the Creative Commons Attribution 4.0 License.
the Creative Commons Attribution 4.0 License.
 | 27 Jan 2022
Land use and anthropogenic heat modulate ozone by meteorology: a perspective from the Yangtze River Delta region
Chenchao Zhan
With the rapid advance in urbanization, land use and anthropogenic heat (AH) dictated by human activities significantly modify the urban climate and in turn the air quality. Focusing on the Yangtze River Delta (YRD) region, a highly urbanized coastal area with severe ozone (O3) pollution, we estimate the impacts of land use and AH on meteorology and O3 using the Weather Research and Forecasting model coupled to Chemistry (WRF-Chem). These results enhance our understanding of the formation of O3 pollution in rapidly developing city clusters with place-specific topography, as most of our results can be supported by previous studies conducted in other regions around the world. Regional O3 pollution episodes occurred frequently (∼ 26 times per year) in the YRD from 2015 to 2019. These O3 pollution episodes are usually in calm conditions characterized by high temperature (over 20 ∘C), low relative humidity (less than 80 %), light wind (less than 3 m s−1) and shallow cloud cover (less than 5 okta). In this case, O3 pollution belts tend to appear in the converging airflows associated with the sea and the lake breezes. On the other hand, rapid urbanization has significantly changed land use and AH in this region, which subsequently affects meteorology and O3 concentration. The largest change in land use comes from urban expansion, which causes an increase in 2 m temperature (T2) by a maximum of 3 ∘C, an increase in planetary boundary layer height (PBLH) by a maximum of 500 m, a decrease in 10 m wind speed (WS10) by a maximum of 1.5 m s−1 and an increase in surface O3 by a maximum of 20 µg m−3. With regard to the sea and lake breezes, the expansion of coastal cities, like Shanghai, can enhance the sea breeze circulation by ∼ 1 m s−1. During the advance of the sea breeze front inland, the updraft induced by the front causes strong vertical mixing of O3. However, once the sea breeze is fully developed in the afternoon (∼ 17:00 LT), further progression inland will stall. Then O3 removal by the low sea breeze will be weakened, and surface O3 can be 10 µg m−3 higher in the case with cities than in the case with no cities. The expansion of lakeside cities, such as Wuxi and Suzhou, can extend the lifetime of lake breezes from noon to afternoon. Since the offshore flow of the lake breeze transports high O3 from the land to the lake, the onshore flow brings high O3 back to the land. Surface O3 in lakeside cities can increase by as much as 30 µg m−3. Compared to land use, the effects of AH are relatively small. The changes mainly appear in and around cities where AH fluxes are large. There are increases in T2, PBLH, WS10 and surface O3 when AH fluxes are taken into account, with increments of approximately 0.2 ∘C, 75 m, 0.3 m s−1 and 4 µg m−3, respectively. AH contributes largely to the urban environment, altering meteorological factors, O3 concentration and urban breeze circulation, but its effect on the sea and the lake breezes seems to be limited.
- Article
(19780 KB) - Full-text XML
-
Supplement
(8593 KB) - BibTeX
- EndNote


Tropospheric O3 is a secondary pollutant formed by a series of complex chemical reactions (Chameides and Walker, 1973; Xie et al., 2014) of precursor gases such as nitrogen oxides (NOx, which is NO + NO2) and volatile organic compounds (VOCs) in combination with sunlight. It has received continuous attention over the last few decades due to its negative effects on the human respiratory system (Jerrett et al., 2009) and the growth of vegetation (Mills et al., 2011). The global average lifetime of tropospheric O3 is 20 to 25 d, and it will decrease to 5 d in the boundary layer (Young et al., 2013). The relatively long lifetime of O3 favors regional transport and brings huge challenges to its control (Bergin et al., 2005). O3 concentrations considerably depend on weather conditions because they play an important role in determining the chemistry, dispersion and removal of O3 (Jacob and Winner, 2009). Elevated O3 usually occurs in warm dry weather with strong sunlight, high temperature, low relative humidity and light wind speed (Zhang et al., 2015). Furthermore, weather conditions have many similarities in terms of certain weather patterns (Buchholz et al., 2010; Zhan et al., 2019), and the main weather patterns associated with O3 pollution episodes in China are tropical cyclones and continental anticyclones (Wang et al., 2017).
O3 concentration and meteorology in urban areas are of great concern because urban areas have huge populations. A report from the United Nations has pointed out that 69.6 % of the world's population will live in cities by 2050 (Zhang et al., 2011). Because of historical and cultural factors, many cities have similar topography, usually along the coasts, close to mountains or in basins. For these cities, the local circulations induced by the thermal contrast of the topography, such as sea–land breezes, mountain–valley breezes and lake–land breezes, have an important impact on urban air quality under calm conditions (Crosman and Horel, 2010). Examples can be found around the world. Ding et al. (2004) simulated the main features of sea–land breezes during a multiday episode in the Pearl River Delta (PRD) region and found that the sea–land breezes can transport air pollutants between inland and coastal cities. Miao et al. (2015) studied the effects of mountain–valley breezes on the boundary layer structure in the Beijing–Tianjin–Hebei (BTH) region, suggesting that mountain–valley breezes are vital to the vertical transport and distribution of air pollutants in Beijing. Wentworth et al. (2015) identified a causal link between lake breezes and O3 in the Greater Toronto Area, finding that the daytime O3 maxima were 13.6–14.8 ppb higher on lake breeze days than on no-lake-breeze days.
Ongoing urbanization, including changes in land use and anthropogenic heat (AH), can affect meteorology and atmospheric compositions at local, regional and even global scales (Fu and Liao, 2014; Park et al., 2014; Oke et al., 2017). Land use changes via urban expansion (typically from vegetation to impervious surfaces) directly alter the surface physical properties (e.g., albedo, surface moisture and roughness), subsequently affecting the exchange of energy, moisture and momentum and hence impacting the urban climate and air quality (Jiang et al., 2008; Wang et al., 2009). Li et al. (2019) found that increases in thermal inertia, surface roughness and evapotranspiration due to urban expansion can increase O3 by 5.6 ppb in southern California. AH is an important waste by-product of urban metabolism. Nearly all energy consumed by human activities will be dissipated as heat within Earth's land–atmosphere system (Flanner, 2009; Sailor, 2011), which is then “injected” into the energy balance processes. Ryu et al. (2013) reported that AH affects the characteristics/structures of the boundary layer and local circulations, resulting in an increase in O3 by 3.8 ppb in the Seoul metropolitan area.
Previous studies have usually investigated the impacts of topography, land use and AH on meteorology and air quality separately and have mainly focused on a specific megacity. However, these factors can work together in near-calm conditions. Furthermore, complex interactions exist widely among thermally driven circulations, and the effects can even spread from one city to nearby areas. For example, Zhu et al. (2015) demonstrated that the meteorological conditions and air quality over Kunshan are significantly affected by Shanghai urban land-surface forcing (Kunshan is located downstream of Shanghai with a straight-line distance of approximately 50 km). Given the increasing prevalence of cities, cities gradually appear in the form of clusters. Therefore, assessing the effects of land use and AH (the topography rarely changes) in city clusters is meaningful, which also helps us to understand interactions between the urban environment and human activities.
The Yangtze River Delta (YRD) region, located on the western coast of the Pacific Ocean (Fig. 1a), has undergone accelerated urbanization processes and rapid economic development over the past few decades. It is now one of the largest economic zones in the world. The YRD region consists of the southern part of Jiangsu Province, the northern part of Zhejiang Province and the eastern part of Anhui Province, including 26 megacities/large cities such as Shanghai, Hangzhou and Nanjing (Fig. 1b). With dense population and huge energy consumption, this area is now suffering from air quality deterioration (Xie et al., 2017; Zhan et al., 2020), especially increasingly severe O3 pollution in recent years (Li et al., 2020; Wang et al., 2020). Furthermore, cities with hot spots of O3 are usually concentrated in the central YRD region surrounding Lake Tai (Zhan et al., 2021). Numerous cities, unique topography and severe O3 pollution make the YRD an ideal study place.
In this study, the impacts of land use and AH on meteorology in the central YRD region and how these effects further modulate O3 are investigated using the Weather Research and Forecasting model coupled to Chemistry (WRF-Chem). These results fill a knowledge gap about the formation of O3 pollution in this region and provide valuable insight for other rapidly developing regions with complex topography in the world. The remainder of this paper is organized as follows. Section 2 gives a detailed description of the observation data, the model setup and the experimental design. The main results, including the characteristics of O3 pollution episodes, the model evaluation, and the changes in meteorology and O3 caused by land use and AH, are presented in Sect. 3. A summary and conclusions are given in Sect. 4.
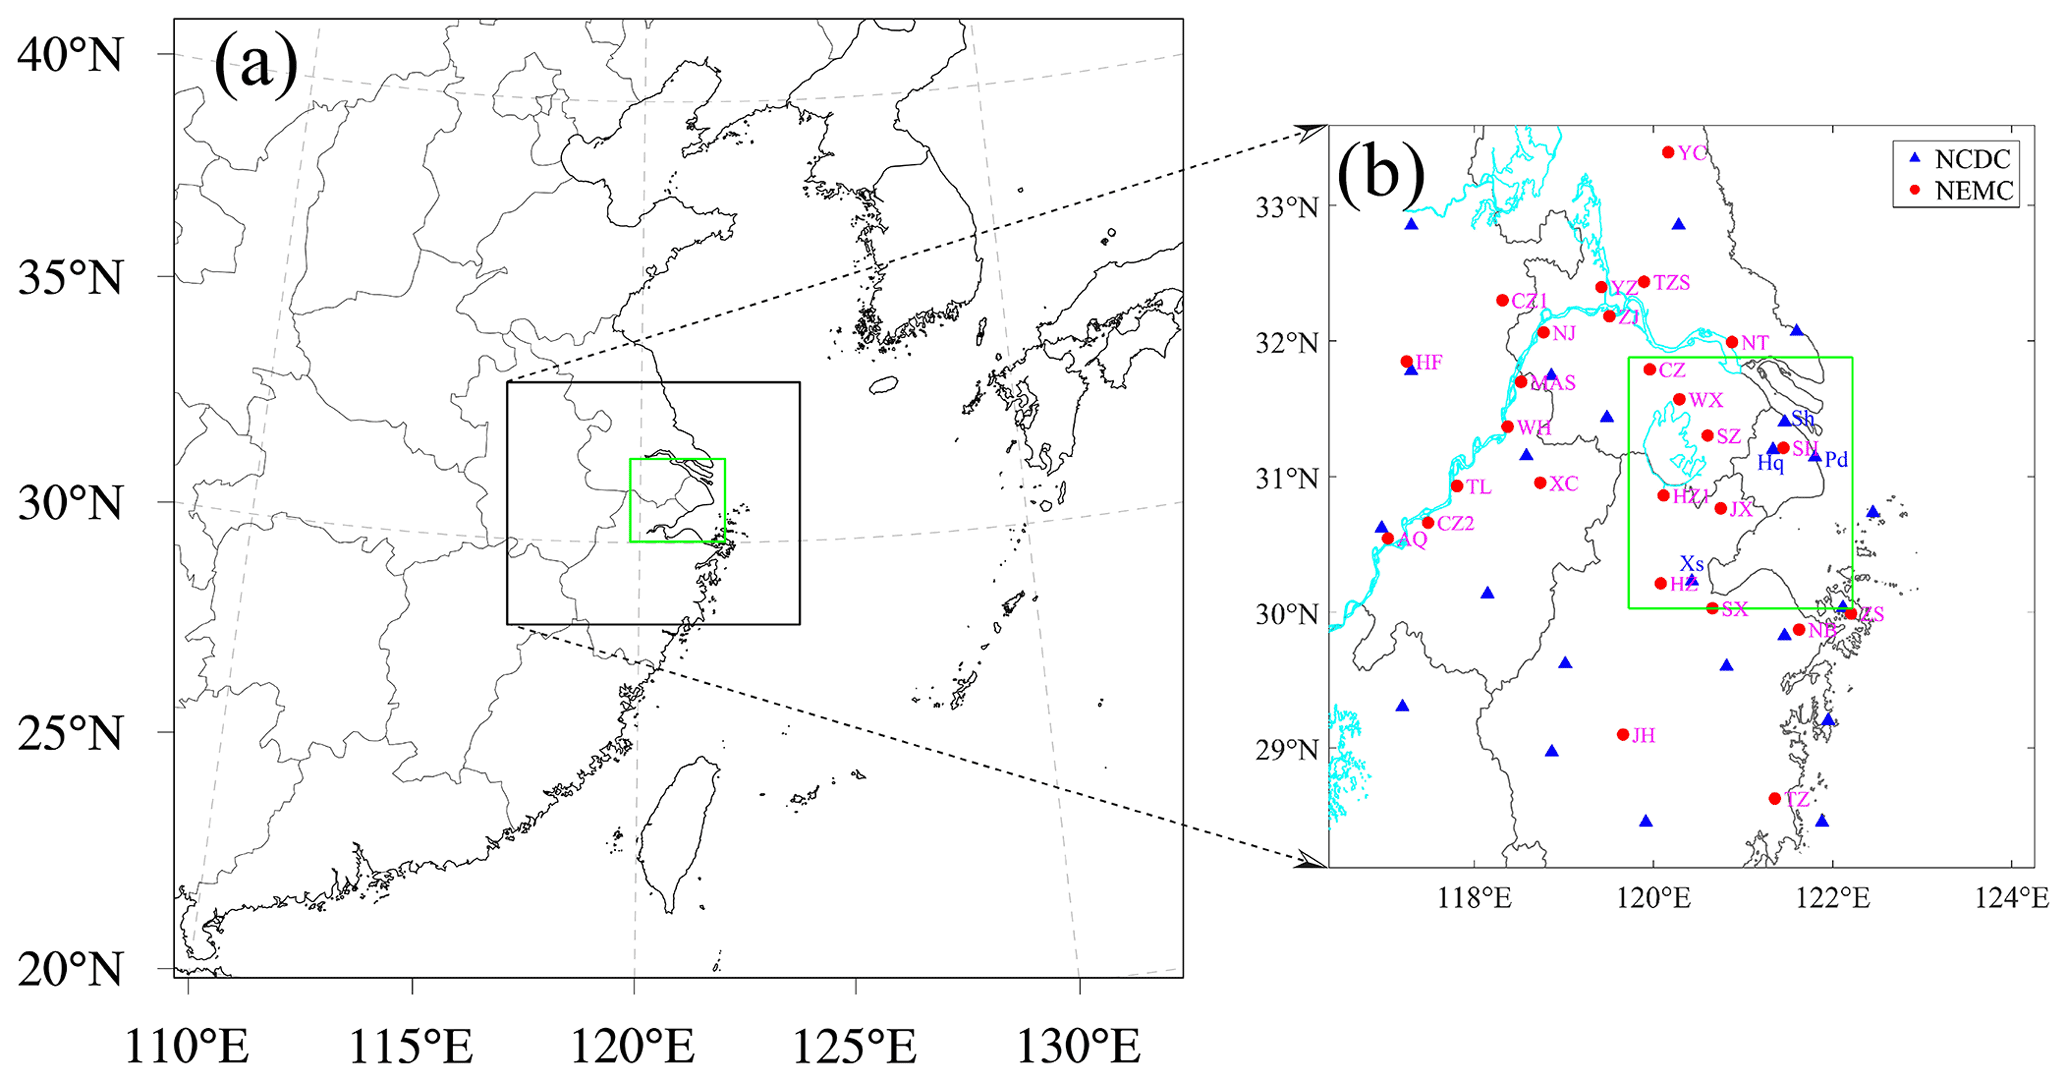
Figure 1(a) Three nested WRF-Chem domains. (b) The locations of cities (red dots) and weather stations (blue triangles) in the YRD. The green rectangular regions represent the innermost domain and also the central YRD region. The cities in (b) include the megacity Shanghai (SH); Hangzhou (HZ), Ningbo (NB), Jiaxing (JX), Huzhou (HZ1), Shaoxing (SX), Jinhua (JH), Zhoushan (ZS) and Taizhou (TZ) located in Zhejiang Province; Nanjing (NJ), Wuxi (WX), Changzhou (CZ), Suzhou (SZ), Nantong (NT), Yancheng (YC), Yangzhou (YZ), Zhenjiang (ZJ) and Taizhou Shi (TZS) located in Jiangsu Province; and Hefei (HF), Wuhu (WH), Ma'anshan (MAS), Tongling (TL), Anqing (AQ), Chuzhou (CZ1), Chizhou (CZ2) and Xuancheng (XC) located in Anhui Province.
2.1 Surface observations
Hourly O3 concentrations monitored by the National Environmental Monitoring Center (NEMC) of China are used in this study. These data strictly follow the national monitoring standards HJ 654-2013 and HJ 193-2013 (http://www.cnemc.cn/jcgf/dqhj/, last access: 18 January 2022) and are available at https://quotsoft.net/air/ (last access: 18 January 2022). The nationwide observation network initially operated in 74 major cities from 2013, and it had grown to more than 1500 stations covering 454 cities by 2017 (Lu et al., 2018). The urban hourly O3 concentrations are the average results of measurements at all monitoring sites in each city. The daily maximum 8 h average (MDA8) O3 concentrations are calculated using the hourly O3 concentrations for days with more than 18 h of measurements (Liao et al., 2017).
Meteorological data are taken from the National Climatic Data Center (NCDC), including 2 m air temperature (T2), relative humidity (RH), 10 m wind speed (WS10) and direction (WD10), and cloud cover (CC). These data as well as the technical documents recording the quality control, data collection and archive are available at ftp://ftp.ncdc.noaa.gov/pub/data/noaa/isd-lite/ (last access: 18 January 2022). Locations of the weather stations are shown in Fig. 1b. Specifically, the weather stations in the innermost domain are Pudong (Pd), Shanghai (Sh), Hongqiao (Hq) and Xiaoshan (Xs).
2.2 MODIS-based and USGS land use classifications
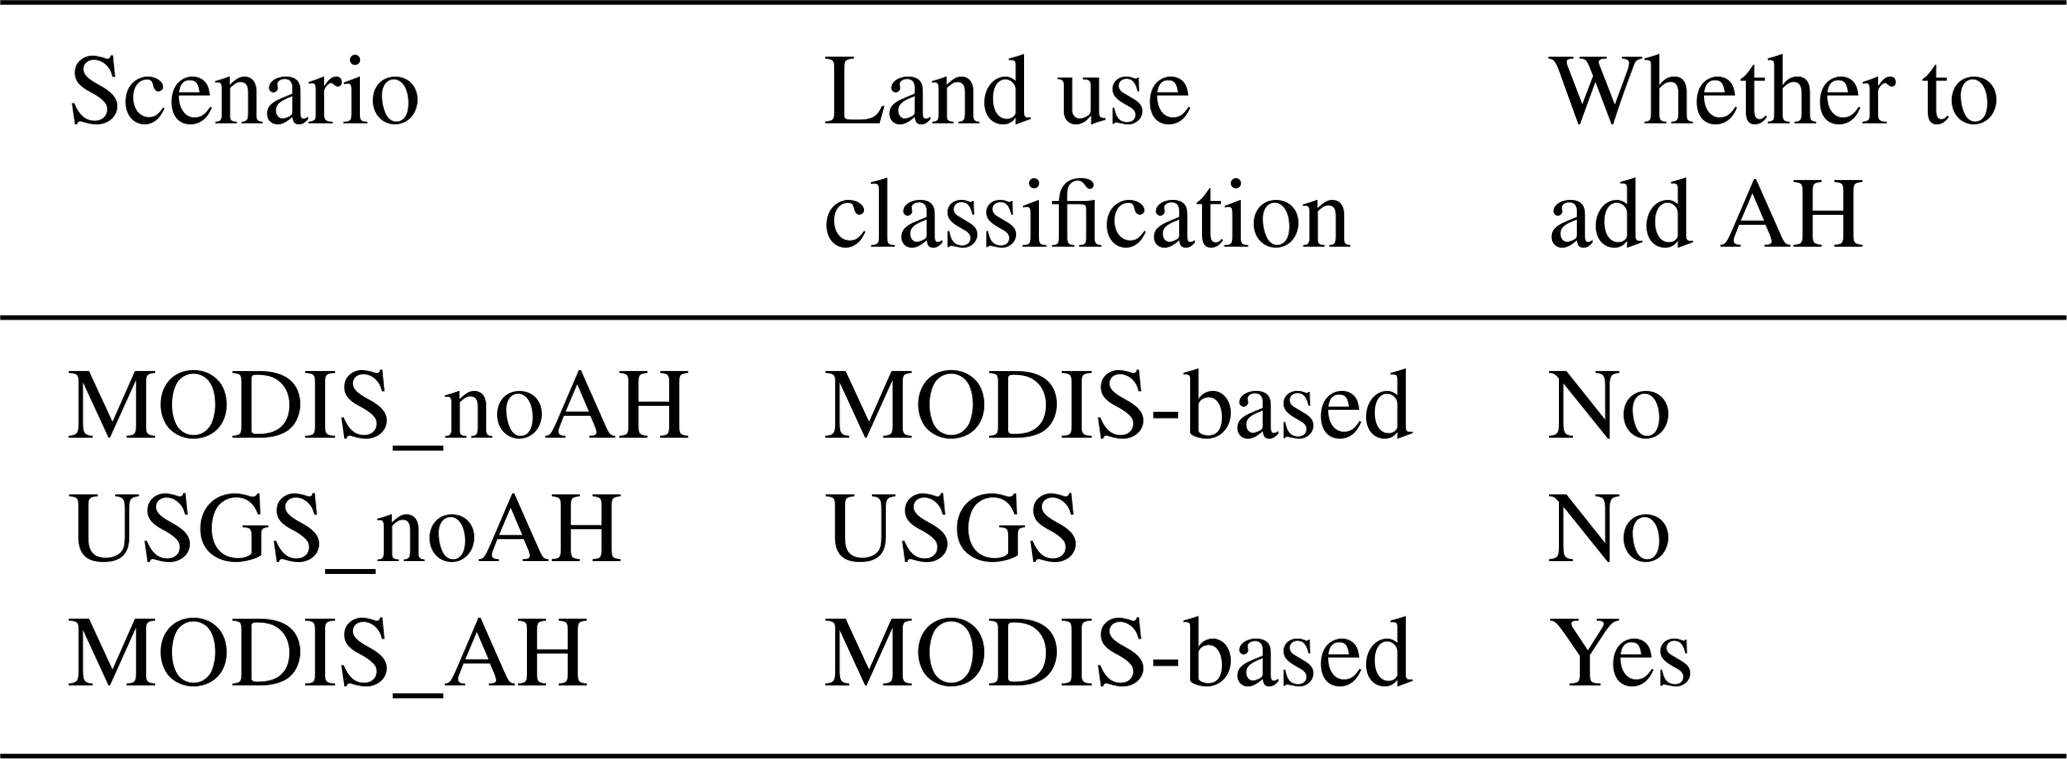
To explore the effects of land use, two land use categories set as default in WRF are used to set up the first two scenario simulations (Table 2). The MODIS-based land cover product was created from 500 m MODIS Terra and Aqua satellite imagery (Friedl et al., 2010) and has replaced USGS as the default settings in WRF since version 3.8. The USGS data were primarily derived from the Advanced Very High Resolution Radiometer (AVHRR) from 1992 to 1993 at a 1 km spatial resolution (Loveland et al., 2000), which reflects the distribution of cities in the late 1980s. Figure 2 presents the land cover maps in the innermost domain. The most obvious difference between MODIS and USGS is the urban fraction, which is related to the urban expansion caused by rapid urbanization. In addition, the Finer Resolution Observation and Monitoring of Global Land Cover in 2015 (GLC), one of the latest (2015) and finest (30 m) land cover datasets (Gong et al., 2019), is quite consistent with the performance of MODIS in this region. This confirms that the urban fraction in MODIS is close to reality. Thus, the MODIS data can generally refer to today's distribution of cities.
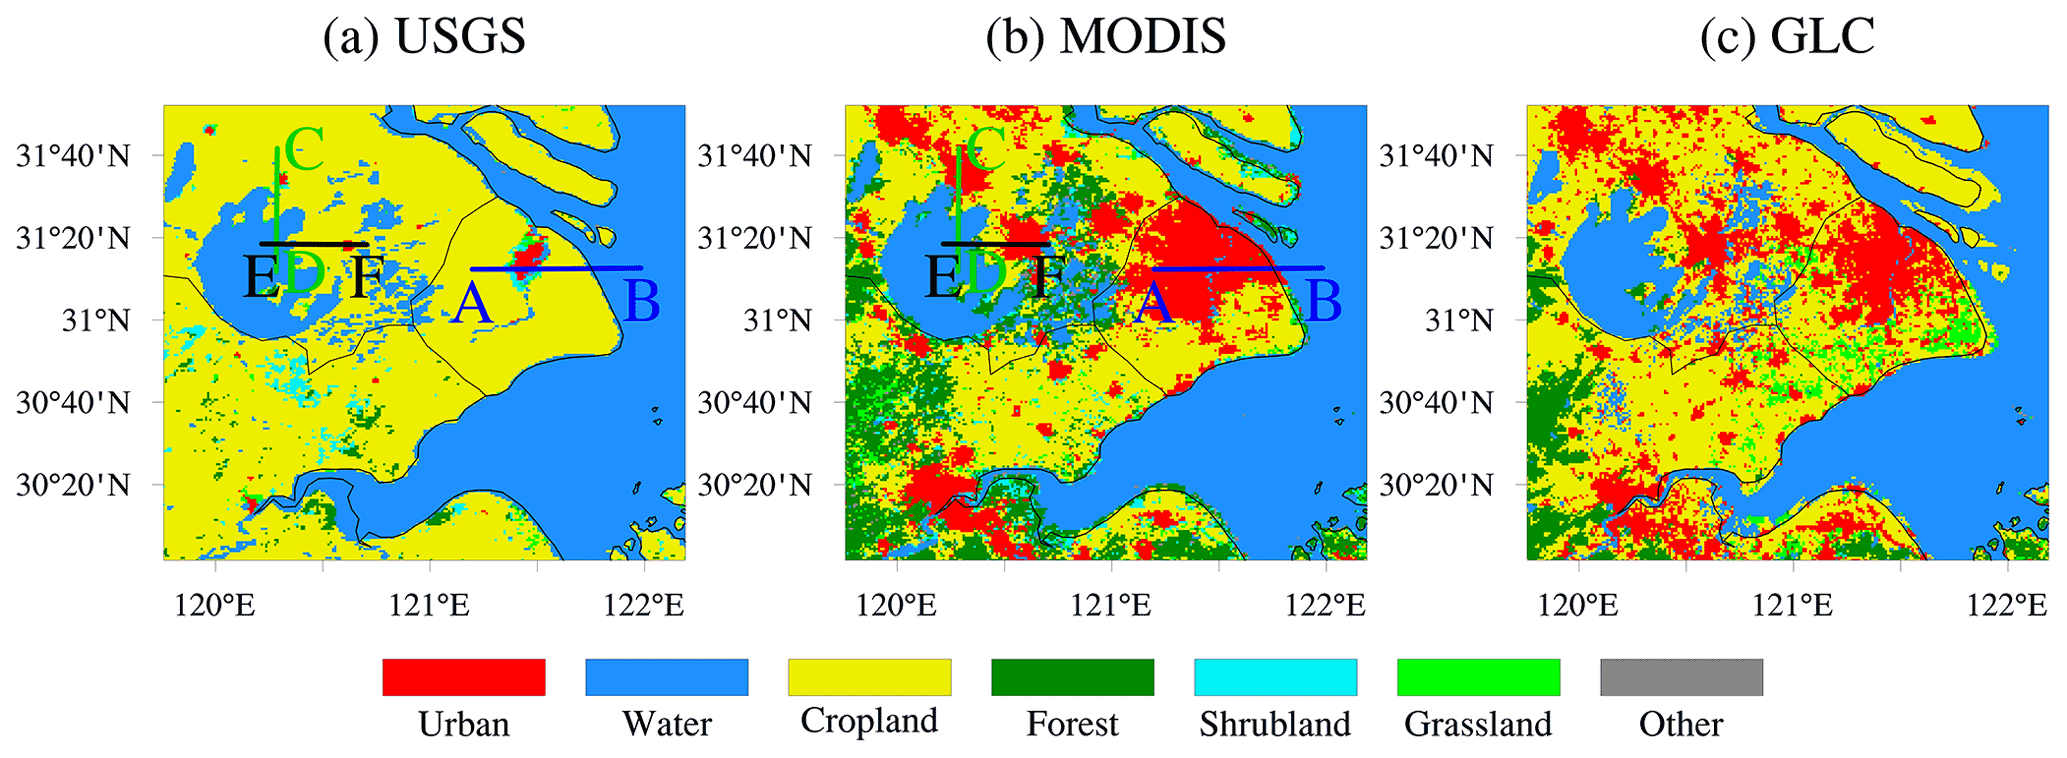
Figure 2Land cover maps in the innermost domain, with (a) USGS, (b) MODIS and (c) GLC datasets.
2.3 Anthropogenic heat flux modeling
Another scenario simulation incorporates the urban canopy model with gridded AH fluxes to diagnose the impact of AH. The AH fluxes were calculated based on the statistical data of energy consumption of China in 2016 and then were gridded as 144 rows and 144 columns with a resolution of 2.5∘ using population density downloaded from Columbia University's Socioeconomic Data and Applications Center. AH fluxes with their diurnal variations are considered by adding them to the sensible heat flux from the urban canopy layer within the single-layer urban canopy model (SLUCM). The AH fluxes for each grid are determined by the fixed AH value for the urban land use category, the urban fraction value on each grid and the fixed temporal diurnal pattern. Details on the calculation of AH fluxes and how to add AH fluxes into the model can be found in Xie et al. (2016a, b). Figure 3 gives the spatial distribution of AH fluxes in the innermost domain. In urban areas, the AH fluxes usually exceed 20 W m−2. Some megacities, like Shanghai, can have an AH flux value as high as 200 W m−2. Except for the urban areas, the AH fluxes are generally less than 5 W m−2 in most parts of the YRD region. In particular, in places where there is no human activity, the AH flux is 0.

Figure 3Spatial distribution of anthropogenic heat fluxes in the innermost domain.
2.4 Model setup and experimental designs
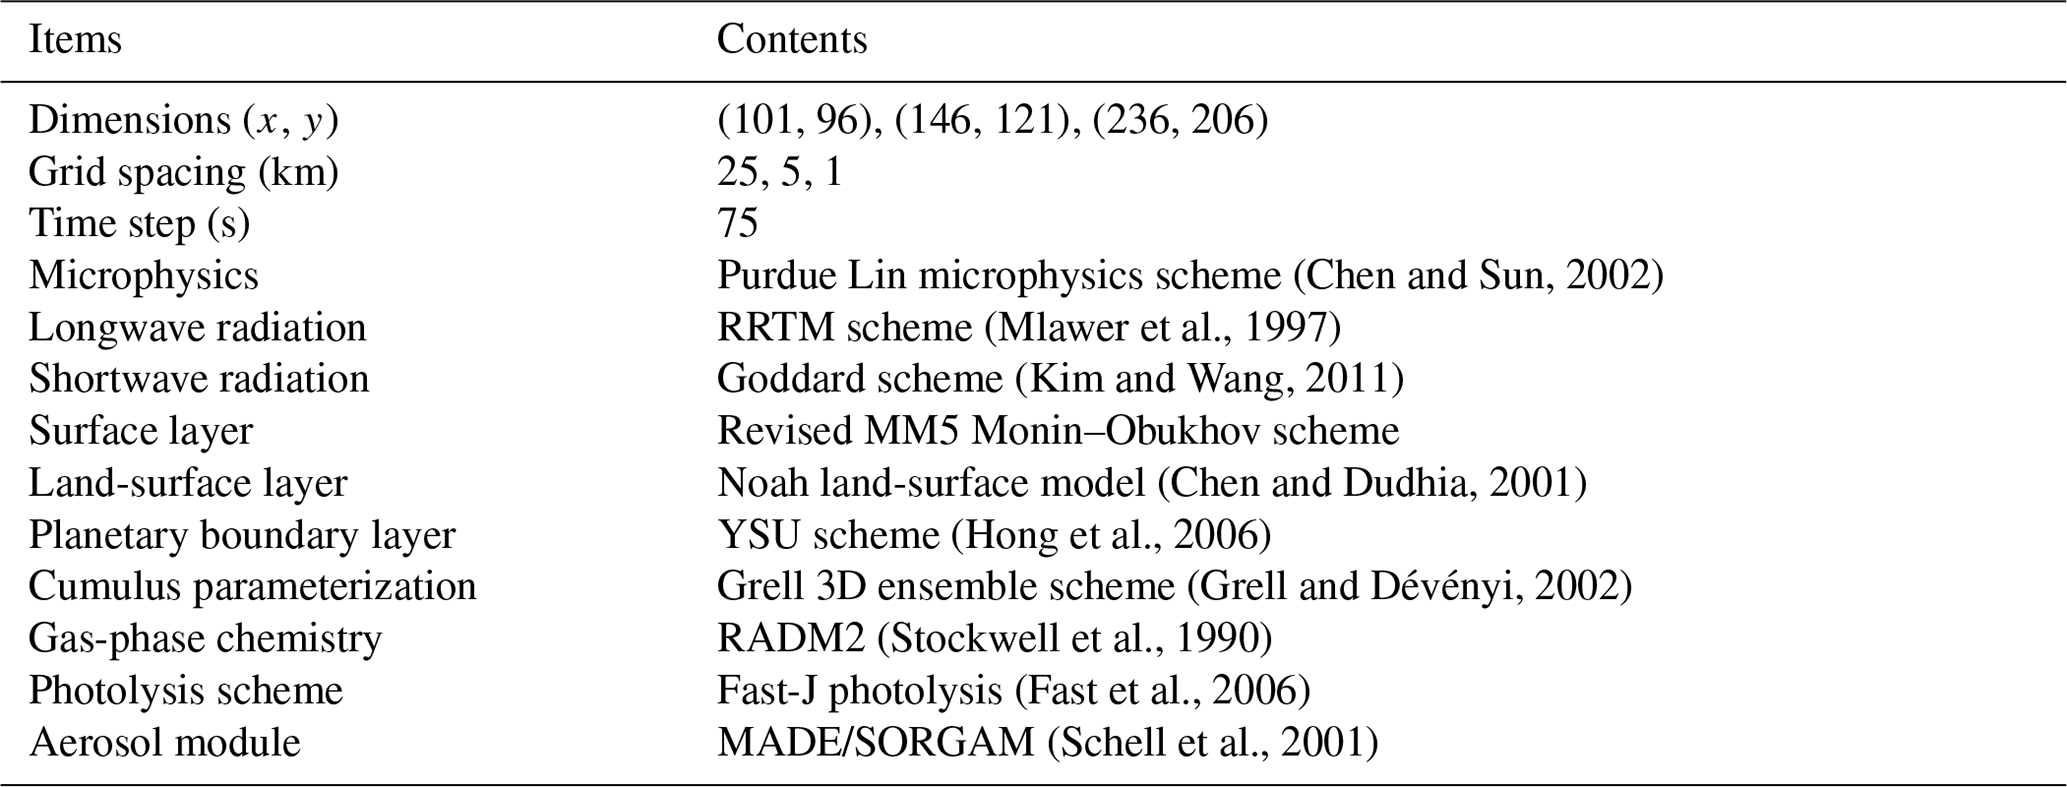
In this study, WRF-Chem version 3.9.1 was applied. The WRF-Chem model is a fully coupled online numerical weather prediction model with chemistry components (Grell et al., 2005), in which chemical and meteorological variables use the same coordinates, transport schemes and physics schemes in space and time. There are 32 vertical levels extending from the surface to 100 hPa with 12 levels located below 2 km to resolve the boundary layer processes. The domain and options for physical and chemical parameterization schemes are summarized in Table 1. The initial and boundary conditions of meteorological fields are from the National Centers for Environmental Prediction (NCEP) global final analysis fields every 6 h at resolution. The anthropogenic emissions are provided by the Multi-resolution Emission Inventory for China (MEIC) in 2017 with a resolution of 0.25∘ (http://meicmodel.org/), which includes 10 air pollutants and CO2 from power, industry, residential, transportation and agriculture sectors. The biogenic emissions are calculated online using the Model of Emissions of Gases and Aerosols from Nature (MEGAN) available in WRF-Chem (Guenther et al., 2006). As our main objective is to explore the response of O3 to the meteorological changes induced by land use and AH, we use the same surface biogenic emission rates for different land use scenarios (Li et al., 2014, 2017a). Further studies will be carried out to quantify the contribution of biogenic volatile organic compounds changed by meteorological conditions to O3.
As shown in Table 2, three numerical experiments are performed. The MODIS_noAH experiment is a control simulation with commonly used settings. Compared with MODIS_noAH, USGS_noAH selects the USGS land use classification at runtime through the geogrid program. Thus, the difference between the modeling results of MODIS_noAH and USGS_noAH can illustrate the changes caused by land use. The impact of AH can be identified by comparing the modeling results of MODIS_AH and MODIS_noAH because AH is only added in MODIS_AH. To exclude the uncertainty conceivably caused by different configurations, all three simulations use the same emission inventory and physical and chemical parameterization schemes (Table 1), running from 00:00 UTC 21 May to 00:00 UTC 4 June 2017 with the first 88 h as spin-up time.
2.5 Model evaluation
To verify the model performance, the simulation results in the innermost domain, including O3 concentration, T2, RH, WS10 and WD10, are examined against the surface observations described in Sect. 2.1. The statistical metrics, including the mean bias (MB), root mean square error (RMSE) and correlation coefficient (COR), are also calculated. They are defined as follows:
where Si and Oi are the simulations and observations, respectively. N is the total number of valid data, and and represent the average of simulations and observations, respectively. Generally, the model performance is acceptable if the values of MB and RMSE are close to 0 and that of COR is close to 1 (Xie et al., 2016a, b; Zhan et al., 2020).
3.1 Regional O3 pollution episodes in the YRD
On cloudless sunny days, regional O3 pollution episodes occur frequently in the YRD (Gao et al., 2020; Zhan et al., 2021), affecting an area of 3.5×10⁶ km2 and harming more than 200 million people. Regional O3 pollution is generally defined as when more than half of the 26 typical cities in the YRD fail to meet the national O3 standard (in China, the national ambient air quality standard for MDA8 O3 is 160 µg m−3). Based on the surface O3 observations, we sort out all regional O3 pollution episodes and the corresponding weather patterns from 2015 to 2019 (Table S1). There were 20, 19, 34, 28 and 30 regional O3 pollution cases in the YRD from 2015 to 2019, respectively. These cases mainly occurred in April to October of each year and were usually related to high-pressure, uniform-pressure fields and typhoon activity.
Figure 4 further displays the monthly distribution of meteorological factors during the daytime (from 08:00 to 20:00 local time) when regional O3 pollution occurs in the YRD. All the variables show significant monthly variations. The highest (lowest) temperature is found in July (April), and the relative humidity is highest in June. As for the cloud cover, the sky is covered with fewer clouds in October than in other months. In addition, southeast winds prevail in the YRD from April to October under the influence of the monsoon climate. The correlation coefficients between temperature, relative humidity, cloud cover and wind speed and MDA8 O3 are 0.12, −0.34, −0.15 and 0.04, respectively. Therefore, O3 pollution episodes tend to occur on days characterized by high temperature, low relative humidity, cloudless sky and light wind (the weak correlation between wind speed and MDA8 O3 is due to the small change in light wind). More specifically, on days when the temperature exceeds 20 ∘C (Fig. 4b), the relative humidity is less than 80 % (Fig. 4c), the cloud cover is less than 5 okta (Fig. 4d) and the wind speed is less than 3 m s−1 (Fig. 4e) in the YRD. On the other hand, local circulations are clearest when there is an absence of clouds, radiative heating is strongest and wind is weakest. In this case, local circulation will inevitably have an impact on the distribution of O3.
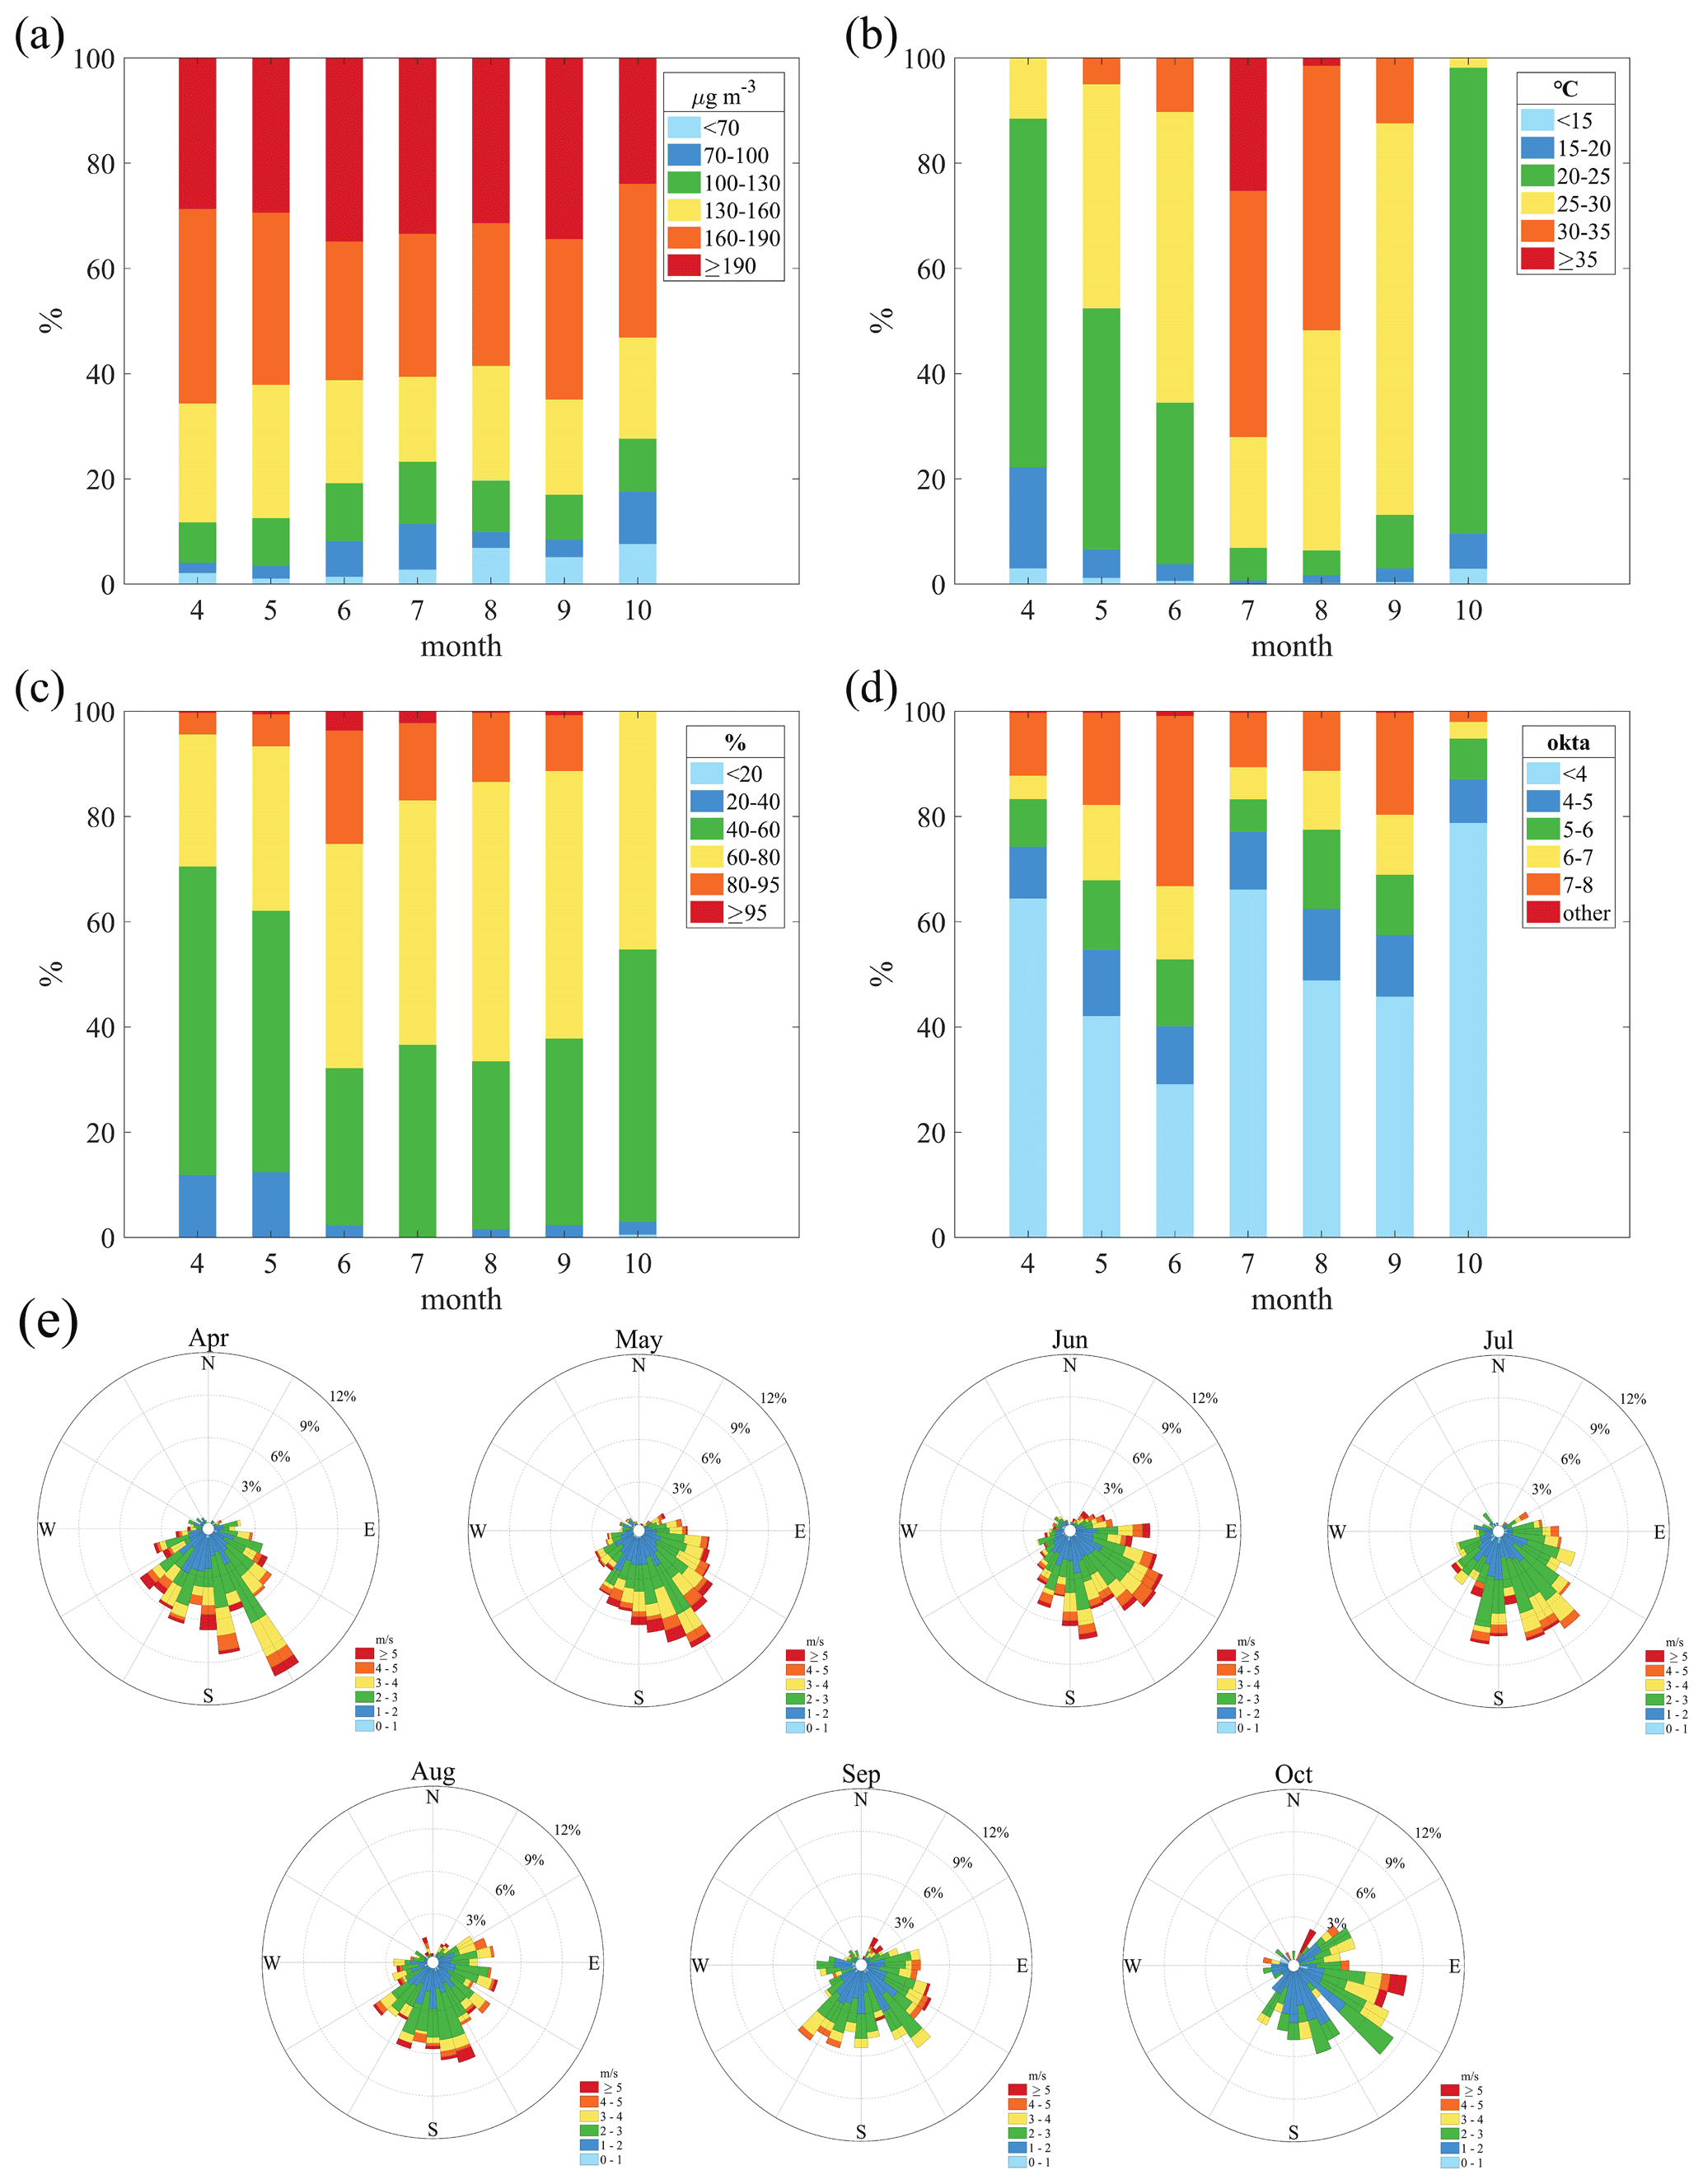
Figure 4The monthly distributions of (a) MDA8 O3, (b) temperature, (c) relative humidity, (d) cloud cover, and (e) wind speed and direction during the daytime (08:00 to 20:00 LT) when regional O3 pollution occurs in the YRD.
3.2 Case selection
3.2.1 Case for O3 pollution episode
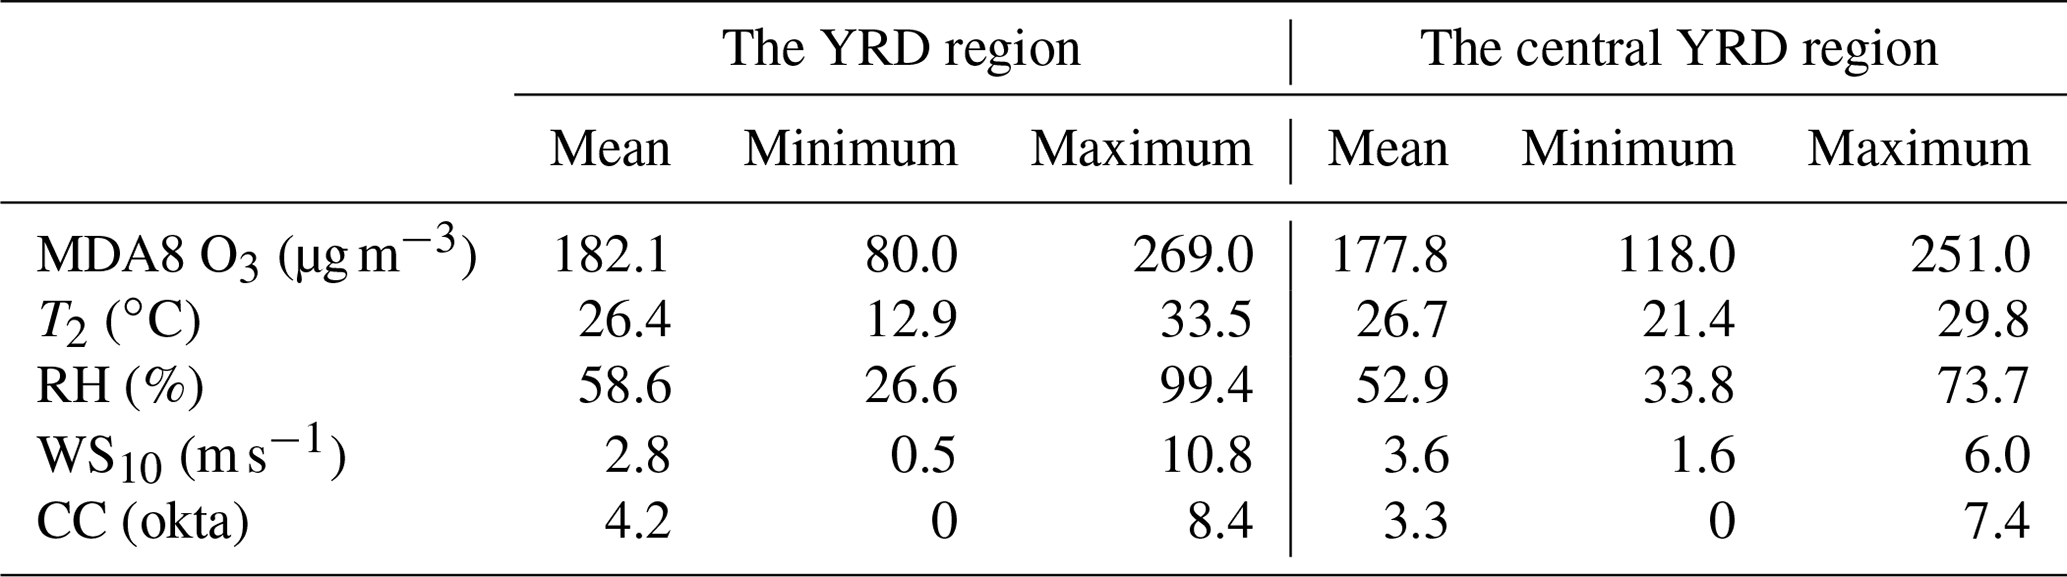
For simplicity but without loss of generality, the longest-lasting regional O3 pollution episode is selected to investigate the impacts of land use and AH on meteorology and O3 in the YRD. This 10 d regional O3 pollution episode occurred from 25 May to 3 June 2017 (Table S1). Dominated by high-pressure/uniform-pressure fields (Fig. S1), high O3 concentrations are accompanied by high air temperature, low relative humidity, light wind and shallow cloud cover during this smog episode. An average of 18 out of the 26 cities experienced O3 pollution every day with MDA8 O3 concentrations ranging from 80.0 to 269.0 µg m−3 in the YRD. With regard to the meteorological factors, T2 ranged from 12.9 to 33.5 ∘C, with an average of 26.4 ∘C; RH ranged from 26.6 % to 99.4 %, with an average of 58.6 %; WS10 ranged from 0.5 to 10.8 m s−1, with an average of 2.8 m s−1; CC ranged from 0 to 8.4 okta, with an average of 4.2 okta (Table 3). The values of these meteorological factors meet the standards in the previous section and can cover both the whole YRD and the central YRD region (the innermost domain). Therefore, this O3 pollution episode meets the requirements of not only high O3 concentrations but also calm weather conditions. The long duration also provides relatively universal results.
Table 3Mean, minimum and maximum of MDA8 O3, T2, RH, WS10 and CC during the daytime from 25 May to 3 June 2017.
3.2.2 Evaluation of model performance
To evaluate the model performance, the simulation results in the innermost domain are validated by comparing them with the observational data. Table 4 presents the statistical metrics in meteorological factors. Figure 5 further illustrates the time series of these meteorological factors and their modeling results. T2 is reasonably well simulated as the CORs (the mean of all the sites) are 0.87, 0.86 and 0.86 in MODIS_noAH, USGS_noAH and MODIS_AH, respectively. The small negative MBs at all sites suggest that our simulations underestimate T2 to some extent, although this light underestimation is acceptable because of the small RMSEs (2.3, 3.1 and 2.3 ∘C). The MBs for T2 in USGS_noAH, MODIS_noAH and MODIS_AH are −2.4, −1.0 and −0.8 ∘C. The smaller RMSEs and MBs indicate that the T2 simulation is improved when new land use and AH are taken into account, which may be related to the improved latent and sensible heat fluxes in models (De Meij and Vinuesa, 2014). The improvement can also be confirmed by Fig. 5a. With respect to RH, the CORs are 0.82, 0.75 and 0.83 in MODIS_noAH, USGS_noAH and MODIS_AH, respectively. Thus, all three simulations can capture the diurnal variation in RH well but have different performances at different sites. In USGS_noAH, RH is overestimated at all sites, especially at the Pudong site with an MB of 11.2 %, while RH is overestimated at the two coastal sites (Pudong and Shanghai) but underestimated at two other sites (Hongqiao and Xiaoshan) in MODIS_noAH and MODIS_AH. Moreover, USGS_noAH has the highest RMSEs of RH (16.3 %), followed by MODIS_AH (12.4 %) and MODIS_noAH (12.1 %). Among the three experiments, the simulation result of RH in USGS_noAH is the worst (Fig. 5b). As for WS10, the modeling values are slightly overestimated at all sites in all three simulations. The overestimation of WS10 may partly be attributed to the unresolved terrain features by the default surface drag parameterization causing an overestimation of wind speed especially at low values (Jimenez and Dudhia, 2012). In particular, WS10 in USGS_noAH is the most overestimated, followed by MODIS_AH and MODIS_noAH, with MBs of 1.2, 1.0 and 0.8 m s−1, respectively. In addition, high MBs of WS10 correspond to high RMSEs (1.9, 1.8 and 1.7 m s−1) in our simulations. The MODIS-based land cover shows a larger urban fraction and thereby leads to more friction and higher roughness than the USGS dataset. In this case, the overestimation of WS10 is somewhat neutralized to fit the observations. In terms of WD10, the model captures well the shift in wind direction during the study period (Fig. 5d). In summary, both the statistical metrics in Table 4 and the time series in Fig. 5 indicate that all three numerical experiments can capture the major changes in meteorological factors during this O3 pollution episode. Nevertheless, updating the land use and adding AH can reduce the underestimation of T2 and the overestimation of RH and WS10 in models. Benefitting from the development of computers, numerical models grow more complex, and the resolution requirements are higher. This puts forward demands on many basic parameters. An updated land cover dataset, like the GLC, contains useful information and can improve the model results (Chen et al., 2016; Wang et al., 2018). Some factors that are generally ignored in models, like the AH fluxes, should also be estimated and evaluated.
Table 4Statistical metrics in meteorological variables between observations and simulations.
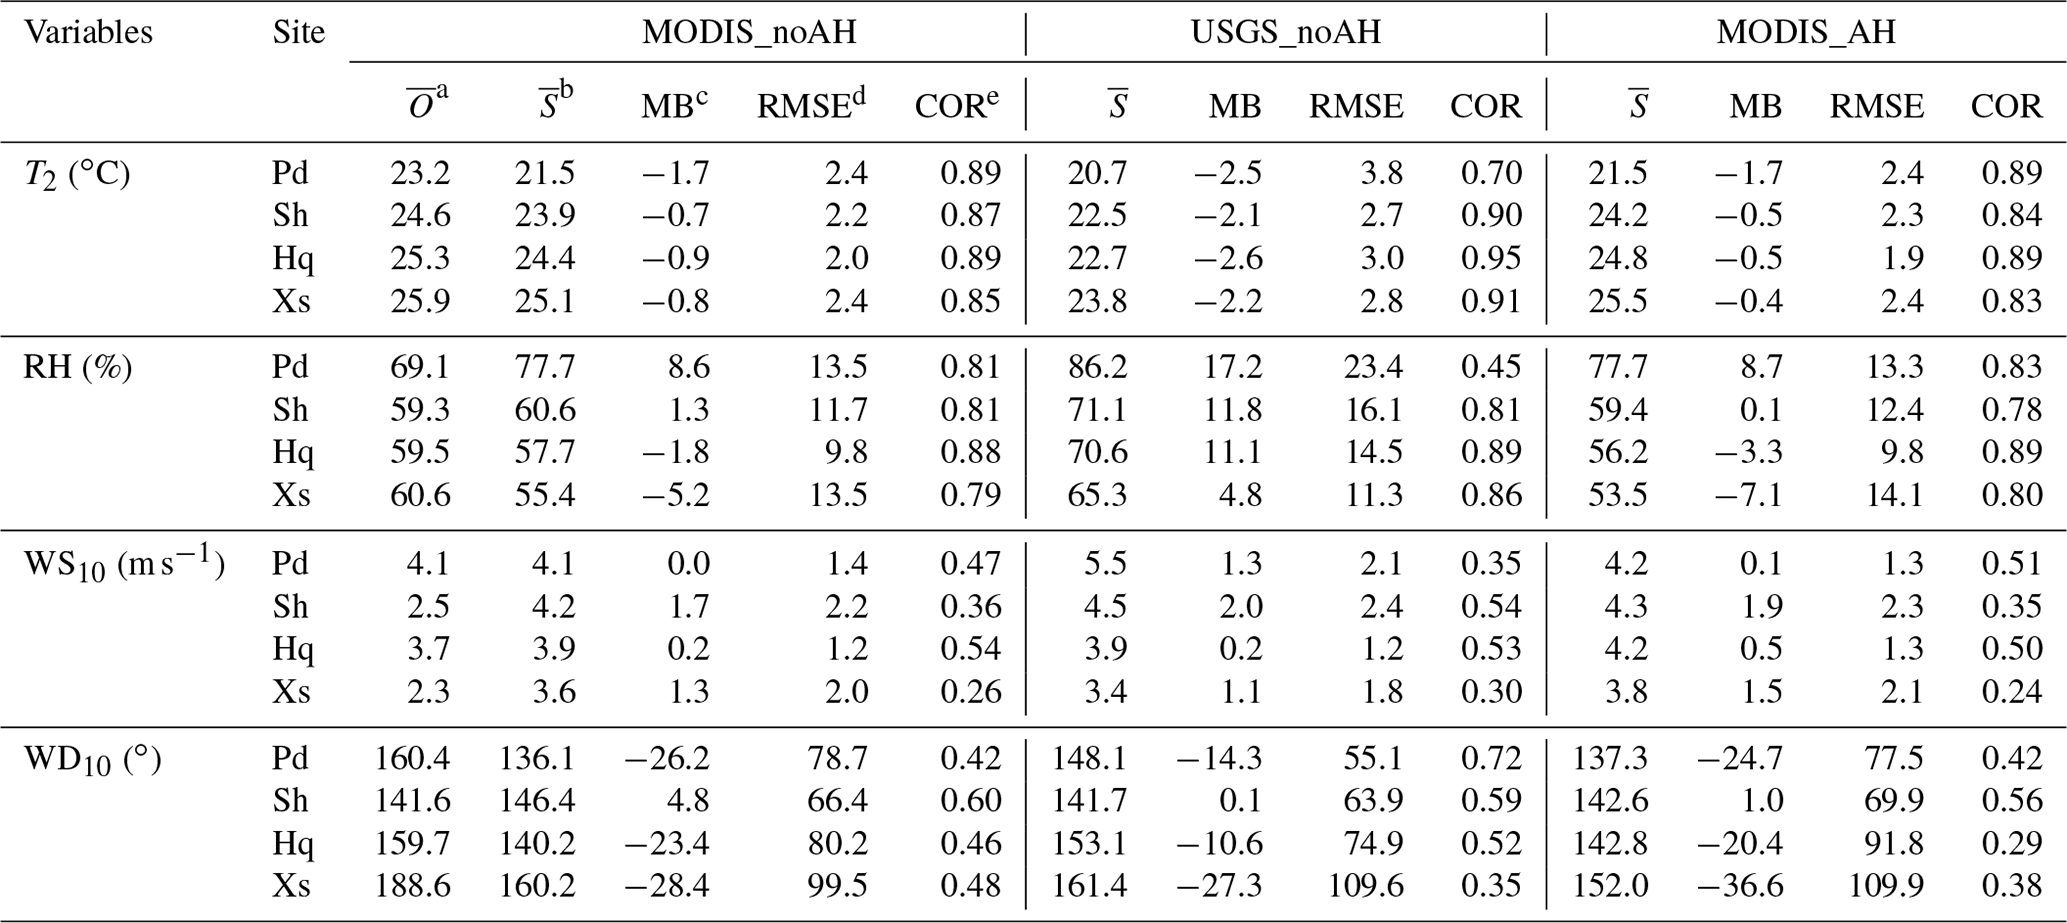
indicates the average of observations. indicates the average of simulations. c MB indicates the mean bias. d RMSE indicates the root mean square error. e COR indicates the correlation coefficient, with statistical significance at the 99 % confidence level.
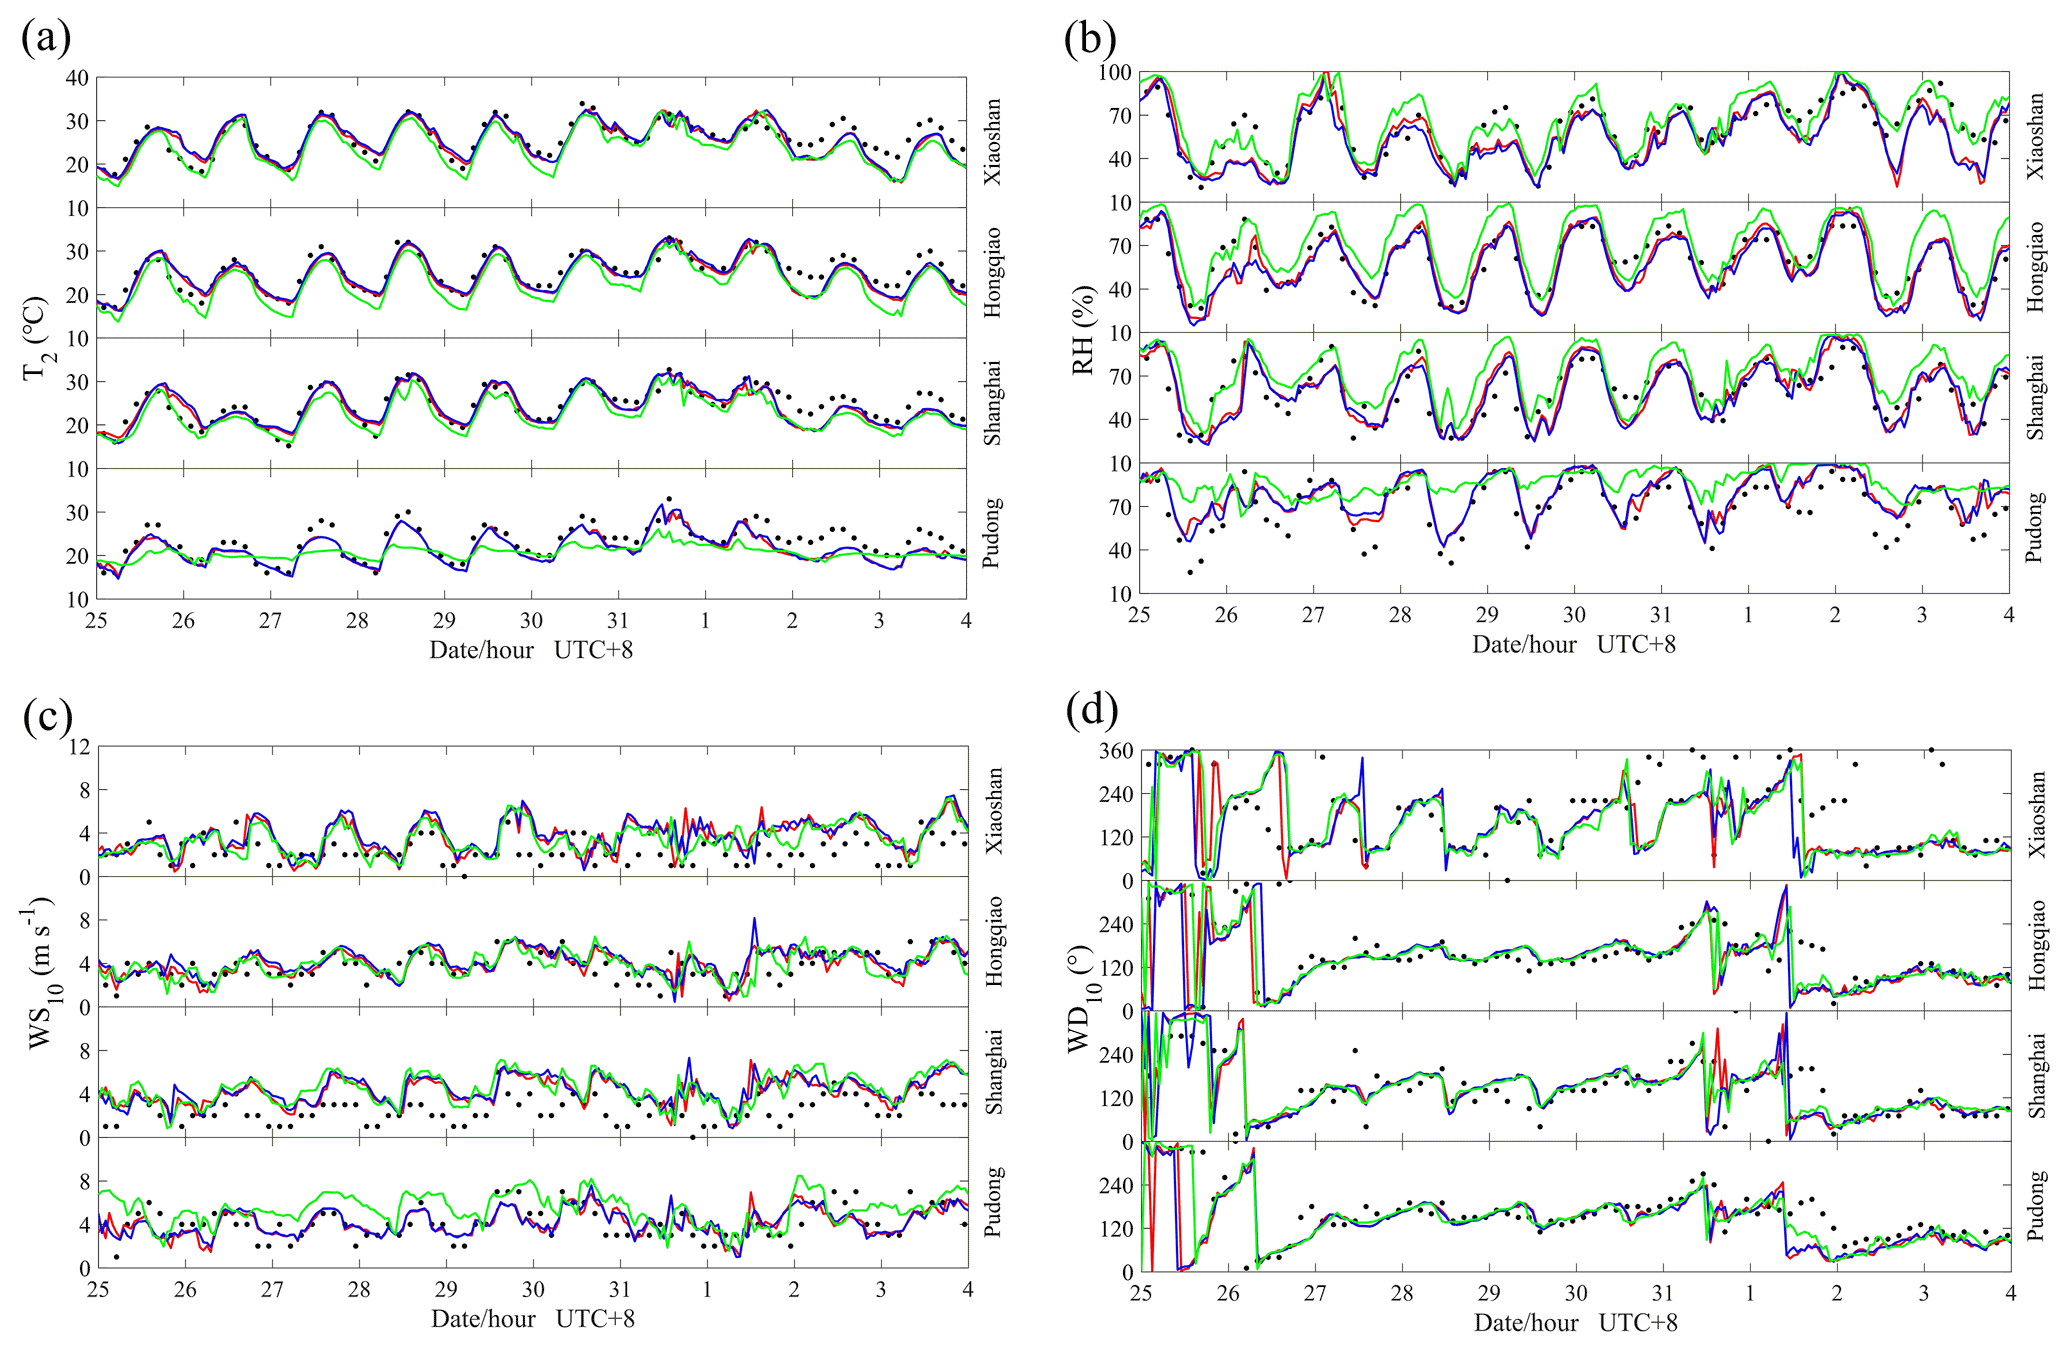
Figure 5Time series of (a) T2, (b) RH, (c) WS10 and (d) WD10 for observations and simulations at different weather stations. The black dots are the surface observations. The simulation results of MODIS_noAH, USGS_noAH and MODIS_AH are shown in red, green and blue lines, respectively.
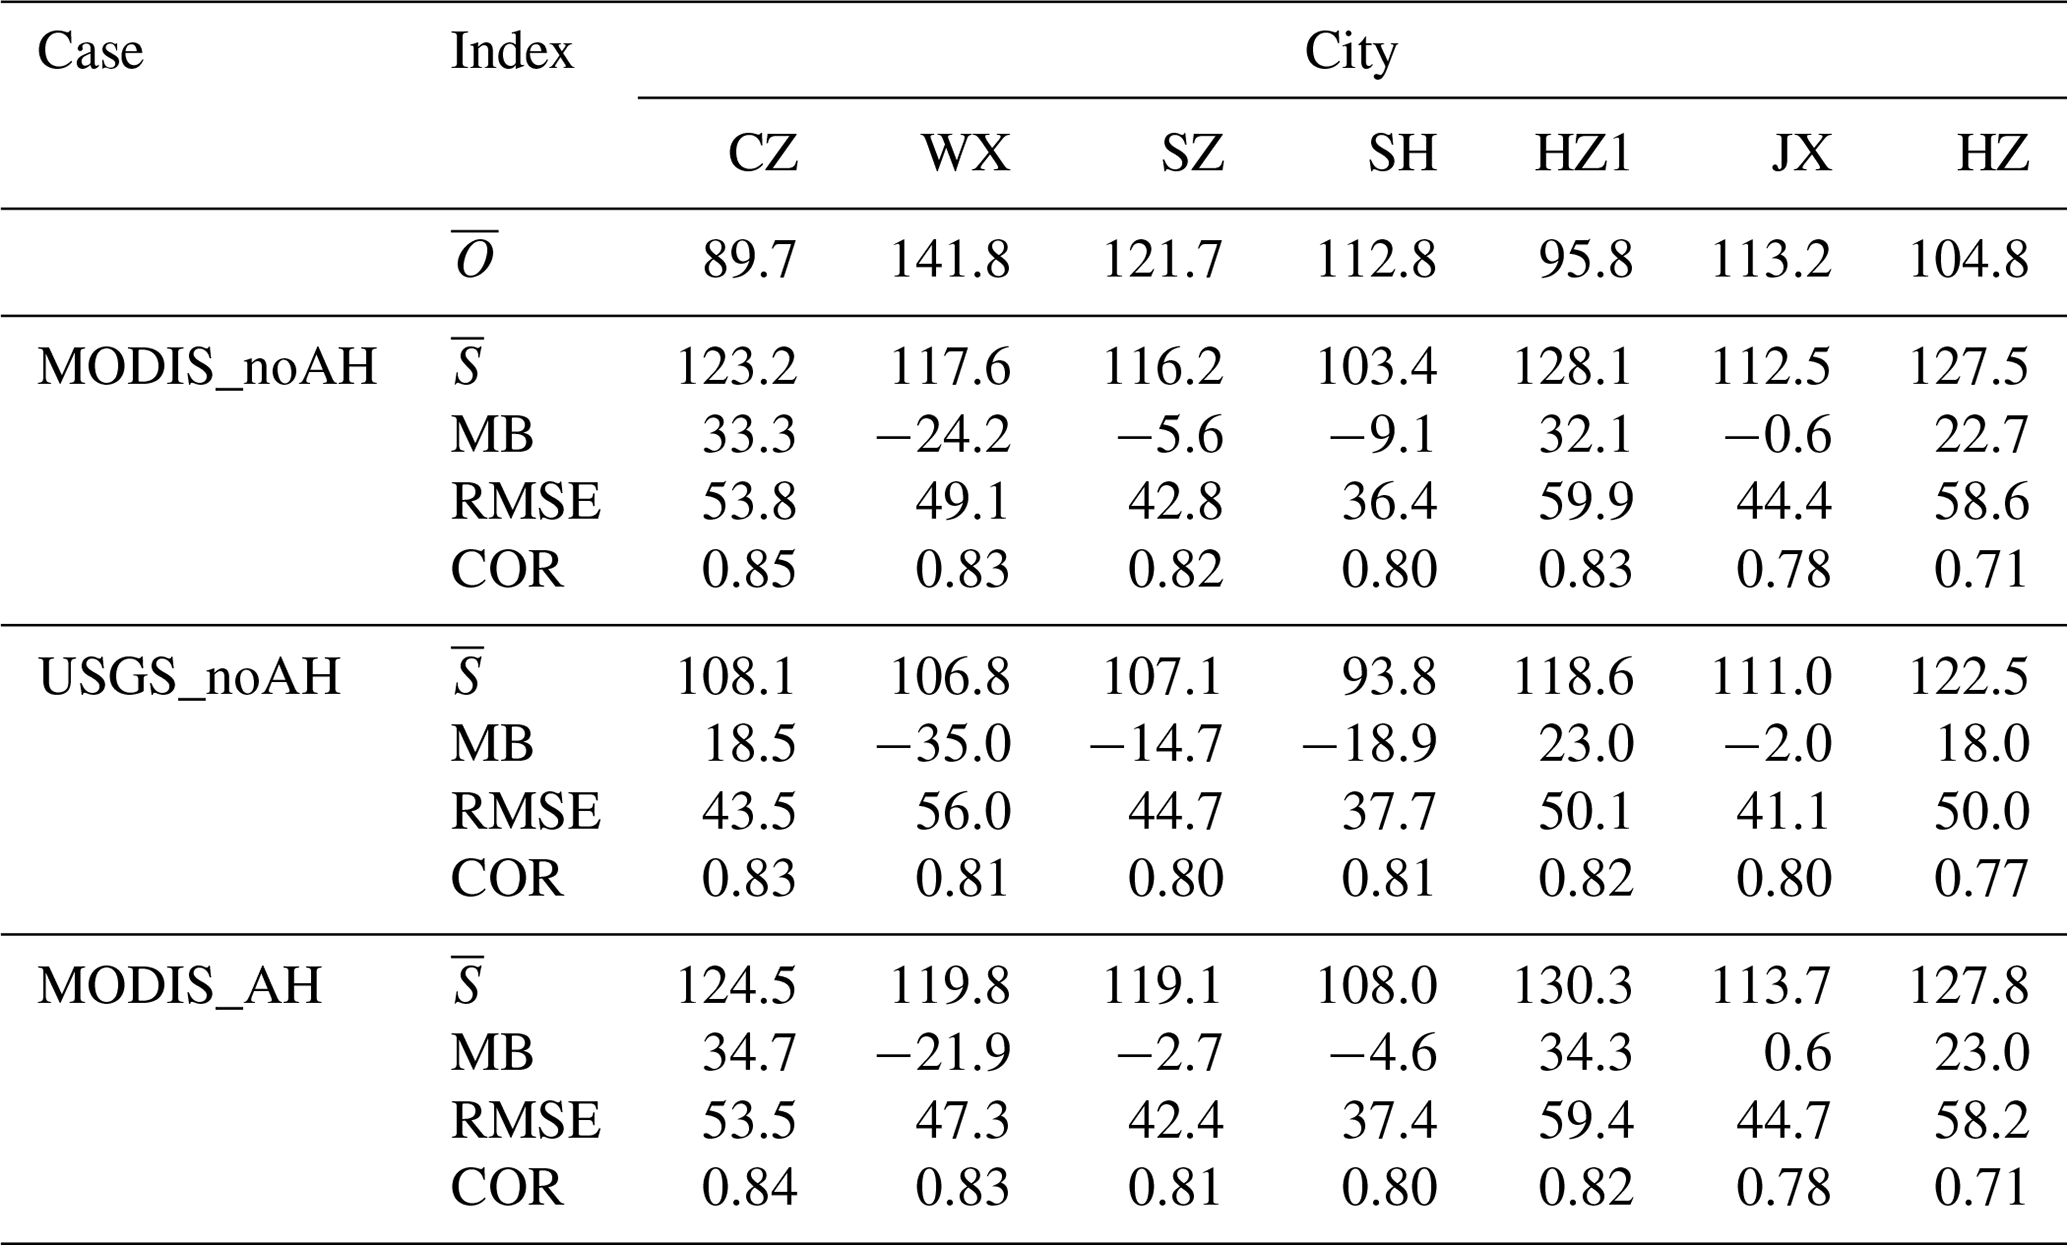
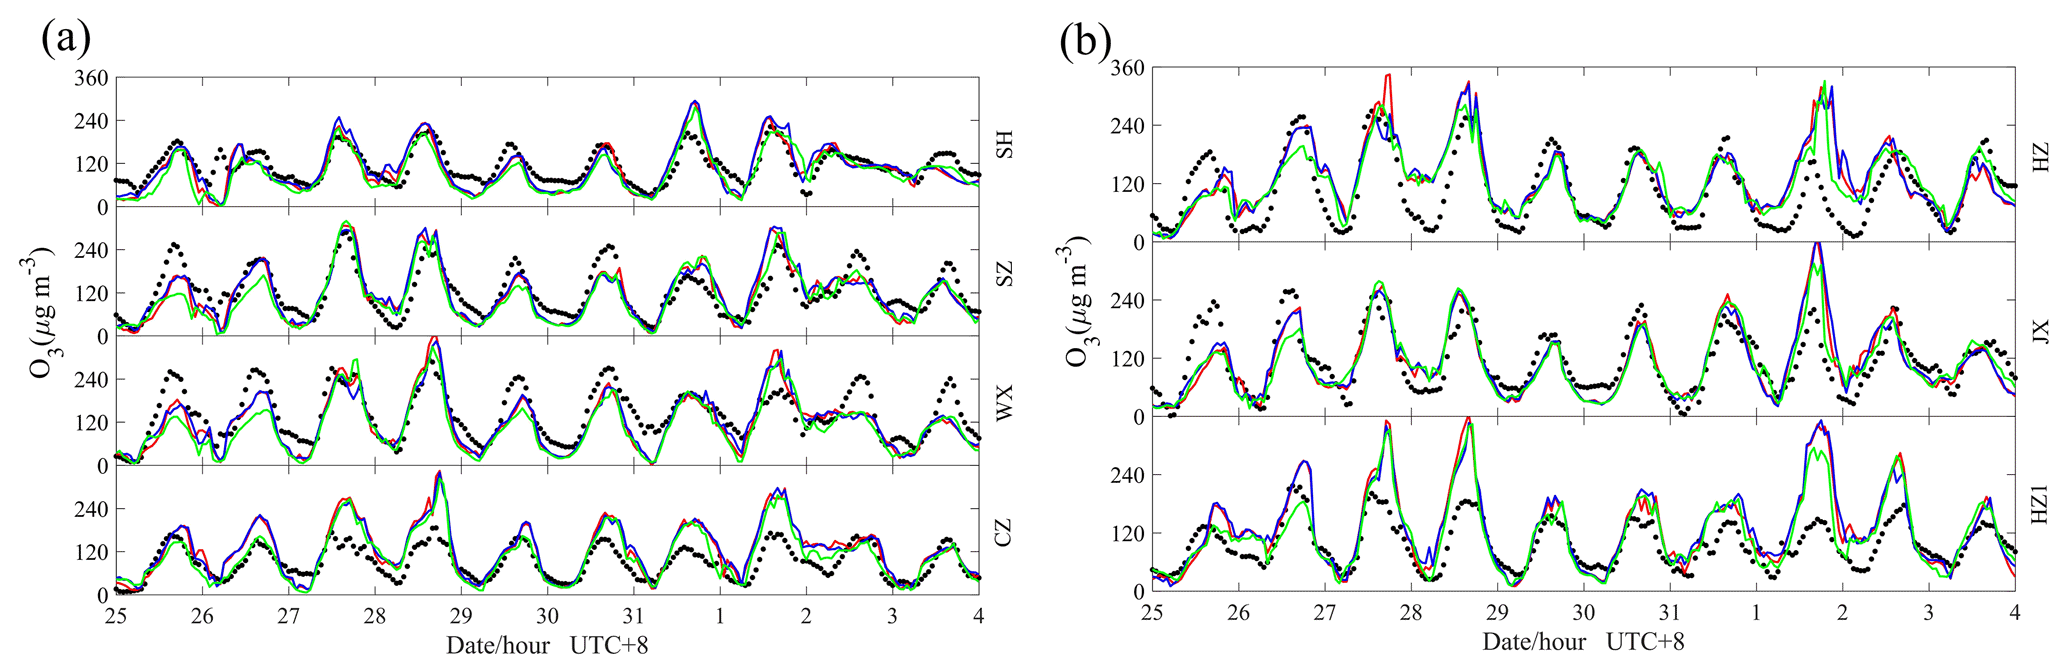
Table 5 lists the statistical metrics in O3, and Fig. 6 gives the hourly variations in O3 for observations and simulations in different cities. With high CORs (the CORs are 0.80, 0.81 and 0.80 in MODIS_noAH, USGS_noAH and MODIS_AH, respectively), all three simulations reproduce well the diurnal variation in O3, which is that O3 concentration reaches its maximum in the afternoon and decreases to its minimum in the morning. The magnitudes of O3 modeling results are reasonable (Fig. 6), but the peak and valley values of O3 simulations sometimes differ from the observations, especially the peak values, like at Huzhou. Considering the relatively low MBs (6.9, −1.6 and 9.0 µg m−3) and RMSEs (49.3, 46.2 and 49.0 µg m−3), the modeling results of O3 are generally reasonable and acceptable.
Table 5Statistical metrics in O3 (µg m−3) between observations and simulations.
Above all, the WRF-Chem model using our configuration has a good capability in simulating the meteorological factors and O3 over the studied region. In addition, it is noteworthy that the object of inter-comparisons between the three numerical experiments is not to determine which setting is the most skillful in reproducing the observations. Rather, it is to diagnose and understand the changes induced by land use and AH and the response of O3 to these changes.
3.3 Overall behaviors of O3 and local circulations
Based on the results of the control simulation (MODIS_noAH), we first give an overall behavior of O3 and local circulations during the study period. Then the changes induced by land use and AH are discussed via inter-comparisons between different numerical experiments. Therefore, only difference plots between USGS_noAH/MODIS_AH and MODIS_noAH are shown in this paper, and the corresponding original plots for USGS_noAH/MODIS_AH can be found in the Supplement (Figs. S2–S7).
3.3.1 Spatiotemporal variations in O3
As shown in Fig. 7, O3 concentration began to rise at around 08:00 local time (LT is UTC+8 h) and became noticeable after only 3 h (Fig. 7a and h). During this stage, the nocturnal residual layer vanished due to the development of the convective boundary layer (Fig. 8). The O3-rich air mass in the residual layer was mixed with the O3-poor air mass on the ground, which enhanced the surface O3 in the morning (Hu et al., 2018). At around 11:00 LT, a convective boundary layer was established (Fig. 8), and high O3 produced by photochemical reactions appeared over the central YRD and persisted until 18:00 LT (Fig. 7b and c). After sunset, surface O3 concentration generally decreased due to nitrogen oxide (NO) titration and reached its minimum in the early morning (Fig. 7f and g). In general, O3 has a typical diurnal variation with high concentrations in the daytime and low concentrations at night. This is consistent with the observations in Fig. 6, and this rule of O3 can be applied to most parts of the world. Therefore, the situation during the daytime (we select 11:00, 14:00, 17:00 and 20:00 LT in this study) should be considered in regard to O3 pollution.
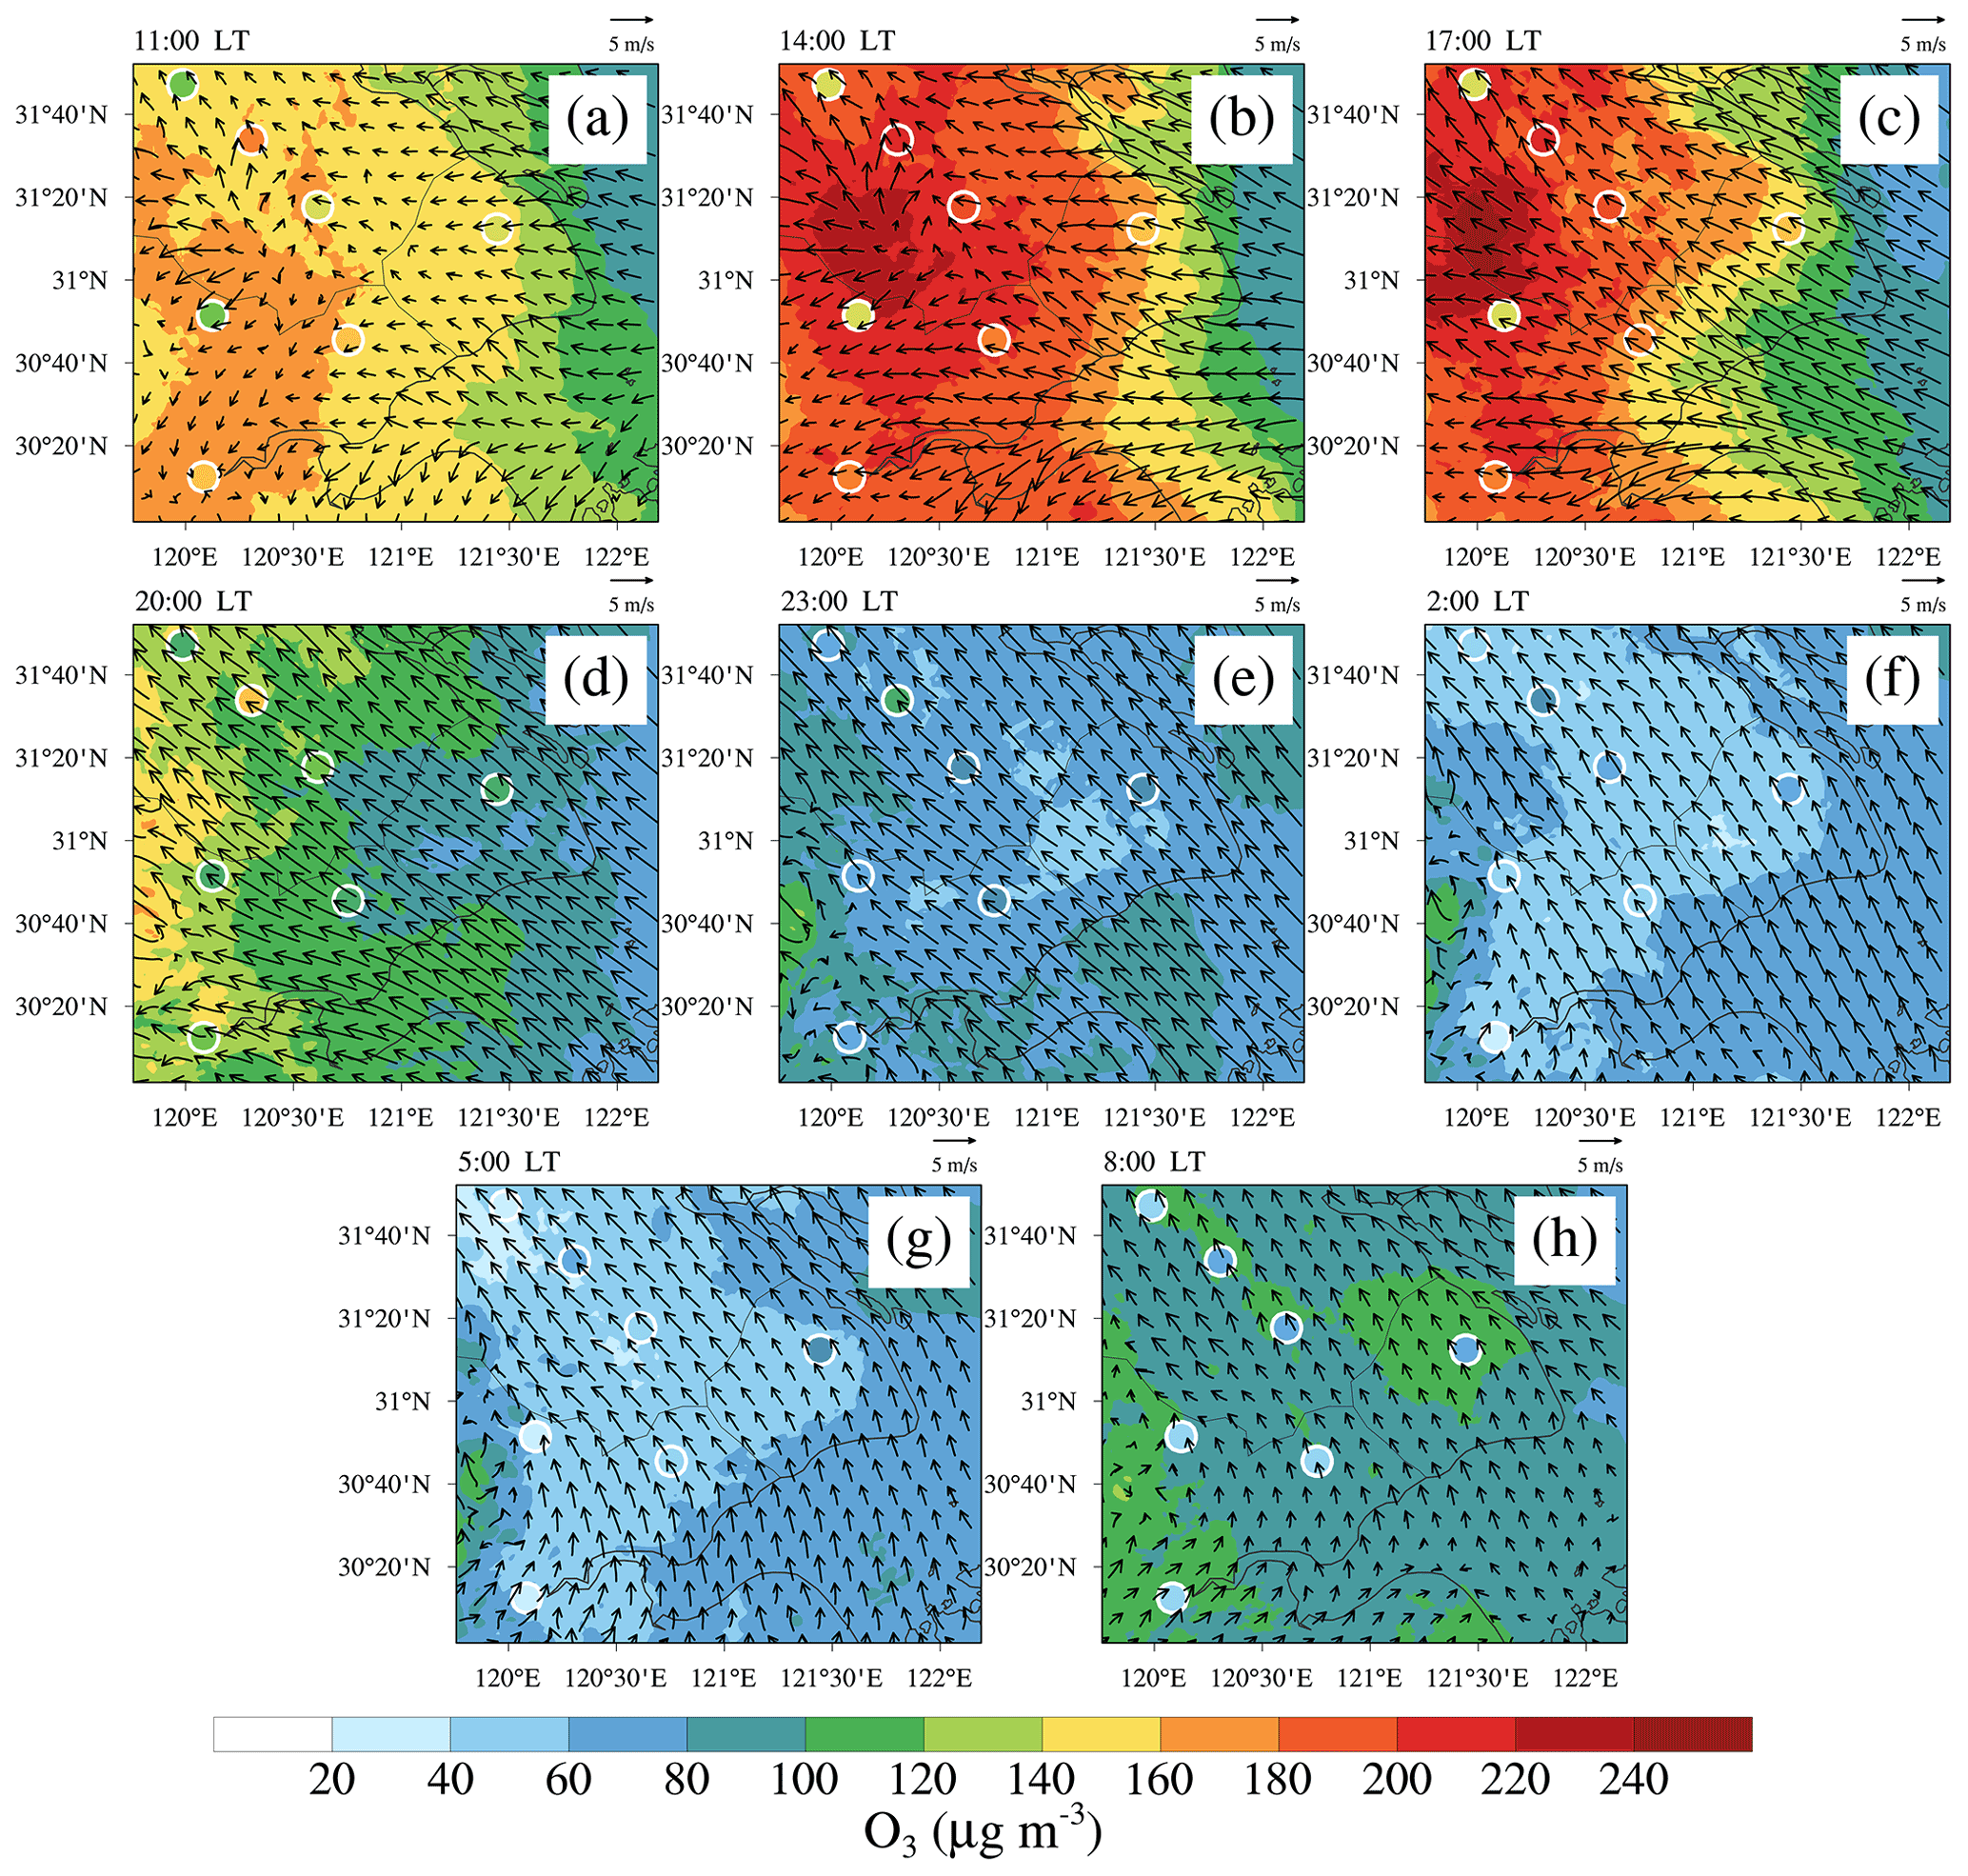
Figure 7Horizontal distributions of O3 and wind at the lowest model level in MODIS_noAH. Panels (a), (b), (c) and (d) show the results at 11:00, 14:00, 17:00 and 20:00 LT, referring to the daytime. Panels (e), (f), (g) and (h) show the results at 23:00, 02:00, 05:00 and 08:00 LT, referring to the night. The observations in different cities are overlaid using colored circles. To obtain universal features, all results are the average of the study period, and the same applies for the subsequent results.
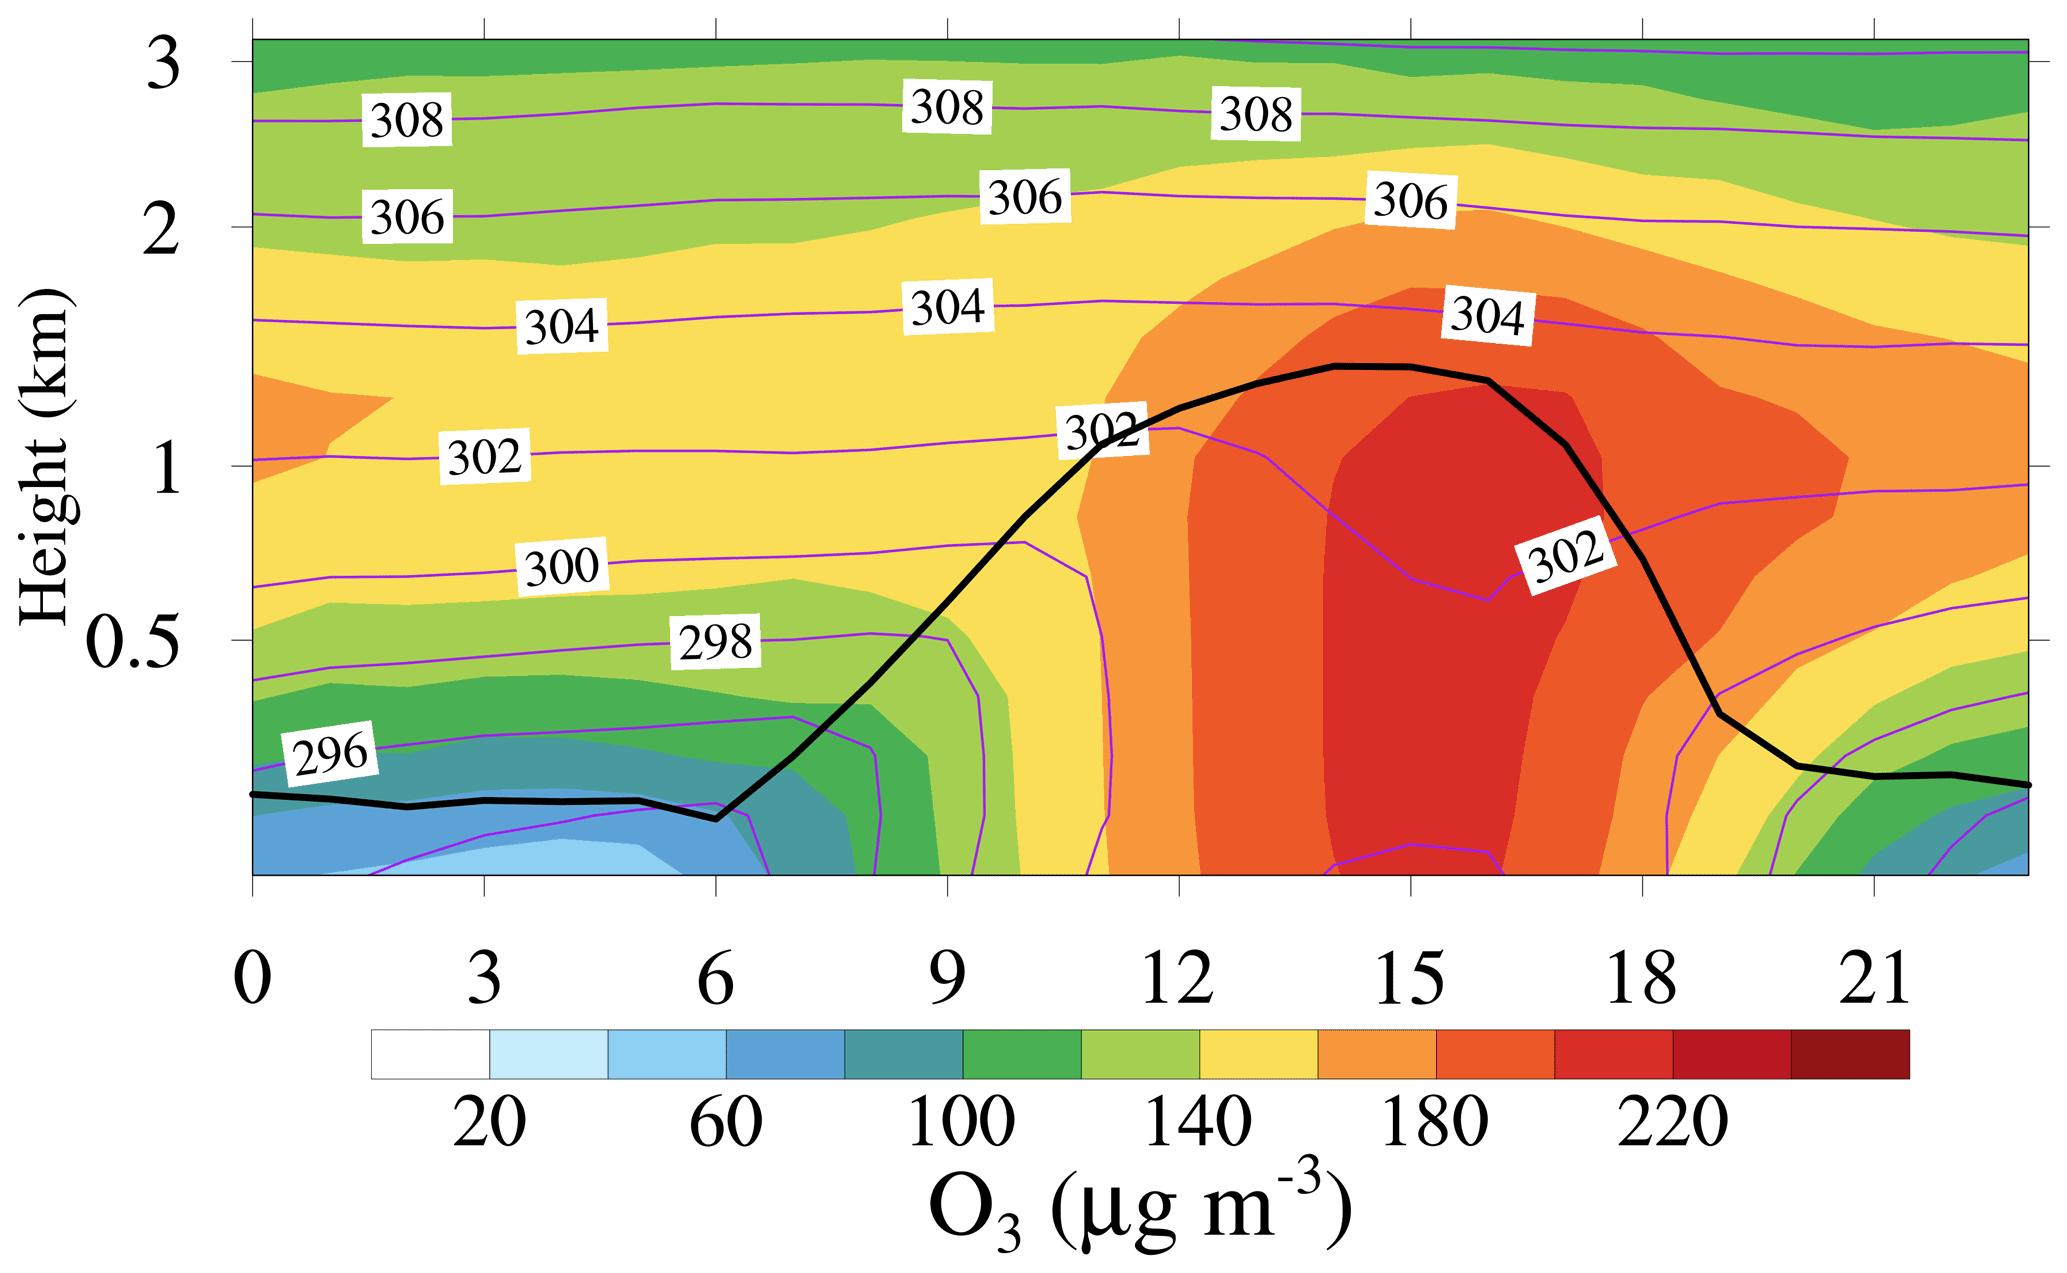
Figure 8Temporal–vertical distribution of O3 and potential temperature covering CZ, WX, SZ, SH, HZ1, JX and HZ over the innermost domain in MODIS_noAH.
3.3.2 The sea and lake breezes
As shown in Fig. 7a and b, high O3 concentrations in the central YRD tended to appear in the converging airflows associated with the sea breeze, the lake breeze and the background southeast wind (Fig. 4e). The sea breeze and the background southeast wind were usually in the same direction, and thereby the sea breeze affected a wide area and lasted a long time. The sea breeze was obvious at around 14:00 LT, matured at around 17:00 LT and continuously transported high O3 from coastal to inland areas during this period (Fig. 7b–d). Compared with the sea breeze, the lake breeze had a much smaller influencing area and a shorter duration. At around 11:00 LT, the lake breeze was established. It reached its maximum intensity at around 14:00 LT and then disappeared sharply due to the predominant southeast wind (Fig. 7b and c). Both the sea and the lake breezes are the typical local circulations in the YRD and play important roles in the horizontal distributions of O3 over this region.
Since the coastline is generally north–south (Fig. 1b), the cross sections along the blue line AB (east–west) depicted in Fig. 2a are illustrated to show representative examples of the vertical structure of the sea breeze (Fig. 9a–c). By 11:00 LT, the sea breeze below 500 m had already developed. The sea breeze front was found in front of Shanghai (∼ 121.6∘ E), with a height of 1.5 km (Fig. 9a). At around 14:00 LT, the speed of the sea breeze increased, exceeding 5 m s−1. The sea breeze front moved inland for a distance of 20–30 km (∼ 121.4∘ E) and was elevated to ∼ 2 km (Fig. 9b). At around 17:00 LT, the sea breeze matured, reducing the O3 concentration near the surface in Shanghai. However, the O3 in the mixed layer still maintained a high level, which may result in an O3-rich reservoir forming in the nocturnal residual layer (Fig. 9c). The penetration of the sea breeze front and its effect on surface O3 are also observed in other coastal regions, such as Taiwan (Lin et al., 2007), the Athens basin (Mavrakou et al., 2012) and São Paulo (Freitas et al., 2007).
As for the lake breeze, since the lake is inland, the lake breeze has different directions. Thus, the cross sections along the green line CD (south–north) and black line EF (east–west) in Fig. 2a are given. The lake breeze was established by 11:00 LT (Fig. 9d and g) although it was shallow at that time. At around 14:00 LT, the lake breeze strengthened. The extension of the lake breeze circulation zone can reach up to 2 km in the vertical dimension (Fig. 9e). The offshore flow of the lake breeze circulation (∼ 2 m s−1) transported high O3 concentrations from the urban areas to the lake, while the onshore flow blew the O3 back to urban areas (Fig. 9e and h). Thus, the net effect of the lake breeze is to accelerate the vertical mixing of O3 in the boundary layer, resulting in high surface O3 in the lakeside cities. This has also been reported in other lakeside cities, such as Lake Michigan (Lennartson and Schwartz, 2002), the Great Lakes (Sills et al., 2011) and the Great Salt Lake (Blaylock et al., 2017). By 17:00 LT, the lake breeze had disappeared.
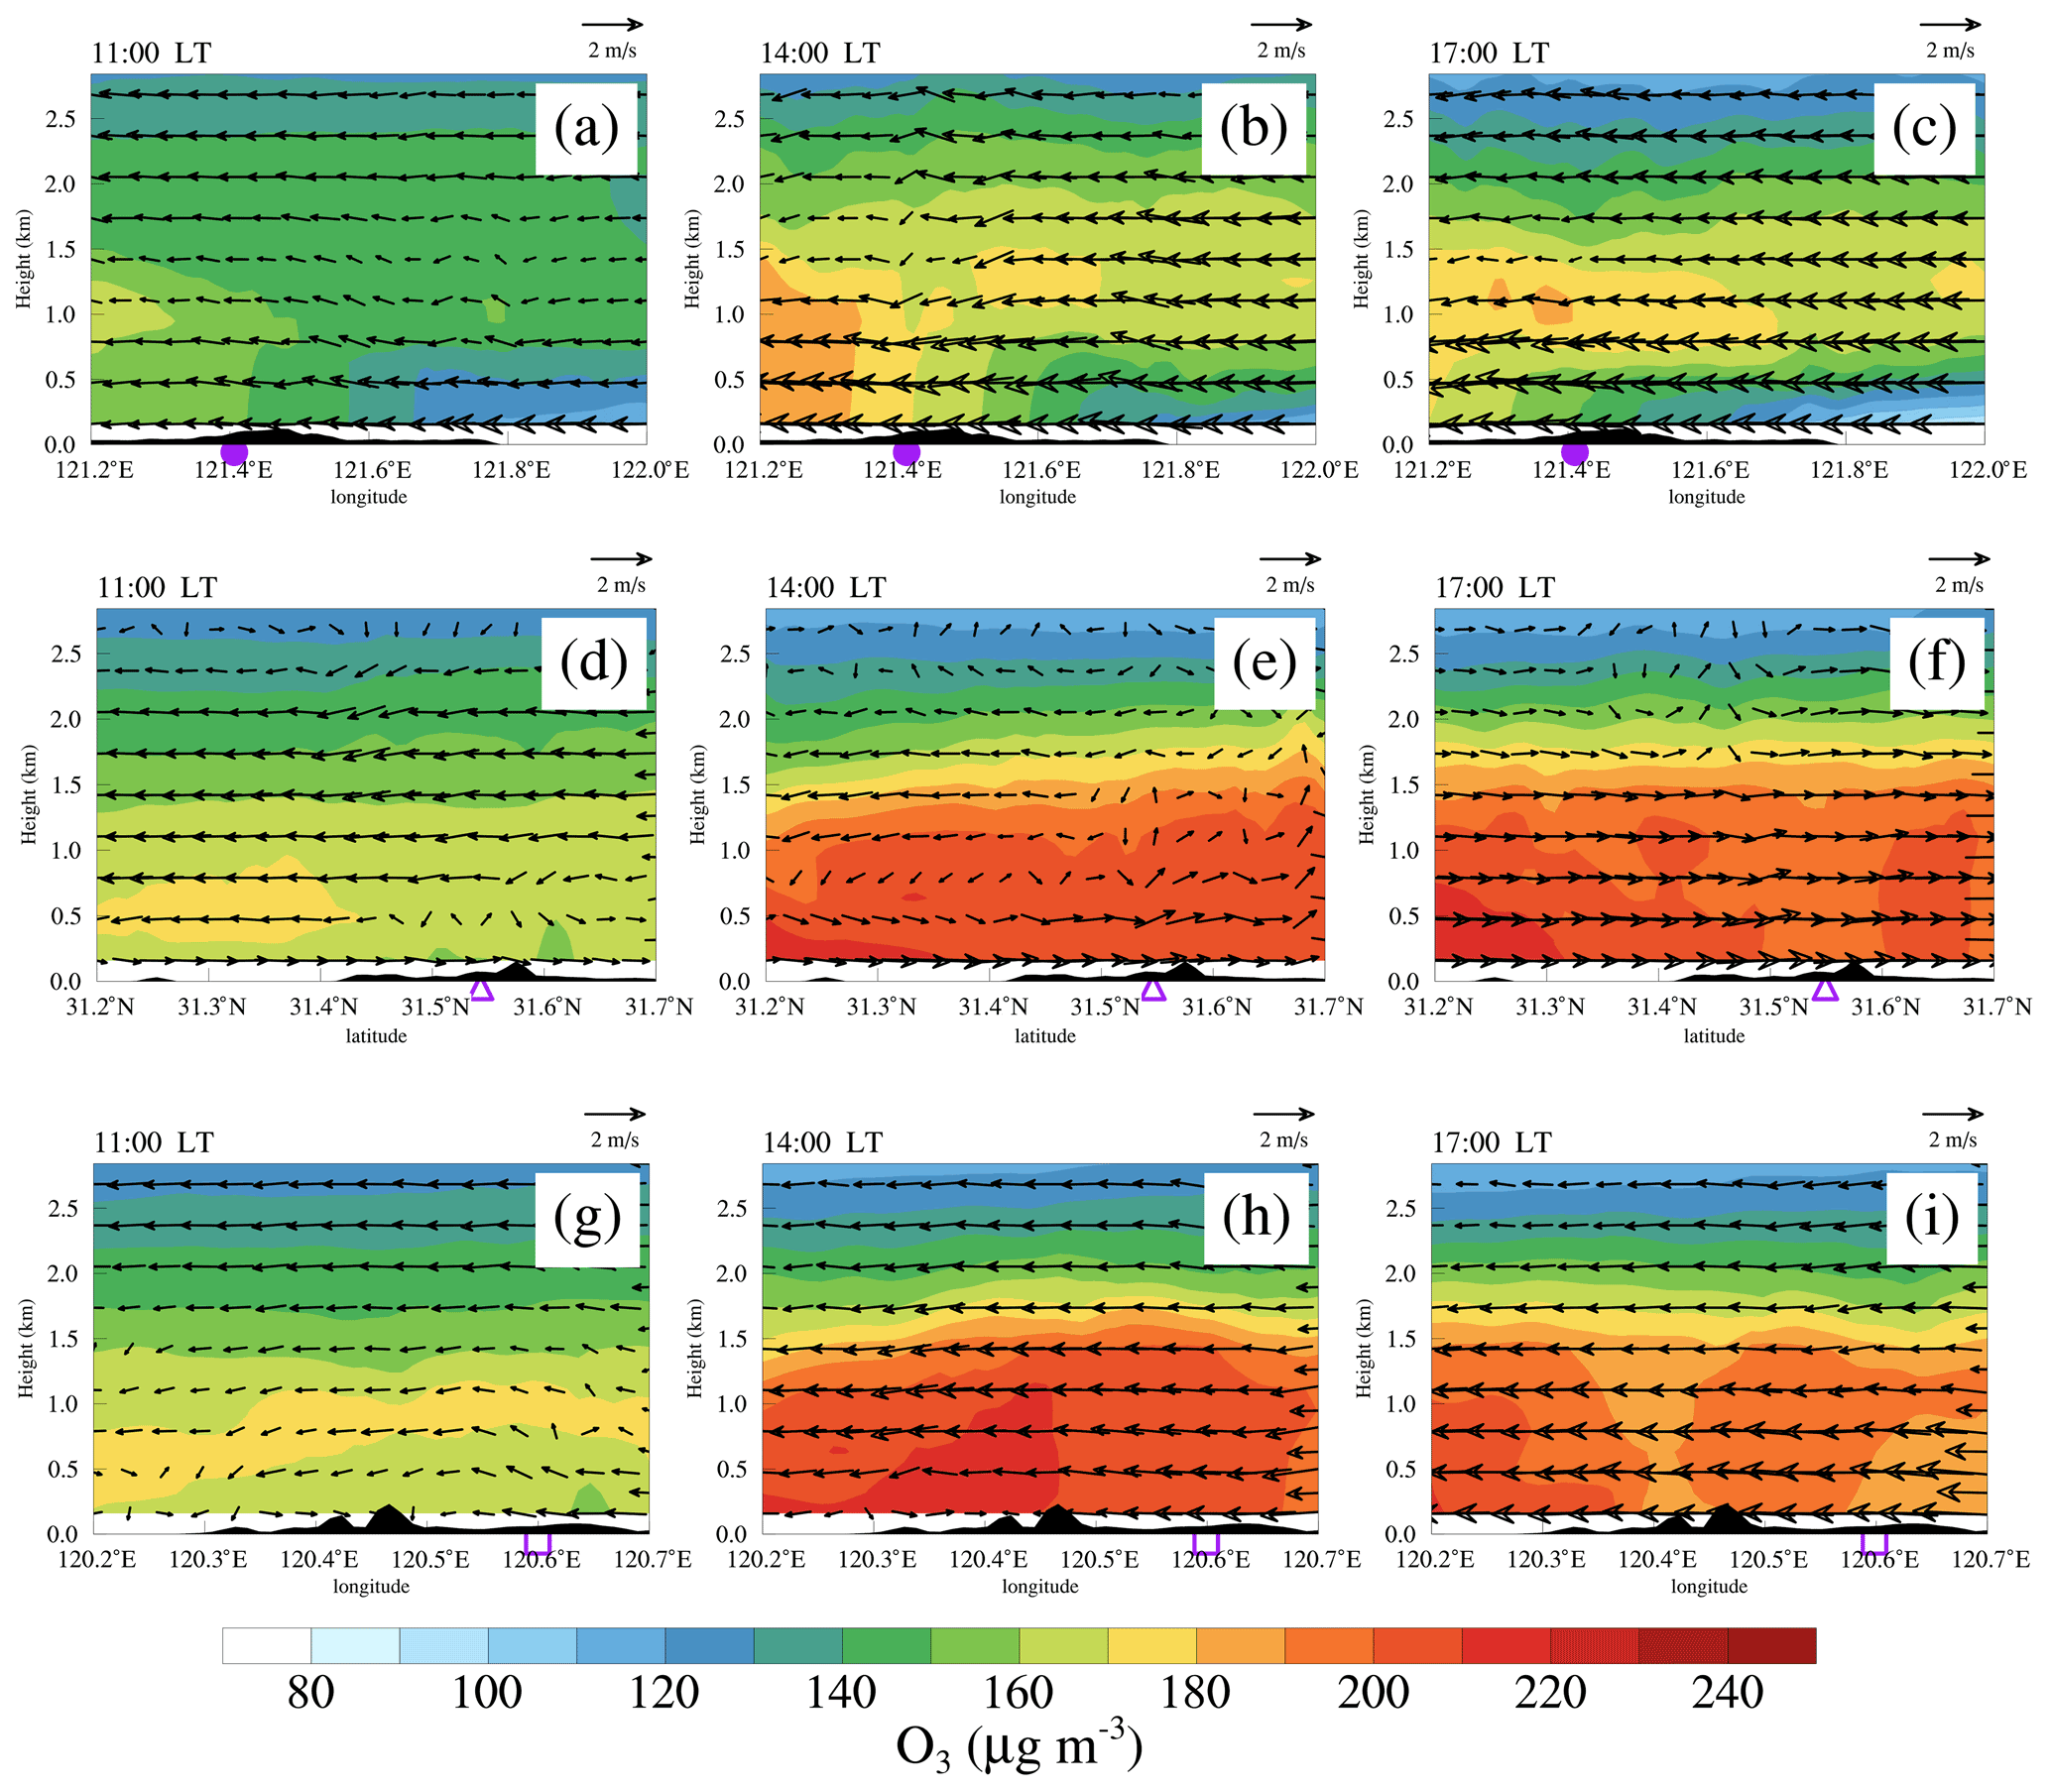
Figure 9Vertical cross sections of O3 and wind for the sea breeze at (a) 11:00, (b) 14:00 and (c) 17:00 LT along the blue line AB in Fig. 2a. Panels (d), (e) and (f) are the same as (a), (b) and (c), respectively, but for the lake breeze along the green line CD in Fig. 2a. Panels (g), (h) and (i) are also the same as (a), (b) and (c), respectively, but for the lake breeze along the black line EF in Fig. 2a. The purple dots, triangles and rectangles represent the locations of Shanghai, Wuxi and Suzhou, respectively. The black-shaded areas represent the terrain, and the terrain is multiplied by a factor of 10 when plotting.
3.4 Impacts of land use on meteorology and O3
3.4.1 The changes in horizontal direction
Figure 10 presents the spatial differences of the main factors (T2, PBLH, WS10 and O3) between MODIS_noAH and USGS_noAH. Land use changes via urban expansion can enhance surface heating through upward sensible heat fluxes so that T2 will increase. As shown in Fig. 10a–d, the spatial pattern of the remarkable warming effect for T2 was consistent with the urban fraction change associated with urbanization (Fig. 2a and b), which is the positive temperature anomaly that mainly appeared in cities and their surrounding areas. In megacities like Shanghai, T2 increased by as much as 3 ∘C. The change in PBLH was similar to that in T2 because the warming up of T2 was conducive to vertical movement in the boundary layer, which increased the PBLH (Fig. 10e–h). The maximum positive change in PBLH can reach up to 500 m at noon but down to 100 m after sunset. With regard to WS10, it decreased in MODIS_noAH (Fig. 10i–l), with a maximum decrease up to 1.5 m s−1 in Hangzhou at around 17:00 LT. This is because the roughness of cities and forest is larger than that of cropland (Fig. 2a and b). Apart from the abovementioned meteorological factors, urban expansion also increased the surface O3 concentration (Fig. 10m–p). The largest increment of O3 appeared in the afternoon, with a value of 20 µg m−3 at around 17:00 LT in Changzhou. In addition to these results, it is noteworthy that there were confusing “false” changes at the junction of land and sea/lake, especially for meteorological factors, such as T2 and WS10. This was caused by the different treatments of the MODIS-based and USGS land use classifications at the boundary conditions of land versus water instead of urban expansion.
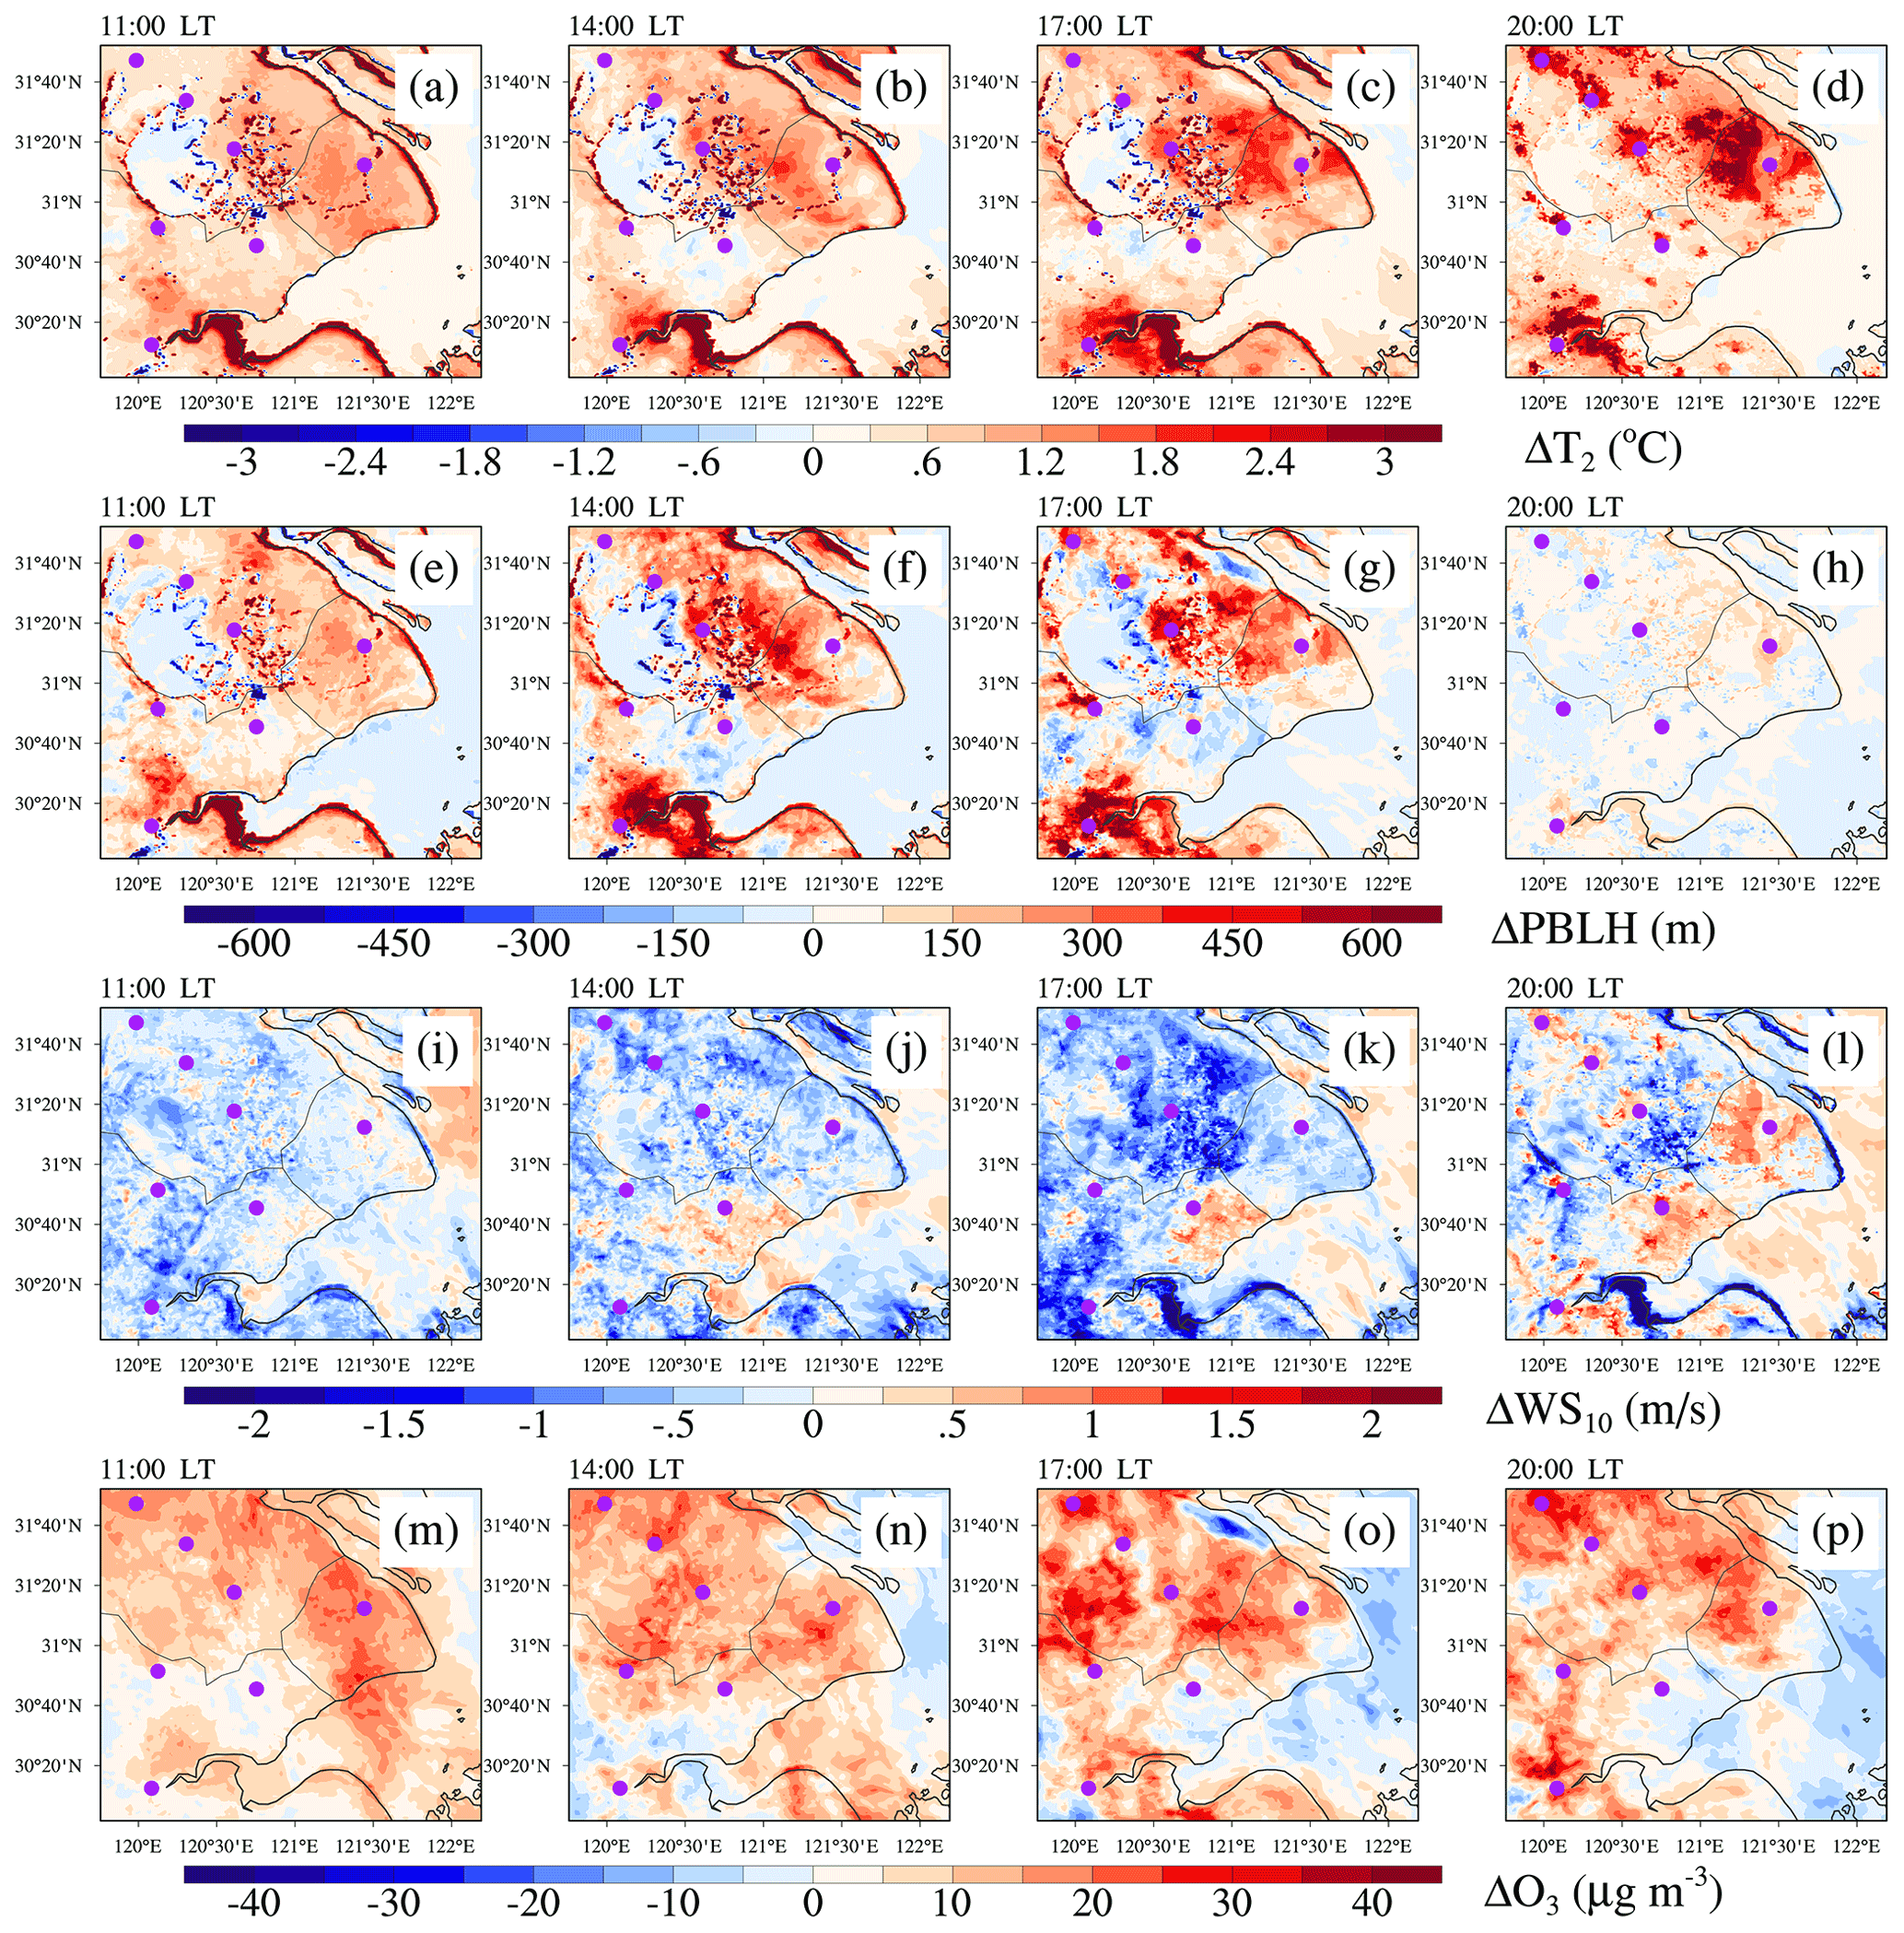
Figure 10Horizontal distributions of the differences in (a–d) T2, (e–h) PBLH, (i–l) WS10 and (m–p) O3 between MODIS_noAH and USGS_noAH (MODIS_noAH − USGS_noAH) during the daytime. The purple dots represent the locations of cities in the innermost domain.
3.4.2 The changes in vertical direction
Urban expansion alters not only the meteorological factors but also the local circulations. As shown in Fig. 11a–c, the sea breeze below 500 m increased by ∼ 1 m s−1 due to the enhanced temperature contrast between the land and the sea induced by the expansion of Shanghai. During the advance of the sea breeze front inland, the updraft induced by the sea breeze front promoted the vertical mixing of O3, elevating the surface O3 concentration in Shanghai (Fig. 11a and b). When the sea breeze matured at around 17:00 LT, its transport effect reduced the surface O3 concentration of the coastal cities (Fig. 9c). However, this “transport effect” was weakened because the sea breeze near the surface was slowed, affected by the rough urban surface. Finally, surface O3 of ∼ 10 µg m−3 was left compared to the scenario without cities. In contrast to the onshore flow, the offshore flow transported O3 to the sea, which may be an important source of O3 in the nocturnal residual layer. Influenced by the strong background southeast wind, the offshore flow was imperceptible during the daytime (Fig. 9), but it was enhanced by urban expansion (Fig. 11c).
As for the lake breeze, it was also enhanced by ∼ 1 m s−1 because of the larger temperature contrast resulting from the expansion of lakeside cities (Fig. 11e and h). Moreover, the life of the lake breeze was extended to 17:00 LT (Fig. 11f and i). Since the lake breeze circulation was conducive to the vertical mixing of O3 in the boundary layer (Sect. 3.3.2), the O3 concentration will increase in the lakeside cities, with a maximum of 30 µg m−3 in Wuxi at 14:00 LT.
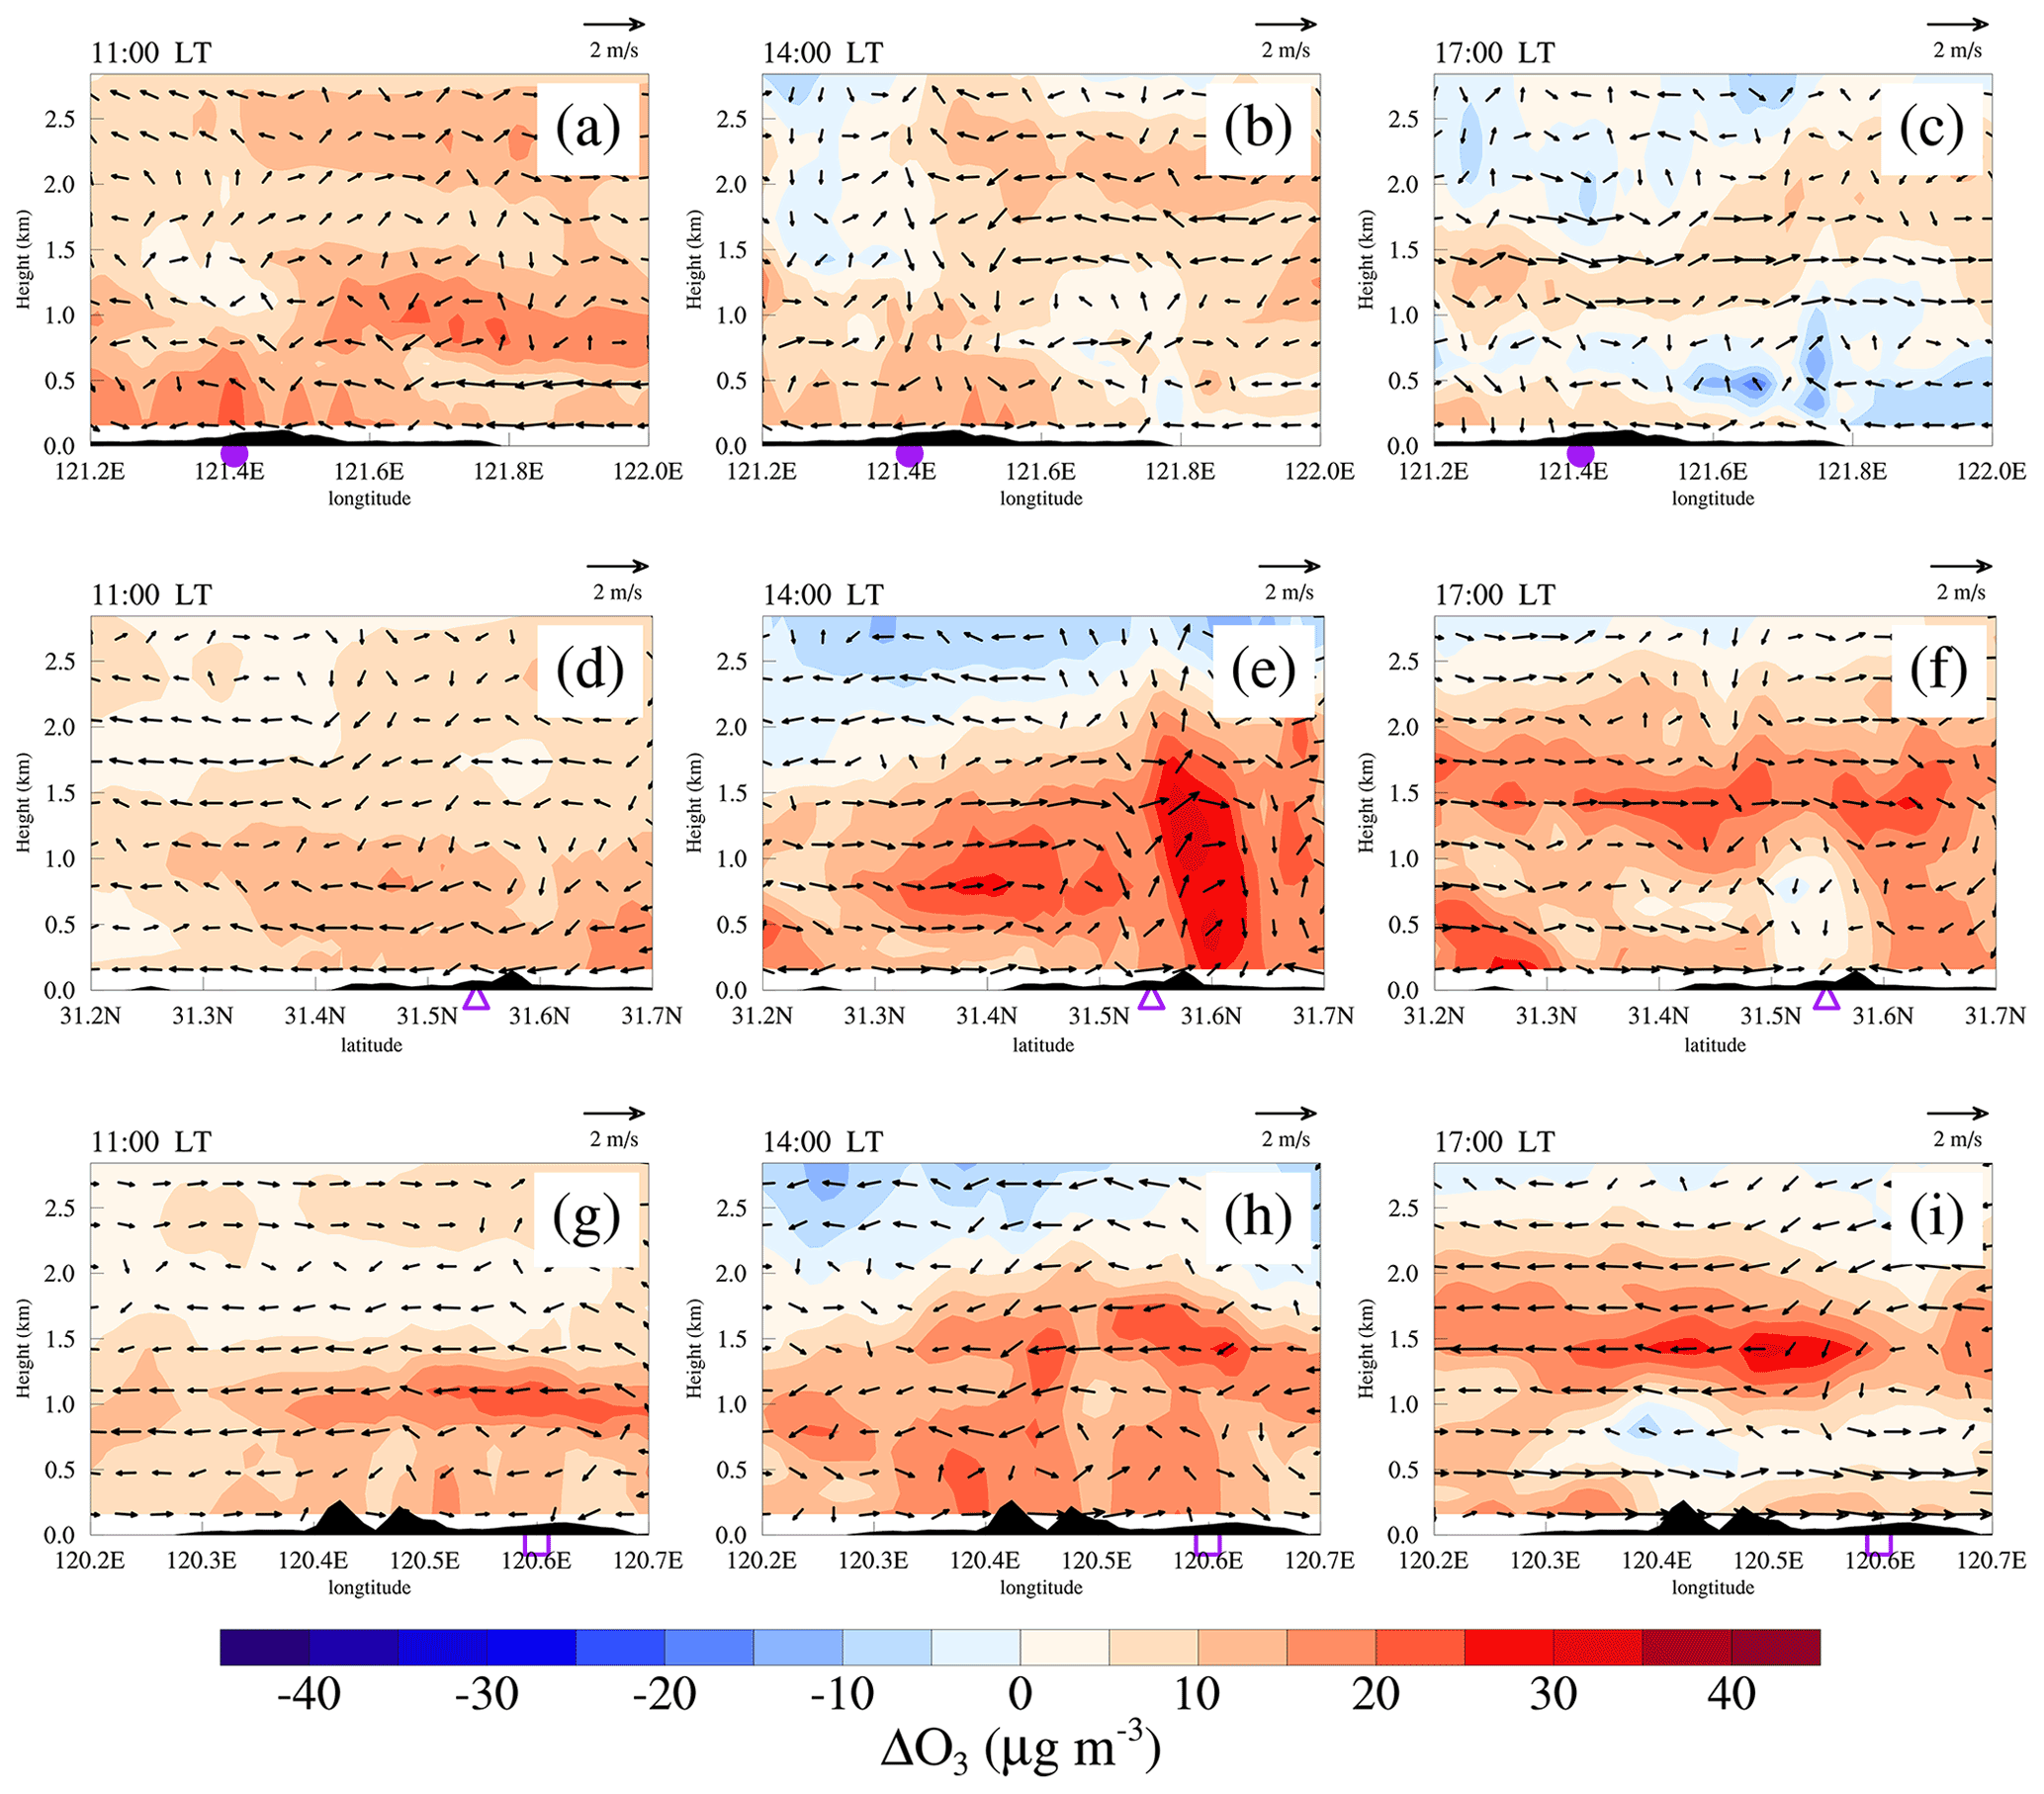
Figure 11Same as Fig. 9 but for the differences between MODIS_noAH and USGS_noAH (MODIS_noAH − USGS_noAH).
3.4.3 The mechanism of land use modulating O3
Changing land use from USGS to MODIS leads to an increase in T2 by a maximum of 3 ∘C, an increase in PBLH by a maximum of 500 m and a decrease in WS10 by a maximum of 1.5 m s−1 in the YRD, which is comparable to those in the BTH region (Yu et al., 2012), the PRD region (Li et al., 2014) and the National Capital Region of India (Sati and Mohan, 2017). These changes are particularly evident in and around cities as the largest change in land use is in urban surface fractions. Elevated air temperature is conducive to the photochemical production of O3, and the well-developed convective boundary layer favors the vertical mixing of O3. These changes in meteorological factors eventually increase the surface O3 concentration by a maximum of 20 µg m−3 in the YRD. Furthermore, local circulations, including the sea and the lake breezes, are also influenced by urban expansion, which further alters O3 in the vertical direction. For coastal cities, like Shanghai, the larger temperature contrast caused by cities enhances the sea breeze. As the sea breeze front moves inland, it enhances upward movement, which is conducive to the mixing of O3 in the boundary layer. However, the movement of the sea breeze is slowed due to the rough urban surface after the sea breeze matures. The removal of O3 via the sea breeze near the surface is then weakened. A similar response of the sea breeze to cities as well as its impact on O3 has also been reported in the PRD region (You et al., 2019) and São Paulo (Freitas et al., 2007). For the lakeside cities, like Wuxi and Suzhou, the lifetime of lake breezes is extended to the afternoon due to the expansion of cities. The offshore flow of the lake breeze transports high O3 concentrations in the middle of the boundary layer from the land to the lake, while the onshore flow brings the O3 back to the land, which accelerates the vertical mixing of O3 and increases the surface O3. Thus, high surface O3 usually appears when the lake breeze is established. This has also been observed in the Greater Toronto Area (Wentworth et al., 2015) and Lake Michigan (Abdi-Oskouei et al., 2020).
3.5 Impacts of anthropogenic heat on meteorology and O3
3.5.1 Horizontal changes
Compared with land use, the changes caused by AH are much smaller (Fig. 12). Furthermore, these changes are effective in and around cities as they usually have large AH flux densities (Fig. 3). By adding more surface sensible heat into the atmosphere, the AH fluxes led to an increase in T2 of 0.2 ∘C in urban areas, with a typical value of 0.42 ∘C in Shanghai (Fig. 12a–d). Vertical air movement in the boundary layer was then enhanced by the warming of T2, and the PBLH increased as well. According to the simulations, the PBLH increased by ∼ 75 m in the urban areas (Fig. 12e–h). Contrary to the decrease in WS10 caused by urban expansion, WS10 increased by ∼ 0.3 m s−1 in the urban areas when AH fluxes were taken into account (Fig. 12i–l). This is ascribed to the strengthened urban breeze circulations, which are conducive to the transmission of momentum from the upper layer to the surface. With regard to surface O3 concentration, it increased by ∼ 4 µg m−3 in the simulation with adding AH. What is more, the increases in T2, PBLH, WS10 and O3 were clearer after sunset as the solar shortwave radiation disappeared.
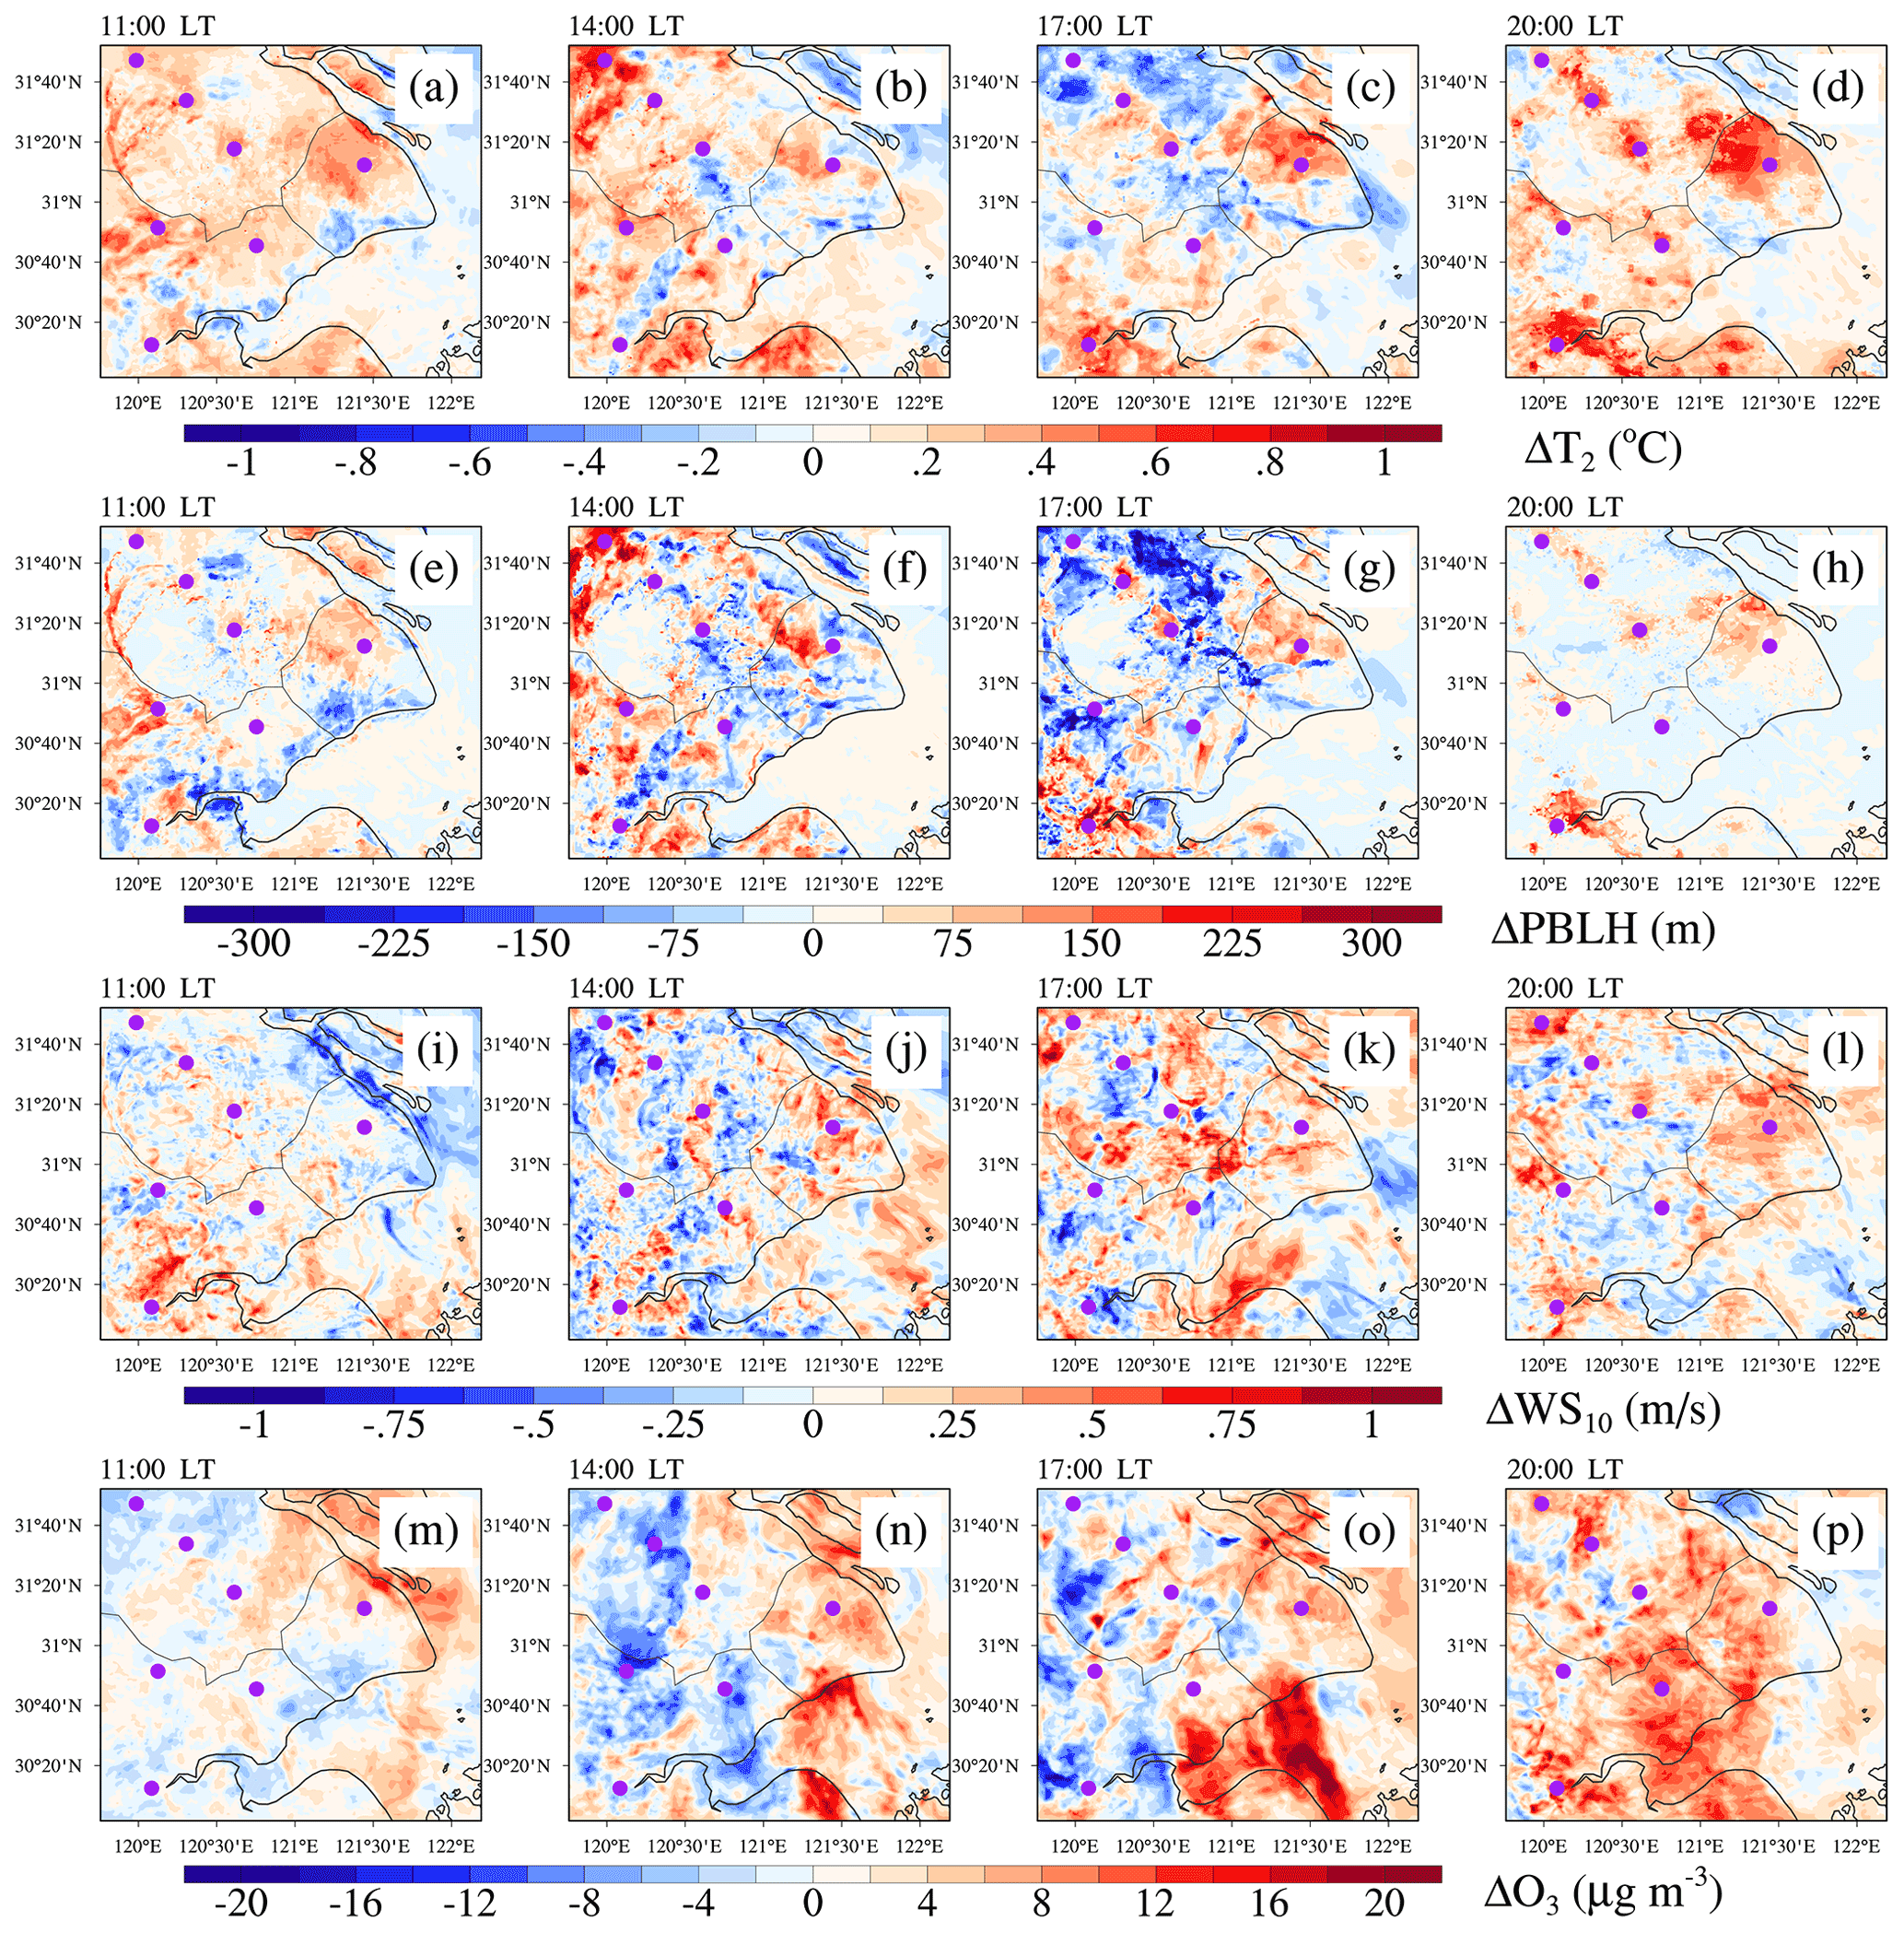
Figure 12Same as Fig. 10 but for the differences between MODIS_AH and MODIS_noAH (MODIS_AH − MODIS_noAH).
3.5.2 Vertical changes
The phenomenon that cities are almost always warmer than their surroundings is widely known as the urban heat island (UHI), and this urban–rural difference in temperature can further induce urban heat island circulation (UHIC). There was enhanced UHIC driven by AH in the megacity Shanghai at around 14:00 LT (Fig. 13b). This circulation extended horizontally 20–30 km from the city center to the urban edge and vertically to ∼ 2 km from the ground to the top of the urban boundary layer, resulting in a small increase (4–6 µg m−3) in surface O3. However, for the lakeside cities, the enhanced UHIC was not perceptible. The O3 concentration in urban areas was reduced on average, with a maximum of 16 µg m−3 in Wuxi at around 14:00 LT (Fig. 13e). The decrease in O3 may be related to the increased wind (Fig. 12i–k), which was beneficial to the diffusion and dilution of O3. Furthermore, AH has a limited effect on the sea and the lake breezes as it cannot affect any branch of the two as significantly as urban expansion.
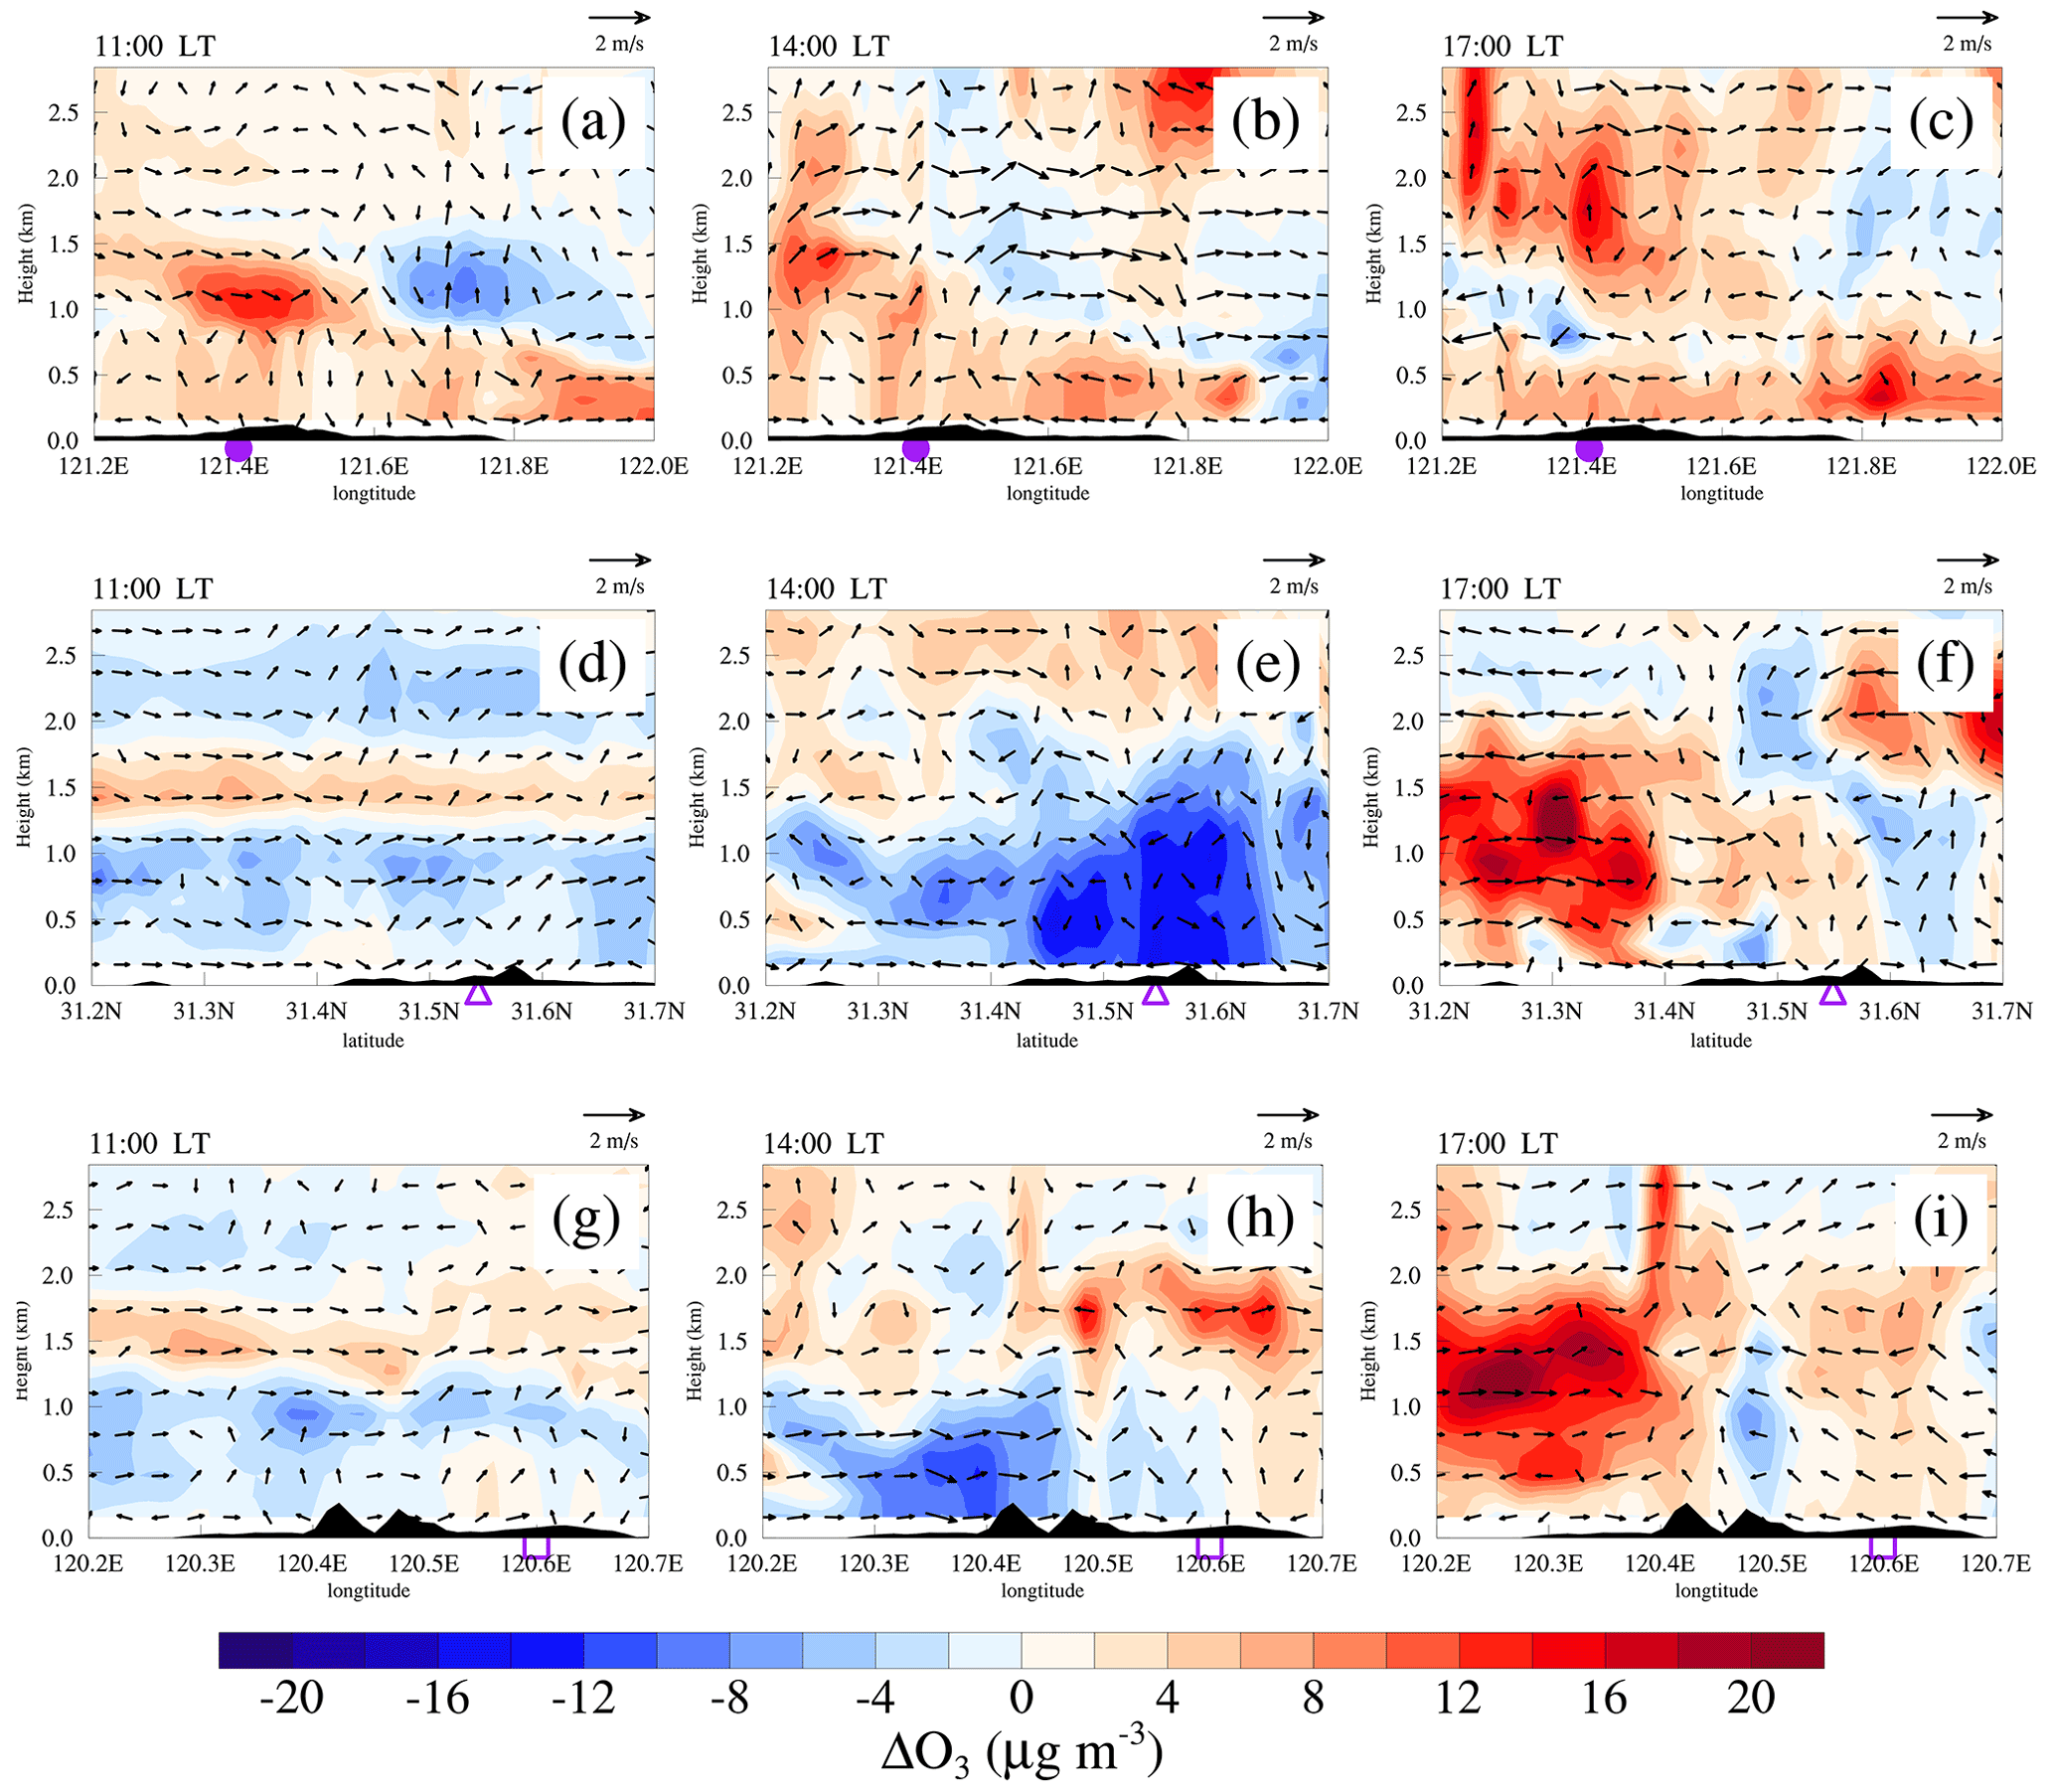
Figure 13Same as Fig. 9 but for the differences between MODIS_AH and MODIS_noAH (MODIS_AH − MODIS_noAH).
3.5.3 The mechanism of anthropogenic heat modulating O3
AH and land use play different roles in meteorology and O3. AH allows the atmosphere to reserve more energy via the additional sensible heat fluxes, which increases T2 by ∼ 0.2 ∘C. Higher temperature induces stronger upward air movement to the development of the convective boundary layer, raising the PBLH by ∼ 75 m. In the convective boundary layer, the atmosphere is associated with turbulent motions and is unstable. Together with the enhanced urban breeze caused by AH, WS10 increases by ∼ 0.3 m s−1. These findings are comparable to the values estimated in other cities around the world, such as Philadelphia in the United States (Fan and Sailor, 2005), Winnipeg in Canada (Ferguson and Woodbury, 2007) and Berlin in Germany (Menberg et al., 2013). These changes in meteorological factors eventually lead to an increase in surface O3 by ∼ 4 µg m−3. It is noteworthy that the effects of AH are usually clearer at night in urban areas. In addition, although AH plays an important role in urban breeze circulations, it may not be powerful enough to affect local circulations such as the sea and the lake breezes.
Land use change via urban expansion and the increase in AH release are important manifestations of urbanization. They can alter the regional meteorology and thereby affect O3 concentrations in and around cities. In this study, the YRD region, a highly urbanized coastal area with severe O3 pollution, is selected to investigate this issue. Firstly, the basic characteristics of O3 pollution in the YRD are provided based on the surface observations. Secondly, a representative case is selected for further study using the WRF-Chem model, and the model performance is evaluated by comparing it with the observations. Finally, the response of O3 to changes in meteorology caused by land use and AH are discussed via the model inter-comparisons. The main findings are listed below:
-
Regional O3 pollution occurred frequently in the YRD (∼ 26 times per year) from 2015 to 2019. These O3 pollution episodes mainly occur in calm conditions characterized by high temperature (over 20 ∘C), low relative humidity (less than 80 %), light wind (less than 3 m s−1) and shallow cloud cover (less than 5 okta). In this case, the sea and the lake breezes tend to develop and have an important impact on the distribution of O3 in the YRD.
-
By updating the land use dataset from USGS to MODIS, we find an increase in T2 by a maximum of 3 ∘C, an increase in PBLH by a maximum of 500 m and a decrease in WS10 by a maximum of 1.5 m s−1 in the YRD. The higher temperature and PBLH elevate the surface O3 concentration by a maximum of 20 µg m−3 via stronger photochemical reactions and vertical mixing processes. Apart from meteorological factors, the sea and the lake breezes are also modified by urban expansion associated with urbanization. The sea breeze is enhanced due to the expansion of coastal cities. Nevertheless, further progression inland of the sea breeze is stalled in the afternoon on account of the rough urban surface, reducing the transmission of O3 from the coast to the land. The expansion of lakeside cities extends the lifetime of the lake breeze from noon to afternoon. Since the lake breeze accelerates the vertical mixing of O3 in the boundary layer, the surface O3 in lakeside cities can increase as much as 30 µg m−3.
-
When the AH fluxes are taken into account, T2, PBLH, WS10 and O3 will increase by about 0.2 ∘C, 75 m, 0.3 m s−1 and 4 µg m−3, respectively, in and around cities. These changes are relatively small compared to urban expansion and mainly appear around cities where the AH fluxes are large. In addition, unlike urban expansion, AH may have a limited impact on the sea and the lake breezes. But the urban breeze circulations are found to be sensitive to AH inputs.
Studying the impacts of land use and AH forced by human activities on the urban environment is fundamental in improving urban air quality. Although this study only focuses on the YRD region, most of the results can be supported by previous studies conducted in other regions around the world. As an increasing number of city clusters composed of large- and medium-sized cities are built, this work can provide valuable insight into the formation of O3 pollution in rapidly developing regions with unique geographical features.
Air quality monitoring data were acquired from a mirror of data from the official NEMC real-time publishing platform (https://quotsoft.net/air/, National Environmental Monitoring Centre of China, 2022). Meteorological data were issued by the NCDC (ftp://ftp.ncdc.noaa.gov/pub/data/noaa/isd-lite/, National Climatic Data Center, 2016). The FNL meteorological data were taken from the NCEP (https://doi.org/10.5065/D6M043C6, National Centers for Environmental Prediction/National Weather Service/NOAA/U.S. Department of Commerce, 2000). The MEIC data were accessible at http://meicmodel.org/ (Li et al., 2017b; Zheng et al., 2018). These data can be downloaded for free as long as you agree to the official instructions. Model output data used for analysis and plotting, as well as the code used for simulations, can be made available upon request.
The supplement related to this article is available online at: https://doi.org/10.5194/acp-22-1351-2022-supplement.
CZ and MX had the original ideas, designed the research, collected the data and prepared the original draft. CZ did the numerical simulations and carried out the data analysis. MX acquired financial support for the project leading to this publication.
The contact author has declared that neither they nor their co-author has any competing interests.
Publisher’s note: Copernicus Publications remains neutral with regard to jurisdictional claims in published maps and institutional affiliations.
We are grateful to the MEPC for the air quality monitoring data, to the NCDC for the meteorological data, to the NCEP for global final analysis fields and to Tsinghua University for the MEIC inventories. The numerical calculations were performed on the blade cluster system in the High Performance Computing and Massive Data Center (HPC&MDC) of the School of Atmospheric Sciences, Nanjing University. We also thank the anonymous reviewers for the constructive comments and suggestions.
This research has been supported by the Natural Science Foundation of Jiangsu Province (grant no. BK20211158) and the National Key Research and Development Program of China (grant nos. 2017YFA0604301, 2018YFC0213502, 2018YFC1506404 and 2019YFA0606803).
This paper was edited by Andrea Pozzer and reviewed by two anonymous referees.
Abdi-Oskouei, M., Carmichael, G., Christiansen, M., Ferrada, G., Roozitalab, B., Sobhani, N., Wade, K., Czarnetzki, A., Pierce, R. B., Wagner, T., and Stanier, C.: Sensitivity of Meteorological Skill to Selection of WRF-Chem Physical Parameterizations and Impact on Ozone Prediction During the Lake Michigan Ozone Study (LMOS), J. Geophys. Res.-Atmos., 125, e2019JD031971, https://doi.org/10.1029/2019jd031971, 2020.
Bergin, M. S., West, J. J., Keating, T. J., and Russell, A. G.: Regional atmospheric pollution and transboundary air quality management, Annu. Rev. Environ. Resour., 30, 1–37, https://doi.org/10.1146/annurev.energy.30.050504.144138, 2005.
Blaylock, B. K., Horel, J. D., and Crosman, E. T.: Impact of Lake Breezes on Summer Ozone Concentrations in the Salt Lake Valley, J. Appl. Meteorol. Clim., 56, 353–370, 2017.
Buchholz, S., Junk, J., Krein, A., Heinemann, G., and Hoffmann, L.: Air pollution characteristics associated with mesoscale atmospheric patterns in northwest continental Europe, Atmos. Environ., 44, 5183–5190, https://doi.org/10.1016/j.atmosenv.2010.08.053, 2010.
Chameides, W. and Walker, J. C. G.: A photochemical theory of tropospheric ozone, J. Geophys. Res., 78, 8751–8760, https://doi.org/10.1029/JC078i036p08751, 1973.
Chen, F. and Dudhia, J.: Coupling an advanced land surface-hydrology model with the Penn State-NCAR MM5 modeling system. Part II: Preliminary model validation, Mon. Weather Rev., 129, 587–604, 2001.
Chen, G., Zhao, L., and Mochida, A.: Urban Heat Island Simulations in Guangzhou, China, Using the Coupled WRF/UCM Model with a Land Use Map Extracted from Remote Sensing Data, Sustainability, 8, 14, https://doi.org/10.3390/su8070628, 2016.
Chen, S. H. and Sun, W. Y.: A one-dimensional time dependent cloud model, J. Meteorol. Soc. Jpn., 80, 99–118, 2002.
Crosman, E. T. and Horel, J. D.: Sea and Lake Breezes: A Review of Numerical Studies, Bound.-Lay. Meteorol., 137, 1–29, https://doi.org/10.1007/s10546-010-9517-9, 2010.
De Meij, A. and Vinuesa, J. F.: Impact of SRTM and Corine Land Cover data on meteorological parameters using WRF, Atmos. Res., 143, 351–370, https://doi.org/10.1016/j.atmosres.2014.03.004, 2014.
Ding, A., Wang, T., Zhao, M., Wang, T., and Li, Z.: Simulation of sea-land breezes and a discussion of their implications on the transport of air pollution during a multi-day ozone episode in the Pearl River Delta of China, Atmos. Environ., 38, 6737–6750, https://doi.org/10.1016/j.atmosenv.2004.09.017, 2004.
Fan, H. L. and Sailor, D. J.: Modeling the impacts of anthropogenic heating on the urban climate of Philadelphia: a comparison of implementations in two PBL schemes, Atmos. Environ., 39, 73–84, 2005.
Fast, J. D., Gustafson, W. I., Easter, R. C., Zaveri, R. A., Barnard, J. C., Chapman, E. G., Grell, G. A., and Peckham, S. E.: Evolution of ozone, particulates, and aerosol direct radiative forcing in the vicinity of Houston using a fully coupled meteorology-chemistry-aerosol model, J. Geophys. Res.-Atmos., 111, D21305, https://doi.org/10.1029/2005jd006721, 2006.
Ferguson, G. and Woodbury, A. D.: Urban heat island in the subsurface, Geophys. Res. Lett., 34, L23713, https://doi.org/10.1029/2007gl032324, 2007.
Flanner, M. G.: Integrating anthropogenic heat flux with global climate models, Geophys. Res. Lett., 36, L02801, https://doi.org/10.1029/2008gl036465, 2009.
Freitas, E. D., Rozoff, C. M., Cotton, W. R., and Dias, P. L. S.: Interactions of an urban heat island and sea-breeze circulations during winter over the metropolitan area of Sao Paulo, Brazil, Bound.-Lay. Meteorol., 122, 43–65, 2007.
Friedl, M. A., Sulla-Menashe, D., Tan, B., Schneider, A., Ramankutty, N., Sibley, A., and Huang, X.: MODIS Collection 5 global land cover: Algorithm refinements and characterization of new datasets, Remote Sens. Environ., 114, 168–182, https://doi.org/10.1016/j.rse.2009.08.016, 2010.
Fu, Y. and Liao, H.: Impacts of land use and land cover changes on biogenic emissions of volatile organic compounds in China from the late 1980s to the mid-2000s: implications for tropospheric ozone and secondary organic aerosol, Tellus B, 66, 24987, https://doi.org/10.3402/tellusb.v66.24987, 2014.
Gao, D., Xie, M., Chen, X., Wang, T. J., Liu, J., Xu, Q., Mu, X. Y., Chen, F., Li, S., Zhuang, B. L., Li, M. M., Zhao, M., and Ren, J. Y.: Systematic classification of circulation patterns and integrated analysis of their effects on different ozone pollution levels in the Yangtze River Delta Region, China, Atmos. Environ., 242, 117760, https://doi.org/10.1016/j.atmosenv.2020.117760, 2020.
Gong, P., Liu, H., Zhang, M., Li, C., Wang, J., Huang, H., Clinton, N., Ji, L., Li, W., Bai, Y., Chen, B., Xu, B., Zhu, Z., Yuan, C., Ping Suen, H., Guo, J., Xu, N., Li, W., Zhao, Y., Yang, J., Yu, C., Wang, X., Fu, H., Yu, L., Dronova, I., Hui, F., Cheng, X., Shi, X., Xiao, F., Liu, Q., and Song, L.: Stable classification with limited sample: transferring a 30-m resolution sample set collected in 2015 to mapping 10-m resolution global land cover in 2017, Sci. Bull., 64, 370–373, https://doi.org/10.1016/j.scib.2019.03.002, 2019.
Grell, G. A. and Dévényi, D.: A generalized approach to parameterizing convection combining ensemble and data assimilation techniques, Geophys. Res. Lett., 29, 38-31–38-34, https://doi.org/10.1029/2002gl015311, 2002.
Grell, G. A., Peckham, S. E., Schmitz, R., McKeen, S. A., Frost, G., Skamarock, W. C., and Eder, B.: Fully coupled “online” chemistry within the WRF model, Atmos. Environ., 39, 6957–6975, https://doi.org/10.1016/j.atmosenv.2005.04.027, 2005.
Guenther, A., Karl, T., Harley, P., Wiedinmyer, C., Palmer, P. I., and Geron, C.: Estimates of global terrestrial isoprene emissions using MEGAN (Model of Emissions of Gases and Aerosols from Nature), Atmos. Chem. Phys., 6, 3181–3210, https://doi.org/10.5194/acp-6-3181-2006, 2006.
Hong, S. Y., Noh, Y., and Dudhia, J.: A new vertical diffusion package with an explicit treatment of entrainment processes, Mon. Weather Rev., 134, 2318–2341, 2006.
Hu, J., Li, Y., Zhao, T., Liu, J., Hu, X.-M., Liu, D., Jiang, Y., Xu, J., and Chang, L.: An important mechanism of regional O3 transport for summer smog over the Yangtze River Delta in eastern China, Atmos. Chem. Phys., 18, 16239–16251, https://doi.org/10.5194/acp-18-16239-2018, 2018.
Jacob, D. J. and Winner, D. A.: Effect of climate change on air quality, Atmos. Environ., 43, 51–63, https://doi.org/10.1016/j.atmosenv.2008.09.051, 2009.
Jerrett, M., Burnett, R. T., Pope, C. A., Ito, K., Thurston, G., Krewski, D., Shi, Y. L., Calle, E., and Thun, M.: Long-Term Ozone Exposure and Mortality, New Engl. J. Med., 360, 1085–1095, 2009.
Jiang, X., Wiedinmyer, C., Chen, F., Yang, Z.-L., and Lo, J. C.-F.: Predicted impacts of climate and land use change on surface ozone in the Houston, Texas, area, J. Geophys. Res., 113, D20312, https://doi.org/10.1029/2008jd009820, 2008.
Jimenez, P. A. and Dudhia, J.: Improving the Representation of Resolved and Unresolved Topographic Effects on Surface Wind in the WRF Model, J. Appl. Meteorol. Clim., 51, 300–316, 2012.
Kim, H.-J. and Wang, B.: Sensitivity of the WRF model simulation of the East Asian summer monsoon in 1993 to shortwave radiation schemes and ozone absorption, Asia-Pac. J. Atmos. Sci., 47, 167–180, https://doi.org/10.1007/s13143-011-0006-y, 2011.
Lennartson, G. J. and Schwartz, M. D.: The lake breeze-ground-level ozone connection in eastern Wisconsin: A climatological perspective, Int. J. Climatol., 22, 1347–1364, 2002.
Li, K., Jacob, D. J., Shen, L., Lu, X., De Smedt, I., and Liao, H.: Increases in surface ozone pollution in China from 2013 to 2019: anthropogenic and meteorological influences, Atmos. Chem. Phys., 20, 11423–11433, https://doi.org/10.5194/acp-20-11423-2020, 2020.
Li, M., Song, Y., Huang, X., Li, J., Mao, Y., Zhu, T., Cai, X., and Liu, B.: Improving mesoscale modeling using satellite-derived land surface parameters in the Pearl River Delta region, China, J. Geophys. Res.-Atmos., 119, 6325–6346, https://doi.org/10.1002/2014jd021871, 2014.
Li, M., Wang, T., Xie, M., Zhuang, B., Li, S., Han, Y., Song, Y., and Cheng, N.: Improved meteorology and ozone air quality simulations using MODIS land surface parameters in the Yangtze River Delta urban cluster, China, J. Geophys. Res.-Atmos., 122, 3116–3140, https://doi.org/10.1002/2016jd026182, 2017a.
Li, M., Liu, H., Geng, G., Hong, C., Liu, F., Song, Y., Tong, D., Zheng, B., Cui, H., Man, H., Zhang, Q., and He, K.: Anthropogenic emission inventories in China: a review, Nat. Sci. Rev., 4, 834–866, https://doi.org/10.1093/nsr/nwx150, 2017b (data available at: http://meicmodel.org/, last access: 18 January 2022).
Li, Y., Zhang, J., Sailor, D. J., and Ban-Weiss, G. A.: Effects of urbanization on regional meteorology and air quality in Southern California, Atmos. Chem. Phys., 19, 4439–4457, https://doi.org/10.5194/acp-19-4439-2019, 2019.
Liao, Z., Gao, M., Sun, J., and Fan, S.: The impact of synoptic circulation on air quality and pollution-related human health in the Yangtze River Delta region, Sci. Total Environ., 607–608, 838–846, https://doi.org/10.1016/j.scitotenv.2017.07.031, 2017.
Lin, C. H., Lai, C. H., Wu, Y. L., Lin, P. H., and Lai, H. C.: Impact of sea breeze air masses laden with ozone on inland surface ozone concentrations: A case study of the northern coast of Taiwan, J. Geophys. Res.-Atmos., 112, D14309, https://doi.org/10.1029/2006jd008123, 2007.
Loveland, T. R., Reed, B. C., Brown, J. F., Ohlen, D. O., Zhu, Z., Yang, L., and Merchant, J. W.: Development of a global land cover characteristics database and IGBP DISCover from 1 km AVHRR data, Int. J. Remote Sens., 21, 1303–1330, https://doi.org/10.1080/014311600210191, 2000.
Lu, X., Hong, J., Zhang, L., Cooper, O. R., Schultz, M. G., Xu, X., Wang, T., Gao, M., Zhao, Y., and Zhang, Y.: Severe Surface Ozone Pollution in China: A Global Perspective, Environ. Sci. Tech. Let., 5, 487–494, https://doi.org/10.1021/acs.estlett.8b00366, 2018.
Mavrakou, T., Philippopoulos, K., and Deligiorgi, D.: The impact of sea breeze under different synoptic patterns on air pollution within Athens basin, Sci. Total Environ., 433, 31–43, 2012.
Menberg, K., Bayer, P., Zosseder, K., Rumohr, S., and Blum, P.: Subsurface urban heat islands in German cities, Sci. Total Environ., 442, 123–133, https://doi.org/10.1016/j.scitotenv.2012.10.043, 2013.
Miao, Y., Hu, X.-M., Liu, S., Qian, T., Xue, M., Zheng, Y., and Wang, S.: Seasonal variation of local atmospheric circulations and boundary layer structure in the Beijing-Tianjin-Hebei region and implications for air quality, J. Adv. Model. Earth Sy., 7, 1602–1626, https://doi.org/10.1002/2015ms000522, 2015.
Mills, G., Hayes, F., Simpson, D., Emberson, L., Norris, D., Harmens, H., and Buker, P.: Evidence of widespread effects of ozone on crops and (semi-)natural vegetation in Europe (1990–2006) in relation to AOT40-and flux-based risk maps, Glob. Change Biol., 17, 592–613, https://doi.org/10.1111/j.1365-2486.2010.02217.x, 2011.
Mlawer, E. J., Taubman, S. J., Brown, P. D., Iacono, M. J., and Clough, S. A.: Radiative transfer for inhomogeneous atmospheres: RRTM, a validated correlated-k model for the longwave, J. Geophys. Res.-Atmos., 102, 16663–16682, https://doi.org/10.1029/97jd00237, 1997.
National Centers for Environmental Prediction/National Weather Service/NOAA/U.S. Department of Commerce: NCEP FNL Operational Model Global Tropospheric Analyses, continuing from July 1999, Research Data Archive at the National Center for Atmospheric Research, Computational and Information Systems Laboratory, https://doi.org/10.5065/D6M043C6, 2000 (updated daily).
National Climatic Data Center: ftp://ftp.ncdc.noaa.gov/pub/data/noaa/isd-lite/ (last access: 18 January 2022), 2016.
National Environmental Monitoring Centre of China: https://quotsoft.net/air/ (last access: 18 January 2022), 2022.
Oke, T. R., Mills, G., Christen, A., and Voogt, J. A.: Urban Climates, Cambridge University Press, Cambridge, https://doi.org/10.1017/9781139016476, 2017.
Park, R. J., Hong, S. K., Kwon, H.-A., Kim, S., Guenther, A., Woo, J.-H., and Loughner, C. P.: An evaluation of ozone dry deposition simulations in East Asia, Atmos. Chem. Phys., 14, 7929–7940, https://doi.org/10.5194/acp-14-7929-2014, 2014.
Ryu, Y.-H., Baik, J.-J., and Lee, S.-H.: Effects of anthropogenic heat on ozone air quality in a megacity, Atmos. Environ., 80, 20–30, https://doi.org/10.1016/j.atmosenv.2013.07.053, 2013.
Sailor, D. J.: A review of methods for estimating anthropogenic heat and moisture emissions in the urban environment, Int. J. Climatol., 31, 189–199, https://doi.org/10.1002/joc.2106, 2011.
Sati, A. P. and Mohan, M.: The impact of urbanization during half a century on surface meteorology based on WRF model simulations over National Capital Region, India, Theor. Appl. Climatol., 134, 309–323, 2017.
Schell, B., Ackermann, I. J., Hass, H., Binkowski, F. S., and Ebel, A.: Modeling the formation of secondary organic aerosol within a comprehensive air quality model system, J. Geophys. Res.-Atmos., 106, 28275–28293, 2001.
Sills, D. M. L., Brook, J. R., Levy, I., Makar, P. A., Zhang, J., and Taylor, P. A.: Lake breezes in the southern Great Lakes region and their influence during BAQS-Met 2007, Atmos. Chem. Phys., 11, 7955–7973, https://doi.org/10.5194/acp-11-7955-2011, 2011.
Stockwell, W. R., Middleton, P., Chang, J. S., and Tang, X. Y.: The 2nd Generation Regional Acid Deposition Model Chemical Mechanism for Regional Air-Quality Modeling, J. Geophys. Res.-Atmos., 95, 16343–16367, 1990.
Wang, H., Wu, Q., Liu, H., Wang, Y., Cheng, H., Wang, R., Wang, L., Xiao, H., and Yang, X.: Sensitivity of biogenic volatile organic compound emissions to leaf area index and land cover in Beijing, Atmos. Chem. Phys., 18, 9583–9596, https://doi.org/10.5194/acp-18-9583-2018, 2018.
Wang, T., Xue, L., Brimblecombe, P., Lam, Y. F., Li, L., and Zhang, L.: Ozone pollution in China: A review of concentrations, meteorological influences, chemical precursors, and effects, Sci. Total Environ., 575, 1582–1596, https://doi.org/10.1016/j.scitotenv.2016.10.081, 2017.
Wang, X., Chen, F., Wu, Z., Zhang, M., Tewari, M., Guenther, A., and Wiedinmyer, C.: Impacts of weather conditions modified by urban expansion on surface ozone: Comparison between the Pearl River Delta and Yangtze River Delta regions, Adv. Atmos. Sci., 26, 962–972, https://doi.org/10.1007/s00376-009-8001-2, 2009.
Wang, Y., Gao, W., Wang, S., Song, T., Gong, Z., Ji, D., Wang, L., Liu, Z., Tang, G., Huo, Y., Tian, S., Li, J., Li, M., Yang, Y., Chu, B., Petäjä, T., Kerminen, V.-M., He, H., Hao, J., Kulmala, M., Wang, Y., and Zhang, Y.: Contrasting trends of PM2.5 and surface-ozone concentrations in China from 2013 to 2017, Nat. Sci. Rev., 7, 1331–1339, https://doi.org/10.1093/nsr/nwaa032, 2020.
Wentworth, G. R., Murphy, J. G., and Sills, D. M. L.: Impact of lake breezes on ozone and nitrogen oxides in the Greater Toronto Area, Atmos. Environ., 109, 52–60, https://doi.org/10.1016/j.atmosenv.2015.03.002, 2015.
Xie, M., Liao, J., Wang, T., Zhu, K., Zhuang, B., Han, Y., Li, M., and Li, S.: Modeling of the anthropogenic heat flux and its effect on regional meteorology and air quality over the Yangtze River Delta region, China, Atmos. Chem. Phys., 16, 6071–6089, https://doi.org/10.5194/acp-16-6071-2016, 2016a.
Xie, M., Zhu, K., Wang, T., Feng, W., Gao, D., Li, M., Li, S., Zhuang, B., Han, Y., Chen, P., and Liao, J.: Changes in regional meteorology induced by anthropogenic heat and their impacts on air quality in South China, Atmos. Chem. Phys., 16, 15011–15031, https://doi.org/10.5194/acp-16-15011-2016, 2016b.
Xie, M., Shu, L., Wang, T. J., Liu, Q., Gao, D., Li, S., Zhuang, B. L., Han, Y., Li, M. M., and Chen, P. L.: Natural emissions under future climate condition and their effects on surface ozone in the Yangtze River Delta region, China, Atmos. Environ., 150, 162–180, https://doi.org/10.1016/j.atmosenv.2016.11.053, 2017.
Xie, M., Zhu, K., Wang, T., Yang, H., Zhuang, B., Li, S., Li, M., Zhu, X., and Ouyang, Y.: Application of photochemical indicators to evaluate ozone nonlinear chemistry and pollution control countermeasure in China, Atmos. Environ., 99, 466–473, https://doi.org/10.1016/j.atmosenv.2014.10.013, 2014.
You, C., Fung, J. C. H., and Tse, W. P.: Response of the Sea Breeze to Urbanization in the Pearl River Delta Region, J. Appl. Meteorol. Clim., 58, 1449–1463, 2019.
Young, P. J., Archibald, A. T., Bowman, K. W., Lamarque, J.-F., Naik, V., Stevenson, D. S., Tilmes, S., Voulgarakis, A., Wild, O., Bergmann, D., Cameron-Smith, P., Cionni, I., Collins, W. J., Dalsøren, S. B., Doherty, R. M., Eyring, V., Faluvegi, G., Horowitz, L. W., Josse, B., Lee, Y. H., MacKenzie, I. A., Nagashima, T., Plummer, D. A., Righi, M., Rumbold, S. T., Skeie, R. B., Shindell, D. T., Strode, S. A., Sudo, K., Szopa, S., and Zeng, G.: Pre-industrial to end 21st century projections of tropospheric ozone from the Atmospheric Chemistry and Climate Model Intercomparison Project (ACCMIP), Atmos. Chem. Phys., 13, 2063–2090, https://doi.org/10.5194/acp-13-2063-2013, 2013.
Yu, M., Carmichael, G. R., Zhu, T., and Cheng, Y.: Sensitivity of predicted pollutant levels to urbanization in China, Atmos. Environ., 60, 544–554, https://doi.org/10.1016/j.atmosenv.2012.06.075, 2012.
Zhan, C., Xie, M., Huang, C., Liu, J., Wang, T., Xu, M., Ma, C., Yu, J., Jiao, Y., Li, M., Li, S., Zhuang, B., Zhao, M., and Nie, D.: Ozone affected by a succession of four landfall typhoons in the Yangtze River Delta, China: major processes and health impacts, Atmos. Chem. Phys., 20, 13781–13799, https://doi.org/10.5194/acp-20-13781-2020, 2020.
Zhan, C., Xie, M., Liu, J., Wang, T., Xu, M., Chen, B., Li, S., Zhuang, B., and Li, M.: Surface Ozone in the Yangtze River Delta, China: A Synthesis of Basic Features, Meteorological Driving Factors, and Health Impacts, J. Geophys. Res.-Atmos., 126, e2020JD033600, https://doi.org/10.1029/2020jd033600, 2021.
Zhan, C.-C., Xie, M., Fang, D.-x., Wang, T.-j., Wu, Z., Lu, H., Li, M.-m., Chen, P.-l., Zhuang, B.-l., Li, S., Zhang, Z.-q., Gao, D., Ren, J.-y., and Zhao, M.: Synoptic weather patterns and their impacts on regional particle pollution in the city cluster of the Sichuan Basin, China, Atmos. Environme, 208, 34–47, https://doi.org/10.1016/j.atmosenv.2019.03.033, 2019.
Zhang, N., Zhu, L., and Zhu, Y.: Urban heat island and boundary layer structures under hot weather synoptic conditions: A case study of Suzhou City, China, Adv. Atmos. Sci., 28, 855–865, https://doi.org/10.1007/s00376-010-0040-1, 2011.
Zhang, H., Wang, Y., Hu, J., Ying, Q., and Hu, X. M.: Relationships between meteorological parameters and criteria air pollutants in three megacities in China, Environ. Res., 140, 242–254, https://doi.org/10.1016/j.envres.2015.04.004, 2015.
Zheng, B., Tong, D., Li, M., Liu, F., Hong, C., Geng, G., Li, H., Li, X., Peng, L., Qi, J., Yan, L., Zhang, Y., Zhao, H., Zheng, Y., He, K., and Zhang, Q.: Trends in China's anthropogenic emissions since 2010 as the consequence of clean air actions, Atmos. Chem. Phys., 18, 14095–14111, https://doi.org/10.5194/acp-18-14095-2018, 2018 (data available at: http://meicmodel.org/, last access: 18 January 2022).
Zhu, B., Kang, H., Zhu, T., Su, J., Hou, X., and Gao, J.: Impact of Shanghai urban land surface forcing on downstream city ozone chemistry, J. Geophys. Res.-Atmos., 120, 4340–4351, https://doi.org/10.1002/2014jd022859, 2015.