the Creative Commons Attribution 4.0 License.
the Creative Commons Attribution 4.0 License.
 | 19 Oct 2022
Hygroscopicity and CCN potential of DMS-derived aerosol particles
Bernadette Rosati
Sini Isokääntä
Sigurd Christiansen
Mads Mørk Jensen
Shamjad P. Moosakutty
Robin Wollesen de Jonge
Andreas Massling
Marianne Glasius
Jonas Elm
Annele Virtanen
Dimethyl sulfide (DMS) is emitted by phytoplankton species in the oceans and constitutes the largest source of naturally emitted sulfur to the atmosphere. The climate impact of secondary particles, formed through the oxidation of DMS by hydroxyl radicals, is still elusive. This study investigates the hygroscopicity and cloud condensation nuclei activity of such particles and discusses the results in relation to their chemical composition. We show that mean hygroscopicity parameters, κ, during an experiment for particles of 80 nm in diameter range from 0.46 to 0.52 or higher, as measured at both sub- and supersaturated water vapour conditions. Ageing of the particles leads to an increase in κ from, for example, 0.50 to 0.58 over the course of 3 h (Exp. 7). Aerosol mass spectrometer measurements from this study indicate that this change most probably stems from a change in chemical composition leading to slightly higher fractions of ammonium sulfate compared to methanesulfonic acid (MSA) within the particles with ageing time. Lowering the temperature to 258 K increases κ slightly, particularly for small particles. These κ values are well comparable to previously reported model values for MSA or mixtures between MSA and ammonium sulfate. Particle nucleation and growth rates suggest a clear temperature dependence, with slower rates at cold temperatures. Quantum chemical calculations show that gas-phase MSA clusters are predominantly not hydrated, even at high humidity conditions, indicating that their gas-phase chemistry should be independent of relative humidity.
- Article
(2539 KB) - Full-text XML
-
Supplement
(2900 KB) - BibTeX
- EndNote


Aerosols originating from marine environments have a large impact on climate and are present over large parts of the Earth, as oceans cover more than 70 % of the Earth's surface (Seinfeld and Pandis, 2016). Marine aerosols affect climate not only by scattering and absorbing solar radiation but also by acting as cloud condensation nuclei, CCN (e.g. IPCC, 2021). Marine aerosols consist of primary particles – mostly sea salt (Lewis and Schwartz, 2004) – with various organic compounds (e.g. Facchini et al., 2008; Prather et al., 2013) and secondary particles comprising non-sea-salt sulfate originating from dimethyl sulfide (DMS) oxidation. DMS is emitted to the atmosphere due to the decomposition of dimethylsulfoniopropionate, which, in turn, is produced by phytoplankton in the oceans (Andreae, 1990). In addition, exposure of corals to air has also been found to result in emission of significant amounts of DMS into the atmosphere (Hopkins et al., 2016). DMS is considered as one of the most abundant natural sulfur compounds in the atmosphere (e.g. Seinfeld and Pandis, 2016), and the global flux to the atmosphere is estimated to be ∼28 TgS each year (Carpenter et al., 2012). In the atmosphere, DMS reacts primarily with hydroxyl radicals (OH) by either addition or hydrogen abstraction, where the relative importance of these two pathways has been shown to be sensitive to the prevalent temperature (Albu et al., 2006; Barnes et al., 2006). This reaction finally leads to compounds such as sulfuric acid (H2SO4, SA) and methanesulfonic acid (CH3SO3H, MSA), often found in the particle phase (Barnes et al., 2006; Mardyukov and Schreiner, 2018), as well as hydroperoxymethyl thioformate (HOOCH2SCHO, HPMTF) (Veres et al., 2020; Ye et al., 2021).
Research on the importance of DMS for climate was stimulated by the so-called CLAW hypothesis (Charlson et al., 1987). The CLAW hypothesis proposes that higher ambient temperatures may increase the DMS production, which, in turn, could enhance the formation of sulfate aerosols capable of acting as CCN. Subsequently, this could lead to changes in cloud micro-physical properties, coverage, and lifetime and, therefore, the cooling of the atmosphere. Although this hypothesis has been widely disputed, it has resulted in substantial progress in understanding the role of DMS oxidation products in the marine atmosphere (e.g. Ayers and Cainey, 2007; Vallina and Simó, 2007; Smith, 2007; Quinn and Bates, 2011).
Hoffmann et al. (2016) investigated the multi-phase chemistry of DMS by means of advanced box models and presented a new parameterisation to include important aqueous-phase chemical processes. They showed that the atmospheric conversion of DMS into MSA is highly underestimated if the aqueous-phase chemistry of DMS is not considered. Their revised set of oxidation mechanisms was essential to explain MSA ratios found in atmospheric aerosols. Recently, the secondary aerosol formation from DMS oxidation by hydroxyl radicals was studied in smog chamber experiments accompanied by kinetic multi-layer modelling (Rosati et al., 2021a; Wollesen de Jonge et al., 2021). It was observed that the secondary aerosol particle mass production from DMS oxidation was lower in experiments at humid conditions (relative humidity >50 %) compared to dry ones (relative humidity <12 %) for otherwise similar conditions of temperature, DMS, and oxidant levels. In both cases the formed aerosol particles were found to consist mostly of MSA. Modelling and experimental data could be reconciled by including the newest parameterisations for DMS oxidation, extended by revised and complete multi-phase DMS oxidation mechanisms (Wollesen de Jonge et al., 2021).
Despite the significant contribution of DMS to atmospheric aerosols, knowledge about key properties – especially concerning the hygroscopicity and CCN activity of DMS-derived aerosols – is sparse. Hygroscopicity, which describes the ability of a particle to take up water at subsaturated water vapour conditions, is one key aspect of the climatic effects of aerosols, and it is predominately determined by the chemical composition of the particles. The CCN activity describes the potential of aerosol particles to be activated into cloud droplets at supersaturated water vapour conditions, and it is known to depend on particle size and chemical composition (IPCC, 2021; Seinfeld and Pandis, 2016). The hygroscopicity (e.g. Berg et al., 1998; Nilsson et al., 2001; Lewis and Schwartz, 2004; Swietlicki et al., 2008; Modini et al., 2010; Fuentes et al., 2011) and ability to serve as CCN (e.g. Covert et al., 1998; Ovadnevaite et al., 2011; King et al., 2012; Prather et al., 2013; Collins et al., 2013, 2016; Nguyen et al., 2017; Fossum et al., 2018; Rosati et al., 2021b) of marine aerosols and, in particular, sea spray aerosols have been studied intensively. Few studies have addressed the water uptake behaviour of secondary DMS-derived aerosols. Methanesulfonate (MSA) particles were scrutinised in a few studies: Johnson et al. (2004) reported experimentally derived hygroscopic growth factors (GF) for MSA at high humidity conditions, obtaining GF (90 %) = 1.57 for particles with a dry diameter of 100 nm; Tang et al. (2019) investigated various particulate methanesulfonates and obtained hygroscopicity parameters in the range of 0.37–0.47 based on CCN activity measurements (diameter: 40–60 nm), finding calcium methanesulfonate as the least and potassium and sodium methanesulfonate as the most hygroscopic compounds. The water cycle of sodium methanesulfonate, among others, has also been studied with an electrodynamic balance, finding that particles deliquesce (i.e. dissolve completely) at RH = 65.2 %–68.9 % and exhibit a GF (90 %) = 1.80 (Peng and Chan, 2001). Fossum et al. (2018) included the methanesulfonate anion to the list of ions considered in the Aerosol Inorganic–Organic Mixtures Functional groups Activity Coefficients (AIOMFAC) model (Zuend et al., 2008, 2011) to predict the CCN activity of methanesulfonate particles, including MSA, sodium, and ammonium methanesulfonate. Their calculations suggest that MSA and sodium methanesulfonate activate at similar critical supersaturations, while higher supersaturations are needed to activate ammonium methanesulfonate particles of the same size.
To our knowledge, the hygroscopicity and CCN activity of complex aerosols formed in the oxidation of DMS have not been addressed before. Therefore, the aim of this study is to investigate comprehensively the hygroscopic growth and CCN activity of DMS-derived aerosols generated in an atmospheric simulation chamber and to discuss these properties in relation to the chemical composition of the aerosols. Additionally, we show the results of nucleation and the growth rates of new particles formed through the oxidation of DMS with OH radicals. The experiments were designed to mimic a realistic marine atmosphere by simulating different relevant humidity and temperature conditions. For completeness, we also include in this work results from five experiments already presented by Rosati et al. (2021a) and/or Wollesen de Jonge et al. (2021) but not previously discussed with respect to hygroscopicity and CCN activation potential. Our extensive measurement setup covers the formation rates of particles larger than 1.7 nm, the growth rates of 10–20 nm particles, and the water uptake of particles from 10–150 nm (dry size) and provides insight into the bulk chemical composition of the DMS-derived aerosols. Experiments were additionally complemented by quantum chemical modelling of MSA clusters.
2.1 Theory
2.1.1 Nucleation rate calculations
Particle nucleation rates were obtained using the method described in Tomicic et al. (2018). By measuring the concentration of particles with diameters exceeding a cut-off diameter of 1.7 nm (N1.7), the nucleation rate J1.7 is defined as
where k denotes the rate of particle wall loss and t the time after the initiation of new particle formation. The cut-off diameter of 1.7 nm was selected according to Kulmala et al. (2013), being described as the critical cluster size from where nucleation occurs; thus, J1.7 constitutes an approximation of the nucleation rate. J1.7 was obtained from the wall-loss-corrected particle number concentrations, calculating the gradient between 20 % and 80 % of the maximum particle number concentration.
2.1.2 Water uptake by atmospheric aerosols
The water uptake behaviour of aerosol particles at sub- and supersaturated conditions can be described by the Köhler equation:
where S is the water vapour saturation ratio, aw the water activity, σs the surface tension of the solution, R the ideal gas constant, T the absolute temperature, ρw the density of water, Mw the molecular mass of water, and D(RH) the diameter of a particle exposed to a certain relative humidity, RH.
At sub-saturated conditions of water vapour, the hygroscopic growth factor at a given relative humidity (GF(RH) is calculated as the ratio of the particle diameter at high RH (D(RH)) to the dry particle diameter (Ddry):
At supersaturated conditions of water vapour, the critical supersaturation (SScrit) needed for a specific particle size to be activated into a cloud droplet is in focus. This point is identified as the maximum of the Köhler curve (SS versus D(RH)).
To compare water uptake at sub- and supersaturated conditions, the hygroscopicity parameter κ, introduced by Petters and Kreidenweis (2007), can be used. The water activity term in Eq. (2) can then be described in terms of κ in the following way:
where Vs is the volume of the dry particle and Vw the volume of the water in the droplet. By combining Eqs. (2), (3) and (4), the semi-empirical κ-Köhler equation can be obtained:
For a given supersaturation (or RH for the subsaturated case), a κGF and can be calculated.
2.2 Experimental procedure
Experiments were carried out at the Aarhus University Research on Aerosol (AURA) atmospheric simulation chamber (Kristensen et al., 2017). In short, the facility consists of a 5 m3 Teflon bag situated inside a temperature-controlled room, allowing experiments to be performed in the temperature range of 257–299 K. The chamber is equipped with 24 UV lamps (wavelengths: 300–400 nm) located at the top and bottom of the bag. In high humidity experiments, a custom-built humidifier was used to increase the relative humidity in the chamber to RH = 70 %. H2O2 (30 % in H2O, Merck, 1.07209.0250) was evaporated from a heated round-bottom flask (at 403 K) and flushed into the chamber using heated N2 (333–343 K, 10 L min−1). By photolysing H2O2, OH radicals were produced. The OH radical concentrations in the experiments are estimated to be in the range of typical tropospheric concentrations (4.64–5.71×10⁶ molec. cm−3; Seinfeld and Pandis, 2016) based on supplementary experiments investigating the decay of 1-butanol in the bag (Rosati et al., 2021a, b; Wollesen de Jonge et al., 2021). Either 200 or 400 ppb of DMS (Sigma Aldrich, anhydrous ≥99.0 %, 274380) were injected into the chamber by evaporating a known amount and guiding it into the chamber using 10 L min−1 of N2 gas heated to 333 K. The sequential order of the procedure was: (1) setting the desired chamber temperature, (2) filling the chamber with purified air (active carbon, HEPA filter, and zero-air generator (Aadco Model 737-14)), (3) injecting humidified air to reach the desired RH, (4) injecting H2O2, (5) switching the UV lights on, and (6) injecting DMS. The injection of DMS denotes the “time-0” in the experiments. Ammonia concentrations during the experiments are estimated to be between 1–10 ppb based on data from Tange (56.352222∘ N, 9.5875∘ W; ∼50 km from Aarhus; http://ebas.nilu.no/, last access: 17 May 2022). Table 1 presents an overview of the experimental conditions. All instruments were operated at the laboratory temperature of 22 ∘C outside the AURA chamber. To limit evaporation in tubing en route to the particle size (SMPS) and chemical composition measurement (AMS), the tubing was insulated. Particle size distributions and chemical composition for Exp. 5 and 9 were already presented in Wollesen de Jonge et al. (2021). This work focuses on the water uptake of the studied aerosol particles; thus, Exp. 1, 5, 6, 7, and 9 are presented in terms of the hygroscopicity and CCN activity, which were not addressed in any of the previous studies (Rosati et al., 2021a; Wollesen de Jonge et al., 2021).
Rosati et al. (2021a)Wollesen de Jonge et al. (2021)Rosati et al. (2021a)Rosati et al. (2021a)Wollesen de Jonge et al. (2021)Table 1Experimental conditions. Tch and RHch denote the mean measured temperature and RH together with their standard deviations (1 SD) in the chamber. The DMS concentrations indicate the measured concentrations after injection, except in Exp. 3, 6, and 7 – marked with an asterisk – where theoretical values are given based on the liquid injected into the chamber, as the PTR-ToF-MS was not available. Additionally, NOx concentration ranges, H2O2 mixing ratios, and particle growth rates (GR) obtained for the size range 10–20 nm are listed. Lower H2O2 mixing ratios correspond to injections of 418 µL, while higher ones correspond to injections of 1500 µL. See also Rosati et al. (2021a) for additional information regarding Exp. 1, 6, and 7 and Wollesen de Jonge et al. (2021) for experiments 5 and 9. The last column specifies if any data of these experiments were previously presented.
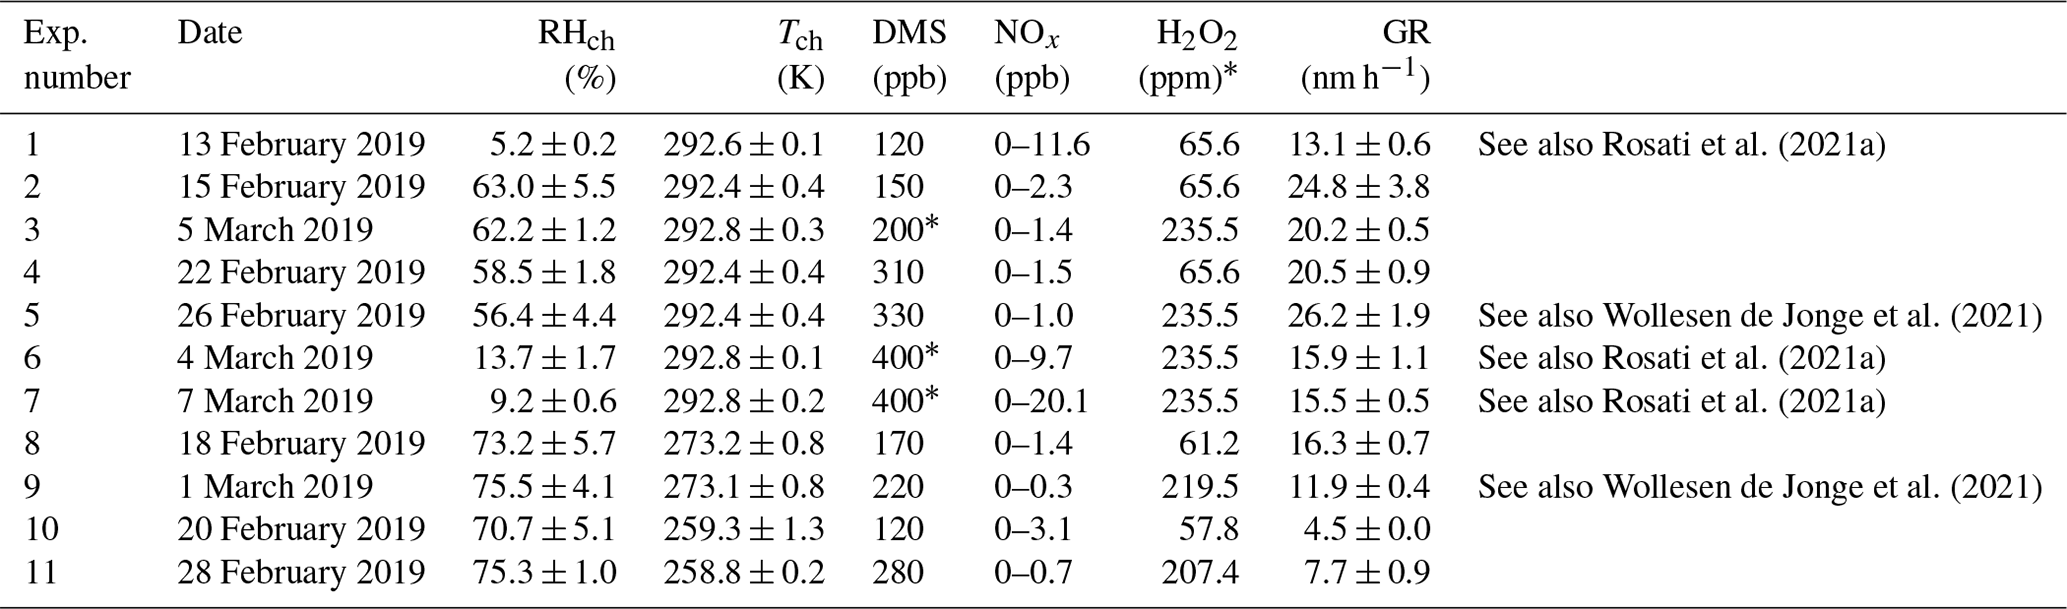
∗ Mixing ratios calculated assuming a smog chamber volume of 5 m3 and a density of the H2O2 solution (30 % in H2O) of 1.11 g mL−1.
2.3 Instrumentation and analysis
2.3.1 Stationary instrumentation
Nitrogen oxides (NOx) and ozone (O3) levels were continuously measured with a chemiluminescent monitor (AC32M, Environnement SA) and a UV absorption ozone analyser (O342 Module, Environment S.A), respectively. The temperature (T) and RH were monitored in the centre of the bag (HC02-04 sensor; Rotronic AG, Switzerland).
2.3.2 Volatile organic compounds
During Exp. 1, 2, 4, 5, and 8–11, a proton transfer reaction time-of-flight mass spectrometer (PTR-ToF-MS 4000, Ionicon Analytik, Innsbruck, Austria; e.g. Graus et al., 2010; Cappellin et al., 2012; Sekimoto et al., 2017) was employed to continuously monitor DMS concentrations. The instrument is based on a soft-ionisation technique using hydronium ions (H3O+) to ionise gas-phase compounds with proton affinities equal to or greater than that of water, which is the case for most volatile organic compounds (VOC). After the reaction with the primary ion occurs in the drift tube, the ionised compounds are detected in the ToF-MS. The PTR-ToF-MS was run with drift tube conditions of 650 V, 80 ∘C, and 2.4 mbar and, thus, an E/N number of 143 Townsend. The instrument was connected to the chamber via a 2 m long Teflon tube, wrapped in heating tape set to 60 ∘C, that was connected to the heated inlet of the instrument (temperature set to 80 ∘C). Additionally, the instrument flow rate was increased by adding a sheath flow of 200 mL min−1 to reduce sampling losses.
Data analysis was performed using the PTR-MS Viewer 3 (IONICON). Prior to the measurement campaign, a transmission calibration was carried out based on specific reaction rate constants and mass discrimination factors, as described elsewhere (Taipale et al., 2008; Liu et al., 2018).
2.3.3 Particle number concentration
An Airmodus A11 nano Condensation Nucleus Counter (nCNC, Airmodus), consisting of a particle size magnifier (PSM, Airmodus A10) and a condensation particle counter (CPC, Airmodus A20), was used to measure particles above 1.7 nm in diameter during Exp. 5, 9, and 11. A thorough description of the instrument is given elsewhere (Vanhanen et al., 2011). In short, the PSM was operated with diethylene glycol as working fluid. Supersaturated diethylene glycol leads to growth of the smallest (approximately 1 nm) particles by condensing the working fluid onto them. When the particles reach sizes of approximately 90 nm, they are guided to a condensation particle counter (using butanol as working fluid) and optically detected therein. The PSM was operated in fixed mode, counting all particles above the selected 1.7 nm threshold. The saturator flow rate was kept at 0.28 L min−1 in order to obtain the desired cut-off diameter.
2.3.4 Particle size distributions
A scanning mobility particle sizer (SMPS, TSI model 3938) was used to measure the dry particle number size distributions. The electrostatic classifier (EC, TSI model 3082) was either connected to a nano differential mobility analyser (DMA; TSI model 3085A) for sizes between 2 and 65 nm or a long DMA (TSI model 3081) for the size range 10–422 nm. Initially, the nano DMA was used and switched to the long DMA when particles grew out of the size range. The DMAs were connected to a nano water-based condensation particle counter (WCPC, TSI model 3788). The SMPS data analysis was performed with the Aerosol Instrument Manager (AIM) version 10.2.0.11, using the corrections for diffusion losses and multiple charges. A sheath to aerosol flow ratio of 10:1 was chosen (nano SMPS: 15:1.5 L min−1; long SMPS: 6:0.6 L min−1). A silica gel diffusion dryer was used to ensure a RH < 10 % at the inlet of the SMPS.
In order to retrieve particle properties, such as hygroscopicity, representative for the main particle mode, we used the size distributions measured with SMPS over time. A log-normal distribution was fitted to the SMPS data at every time step. The mean and standard deviation of the particle number size distribution were retrieved from the fit. A particle size was classified as representative for the major particle population in the chamber when it was within the fitted mean ±1 SD of the SMPS size distribution. All mean values presented in the manuscript refer to the time when particle properties were measured within the main growth mode. An example for the limits found for Exp. 5 is shown in Fig. S1 in the Supplement.
2.3.5 Water uptake at sub- and supersaturated conditions
The hygroscopic growth of 10–150 nm (dry size) particles was measured with two separate humidified tandem differential mobility analysers (HTDMAs) at a constant RH of 80 %. In brief, an HTDMA consists of two DMAs, a CPC, and a humidifier in between the two DMAs. The first DMA is used to select a monodisperse sample from the dry polydisperse particle population, which is then exposed to a selected RH. The size distribution of the humidified particles is then measured with the second DMA, followed by the CPC. In this way, the hygroscopic growth factor GF(RH) can be retrieved (Eq. 3). The hygroscopic growth of particles with Ddry=10, 15, and 20 nm particles was measured with a custom built “nano-HTDMA”, described in more detail in, for example, Keskinen et al. (2011) and Tikkanen et al. (2018). In short, the nano-HTDMA system consists of two nano-DMAs (TSI, model 3085) and a water-based CPC (TSI, model 3785) to count the particles. A silica gel diffusion drier was placed in front of the first DMA to make sure the particles entered the instrument with RH < 10 %. The DMAs were operated in an open-loop system, with a sample flow of 1 L min−1 and a sheath flow of 10 L min−1. To ensure stable conditions through the particle sizing, the sample flow and the sheath air inside the second DMA were humidified separately. The measured GFs were then corrected to the target RH of 80 %, assuming a constant hygroscopicity parameter κ within small deviation around the target humidity (±1.5 %), as in Tikkanen et al. (2018). Ammonium sulfate particles (Sigma Aldrich, purity ≥99.0 %) were used to calibrate the instrument for offsets in dry size selection. After taking into account the uncertainties of all devices influencing particle sizing, the uncertainty in the GFs can be estimated to be at maximum 2.5 %. The hygroscopic growth of particles with Ddry=30, 50, 80, 100, and 150 nm was measured with a commercially available HTDMA (Brechtel, Model 3002, Lopez-Yglesias et al., 2014), from now on termed “long-HTDMA”. A diffusion drier at the inlet ensured that particles entered the instrument at RH < 10 %. The aerosol flow of the first and second DMA were 0.8 and 0.5 L min−1, respectively, while the sheath flows were 5 L min−1 in both systems. The instrument was calibrated using ammonium sulfate (Sigma Aldrich, purity >99.95 %) particles. The overall uncertainty in GF (80 %) is estimated to be below 3 %, based on the combination of instrumental uncertainty (estimated to be 2 % sizing accuracy and 1 % RH uncertainty) and comparison to theoretical values calculated with Köhler theory (max. 2 % for the chosen size range).
The ability of particles to act as cloud condensation nuclei (CCN) was monitored with a continuous-flow streamwise thermal-gradient ccn chamber (CFSTGC, CCN-100 from Droplet Measurement Technologies; Roberts and Nenes, 2005). The CCN instrument was operated following the Scanning Mobility CCN Analysis (SMCA) described in Moore et al. (2010) to increase the temporal resolution. In short, we measured the critical dry diameter, Dp,c, of mobility size-selected aerosols. Aerosol-laden air from AURA was dried using diffusion dryers (RH < 10 %) before entering the electrostatic classifier. The classifier consisted of a long-DMA (TSI model 3081) and an aerosol neutraliser (X-ray source, TSI model 3087). A scanning voltage was applied (scan time 120 s up and 15 s down), and the mono-disperse outlet stream of the DMA was directed to both the CCNc and CPC (TSI model 3010). Time was synchronised daily. The CCN supersaturation was initially set high (∼1.4 %), since the newly formed aerosols were small in the beginning. As the particle size distribution grew to larger sizes, the supersaturation of the CCNc was decreased to ∼0.2 %, which is representative for supersaturations found in the marine environment (Ditas et al., 2012). Scan time alignment, multiple charge correction, quality control, and sigmoidal fitting of the activation curves (CCN/CN vs. Dp) were done using the “SMCAProcessor.xls” file, available at http://nenes.eas.gatech.edu/Experiments/SMCA.html (last access: 1 February 2019). The supersaturation of the CCN column was calibrated on 11 March 2019 using atomised ammonium sulfate (99.9999 % purity, 33 mg in 500 mL MilliQ). The measured Dp,c was used as input to the “Köhler curves” module of the Extended AIM Aerosol Thermodynamics Model to estimate the supersaturation (http://www.aim.env.uea.ac.uk/aim/kohler/kohler2.php, last access: 13 March 2019). A schematic of the SMCA calibration setup and a calibration curve performed with ammonium sulfate are shown in Figs. S2 and S3.
2.3.6 Chemical composition of particles
A high-resolution time-of-flight aerosol mass spectrometer (HR-ToF-AMS, Aerodyne Research Inc.) was used to measure the chemical composition of the particles in real time. The instrument setup is described in detail in Decarlo et al. (2006). The instrument was employed as described in Rosati et al. (2021a). HR-ToF-AMS data were processed in Igor Pro 8 by the data analysis software packages SQUIRREL (version 1.62) and PIKA (version 1.22). The PIKA default HR-ToF-AMS collection efficiency (CE) of 1 was used. The MSA calibration as presented in Rosati et al. (2021a) was applied to quantify particulate MSA. Unit-mass resolution efficient particle time-of-flight (ePToF) data were exported for the MSA tracer ion 79 and sulfate tracer ion 80. This sulfate tracer ion was selected, because MSA only contributes to the 80 signal. The relationship between vacuum aerodynamic diameters, as retrieved from ePToF data and mobility diameters for spherical particles, used in the measurement of the water uptake, can be calculated according to DeCarlo et al. (2004):
where dva is the vacuum aerodynamic diameter, dm is the electric mobility diameter, ρ0 is standard density (1 g cm−3), and ρp is the density of the particle. The particles were assumed to have no voids, which results in the density of the particle being equal to the density of the material. PToF time series were smoothed using a 15-point (i.e. 15 min) moving average to decrease short-term fluctuations.
2.4 Quantum chemical calculations
To obtain molecular-level insight into the hydration-free energy of MSA, we carried out highly accurate quantum chemical calculations of the MSA-hydrate cluster structures. These calculations will aid in elucidating to what extent the MSA molecules are hydrated in the gas phase.
2.4.1 Computational details
The Gaussian09 (Frisch et al., 2013) program was used to obtain the molecular cluster structures and to calculate the vibrational frequencies. The ωB97X-D (Chai and Head-Gordon, 2008) functional was employed, as it has been shown to exhibit low errors in the binding energies of atmospheric molecular clusters compared to higher level CCSD(T) calculations (Leverentz et al., 2013; Elm et al., 2013; Elm and Kristensen, 2017). The calculations were performed using the 6-31++G(d,p) basis set, which has shown good agreement with basis sets of significantly larger sizes (Elm and Mikkelsen, 2014; Myllys et al., 2016).
The ORCA program version 4.0.0 (Neese, 2012) was used to calculate the single point energy (i.e. the electronic energy of a molecule for a certain arrangement of the atoms in the molecule) of all the clusters using DLPNO-CCSD(T0) (Riplinger and Neese, 2013; Riplinger et al., 2013) with an aug-cc-pVTZ basis set. The aug-cc-pVTZ/C and aug-cc-pVTZ/JK auxiliary basis sets were used for density fitting and Coulomb or exchange fitting. We have recently demonstrated that this level of theory yields total and relative binding energy results in good agreement with higher level, explicitly correlated, coupled cluster calculations on a test set of 45 cluster structures (Schmitz and Elm, 2020) and sulfuric acid hydrates (Kildgaard et al., 2018a). All the thermochemical parameters have been calculated at 298.15 K and 1 atm.
2.4.2 Cluster structure sampling
We have recently reported the application of a systematic sampling technique to obtain the molecular structures of sulfuric acid–water clusters (Kildgaard et al., 2018a) and carboxylic acid–water clusters (Kildgaard et al., 2018b). Here, we utilise the same method to thoroughly sample the rich potential energy surface of the methanesulfonic acid (MSA)–water clusters. The following procedure was applied:
-
Water molecules are placed around all the exterior atoms of the cluster.
-
Generated conformers are optimised using the PM6 (Stewart, 2007) method.
-
Identical conformers were excluded based on energy and rotational temperature.
-
The Gibbs free energy is calculated at the ωB97X-D/6-31++G(d,p) level of theory.
-
All conformers below 3 kcal mol−1 are then used as input structures for the addition of the next water molecules (step 1).
This approach generates a massive amount of conformers (350, 1084, 2027, 6801, and 5542 for the respective hydrates) and will yield a qualified guess for the global minimum cluster structure.
3.1 Nucleation and growth rates at different temperatures
Figure 1a presents particle number concentrations and nucleation rates of particles larger than 1.7 nm in diameter at 258 K (in blue), 273 K (in orange), and 293 K (in red), measured during Exp. 5, 9, and 11, respectively. The highest particle number concentrations were recorded at 298 K and the lowest ones at 258 K. Nucleation rates increased with increasing temperature, e.g. from 68.7 cm−3 s−1 at 258 K to 426.3 cm−3 s−1 at 293 K. New particle formation was initiated at an earlier point in time at 293 K (immediately after DMS injection) compared to 258 K (approximately 10 min after DMS injection).
Figure 1b shows particle growth rates (GR) of particles with diameters between 10 and 20 nm, calculated using the maximum concentration method (Lehtinen and Kulmala, 2003; Kulmala et al., 2012). The overall GR range (4.5–26.2 nm h−1; see values in Table 1) fits well with ambient values measured in marine and coastal areas (1.8–20 nm h−1; Manninen et al., 2010; Yli-Juuti et al., 2011). Similar to the nucleation rates, GR increases with increasing temperature. The colour code in Fig. 1b denotes the RH during the experiments. Results at 293 K show that lower RH values lead to lower GR compared to experiments performed at high RH.
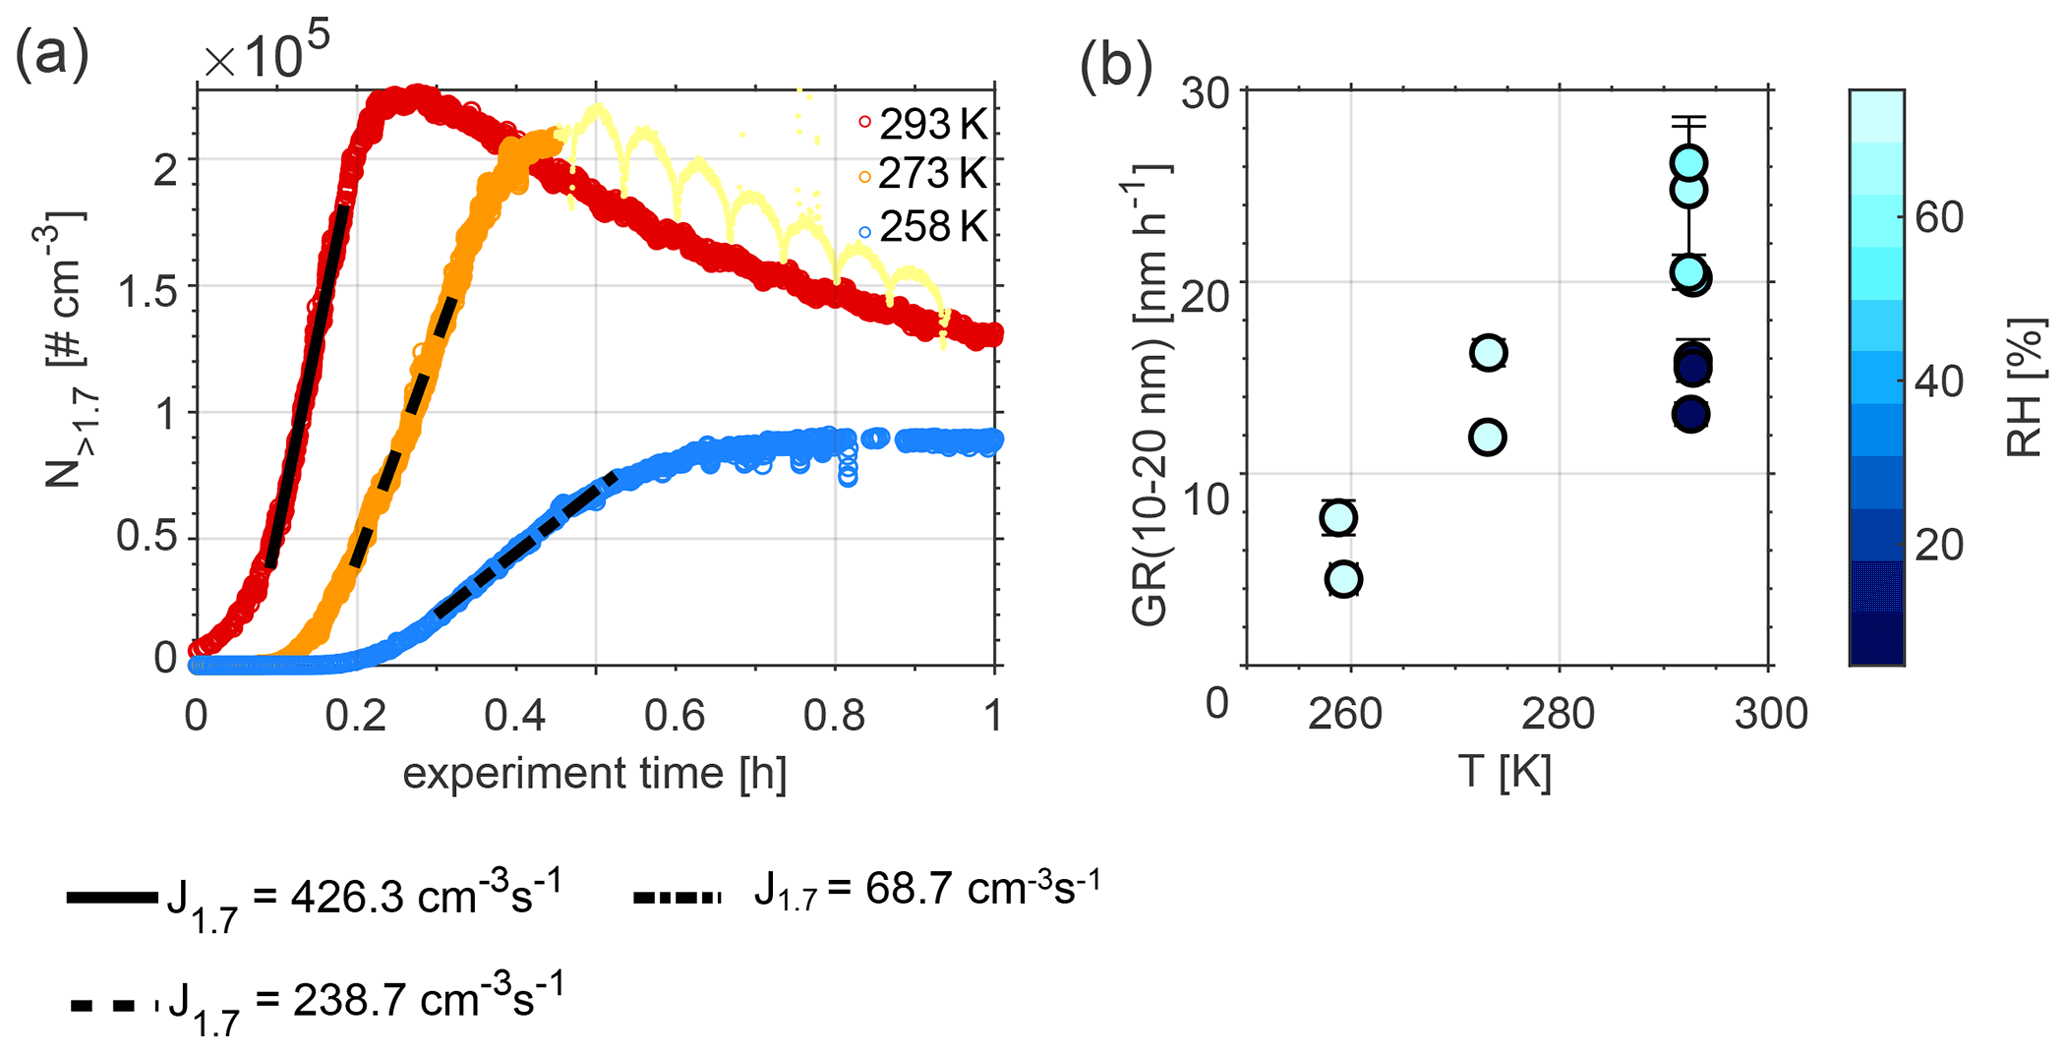
Figure 1(a) Nucleation rates (J) of particles larger than 1.7 nm during Exp. 5, 9, and 11, and (b) growth rates (GR) for the size range of 10–20 nm at three different temperatures during Exp. 1–11. The fluctuations seen at T=273 K (light yellow dots) are due to the fact that the PSM was set to measure in scanning mode during this period (Lehtipalo et al., 2014). These data were not used for the calculation of J1.7 and are only illustrated to show the reader that the maximum in number concentration had been reached.
The decrease of nucleation and growth rates with decreasing temperature is consistent with a lower observed loss rate of DMS at lower temperatures; see Fig. S4 and Table S1 in the Supplement, which illustrate an example for each of the temperatures investigated in this study and a comparison between dry and humid experiments (Exp. 1, 2, 8, and 10). Different temperature trends for the rate of the reaction of DMS with OH radicals have been reported in the literature (Albu et al., 2006; Barnes et al., 2006; Hoffmann et al., 2016). Our observed trend is in line with the predicted temperature dependence obtained with the Arrhenius expression used in the Master Chemical Mechanism version 3.3.1 (MCMv3.3.1) and Hoffmann et al. (2016), delineating slower reaction rates at colder temperatures. The decay of the concentration of DMS over time for similar experiments at 293 and 273 K, dry and humid conditions, was formerly presented in Rosati et al. (2021b) and Wollesen de Jonge et al. (2021). Wollesen de Jonge et al. (2021) found good agreement between measured and modelled decay rates using the ADCHAM box model.
Nucleation and growth rates are known to be inherently dependent on temperature and RH (Seinfeld and Pandis, 2016). Typically, at lower temperatures, both nucleation and growth rates increase as the Gibbs free energy barrier decreases. This has also been observed in laboratory experiments with homogeneous nucleation of sulfuric acid and water at temperatures between 207–299 K and RH between 11–58 % (Duplissy et al., 2016). Ambient measurements of nucleation and growth rates, however, show ambiguous trends probably related to different temperature-dependent processes occurring at the same time (Kerminen et al., 2018). A possible explanation for the decreasing nucleation and growth rates with decreasing temperatures seen in this study can be that the oxidation of DMS is slower at colder temperatures; thus, fewer volatile compounds are available for cluster formation, as they are formed more slowly. This is also supported by the above presented DMS decay trends illustrating slower decay rates with colder temperatures. The absolute water concentration could also have an effect on the observed trends in the nucleation rate, as the initial cluster formation in our chamber setup most likely consisted of relatively weakly bound sulfuric acid–methane sulfonic acid–ammonia clusters (Rosati et al., 2021a). Water has been shown to increase the nucleation rate if the initial cluster is weakly bound, such as for sulfuric acid–ammonia clusters (Henschel et al., 2014b, 2016). However, in our studies, the absolute concentration of water is lowest at colder temperatures.
OH concentrations in the chamber were obtained from the decay of 1-butanol due to reactions with OH radicals produced by photolysing H2O2; 1-butanol decay rates and resulting OH concentrations for experiments performed at the same temperature and humidity conditions as those used in the DMS experiments presented herein are illustrated in Fig. S5 and Table S2.
The OH concentrations found herein are in the range of tropospheric levels (e.g. 1–2×10⁶ molec. cm−3; Seinfeld and Pandis, 2016; 1.09×10⁶ molec. cm−3; Li et al., 2018).
3.2 Hygroscopicity, CCN activity, and chemical composition
3.2.1 Effect of atmospheric ageing at 293 K
Atmospheric ageing of DMS-derived secondary aerosols was simulated by prolonged exposure to OH radicals at different temperatures and RH. We first consider the water uptake at sub- and supersaturated water vapour conditions at 293 K for both dry and humid conditions. Figure 2 illustrates the water uptake behaviour in the form of κ values obtained from hygroscopic growth and CCN measurements overlaid on particle number size distributions during Exp. 5 (humid conditions) and Exp. 7 (dry conditions). In both cases, clear nucleation events are visible, with particles growing up to approximately 150 nm in diameter within the first 10 h. As mentioned in Rosati et al. (2021a), an additional growth mode is observed, and from Fig. 2, it seems to be more pronounced at dry compared to humid conditions (Fig. 2a vs. b).
κ values are only presented for times when the selected dry diameter was within the boundary chosen to represent the main growth mode (see description in Sect. 2.3.4). The colour code describes the magnitude of κ, where dark blue colours represent low values and light blue colours high values. Mean κ values during the main particle growth mode for 80 nm particles (dry size), as retrieved from long-HTDMA measurements in Exp. 5 and 7, were κ=0.52 ± 0.03 and κ=0.54 ± 0.03, respectively. These were calculated from GF (80 %) results of 1.42 ± 0.02 and 1.44 ± 0.02. κ values derived for other particle sizes are presented in Table 2, and the GF (80 %) results are presented in Table S3. In comparison, κ values from CCNc measurements for dry particles of approximately 80 nm yielded κ=0.50 ± 0.03 and κ=0.54 ± 0.06 for Exp. 5 and 7, respectively (all mean κ values from CCNc are presented in Table S4). Thus, for this size, mean κ values at sub- and supersaturated water vapour conditions are well comparable and agree within the standard variations of the measurements. Figure S6 shows the derived mean κ values as a function of all measured dry particle diameters for Exp. 5 and 7. There is no systematic trend in the variation of κ with particle diameter for κ values calculated from GFs, while an increase in κ with particle size can be seen for κ values calculated from CCNc data. Such a size trend can be expected from Köhler theory; for comparison, the κ value for ammonium sulfate varies from 0.51 to 0.63 over the particle size range 20–100 nm (calculated using UManSysprop at 293 K, Topping et al., 2016). Mean κ values during the main particle growth mode are consistent across instruments and supersaturations. Agreement between κ values derived for the same particle size from measurements at sub- and supersaturation is not necessarily expected, as shown by several earlier studies for organic and inorganic particles (e.g. Petters and Kreidenweis, 2007; Whitehead et al., 2014; Pajunoja et al., 2015; Zhao et al., 2016; Rastak et al., 2017; Rosati et al., 2020).
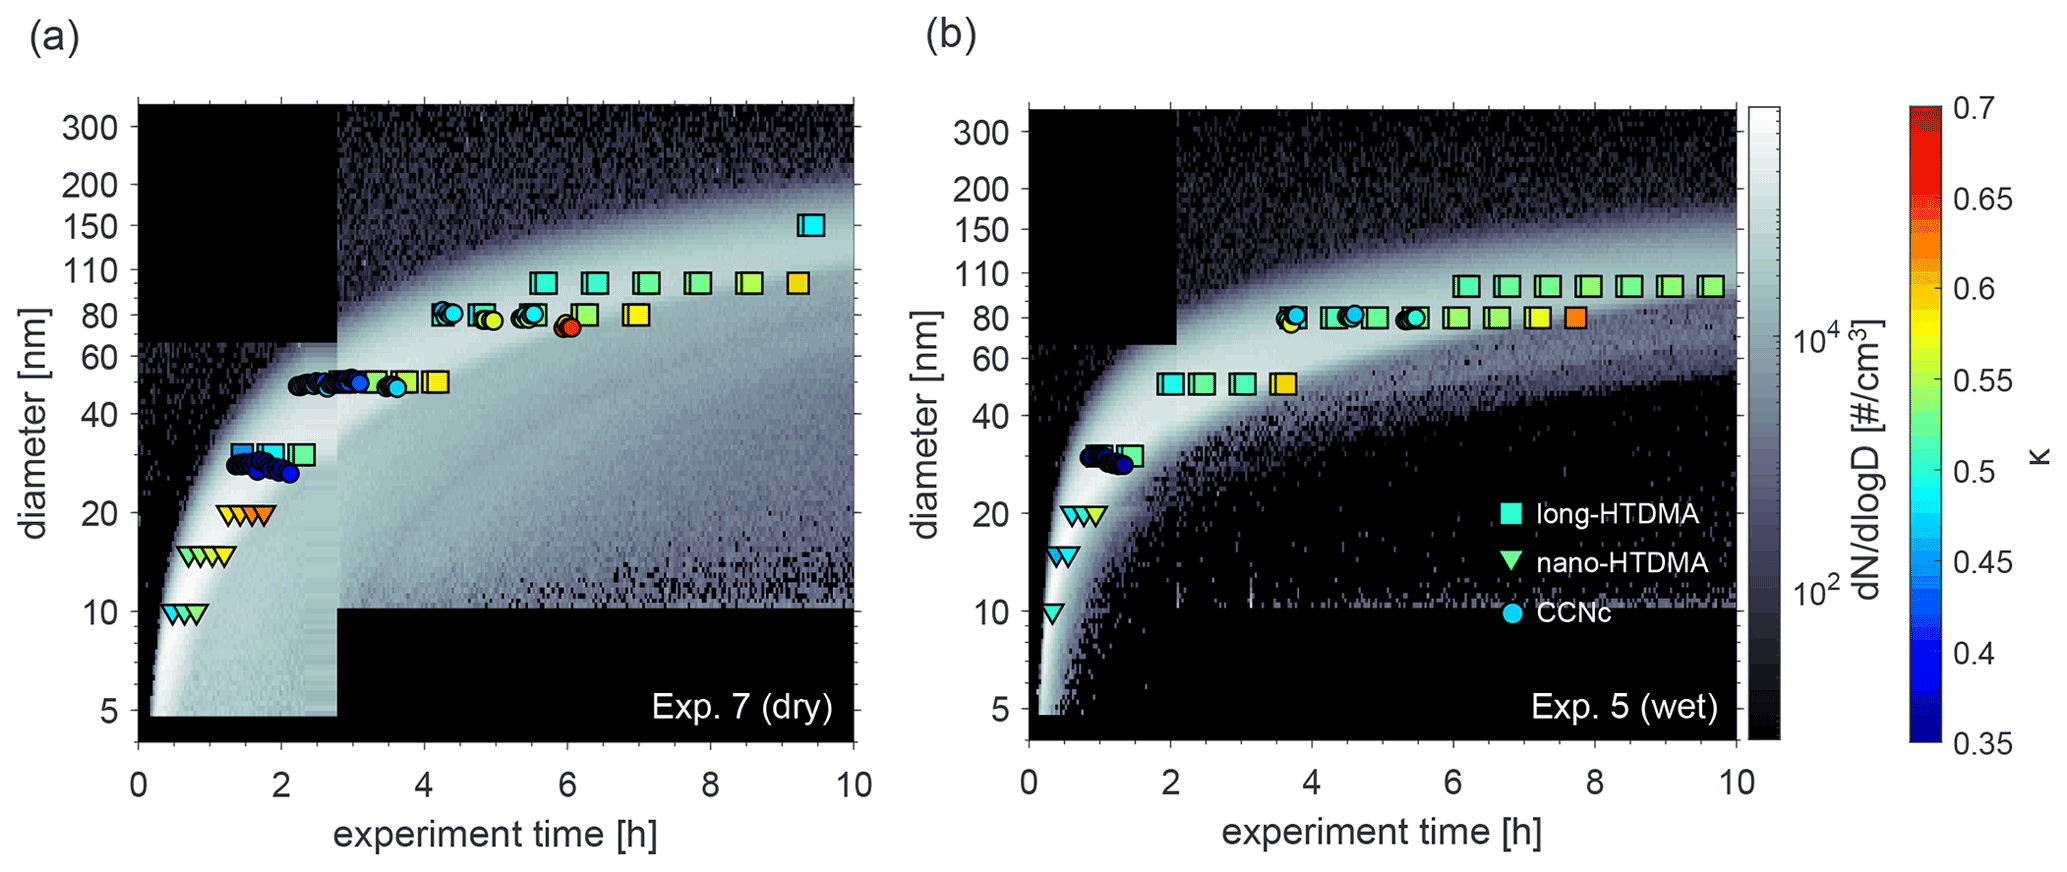
Figure 2κ values as obtained from nano- (triangles) and long-HTDMA (squares) and from CCNc (circle) measurements for different dry particle sizes. Particle number size distributions of the DMS-derived aerosol particles at dry and wet conditions are shown in the background. Results are from (a) Exp. 7 (dry) and (b) Exp. 5 (wet).
Following the evolution of κ for a certain size, in Fig. 2 it can be seen that the values increase over time, meaning that hygroscopicity increases with ageing by exposure to OH radicals and UV light, indicating slight changes in chemical composition. In Exp. 7, performed under dry conditions (Fig. 2a), dry 80 nm particles could first be measured approximately 4 h after the start of the experiment, showing κ values of 0.50, which increased to κ values of 0.58 at about 7 h after the start of the experiment. Similarly, in Exp. 5, performed under humid conditions (Fig. 2b), the κ value for dry 80 nm particles changed from 0.51 to 0.63 (measured at approximately 4 and 8 h after the start of the experiment). Similar trends were observed in Exp. 8 and 10, performed at different temperatures and shown in the Supplement.
To further investigate this change in hygroscopicity as a result of ageing, we extracted size-selected ePToF data from the HR-ToF-AMS. Figure 3 illustrates the temporal evolution of 79 and 80, representative for MSA and ammonium sulfate, respectively. Only data for particles with an aerodynamic diameter of approximately 126 nm are illustrated, as these correspond to particles with a mobility diameter of 80 nm, assuming that particles were spherical and composed of approximately 50 % MSA and 50 % ammonium sulfate, thus having a density of approximately 1.6 g cm−3 (density of MSA: 1.48 g cm−3, density of ammonium sulfate: 1.77 g cm−3; according to Sigma-Aldrich). This assumption is based on bulk chemical composition data from HR-ToF-AMS, presented in Fig. S7. Only results for Exp. 5 (wet conditions) and Exp. 6 (dry conditions) are shown, as the signal on the chosen marker ions was highest during these experiments; thus, best PToF data analysis could be performed. The black lines in Fig. 3 denote the ratio of 79 to 80, and the vertical grey, dashed lines depict the time interval when this selected size was present within the main particle growth mode. When performing a linear regression to the ratio of 79 to 80, when the ion signal was above 0.2 (threshold chosen to be less influenced by noise), a slow decrease is visible, indicating an increased fraction of ammonium sulfate in the particles with time (red solid lines in Fig. 3) under both dry and humid conditions. During this campaign, the HR-ToF-AMS was not set up in a way to resolve size-selected properties at low aerosol mass concentration, as only 30 s were spent on ePToF data acquisition for each 1 min data point. Thus, these results have to be treated with care, and further experiments targeting the size-selected chemical composition of secondary particles formed from the oxidation of DMS are needed to obtain a more detailed understanding of changes in the chemical composition of DMS-derived products.
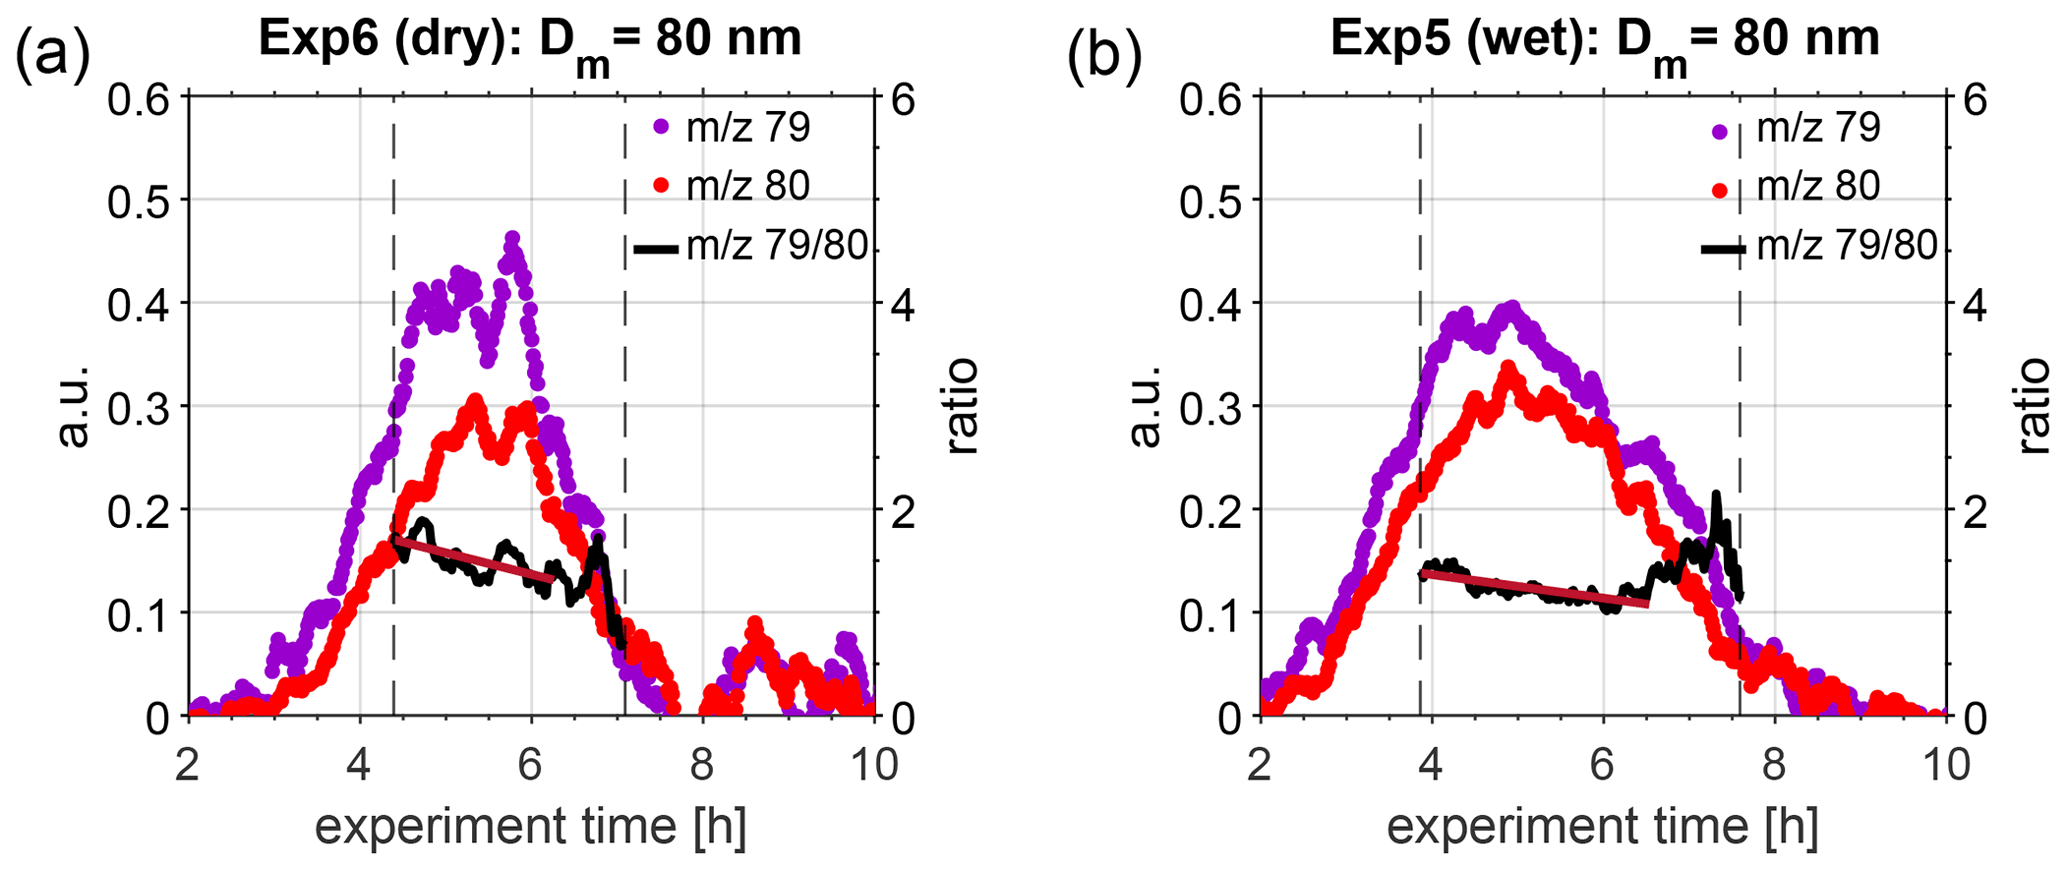
Figure 3Temporal evolution of 79 (violet dots) and 80 (red dots), representative for MSA and ammonium sulfate, respectively, as measured in the HR-ToF-AMS during (a) Exp. 6 (dry conditions, T=293 K) and (b) Exp. 5 (wet conditions, T=293 K). The black solid lines denote the ratio of 79 to 80, as calculated during the main particle growth mode in the chamber (represented by vertical dashed lines). A linear fit was calculated for the ratio during the time period where both ions had a signal higher than 0.2 (dark red line), indicating a linear decrease over this period.
Previous HTDMA measurements of pure MSA particles at 293 K yielded GF (90 %) = 1.57 for a dry particle size of 100 nm (Johnson et al., 2004), which translates to κ=0.36 and GF (80 %) = 1.33 (recalculated using κ-Köhler theory). Fossum et al. (2018) predicted the supersaturation needed to activate MSA particles at 293.15 K with dry sizes between 20 and 200 nm with the AIOMFAC model, finding a κ value of 0.55 for 80 nm particles (critical supersaturations presented in the Supplement of Fossum et al. (2018) and recalculated using κ-Köhler theory). Lower κ values of 0.40 for 80 nm particles were modelled for ammonium–MSA (Fossum et al., 2018). In comparison, κ values for 80 nm ammonium sulfate particles are 0.59 and 0.62, according to the UManSysProp thermodynamic model (Topping et al., 2016), for subsaturated (GF (80 nm, 80 %)) and supersaturated (80 nm dry size) conditions, respectively. Assuming particles are composed of 50 % MSA and 50 % ammonium sulfate, as indicated by the HTR-ToF-MS results in this study, mixed κ values can be retrieved using the modelled data of the single substances, yielding 0.57 and 0.59 for 80 nm particles using ammonium sulfate results at sub- and supersaturated conditions, respectively. Our mean κ results are considerably higher than those for pure MSA from HTDMA measurements, presented earlier by Johnson et al. (2004) and being closest to AIOMFAC κ values for MSA while being lower than the ammonium sulfate values from UManSysProp. The range of κ values measured within this study is consistent with the hygroscopicity of a mixture of MSA and ammonium sulfate. As the hygroscopicity of ammonium sulfate is larger than that of MSA, a change in chemical composition during ageing leading to a higher fraction of ammonium sulfate in the particles could be responsible for the measured increase in hygroscopicity over time.
3.2.2 Effect of lower temperatures
Experiments at 258, 273, and 293 K and high relative humidity were carried out to explore how the hygroscopicity and CCN activation potential are affected by the temperature during particle formation and subsequent ageing. Similar to the results at 293 K, the hygroscopicity of the particles formed at 258 and 273 K increases with ageing (see Figs. S8 and S9). Figure 4a illustrates mean GF (80 %) as measured by nano- and long-HTDMA, and Fig. 4b illustrates mean κ values as calculated from HTDMA and CCNc results for the three different temperatures. The mean values are calculated from the time period when a certain size was measured in the main growth mode, as described in Sect. 2.3.4. Only data for humid experiments are shown, i.e. Exp. 2–5 and 8–11. Table 2 shows mean κ values for each experiment (mean GF (80 %) values and mean κ values from the CCNc are presented in Table S4). When comparing results at 293 K in Fig. 4a, it is evident that GF (80 %) values are smaller for smaller sizes. This difference disappears when κ values are compared (spherical symbols), indicating that this difference originates from the Kelvin term that is more important for particles of approximately 15 nm in dry size compared to those of approximately 80 nm. GF (80 %) values in the long-HTDMA range seem comparable at all temperatures, while the nano-HTDMA shows a tendency for smaller GF (80 %) at 293 K compared to 258 K. When comparing HTDMA data in Fig. 4b, which illustrates κ values, this general trend of less hygroscopic particles at 293 K compared to 258 K is also visible. Figure 4b additionally illustrates κ values as derived from CCNc measurements (square symbols). Generally, the ranges of the CCNc results are more scattered, but they overlap with HTDMA results. The majority of the herein presented experimental κ values lie in the range of modelled values for MSA and ammonium–MSA, as found by Fossum et al. (2018) (theoretical values depicted in Fig. 4b); the experimental κ values at 258 K for small particles exceed the modelled MSA results and are more comparable with the theoretical κ values for ammonium sulfate.
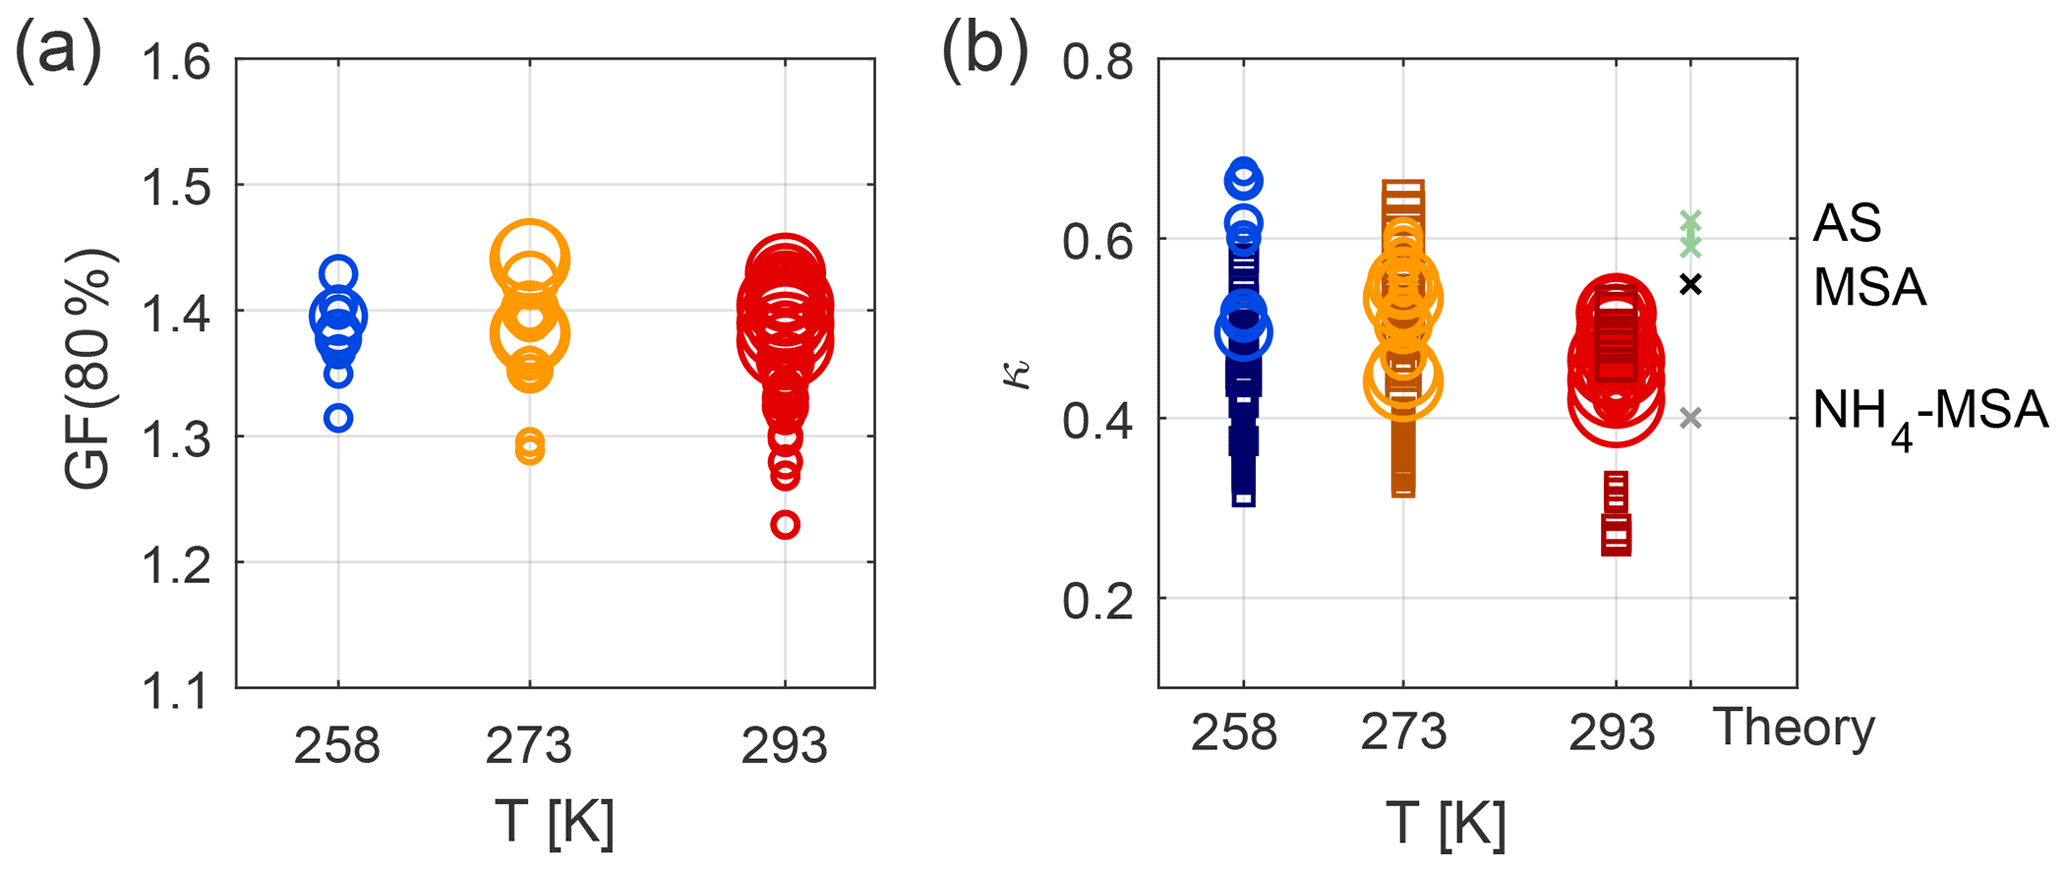
Figure 4Temperature dependence of water uptake: (a) GF (80 %), as measured from nano- and long-HTDMA (spheres), (b) κ values, as measured from nano- and long-HTDMA (spheres) and CCNc (squares). The size of the markers is related to the dry particle size selected, i.e. smaller markers describe results for smaller particles and vice versa. Results describe Exp. 2–5 and 8–11 at high humidity conditions. The theoretical κ values are taken from Fossum et al. (2018) for MSA and NH4MSA for 80 nm dry particles and from the UManSysProp model for ammonium sulfate (AS), as found for 80 nm dry particles, as recalculated from sub- and supersaturated water vapour conditions.
Table 2Mean κ values and their standard deviations (1 SD), as calculated from nano- and long-HTDMA.
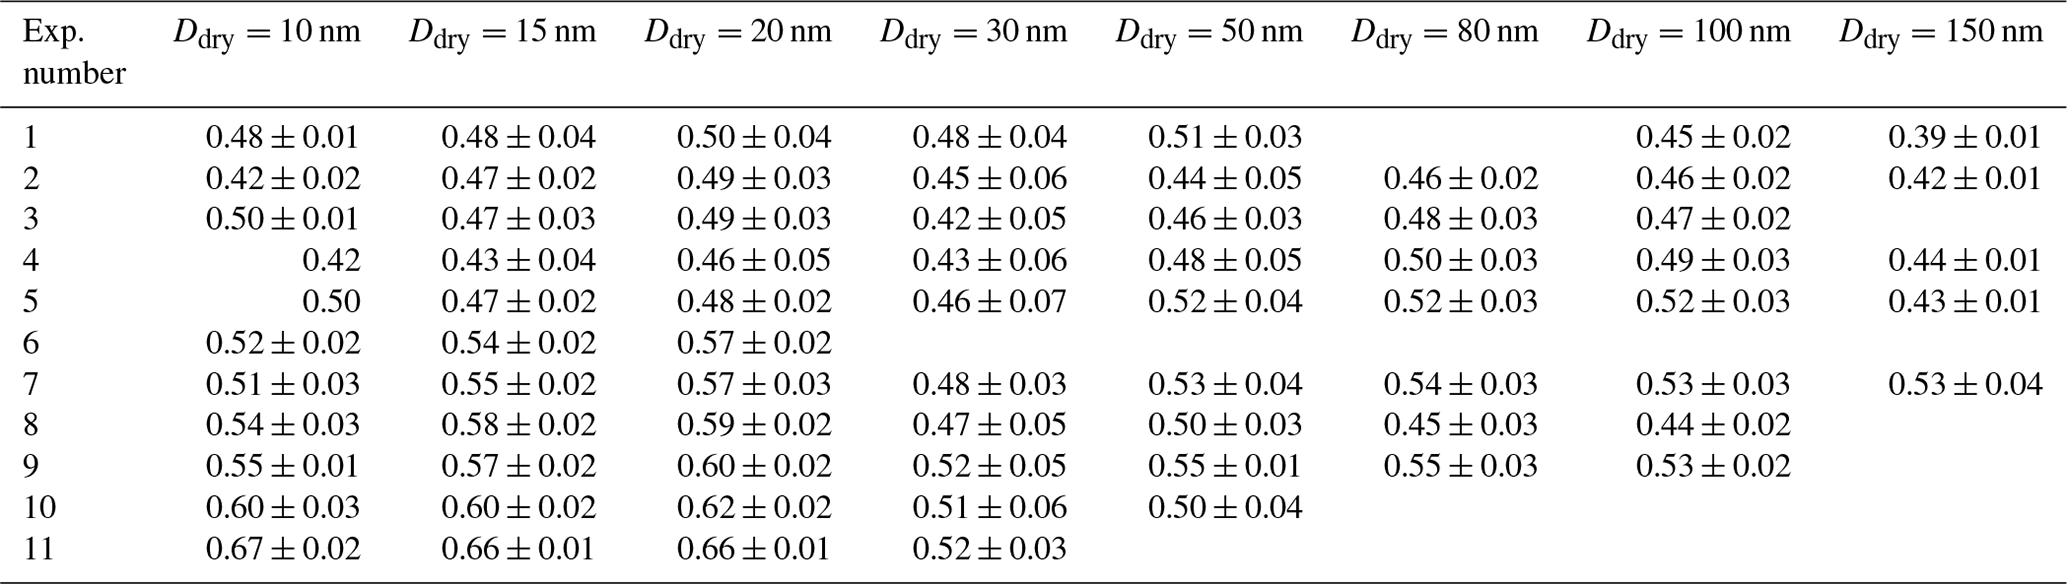
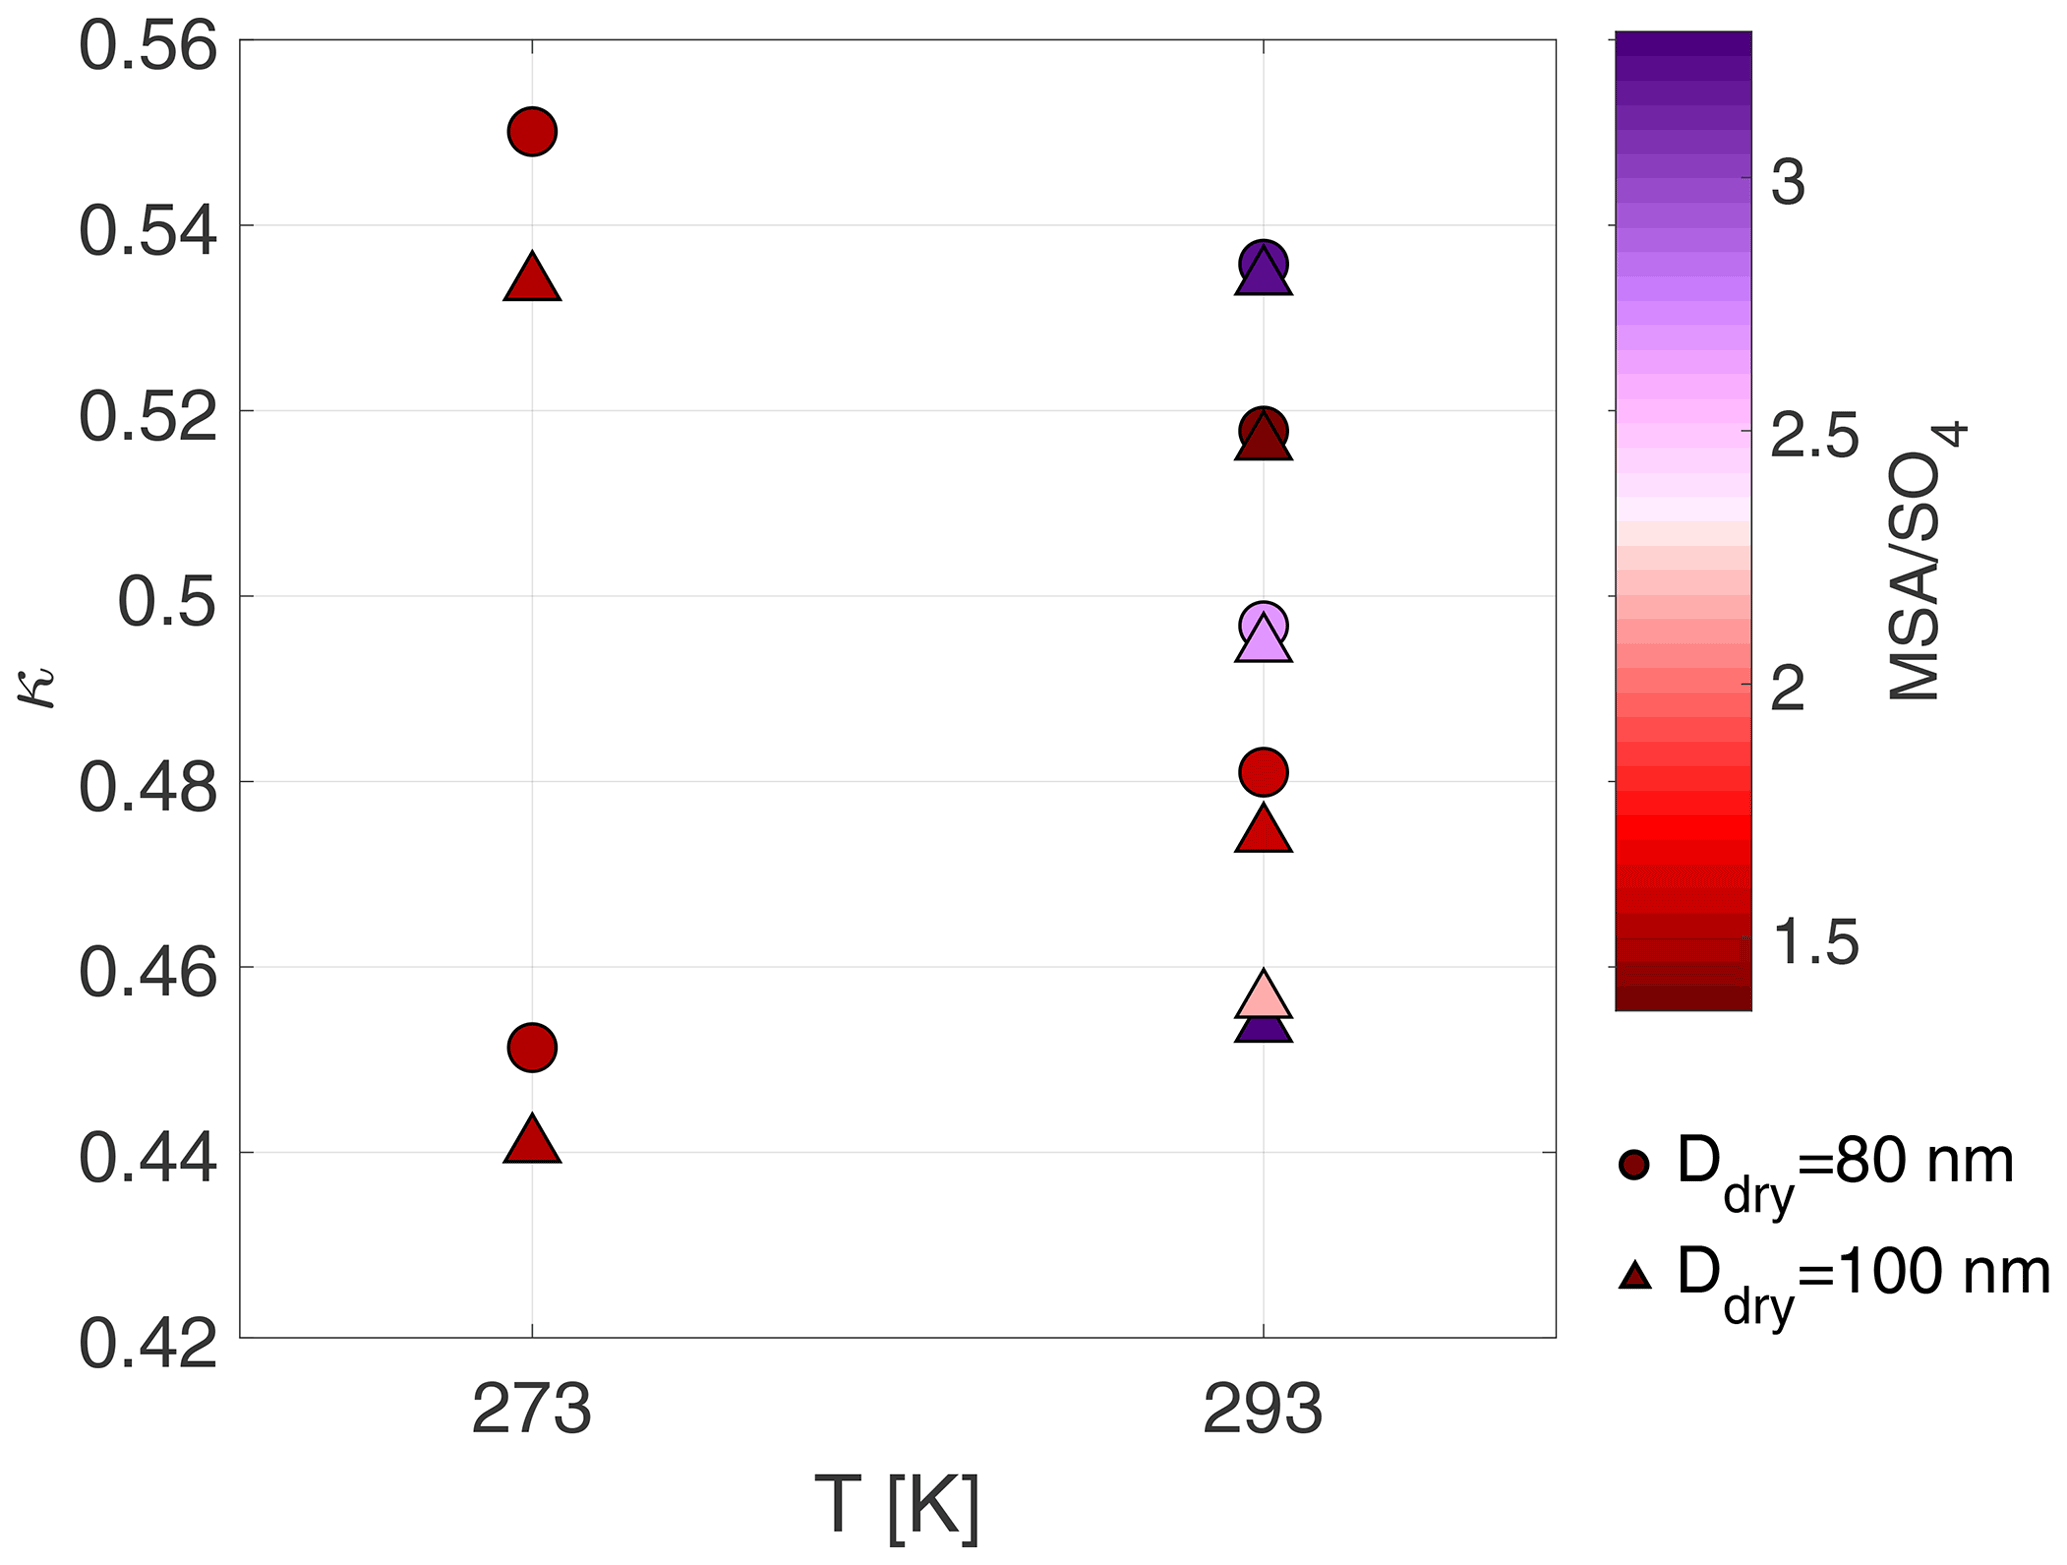
Figure 5Mean κ values at 273 and 293 K for particles with dry sizes of 80 and 100 nm. Colour scheme shows the average MSA to sulfate ratio during the time period when the specific dry size was measured. Exp. 1–9 are shown.
The relative contributions and absolute concentrations of organics, nitrate, sulfate, ammonia, chloride, and MSA are illustrated in Fig. S7 for experiments performed at 273 and 293 K. Absolute concentrations show that, in general, the aerosol mass loading was small and that the organic contribution was comparable during all experiments. As previously discussed in Rosati et al. (2021a) and Wollesen de Jonge et al. (2021), we cannot conclude on the exact origin of the organic signal. A thorough analysis of the organic mass spectra revealed that the organic mass signal is composed of the sum of many low-intensity fragments that we cannot attribute to a specific source (see example organic mass spectrum for Exp. 5). It cannot be entirely excluded that it is due to contamination from previous experiments. It could, however, also derive from biases due to the complex fragmentation during ionisation and uncertainties arising from the calibration with MSA. Additionally, instrumental memory effects have previously been documented for the AMS (e.g. Drewnick et al., 2009, 2015; Pieber et al., 2016). Two ionisation efficiency calibrations before and after the experiments could neither exclude nor completely prove memory effects. If the organic signal stems from uncertainties in the analysis, it will not influence hygroscopicity. In the case that the organic signal is real, the herein presented hygroscopicity results represent lower estimates of the inorganic aerosol hygroscopicity, as κ values for organics in the range 0–0.2 (Jimenez et al., 2009) can be expected, which would lead to a decrease of the κ values measured for an organic–inorganic mixture.
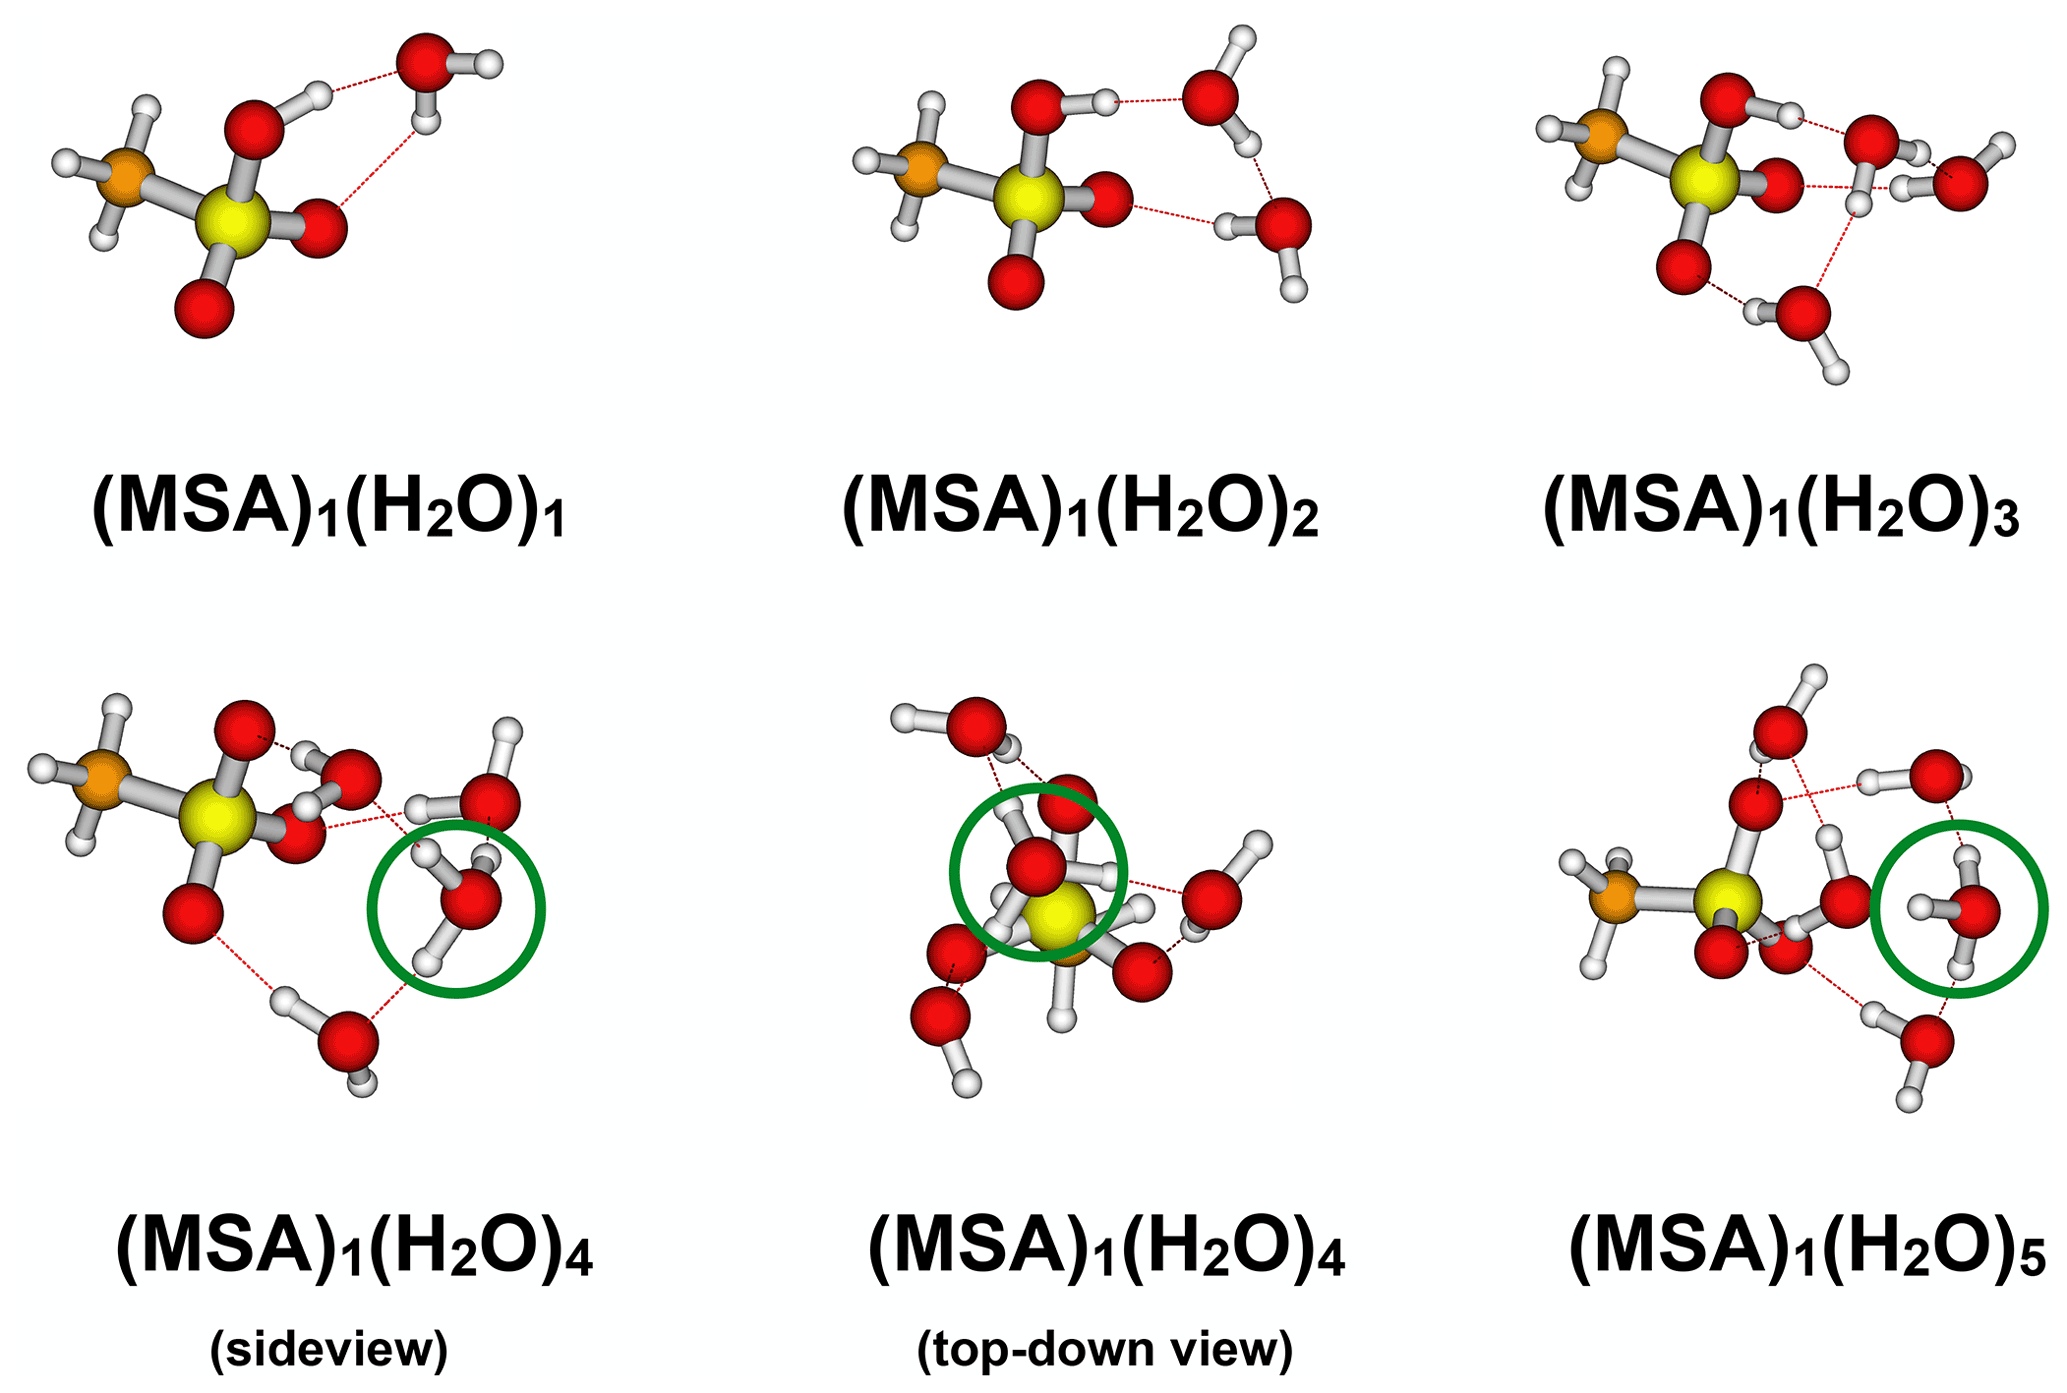
Figure 6Identified lowest Gibbs free energy (MSA)1(H2O)1−5 cluster structures calculated at the ωB97X-D/6-31++G(d,p) level of theory. The green circles indicate the formation of a H3O+ ion.
The chemical composition of the aerosol particles could not be measured at 258 K due to the low mass produced during these experiments. Experiments 8 and 9 were carried out at 273 K, but no obvious difference was found compared to the experiments carried out at 293 K. Figure 5 illustrates mean κ values colour coded by the MSA to sulfate ratio measured by the HR-ToF-AMS at 293 and 273 K. We selected κ values for dry particles of 80 and 100 nm (long-HTDMA), as these sizes are more representative of the size range analysed by the HR-ToF-AMS (typically PM1). Tabular values of MSA are given in Table S5. The MSA ratio is highest in Exp. 1 and 7, which were performed at 293 K and dry conditions, reaching values above 3. These high values at dry and warm conditions were already discussed in Wollesen de Jonge et al. (2021). Contrarily, Exp. 6, which was also carried out at 293 K and dry conditions, shows a small MSA ratio of 1.3. This difference could potentially originate from the higher RH values of 13.7 ± 1.7 in Exp. 6 compared to RH below 10 % in Exp. 1 and 7. At 293 K and high humidity conditions, the MSA ratios vary from 2.7 to 1.4, where experiments at low H2O2 concentrations yield high values and experiments at high H2O2 conditions yield low values. At 273 K and high humidity conditions, the values during experiments with high or low H2O2 coincide, yielding ratios of 1.5. As seen in Fig. 5, the κ values at 273 K vary most, while their MSA ratios are the same. At 293 K, on the other hand, the MSA ratios vary from 3 to 1.4, as discussed above, but no clear trend is observed in the κ values, i.e. higher κ values are associated with both high and low MSA ratios.
To the best of our knowledge, there are no previous measurements of the water uptake of MSA or ammonium–MSA particles at 258 or 273 K. When using the UManSysProp thermodynamic model to calculate κ values for ammonium sulfate particles at 293 and 258 K, only small variations are found. κ values of 0.59 and 0.58 at 293 and 258 K, respectively, are found based on hygroscopic growth, while κ values of 0.63 and 0.59 at 293 and 258 K, respectively, are found based on CCN activation potential. This is consistent with previous findings showing that the water activity of ammonium sulfate in this temperature range is quite constant (Gysel et al., 2002). Due to the similarities between ammonium sulfate and MSA, we thus expect that the temperature dependence of the water uptake of MSA is also negligible.
3.3 Quantum chemical calculations of gas-phase hydration of MSA
Gas-phase chemistry might be influenced by the presence of water molecules. We carried out detailed quantum chemical calculations to investigate whether the formed MSA is hydrated in the gas phase. Figure 6 presents the lowest free energy cluster structures (298.15 K and 1 atm) obtained at the ωB97X-D/6-31++G(d,p) level of theory.
The formed (MSA)1(H2O)1−5 clusters show some differences compared to the corresponding sulfuric acid–water clusters (see Table S6). A proton transfer in the global free energy structures of the (MSA)1(H2O)3−5 clusters is observed, whereas at least six water molecules are required in the case of sulfuric acid clusters (Kildgaard et al., 2018a). The calculated reaction free energy at the DLPNO-CCSD(T0)/aug-cc-pVTZ//ωB97X-D/6-31++G(d,p) level of theory for adding the first four water molecules to MSA is less favourable than adding water molecules to sulfuric acid (see Supplement). This indicates that gas-phase MSA is significantly less hygroscopic compared to SA.
The hydrate distribution (xn) of the (MSA)1(H2O)1−5 clusters can be calculated to elucidate the extent to which the clusters are hydrated under realistic atmospheric conditions. The hydrate distributions can be calculated as follows (Henschel et al., 2014a):
Here, n is the given hydrate, ΔGn is the binding free energy of the cluster, and pref is the reference pressure (1 atm). The population of the un-hydrated cluster x0 is normalised so that all the populations sum up to 1. p(H2O)=0.0316 atm is the saturation water vapour pressure at 298.15 K. We find that the MSA clusters are predominantly not hydrated in the gas phase (see Fig. S11). At low RH (20 %), the MSA monohydrate population is only 3 %. At increasing RH, the monohydrate becomes more pronounced, with a value of 14 % at 100 % RH. Even at 100 % RH, the dihydrate is only 0.7 % populated. In contrast, the monohydrate and dihydrate of SA are populated by 32 % and 6 %, respectively, at 100 % RH (Kildgaard et al., 2018a). These findings imply that MSA is not significantly hydrated in the gas phase, and water should have little influence on the gas-phase chemistry. This is consistent with a previous study on the effect of a single water molecule on the reactions between the OH radical and MSA (Jörgensen et al., 2013), where water was also found to have no influence on the reaction kinetics.
The oceans emit large quantities of DMS, which can act as a precursor for the production and growth of aerosol particles. In this study, we investigate the oxidation of DMS by hydroxyl radicals, with a special focus on the hygroscopicity and CCN activity potential of the particles. The experiments were carried out in the temperature range of 258–293 K at dry and humid conditions in the AURA chamber and complemented by quantum chemical calculations.
The nucleation and growth rates of the new particles formed were smaller at cold temperatures compared to at warm temperatures. This temperature dependence is unexpected but most likely originates from a slower oxidation of DMS at 258 K compared to at 293 K. Higher relative humidities did not seem to significantly affect the decay of DMS during oxidation with OH radicals but led to lower particle growth rates compared to at low relative humidities. Quantum chemical calculations revealed that gas-phase MSA clusters are predominantly not hydrated; thus, high humidity conditions are not expected to influence its gas-phase chemistry.
The average hygroscopicity parameters, κ, calculated from measurements performed during the main particles' growth mode at sub- and supersaturated water vapour conditions at 293 K, ranged from 0.48 to 0.52 for dry 80 nm particles. These values may represent lower limits and are well comparable with modelled values for MSA or mixtures of MSA and ammonium sulfate (Fossum et al., 2018). These results are also consistent with online chemical composition measurements revealing that the largest fraction of the particles was MSA followed by ammonium sulfate. During ageing by exposure to hydroxyl radicals, the water uptake of the particles increased, as found for all investigated sizes (Ddry=10–150 nm) at sub- and supersaturated water vapour conditions. The size-selected results from the HR-ToF-AMS indicate that this could originate from a change in the MSA sulfate ratio, with ageing favouring more ammonium sulfate in the particles with longer ageing. When oxidising DMS at colder temperatures, a slight increase in κ values is visible, which is more pronounced for smaller particles. The MSA sulfate ratio did not show a clear temperature trend but showed a dependency on RH, where highest values were measured at low relative humidities.
The κ values found in this study for particles produced by the oxidation of DMS by OH radicals lie within the upper range of the so-called “more-hygroscopic particle” (MHP) mode, defined by Swietlicki et al. (2008) as the κ range between approximately 0.17 and 0.66. This is the prevailing hygroscopicity group found from observations in the marine environment. Swietlicki et al. (2008) described a potential source of these particles to be partly neutralised DMS-derived sulfate particles as well as aged sea salt particles and mixtures with organic matter. Our hygroscopicity results are consistent with these observations, underlining the high water uptake potential of particles formed via the oxidation of DMS by OH radicals. Aerosol particles from new particle formation have been shown to contribute the major fraction of all particles in remote continental regions (Spracklen et al., 2006). Specifically, at Arctic sites, new particles formed from the oxidation of DMS have been found to be important for the particle population, for their growth, and for their potential to act as CCN (Beck et al., 2021; Schmale and Baccarini, 2021). Recently, Zheng et al. (2021) provided evidence for regular and frequent new particle formation in remote marine locations, thereby contradicting the common view of rare occurrences in these areas (e.g. Kerminen et al., 2018). There is still a substantial knowledge gap regarding the detailed processes occurring in the ambient atmosphere. Thus, this laboratory study provides new insights into the properties of particles formed from DMS oxidation at different temperatures and humidity regimes, which is needed to understand atmospheric observations.
The experimental data obtained in this study and the codes for the analysis, written in MATLAB, are available at https://sciencedata.dk/shared/4f1826ab4877ee70a2388cd519b3039a (Rosati, 2022). Results from the quantum-chemical calculations are available on request from Jonas Elm.
The supplement related to this article is available online at: https://doi.org/10.5194/acp-22-13449-2022-supplement.
BR, MB, and AV designed and supervised the research; BR, SI, and SC performed and analysed the different water uptake measurements; MMJ and SPM performed and analysed the chemical composition measurements with input from MG; BR performed and analysed the gas-phase measurements; JE performed and analysed the quantum chemical simulations; AM, AV, and MB contributed to interpreting the results. BR and SI wrote the paper with contributions from all co-authors. All authors read and reviewed the manuscript.
The contact author has declared that none of the authors has any competing interests.
Publisher’s note: Copernicus Publications remains neutral with regard to jurisdictional claims in published maps and institutional affiliations.
We thank the Villum Foundation for supporting the long-HTDMA involved in this study. We also thank Jon Bjarke Valbaek Mygind and Anders Feilberg for their involvement in the PTR measurements, and Olli Väisänen for his help with the nano-HTDMA setup and analysis. We also thank Athanasios Nenes and his group for providing the SMCA analysis software.
This research has been supported by the Austrian Science Fund (grant no. J 3970-N36), the Academy of Finland (grant no. grant No 337550), the Carlsbergfondet (grant no. CF20-0637), and Aarhus University and the University of Eastern Finland Doctoral Program in Environmental Physics, Health and Biology.
This paper was edited by Qi Chen and reviewed by two anonymous referees.
Albu, M., Barnes, I., Becker, K. H., Patroescu-Klotz, I., Mocanu, R., and Benter, T.: Rate coefficients for the gas-phase reaction of OH radicals with dimethyl sulfide: temperature and O2 partial pressure dependence, Phys. Chem. Chem. Phys., 8, 728–736, https://doi.org/10.1039/B512536G, 2006. a, b
Andreae, M. O.: Ocean–atmosphere Interactions in the Global Biogeochemical Sulfur Cycle, Mar. Chem., 30, 1–29, 1990. a
Ayers, G. P. and Cainey, J. M.: The CLAW hypothesis: a review of the major developments, Environ. Chem., 4, 366–374, 2007. a
Barnes, I., Hjorth, J., and Mihalopoulos, N.: Dimethyl Sulfide and Dimethyl Sulfoxide and Their Oxidation in the Atmosphere, Chem. Rev., 106, 940–975, https://doi.org/10.1021/cr020529+, 2006. a, b, c
Beck, L. J., Sarnela, N., Junninen, H., Hoppe, C. J. M., Garmash, O., Bianchi, F., Riva, M., Rose, C., Peräkylä, O., Wimmer, D., Kausiala, O., Jokinen, T., Ahonen, L., Mikkilä, J., Hakala, J., He, X.-C., Kontkanen, J., Wolf, K. K. E., Cappelletti, D., Mazzola, M., Traversi, R., Petroselli, C., Viola, A. P., Vitale, V., Lange, R., Massling, A., Nøjgaard, J. K., Krejci, R., Karlsson, L., Zieger, P., Jang, S., Lee, K., Vakkari, V., Lampilahti, J., Thakur, R. C., Leino, K., Kangasluoma, J., Duplissy, E.-M., Siivola, E., Marbouti, M., Tham, Y. J., Saiz-Lopez, A., Petäjä, T., Ehn, M., Worsnop, D. R., Skov, H., Kulmala, M., Kerminen, V.-M., and Sipilä, M.: Differing Mechanisms of New Particle Formation at Two Arctic Sites, Geophys. Res. Lett., 48, e2020GL091334, https://doi.org/10.1029/2020GL091334, 2021. a
Berg, O. H., Swietlicki, E., and Krejci, R.: Hygroscopic growth of aerosol particles in the marine boundary layer over the Pacific and Southern Oceans during the First Aerosol Characterization Experiment (ACE 1), J. Geophys. Res.-Atmos., 103, 16535–16545, https://doi.org/10.1029/97JD02851, 1998. a
Cappellin, L., Karl, T., Probst, M., Ismailova, O., Winkler, P. M., Soukoulis, C., Aprea, E., Märk, T. D., Gasperi, F., and Biasioli, F.: On Quantitative Determination of Volatile Organic Compound Concentrations Using Proton Transfer Reaction Time-of-Flight Mass Spectrometry, Environ. Sci. Technol., 46, 2283–2290, https://doi.org/10.1021/es203985t, 2012. a
Carpenter, L. J., Archer, S. D., and Beale, R.: Ocean-atmosphere trace gas exchange, Chem. Soc. Rev., 41, 6473–6506, https://doi.org/10.1039/C2CS35121H, 2012. a
Chai, J.-D. and Head-Gordon, M.: Long-range Corrected Hybrid Density Functionals with Damped Atom-atom Dispersion Corrections, Phys. Chem. Chem. Phys., 10, 6615–6620, 2008. a
Charlson, R. J., Lovelock, J. E., Andreae, M. O., and Warren, S. G.: Oceanic phytoplankton, atmospheric sulphur, cloud albedo and climate, Nature, 326, 655–661, https://doi.org/10.1038/326655a0, 1987. a
Collins, D. B., Ault, A. P., Moffet, R. C., Ruppel, M. J., Cuadra-Rodriguez, L. A., Guasco, T. L., Corrigan, C. E., Pedler, B. E., Azam, F., Aluwihare, L. I., Bertram, T. H., Roberts, G. C., Grassian, V. H., and Prather, K. A.: Impact of marine biogeochemistry on the chemical mixing state and cloud forming ability of nascent sea spray aerosol, J. Geophys. Res.-Atmos., 118, 8553–8565, https://doi.org/10.1002/jgrd.50598, 2013. a
Collins, D. B., Bertram, T. H., Sultana, C. M., Lee, C., Axson, J. L., and Prather, K. A.: Phytoplankton blooms weakly influence the cloud forming ability of sea spray aerosol, Geophys. Res. Lett., 43, 9975–9983, https://doi.org/10.1002/2016GL069922, 2016. a
Covert, D. S., Gras, J. L., Wiedensohler, A., and Stratmann, F.: Comparison of directly measured CCN with CCN modeled from the number-size distribution in the marine boundary layer during ACE 1 at Cape Grim, Tasmania, J. Geophys. Res.-Atmos., 103, 16597–16608, https://doi.org/10.1029/98JD01093, 1998. a
DeCarlo, P. F., Slowik, J. G., Worsnop, D. R., Davidovits, P., and Jimenez, J. L.: Particle Morphology and Density Characterization by Combined Mobility and Aerodynamic Diameter Measurements, Part 1: Theory, Aerosol Sci. Technol., 38, 1185–1205, https://doi.org/10.1080/027868290903907, 2004. a
Decarlo, P. F., Kimmel, J. R., Trimborn, A., Northway, M. J., Jayne, J. T., Aiken, A. C., Gonin, M., Fuhrer, K., Horvath, T., Docherty, K. S., Worsnop, D. R., and Jimenez, J. L.: Field-Deployable, High-Resolution, Time-of-Flight Aerosol Mass Spectrometer, Anal. Chem., 78, 8281–8289, https://doi.org/10.1029/2001JD001213.Analytical, 2006. a
Ditas, F., Shaw, R. A., Siebert, H., Simmel, M., Wehner, B., and Wiedensohler, A.: Aerosols-cloud microphysics-thermodynamics-turbulence: evaluating supersaturation in a marine stratocumulus cloud, Atmos. Chem. Phys., 12, 2459–2468, https://doi.org/10.5194/acp-12-2459-2012, 2012. a
Drewnick, F., Hings, S. S., Alfarra, M. R., Prevot, A. S. H., and Borrmann, S.: Aerosol quantification with the Aerodyne Aerosol Mass Spectrometer: detection limits and ionizer background effects, Atmos. Meas. Tech., 2, 33–46, https://doi.org/10.5194/amt-2-33-2009, 2009. a
Drewnick, F., Diesch, J.-M., Faber, P., and Borrmann, S.: Aerosol mass spectrometry: particle–vaporizer interactions and their consequences for the measurements, Atmos. Meas. Tech., 8, 3811–3830, https://doi.org/10.5194/amt-8-3811-2015, 2015. a
Duplissy, J., Merikanto, J., Franchin, A., Tsagkogeorgas, G., Kangasluoma, J., Wimmer, D., Vuollekoski, H., Schobesberger, S., Lehtipalo, K., Flagan, R. C., Brus, D., Donahue, N. M., Vehkamäki, H., Almeida, J., Amorim, A., Barmet, P., Bianchi, F., Breitenlechner, M., Dunne, E. M., Guida, R., Henschel, H., Junninen, H., Kirkby, J., Kürten, A., Kupc, A., Määttänen, A., Makhmutov, V., Mathot, S., Nieminen, T., Onnela, A., Praplan, A. P., Riccobono, F., Rondo, L., Steiner, G., Tome, A., Walther, H., Baltensperger, U., Carslaw, K. S., Dommen, J., Hansel, A., Petäjä, T., Sipilä, M., Stratmann, F., Vrtala, A., Wagner, P. E., Worsnop, D. R., Curtius, J., and Kulmala, M.: Effect of ions on sulfuric acid-water binary particle formation: 2. Experimental data and comparison with QC-normalized classical nucleation theory, J. Geophys. Res.-Atmos., 121, 1752–1775, https://doi.org/10.1002/2015JD023539, 2016. a
Elm, J. and Kristensen, K.: Basis Set Convergence of the Binding Energies of Strongly Hydrogen-Bonded Atmospheric Clusters, Phys. Chem. Chem. Phys, 19, 1122–1133, 2017. a
Elm, J. and Mikkelsen, K. V.: Computational Approaches for Efficiently Modelling of Small Atmospheric Clusters, Chem. Phys. Lett., 615, 26–29, 2014. a
Elm, J., Bilde, M., and Mikkelsen, K. V.: Assessment of Binding Energies of Atmopsheric Clusters, Phys. Chem. Chem. Phys, 15, 16442–16445, 2013. a
Facchini, M., Rinaldi, M., Decesari, S., Carbone, C., Finessi, E., Mircea, M., Fuzzi, S., Ceburnis, D., Flanagan, R., Nilsson, E., de Leeuw, G., Martino, M., Woeltjen, J., and O'Dowd, C.: Primary submicron marine aerosol dominated by insoluble organic colloids and aggregates, Geophys. Res. Lett., 35, 1–5, https://doi.org/10.1029/2008GL034210, 2008. a
Fossum, K. N., Ovadnevaite, J., Ceburnis, D., Dall’Osto, M., Marullo, S., Bellacicco, M., Simó, R., Liu, D., Flynn, M., Zuend, A., and O’Dowd, C.: Summertime primary and secondary contributions to Southern Ocean cloud condensation nuclei, Sci. Rep., 8, 1–14, 2018. a, b, c, d, e, f, g, h
Frisch, M., Trucks, G. W., Schlegel, H. B., Scuseria, G. E., Robb, M. A., Cheeseman, J. R., Scalmani, G., Barone, V., Mennucci, B., and Petersson, G. A.: Gaussian, Inc., W. C.: Gaussian 09, Revision E.01, 2013. a
Fuentes, E., Coe, H., Green, D., and McFiggans, G.: On the impacts of phytoplankton-derived organic matter on the properties of the primary marine aerosol – Part 2: Composition, hygroscopicity and cloud condensation activity, Atmos. Chem. Phys., 11, 2585–2602, https://doi.org/10.5194/acp-11-2585-2011, 2011. a
Graus, M., Müller, M., and Hansel, A.: High Resolution PTR-TOF: Quantification and Formula Confirmation of VOC in Real Time, J. Am. Soc. Mass Spectrom., 21, 1037–1044, https://doi.org/10.1016/j.jasms.2010.02.006, 2010. a
Gysel, M., Weingartner, E., and Baltensperger, U.: Hygroscopicity of Aerosol Particles at Low Temperatures. 2. Theoretical and Experimental Hygroscopic Properties of Laboratory Generated Aerosols, Environ. Sci. Technol., 36, 63–68, https://doi.org/10.1021/es010055g, 2002. a
Henschel, H., Navarro, J. C. A., Yli-Juuti, T., Kupiainen-Määttä, O., Olenius, T., Ortega, I. K., Clegg, S. L., Kurtén, T., Riipinen, I., and Vehkamäki, H.: Hydration of Atmospherically Relevant Molecular Clusters: Computational Chemistry and Classical Thermodynamics, J. Phys. Chem. A., 118, 2599–2611, 2014a. a
Henschel, H., Navarro, J. C. A., Yli-Juuti, T., Kupiainen-Määttä, O., Olenius, T., Ortega, I. K., Clegg, S. L., Kurtén, T., Riipinen, I., and Vehkamäki, H.: Hydration of Atmospherically Relevant Molecular Clusters: Computational Chemistry and Classical Thermodynamics, J. Phys. Chem. A, 118, 2599–2611, https://doi.org/10.1021/jp500712y, 2014b. a
Henschel, H., Kurtén, T., and Vehkamäki, H.: Computational Study on the Effect of Hydration on New Particle Formation in the Sulfuric Acid/Ammonia and Sulfuric Acid/Dimethylamine Systems, J. Phys. Chem. A., 120, 1886–1896, 2016. a
Hoffmann, E. H., Tilgner, A., Schrödner, R., Bräuer, P., Wolke, R., and Herrmann, H.: An advanced modeling study on the impacts and atmospheric implications of multiphase dimethyl sulfide chemistry, P. Natl. Acad. Sci. USA, 113, 11776–11781, https://doi.org/10.1073/pnas.1606320113, 2016. a, b, c
Hopkins, F. E., Bell, T. G., Yang, M., Suggett, D. J., and Steinke, M.: Air exposure of coral is a significant source of dimethylsulfide (DMS) to the atmosphere, Sci. Rep., 6, 1–11, 2016. a
IPCC, 2021: Climate Change 2021: The Physical Science Basis. Contribution of Working Group I to the Sixth Assessment Report of the Intergovernmental Panel on Climate Change, edited by: Masson-Delmotte, V., Zhai, P., Pirani, A., Connors, S. L., Péan, C., Berger, S., Caud, N., Chen, Y., Goldfarb, L., Gomis, M. I., Huang, M., Leitzell, K., Lonnoy, E., Matthews, J. B. R., Maycock, T. K., Waterfield, T., Yelekçi, O., Yu, R., and Zhou, B., Cambridge University Press, Cambridge, United Kingdom and New York, NY, USA, 2391 pp., https://doi.org/10.1017/9781009157896, 2021. a, b
Jimenez, J. L., Canagaratna, M. R., Donahue, N. M., Prevot, A. S. H., Zhang, Q., Kroll, J. H., DeCarlo, P. F., Allan, J. D., Coe, H., Ng, N. L., Aiken, A. C., Docherty, K. S., Ulbrich, I. M., Grieshop, A. P., Robinson, A. L., Duplissy, J., Smith, J. D., Wilson, K. R., Lanz, V. A., Hueglin, C., Sun, Y. L., Tian, J., Laaksonen, A., Raatikainen, T., Rautiainen, J., Vaattovaara, P., Ehn, M., Kulmala, M., Tomlinson, J. M., Collins, D. R., Cubison, M. J., null null, Dunlea, J., Huffman, J. A., Onasch, T. B., Alfarra, M. R., Williams, P. I., Bower, K., Kondo, Y., Schneider, J., Drewnick, F., Borrmann, S., Weimer, S., Demerjian, K., Salcedo, D., Cottrell, L., Griffin, R., Takami, A., Miyoshi, T., Hatakeyama, S., Shimono, A., Sun, J. Y., Zhang, Y. M., Dzepina, K., Kimmel, J. R., Sueper, D., Jayne, J. T., Herndon, S. C., Trimborn, A. M., Williams, L. R., Wood, E. C., Middlebrook, A. M., Kolb, C. E., Baltensperger, U., and Worsnop, D. R.: Evolution of Organic Aerosols in the Atmosphere, Science, 326, 1525–1529, https://doi.org/10.1126/science.1180353, 2009. a
Johnson, G., Ristovski, Z., and Morawska, L.: Method for measuring the hygroscopic behaviour of lower volatility fractions in an internally mixed aerosol, J. Aerosol Sci., 35, 443–455, https://doi.org/10.1016/j.jaerosci.2003.10.008, 2004. a, b, c
Jörgensen, S., Jensen, C., Kjaergaard, H. G., and Anglada, J. M.: The Gas-phase Reaction of Methane Sulfonic Acid with the Hydroxyl Radical Without and With Water Vapor, Phys. Chem. Chem. Phys., 15, 5140–5150, 2013. a
Kerminen, V.-M., Chen, X., Vakkari, V., Petäjä, T., Kulmala, M., and Bianchi, F.: Atmospheric new particle formation and growth: review of field observations, Environ. Res. Lett., 13, 103003, https://doi.org/10.1088/1748-9326/aadf3c, 2018. a, b
Keskinen, H., Romakkaniemi, S., Jaatinen, A., Miettinen, P., Saukko, E., Jorma, J., Mäkelä, J. M., Virtanen, A., Smith, J. N., and Laaksonen, A.: On-Line Characterization of Morphology and Water Adsorption on Fumed Silica Nanoparticles, Aerosol Sci. Technol., 45, 1441–1447, https://doi.org/10.1080/02786826.2011.597459, 2011. a
Kildgaard, J. V., Mikkelsen, K. V., Bilde, M., and Elm, J.: Hydration of Atmospheric Molecular Clusters: A New Method for Systematic Configurational Sampling, J. Phys. Chem. A, 122, 5026–5036, 2018a. a, b, c, d
Kildgaard, J. V., Mikkelsen, K. V., Bilde, M., and Elm, J.: Hydration of Atmospheric Molecular Clusters II: Organic Acid-Water Clusters, J. Phys. Chem. A, 122, 8549–8556, 2018b. a
King, S., Butcher, A., Rosenoern, T., Coz, E., Lieke, K., De Leeuw, G., Nilsson, E., and Bilde, M.: Investigating primary marine aerosol properties: CCN activity of sea salt and mixed inorganic-organic particles, Environ. Sci. Technol., 46, 10405–10412, https://doi.org/10.1021/es300574u, 2012. a
Kristensen, K., Jensen, L., Glasius, M., and Bilde, M.: The effect of sub-zero temperature on the formation and composition of secondary organic aerosol from ozonolysis of alpha-pinene, Environ. Sci., 19, 1220–1234, https://doi.org/10.1039/c7em00231a, 2017. a
Kulmala, M., Petäjä, T., Nieminen, T., Sipilä, M., Manninen, H., Lehtipalo, K., Dal Maso, M., Aalto, P., Junninen, H., Paasonen, P., Riipinen, I., Lehtinen, K., Laaksonen, A., and Kerminen, V.-M.: Measurement of the nucleation of atmospheric aerosol particles, Nat. Protoc., 7, 1651–1667, https://doi.org/10.1038/nprot.2012.091, 2012. a
Kulmala, M., Kontkanen, J., Junninen, H., Lehtipalo, K., Manninen, H. E., Nieminen, T., Petäjä, T., Sipilä, M., Schobesberger, S., Rantala, P., et al.: Direct Observations of Atmospheric Aerosol Nucleation, Science, 339, 943–946, 2013. a
Lehtinen, K. E. J. and Kulmala, M.: A model for particle formation and growth in the atmosphere with molecular resolution in size, Atmos. Chem. Phys., 3, 251–257, https://doi.org/10.5194/acp-3-251-2003, 2003. a
Lehtipalo, K., Leppä, J., Kontkanen, J., Kangasluoma, J., Franchin, A., Wimnner, D., Schobesberger, S., Junninen, H., Petäjä, T., Sipilä, M., et al.: Methods for determining particle size distribution and growth rates between 1 and 3 nm using the Particle Size Magnifier, Boreal Environ. Res., 19 (suppl. B), 215–236, ISSN: 1797-2469, 2014. a
Leverentz, H. R., Siepmann, J. I., Truhlar, D. G., Loukonen, V., and Vehkamäki, H.: Energetics of Atmospherically Implicated Clusters Made of Sulfuric Acid, Ammonia, and Dimethyl Amine, J. Phys. Chem. A, 117, 3819–3825, 2013. a
Lewis, E. and Schwartz, S.: Sea Salt Aerosol Production: Mechanisms, Methods, Measurements and Models, American Geophysical Union, Washington DC, ISBN: 9780875904177, 2004. a, b
Li, M., Karu, E., Brenninkmeijer, C., Fischer, H., Lelieveld, J., and Williams, J.: Tropospheric OH and stratospheric OH and Cl concentrations determined from CH4, CH3, Cl, and SF6 measurements, npj Clim. Atmos. Sci., 1, 1–7, 2018. a
Liu, D., Nyord, T., Rong, L., and Feilberg, A.: Real-time quantification of emissions of volatile organic compounds from land spreading of pig slurry measured by PTR-MS and wind tunnels, Sci. Total Environ., 639, 1079–1087, https://doi.org/10.1016/j.scitotenv.2018.05.149, 2018. a
Lopez-Yglesias, X. F., Yeung, M. C., Dey, S. E., Brechtel, F. J., and Chan, C. K.: Performance Evaluation of the Brechtel Mfg. Humidified Tandem Differential Mobility Analyzer (BMI HTDMA) for Studying Hygroscopic Properties of Aerosol Particles, Aerosol Sci. Technol., 48, 969–980, https://doi.org/10.1080/02786826.2014.952366, 2014. a
Manninen, H. E., Nieminen, T., Asmi, E., Gagné, S., Häkkinen, S., Lehtipalo, K., Aalto, P., Vana, M., Mirme, A., Mirme, S., Hõrrak, U., Plass-Dülmer, C., Stange, G., Kiss, G., Hoffer, A., Törő, N., Moerman, M., Henzing, B., de Leeuw, G., Brinkenberg, M., Kouvarakis, G. N., Bougiatioti, A., Mihalopoulos, N., O'Dowd, C., Ceburnis, D., Arneth, A., Svenningsson, B., Swietlicki, E., Tarozzi, L., Decesari, S., Facchini, M. C., Birmili, W., Sonntag, A., Wiedensohler, A., Boulon, J., Sellegri, K., Laj, P., Gysel, M., Bukowiecki, N., Weingartner, E., Wehrle, G., Laaksonen, A., Hamed, A., Joutsensaari, J., Petäjä, T., Kerminen, V.-M., and Kulmala, M.: EUCAARI ion spectrometer measurements at 12 European sites – analysis of new particle formation events, Atmos. Chem. Phys., 10, 7907–7927, https://doi.org/10.5194/acp-10-7907-2010, 2010. a
Mardyukov, A. and Schreiner, P. R.: Atmospherically Relevant Radicals Derived from the Oxidation of Dimethyl Sulfide, Acc. Chem. Res., 51, 475–483, 2018. a
Modini, R. L., Johnson, G. R., He, C., and Ristovski, Z. D.: Observation of the suppression of water uptake by marine particles, Atmos. Res., 98, 219–228, https://doi.org/10.1016/j.atmosres.2010.03.025, 2010. a
Moore, R. H., Nenes, A., and Medina, J.: Scanning Mobility CCN Analysis—A Method for Fast Measurements of Size-Resolved CCN Distributions and Activation Kinetics, Aerosol Sci. Technol., 44, 861–871, https://doi.org/10.1080/02786826.2010.498715, 2010. a
Myllys, N., Elm, J., and Kurtén, T.: Density Functional Theory Basis Set Convergence of Sulfuric Acid-Containing Molecular Clusters, Comp. Theor. Chem., 1098, 1–12, 2016. a
Neese, F.:, wIREs Comput. Mol. Sci., 2, 73–78, https://doi.org/10.1002/wcms.81 2012. a
Nguyen, Q. T., Kjær, K. H., Kling, K. I., Boesen, T., and Bilde, M.: Impact of fatty acid coating on the CCN activity of sea salt particles, Tellus B, 69, 1304064, https://doi.org/10.1080/16000889.2017.1304064, 2017. a
Nilsson, E. D., Rannik, U., Swietlicki, E., Leck, C., Aalto, P. P., Zhou, J., and Norman, M.: Turbulent aerosol fluxes over the Arctic Ocean: 2. Wind-driven sources from the sea, J. Geophys. Res.-Atmos., 106, 32139–32154, https://doi.org/10.1029/2000JD900747, 2001. a
Ovadnevaite, J., Ceburnis, D., Martucci, G., Bialek, J., Monahan, C., Rinaldi, M., Facchini, M. C., Berresheim, H., Worsnop, D. R., and O'Dowd, C.: Primary marine organic aerosol: A dichotomy of low hygroscopicity and high CCN activity, Geophys. Res. Lett., 38, L21806, https://doi.org/10.1029/2011GL048869, 2011. a
Pajunoja, A., Lambe, A. T., Hakala, J., Rastak, N., Cummings, M. J., Brogan, J. F., Hao, L., Paramonov, M., Hong, J., Prisle, N. L., Malila, J., Romakkaniemi, S., Lehtinen, K. E. J., Laaksonen, A., Kulmala, M., Massoli, P., Onasch, T. B., Donahue, N. M., Riipinen, I., Davidovits, P., Worsnop, D. R., Petäjä, T., and Virtanen, A.: Adsorptive uptake of water by semisolid secondary organic aerosols, Geophys. Res. Lett., 42, 3063–3068, https://doi.org/10.1002/2015GL063142, 2015. a
Peng, C. and Chan, C. K.: The water cycles of water-soluble organic salts of atmospheric importance, Atmos. Environ., 35, 1183–1192, https://doi.org/10.1016/S1352-2310(00)00426-X, 2001. a
Petters, M. D. and Kreidenweis, S. M.: A single parameter representation of hygroscopic growth and cloud condensation nucleus activity, Atmos. Chem. Phys., 7, 1961–1971, https://doi.org/10.5194/acp-7-1961-2007, 2007. a, b
Pieber, S. M., El Haddad, I., Slowik, J. G., Canagaratna, M. R., Jayne, J. T., Platt, S. M., Bozzetti, C., Daellenbach, K. R., Fröhlich, R., Vlachou, A., Klein, F., Dommen, J., Miljevic, B., Jiménez, J. L., Worsnop, D. R., Baltensperger, U., and Prévôt, A. S. H.: Inorganic Salt Interference on CO in Aerodyne AMS and ACSM Organic Aerosol Composition Studies, Environ. Sci. Technol., 10494–10503 https://doi.org/10.1021/acs.est.6b01035, 2016. a
Prather, K., Bertram, T., Grassian, V., Deane, G., Stokes, M., DeMott, P., Aluwihare, L., Palenik, B., Azam, F., Seinfeld, J., Moffet, R., Molina, M., Cappa, C., Geiger, F., Roberts, G., Russell, L., Ault, A., Baltrusaitis, J., Collins, D., Corrigan, C., Cuadra-Rodriguez, L., Ebben, C., Forestieri, S., Guasco, T., Hersey, S., Kim, M., Lambert, W., Modini, R., Mui, W., Pedler, B., Ruppel, M., Ryder, O., Schoepp, N., Sullivan, R., and Zhao, D.: Bringing the ocean into the laboratory to probe the chemical complexity of sea spray aerosol, P. Natl. Acad. Sci. USA, 110, 7550–7555, https://doi.org/10.1073/pnas.1300262110, 2013. a, b
Quinn, P. and Bates, T.: The case against climate regulation via oceanic phytoplankton sulphur emissions, Nature, 480, 51–56, https://doi.org/10.1038/nature10580, 2011. a
Rastak, N., Pajunoja, A., Acosta Navarro, J. C., Ma, J., Song, M., Partridge, D. G., Kirkevåg, A., Leong, Y., Hu, W. W., Taylor, N. F., Lambe, A., Cerully, K., Bougiatioti, A., Liu, P., Krejci, R., Petäjä, T., Percival, C., Davidovits, P., Worsnop, D. R., Ekman, A. M. L., Nenes, A., Martin, S., Jimenez, J. L., Collins, D. R., Topping, D., Bertram, A. K., Zuend, A., Virtanen, A., and Riipinen, I.: Microphysical explanation of the RH-dependent water affinity of biogenic organic aerosol and its importance for climate, Geophys. Res. Lett., 44, 5167–5177, https://doi.org/10.1002/2017GL073056, 2017. a
Riplinger, C. and Neese, F.: An Efficient and Near Linear Scaling Pair Natural Orbital Based Local Coupled Cluster Method, J. Chem. Phys., 138, 034106, https://doi.org/10.1063/1.4773581, 2013. a
Riplinger, C., Sandhoefer, B., Hansen, A., and Neese, F.: Natural Triple Excitations in Local Coupled Cluster Calculations with Pair Natural Orbitals, J. Chem. Phys., 139, 134101, https://doi.org/10.1063/1.4821834, 2013. a
Roberts, G. C. and Nenes, A.: A Continuous-Flow Streamwise Thermal-Gradient CCN Chamber for Atmospheric Measurements, Aerosol Sci. Technol., 39, 206–221, https://doi.org/10.1080/027868290913988, 2005. a
Rosati, B.: Data set containing raw and processed experimental data for the manuscript: Hygroscopicity and CCN potential of DMS-derived aerosol particles, Science Data [data set, code], https://sciencedata.dk/shared/4f1826ab4877ee70a2388cd519b3039a, last of access: 21 September 2022. a
Rosati, B., Paul, A., Iversen, E. M., Massling, A., and Bilde, M.: Reconciling atmospheric water uptake by hydrate forming salts, Environ. Sci.-Proc. Im., 22, 1759–1767, https://doi.org/10.1039/D0EM00179A, 2020. a
Rosati, B., Christiansen, S., Wollesen de Jonge, R., Roldin, P., Jensen, M. M., Wang, K., Moosakutty, S. P., Thomsen, D., Salomonsen, C., Hyttinen, N., Elm, J., Feilberg, A., Glasius, M., and Bilde, M.: New Particle Formation and Growth from Dimethyl Sulfide Oxidation by Hydroxyl Radicals, ACS Earth Space Chem., 5, 801–811, https://doi.org/10.1021/acsearthspacechem.0c00333, 2021a. a, b, c, d, e, f, g, h, i, j, k, l, m
Rosati, B., Christiansen, S., Dinesen, A., Roldin, P., Massling, A., E, D. N., and Bilde, M.: The impact of atmospheric oxidation on hygroscopicity and cloud droplet activation of inorganic sea spray aerosol, Sci. Rep., 11, 10008, https://doi.org/10.1038/s41598-021-89346-6, 2021b. a, b, c
Schmale, J. and Baccarini, A.: Progress in Unraveling Atmospheric New Particle Formation and Growth Across the Arctic, Geophys. Res. Lett., 48, e2021GL094198, https://doi.org/10.1029/2021GL094198, 2021. a
Schmitz, G. and Elm, J.: Assessment of the DLPNO binding energies of strongly non-covalent bonded atmospheric molecular clusters, ACS Omega, 5, 7601–7612, 2020. a
Seinfeld, J. and Pandis, S.: Atmospheric Chemistry and Physics: From Air Pollution to Climate Change, 3rd Edition, Wiley & Sons, Inc., ISBN: 978-1-118-94740-1, 2016. a, b, c, d, e, f
Sekimoto, K., Li, S.-M., Yuan, B., Koss, A., Coggon, M., Warneke, C., and de Gouw, J.: Calculation of the sensitivity of proton-transfer-reaction mass spectrometry (PTR-MS) for organic trace gases using molecular properties, International J. Mass Spectrom., 421, 71–94, https://doi.org/10.1016/j.ijms.2017.04.006, 2017. a
Smith, M.: Sea-salt particles and the CLAW hypothesis, Environ. Chem., 4, 391–395, 2007. a
Spracklen, D. V., Carslaw, K. S., Kulmala, M., Kerminen, V.-M., Mann, G. W., and Sihto, S.-L.: The contribution of boundary layer nucleation events to total particle concentrations on regional and global scales, Atmos. Chem. Phys., 6, 5631–5648, https://doi.org/10.5194/acp-6-5631-2006, 2006. a
Stewart, J. J. P.: Optimization of Parameters for Semiempirical Methods. V. Modification of NDDO Approximations and Application to 70 Elements, J. Molec. Model., 13, 1173–1213, 2007. a
Swietlicki, E., Hansson, H.-C., Hämeri, K., Svenningsson, B., Massling, A., Mcfiggans, G., Mcmurry, P., Petäjä, T., Tunved, P., Gysel, M., Topping, D., Weingartner, E., Baltensperger, U., Rissler, J., Wiedensohler, A., and Kulmala, M.: Hygroscopic properties of submicrometer atmospheric aerosol particles measured with H-TDMA instruments in various environments – A review, Tellus B, 60, 432–469, https://doi.org/10.1111/j.1600-0889.2008.00350.x, 2008. a, b, c
Taipale, R., Ruuskanen, T. M., Rinne, J., Kajos, M. K., Hakola, H., Pohja, T., and Kulmala, M.: Technical Note: Quantitative long-term measurements of VOC concentrations by PTR-MS – measurement, calibration, and volume mixing ratio calculation methods, Atmos. Chem. Phys., 8, 6681–6698, https://doi.org/10.5194/acp-8-6681-2008, 2008. a
Tang, M., Guo, L., Bai, Y., Huang, R.-J., Wu, Z., Wang, Z., Zhang, G., Ding, X., Hu, M., and Wang, X.: Impacts of methanesulfonate on the cloud condensation nucleation activity of sea salt aerosol, Atmos. Environ., 201, 13–17, 2019. a
Tikkanen, O.-P., Väisänen, O., Hao, L., Holopainen, E., Wang, H., Lehtinen, K. E. J., Virtanen, A., and Yli-Juuti, T.: Hygroscopicity of dimethylaminium-, sulfate-, and ammonium-containing nanoparticles, Aerosol Sci. Technol., 52, 971–983, https://doi.org/10.1080/02786826.2018.1484071, 2018. a, b
Tomicic, M., Bødker Enghoff, M., and Svensmark, H.: Experimental study of H2SO4 aerosol nucleation at high ionization levels, Atmos. Chem. Phys., 18, 5921–5930, https://doi.org/10.5194/acp-18-5921-2018, 2018. a
Topping, D., Barley, M., Bane, M. K., Higham, N., Aumont, B., Dingle, N., and McFiggans, G.: UManSysProp v1.0: an online and open-source facility for molecular property prediction and atmospheric aerosol calculations, Geosci. Model Dev., 9, 899–914, https://doi.org/10.5194/gmd-9-899-2016, 2016. a, b
Vallina, S. M. and Simó, R.: Re-visiting the CLAW hypothesis, Environ. Chem., 4, 384–387, 2007. a
Vanhanen, J., Mikkilä, J., Lehtipalo, K., Sipilä, M., Manninen, H. E., Siivola, E., Petäjä, T., and Kulmala, M.: Particle Size Magnifier for Nano-CN Detection, Aerosol Sci. Technol., 45, 533–542, https://doi.org/10.1080/02786826.2010.547889, 2011. a
Veres, P. R., Neuman, J. A., Bertram, T. H., Assaf, E., Wolfe, G. M., Williamson, C. J., Weinzierl, B., Tilmes, S., Thompson, C. R., Thames, A. B., Schroder, J. C., Saiz-Lopez, A., Rollins, A. W., Roberts, J. M., Price, D., Peischl, J., Nault, B. A., Møller, K. H., Miller, D. O., Meinardi, S., Li, Q., Lamarque, J.-F., Kupc, A., Kjaergaard, H. G., Kinnison, D., Jimenez, J. L., Jernigan, C. M., Hornbrook, R. S., Hills, A., Dollner, M., Day, D. A., Cuevas, C. A., Campuzano-Jost, P., Burkholder, J., Bui, T. P., Brune, W. H., Brown, S. S., Brock, C. A., Bourgeois, I., Blake, D. R., Apel, E. C., and Ryerson, T. B.: Global airborne sampling reveals a previously unobserved dimethyl sulfide oxidation mechanism in the marine atmosphere, P. Natl. Acad. Sci. USA, 117, 4505–4510, https://doi.org/10.1073/pnas.1919344117, 2020. a
Whitehead, J. D., Irwin, M., Allan, J. D., Good, N., and McFiggans, G.: A meta-analysis of particle water uptake reconciliation studies, Atmos. Chem. Phys., 14, 11833–11841, https://doi.org/10.5194/acp-14-11833-2014, 2014. a
Wollesen de Jonge, R., Elm, J., Rosati, B., Christiansen, S., Hyttinen, N., Lüdemann, D., Bilde, M., and Roldin, P.: Secondary aerosol formation from dimethyl sulfide – improved mechanistic understanding based on smog chamber experiments and modelling, Atmos. Chem. Phys., 21, 9955–9976, https://doi.org/10.5194/acp-21-9955-2021, 2021. a, b, c, d, e, f, g, h, i, j, k, l, m
Ye, Q., Goss, M. B., Isaacman-VanWertz, G., Zaytsev, A., Massoli, P., Lim, C., Croteau, P., Canagaratna, M., Knopf, D. A., Keutsch, F. N., Heald, C. L., and Kroll, J. H.: Organic Sulfur Products and Peroxy Radical Isomerization in the OH Oxidation of Dimethyl Sulfide, ACS Earth Space Chem., 5, 2013–2020, https://doi.org/10.1021/acsearthspacechem.1c00108, 2021. a
Yli-Juuti, T., Nieminen, T., Hirsikko, A., Aalto, P. P., Asmi, E., Hõrrak, U., Manninen, H. E., Patokoski, J., Dal Maso, M., Petäjä, T., Rinne, J., Kulmala, M., and Riipinen, I.: Growth rates of nucleation mode particles in Hyytiälä during 2003−2009: variation with particle size, season, data analysis method and ambient conditions, Atmos. Chem. Phys., 11, 12865–12886, https://doi.org/10.5194/acp-11-12865-2011, 2011. a
Zhao, D. F., Buchholz, A., Kortner, B., Schlag, P., Rubach, F., Fuchs, H., Kiendler-Scharr, A., Tillmann, R., Wahner, A., Watne, Å. K., Hallquist, M., Flores, J. M., Rudich, Y., Kristensen, K., Hansen, A. M. K., Glasius, M., Kourtchev, I., Kalberer, M., and Mentel, Th. F.: Cloud condensation nuclei activity, droplet growth kinetics, and hygroscopicity of biogenic and anthropogenic secondary organic aerosol (SOA), Atmos. Chem. Phys., 16, 1105–1121, https://doi.org/10.5194/acp-16-1105-2016, 2016. a
Zheng, G., Wang, Y., Wood, R., Jensen, M. P., Kuang, C., McCoy, I. L., Matthews, A., Mei, F., Tomlinson, J. M., Shilling, J. E., et al.: New particle formation in the remote marine boundary layer, Nat. Commun., 12, 1–10, 2021. a
Zuend, A., Marcolli, C., Luo, B. P., and Peter, T.: A thermodynamic model of mixed organic-inorganic aerosols to predict activity coefficients, Atmos. Chem. Phys., 8, 4559–4593, https://doi.org/10.5194/acp-8-4559-2008, 2008. a
Zuend, A., Marcolli, C., Booth, A. M., Lienhard, D. M., Soonsin, V., Krieger, U. K., Topping, D. O., McFiggans, G., Peter, T., and Seinfeld, J. H.: New and extended parameterization of the thermodynamic model AIOMFAC: calculation of activity coefficients for organic-inorganic mixtures containing carboxyl, hydroxyl, carbonyl, ether, ester, alkenyl, alkyl, and aromatic functional groups, Atmos. Chem. Phys., 11, 9155–9206, https://doi.org/10.5194/acp-11-9155-2011, 2011. a