the Creative Commons Attribution 4.0 License.
the Creative Commons Attribution 4.0 License.
 | 18 Oct 2022
On the potential fingerprint of the Antarctic ozone hole in ice-core nitrate isotopes: a case study based on a South Pole ice core
Yanzhi Cao
Zhuang Jiang
Becky Alexander
Jihong Cole-Dai
Joel Savarino
Joseph Erbland
Column ozone variability has important implications for surface photochemistry and the climate. Ice-core nitrate isotopes are suspected to be influenced by column ozone variability and δ15N(NO) has been sought to serve as a proxy of column ozone variability. In this study, we examined the ability of ice-core nitrate isotopes to reflect column ozone variability by measuring δ15N(NO) and Δ17O(NO) in a shallow ice core drilled at the South Pole. The ice core covers the period 1944–2005, and during this period δ15N(NO) showed large annual variability ((59.2 ± 29.3) ‰ ), but with no apparent response to the Antarctic ozone hole. Utilizing a snow photochemical model, we estimated 6.9 ‰ additional enrichments in δ15N(NO) could be caused by the development of the ozone hole. Nevertheless, this enrichment is small and masked by the effects of the snow accumulation rate at the South Pole over the same period of the ozone hole. The Δ17O(NO) record has displayed a decreasing trend by ∼ 3.4 ‰ since 1976. This magnitude of change cannot be caused by enhanced post-depositional processing related to the ozone hole. Instead, the Δ17O(NO) decrease was more likely due to the proposed decreases in the O3 HOx ratio in the extratropical Southern Hemisphere. Our results suggest ice-core δ15N(NO) is more sensitive to snow accumulation rate than to column ozone, but at sites with a relatively constant snow accumulation rate, information of column ozone variability embedded in δ15N(NO) should be retrievable.
- Article
(1879 KB) - Full-text XML
-
Supplement
(2641 KB) - BibTeX
- EndNote


Stratospheric ozone absorbs UV radiation and protects life on land. In 1985, Farman et al. (1985) and Stolarski et al. (1986) discovered severe depletion in stratospheric ozone over Antarctica in austral springs since the late 1970s, and this phenomenon was termed the “Antarctic ozone hole”. The ozone hole in Antarctic spring continued to exist after ∼ 1980 (until today) (Müller et al., 2008; WMO, 2018). The Antarctic ozone hole is caused by man-made chlorofluorocarbons (CFCs) which can be photolyzed to produce HCl and ClONO2 in the stratosphere, producing reactive chlorine and bromine atoms that destroy ozone in catalytic cycles in the cold Antarctic vortex (Keeble et al., 2014; Grooß et al., 2011; Wohltmann et al., 2017). The occurrence of an ozone hole endangers human health and affects ecosystems (Andrady et al., 2017). In addition, the occurrence of an ozone hole also has climate impacts. As suggested by numerous studies, the Antarctic ozone hole results in not only polar lower-stratospheric temperature decrease and polar tropopause rise (Son et al., 2009; Polvani et al., 2011), but also poleward shifts of the midlatitude jet (Archer and Caldeira, 2008) and the Hadley cell edge (Hu and Fu, 2007). In particular, Bitz and Polvani (2012) found the Antarctic ozone hole can cause a broad ocean surface warming and substantial Antarctic sea ice loss probably by enhancing and poleward shifting of the westerlies (Polvani et al., 2011; Thompson et al., 2011). Due to the influence of stratospheric ozone depletion (or an ozone hole) on the environment and climate, it is of interest to reconstruct past changes in stratospheric ozone and to assess its response and feedback to climate change. For example, it was suggested that in ∼ 17.7 ka BP there was likely a prolonged Antarctic ozone hole event owing to injection of halogen species to the stratosphere by a series of volcanic eruptions, and this ozone hole may have accelerated the last Antarctic deglaciation through processes similar to the interactions between the modern Antarctic ozone hole and climate (McConnell et al., 2017).
However, to reconstruct past changes in stratospheric ozone is difficult due to the lack of reliable proxies. UV-light-sensitive chemicals in snow including nitrate (Frey et al., 2009) and halogens (Abbatt et al., 2012; Spolaor et al., 2021) have been sought to investigate changes in surface UV conditions and the potential links to stratospheric ozone. The occurrence of an ozone hole would result in enhanced surface reception of UV radiation, and therefore influence snow and atmospheric chemistry at the surface. It is known that sunlit snow and ice can lead to emissions of a variety of chemicals (e.g., NOx, OH, molecular halogens, etc.) from snow to the air (e.g., Dominé and Shepson, 2002; Grannas et al., 2007). This affects local atmospheric chemistry by altering the oxidation environment (Thomas et al., 2012; Zatko et al., 2016) leading to detectable signals in snow chemicals and/or isotopes (Erbland et al., 2013; Frey et al., 2009; McConnell et al., 2017; Spolaor et al., 2021). The latter makes it possible to search for ice-core proxies to explore past changes in stratospheric ozone, which determines surface UV radiation. Nitrate is one of the snow impurities sensitive to UV radiation (Frey et al., 2009; Erbland et al., 2013), and previous studies suggest the effect of the perturbation of snow photochemistry on atmospheric chemistry is largely related to snow nitrate photolysis (Dominé and Shepson, 2002; Grannas et al., 2007; Thomas et al., 2012). Under surface conditions, snow nitrate, which is originally deposited as HNO3, can be photolyzed at a UV range of 280–350 nm (Chu and Anastasio, 2003), and the main product NO2 can quickly reach the overlying atmosphere where it is oxidized to HNO3 again (Zatko et al., 2016; Grannas et al., 2007). The re-produced HNO3 would then be either re-deposited to snow surface or transported away from the site of photolysis (Dibb and Fahnestock, 2004; Erbland et al., 2013; Davis et al., 2004). This nitrate recycling process at the air–snow interface can occur multiple times before NO is permanently buried below the snow photic zone, which is usually 15–60 cm deep, and below this depth more than 95 % of the radiation is attenuated (Erbland et al., 2015; Zatko et al., 2013; Winton et al., 2020).
Snow nitrate photolysis and the recycling of nitrate at the air–snow interface not only changes snow nitrate concentrations, but also alters snow nitrate isotope composition including δ15N, δ18O, and Δ17O (Δ17O =δ18O −0.52 × δ17O) (McCabe et al., 2005; Frey et al., 2009; Erbland et al., 2013; Jiang et al., 2021; Jiang et al., 2022). In particular, the photolysis itself is associated with nitrogen and oxygen isotope fractionation (Erbland et al., 2013). The specific isotope fractionation constant varies with actinic flux and ranges from, e.g., −78.8 ‰ to −47.6 ‰ for δ15N and −34.4 ‰ to −18 ‰ for δ18O in East Antarctica (Frey et al., 2009; Berhanu et al., 2014; Erbland et al., 2015; Shi et al., 2018). The negative fractionation constants mean enrichment in heavier isotopes (e.g., N-15) in nitrate remain in snow after photolysis. For δ18O, the enrichment caused by photolysis is relatively small and the final preserved signal is complicated by oxygen isotope exchange in snow grain and further fractionations/alteration during nitrate recycling. Snow nitrate photolysis does not directly influence Δ17O because it is a mass-independent fractionation signal while photolysis only induces mass-dependent fractionation (McCabe et al., 2005). However, when photolysis occurs, the cage effect leads to oxygen isotope exchange between snow and the intermediate photo-product, lowering snow nitrate Δ17O (Erbland et al., 2013; Frey et al., 2009). In addition, the reformed nitrate from snow-sourced NOx possesses Δ17O reflecting the local oxidation environment, which is usually different from the Δ17O signals carried by nitrate from long-range transport that is the primary source of snow nitrate. Previous studies suggest δ15N is most sensitive to the degree of post-depositional processing (Frey et al., 2009; Winton et al., 2020; Jiang et al., 2021, 2022). This is because the large nitrogen isotope fractionation constant associated with photolysis leads to significant changes in δ15N of snow nitrate even with small amounts of nitrate loss from snow (e.g., Jiang et al., 2021; Erbland et al., 2013).
The degree of photolysis snow nitrate experienced upon archival below the photic zone and the associated isotope effects are mainly determined by three factors including UV radiation, snow accumulation rate, and snow chemical and physical properties (Zatko et al., 2013). Among them, surface UV radiation is determined by total column ozone (TCO) which is largely controlled by the thickness of the stratospheric ozone layer. Jones and Wolff (2003) also suggested that UV radiation has clearly increased nitrate photolysis frequencies in spring/early summer months (particularly in November) during the ozone hole period compared to the pre-ozone hole period. Previous studies suggested δ15N of nitrate preserved in snow and ice cores has the potential to reconstruct past changes in stratospheric ozone given the sensitivity of snow nitrate δ15N to the photo-driven nitrate recycling and loss at the air–snow interface (Frey et al., 2009; Erbland et al., 2015, 2013). Although a recent study suggested that snow nitrate δ15N could be more sensitive to snow accumulation rate than UV level (Winton et al., 2020), over a period with continuous reoccurrence of ozone layer depletion and thus enhanced surface UV levels (e.g., during the Antarctic ozone hole period), snow nitrate δ15N may show detectable responses and serve as evidence of past stratospheric ozone change. In addition, changes in TCO may also leave signals in snow Δ17O(NO). McCabe et al. (2007) found a co-variation in snow pit Δ17O(NO) with TCO at the South Pole with a 2.7-year cycle. A similar cycle of snow Δ17O(NO) was also observed at Dome C in Antarctica, although the cause was not explicitly explored (Frey et al., 2009). These previous studies imply the potential of ice-core nitrate isotopes in reflecting past stratospheric ozone variability.
Ming et al. (2020) explored the response of ice-core nitrate δ15N to possible stratospheric ozone depletions caused by the 1257 CE Samalas volcano eruption but found no detectable signals. However, whether or not the Samalas eruption resulted in stratospheric ozone depletion is unknown. The modeled ozone depletion by Ming et al. (2020) was highly sensitive to the amount of HCl injection to the stratosphere. Moreover, the stratospheric ozone depletion caused by a single volcanic eruption is an episode event and its effects on ice-core nitrate δ15N could be masked by annual variations in the snow accumulation rate as suggested by Ming et al. (2020). A recent study by Shi et al. (2022) measured the snow pit nitrate concentrations and isotopes at Dome A in Antarctica, and there appeared to be responses of nitrate concentrations and isotopes to the Antarctic ozone hole. However, the onsets of the observed changes (i.e., isotopes and column ozone) are not lined up, the model efforts in the study are ambiguous, and it is unclear whether the effects of the ozone hole can quantitatively (or even at the qualitative level) explain the observed changes. In this study, we measured and examined a 60-year nitrate δ15N and Δ17O record covering the period of Antarctic ozone hole from a South Pole ice core. At the South Pole, the snow accumulation rate is relatively low (0.073 w.e. m yr−1) and the effects of post-depositional processing are well observed as reflected by the large differences between atmospheric and snow nitrate isotopes (Walters et al., 2019). Utilizing a snow nitrate photochemical column model (i.e., the TRANSITS model, Erbland et al., 2015), we quantitatively assessed the effects of the Antarctic ozone hole on nitrate isotopes in the record. The study sheds light on the causes of ice-core δ15N and Δ17O variability and the relationships with column ozone density, as well as the potential to use ice-core nitrate δ15N and Δ17O to reconstruct past changes in stratospheric ozone.
2.1 Ice-core data
In the austral summer of 2004/2005, two ice cores were drilled at a site (89.96∘ S, 17.67∘ W) 4.7 km west of the Amundsen–Scott South Pole Station. The two ice cores were less than 10 m apart and named as “SP04C5” and “SP04C6”, respectively. The SP04C5 core was measured for major ions (Na+, NH, K+, Mg2+, Ca2+, Cl−, NO, SO) in the laboratory at South Dakota State University using a continuous flow analysis–ion chromatography (CFA-IC) system (Cole-Dai et al., 2006) and the data have been reported by Ferris et al. (2011). Based on the annual peaks of Mg2+ and Na+ concentrations, the core was dated and the annual snow accumulation rate was estimated (Ferris et al., 2011).
Nitrate isotope analyses were conducted for the SP04C6 core. Given the close proximity of the two cores, we used the ion concentration measurement and dating results of the SP04C5 core to estimate the annual layer thickness and nitrate abundance of the SP04C6 core and prepared annual samples to contain at least 500 nmol nitrate for triplicate isotope analysis. As a result, a total of 62 samples were cut from the top 8.4 m of the SP04C6 core covering the years from 1944 to 2005. The depth resolution of these samples varies from 11 to 38 cm and each sample covers 1 year. Among these samples, 14 contain less than 400 nmol NO and thus were combined with the adjacent samples (Table S1 in the Supplement), resulting in 48 samples for isotope analysis. After cutting, the surface of each sample was cleaned with a bandsaw and the cleaned sample was melted in a clean beaker at room temperature. The nitrate in the meltwater was then concentrated using ion-exchange resin (Frey et al., 2009) and measured for nitrogen and oxygen isotopes using the bacterial denitrifier method with a gold tube at the University of Washington. The processes were identical to those described in Geng et al. (2014, 2015), with analytical precision of ±0.25 ‰ and ±0.57 ‰ for δ15N and Δ17O, respectively, as indicated by repeated measurements of the international nitrate isotope standards IAEA-NO-3 and USGS35.
2.2 TRANSITS model simulations
As shown in Fig. 1, compared to years without an ozone hole (represented by the case in 1976), in years with an ozone hole (represented by the year of 1993), surface actinic flux was significantly enhanced in the summer half year especially in spring when the ozone hole was developed. The stronger surface actinic flux in the ozone hole period presumably would enhance the photo-driven post-depositional processing of snow nitrate and leave more or fewer changes in the isotopes of the preserved nitrate. Here we used the updated version of the TRansfer of Atmospheric Nitrate Stable Isotopes To the Snow (TRANSITS) model (Erbland et al., 2015; Jiang et al., 2021) to explicitly assess the effects of the Antarctic ozone hole on the ice-core nitrate isotope records from South Pole. The model calculated changes in snow nitrate and its isotopes upon archiving due to the photo-driven post-depositional processing. Figure 2 illustrates photo-driven post-depositional processing of snow nitrate as described in the TRANSITS model. Here we conducted a long-term simulation covering the full record of the ice core from 1944 to 2005. This includes the pre-ozone hole period before 1976, the ozone hole period from 1976 to the mid-1990s, and after that a slow recovery of column ozone was observed (Zambri et al., 2020). Throughout the record, key parameters (i.e., snow accumulation rate, column ozone density, and snow e-folding depth) influencing the degree of post-depositional processing were determined as follows.
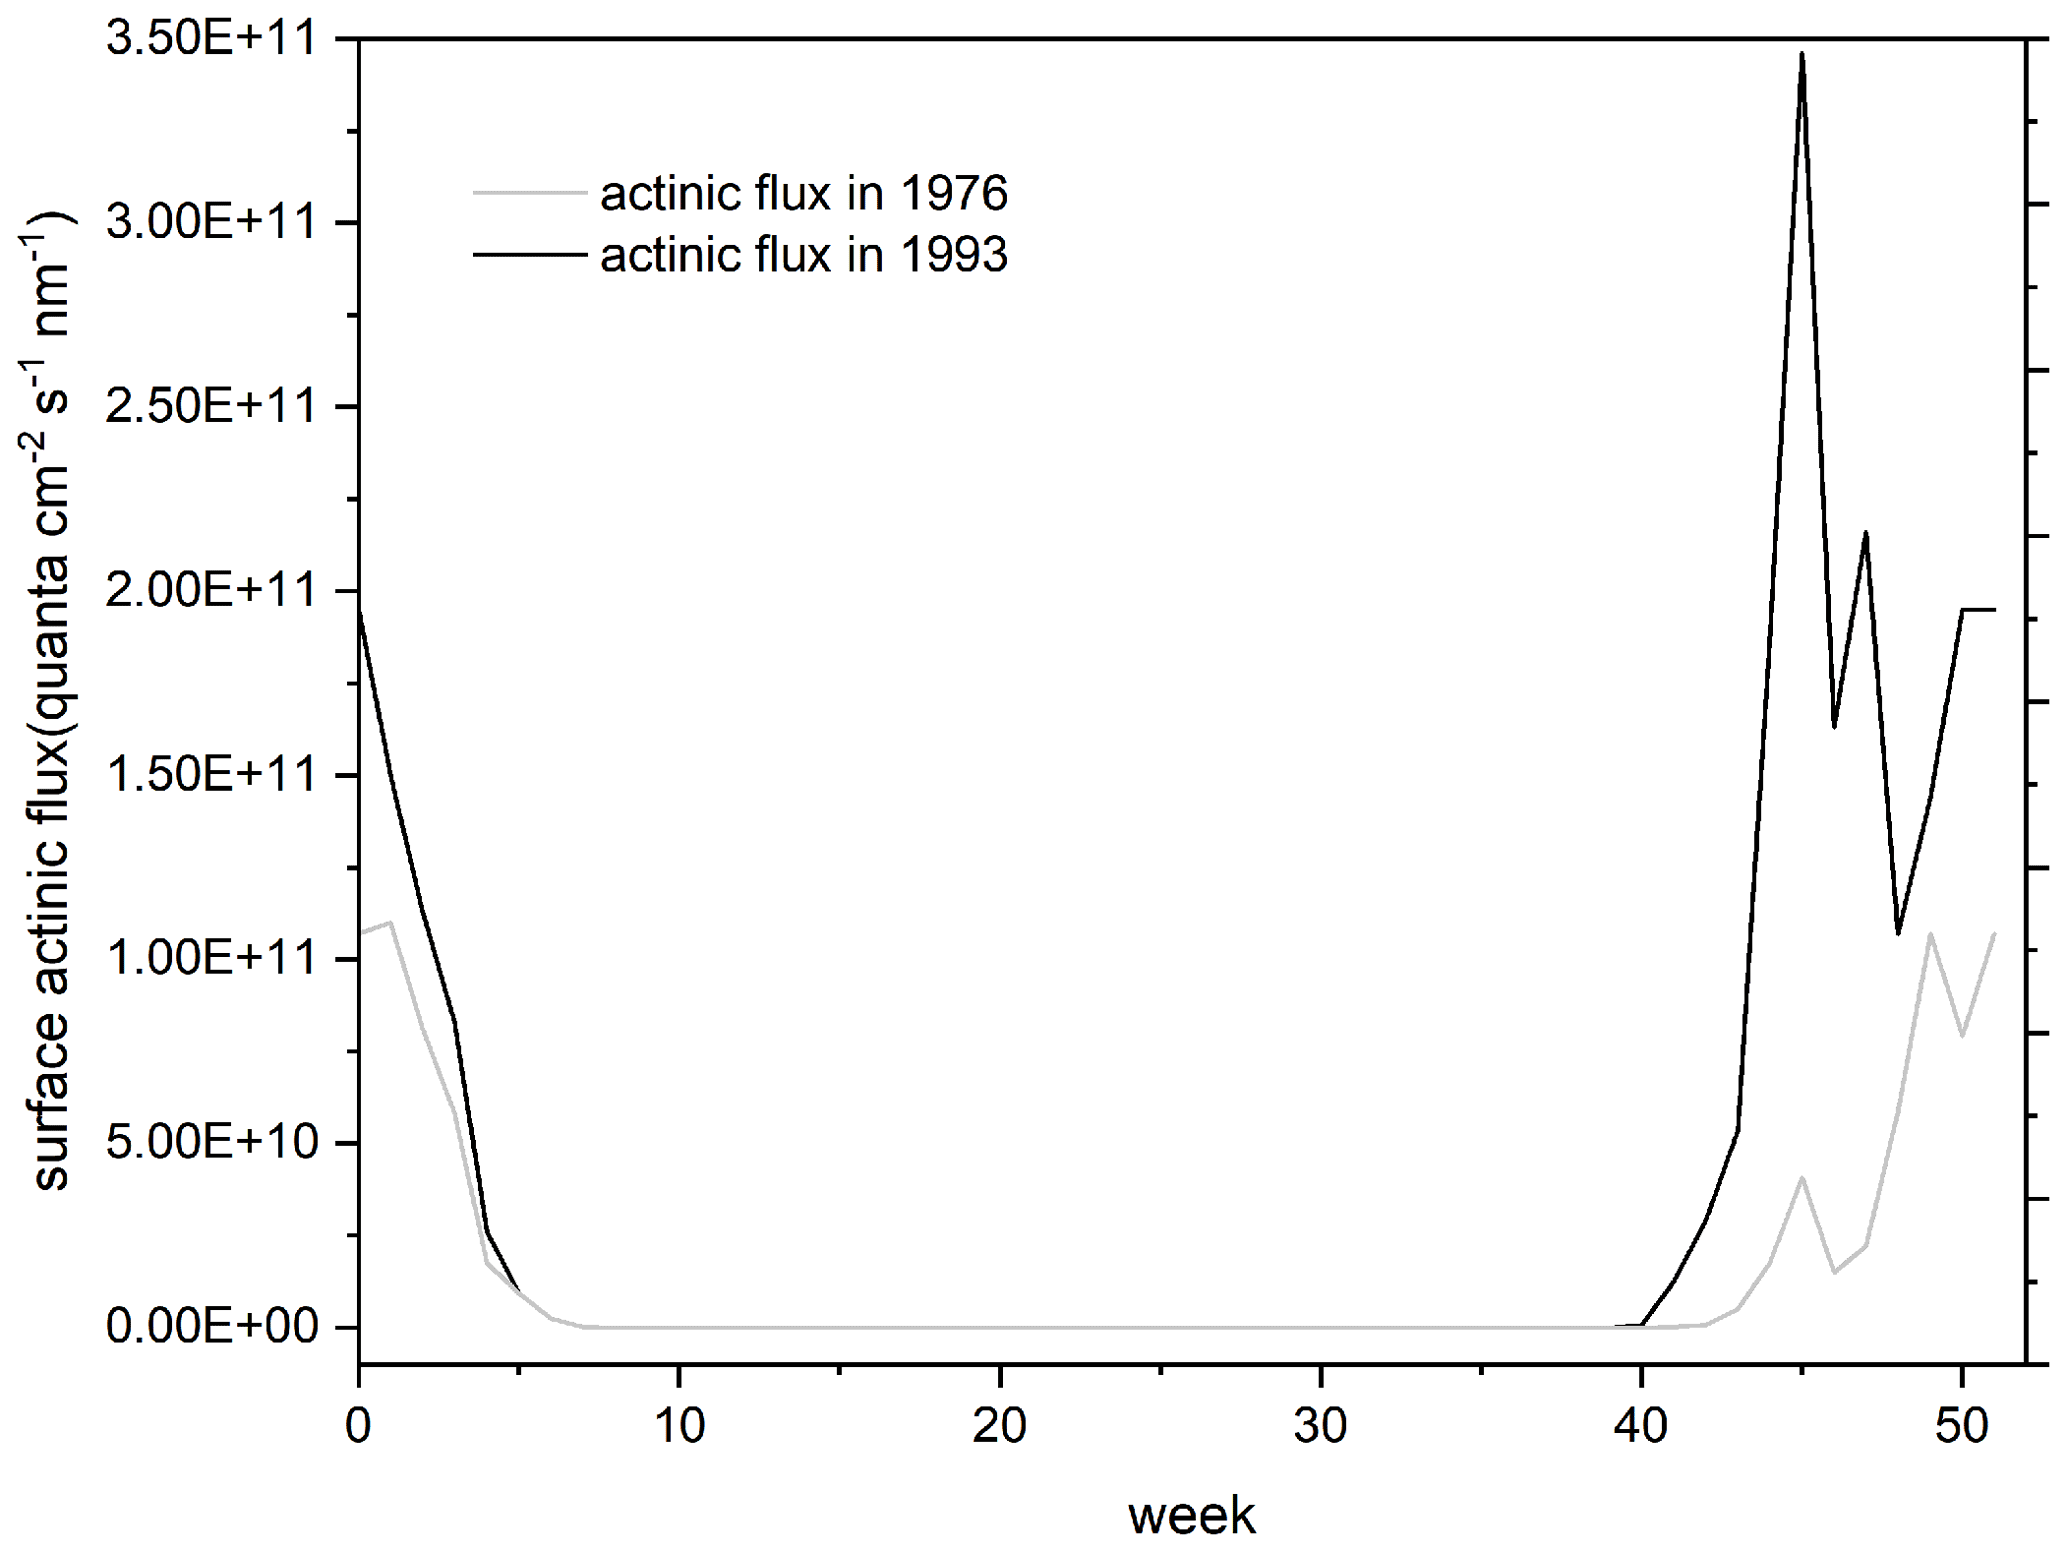
Figure 1Surface actinic flux at a wavelength of 305 nm (the peak wavelength of snow nitrate absorption spectra at the surface) in pre-ozone hole time (1976) and maximum ozone hole year (1993) at the South Pole. Results were calculated from the TUV radiation model.
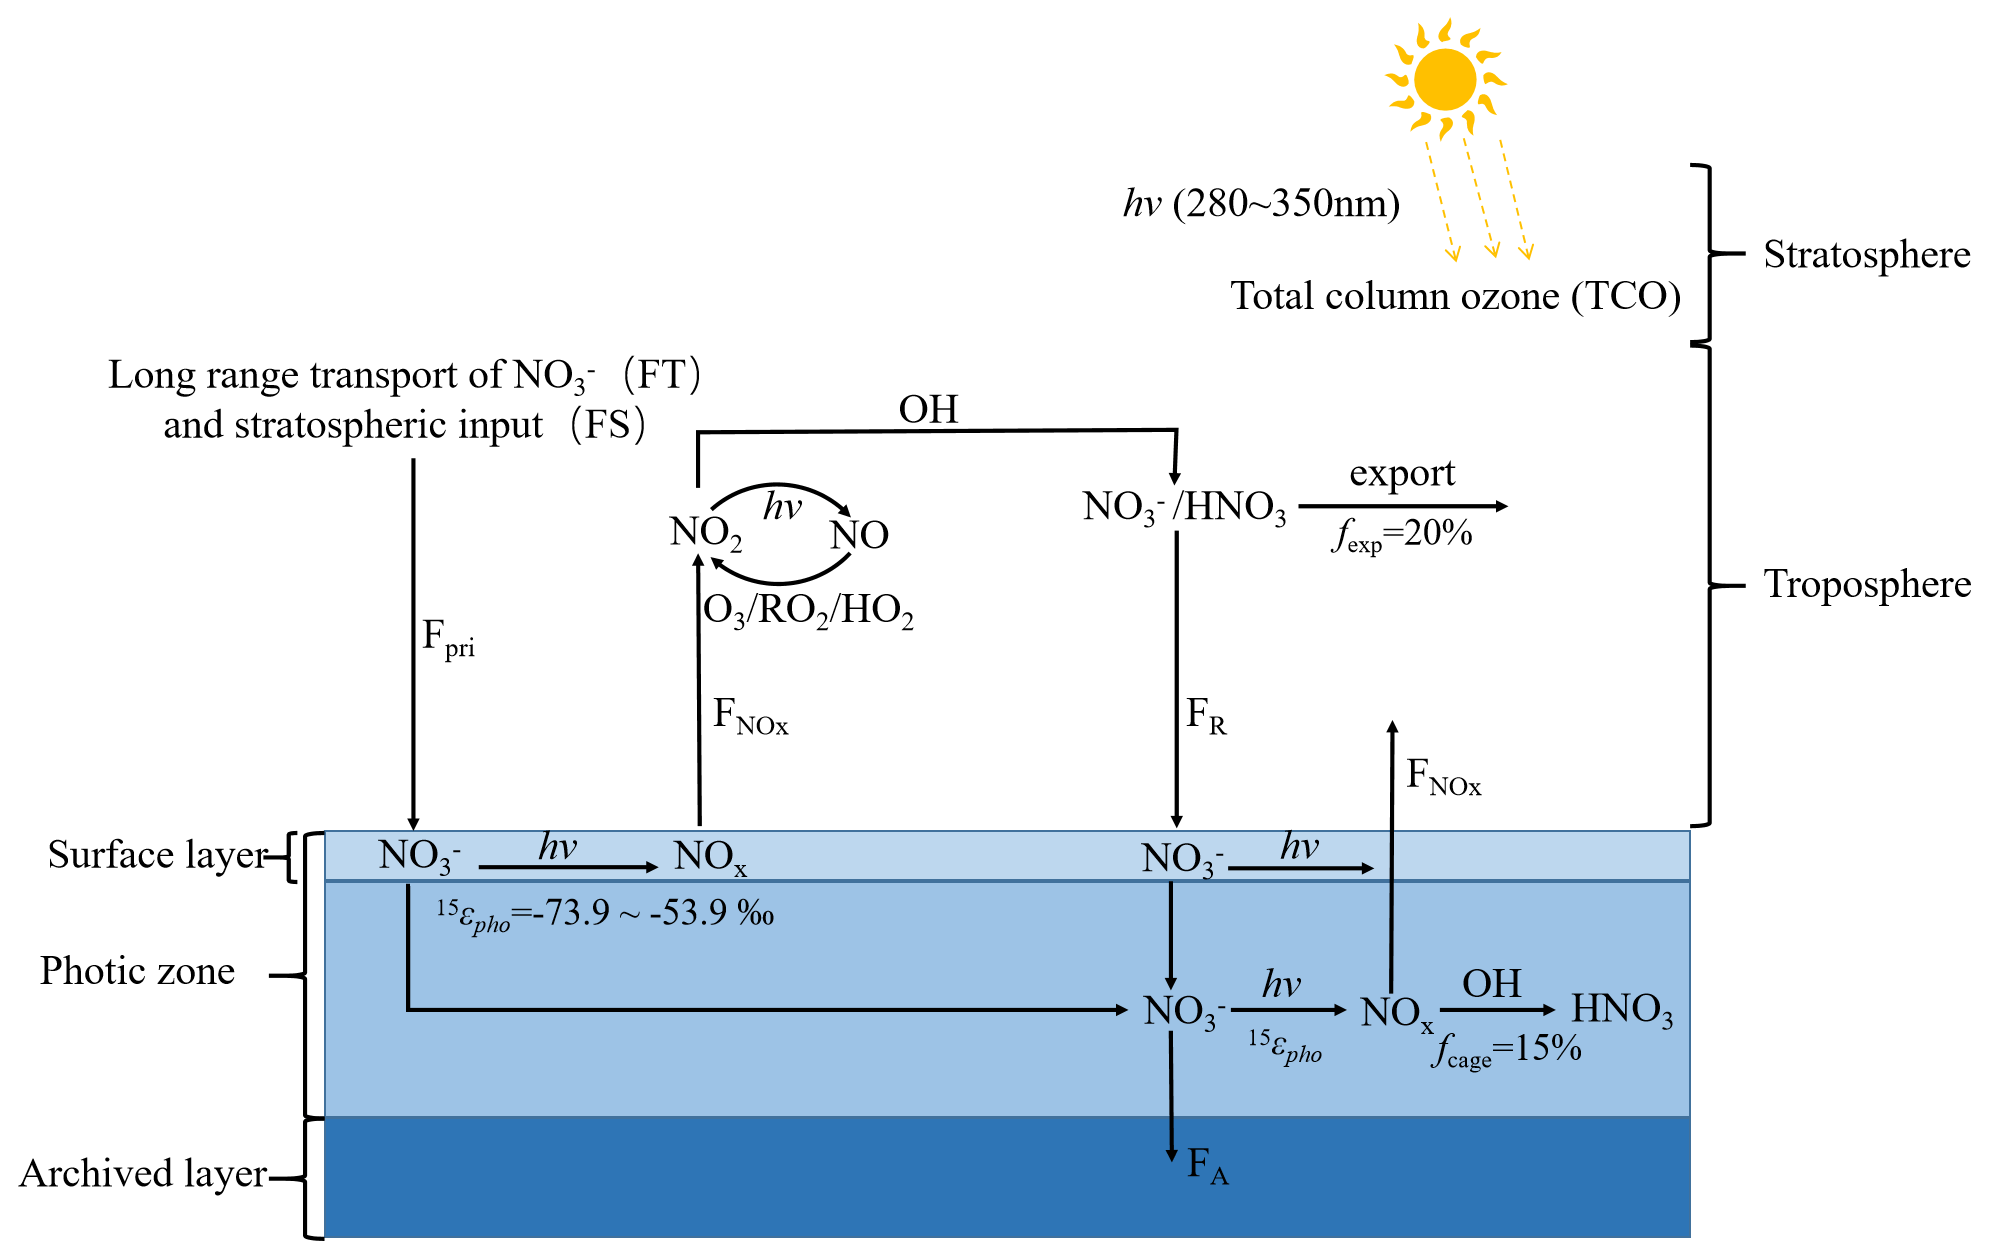
Figure 2Schematic diagram of the photo-driven post-depositional processing of snow nitrate (adapted from Zatko et al., 2016 and Geng, 2022). Details on abbreviations can be found in Table S2.
The annual snow accumulation rate was obtained based on ion concentration measurements and the field-measured density profile of the SP04C5 core as described in Sect. 2.1 and shown in Fig. 3a. TCO density from 1964 to 2005 was obtained from the NOAA ozonesonde dataset (https://www.esrl.noaa.gov/gmd/dv/data.html, last access: 12 October 2022) and the austral spring (when the ozone hole occurs in a year) average TCO over this period is plotted in Fig. 3b. Satellite and/or ground-based ozone observations are not available prior to 1964, and thus in model calculations we just used the averaged TCO during 1964–1975 (i.e., when there was no ozone hole) to represent TCO from 1944 to 1963. The spring TCO (Fig. 3b) record indicates a dramatic decrease from ∼ 300 DU in 1976 to ∼ 150 DU in the mid-1990s, and after that the spring TCO slowly recovered but has not yet returned to the pre-1970 level.
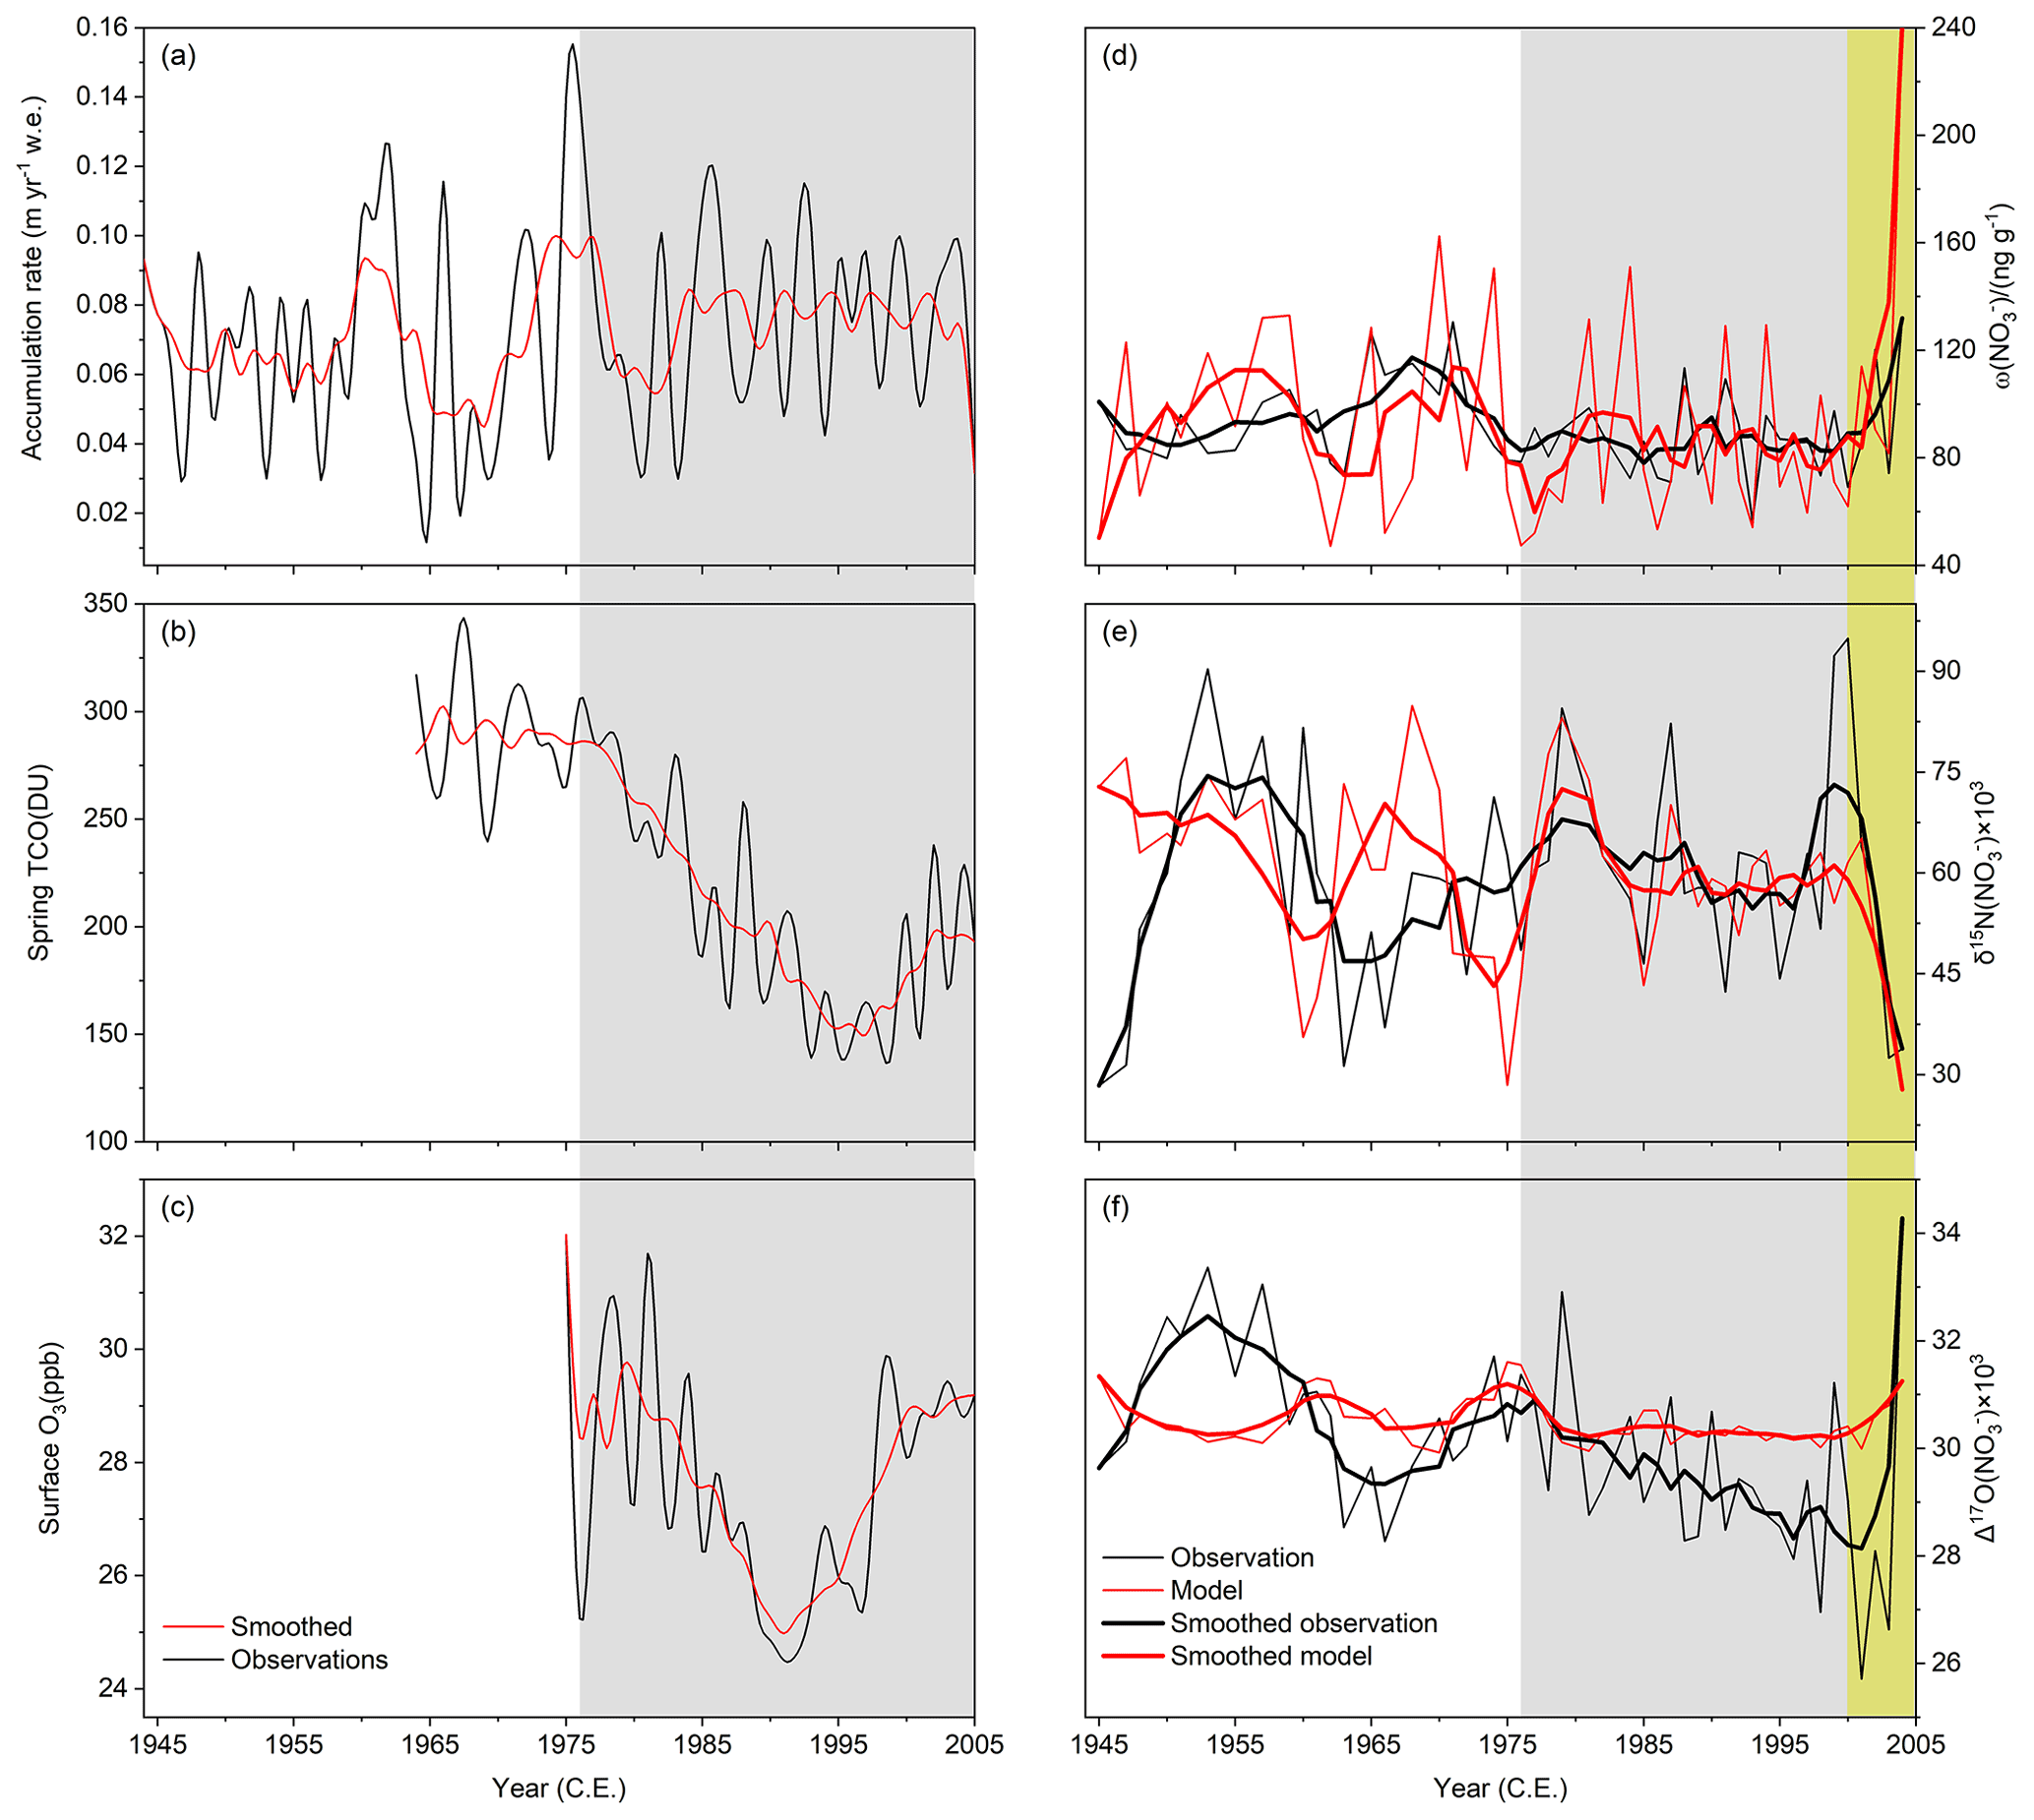
Figure 3(a–c) Time series of annual snow accumulation rate (a), spring (average from 22 September to 13 October) TCO (total column ozone) (b), and summer half-year surface O3 concentrations (c) at the South Pole over the period of the ice-core record. Red curves are the 5-year moving averages. (d–f) Ice-core nitrate concentration and isotopic compositions at the South Pole during 1944–2005 (black: observations; red: modeled). The thin lines represent the observed and modeled annual (d) ω (NO), (e) δ15N(NO), and (f) Δ17 O(NO) from 1944 to 2005. The thick lines represent the 5-year moving averages. Yellow shading represents the period with changes in nitrate concentrations and isotopes from surface snow to below the photic zone. Gray shading represents the ozone hole period.
The e-folding depth of actinic flux in snow is mainly determined by snow density, grain size, and snow light-absorbing impurities (LAIs, e.g., dust and black carbon (BC)) (Zatko et al., 2013). Here, we assumed these factors are constant from 1944 to 2005 and the e-folding depth was the same throughout the record for simplicity, although in this period surface wind speed at the South Pole has a decreasing trend (Fig. S3) which may have affected snow density. However, the effect caused on snow e-folding depth due to changing wind speed is only ∼ 1 cm and the resulting difference in δ15N(NO) is only ∼ 1 ‰ and thus can be ignored (SI). Snow density profile at the ice-core drilling site was measured by Ferris et al. (2011) in the field. Due to the lack of measurement of specific surface area (SSA) of snow grains at the South Pole, we applied the average vertical SSA profile measured at Dome C by Gallet et al. (2011) to estimate snow grain size. For LAIs, we adopted a BC concentration of 0.26 ng g−1 (Casey et al., 2017) and assuming total LAIs are ∼ 10 times of BC to account for non-BC materials following Zatko et al. (2013). As a result, the e-folding depth of actinic flux at 305 nm was calculated to be 20 cm at the South Pole using the Two-stream Analytical Radiative TransfEr in Snow (TARTES) model (Libois et al., 2013), shallower than that estimated by Zatko et al. (2013) (∼ 30 cm at remote South Pole where snow impurity concentrations are relatively low probably due to the distance and thus less pollution from the station). Note that Zatko et al. (2013) applied the Fast-J radiative transfer program, which does not consider the absorption enhancement parameter and geometric asymmetry factor when calculating actinic flux. This may explain the difference in the calculated e-folding depths.
The first-order rate constant of snow nitrate photolysis in the photic zone (60 cm, 3 times e-folding depth) was calculated by the following equation:
where Φ is the quantum yield, σ is the absorption cross section, and I is the actinic flux of a wavelength at a depth of z in the photic zone. We used the absorption cross section of 14NO and 15NO in Antarctic snow at a given temperature reported by Berhanu et al. (2014). The depth- and wavelength-dependent I in snow was calculated by the combination of the Troposphere Ultraviolet and Visible (TUV) radiation model (Madronich et al., 1998) and the TARTES model (Libois et al., 2013). Here we used a quantum yield (Φ) of 0.021 molecular photon−1 to calculate J. This value is within the range of 0.003–0.44 molecular photon−1 as observed in laboratory experiments (Meusinger et al., 2014), and best reproduced the observed ice-core δ15N(NO) values at the South Pole. The nitrogen isotopic fractionation constant 15εpho during nitrate photolysis was calculated as the ratio of 14NO and 15NO photolysis rate constant in each layer (15εpho= J15 J14 −1). The calculated 15εpho varied from −73.9 ‰ to −53.9 ‰ under different solar zenith angles in the summer half-year at the South Pole.
Other parameters, for example, the surface meteorological conditions (e.g., boundary layer height, temperature, pressure, etc.), and atmospheric chemical properties including ozone and radical (e.g., OH, RO2 and HO2) concentrations are also needed to calculate the recycling of nitrate in the overlying atmosphere. In the model, the weekly air temperature and surface pressure were obtained from the Amundsen–Scott South Pole Station Meteorological Observations dataset (http://amrc.ssec.wisc.edu/usap/southpole/, last access: 12 October 2022), and the boundary layer height was set as 81 m, which is the mean observed value during November and December in 2003 (Neff et al., 2018). Surface ozone concentrations from 1975 to 2005 were obtained from the NOAA ozonesonde dataset (https://www.esrl.noaa.gov/gmd/dv/data.html, last access: 12 October 2022) and the summer half-year surface O3 concentrations are shown in Fig. 3c. Data prior to 1975 were extrapolated. The summer half-year average surface O3 concentration record (Fig. 3c) displays a similar trend to spring TCO. Radicals including OH, HO2, RO2, and BrO in the summer half-year were from GEOS-Chem model simulations by Zatko et al. (2016) and assessed using on-site observations by Kukui et al. (2014) and Mauldin et al. (2004) at the South Pole. The radical time series over the period of the ice-core records were then obtained by scaling to local using the relationships between and radicals (Kukui et al., 2014), where local varies with surface actinic flux.
Model input of primary nitrate deposition (Fpri) was set to be kg N m−2 yr−1 to best fit the ice-core nitrate concentrations at the South Pole after considering post-depositional loss. This value is within the range of 0.09– kg N m2 a−1 estimated by Zatko et al. (2016) using the GEOS-Chem model. Sources of Fpri to the Antarctic atmosphere include stratospheric inputs (FS) and the long-range transport (FT) of nitrate (Erbland et al., 2015; Savarino et al., 2007). Due to the absence of direct observed nitrate fluxes of FS and FT to the South Pole, for simplicity, we assumed FS Fpri= 50 % following Erbland et al. (2015). Note that McCabe et al. (2007) estimated that ∼ 25 % of surface snow nitrate at the South Pole is from the stratosphere, but this is an underestimate as in their calculations tropospheric nitrate included snow-sourced nitrate in addition to FT. As estimated by Savarino et al. (2007) and Erbland et al. (2015), δ15N(FS) and Δ17O(FS) values were set equal to 19 ‰ and 42 ‰, respectively. Meanwhile, δ15N(FT) and Δ17O(FT) were set equal to 0 ‰ and 30 ‰, respectively, following previous Antarctic studies (Morin et al., 2009; Erbland et al., 2015; Winton et al., 2020). The fraction of nitrate export was assumed to be fexp= 20 %, consistent with Erbland et al. (2015) and Winton et al. (2020). The cage effect was assumed to be 15 % (i.e., the chance of oxygen isotope exchange with water during snow nitrate photolysis) following the methods adopted in previous studies (Winton et al., 2020; Erbland et al., 2015; Jiang et al., 2021). It should be noted that we did not consider their long-term variability for model simplicity. What is more, these are all adjustable starting values justified according either to local observations or previous studies. Starting from these values, the model computes changes of nitrate isotopes upon archiving beneath the snow photic zone. Modeled changes in nitrate isotopes after deposition are independent of the starting values but determined entirely by the degree of post-depositional processing experienced before archiving (Fig. S1). Model input parameters are listed and described in Table S2.
3.1 Ice-core observations
The ice-core records cover the years 1944 to 2005 CE. During this period, the annual snow accumulation rate (Fig. 3a) varied significantly from year to year (0.021–0.140 w.e. m yr−1) (w.e. = water equivalent depth) with a mean of (0.073 ± 0.029) w.e. m yr−1 (1σ) Using on-site stake network measurements at the South Pole station, Mosley-Thompson et al. (1995) found the average snow accumulation rate at the South Pole in the period 1978–1990 to be ∼ 0.086 w.e. m yr−1, higher than the mean of ∼ 0.065 w.e. m yr−1 in the 1960s, suggesting a 32 % increase. This appears to be consistent with our record from which the mean snow accumulation rate after 1976 (the beginning of the springtime ozone hole) was (0.078 ± 0.026) w.e. m yr−1 (1σ), slightly higher than before 1970 (0.066±0.030) w.e. m yr−1 (1σ), although the stake measurements indicate a larger increase than our ice-core records.
Figure 3d–f show the South Pole ice-core records of annual nitrate concentrations (ω(NO) and isotopes (i.e., δ15N(NO) and Δ17O(NO) from 1944 to 2005, respectively. From 2005 to ∼ 2000, there is a decreasing trend in ω(NO) and Δ17O(NO) while δ15N(NO) increases. These are similar to the patterns of snow nitrate concentrations and isotopes versus depth observed at the East Antarctic Plateau (e.g., Morin et al., 2009; Erbland et al., 2013). Throughout the 62-year record, ω(NO) ranged from 56.8 to 132.0 ng g−1 with an average of (92.7 ± 18.5) ng g−1 (1σ). This is within the range of a recent South Pole ice core of (58–169) ng g−1 (Winski et al., 2019) and a 2002 SPRESSO ice core (averaged at ∼ 100 ng g−1) drilled at the South Pole (Jarvis, 2008). All of these ice-core results are, however, lower than ω(NO) of (∼ 100–200) ng g−1 in a 6 m snow pit (1977–2003) at the same site reported by McCabe et al. (2007). In comparison, surface snow nitrate concentrations up to 400 ng g−1 have been reported by McCabe et al. (2007) and Jarvis (2008).
From 1944 to 2005, δ15N(NO) varied from 28.4 ‰ to 94.9 ‰ with an average of (59.2 ± 29.3) ‰ (1σ). This range and the average are also consistent with the SPRESSO ice core ranging from 42 ‰ to 94 ‰ with a mean of (66.2±13.0) ‰ (1σ), except that the very top sample of the SPRESSO ice core possesses δ15N(NO) of −4.4 ‰ (Jarvis, 2008) which is much lower than the very top sample of our ice core of (33.8 ± 0.5) ‰ (1σ). This is likely due to the fact that our top sample was not actually from surface snow, but covered the first ∼ 40 cm that represents the weighted mean of snow nitrate in 2004 and part of 2005. In comparison, atmospheric δ15N(NO) at the South Pole ranged from −60.8 ‰ in summer to 10.5 ‰ in winter (Walters et al., 2019). Due to the sparse nature of the atmospheric δ15N(NO) data, we cannot calculate annual means and compare them with our ice-core data.
From 1944 to 2005, Δ17O(NO) varied from 25.7 ‰ to 34.3 ‰ with a mean of (30.0±1.7) ‰ (1σ). Although this range of Δ17O(NO) is within that in the 6 m snow pit (20.6 ‰–33.1 ‰) reported by McCabe et al. (2007), the mean value in our ice core is higher than the mean of (25.5 ± 2.1) ‰ (1σ) in the snow pit (McCabe et al., 2007). This may be due to spatial variability of the samples but we cannot assert the true reason here without more information on sampling and experimental details. Despite this, the ice-core record indicates a decrease in Δ17O(NO) by ∼ 4 ‰ from the surface snow to the average below the photic zone in the ice core, while the snow pit record in McCabe et al. (2007) indicates a similar decrease of ∼ 4 ‰, from 29.3 ‰ in the surface snow to the mean of (25.4 ± 1.9) ‰ (1σ) below 61 cm depth, which is also below the photic zone. These values more or less reflect the degree of Δ17O(NO) reduction upon archival at the South Pole. In addition, our ice-core Δ17O(NO) record displays a small long-term decreasing trend especially after 1976, and from ∼ 1976 to 2000 Δ17O(NO) decreased by about 3.4 ‰. Atmospheric Δ17O(NO) at the South Pole ranged from 21.8 ‰ in summer to 41.1 ‰ in winter (Walters et al., 2019). Unfortunately, the atmospheric data were sparse (only 7 in a year) and one sample represented only 1 week, and thus direct comparisons with the ice-core annual data cannot be made here.
3.2 Modeled results
In Fig. 3d–f, we also plotted the modeled annual ω(NO), δ15N(NO), and Δ17O(NO) from 1944 to 2005. As shown in Fig. 3d–e, the modeled ω(NO) and δ15N(NO) records capture the long-term variabilities of the observations, including the patterns in the first few years (i.e., from 2005 to ∼ 2000 the ω(NO) decrease and δ15N(NO) increase). During the study period, the modeled average ω(NO) and δ15N(NO) are (91.4 ± 38.1) ng g−1 (1σ) and (59.1 ± 12.8) ‰ (1σ), respectively, similar to the observations. The modeled long-term trend in δ15N(NO) is also similar to the observation and displays no expected response (i.e., increase) in the period of the Antarctic ozone hole (i.e., after ∼ 1976); while for Δ17O(NO) (Fig. 3f), the model did not reproduce the observed decreasing trend from ∼ 1976 to 2000.
In addition, in comparison with the isotope signals of Fpri, the preserved δ15N(NO) in the record (both observed and modeled) was enriched by ∼ 50 ‰. This appears to be smaller than the difference between the observed surface snow δ15N(NO) of −4.4 ‰ (Jarvis, 2008) and snow δ15N(NO) of ∼ 60 ‰ below the photic zone. This is because surface snow nitrate is affected by snow-sourced nitrate which is depleted in δ15N(NO) (as low as −60 ‰; Walters et al., 2019). For the modeled Δ17O(NO), on the other hand, the ice-core mean was reduced by ∼ 5.5 ‰ compared to that of Fpri, and this level of reduction appears to be larger than the observed ∼ 4 ‰ reduction from surface snow to that below the photic zone. Again, this is because surface snow nitrate is influenced by snow-sourced nitrate which possesses lower Δ17O(NO) than Fpri and is not accounted for in the model.
4.1 Effects of post-depositional processing at the South Pole
As shown in Fig. 3d–e, the observed and modeled ω(NO) and δ15N(NO) exhibit similar trends from 2005 to ∼ 2000 (in the top meter of the ice core), i.e., decreases in ω(NO) while increases in δ15N(NO). Moreover, the observed Δ17O(NO) also displays a decreased trend which was not reproduced in the model (Fig. 3f). These features are consistent with the expected effects of post-depositional processing. Summer surface snow ω(NO) at the South Pole was reported to be up to ∼ 400 ng g−1 by McCabe et al. (2007) and Jarvis (2008), this value is about 4 times the ice core mean ω(NO) of (92.7 ± 18.5) ng g−1 (1σ). This difference suggests significant loss of snow nitrate before archiving, but the degree of loss cannot be estimated using these numbers because the summer high ω(NO) is due to the re-deposition of snow-sourced nitrate (i.e., the recycling of nitrate at the air-/snow interface) in addition to that of primary nitrate.
Regarding the annual net nitrate mass loss (floss) before archiving, we calculated it as follows:
where FA represents the archival flux of nitrate (Fig. 2); the TRANSITS model calculated a mean 42.8 % net loss throughout the record, and the floss was ∼ 45 % in the period of the ozone hole which is slightly higher than that of ∼ 41 % before the ozone hole period. This degree of loss is similar to that (∼ 40 %) estimated by Wolff et al. (2002) using a simplified photochemical model at the South Pole, but slightly higher than the post-depositional loss of nitrate (∼ 37 %) calculated using the approach of Weller et al. (2004). Together with the above estimated level of mass loss, on average the modeled ice-core δ15N(NO) was enriched by ∼ 50 ‰ compared to Fpri and Δ17O(NO) was depleted by 5.5 ‰ before archiving. The modeled Δ17O(NO) depletion was from two parts: ∼ 3.7 ‰ was caused by the reformation of nitrate in the overlying atmosphere which produces nitrate mainly by OH oxidation with relatively low Δ17O(NO), and ∼ 1.8 ‰ was caused by oxygen isotope exchange with snow grains during photolysis (i.e., the cage effect). In all, the model predicts that at the South Pole, ∼ 40 % of nitrate is lost through post-depositional processing inducing significant changes in snow nitrate isotopes compared to atmospheric nitrate.
4.2 Modeled effects of the ozone hole on the δ15 N(NO) and Δ17O(NO) records
As discussed in the previous section, snow and ice-core nitrate at the South Pole experiences a significant degree of post-depositional processing that is determined by surface UV radiation (which is in turn influenced by TCO), snow accumulation rate, and snow LAIs. At the South Pole, the TCO record indicates the spring ozone hole started to occur ∼ 1976 (Fig. 3b), and recurred every spring with an increasing level of depletion until the mid-1990s. Since the mid-1990s, the ozone hole started to recover but by the end of the record TCO was still lower than that before the 1970s. If other parameters had remained constant, given these changes in the springtime TCO levels, presumably the degree of post-depositional processing should have been enhanced over the period of the ozone hole, and decreases in ω(NO) with corresponding increases in δ15N(NO) and decreases in Δ17O(NO) should be expected. However, as shown in Fig. 3d–e, neither the ω(NO) record nor the δ15N(NO) record shows expected responses to the ozone hole (shaded area in the figure). In comparison, the observed Δ17O(NO) record indicates a decreasing trend starting approximately with the onset of the ozone hole (Fig. 3f, black lines). This appears to be qualitatively consistent with the expected effects of the ozone hole, but the model with consideration of the ozone hole did not reproduce any apparent decreases in Δ17O(NO) in the period of the ozone hole (Fig. 3f, red lines).
A recent study at the DML station in Antarctica indicates that at this site the preserved snow/ice-core δ15N(NO) is more sensitive to the snow accumulation rate compared to TCO (Winton et al., 2020). Throughout our record, the mean annual snow accumulation rate during 1976–2000 was (0.078±0.027) w.e. m yr−1 (1σ), slightly higher than that of (0.066 ± 0.030) w.e. m yr−1 (1σ) before 1970. This alone would lead to a mean decrease in the preserved δ15N(NO) by ∼ 9.0 ‰ as a result of the shortened duration of nitrate in the photic ozone, assuming TCO was the same before and after 1976 (Fig. 4a, dashed blue line). Meanwhile, if we assume the snow accumulation rate had stayed the same throughout the record, the changes in the springtime TCO after 1976 would lead to a maximum increase in the preserved δ15N(NO) by ∼ 6.9 ‰ (Fig. 4a, dashed green line). These sensitivity tests suggest the overall effect of the ozone hole on preserved δ15N(NO) is nevertheless small compared to the observed δ15N(NO) values and variability, and this effect has been offset by the effects of the increased snow accumulation rate over the same period (i.e., blue and green lines in Fig. 4 cancel each other after 1976 and make the red line in the model). In addition, in comparison with the maximum level of changes in the preserved δ15N(NO) that could be caused by the ozone hole, annual snow accumulation rate variations at the South Pole can lead to ±14.3 ‰ (1σ) annual δ15N(NO) variability, which is also larger than the maximum effects of the ozone hole on preserved δ15N(NO). These together mask the effect of the ozone hole although it was gradually enhanced from ∼ 1976 to ∼ 2000, and they explain why the observed and modeled δ15N(NO) records display no response to the ozone hole.
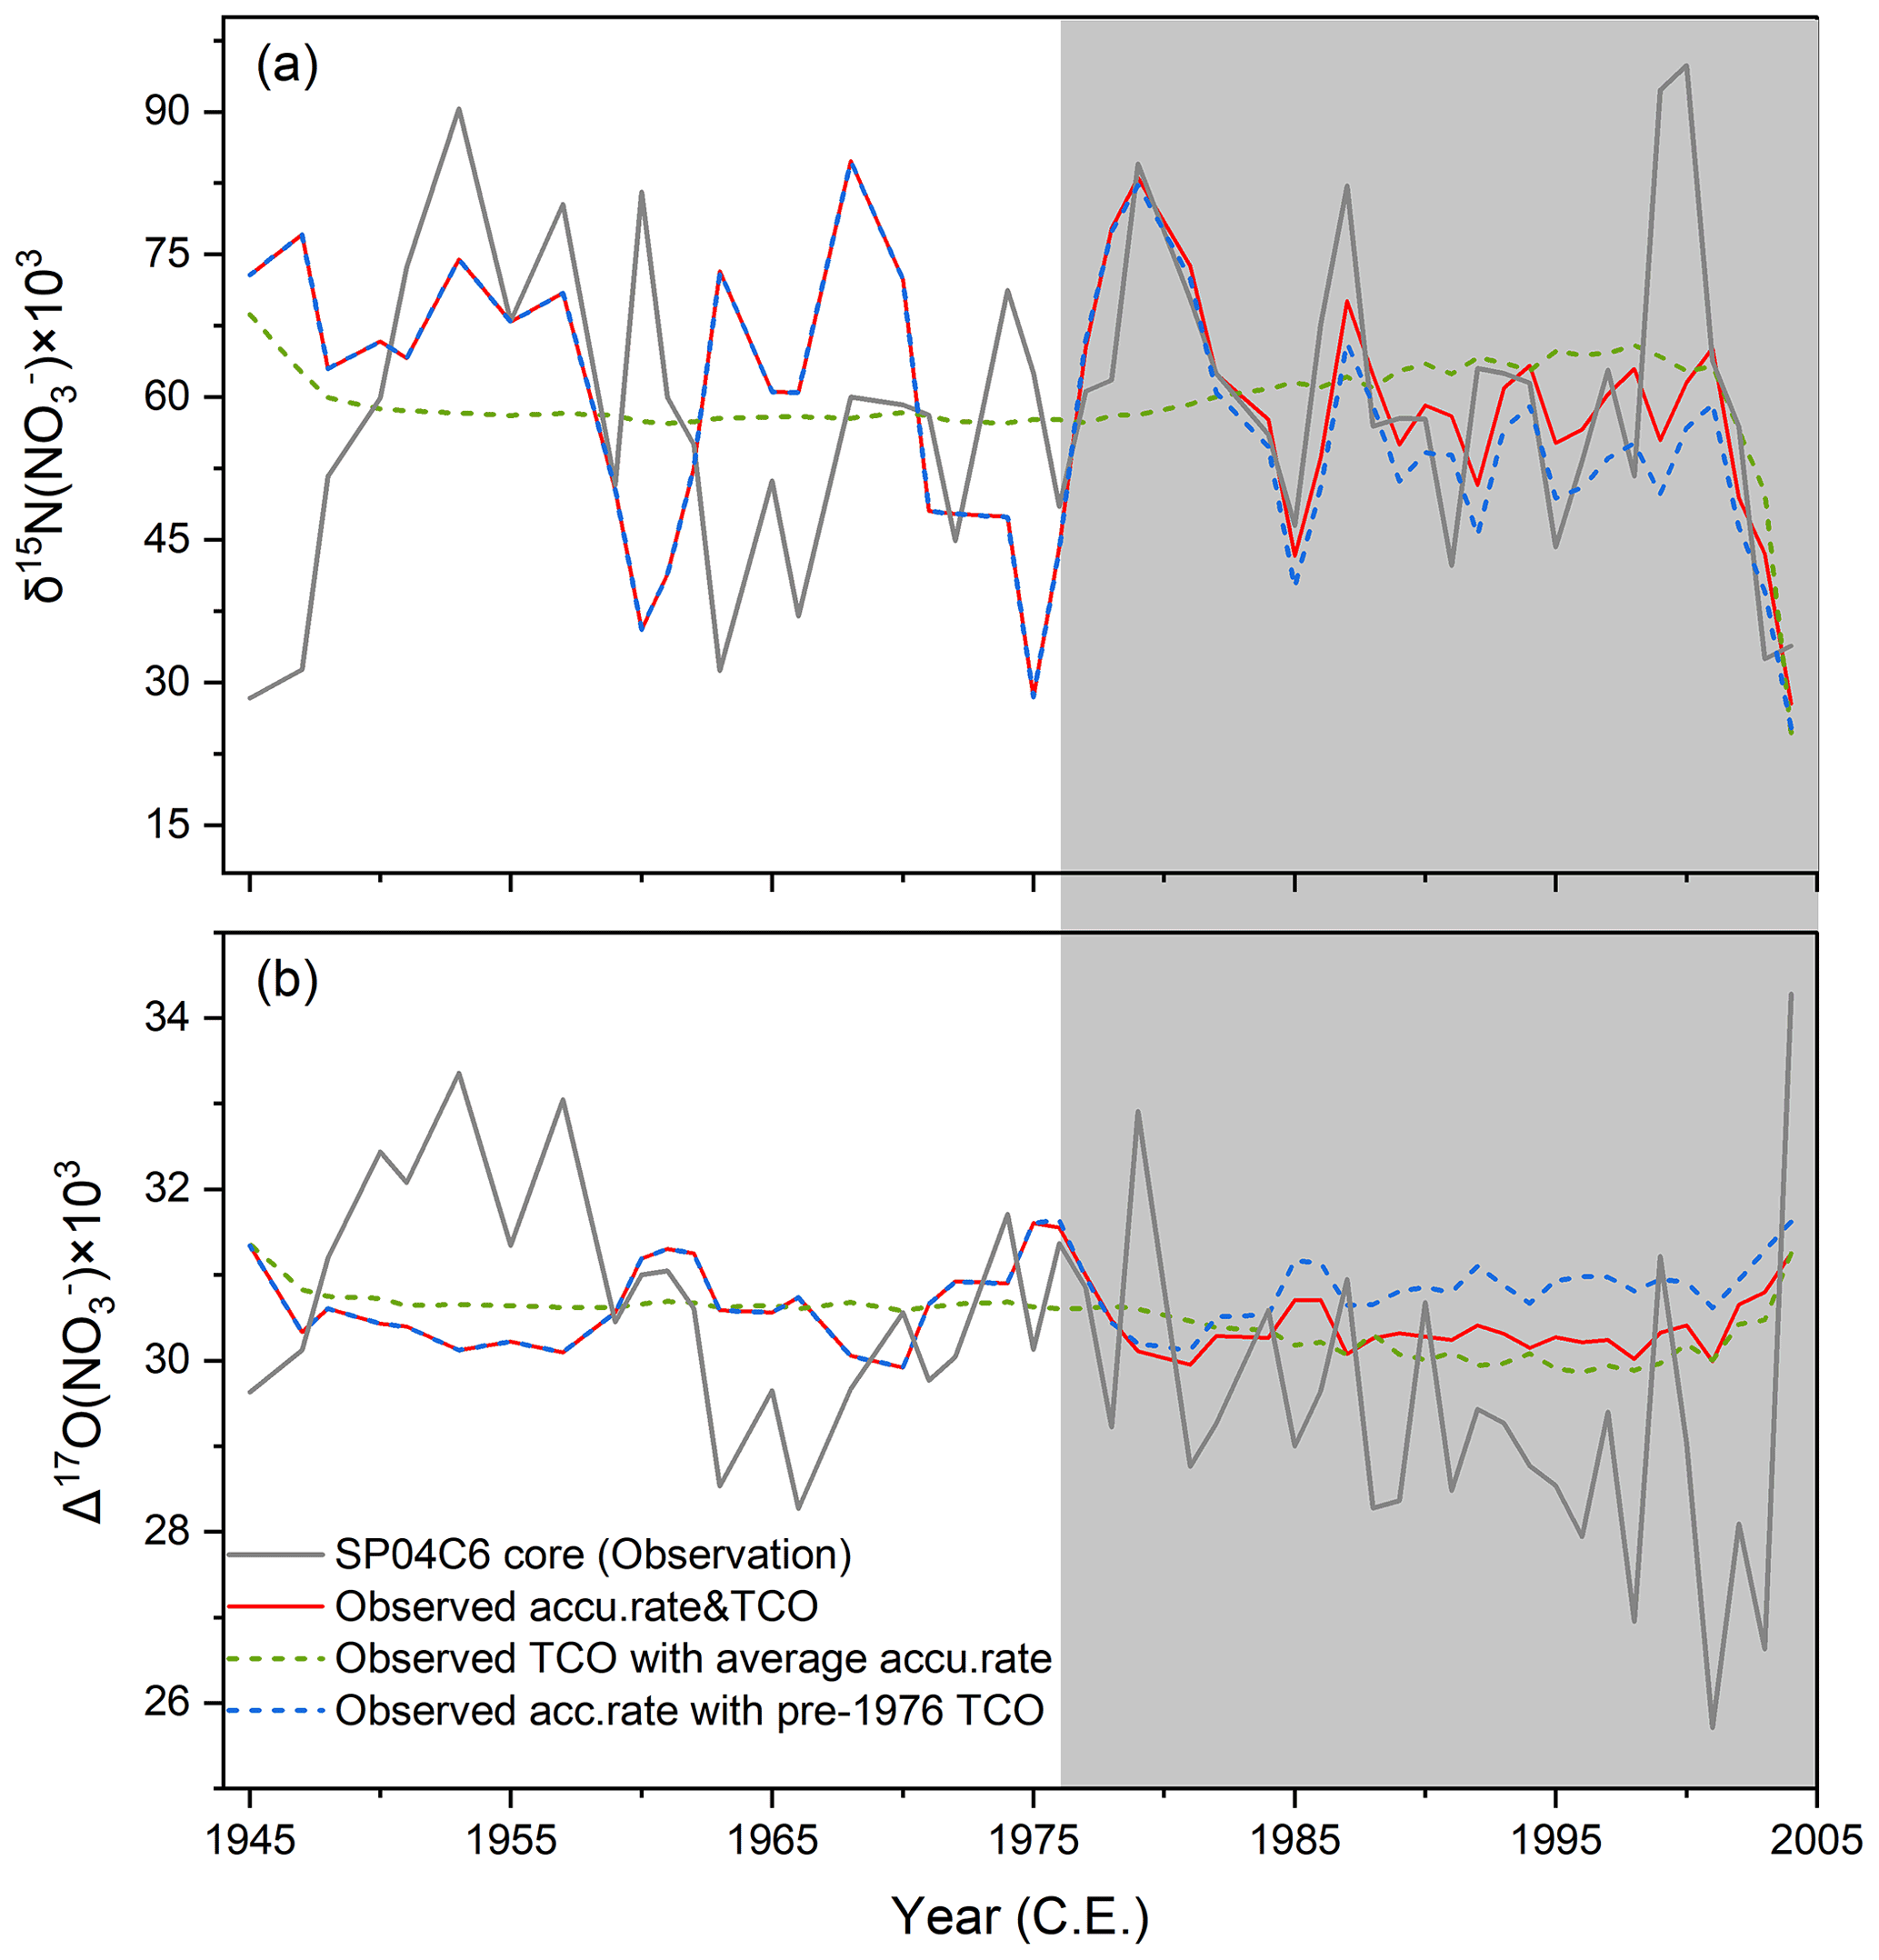
Figure 4Sensitivity results of the modeled isotopes, i.e., δ15N(NO) (a) and Δ17O(NO) (b), to TCO and snow accumulation rate. Gray curve: ice-core observed record; Red curve: modeled results with observed accumulation rate and TCO; Green curve: modeled results with observed TCO but mean accumulation rate throughout the record; Blue curve: modeled results with observed accumulation rate but TCO was kept the same before and after 1976. Gray area represents the ozone hole period.
In contrast to δ15N(NO), the preserved Δ17O(NO) is affected by the post-depositional processing mainly through recycling of nitrate in the overlying atmosphere and the cage effect. Over the period of the ozone hole, enhanced surface UV radiation tended to enlarge the cage effect; at the same time, recycled nitrate formed in the overlying atmosphere was also affected by the decreases in surface O3 and increases in HOx radicals. These changes both tend to lower Δ17O(NO). Nevertheless, the model did not reproduce the observed Δ17O(NO) decrease from ∼ 1976 to ∼ 2000. Even without considering the slightly higher snow accumulation rate in the 1980s and 1990s, the modeled Δ17O(NO) in the ozone hole period was only ∼ 0.8 ‰ lower than that before 1970 (Fig. 4b, dashed green line). These results suggest that the Antarctica ozone hole has not left any apparent signals in Δ17O(NO) either. Note the model did not consider long-term trends in e-folding depth that is determined by snow LAIs (e.g., BC and dust) because snow LAIs at the South Pole have stayed relatively constant in the past few decades (Winski et al., 2021). Changes in the export fraction of the snow-sourced nitrate (fexp) would also affect the final preserved δ15N(NO) and Δ17O(NO), but how this has changed in the past is unknown. The fexp determines how much of the reformed nitrate is recycled back to snow, and the archived δ15N(NO) increases with increasing fexp, while the archived Δ17O(NO) responds oppositely but with a smaller degree of response (Jiang et al., 2021). The fact that only a 3.4 ‰ decrease in Δ17O(NO) but no changes in δ15N(NO) were observed excludes the possible effects of a varying fexp on the observed decrease of Δ17O(NO).
In all, the above analysis indicates that the Antarctica ozone hole has not left detectable signals in ice-core δ15N(NO) and Δ17O(NO) at the South Pole. For δ15N(NO), this is mainly because the signal was offset by changes in the snow accumulation rate occurring at the same time, in addition to the fact that the ozone hole effects on δ15N(NO) are overall small. For Δ17O(NO), the effects of the ozone hole were nevertheless small, i.e., only ∼ 0.8 ‰ additional Δ17O(NO) reduction in the model even without considering the consequences of the changing snow accumulation rate.
4.3 Estimated effects of the ozone hole on snow nitrate isotopes in other Antarctic sites
In order to search for signals of the ozone hole, we used the TRANSITS model to further explore the maximum possible responses of ice-core preserved δ15N(NO) and Δ17O(NO) to the ozone hole at other Antarctic sites, including Dome A, Dome C, Vostok, Dome Fuji, and the West Antarctic Ice Sheet (WAIS) Divide in addition to the South Pole. The responses are defined as the differences between the isotopes before the ozone hole period and in the year with the most depletion. The results are listed in Table 1. As shown in the table, except for the WAIS Divide, all other sites display bigger responses to the ozone hole,especially the three East Antarctic Plateau sites. These patterns are mainly determined by the differences in snow accumulations rates at these sites (Frezzotti et al., 2013; Erbland et al., 2015; Shi et al., 2022), i.e., lower snow accumulation rates correspond to longer durations of nitrate in the photic zone, leading to larger effects of the ozone hole. In particular, at Vostok, Dome C, and Dome A, the ozone hole alone can result in enrichments in δ15N(NO) by 31.2 ‰, 30.7 ‰ and 26.5 ‰, respectively. These values are higher than that (∼ 6.9 ‰) at the South Pole, and since the effects of the ozone hole were gradually increased given the enhanced level of depletion from ∼ 1976 to the mid-1990s, a gradual increase in δ15N(NO) might still be possibly detected as long as the snow accumulation rate at these sites stayed relatively constant before and during the period of the ozone hole. However, at East Antarctic Plateau sites (i.e., Vostok, Dome C, and Dome A) where snow accumulation rates are extremely low, δ15N(NO) of preserved nitrate is above 300 ‰. It would be difficult to determine changes of ∼ 30 ‰ out of more than 300 ‰, especially considering the increasing pattern of snow accumulation rate in the East Antarctic Plateau since the ∼ 1970s (Thomas et al., 2017) and the fact that ice-core δ15N(NO) is very sensitive to the snow accumulation rate (Akers et al., 2022). Nevertheless, a recent study by Shi et al. (2022) reported snow pit nitrate concentration and isotopes at Dome A, where nitrate concentrations in the 1990s and later decreased by close to one-third compared to those in the 1970s (i.e., ∼ 18–∼ 12 ng g−1), with 20 ‰–30 ‰ increases in δ15N(NO) and >5 ‰ decreases in Δ17O(NO). These appear to be qualitatively consistent with the effects of the ozone hole. However, our analyses indicate that changes in nitrate mass do not agree with the degree of isotope changes resulting from the photo-driven post-depositional processing. For example, our preliminary calculations using the TRANSITS model suggest that at Dome A the ozone hole can only induce a maximum of 2.8 ng g−1 decrease in nitrate concentration, and as little as 0.9 ‰ decrease in Δ17O(NO). These results imply there are probably other factors regulating the observed nitrate concentration and isotopes at Dome A. Shi et al. (2022) also conducted a TRANSITS modeling study, but the model parameters are not clear, e.g., snow e-folding depth, quantum yield of snow nitrate photolysis, and the modeled results cannot be reproduced given the local Dome A conditions we compiled. For example, Shi et al. (2022) stated when modeling the Dome A situation that similar parameters to Dome C (Erbland et al., 2015) were used except for snow accumulation rate and TCO. However, the quantum yield is 0.026 (Erbland et al., 2015), and using this same quantum yield at Dome A will give a predicted δ15N(NO) value of 1150 ‰ in preserved snow, 3 times higher than the observations and the modeled results of Shi et al. (2022). In addition, Shi et al. (2022) did not present the modeled results of Δ17O(NO) although the model is able to predict Δ17O(NO). A comprehensive modeling effort in combination with more thoughtful analyses on the observed data is necessary to investigate whether the signals can be detected at Dome A.
Table 1Model-calculated maximum isotope changes resulting from the Antarctic ozone hole (i.e., the differences between isotopes in the pre-ozone hole period and those in year with the most depletion) at different Antarctic sites.

* The depletion refers to the difference of the spring TCO before the ozone hole period (use that in 1979 as the representative) and that in the year 1998 when the ozone hole was the largest.
4.4 Causes of the observed deceases in Δ17O(NO)
No apparent long-term changes in ice-core ω(NO) and δ15N(NO) most likely reflect that the main nitrate sources to the South Pole and post-depositional effects have not changed in the study period. The observed decreases in Δ17O(NO) thus should be caused by non-local processes other than local snow and atmospheric chemistry. Non-local processes are related to nitrate chemistry that controls Δ17O(NO) in the source regions, as well as atmospheric transport of nitrate to the South Pole. In the discussion that follows, we investigate possible reasons for the observed deceases in Δ17O(NO) with respect to the possible effects of nitrate chemistry in source regions and atmospheric transport.
4.4.1 Effects of primary nitrate inputs
Stratospheric and tropospheric circulation patterns in/around Antarctica in the past few decades have both changed due to the effects of greenhouse warming and/or the ozone hole (Butchart, 2014; Bitz and Polvani, 2012). This would have altered the relative contributions of stratospheric and tropospheric nitrate to the South Pole, with consequences for Δ17O(NO) of primary nitrate and thus the ice-core Δ17O(NO).
Stratospheric nitrate in general possesses higher Δ17O(NO) than tropospheric nitrate (McCabe et al., 2007; Savarino et al., 2007). Therefore, reduced stratospheric nitrate input to the South Pole tends to lower Δ17O(NO). Stratospheric nitrate input is related to the formation and deposition of polar stratospheric clouds (PSCs) (Jacob, 1999). In the lower part of the stratosphere, polar stratospheric clouds (PSCs) are formed in Antarctic winter when stratospheric temperature falls below 197 K. PSCs containing nitric acid trihydrate (NAT) can grow sufficiently large and fall out of the stratosphere and be deposited on the snow surface (Jacob, 1999). This is the so-called stratosphere denitrification, which can lead to a late winter/early spring nitrate concentration maximum in Antarctic snow as has been observed (Mulvaney and Wolff, 1993). Observations of abnormally high values of atmospheric Δ17O(NO) in winter/spring across many sites in Antarctica provide further evidence of direct stratospheric nitrate inputs, including the coastal Dumont d'Urville station (Savarino et al., 2007), the inland Dome C station (Erbland et al., 2013), as well as the South Pole station (McCabe et al., 2007). Stratospheric denitrification is directly related to the formation and deposition of PSCs, which in turn is largely determined by lower stratospheric temperature. With the development of the ozone hole, the Southern Hemisphere lower polar stratospheric temperature has slightly decreased (Keeble et al., 2014; Polvani et al., 2011), which tends to accelerate polar vortex formation and delays its breakdown, facilitating the growth of PSCs and enhancing stratospheric denitrification. As such, during the period of the ozone hole, Δ17O(NO) of stratospheric nitrate inputs to the South Pole should have increased, increasing ice-core Δ17O(NO). This is opposite to the observations.
Given the potential increases in the input of stratospheric nitrate, simultaneous increases in tropospheric nitrate through long-range transport to the South Pole could also lead to Δ17O(NO) decreases as long as increases in tropospheric nitrate were greater than those in stratospheric nitrate. However, such increases resulting from changes in atmospheric circulation patterns would also influence ice-core concentrations of nitrate as well as other species (e.g., dust), which were not observed in the ice core. Therefore, the observed Δ17O(NO) was unlikely caused by changes in the relative importance of stratospheric and tropospheric nitrate to primary nitrate input to the South Pole.
4.4.2 Effects of interior Antarctic nitrate transport
Savarino et al. (2007) suggested that snow-sourced nitrate from the East Antarctica Plateau can serve as a source of nitrate to other sites downwind of the plateau (i.e., transported by the katabatic wind). The South Pole is downwind of the East Antarctic Plateau and influenced by the katabatic winds (Parish and Bromwich, 1991). This means in the summer half-year, snow-sourced nitrate from the plateau can be transported to the South Pole. The East Antarctic Plateau snow-sourced nitrate has low δ15N(NO) and Δ17O(NO) compared to primary nitrate. For example, at Dome C, the summer atmospheric nitrate which is dominated by snow-sourced nitrate possesses δ15N(NO) as low as −40 ‰, which is lower than other nitrate sources, and its Δ17O(NO) is < 29 ‰ (Erbland et al., 2013). The latter is similar to the South Pole ice-core mean Δ17O(NO) but lower than that of primary nitrate to the South Pole. Therefore, increases in transport of snow-sourced nitrate from the plateau to the South Pole would tend to decrease South Pole Δ17O(NO) as well as δ15N(NO). But a concurrent decrease in δ15N(NO) was not observed at the South Pole ice core. What is more, Polvani et al. (2011) suggested that the ozone hole would result in a strengthening of the positive SAM (Southern Annular mode) and surface westerlies in summer, which would further reduce the advections of heat and moisture into East Antarctica (Previdi et al., 2013), weakening the katabatic easterlies over West and East Antarctica (Van Den Broeke and Lipzig, 2003; Marshall and Bracegirdle, 2015). As such, in the period of the ozone hole, interior Antarctic nitrate transport from the plateau to the South Pole should have been reduced, which should lead to increases instead of decreases in South Pole Δ17O(NO). Therefore, snow-sourced nitrate transported by katabatic wind from the plateau cannot explain the observed Δ17O(NO) decreases in the South Pole ice core.
4.4.3 Effects of oxidant changes in the source regions
Using a global chemical transport model (the GEOS-chem model) with updated sea-salt production mechanisms and nitrate chemistry, Alexander et al. (2020) calculated that ∼ 80 % of atmospheric nitrate in the Southern Ocean is formed through BrO oxidation pathways. BrO oxidation in general gives higher Δ17O(NO) than nitrate formed in other pathways (Morin et al., 2007; Morin et al., 2008; Alexander et al., 2020). Had the relative contribution of BrO chemistry to nitrate formation decreased in the past few decades, atmospheric Δ17O(NO) in the Southern Ocean would decrease, and this would also be qualitatively consistent with the ice-core records. However, the main source of BrO is acid-catalyzed heterogeneous reactions on sea-salt aerosol (Yang et al., 2008). Sea-salt aerosol has not changed significantly in the past few decades as indicated by Antarctic ice-core Na+ records (Cole-Dai et al., 2021; Winski et al., 2021; Ferris et al., 2011), and using ice-core ionic balance calculations we calculated H+ concentrations and found acidity has also stayed relatively constant over the period of the record. In addition, sea ice is an important source of sea-salt aerosol (Yang et al., 2008; Huang and Jaeglé, 2017), while satellite observations indicate that Antarctic sea ice extent slightly increased from the 1970s to 2014 (Parkinson, 2019). This tends to enhance BrO production, leading to more nitrate production with higher Δ17O(NO), opposite to the observations.
Similar decreases in Δ17O(NO) over the past few decades were also observed in other Antarctic ice cores. Sofen et al. (2014) found that in the WAIS Divide ice core, Δ17O(NO) has had a long-term downward trend in the past 150 years, and a step decrease occurred after the 1970s. Meanwhile, δ15N(NO) in the WAIS Divide ice core over the same period of Δ17O(NO) decrease did not have any long-term trends. A recent study by Shi et al. (2022) also indicated a downward trend of Δ17O(NO) after the 1970s, which is unlikely be explained by the effects of the ozone hole. These coherent decreases in Δ17O(NO) in West, East and Central Antarctica after the 1970s may imply changes in nitrate chemistry in the source region. Assisted by box-model sensitivity studies, Sofen et al. (2014) attributed the WAIS Divide ice-core Δ17O(NO) decrease in the past 150 years (including that after the 1970s) to decreases in the O3 / RO2 ratio in extratropical Southern Hemisphere NOx source regions. Decreases in the O3 / RO2 ratio means a reduced importance of O3 oxidation in the conversion of NO to NO2, leading to lower Δ17O(NO2) and subsequently lower Δ17O(NO). Long-range transport of nitrate from the NOx source regions to Antarctica can then lead to lower Δ17O(NO) in primary nitrate. This at least qualitatively explains the observed decreasing Δ17O(NO) trend. Other processes influencing nitrate formation (e.g., daytime vs. nighttime nitrate formation) in the source regions may also have changed and resulted in changes in Δ17O(NO). These can be investigated once more nitrate observations in the source regions are available. Therefore, the observed Δ17O(NO) decrease after the 1970s is more likely due to the potential decreases in the O3/HOx ratio in the extratropical Southern Hemisphere. This remains to be explored and confirmed with future studies.
The occurrence of the Antarctic ozone hole has implications for the environment and climate (Bitz and Polvani, 2012; Andrady et al., 2017; Polvani et al., 2011). Reconstruction of past stratospheric ozone or column ozone variability is also important for atmospheric photo-chemistry that influences reactive nitrogen, sulfur, and other species. To explore the potential of ice-core nitrate isotopes to serve as a proxy for column ozone variability, we measured nitrate isotopes in a 60-year ice core from the South Pole, and used a snow photochemical model to explicitly investigate the effects of the ozone hole on nitrate isotopes in the record. The model results indicate that at the South Pole post-depositional processing is active, i.e., more than 40 % nitrate is lost upon archiving, with corresponding enrichments in δ15N(NO) by ∼ 50 ‰ and reductions in Δ17O(NO) by ∼ 5.5 ‰. Moreover, the model results indicate the ozone hole alone can lead to ∼ 6.9 ‰ additional δ15N(NO) enrichments compared to the observed average of (59.2 ± 29.3) ‰ (1σ), and ∼ 0.8 ‰ additional reductions in Δ17O(NO) compared to the observed average of (30.0 ± 1.7) ‰ (1σ). These changes are, nevertheless, small compared to the observed absolute values and uncertainties. In addition, a slight increase in the snow accumulation rate during the period of the ozone hole compared to the pre-ozone hole period also tends to offset the effects of the ozone hole on δ15N(NO). As a result, at the South Pole, the ozone hole effects on ice-core δ15N(NO) are not detectable.
In search of the ozone hole footprints, other sites with lower snow accumulation rate might be better suited. For example, at Dome A, East Antarctica, model results suggest that the ozone hole can cause up to 21 ‰ additional δ15N(NO) enrichments. If the snow accumulation rate at Dome A has stayed relatively constant before and during the ozone hole period in the absence of changes in other factors, this gradually increased signal may be detectable. Overall, our analysis suggests ice-core δ15N(NO) seems to be more sensitive to the snow accumulation rate, and detection of column ozone variability from it would require the snow accumulation rate to be relatively constant or well quantified. Alternatively, if the snow accumulation rate is constrained and obtained by other proxies/methods, column ozone information embedded in ice-core δ15N(NO) could be retrieved at least for some recurrent and extreme depletion events.
In contrast to the relatively constant δ15N(NO) record, the South Pole ice-core record of Δ17O(NO) displays a general decreasing trend especially after the 1970s. Such decreases in the same period have also been observed in the WAIS Divide ice core (Sofen et al., 2014) and Dome A snow pit (Shi et al., 2022). This decrease cannot be explained by post-depositional processing even including the effects of the ozone hole. Although here we did not quantitatively discern the causes of the decreasing Δ17O(NO), we found this decrease is likely reflecting changes in atmospheric oxidants (i.e., decreases in the O3 / RO2 ratio) after the 1970s in extratropical Southern Hemisphere NOx source regions as suggested by Sofen et al. (2014). Future work would be necessary to explore the recent changes in atmospheric oxidation environment in extratropical Southern Hemisphere as well as the causes and consequences.
The meteorological data from the Amundsen–Scott South Pole Station Meteorological Observations dataset were freely available at http://amrc.ssec.wisc.edu/usap/southpole/ (Lazzara et al., 2012). The TCO density and surface ozone concentrations data from the NOAA ozonesonde dataset can be accessed at https://doi.org/10.7289/V57P8WBF (McClure-Begley et al., 2013). The ice-core ion concentration and isotopes data will be provided upon direct request to the corresponding author. The codes for the numerical simulations and their analysis will be provided upon direct request to the corresponding author.
The supplement related to this article is available online at: https://doi.org/10.5194/acp-22-13407-2022-supplement.
LG and BA conceived this study, LG performed the measurements. JCD drilled the ice core. YC performed the model simulations, analyzed the data with assistance from ZJ, and wrote the manuscript with LG. JS and JE developed the model used in this study. All authors contributed to the writing of the manuscript.
The contact author has declared that none of the authors has any competing interests.
Publisher’s note: Copernicus Publications remains neutral with regard to jurisdictional claims in published maps and institutional affiliations.
Lei Geng acknowledges financial support from the National Natural Science Foundation of China (grant nos. 41822605, 41871051 and 41727901), the Fundamental Research Funds for Central Universities, the Strategic Priority Research Program of Chinese Academy of Sciences (grant no. XDB 41000000), and the National Key R&D Program of China (grant no. 2019YFC1509100). Becky Alexander acknowledges funding from the US NSF OPP (grant nos. 1446904 and 1542723). Jihong Cole-Dai thanks the US NSF OPP for funding (grant nos. 1443663 and 1904142). Joel Savarino was supported by the French National program LEFE (Les Enveloppes Fluides et l'Environnement), the Agence Nationale de la Recherche (ANR) via contract ANR 16-CE01-0011-01 EAIIST, the Foundation BNP-Paribas through its Climate initiative program and by the French Polar Institute (IPEV) through programs CAPOXI 35-75 (grant no. 1177) and EAIIST (grant no. 1169). The authors appreciate the support of the University of Wisconsin-Madison and Madison College AMRDC for the data set, data display, and information (NSF grant nos. 1951720 (UW) and 1951603 (MATC)). The authors acknowledge Audra McClure-Begley, Irina Petropavlovskikh, Samuel Oltmans, and NOAA ESRL for providing surface ozone data sets.
This research has been supported by the National Natural Science Foundation of China (grant nos. 41822605, 41871051, and 41727901), the National Key R&D Program of China (grant no. 2019YFC1509100), the Fundamental Research Funds for the Central Universities (grant no. XDB 41000000), the Office of Polar Programs (grant nos. 1446904, 1542723, 1443663 and 1904142), the Agence Nationale de la Recherche (grant no. ANR 16-CE01-0011-01 EAIIST), the Fondation BNP Paribas (grant no. 1177; CAPOXI 35–75), and the Institut Polaire Français Paul Emile Victor (grant no. 1169; EAIIST).
This paper was edited by Rolf Müller and reviewed by Holly Winton and one anonymous referee.
Abbatt, J. P. D., Thomas, J. L., Abrahamsson, K., Boxe, C., Granfors, A., Jones, A. E., King, M. D., Saiz-Lopez, A., Shepson, P. B., Sodeau, J., Toohey, D. W., Toubin, C., von Glasow, R., Wren, S. N., and Yang, X.: Halogen activation via interactions with environmental ice and snow in the polar lower troposphere and other regions, Atmos. Chem. Phys., 12, 6237–6271, https://doi.org/10.5194/acp-12-6237-2012, 2012.
Akers, P. D., Savarino, J., Caillon, N., Servettaz, A. P., Le Meur, E., Magand, O., Martins, J., Agosta, C., Crockford, P., and Kobayashi, K.: Sunlight-driven nitrate loss records Antarctic surface mass balance, Nat. Commun., 13, 4274, https://doi.org/10.1038/s41467-022-31855-7, 2022.
Alexander, B., Sherwen, T., Holmes, C. D., Fisher, J. A., Chen, Q., Evans, M. J., and Kasibhatla, P.: Global inorganic nitrate production mechanisms: comparison of a global model with nitrate isotope observations, Atmos. Chem. Phys., 20, 3859–3877, https://doi.org/10.5194/acp-20-3859-2020, 2020.
Andrady, A., Aucamp, P. J., Austin, A. T., Bais, A. F., Ballare, C. L., Barnes, P. W., Bernhard, G. H., Bjoern, L. O., Bornman, J. F., and Congdon, N.: Environmental effects of ozone depletion and its interactions with climate change: Progress report, 2016, Photoch. Photobio. Sci., 16, 107, https://doi.org/10.1039/c7pp90001e, 2017.
Archer, C. L. and Caldeira, K.: Historical trends in the jet streams, Geophys. Res. Lett., 35, L08803, https://doi.org/10.1029/2008GL033614, 2008.
Berhanu, T. A., Meusinger, C., Erbland, J., Jost, R., Bhattacharya, S. K., Johnson, M. S., and Savarino, J.: Laboratory study of nitrate photolysis in Antarctic snow. II. Isotopic effects and wavelength dependence, J. Chem. Phys., 140, 244306, https://doi.org/10.1063/1.4882899, 2014.
Bitz, C. M. and Polvani, L. M.: Antarctic climate response to stratospheric ozone depletion in a fine resolution ocean climate model, Geophys. Res. Lett., 39, L20705, https://doi.org/10.1029/2012gl053393, 2012.
Butchart, N.: The Brewer-Dobson circulation, Rev. Geophys., 52, 157–184, https://doi.org/10.1002/2013RG000448, 2014.
Casey, K. A., Kaspari, S. D., Skiles, S., Kreutz, K., and Handley, M.: The spectral and chemical measurement of pollutants on snow near South Pole, Antarctica, J. Geophys. Res.-Atmos., 122, 6592–6610, https://doi.org/10.1002/2016JD026418, 2017.
Chu, L. and Anastasio, C.: Quantum Yields of Hydroxyl Radical and Nitrogen Dioxide from the Photolysis of Nitrate on Ice, J. Phys. Chem. A, 107, 9594–9602, https://doi.org/10.1021/jp0349132, 2003.
Cole-Dai, J., Budner, D. M., and Ferris, D. G.: High speed, high resolution, and continuous chemical analysis of ice cores using a melter and ion chromatography, Environ. Sci. Technol., 40, 6764–6769, https://doi.org/10.1021/es061188a, 2006.
Cole-Dai, J., Ferris, D. G., Kennedy, J. A., Sigl, M., McConnell, J. R., Fudge, T. J., Geng, L., Maselli, O. J., Taylor, K. C., and Souney, J. M.: Comprehensive Record of Volcanic Eruptions in the Holocene (11,000 years) From the WAIS Divide, Antarctica Ice Core, J. Geophys. Res.-Atmos., 126, e2020JD032855, https://doi.org/10.1029/2020JD032855, 2021.
Davis, D., Chen, G., Buhr, M., Crawford, J., Lenschow, D., Lefer, B., Shetter, R., Eisele, F., Mauldin, L., and Hogan, A.: South Pole NOx chemistry: an assessment of factors controlling variability and absolute levels, Atmos. Environ., 38, 5375–5388, https://doi.org/10.1029/2003JD004300, 2004.
Dibb, J. E. and Fahnestock, M.: Snow accumulation, surface height change, and firn densification at Summit, Greenland: Insights from 2 years of in situ observation, J. Geophys. Res.-Atmos., 109, D24113, 2004.
Dominé, F. and Shepson, P. B.: Air-snow interactions and atmospheric chemistry, Science, 297, 1506–1510, https://doi.org/10.1126/science.1074610, 2002.
Erbland, J., Vicars, W. C., Savarino, J., Morin, S., Frey, M. M., Frosini, D., Vince, E., and Martins, J. M. F.: Air–snow transfer of nitrate on the East Antarctic Plateau – Part 1: Isotopic evidence for a photolytically driven dynamic equilibrium in summer, Atmos. Chem. Phys., 13, 6403–6419, https://doi.org/10.5194/acp-13-6403-2013, 2013.
Erbland, J., Savarino, J., Morin, S., France, J. L., Frey, M. M., and King, M. D.: Air–snow transfer of nitrate on the East Antarctic Plateau – Part 2: An isotopic model for the interpretation of deep ice-core records, Atmos. Chem. Phys., 15, 12079–12113, https://doi.org/10.5194/acp-15-12079-2015, 2015.
Farman, J. C., Gardiner, B. G., and Shanklin, J. D.: Large losses of total ozone in Antarctica reveal seasonal ClOx NOx interaction, Nature, 315, 207–210, https://doi.org/10.1038/315207a0, 1985.
Ferris, D. G., Cole-Dai, J., Reyes, A. R., and Budner, D. M.: South Pole ice core record of explosive volcanic eruptions in the first and second millennia A.D. and evidence of a large eruption in the tropics around 535 A.D, J. Geophys. Res., 116, D17308, https://doi.org/10.1029/2011jd015916, 2011.
Frey, M. M., Savarino, J., Morin, S., Erbland, J., and Martins, J. M. F.: Photolysis imprint in the nitrate stable isotope signal in snow and atmosphere of East Antarctica and implications for reactive nitrogen cycling, Atmos. Chem. Phys., 9, 8681–8696, https://doi.org/10.5194/acp-9-8681-2009, 2009.
Frezzotti, M., Scarchilli, C., Becagli, S., Proposito, M., and Urbini, S.: A synthesis of the Antarctic surface mass balance during the last 800 yr, The Cryosphere, 7, 303–319, https://doi.org/10.5194/tc-7-303-2013, 2013.
Gallet, J.-C., Domine, F., Arnaud, L., Picard, G., and Savarino, J.: Vertical profile of the specific surface area and density of the snow at Dome C and on a transect to Dumont D'Urville, Antarctica – albedo calculations and comparison to remote sensing products, The Cryosphere, 5, 631–649, https://doi.org/10.5194/tc-5-631-2011, 2011.
Geng, L.: Isotopes as Tracers of Chemical Reactivity in Snow, in: Chemistry in the Cryosphere, 503–569, https://doi.org/10.1142/9789811230134_0010, 2022.
Geng, L., Cole-Dai, J., Alexander, B., Erbland, J., Savarino, J., Schauer, A. J., Steig, E. J., Lin, P., Fu, Q., and Zatko, M. C.: On the origin of the occasional spring nitrate peak in Greenland snow, Atmos. Chem. Phys., 14, 13361–13376, https://doi.org/10.5194/acp-14-13361-2014, 2014.
Geng, L., Zatko, M. C., Alexander, B., Fudge, T. J., Schauer, A. J., Murray, L. T., and Mickley, L. J.: Effects of postdepositional processing on nitrogen isotopes of nitrate in the Greenland Ice Sheet Project 2 ice core, Geophys. Res. Lett., 42, 5346–5354, https://doi.org/10.1002/2015gl064218, 2015.
Grannas, A. M., Jones, A. E., Dibb, J., Ammann, M., Anastasio, C., Beine, H. J., Bergin, M., Bottenheim, J., Boxe, C. S., Carver, G., Chen, G., Crawford, J. H., Dominé, F., Frey, M. M., Guzmán, M. I., Heard, D. E., Helmig, D., Hoffmann, M. R., Honrath, R. E., Huey, L. G., Hutterli, M., Jacobi, H. W., Klán, P., Lefer, B., McConnell, J., Plane, J., Sander, R., Savarino, J., Shepson, P. B., Simpson, W. R., Sodeau, J. R., von Glasow, R., Weller, R., Wolff, E. W., and Zhu, T.: An overview of snow photochemistry: evidence, mechanisms and impacts, Atmos. Chem. Phys., 7, 4329–4373, https://doi.org/10.5194/acp-7-4329-2007, 2007.
Grooß, J.-U., Brautzsch, K., Pommrich, R., Solomon, S., and Müller, R.: Stratospheric ozone chemistry in the Antarctic: what determines the lowest ozone values reached and their recovery?, Atmos. Chem. Phys., 11, 12217–12226, https://doi.org/10.5194/acp-11-12217-2011, 2011.
Hu, Y. and Fu, Q.: Observed poleward expansion of the Hadley circulation since 1979, Atmos. Chem. Phys., 7, 5229–5236, https://doi.org/10.5194/acp-7-5229-2007, 2007.
Huang, J. and Jaeglé, L.: Wintertime enhancements of sea salt aerosol in polar regions consistent with a sea ice source from blowing snow, Atmos. Chem. Phys., 17, 3699–3712, https://doi.org/10.5194/acp-17-3699-2017, 2017.
Jacob, D. J.: Introduction to atmospheric chemistry, Princeton University Press, Princeton, https://doi.org/10.1515/9781400841547, 1999.
Jarvis, J. C.: Isotopic studies of ice core nitrate and atmospheric nitrogen oxides in polar regions, Dissertation, Uinversity of Washington, Seattle, WA, ISBN 9780549816201, 2008.
Jiang, Z., Alexander, B., Savarino, J., Erbland, J., and Geng, L.: Impacts of the photo-driven post-depositional processing on snow nitrate and its isotopes at Summit, Greenland: a model-based study, The Cryosphere, 15, 4207–4220, https://doi.org/10.5194/tc-15-4207-2021, 2021.
Jiang, Z., Savarino, J., Alexander, B., Erbland, J., Jaffrezo, J.-L., and Geng, L.: Impacts of post-depositional processing on nitrate isotopes in the snow and the overlying atmosphere at Summit, Greenland, The Cryosphere, 16, 2709–2724, https://doi.org/10.5194/tc-16-2709-2022, 2022.
Jones, A. E. and Wolff, E. W.: An analysis of the oxidation potential of the South Pole boundary layer and the influence of stratospheric ozone depletion, J. Geophys. Res.-Atmos., 108, 4565, https://doi.org/10.1029/2003jd003379, 2003.
Keeble, J., Braesicke, P., Abraham, N. L., Roscoe, H. K., and Pyle, J. A.: The impact of polar stratospheric ozone loss on Southern Hemisphere stratospheric circulation and climate, Atmos. Chem. Phys., 14, 13705–13717, https://doi.org/10.5194/acp-14-13705-2014, 2014.
Kukui, A., Legrand, M., Preunkert, S., Frey, M. M., Loisil, R., Gil Roca, J., Jourdain, B., King, M. D., France, J. L., and Ancellet, G.: Measurements of OH and RO2 radicals at Dome C, East Antarctica, Atmos. Chem. Phys., 14, 12373–12392, https://doi.org/10.5194/acp-14-12373-2014, 2014.
Lazzara, M., Keller, L., Markle, T., and Gallagher, J.: Fifty-year AmundsenScott South Pole station surface climatology, Atmos. Res., 118, 240259, https://doi.org/10.1016/j.atmosres.2012.06.027, 2012 (data available at: http://amrc.ssec.wisc.edu/usap/southpole/, last access: 12 October 2022).
Libois, Q., Picard, G., France, J. L., Arnaud, L., Dumont, M., Carmagnola, C. M., and King, M. D.: Influence of grain shape on light penetration in snow, The Cryosphere, 7, 1803–1818, https://doi.org/10.5194/tc-7-1803-2013, 2013.
Madronich, S., McKenzie, R. L., Björn, L. O., and Caldwell, M. M.: Changes in biologically active ultraviolet radiation reaching the Earth's surface, J. Photoch. Photobio. B, 46, 5–19, https://doi.org/10.1016/s1011-1344(98)00182-1, 1998.
Marshall, G. J. and Bracegirdle, T. J.: An examination of the relationship between the Southern Annular Mode and Antarctic surface air temperatures in the CMIP5 historical runs, Clim. Dynam., 45, 1513–1535, https://doi.org/10.1007/s00382-014-2406-z, 2015.
Mauldin, R. L., Kosciuch, E., Henry, B., Eisele, F. L., Shetter, R., Lefer, B., Chen, G., Davis, D., Huey, G., and Tanner, D.: Measurements of OH, HO2 +RO2, H2SO4, and MSA at the South Pole during ISCAT 2000, Atmos. Environ., 38, 5423–5437, https://doi.org/10.1016/j.atmosenv.2004.06.031, 2004.
McCabe, J. R., Boxe, C. S., Colussi, A. J., Hoffmann, M. R., and Thiemens, M. H.: Oxygen isotopic fractionation in the photochemistry of nitrate in water and ice, J. Geophys. Res., 110, D15310, https://doi.org/10.1029/2004jd005484, 2005.
McCabe, J. R., Thiemens, M. H., and Savarino, J.: A record of ozone variability in South Pole Antarctic snow: Role of nitrate oxygen isotopes, J. Geophys. Res., 112, D12303, https://doi.org/10.1029/2006jd007822, 2007.
McConnell, J. R., Burke, A., Dunbar, N. W., Kohler, P., Thomas, J. L., Arienzo, M. M., Chellman, N. J., Maselli, O. J., Sigl, M., Adkins, J. F., Baggenstos, D., Burkhart, J. F., Brook, E. J., Buizert, C., Cole-Dai, J., Fudge, T. J., Knorr, G., Graf, H. F., Grieman, M. M., Iverson, N., McGwire, K. C., Mulvaney, R., Paris, G., Rhodes, R. H., Saltzman, E. S., Severinghaus, J. P., Steffensen, J. P., Taylor, K. C., and Winckler, G.: Synchronous volcanic eruptions and abrupt climate change approximately 17.7 ka plausibly linked by stratospheric ozone depletion, P. Natl. Acad. Sci. USA, 114, 10035–10040, https://doi.org/10.1073/pnas.1705595114, 2017.
Meusinger, C., Berhanu, T. A., Erbland, J., Savarino, J., and Johnson, M. S.: Laboratory study of nitrate photolysis in Antarctic snow. I. Observed quantum yield, domain of photolysis, and secondary chemistry, J. Chem. Phys., 140, 244305, https://doi.org/10.1063/1.4882898, 2014.
Van Den Broeke, M. R. and Lipzig, N. P. M. V.: Response of wintertime Antarctic temperatures to the Antarctic Oscillation: Results of a regional climate model, in: Antarctic Peninsula climate variability: historical and paleoenvironmental perspectives, edited by: Domack, E., Levente, A., Burnet, A., Bindschadler, R., Convey, P., and Kirby, M., Cambridge University Press, 43–58, https://doi.org/10.1029/AR079p0043, 2003.
McClure-Begley, A., Petropavlovskikh, I., Oltmans, S., and NOAA ESRL: Earth System Research Laboratory Ozone Water Vapor Group Surface Ozone Measurements, Version 1, NOAA National Centers for Environmental Information [data set], https://doi.org/10.7289/V57P8WBF, 2013.
Ming, A., Winton, V. H. L., Keeble, J., Abraham, N. L., Dalvi, M. C., Griffiths, P., Caillon, N., Jones, A. E., Mulvaney, R., Savarino, J., Frey, M. M., and Yang, X.: Stratospheric Ozone Changes From Explosive Tropical Volcanoes: Modeling and Ice Core Constraints, J. Geophys. Res.-Atmos., 125, e2019JD032290, https://doi.org/10.1029/2019jd032290, 2020.
Morin, S., Savarino, J., Bekki, S., Gong, S., and Bottenheim, J. W.: Signature of Arctic surface ozone depletion events in the isotope anomaly (Δ17O) of atmospheric nitrate, Atmos. Chem. Phys., 7, 1451–1469, https://doi.org/10.5194/acp-7-1451-2007, 2007.
Morin, S., Savarino, J., Frey, M. M., Yan, N., Bekki, S., Bottenheim, J. W., and Martins, J. M. F.: Tracing the Origin and Fate of NOx in the Arctic Atmosphere Using Stable Isotopes in Nitrate, Science, 322, 730–732, https://doi.org/10.1126/science.1161910, 2008.
Morin, S., Savarino, J., Frey, M. M., Domine, F., Jacobi, H. W., Kaleschke, L., and Martins, J. M.: Comprehensive isotopic composition of atmospheric nitrate in the Atlantic Ocean boundary layer from 65∘ S to 79∘ N, J. Geophys. Res.-Atmos., 114, D05303, https://doi.org/10.1029/2008JD010696, 2009.
Mosley-Thompson, E., Thompson, L., Paskievitch, J., Pourchet, M., Gow, A., Davis, M., and Kleinman, J.: Recent increase in South Pole snow accumulation, Ann. Glaciol., 21, 131–138, https://doi.org/10.3189/S0260305500015718, 1995.
Müller, R., Grooß, J.-U., Lemmen, C., Heinze, D., Dameris, M., and Bodeker, G.: Simple measures of ozone depletion in the polar stratosphere, Atmos. Chem. Phys., 8, 251–264, https://doi.org/10.5194/acp-8-251-2008, 2008.
Mulvaney, R. and Wolff, E. W.: Evidence for Winter Spring Denitrification of the Stratosphere in the Nitrate Record of Antarctic Firn Cores, J. Geophys. Res.-Atmos., 98, 5213–5220, https://doi.org/10.1029/92JD02966, 1993.
Neff, W., Crawford, J., Buhr, M., Nicovich, J., Chen, G., and Davis, D.: The meteorology and chemistry of high nitrogen oxide concentrations in the stable boundary layer at the South Pole, Atmos. Chem. Phys., 18, 3755–3778, https://doi.org/10.5194/acp-18-3755-2018, 2018.
Parish, T. R. and Bromwich, D. H.: Continental-Scale Simulation of the Antarctic Katabatic Wind Regime, J. Climate, 4, 135–146, https://doi.org/10.1175/1520-0442(1991)004<0135:CSSOTA>2.0.CO;2, 1991.
Parkinson, C. L.: A 40-y record reveals gradual Antarctic sea ice increases followed by decreases at rates far exceeding the rates seen in the Arctic, P. Natl. Acad. Sci. USA, 116, 14414–14423, https://doi.org/10.1073/pnas.1906556116, 2019.
Polvani, L. M., Waugh, D. W., Correa, G. J. P., and Son, S.-W.: Stratospheric Ozone Depletion: The Main Driver of Twentieth-Century Atmospheric Circulation Changes in the Southern Hemisphere, J. Climate, 24, 795–812, https://doi.org/10.1175/2010jcli3772.1, 2011.
Previdi, M., Smith, K. L., and Polvani, L. M.: The Antarctic Atmospheric Energy Budget. Part I: Climatology and Intraseasonal-to-Interannual Variability, J. Climate, 26, 6406–6418, https://doi.org/10.1175/jcli-d-12-00640.1, 2013.
Savarino, J., Kaiser, J., Morin, S., Sigman, D. M., and Thiemens, M. H.: Nitrogen and oxygen isotopic constraints on the origin of atmospheric nitrate in coastal Antarctica, Atmos. Chem. Phys., 7, 1925–1945, https://doi.org/10.5194/acp-7-1925-2007, 2007.
Shi, G., Hastings, M. G., Yu, J., Ma, T., Hu, Z., An, C., Li, C., Ma, H., Jiang, S., and Li, Y.: Nitrate deposition and preservation in the snowpack along a traverse from coast to the ice sheet summit (Dome A) in East Antarctica, The Cryosphere, 12, 1177–1194, https://doi.org/10.5194/tc-12-1177-2018, 2018.
Shi, G., Hu, Y., Ma, H., Jiang, S., Chen, Z., Hu, Z., An, C., Sun, B., and Hastings, M. G.: Snow Nitrate Isotopes in Central Antarctica Record the Prolonged Period of Stratospheric Ozone Depletion From ∼ 1960 to 2000, Geophys. Res. Lett., 49, e2022GL098986, https://doi.org/10.1029/2022GL098986, 2022.
Sofen, E. D., Alexander, B., Steig, E. J., Thiemens, M. H., Kunasek, S. A., Amos, H. M., Schauer, A. J., Hastings, M. G., Bautista, J., Jackson, T. L., Vogel, L. E., McConnell, J. R., Pasteris, D. R., and Saltzman, E. S.: WAIS Divide ice core suggests sustained changes in the atmospheric formation pathways of sulfate and nitrate since the 19th century in the extratropical Southern Hemisphere, Atmos. Chem. Phys., 14, 5749–5769, https://doi.org/10.5194/acp-14-5749-2014, 2014.
Son, S.-W., Polvani, L. M., Waugh, D. W., Birner, T., Akiyoshi, H., Garcia, R. R., Gettelman, A., Plummer, D. A., and Rozanov, E.: The impact of stratospheric ozone recovery on tropopause height trends, J. Climate, 22, 429–445, https://doi.org/10.1175/2008JCLI2215.1, 2009.
Spolaor, A., Burgay, F., Fernandez, R. P., Turetta, C., Cuevas, C. A., Kim, K., Kinnison, D. E., Lamarque, J.-F., de Blasi, F., and Barbaro, E.: Antarctic ozone hole modifies iodine geochemistry on the Antarctic Plateau, Nat. Commun., 12, 1–9, https://doi.org/10.1038/s41467-021-26109-x, 2021.
Stolarski, R. S., Krueger, A. J., Schoeberl, M. R., McPeters, R. D., Newman, P. A., and Alpert, J. C.: Nimbus 7 satellite measurements of the springtime Antarctic ozone decrease, Nature, 322, 808–811, https://doi.org/10.1038/322808a0, 1986.
Thomas, E. R., van Wessem, J. M., Roberts, J., Isaksson, E., Schlosser, E., Fudge, T. J., Vallelonga, P., Medley, B., Lenaerts, J., Bertler, N., van den Broeke, M. R., Dixon, D. A., Frezzotti, M., Stenni, B., Curran, M., and Ekaykin, A. A.: Regional Antarctic snow accumulation over the past 1000 years, Clim. Past, 13, 1491–1513, https://doi.org/10.5194/cp-13-1491-2017, 2017.
Thomas, J. L., Dibb, J. E., Huey, L. G., Liao, J., Tanner, D., Lefer, B., von Glasow, R., and Stutz, J.: Modeling chemistry in and above snow at Summit, Greenland – Part 2: Impact of snowpack chemistry on the oxidation capacity of the boundary layer, Atmos. Chem. Phys., 12, 6537–6554, https://doi.org/10.5194/acp-12-6537-2012, 2012.
Thompson, D. W. J., Solomon, S., Kushner, P. J., England, M. H., Grise, K. M., and Karoly, D. J.: Signatures of the Antarctic ozone hole in Southern Hemisphere surface climate change, Nat. Geosci., 4, 741–749, https://doi.org/10.1038/ngeo1296, 2011.
Walters, W. W., Michalski, G., Böhlke, J. K., Alexander, B., Savarino, J., and Thiemens, M. H.: Assessing the Seasonal Dynamics of Nitrate and Sulfate Aerosols at the South Pole Utilizing Stable Isotopes, J. Geophys. Res.-Atmos., 124, 8161–8177, https://doi.org/10.1029/2019jd030517, 2019.
Weller, R., Traufetter, F., Fischer, H., Oerter, H., Piel, C., and Miller, H.: Postdepositional losses of methane sulfonate, nitrate, and chloride at the European Project for Ice Coring in Antarctica deep-drilling site in Dronning Maud Land, Antarctica, J. Geophys. Res.-Atmos., 109, D07301, https://doi.org/10.1029/2003JD004189, 2004.
Winski, D. A., Fudge, T. J., Ferris, D. G., Osterberg, E. C., Fegyveresi, J. M., Cole-Dai, J., Thundercloud, Z., Cox, T. S., Kreutz, K. J., Ortman, N., Buizert, C., Epifanio, J., Brook, E. J., Beaudette, R., Severinghaus, J., Sowers, T., Steig, E. J., Kahle, E. C., Jones, T. R., Morris, V., Aydin, M., Nicewonger, M. R., Casey, K. A., Alley, R. B., Waddington, E. D., Iverson, N. A., Dunbar, N. W., Bay, R. C., Souney, J. M., Sigl, M., and McConnell, J. R.: The SP19 chronology for the South Pole Ice Core – Part 1: volcanic matching and annual layer counting, Clim. Past, 15, 1793–1808, https://doi.org/10.5194/cp-15-1793-2019, 2019.
Winski, D. A., Osterberg, E. C., Kreutz, K. J., Ferris, D. G., Cole-Dai, J., Thundercloud, Z., Huang, J., Alexander, B., Jaeglé, L., Kennedy, J. A., Larrick, C., Kahle, E. C., Steig, E. J., and Jones, T. R.: Seasonally Resolved Holocene Sea Ice Variability Inferred From South Pole Ice Core Chemistry, Geophys. Res. Lett., 48, e2020GL091602, https://doi.org/10.1029/2020GL091602, 2021.
Winton, V. H. L., Ming, A., Caillon, N., Hauge, L., Jones, A. E., Savarino, J., Yang, X., and Frey, M. M.: Deposition, recycling, and archival of nitrate stable isotopes between the air–snow interface: comparison between Dronning Maud Land and Dome C, Antarctica, Atmos. Chem. Phys., 20, 5861–5885, https://doi.org/10.5194/acp-20-5861-2020, 2020.
WMO: WMO Statement on the State of the Global Climate in 2017, World Meteorological Organization (WMO), 1211 Geneva 2, Switzerland, https://library.wmo.int/doc_num.php?explnum_id=4453 (last access: 12 October 2022), 2018.
Wohltmann, I., Lehmann, R., and Rex, M.: A quantitative analysis of the reactions involved in stratospheric ozone depletion in the polar vortex core, Atmos. Chem. Phys., 17, 10535–10563, https://doi.org/10.5194/acp-17-10535-2017, 2017.
Wolff, E. W., Jones, A. E., Martin, T. J., and Grenfell, T. C.: Modelling photochemical NOx production and nitrate loss in the upper snowpack of Antarctica, Geophys. Res. Lett., 29, 5-1–5-4, https://doi.org/10.1029/2002GL015823, 2002.
Yang, X., Pyle, J. A., and Cox, R. A.: Sea salt aerosol production and bromine release: Role of snow on sea ice, Geophys. Res. Lett., 35, L16815, https://doi.org/10.1029/2008gl034536, 2008.
Zambri, B., Solomon, S., Thompson, D., and Fu, Q.: Emergence of Southern Hemisphere circulation changes in response to ozone recovery, EGU General Assembly 2020, Online, 4–8 May 2020, EGU2020-22211, https://doi.org/10.5194/egusphere-egu2020-22211, 2020.
Zatko, M., Geng, L., Alexander, B., Sofen, E., and Klein, K.: The impact of snow nitrate photolysis on boundary layer chemistry and the recycling and redistribution of reactive nitrogen across Antarctica and Greenland in a global chemical transport model, Atmos. Chem. Phys., 16, 2819–2842, https://doi.org/10.5194/acp-16-2819-2016, 2016.
Zatko, M. C., Grenfell, T. C., Alexander, B., Doherty, S. J., Thomas, J. L., and Yang, X.: The influence of snow grain size and impurities on the vertical profiles of actinic flux and associated NOx emissions on the Antarctic and Greenland ice sheets, Atmos. Chem. Phys., 13, 3547–3567, https://doi.org/10.5194/acp-13-3547-2013, 2013.