the Creative Commons Attribution 4.0 License.
the Creative Commons Attribution 4.0 License.
 | 12 Oct 2022
Size-resolved dust direct radiative effect efficiency derived from satellite observations
Qianqian Song
Zhibo Zhang
Hongbin Yu
Jasper F. Kok
Claudia Di Biagio
Samuel Albani
Jianyu Zheng
Jiachen Ding
The role of mineral dust aerosol in the global radiative energy budget is often quantified by the dust direct radiative effect (DRE). The dust DRE strongly depends on dust aerosol optical depth (DAOD), therefore, DRE efficiency (DREE = DRE / DAOD) is widely compared across different studies to eliminate differences due to the various dust loads. Nevertheless, DREE is still influenced by the uncertainties associated with dust particle size distribution (PSD) and optical properties. In this study, we derive a global clear-sky size-resolved DREE dataset in both shortwave (SW) and longwave (LW) at top of the atmosphere (TOA) and surface based on satellite observations (i.e., satellite-retrieved dust extinction spatial and vertical distributions). In the DREE dataset, dust geometric diameter from 0.1 to 100 µm is divided into 10 bins and the corresponding monthly mean DREE (with respect to DAOD at 532 nm) for each size bin is derived by using the Rapid Radiative Transfer Model (RRTM). Three sets of state of the art dust refractive indices (RI) and two sets of dust shape models (sphere vs. spheroid) are adopted to investigate the sensitivity of dust DREE to dust absorption and shape. As a result, the size-resolved dust DREE dataset contains globally distributed monthly mean dust DREE at TOA and surface for each of 10 size bins with 5∘ (longitude) ×2∘ (latitude) resolution as well as for each dust RI and shape combination. The size-resolved dust DREE dataset can be used to readily calculate global dust DRE for any DAOD and dust PSD, including the uncertainty in the DRE induced by dust microphysical properties, (e.g., dust PSD, RI and shape). By calculating dust DRE based on DAOD climatology retrieved from different satellite sensors and based on different dust PSD, we find that uncertainty in the spatial pattern of DAOD induces more than 10 % of the uncertainty in SW dust DRE at TOA. The observation-based dust PSD induces around 15–20 % uncertainty in dust DRE at TOA and in the atmosphere. The sensitivity assessments of dust DRE to dust RI and shape further suggest that dust nonsphericity induces a negligible effect on dust DRE estimations, while dust RI turns out to be the most important factor in determining dust DRE, particularly in SW.
- Article
(5144 KB) - Full-text XML
-
Supplement
(929 KB) - BibTeX
- EndNote


Mineral dust is an important component of the atmospheric aerosol (Textor et al., 2006; Choobari et al., 2014). It can influence the radiative energy budget of the earth-atmosphere system directly through the interaction with both solar and thermal infrared radiation, which is known as the direct radiative effect (DRE) of dust. The DRE of dust consists of two components. In the solar shortwave (SW) spectral region, dust aerosols reflect a fraction of solar radiation back to the space which generally leads to a negative cooling effect at both top of the atmosphere (TOA) and surface (Tegen et al., 1996; Myhre et al., 2003). In the longwave (LW) thermal infrared region, dust aerosols trap the thermal radiation emitted from the earth's surface by absorption, which generally leads to a positive warming radiative effect at TOA and surface (Sokolik et al., 1998). In addition to DRE, dust can also influence the radiation and the hydrological cycles indirectly through serving as cloud condensation nuclei and ice nuclei and affecting cloud microphysical properties and cloud lifetime, known as indirect effects of dust (Twomey, 1977; Albrecht, 1989).
The dust DRE depends on many factors including primarily the atmospheric dust content, represented by its optical depth (DAOD), vertical distribution (especially important for LW DRE), and particles' physicochemical properties that are the particle size distribution (PSD), complex refractive index (RI), and shape. Besides dust PSD, RI and shape, the dust DRE also depends on the atmospheric composition and structure, notably the atmospheric vertical profile of clouds, water vapor, and temperature, as well as surface properties (Yu et al., 2006). All of these properties vary in space and time and need to be characterized at the best possible spatiotemporal resolution in order to get realistic dust DRE estimates.
Among all these factors, DAOD is of first order importance in determining dust DRE since it is approximately linear with DAOD (Satheesh and Ramanathan, 2000). Many previous studies related to dust DRE are based on DAOD distributions from model simulations. For example, Kok et al. (2017) used four global model simulations to estimate global mean dust DRE efficiency (DREE is defined as DRE / DAOD) and further derived global mean dust DRE. Di Biagio et al. (2020) derived dust DRE based on model-simulated DAOD distributions with global annual mean DAOD constrained by observations. The main advantage of these studies is the availability of continuous and detailed DAOD spatial and temporal variation from model simulations. On the other hand, model-simulated DAOD could be subject to large uncertainties and biases in reproducing DAOD due to parameterization of various physical processes and therefore needs observational constraints for evaluation and improvement.
Satellite observations are important sources of data for evaluating model simulations, because of their routine sampling on a global scale and over decadal time periods. Previous studies have developed sensor-specific methods to distinguish dust aerosol from total aerosol based on the size and shape characteristics of dust particles. Some are based on passive satellite observations such as moderate resolution imaging spectroradiometer (MODIS, Remer et al., 2005) and others are based on active observations such as cloud-aerosol lidar with orthogonal polarization (CALIOP, Winker et al., 2009). The wide spectral coverage of MODIS measurements allows the retrieval of aerosol particle size information, such as effective radius, fine-mode fraction, aerosol Ångström exponent as well as the spectral gradient of absorption (Remer et al., 2005; Hsu et al., 2013). Based on the fact that dust aerosols are generally larger in size than other aerosols and have a decreasing absorption from ultraviolet (UV) to near infrared, the combinations of these retrievals provide the basis for dust separation and dust aerosol optical depth (DAOD) retrievals from MODIS (Kaufman et al., 2005; Ginoux et al., 2012; Voss and Evan, 2020; Yu et al., 2009, 2019). In addition, some recent studies have also characterized dust distribution through integrating MODIS measurements with other data sources and model simulations. For example, using the DAOD to AOD ratio from modern era retrospective analysis for research and applications version 2 (MERRA-2), Gkikas et al. (2021) converted the MODIS AOD retrievals to DAOD. However, passive sensors do not provide the vertical structure of aerosols that is critical for studying aerosol-cloud interactions, LW radiative effects and aerosol influences on the thermal structure of the atmosphere (e.g., Meloni et al., 2005, 2015). In contrast, the active sensor CALIOP can provide the vertical profiles of aerosol extinction and particle properties such as the depolarization ratio and color ratio, which have been used for improving DAOD retrievals in thermal infrared (TIR) spectra (Zheng et al., 2022) and evaluating global dust simulations (Yu et al., 2010; Wu et al., 2020). The CALIOP dust identification is mainly based on dust aerosols being nonspherical in shape and their linear depolarization ratio being much larger than spherical aerosols (Sakai et al., 2010).
Using CALIOP retrievals, Song et al. (2021) derived a three-dimensional (3D) decadal (2007–2019) global scale dust extinction profile climatology, which provides an observational constraint on both the spatial DAOD pattern and the vertical dust distribution for studying dust DRE and evaluating models. In their study, Song et al. (2021) also compared dust retrievals, in particular DAOD, based on different methods (i.e., CALIOP-based and MODIS-based DAOD retrievals) and showed that DAODs often differ significantly between the different products and further discussed the potential reasons for the cause of the differences (e.g., instrument calibration errors and errors in discriminating cloud from aerosol, globally uniform dust lidar ratio assumption in CALIOP DAOD retrieval etc.). They showed that DAOD derived from CALIOP observations is generally smaller and more concentrated over “dust belt” regions, extending from the west coast of North Africa to the Middle East, Central Asia, and China, than that derived from MODIS observations. These differences in DAOD in turn lead to different dust DRE estimations, making it difficult to compare different studies to reach meaningful conclusions. Even an agreement of DRE could be a result of the compensation between differences in DAOD and other aforementioned factors, such as dust microphysical properties. Therefore, DRE provides only a weak constraint on the model. Instead, a normalized quantity, DRE efficiency (DREE) as the ratio of DRE to DAOD, has been widely used in intercomparison studies and model evaluations (Di Biagio et al., 2020). Because of the elimination of DAOD, the DREE provides a stronger constraint on dust microphysical properties and their impacts on the dust DRE from different dust source regions (García et al., 2008).
In addition to DAOD, dust size is also an important factor in determining dust DRE (Mahowald et al., 2014). Smaller particles are more effective at scattering SW radiation and supermicron particles are more effective at absorbing both SW and LW radiation (Tegen and Lacis, 1996). Therefore, when other parameters are equal, fine dust would generally have a more negative SW DRE and a less positive LW DRE than coarse dust. Unfortunately, despite its importance, the simulation of dust PSD in the models and satellite retrievals of dust size remain challenging tasks (Ryder et al., 2019). As a result, there is a large uncertainty in our understanding of dust PSD. For example, several recent studies suggested that model simulations tend to underestimate dust size, especially the very coarse dust with diameters in excess of 5 µm (Adebiyi and Kok, 2020). Moreover, dust RI and shape can be important for DRE estimation as well because besides dust PSD they are the other two factors that determine dust spectral optical properties. As such, it is important to investigate the sensitivity of dust DRE to dust PSD, RI and shape. Previous studies suggested that large dust PSD and RI uncertainty leads to a large uncertainty in dust DRE and thereby DREE estimations. For example, Song et al. (2018) showed that the SW DREE of a dust model with a large size and less absorptive RI is very similar to that of a dust model with a smaller size and more absorptive RI, which are both in the range of satellite-derived values in the NE Atlantic region. Not surprisingly, even DREE cannot provide sufficient constraints due to this possible compensation of effects in the dust PSD and RI.
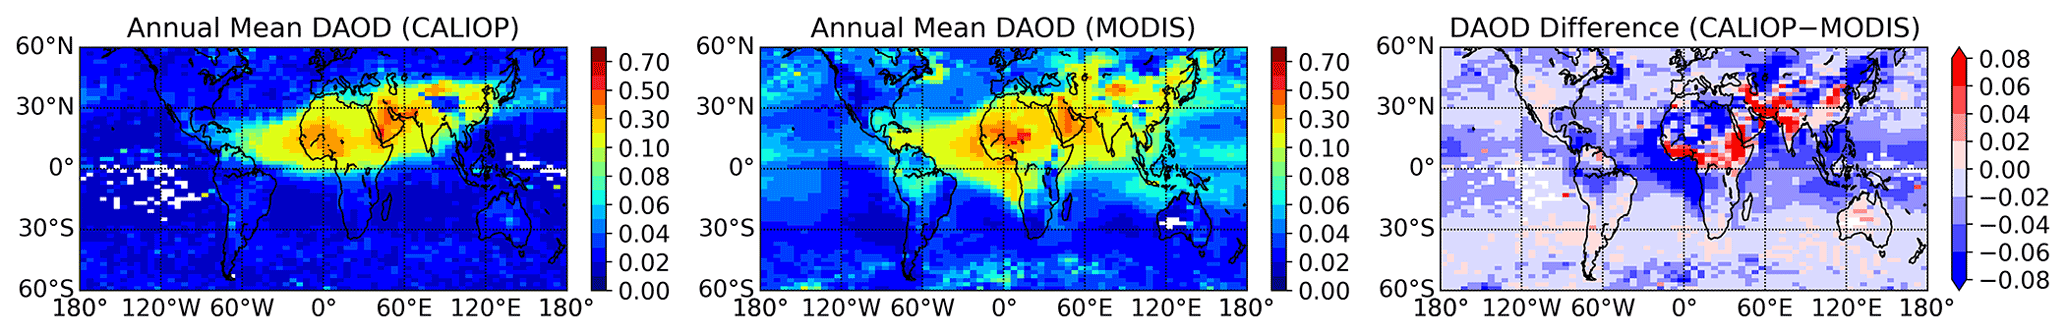
Figure 1Global (60∘ S–60∘ N) spatial pattern of CALIOP-based and MODIS-based 4-year (2007–2010) mean DAOD (Song et al., 2021) and their difference.
The main objective of this study is to derive a global clear-sky size-resolved dust DREE dataset based on satellite observations and demonstrate its usefulness in constraining, comparing, and understanding the dust DRE estimations. As explained later on, the size-resolved DREE decomposes the DREE of dust into several size bins and therefore provides a way to explicitly take into account the effects of dust PSD. The sensitivity of dust DRE to dust RI and shape are also assessed in this study. Due to the inhomogeneous spatiotemporal distribution of the aforementioned factors, it is thus important to consider the spatiotemporal variation of dust DREE. Therefore, we organize the DREE dataset at 5∘ (longitude) ×2∘ (latitude) horizontal resolution and at monthly temporal resolution. To the best of our knowledge, this work presents the first such dataset based on retrieved dust properties (i.e., DAOD vertical and horizontal distributions) from satellite observations, although size-resolved DREE from model simulations have been used in previous studies. We will show that our size-resolved DREE can allow users to readily compute the DREE and DRE of dust based on any dust PSD (e.g., from model simulations, satellite retrievals or in-situ measurements). We will also carry out an inter-comparison of the global dust DRE estimations based on different dust PSD and compare the results with previous studies. With these functions, we expect that the size-resolved DREE will be a useful tool for both observational and modeling studies of dust DRE.
The rest of the paper is organized as follows: Section 2 provides a description of the data and models used in this study. Section 3 describes the methodology of deriving the size-resolved DREE dataset. In Section 4 we describe a methodology of calculating the dust DRE with the size-resolved DREE dataset and its validation. In Section 5 we compare the regional and global dust DRE estimations based on different DAOD, dust PSD and compare the results with previous studies. Section 6 provides a summary of the study along with the main conclusions.
2.1 Satellite-based DAOD climatology
We use the CALIOP-based DAOD climatology and dust vertical distribution derived in Song et al. (2021) to derive a size-resolved dust DREE. The reason for choosing CALIOP-based DAOD climatology is discussed in detail in Sect. 3.2. The CALIOP-based dust climatology dataset contains monthly mean DAOD and dust vertical extinction profiles on a 5∘ (longitude) ×2∘ (latitude) spatial resolution grid for the period 2007–2019. The CALIOP-based DAOD and dust vertical distribution climatology from 2007 to 2010 are used to derive monthly mean size-resolved dust DREE datasets in this study. The selection of 4 years (2007–2010) for DREE calculations is based on several considerations. Firstly, the multiyear DREE calculations allow us to investigate the effect of interannual variations of atmospheric and surface properties on dust DRE. Secondly, this selection is consistent with Song et al. (2018), making it easier to compare our results with previous work. Thirdly, considering the computational efficiency, we do not extend the calculation to more years.
In addition to CALIOP-based DAOD climatology, we will use the MODIS-based DAOD climatology to investigate the sensitivity of dust DRE to DAOD spatial patterns in Sect. 5.2. The MODIS-based DAOD climatology achieves global coverage on a 5∘ (longitude) ×2∘ (latitude) spatial resolution for the period 2003–2019 by combining the monthly mean Aqua MODIS over-ocean (Yu et al., 2020) and over-land (Pu and Ginoux, 2018) DAOD. In contrast to CALIOP-based DAOD climatology, which is based on dust nonsphericity to separate dust aerosol from CALIOP total aerosol observations, MODIS-based DAOD retrieval is mainly based on large dust size to partition DAOD from MODIS total aerosol observations. The two sensor-specific dust partition methods result in different DAOD magnitude and spatial pattern retrievals.
Figure 1 shows the annual mean DAOD from 2007 to 2010 based on CALIOP and MODIS observations. The CALIOP-based and MODIS-based DAOD climatologies differ in terms of both magnitude and spatial pattern. The MODIS-based DAOD is generally larger than the CALIOP-based DAOD. For example, the global (60∘ S–60∘ N) 4-year mean MODIS-based DAOD is 0.047, while the CALIOP-based DAOD is 0.032. High DAODs are seen from both CALIOP-based and MODIS-based DAOD over the “dust belt” regions, where large-scale dust activities occur persistently throughout the year. However, the CALIOP-based DAOD is relatively low in some other regions that are known to be dusty in certain seasons, such as South America, Australia, and South Africa. In other words, the two satellite-based DAOD spatial patterns differ significantly with CALIOP-based DAOD being more concentrated over “dust belt” regions.
2.2 Dust physical and optical models
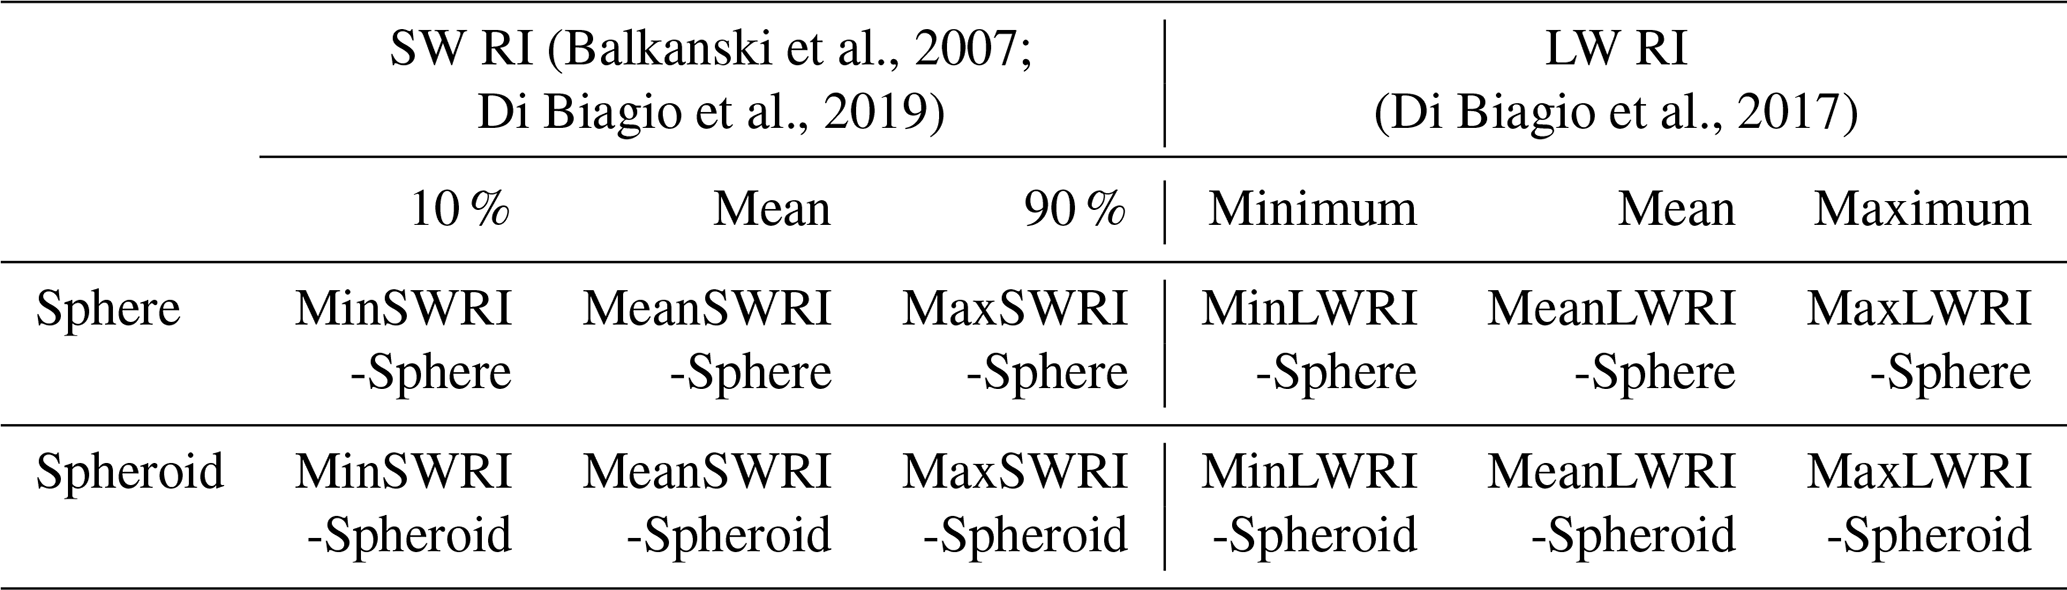
To study the sensitivity of dust DREE to dust RI and dust shape, we adopt three sets of dust RI (Fig. 2) and two dust shapes and compute a total of six sets of DREE based on their combinations. The three dust RI sets represent less absorptive, mean absorptive and more absorptive dust aerosols and the two dust shapes include spherical and spheroidal dust shapes (dust shape distribution is shown in Fig. 4a in Song et al., 2018). The mean, 10th and 90th percentile of the calculated RI for 19 dust samples over 8 regions in Di Biagio et al. (2019) are used to represent mean, less and more absorptive dust in SW. We combine RI of wavelengths from 0.37 to 0.95 µm measured in Di Biagio et al. (2019) and RI of other wavelengths up to 3 µm reported in Balkanski et al. (2007) to get full spectral coverage in SW. The mean, minimum and maximum RI of wavelengths beyond 3 µm measured in Di Biagio et al. (2017) are used to represent mean, less and more absorptive dust in LW. Two dust shapes are used to investigate the effect of dust nonsphericity on dust DRE. One is spherical dust shape, the other one is spheroidal dust shape with the dust aspect ratio distribution described by Fig. 4a in Song et al. (2018) which is originally from Dubovik et al. (2006). Each combination of dust RI and dust shape is considered as a dust model. As a result, the three dust RI and two dust shapes constitute six dust models in SW and LW, respectively, as shown in Table 1.
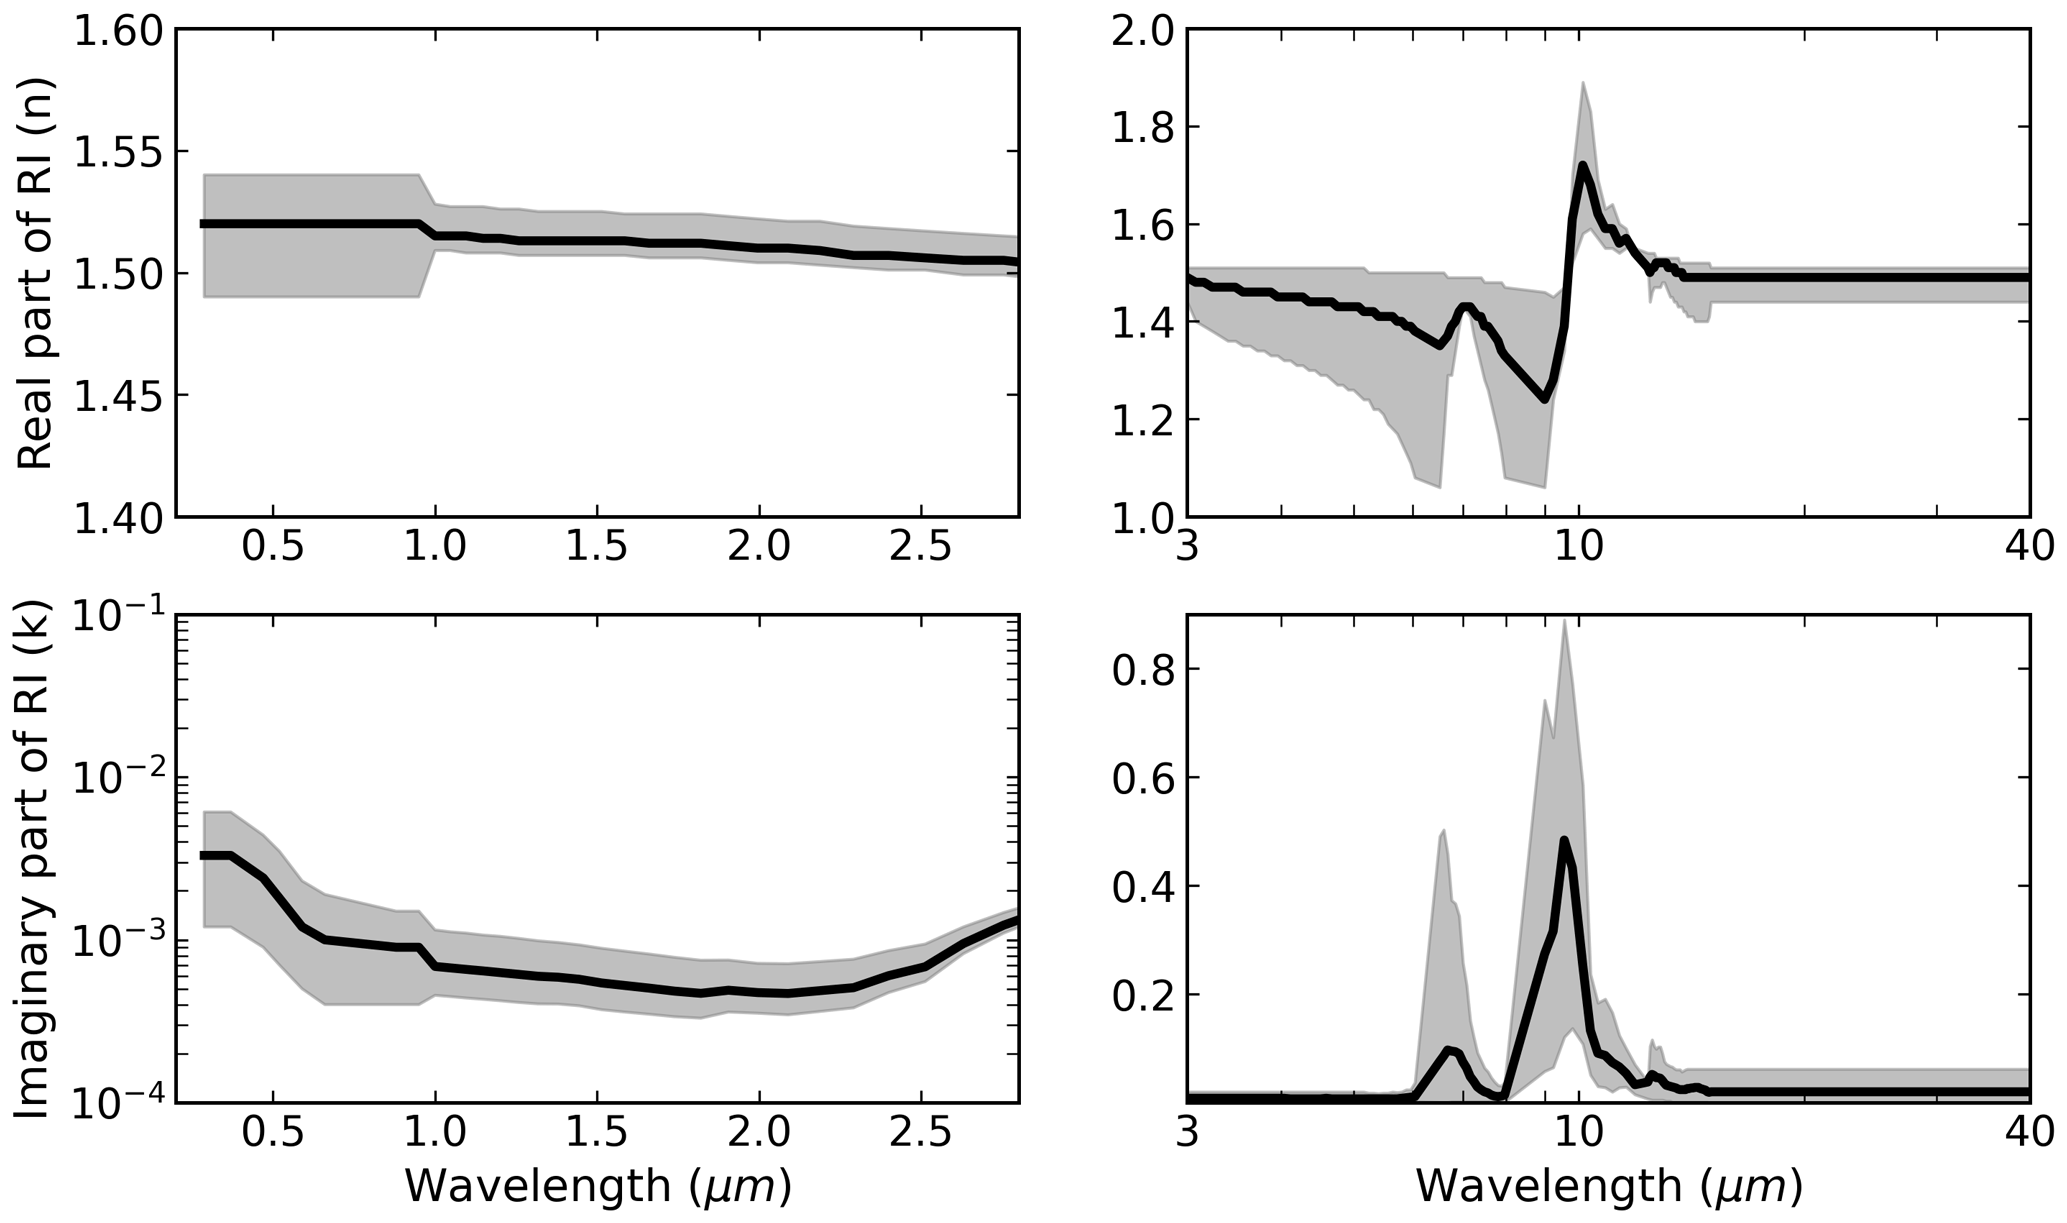
Figure 2The SW and LW spectral refractive indices (RI) used in this study obtained from Di Biagio et al. (2017, 2019) and Balkanski et al. (2007). The black curves represent the mean RI which indicates the mean absorptive dust. The grey shading represents the upper and lower limits indicating more absorptive and less absorptive dust, respectively.
Table 1Dust models used in this study. Three dust RI are used in shortwave (SW) and longwave (LW) to represent less, mean, and more absorptive dust. Two dust shape models are used to represent spherical and spheroidal dust shape. The three dust RI sets and two dust shapes constitute six dust models in each of SW and LW.
3.1 Size-resolved dust scattering properties
The rapid radiative transfer model (RRTM) (Mlawer et al., 1997) is used to compute both SW and LW radiative fluxes for both clean (i.e., cloud-free and aerosol-free) and dusty atmospheres (i.e., free of clouds and non-dust aerosols). The RRTM retains reasonable accuracy in comparison with line-by-line results for single column calculations (Mlawer and Clough, 1998; Mlawer et al., 1997). It divides the solar spectrum into 14 continuous bands ranging from 0.2 to 12.2 µm and the thermal infrared (3.08–1000 µm) into 16 bands. We explicitly specify the spectral DAOD, single scattering albedo (ω), and asymmetry parameter (g) of dust aerosols for every band in the RRTM radiative transfer simulations. In contrast to the radiative transfer scheme in most global models, which do not account for LW scattering, scattering capability is available through the discrete-ordinate-method radiative transfer (DISORT) in RRTM_LW (Stamnes et al., 1988). Four streams are used in DISORT. The Henyey-Greenstein phase function is used and only the first moment of the phase function (i.e., asymmetry parameter) needs to be specified in the RRTM.
Dust scattering properties (extinction efficiency Qe, ω and g) depend on several factors including dust PSD, RI, and dust shape. To account for the impact of dust PSD, we divide dust diameters into 10 logarithmically spaced size bins. The 10 size bins represent a wide range of dust geometric diameters (i.e., diameter of a sphere with the same volume) ranging from 0.1 to 100 µm. The geometric diameter (hereafter diameter or D) range of each size bin is listed in Fig. 3. For each size bin k, the spectral scattering properties ( are calculated for each dust model shown in Table 1 and each spectral band. In the calculations of scattering properties (, dust particle number (dN/dD) is assumed to be uniformly distributed within each size bin. We use the Lorenz–Mie theory code of Wiscombe (1980) to compute the spectral optical properties of dust particles in the assumption of sphericity. The spectral optical properties of spheroidal dust particles are derived from the database of Meng et al. (2010). Figure 3 shows for the MeanSWRI-MeanLWRI-Spheroid dust model. In SW, finer dust has a larger ω and smaller g, implying a more effective SW backscattering of finer dust. As a result, finer dust is expected to have stronger cooling effects (more negative DREE values) at TOA generally. In LW, is generally enhanced as dust size increases, which implies that coarser dust has a larger extinction in LW (optically represented by DAOD10 µm) than finer dust when DAOD532 nm is constrained by CALIOP retrieval. As a result, larger DAOD10 µm will enhance the LW warming (more positive LW DREE) at the TOA of coarser size bins. On the other hand, the increased ω and g of the coarser size bins indicates stronger forward scattering, which reduces the enhancement in LW warming induced by larger DAOD10 µm.

Figure 3Spectral scattering properties (i.e., Qe extinction efficiency, ω single scattering property, g asymmetry parameter) of each size bin for the MeanSWRI-MeanLWRI-Spheroid dust model. The scattering properties of each size bin are represented by the corresponding curve indicated in the legend. Each size bin is defined with respect to dust diameter with the unit micrometers (µm).
3.2 DREE dataset
Based on the dust scattering properties shown in Fig. 3 and the procedures summarized in Fig. 4, we compute the size-resolved dust DREE for the MeanSWRI-MeanLWRI-Spheroid dust model in SW and LW. In this section, we focus on demonstrating the method of deriving size-resolved dust DREE for one dust model, but this method is applicable to all six dust models listed in Table 1.
First, we use RRTM to simulate monthly mean dust DRE from 2007 to 2010 for each 5∘ (longitude) ×2∘ (latitude) grid with CALIOP-based DAOD532 nm exceeding 0.01. The DAOD532 nm≥0.01 threshold ensures most dusty regions over the globe are covered (see Figs. S1 and S2 in the Supplement) and in the meanwhile balances the computational cost. Dust DREs are calculated for each size bin using the extinction properties of the corresponding size bin shown in Fig. 3 (denoted as DRE, hereafter k indicates the size bin index and (i,j) indicates the longitude-latitude grid index, unless specified otherwise). Note that we do not consider dust RI spatial variation and dust size vertical variation due to the lack of observation-based dust mineralogy and size estimation on a global scale. In DRE calculations, we constrain the monthly mean dust extinction vertical distributions using the CALIOP-based climatological dataset of Song et al. (2021). It is worth mentioning that our target in this section is DREE calculations. Considering dust DRE is approximately linear to DAOD (Satheesh and Ramanathan, 2000), the DAOD used in dust DRE calculations will not significantly affect dust DREE results, we simply calculate dustDRE with respect toDAOD from CALIOP-based DAOD climatology. As a result, DRE calculated in this section are only intermediate variables used to calculate dust DREE, they do not represent the actual DRE contributed by k size bin. The atmospheric profiles, such as water vapor (H2O), ozone (O3) and temperature (Tatm) vertical profiles of 72 levels, are from 3-hourly MERRA2 assimilated meteorological fields data (Gelaro et al., 2017). We combine the 1-hourly surface albedo for visible beam from MERRA2 radiation diagnostics with the instantaneous spectral surface albedo from the integrated CALIPSO, Cloud-Sat, CERES, and MODIS merged product (CCCM) (Kato et al., 2011) to get time-dependent spectral surface albedo. Surface temperature is obtained from 1-hourly MERRA2 radiation diagnostics data. The atmospheric and surface properties are all aggregated to monthly mean values at eight UTC times: 00:30, 03:30, 06:30, 09:30, 12:30, 15:30, 18:30, 21:30 to obtain monthly mean diurnal cycles for radiative transfer simulations. Considering DRESW strongly depends on the solar zenith angle (SZA), we calculate DRESW for every 1 h using the corresponding hourly SZA in the mid-month day. As a result, every three SZA share the same atmospheric and surface properties in DRESW calculations due to their different temporal resolution.
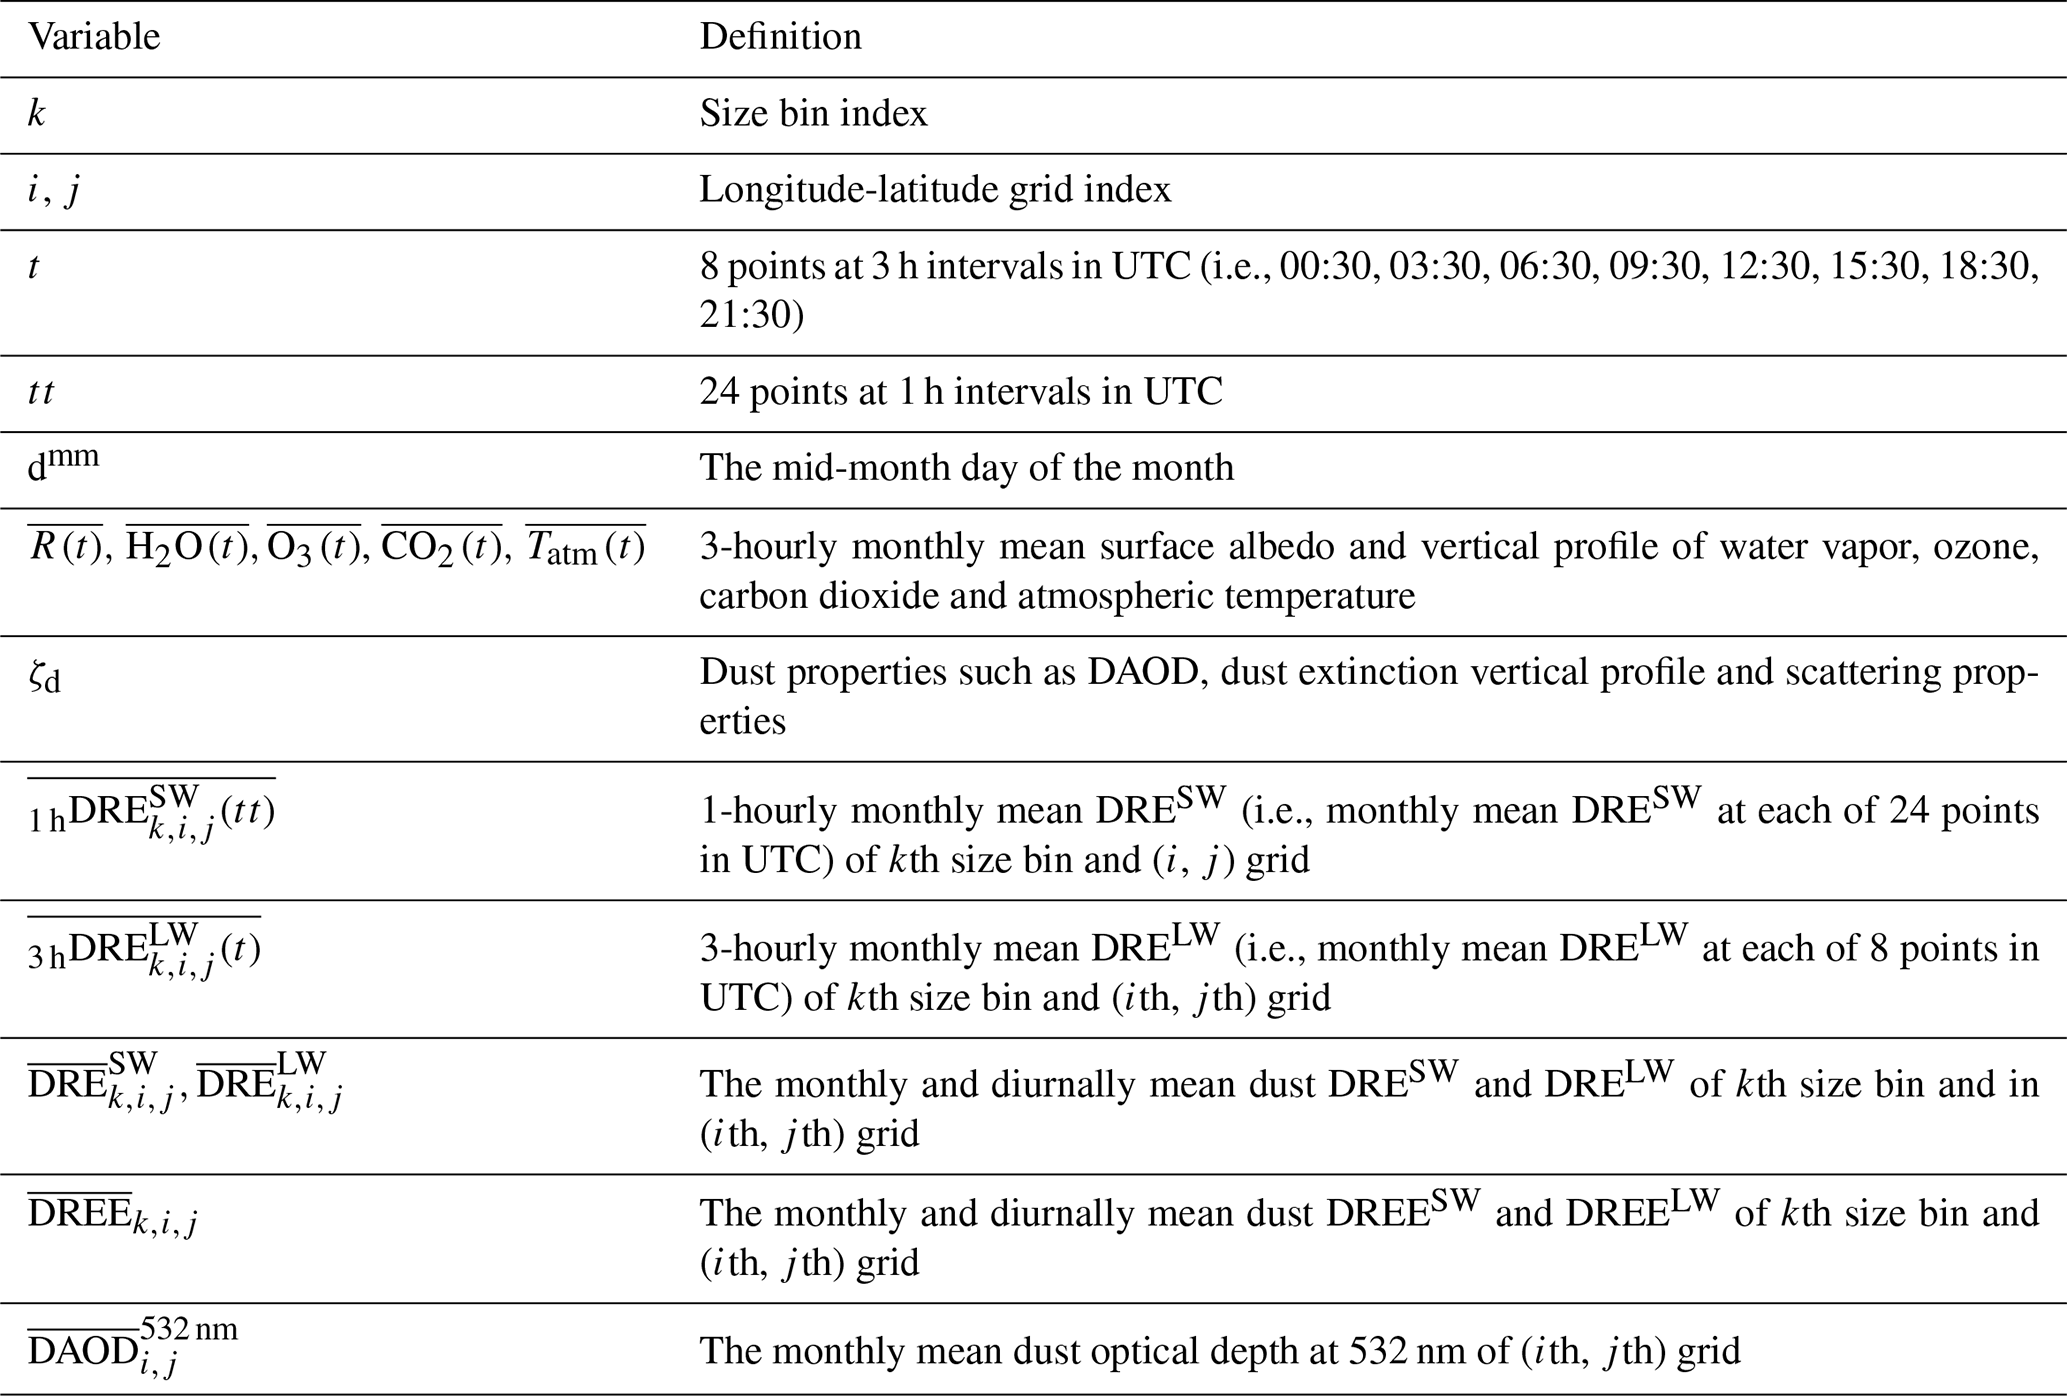
The definitions of variables and indices used to derive size-resolved dust DREE dataset are summarized in Table 2. Equation (1) shows the way of deriving 1-hourly monthly mean DRESW:
where “t” indicates eight points at 3 h intervals given in UTC, `tt' indicates 24 points at 1 h intervals given in UTC, “dmm” indicates the mid-month day of the month, and “” represents 3-hourly monthly mean surface albedo. We include 3-hourly monthly mean vertical profiles of water vapor, ozone, carbon dioxide ( to account for gaseous absorption. The temporal resolution inconsistency of SZA as well as atmospheric and surface properties requires that every three SZA share the same atmospheric and surface properties in the calculations. “ζd” represents dust properties such as DAOD, dust extinction vertical profile and scattering properties which are independent of UTC time in our calculations. The dust extinction vertical profile is interpolated to the 72 levels consistent with the vertical profiles of water vapor, ozone and temperature from MERRA2.
Equation (2) shows the way of deriving 3-hourly monthly mean DRELW:
Surface spectral emissivity (“E”) is obtained from Huang et al. (2016), which contains monthly mean spectral surface emissivity with a 0.5∘ spatial resolution based on MODIS-retrieved mid-IR surface emissivity and modeled different types of surface spectral emissivity. represents 3-hourly monthly mean vertical profile of the atmospheric temperature. With the aid of the 3-hourly monthly mean atmospheric properties, the monthly mean DRELW is calculated for every 3 h.
Then the 1-hourly monthly mean dust DRESW ( derived from Eq. (1) is averaged diurnally (over 24 points) to get the monthly and diurnally mean dust DRESW () as indicated by Eq. (3):
Similarly, the 3-hourly monthly mean DRELW ( derived from Eq. (2) is averaged diurnally (over 8 points) to get the monthly and diurnally mean dust DRE) as indicated by Eq. (4):
The method described by Eqs. (1)–(4) will be referred to as the “conventional” method of calculating monthly mean dust DRE in Sect. 4.
Based on the monthly mean size-resolved dust DRESW ( and DRELW (, we derive the monthly mean size-resolved dust DREE ( using Eq. (5) for SW and LW, respectively. Note that the monthly mean size-resolved dust DREE () is calculated by dividing by the monthly mean DAOD532 nm since the size-resolved was initially derived with respect to monthly mean DAOD532 nm.
Finally, we average the monthly mean size-resolved dust DREE ( over 4 years to get monthly mean size-resolved dust DREE datasets in addition to the associated interannual standard deviation (std). The std indicates the DREE uncertainty caused by interannual variation of monthly mean atmospheric and surface properties as well as dust vertical distributions. Finally, the dataset developed in this study contains monthly mean size-resolved dust DREE and its associated interannual std at TOA and surface with dimension of 10 bins, 12 months, 90 latitudes, 72 longitudes for each of 6 dust models in SW and LW. Figures S1 and S2 in the Supplement demonstrate the global distribution of the monthly mean size-resolved DREESW and DREELW at TOA for June.
It is important to note that the dust DREE of each grid cell rarely depends on the DAOD because dust DRE is approximately linear with DAOD (Satheesh and Ramanathan, 2000). Therefore, the choice of CALIOP-based or MODIS-based DAOD climatology to derive the global () size-resolved DREE dataset will not lead to a large difference. In other words, the size-resolved DREE dataset is rarely related to the robustness of the DAOD used in the derivation process. We select CALIOP-based DAOD to derive the size-resolved dust DREE dataset because the CALIOP-based dust climatology contains a dust vertical distribution, which is especially important for obtaining LW DREE. Nevertheless, using CALIOP-based dust retrieval to derive size-resolved dust DREE dataset has several limitations: (1) the size-resolved dust DREE dataset may miss some regions with tenuous dust layers that are below the CALIOP sensitivity. (2) The LW DREE is related to the quality of dust vertical distribution retrieval. By contrast, dust DRE highly depends on DAOD, therefore we will use different DAOD climatological datasets retrieved from different sensors (i.e., CALIOP and MODIS) to investigate global dust DRE in Sect. 5.2. Furthermore, even though dust DREE of each grid cell is rarely related to DAOD, regional or global mean dust DREE will depend on the DAOD spatial distribution (i.e., DAOD 2D distribution) in the region of interest (see details in Sect. 5.2).
Based on the monthly mean size-resolved dust DREE datasets derived above, we further calculate global annual mean size-resolved dust DREESW and DREELW at TOA and surface for the six dust models (Fig. 5). As already discussed the global mean dust DREEs depend on the DAOD spatial distribution and the global mean dust DREEs shown in Fig. 5 are based on CALIOP-based DAOD spatial distribution from Song et al. (2021). Generally smaller bins cause stronger cooling in SW and less warming in LW, which is consistent with our discussions in Sect. 3.1. This observationally informed global annual mean size-resolved dust DREE is also consistent with the model-simulated results shown in Fig. S3 in Kok et al. (2017) in terms of the variation trend of DREE with respect to dust size. Moreover, our study explicitly shows the sensitivity of dust DREE to dust RI and dust shape. For example, Fig. 5 shows that DREESW is strongly sensitive to dust RI as DREESW of different dust RI is widely separated. Depending on dust RI, DREESW switches from cooling effects (negative value) to warming effects (positive value) at different size bins. More absorptive dust starts to warm the earth system in SW at smaller dust size, and vice versa. In addition, our results suggest that DREESW is generally not sensitive to dust shape. Specifically, dust shape is not important for DREESW in most size bins, while it is important in the fourth size bin ( with DREESW of spheroidal dust obviously higher (less negative) than spherical dust. In the DREELW, dust shape is almost as important as RI for several size bins.
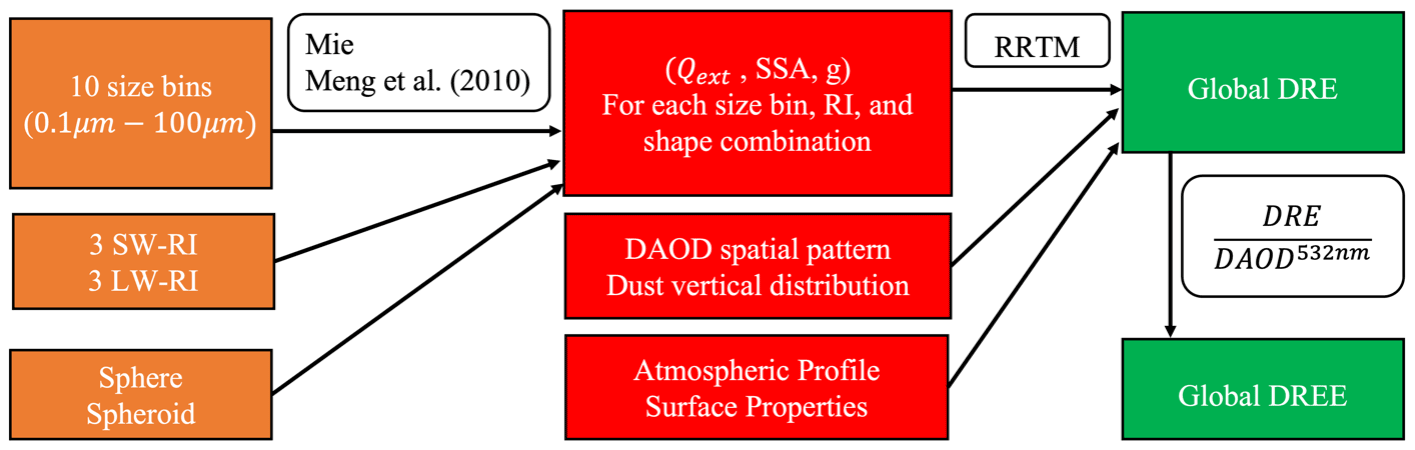
Figure 4Schematic of the methodology used to derive size-resolved dust DREE dataset. Orange boxes denote dust models used to calculate dust scattering properties. Red boxes denote inputs for RRTM. Green boxes denote outputs from RRTM.
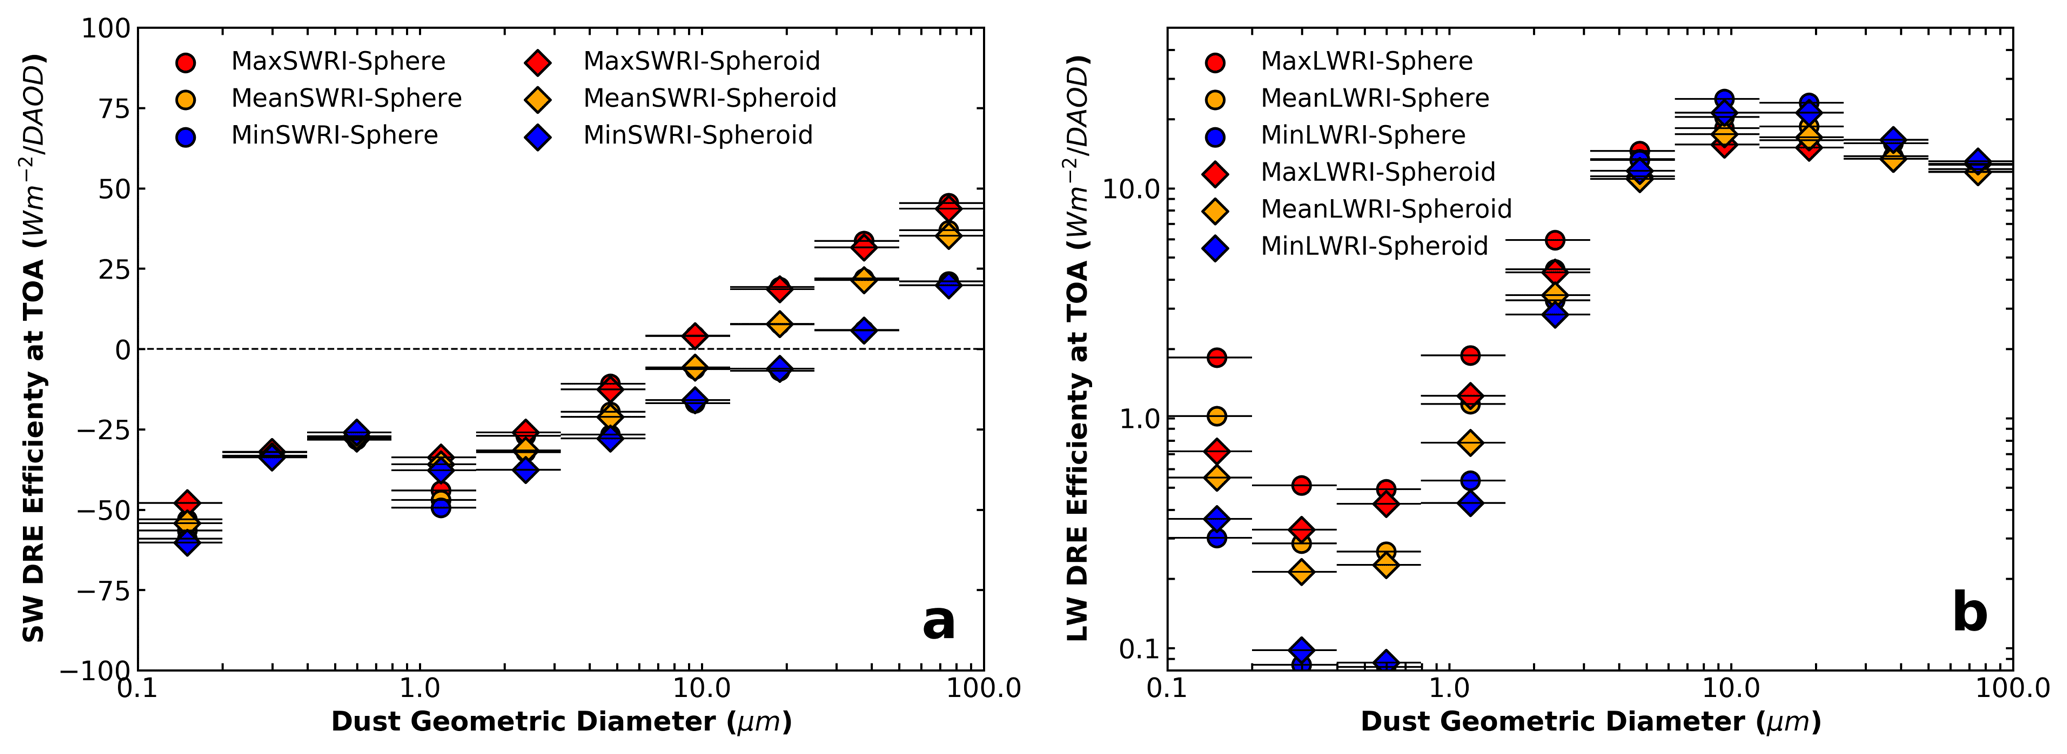
Figure 5Globally annual mean size-resolved dust DREE in SW (a) and LW (b) for six dust models (six markers). Horizontal bars indicate the dust diameter range of each size bin. Note: LW DREE is on a logarithm scale; in contrast to global model simulations, we consider dust LW scattering in LW DRE efficiency calculations.
Our size-resolved dust DREE dataset is unique in many aspects: first, our DREE dataset is derived from CALIOP-based dust 3D distributions. Size-resolved DREE is derived for all grids with CALIOP-based DAOD ≥0.01. Second, our size-resolved DREE dataset covers a wide range of dust diameters, specifically, they include dust DREE for 10 dust diameter size bins ranging from 0.1 to 100 µm. This is challenging, if not impossible to obtain from global models because these models generally simulate dust particles with diameters only up to 20 µm and coarse dust particles in models deposit quickly and could not be sustained in the atmosphere and transport to the remote transport regions (Huneeus et al., 2011; Adebiyi and Kok, 2020) where coarse particles have been observed by in situ measurements (Weinzierl et al., 2017). As a result, our size-resolved DREE dataset achieves a wide spatial coverage for a large range of dust sizes. This is critical for investigating the impacts of coarse dust and even giant dust particles on dust DRE on both regional and global scales. Third, considering that the dust vertical distribution is important for quantifying DRELW, we constrain dust vertical distribution using CALIOP-based dust retrievals in DREELW computations. Fourth, our size-resolved dust DREE dataset accounts for dust LW scattering in DREELW calculations since scattering capability is available through the DISORT in RRTM_LW (Stamnes et al., 1988). Dufresne et al. (2002) suggest that dust LW scattering enhances the dust LW warming effect at TOA by a factor of up to 50 %. However, dust LW scattering is generally not considered in most global models. Therefore, many previous studies artificially account for dust LW scattering by increasing the radiative perturbation due to LW absorption by a certain fraction. For example, Kok et al. (2017) account for LW scattering by artificially augmenting DRELW by 23 % and Di Biagio et al. (2020) augmented DRELW by 50 %.
On the other hand, our size-resolved dust DREE dataset has several limitations. First, possible vertical and horizontal variations of dust particle size in each grid box ( are not accounted for in our calculation. The entire dust-loading column in each grid box is assumed to have the same dust size distribution. Second, we do not explicitly account for spatial variation of dust RI; in other words, dust RI is assumed to be globally uniform. This uncertainty is assessed through the sensitivity tests of DREE to dust RI using 3 sets of state of the art dust RI based on laboratory measurement of 19 dust samples all over the world. Third, dust 3D distribution in the DREE calculation is constrained by CALIOP observations. The limits on the sensitivity of CALIOP will affect the 3D distribution of dust in our calculation. Fourth, we account for dust nonsphericity by using a spheroidal shape model. This shape cannot perfectly represent the highly irregular shape and roughness of real dust. In addition, several studies suggested that dust nonsphericity is underestimated by the spheroidal shape model (Huang et al., 2020). The spheroidal shape model assumption thus might produce systematic errors.
Overall, the size-resolved dust DREE dataset is useful in many dust-related studies. First, with our size-resolved dust DREE dataset, dust DRE could be calculated efficiently for any DAOD magnitude, any DAOD spatial pattern and any dust PSD for any regions of the globe (see details in Sect. 4.1). Second, our size-resolved DREE dataset is derived for different RI and different dust shapes. As a result, we could estimate dust DRE uncertainty coming from DAOD, PSD, RI, and shape separately to better understand major uncertainty sources in dust DRE estimations. Third, our size-resolved DREE dataset could be used to evaluate model simulated DREE for each size bin.
4.1 DRE calculation based on DREE dataset
With the size-resolved dust DREE dataset derived in Sect. 3.2, DRE of dust with any PSD and DAOD could be computed very efficiently without performing radiative transfer simulations as we do in the conventional method. This section introduces the methodology of applying the size-resolved DREE dataset to calculate DRE of dust with any PSD and DAOD.
The DRE of the full size range of dust can be expressed as the sum of DRE from each size bin (DREk). Dust DREk is approximated to be linearly proportional to DAOD of kth size bin (DAODk) (Satheesh and Ramanathan, 2000). A similar concept of calculating dust DRE has been used in previous studies e.g., Kok et al. (2017). Equation (6) shows the process of computing dust DRE using the size-resolved DREE dataset:
where “DRE” represents dust DRE induced by the full size range of dust with an optical depth of “DAOD” and fk is the fraction of the DAOD contributed by the kth size bin.
Each variable in Eq. (6) can be obtained or derived from datasets developed in this study and other studies. For example, the size-resolved DREE dataset ( derived in this study is essential for utilizing this efficient and novel DRE calculation method. The DAOD can be obtained from CALIOP-based or MODIS-based DAOD climatological datasets (Song et al., 2021) and fk can be derived from the dust extinction efficiency (Qe), the geometric cross-sectional area (A) and dust PSD ( based on Eq. (7):
where Qe is defined according to , where σe is the extinction cross-section and the geometric cross-sectional area of the particle (A) can be expressed as A=πr2. Under the assumption of spherical dust particle, r is the radius. Under the assumption of spheroidal dust particle, Vouk (1948) showed that the average projected area of a convex body (e.g., spheroidal particle) is A=πr2, where r is the radius of a surface area-equivalent sphere. The average is taken over all possible orientations in space, which is consistent with our assumption of randomly oriented dust particles in the atmosphere. The for the six dust models are shown in Fig. 6a, they all converge to 2 as the dust diameter becomes much larger than the wavelength, which is consistent with the principle of geometric optics (van de Hulst, 1957). By contrast, of nonspherical dust in Kok et al. (2017) has a much larger value than spherical dust for dust D≥1 µm (see their Fig. 1b). This discrepancy is probably due to the different Qe definitions used in the two studies. Kok et al. (2017) defined Qe as dust extinction per unit cross-section of a volume-equivalent sphere. Figure 6b shows that fk of a specific PSD is not sensitive to dust RI and dust shape, this is also suggested by the similar vs. geometric diameter (D) trends of the six dust models shown in Fig. 6a. In contrast, f4 (i.e., fk for the fourth size bin with D ranging from 0.79 to 1.58 µm) is more sensitive to dust shape than other size bins, this is in line with the larger difference in with the shapes shown in Fig. 6a.

Figure 6(a) Dust extinction efficiency (Qe) at 532 nm for 6 dust models. (b) The colored bars represent fk calculated for six dust models based on a specific dust PSD ( indicated by the black curve. Note, fk is not sensitive to different dust models such as dust RI and dust shape.
In summary, the size-resolved dust DREE dataset provides an efficient way to compute DRE for any dust PSD and any DAOD by using Eqs. (6) and (7). To distinguish from the conventional method introduced in Sect. 3.2, this method of calculating dust DRE based on size-resolved DREE dataset is referred to as “DREE integration” method.
4.2 Validation of DRE calculation methodology
In this section, we select the Sahara Desert (14–30∘ N, 15∘ W–30∘ E) to validate the DREE integration method. We choose the MeanSWRI-MeanLWRI-Spheroid dust model and Fennec-Fresh dust PSD (see red curve in Fig. 7) measured within 12 h of dust uplift in remote Sahara locations by the Fennec field campaign to represent microphysical properties of Saharan dust (Ryder et al., 2013a, b). The monthly mean DAOD is from CALIOP-based DAOD climatology.
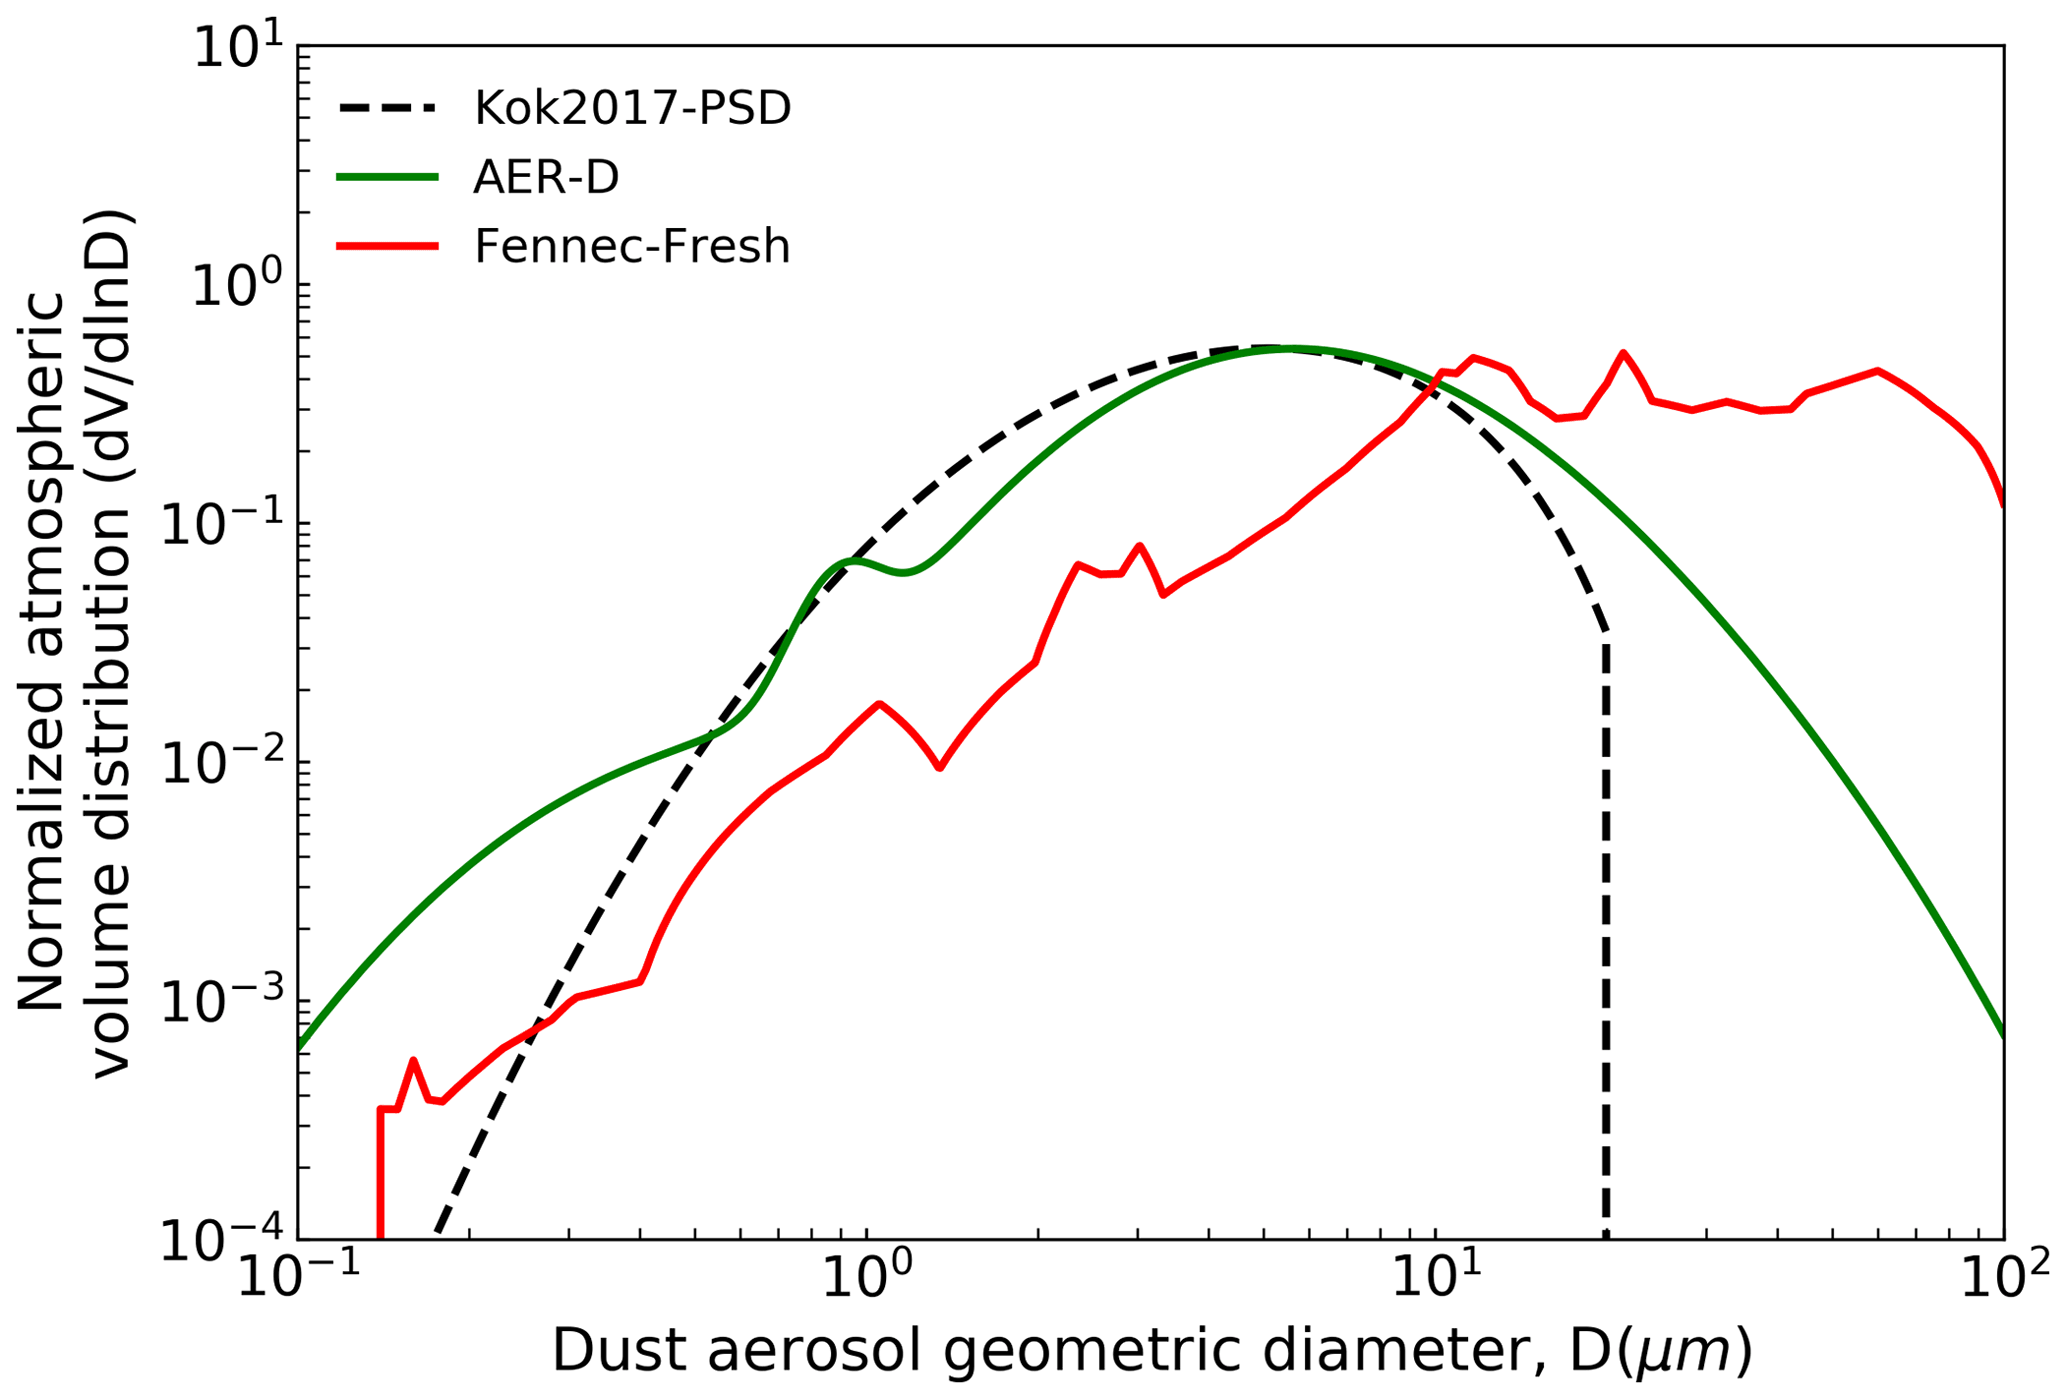
Figure 7Normalized atmospheric dust volume distribution (dV/dlnD) described in Table 5 (Kok et al., 2017; Ryder et al., 2013a, b, 2018, 2019).
Figure 8 shows the comparison of 4-year (2007–2010) monthly mean dust DRE between the conventional and DREE integration methods. In conventional DRE calculation, dust scattering properties (Qe, ω and g) are calculated based on the Fennec-Fresh PSD and then used to calculate monthly mean dust DRE from 2007 to 2010 with RRTM as described in Sect. 3.2 (Eqs. 1–4), while the DREE integration method is based on the monthly mean size-resolved DREE dataset derived from the 4-year (2007–2010) data as described in Sect. 4.1 (Eqs. 6–7). The excellent agreement in monthly mean dust DRE between the two methods validates the DREE integration DRE calculation methodology.
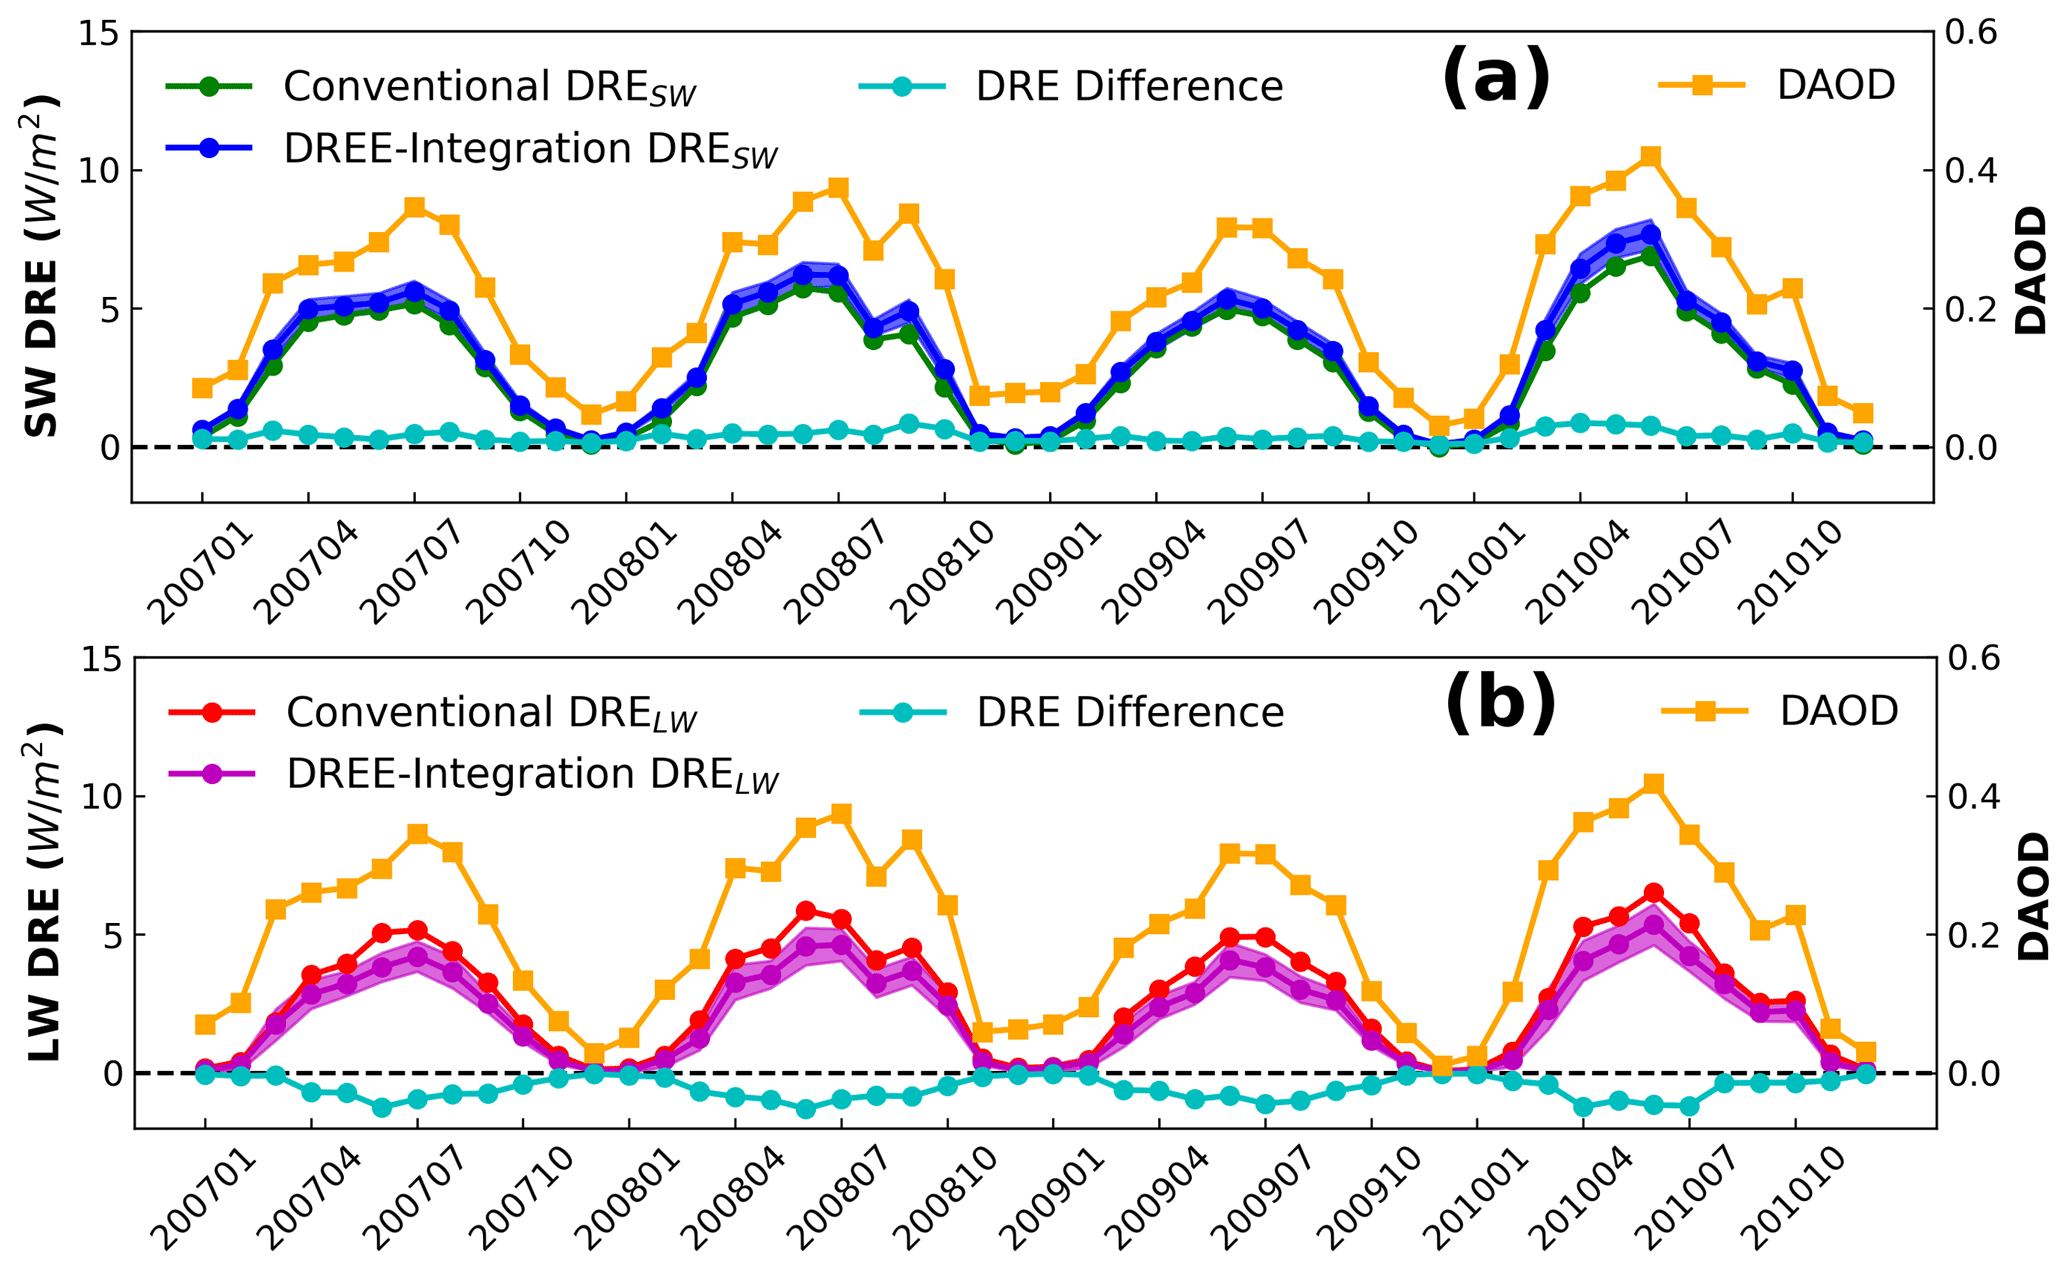
Figure 8Monthly mean dust DRESW (a) and DRELW (b) comparison between conventional and DREE integration calculations from 2007 to 2010 over the Sahara Desert. The DRE difference line represents the difference between DREE integration and conventional calculations. Shaded areas along DREE integration DRE indicates the one standard deviation caused by the atmospheric and surface variations as well as dust vertical distribution variation within the 4 years. Orange curves indicate CALIOP-based monthly mean DAOD. The variation of dust DRE match well with DAOD variation.
The shaded areas associated with DREE integration DRE correspond to the one standard deviation of DREE caused by the 4-year (2007–2010) interannual variation of factors except dust microphysical properties such as monthly mean atmospheric and surface properties as well as dust vertical distributions (hereafter these factors are referred to as non-dust factors for short). The narrow shaded areas along DREE integration DRE suggest that non-dust factors cause very small uncertainty in dust DRE estimations. However, the small effects of the 4-year interannual variation of non-dust factors may not necessarily be representative due to the limited number of years considered. Section 2.1 discusses in detail the reason for choosing 2007–2010 to derive the size-resolved DREE dataset. To check the representativeness of 4-year interannual variation for non-dust factors, we compare the 4-year (2007–2010) and 10-year (2007–2017) interannual standard deviation (std) of monthly mean non-dust factors (e.g., surface albedo, surface temperature and dust vertical distribution) in Fig. 9. To evaluate the interannual variation of dust vertical distribution, we define dust mean extinction height (Zα) referring to Koffi et al. (2012) as , where βext,i is the dust extinction coefficient at 532 nm at level i, and Zi is the altitude of level i. Nevertheless, the 10-year std is slightly larger than 4-year std, they are both close to zero and of the same order of magnitude. As such, even though our monthly mean size-resolved DREE dataset is derived from 4-year (2007–2010) data, they could be used to represent DREE and calculate DRE for other years considering the small sensitivity of monthly mean dust DRE to interannual variation of non-dust factors.

Figure 9Probability density function (PDF) of 4-year and 10-year interannual standard deviation (std) in monthly mean (a) surface albedo, (b) surface temperature, and (c) dust mean extinction height. The PSD analyses include interannual std in 12 months and all 5∘ (longitude) ×2∘ (latitude) grid cells over the world and their mean values are indicated as std_mean on each graph.
After the validation of the DREE integration method in Sect. 4, we use the DREE integration method to calculate regional and global dust DRE in this section. There are three main objectives in this section: (1) the most important objective throughout this section is to demonstrate the usefulness of the size-resolved DREE dataset for calculating regional and global dust DRE for any given dust PSD, (2) the second objective is to validate the size-resolved DREE dataset by comparing with regional dust DREE reported by field studies based on satellite and ground-based observations (Sect. 5.1) and (3) the third objective to assess the sensitivity of dust DRE to DAOD spatial pattern (Sect. 5.2) as well as dust microphysical properties such as dust PSD, RI and shape (Sect. 5.3).
5.1 Comparison with observation-based regional dust DREE
Table 3 shows the comparison of our calculations of clear-sky regional mean SW and LW DREE with those reported by field studies based on satellite and ground-based observations. We first calculated the regional mean dust DRE using the DREE integration method, then divided by the corresponding regional mean DAOD to get regional mean DREE, and then compared this with observation-based results from previous studies. Comparing DREE allows eliminating differences due to the variation in regional dust loading, optically represented by DAOD.
Knowledge of regional dust PSD is necessary for estimating dust DRE regionally. There are several in situ measurements of dust PSD over the Sahara and the tropical eastern Atlantic. The state of the art airborne observations of Saharan dust from the Fennec field campaign (Fennec-Fresh) and transported Saharan dust over the tropical eastern Atlantic within the Saharan air layer (SAL) from both AER-D and Fennec fieldwork campaigns are adopted (Ryder et al., 2013a, b, 2018, 2019) (see Fig. 7). Both campaigns included giant dust particles, measuring up to 100 µm diameter for AER-D and up to 300 µm for Fennec. The wide coverage of dust diameters in our size-resolved DREE dataset allows dust DRE calculations for giant dust up to 100 µm over both dust source and transported regions where giant particles were observed in those campaigns. This is an advantage of our size-resolved DREE dataset compared to modeled dust DREE, because climate models generally cut off dust diameter at 20 µm and could not sustain coarse dust to remote transport regions due to several missing mechanisms in models (Van Der Does et al., 2018; Drakaki et al., 2022; Meng et al., 2022).
The Fennec-Fresh dust PSD includes measurements within 12 h of dust uplift in remote Saharan locations. It is used to calculate dust DRE for Saharan dust in this section. In reality, dust over the wide Sahara Desert region (15–30∘ N, 10∘ W–30∘ E) is not all lifted within 12 h, so using Fennec-Fresh to represent dust PSD over the wide Sahara Desert could bias dust size as coarse, which could partially explain the warm bias in our DREESW estimation over the Sahara Desert compared to the satellite-based result. Over the tropical Atlantic, both AER-D and Fennec-SAL measured PSD are used to assess the sensitivity of dust DREE to dust PSD. In addition, dust DRE is calculated for three dust RIs to evaluate the sensitivity of dust DREE to dust RI as shown in Table 3. Generally, our dust DREE estimations achieve good agreement with observation-based dust DREE. However, there is a significant uncertainty caused by dust RI in DREE, especially for SW. In addition, DRE comparisons between AER-D and Fennec-SAL over the tropical Atlantic suggests that in situ measured dust PSD uncertainty leads to a large uncertainty in regional DREE in both SW and LW.
Based on the regional DREE study with the state of the art RI and PSD, we found DREESW uncertainty could come from both dust RI and dust PSD, while DRELW uncertainty is mainly from dust PSD.
Table 3Comparison of our DREE estimations for different PSD and RI with clear-sky regional SW and LW dust DREE reported by field studies based on satellite and ground-based observations. Specifically, we calculated regional dust DREE for different RI (Min, Mean, Max) and different PSD (AER-D and Fennec-SAL for tropical Atlantic) and then compared them with observation-based results from previous studies. Note, spheroidal dust shape is assumed in our DREE integration DRE calculations.
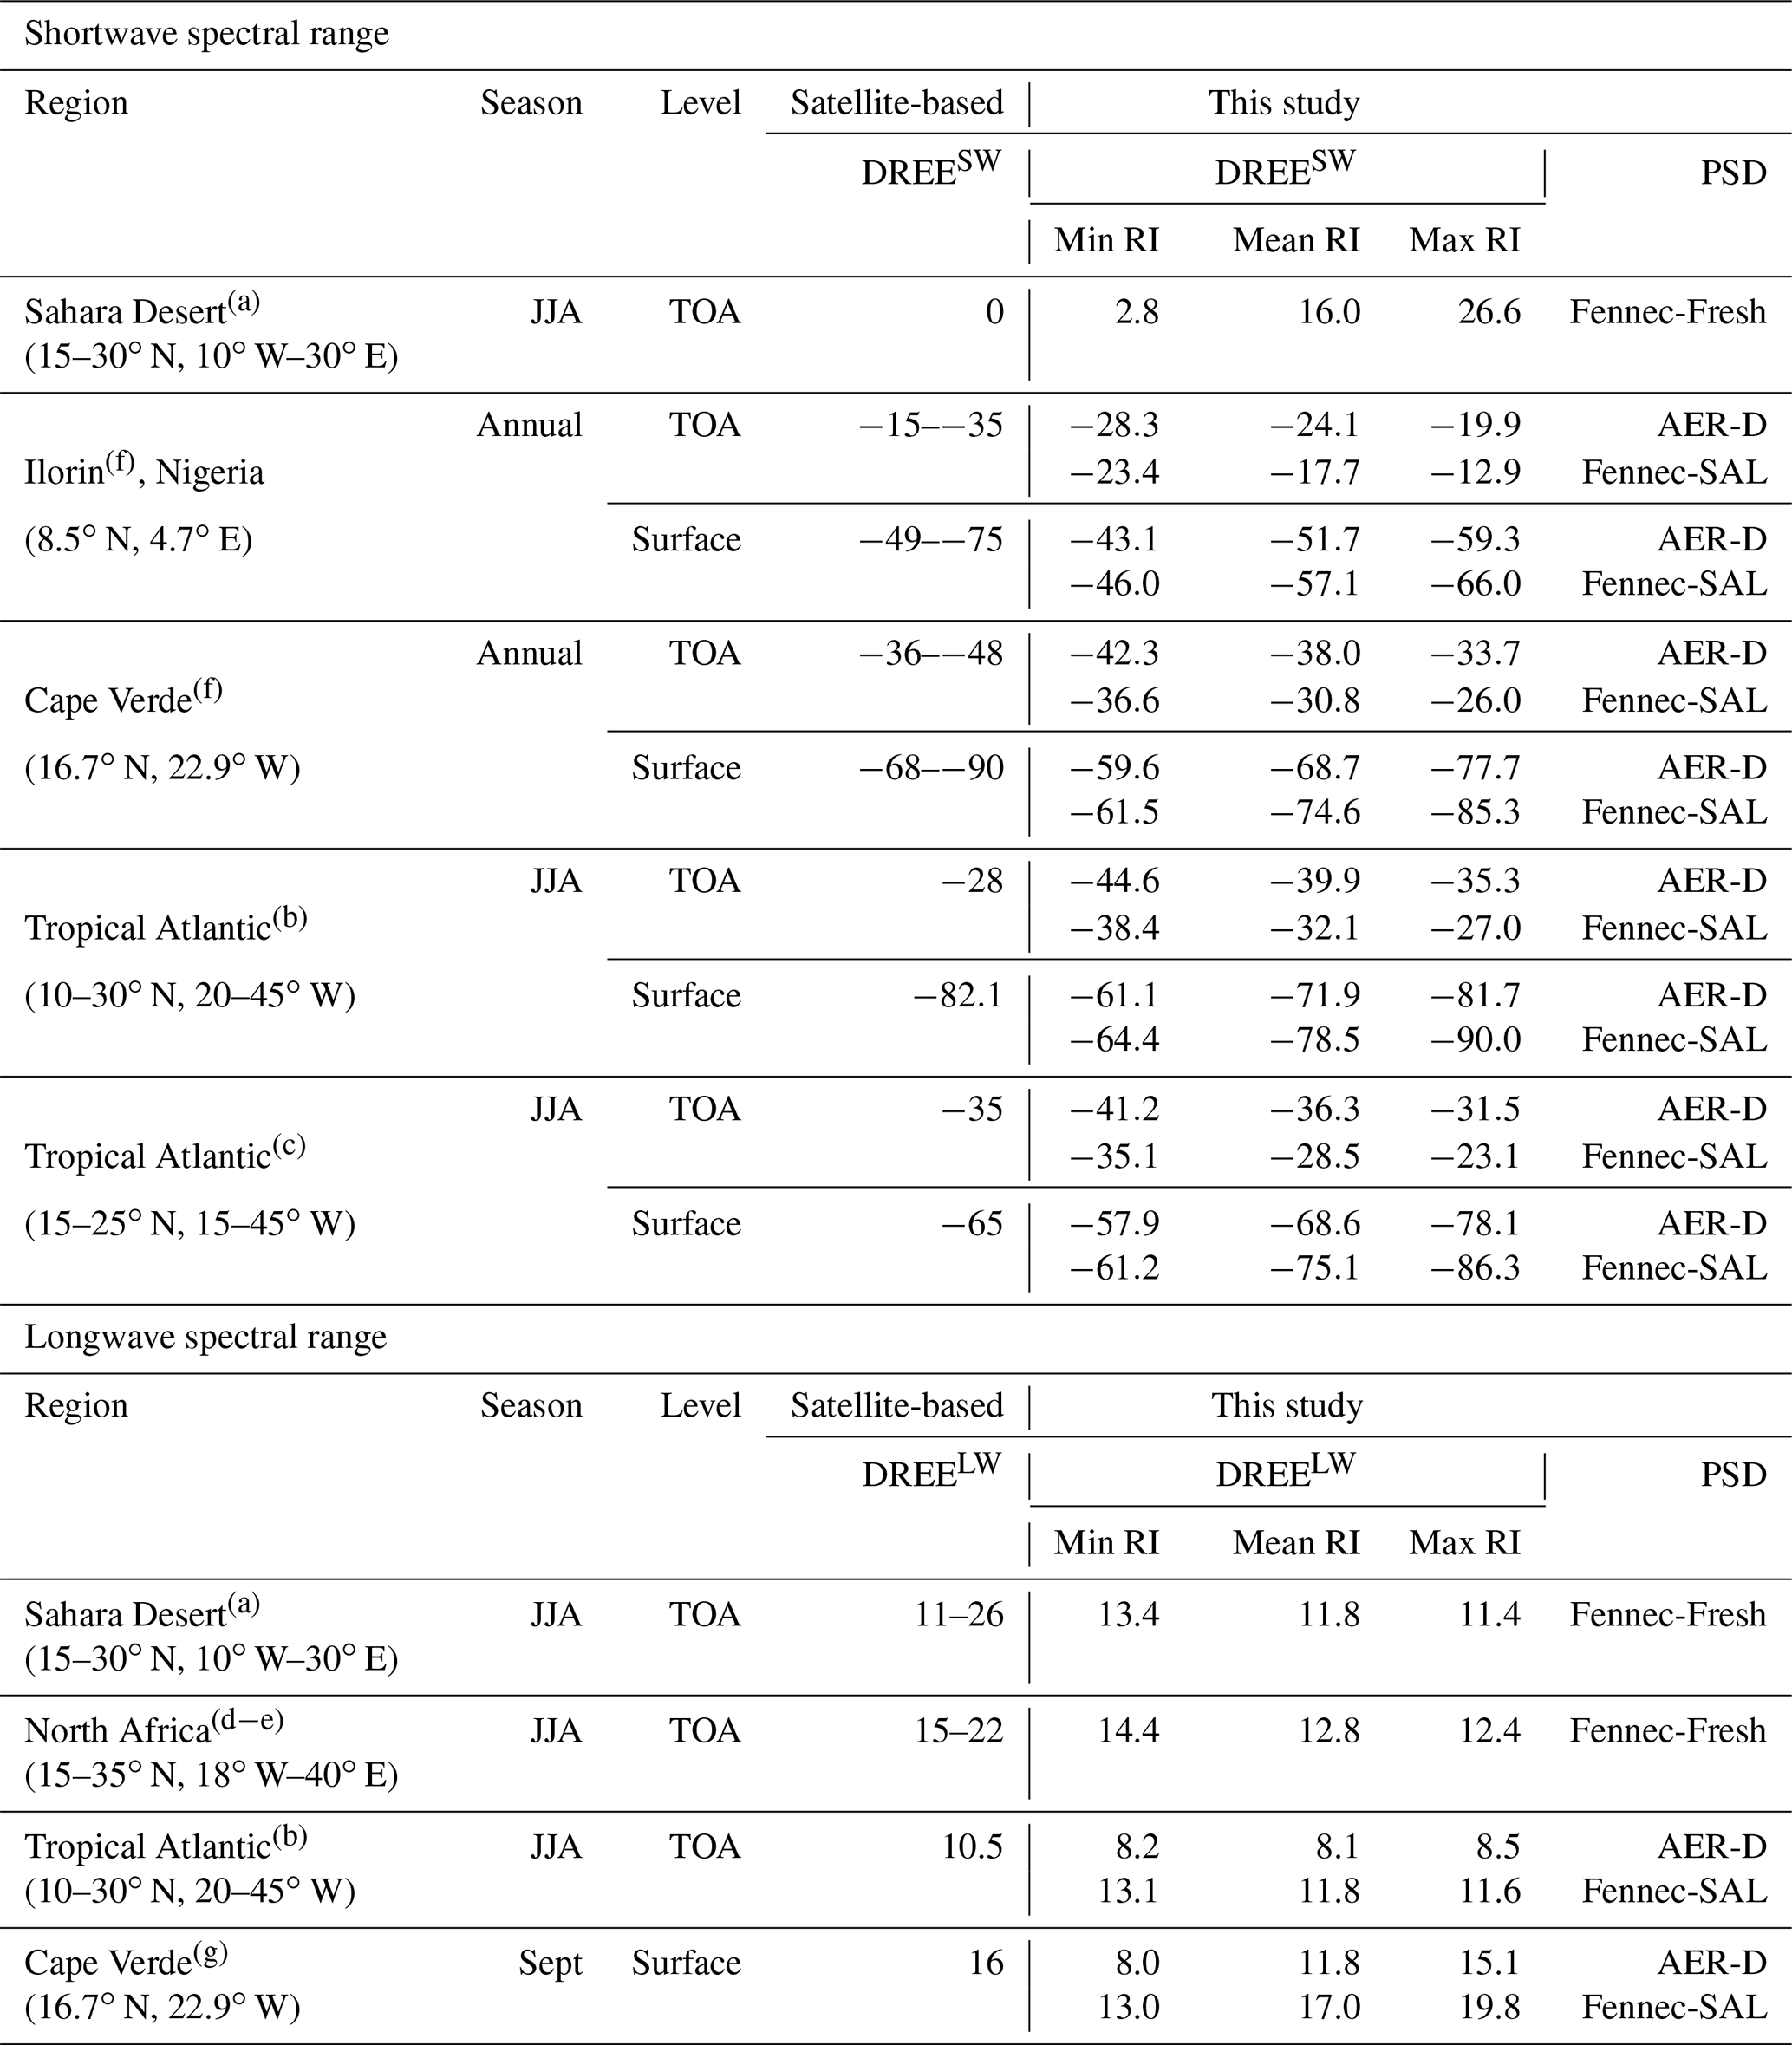
(a) Patadia et al. (2009), (b) Song et al. (2018), (c) Li et al. (2004), (d) Zhang and Christopher (2003), (e) Brindley and Russell (2009), (f) Zhou et al. (2005), (g) Hansell et al. (2010).
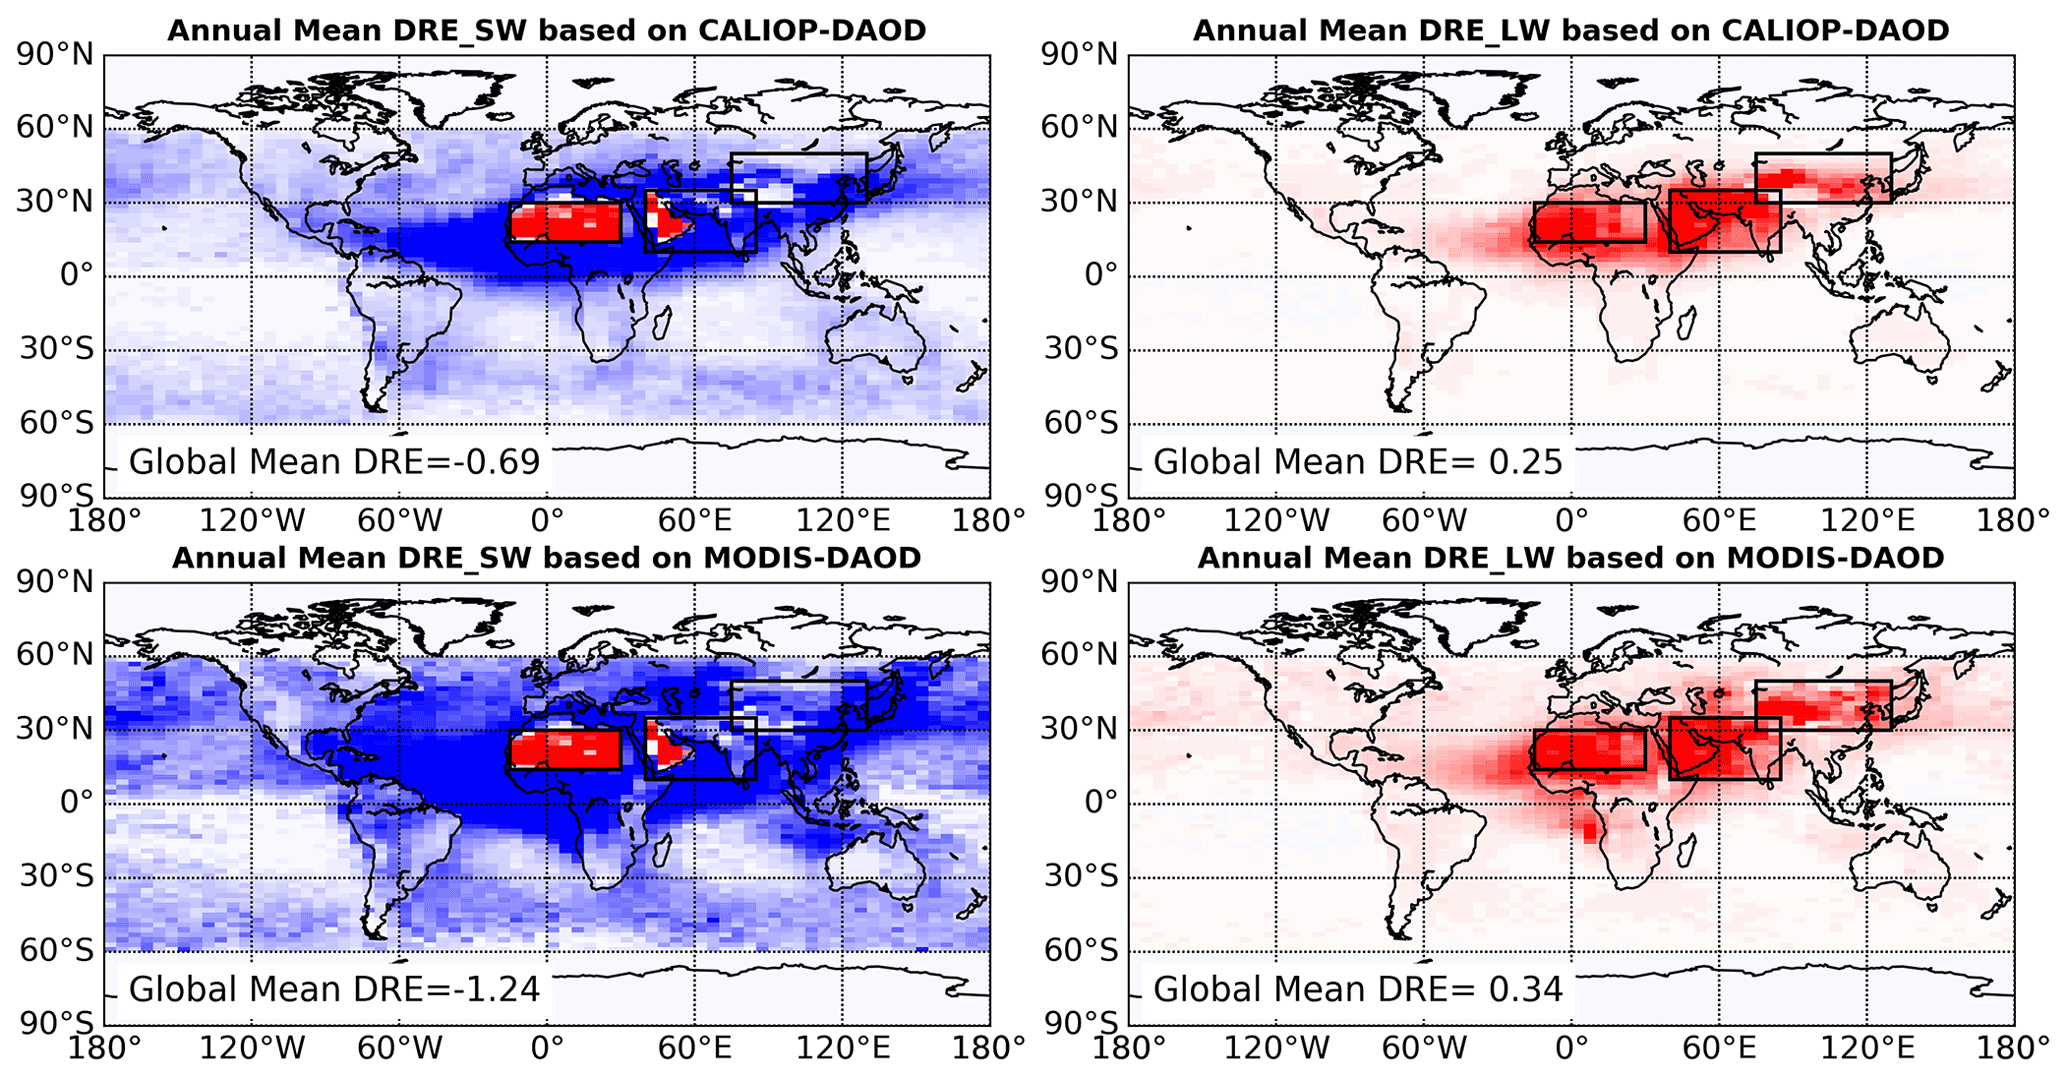
Figure 10Annual mean dust DRE global distributions based on CALIOP and MODIS DAOD climatology. The MeanSWRI-MeanLWRI-Spheroid dust model is used to represent dust RI and shape in the calculations. Campaign PSD is used to represent dust PSD, specifically, Fennec-Fresh PSD is used to represent dust PSD over the three major dust source regions indicated by three black boxes. AER-D PSD is used to represent dust PSD over other regions.
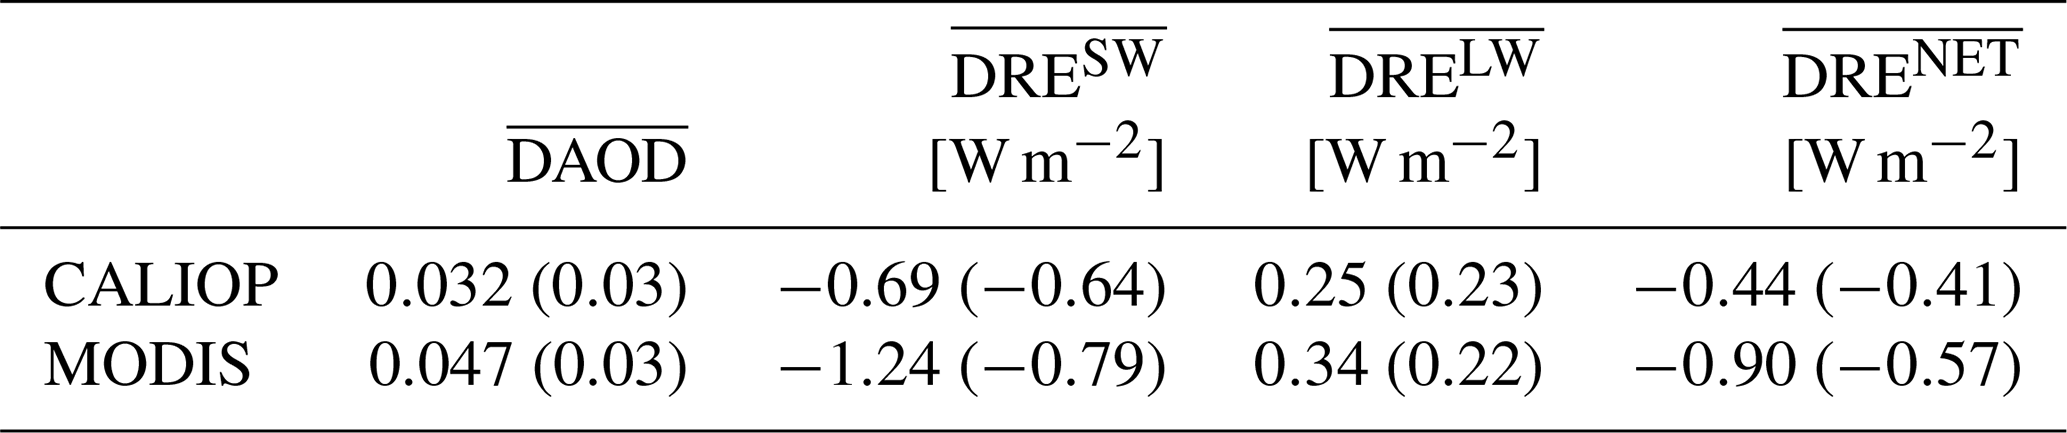
Table 4Globally annual mean DAOD, DRESW, DRELW and DRENET based on CALIOP DAOD and MODIS DAOD climatology. Note, values in parentheses are for the two DAOD scaled to the same value of 0.03.
5.2 Global dust clear-sky DRE based on different DAOD climatology
The DAOD is the most important factor in determining dust DRE. As illustrated in Song et al. (2021), the DAODs retrieved from different satellite sensors have a large difference in terms of magnitude and spatial distribution. To evaluate how the current DAOD uncertainty affects dust DRE estimations, the global dust DRE computed based on monthly mean DAOD climatology retrieved from CALIOP observations and MODIS observations are compared in this section. To separate the effect of DAOD from other factors, we use the same dust PSD, RI and shape in the two sets of dust DRE calculations in this section. Specifically, we use the Fennec-Fresh PSD for three major dust source regions (i.e., Sahara (14–30∘ N, 15∘ W–30∘ E), Middle East (10–35∘ N, 40–85∘ E) and eastern Asia (30–50∘ N, 75–130∘ E), which are indicated by three black boxes in Fig. 10 and use AER-D PSD for other regions (hereafter Campaign-PSD, see Table 5). The MeanSWRI-MeanLWRI-Spheroid dust model described in Table 1 is used to represent dust RI and shape.
The two DAOD climatological datasets result in distinct dust DRE spatial patterns as shown in Fig. 10, which is consistent with the DAOD spatial patterns shown in Fig. 1 suggesting CALIOP DAOD is more concentrated over “dust belt” regions than MODIS DAOD. The global mean dust DRESW, DRELW and DRENET based on the two DAOD climatologies are significantly different (Table 4), which is mainly caused by two factors. The first is the difference in DAOD magnitude. The CALIOP-based global mean DAOD is 0.032, while the MODIS-based DAOD is 0.047. The other factor is the difference in the DAOD spatial pattern. After we scale dust DRE to the same global mean DAOD ( to eliminate the effect of DAOD magnitude differences (values in parentheses in Table 4), the DRESW difference is reduced from 0.55 W m−2 (−0.69 vs. −1.24 W m−2) to 0.15 W m−2 (−0.64 vs. −0.79 W m−2). Similarly, differences in DRELW and DRENET are also significantly reduced. This indicates that the global mean DAOD magnitude difference is more important than the subtle difference in spatial patterns. Nevertheless, after scaling to the same global mean DAOD there is still a more than 10 % difference between the two dust DRESW, with CALIOP-based being the more positive one. This is probably because CALIOP-based DAOD is more concentrated over dust sources where dust aerosols induce less negative or even positive DRESW (e.g., the positive DRESW over the Sahara Desert and Arabia shown in Fig. 10), which results in a less negative global mean DRESW than MODIS.
Table 5The two observation-based dust PSDs used in DRE calculations (see Fig. 7).
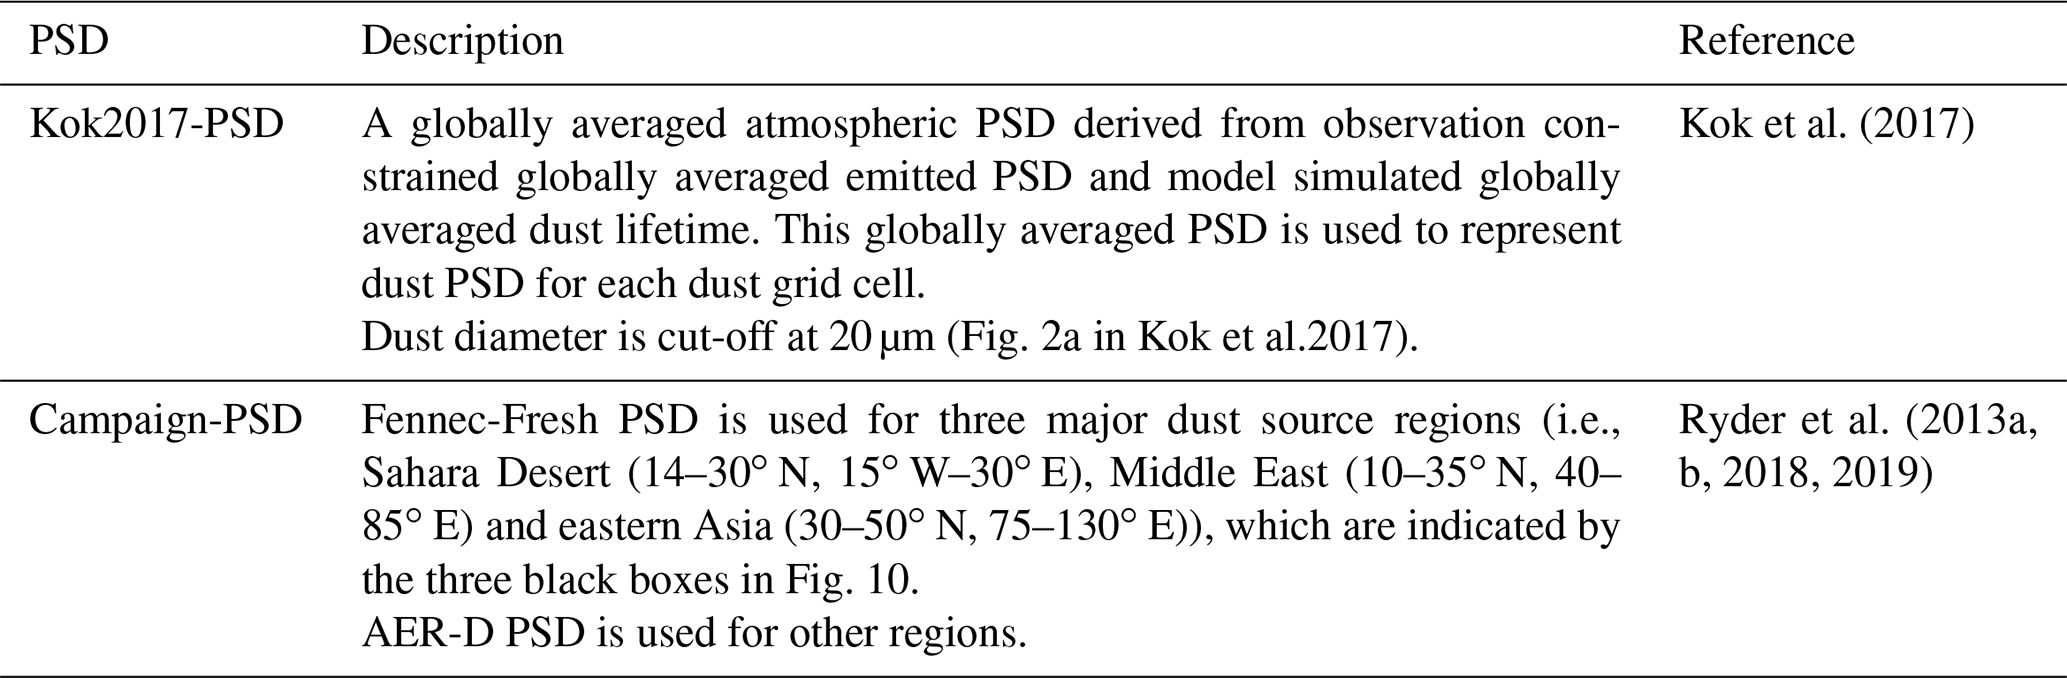
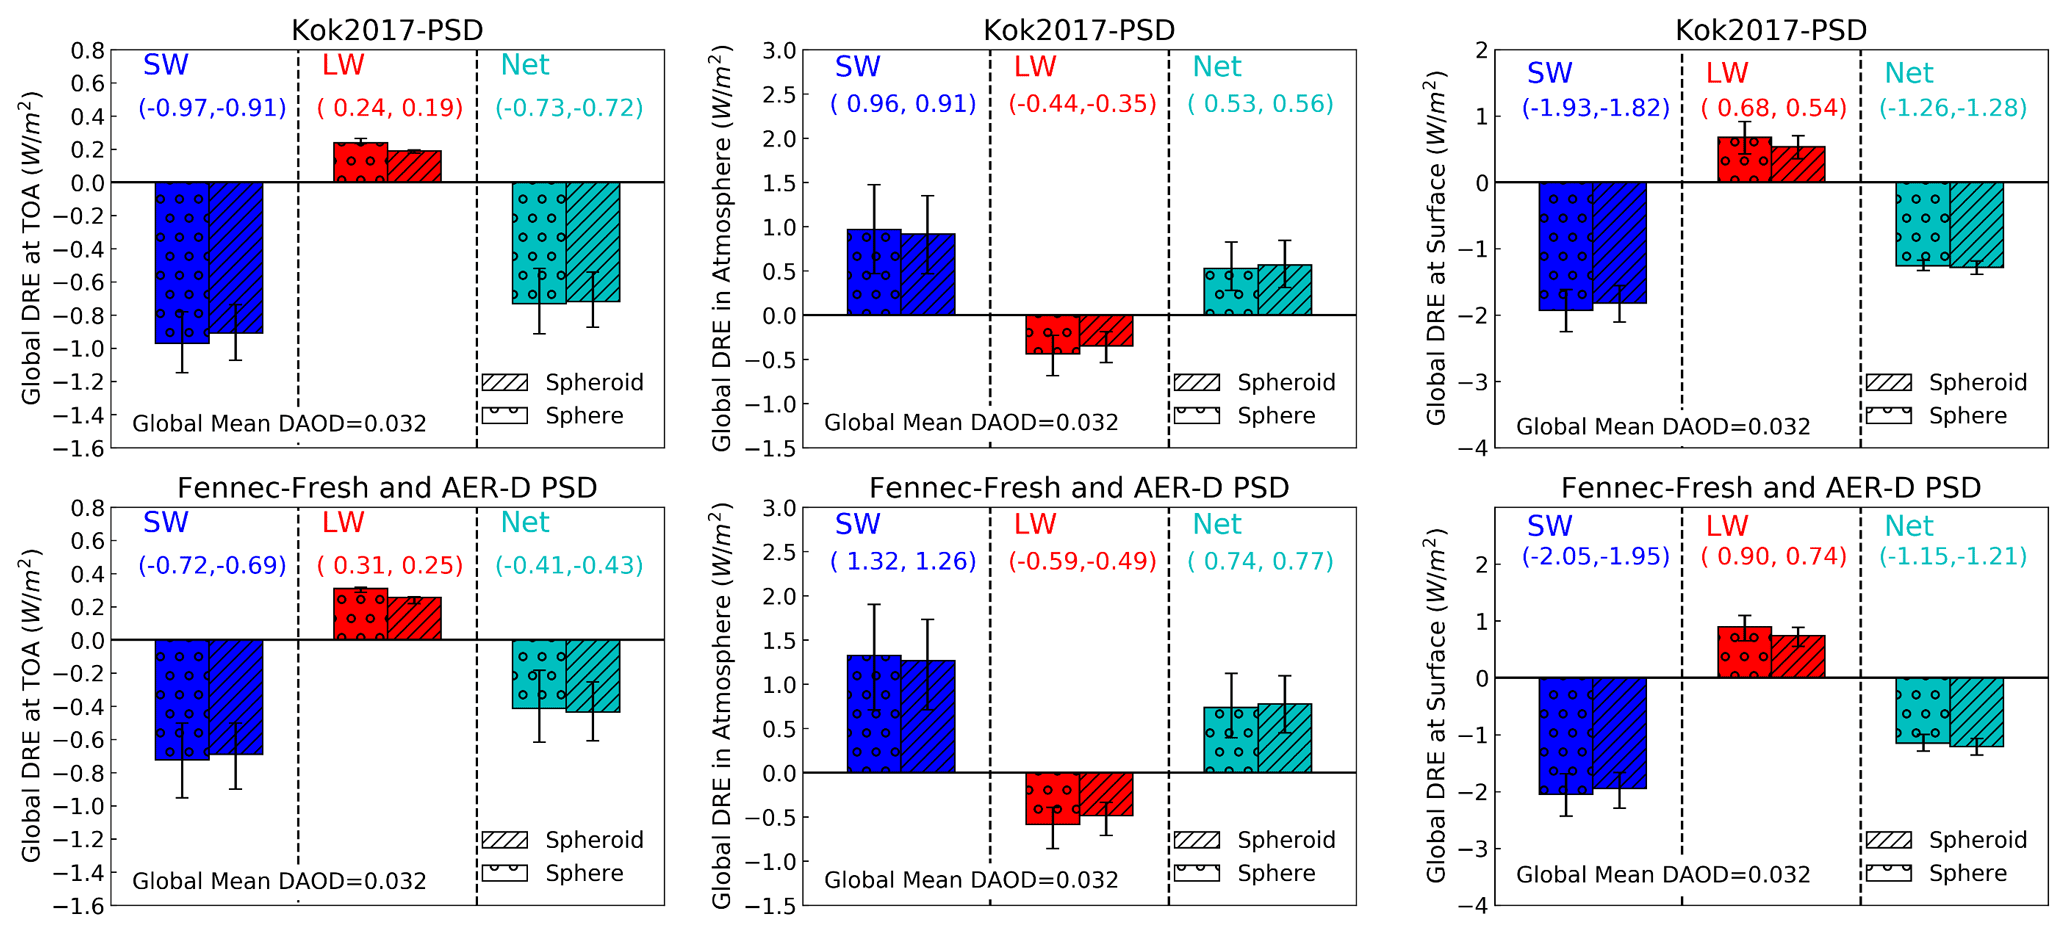
Figure 11Global annual mean clear-sky DRESW, DRELW and DRENET at TOA, in the atmosphere and surface calculated based on the two PSDs described in Table 5. The two rows represent dust DRE based on two PSDs. Error bars indicate uncertainty induced by dust RI uncertainty. Different types of bars indicate dust DRE based on different dust shapes. This figure explicitly separates the impacts of different dust microphysical properties on dust DRE. The two values in parenthesis on each plot represent spherical (left) and spheroidal (right) dust DRE corresponding to mean RI.
5.3 Global dust clear-sky DRE based on different dust PSD
In Sect. 5.2, we showed the dust DRE based on the Campaign-PSD. As aforementioned, one of the main advantages of our size-resolved DREE is that it can be combined with different dust PSDs to estimate the dust DRE. To demonstrate this, we calculate another set of dust DRE based on the Kok2017-PSD. Table 5 describes the two dust PSDs used for global dust DRE calculations and their references. Kok2017-PSD is a globally averaged dust PSD and used to represent dust PSD for each dust grid cell. It is constrained with observations and includes coarse dust particles up to 20 µm. Although our primary goal here is to demonstrate the capability of our size-resolved DREE, the comparison between the two DRE can also help to understand the impacts of dust PSD uncertainty on the dust DRE estimation. Moreover, we also investigate the sensitivity of DRE to dust RI and dust shape explicitly in this section. The same DAOD climatology (CALIOP-based DAOD climatology) is used for dust DRE calculations to eliminate the impact of dust loading difference.
Several recent observation-constrained dust PSDs (e.g., Di Biagio et al., 2020; Adebiyi et al., 2020) suggest that the dust size is coarser than Kok2017-PSD. As such, Kok2017-PSD is used to represent the lower limit of the observation-based global dust PSD to investigate the sensitivity of dust DRE to dust PSD. The Campaign-PSD is purely based on aircraft in situ measurements and the aircraft was extensively equipped to measure giant particles with diameters larger than 20 µm. We use the dust PSD measured over the Sahara (from the Fennec field campaign) to represent dust PSD over three major dust source regions and use dust PSD measured in the SAL over the tropical eastern Atlantic (from AER-D field campaign) to represent dust PSD over dust transport regions. Of course, representing the spatial and temporal variation of global dust PSD with only two PSDs from the field campaigns is only a crude approximation due to the lack of PSD measurements. Dust aerosol over the three wide dust source regions may not be all uplifted within 12 h as in the Fennec-Fresh measurements. In addition, dust size after long-range transport could be slightly finer than dust PSD measured over tropical eastern Atlantic (Weinzierl et al., 2017). Thus, Campaign-PSD likely represents the upper limit of the observation-based global dust PSD for the investigation of sensitivity to dust PSD. By contrast, the climate models miss most of the coarse dust (D>5 µm) in the atmosphere (Adebiyi and Kok, 2020) and as a result, the purely modeled dust PSD without observational constraints will lead to a substantially different dust DRE. Therefore, the sensitivity test to dust PSD conducted in this study can only represent the uncertainty induced by the current understanding of observation-based dust PSD.
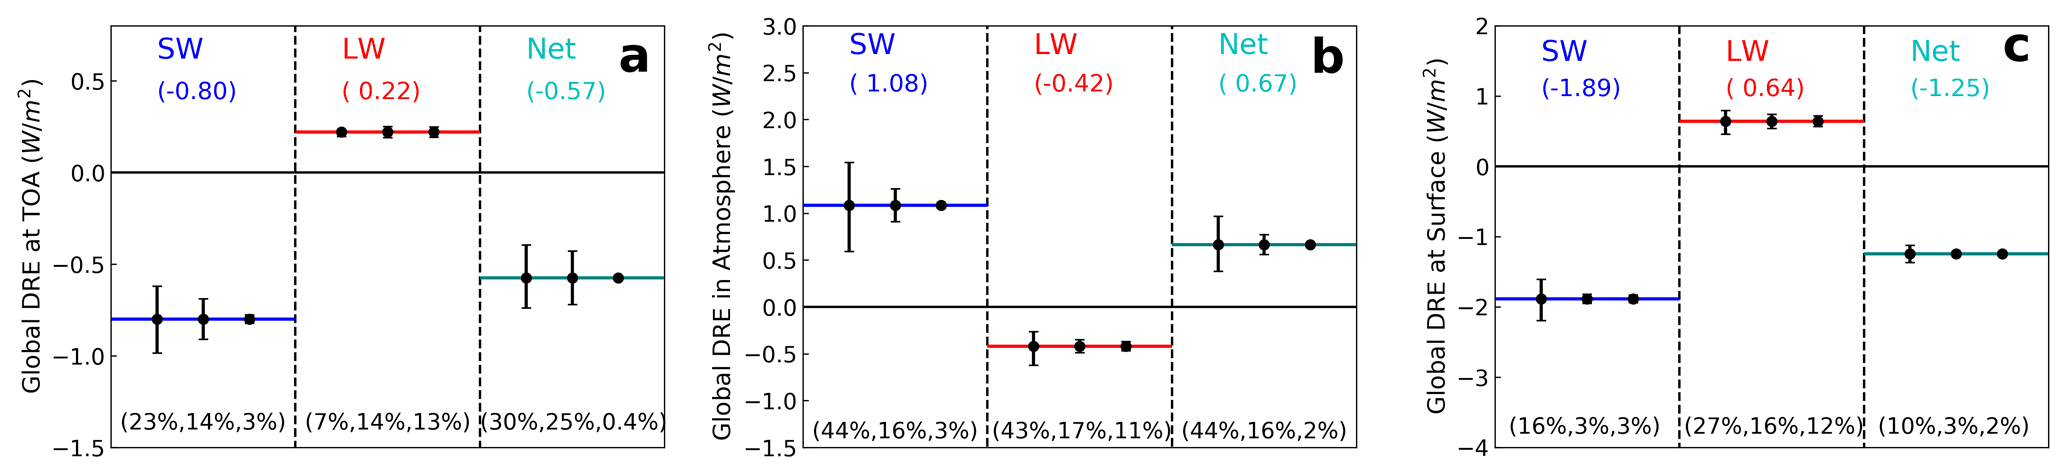
Figure 12Comparison of uncertainty induced by dust RI, PSD and shape in DRESW, DRELW and DRENET at TOA (a), in the atmosphere (b) and surface (c). The horizontal lines in each plot represent global mean DRESW (blue line in the left column), DRELW (red line in the middle column) and DRENET (green line in the right column) averaged over two dust PSDs (i.e., Kok2017-PSD and Campaign-PSD) based on MeanRI-Spheroid dust model. The three error bars in each column represent DRE uncertainty induced by dust RI (left), dust PSD (middle) and dust shape (right). Accordingly, the percentage values on the bottom represent the percentage uncertainty induced by dust RI, PSD and shape, respectively.
We calculated dust DRE of each grid cell (DREi,j) using the DREE integration method based on the dust PSD described in Table 5. Global mean dust DRE was then calculated by averaging dust DREi,j weighted by its surface area. Figure 11 shows the global mean DRESW, DRELW and DRENET at TOA, surface, and in the atmosphere calculated based on the two sets of PSDs. Obviously, Kok2017-PSD leads to stronger cooling effect in SW and weaker warming effect in LW at TOA compared to Campaign-PSD, which is consistent with the fact that Kok2017-PSD is finer than the Campaign-PSD. In addition, we explicitly include the effects of dust RI and dust shape on DRE in Fig. 11. Comparison of uncertainty induced by dust PSD, RI and shape suggests that dust RI uncertainty leads to the largest uncertainty in dust DRE, particularly RI uncertainty induces more than 40 % uncertainty in DRESW estimations in the atmosphere (Fig. 12). Dust PSD is also important for quantifying dust DRE and we found that the observation-based dust PSD uncertainty induces around 15 %–20 % uncertainty in dust DRE at TOA and in the atmosphere. Dust nonsphericity causes a negligible uncertainty in global mean dust DRE, in line with previous studies e.g., Raisanen et al. (2013) and Colarco et al. (2014).
It is tempting to compare our global mean dust DRE with results reported in Kok et al. (2017) but it must be noted that the global mean dust DRE shown in Fig. 11 is for clear sky only, while the global mean dust DRE reported in Kok et al. (2017) is for all sky. The all-sky dust DRE can be separated into contributions from clear-sky and cloudy-sky portions (Myhre et al., 2020):
where CF is cloud fraction, DREclear−sky is dust DRE simulated under the case of removing all clouds and DREcloudy−sky is the dust DRE assuming whole grid is covered by clouds. To compare our global mean dust DRESW based on Kok2017-PSD with the results reported in Kok et al. (2017), we convert our clear-sky DRE to DRE by using the MODIS L3 monthly mean cloud fraction. Specifically, we multiply DRE by (1-CF) for each grid cell and then calculate global annual mean values. In this process, we neglect the cloudy-sky dust DRESW portion because the annual mean cloudy-sky dust DRESW is estimated to be very small, around −0.04 (Zhang et al., 2016). Finally, our estimated global mean DRE corresponding to DAOD = 0.03 is around −0.34 W m−2. Although it is comparable to the −0.48 W m−2 from Kok et al. (2017), the following differences between the two studies must be kept in mind when interpreting the results. First, the rough conversion from global mean DRE to global mean DRE is subject to the approximation of global mean DRE and the MODIS L3 cloud fraction could be different from the modeled cloud fraction used in Kok et al. (2017). Second, the two studies use different dust RI. For example, the imaginary part of RI at 550 nm in this study ranges from 0.00061 to 0.003, while that in Kok et al. (2017) ranges from 0.0014 as used in GEOS-Chem and GISS model based on Sinyuk et al. (2003) to 0.003 as used in WRF-Chem based on Zhao et al. (2010). Third, in this study Kok2017-PSD is used to represent dust PSD in each dust grid and applied to our size-resolved dust DREE dataset to calculate global dust DRE. In contrast, the model-simulated dust DREE in Kok et al. (2017) has reduced cooling from SW scattering and enhanced warming from SW absorption effects because the short lifetime of coarse dust in models concentrates these particles over bright deserts. Fourth, the two studies use different dust shape models, Kok et al. (2017) accounts for a more nonspherical shape model (i.e., triaxial ellipsoids). Here we do not compare our global mean DRE with DRE suggested in Kok et al. (2017) because the lack of knowledge in DRE prevents us from converting DRE to DRE. Moreover, the two studies use different dust vertical profiles, which is critical for DRELW estimations. For instance, the dust vertical profile in Kok et al. (2017) is purely based on model simulations, while this study constrains the dust vertical profile with CALIOP observations. Considering all these factors, it is hard to tell if the comparison is fair.
This study developed a clear-sky size-resolved dust DREE dataset in both SW and LW from CALIOP-based dust DAOD climatology and dust vertical distributions. The dataset contains global monthly mean dust DREE at TOA and surface with 5∘ (longitude) ×2∘ (latitude) spatial resolution for 10 size bins ranging from 0.1 to 100 µm diameter, for three state of the art dust RI representing more, mean and less absorptive dust, and for two dust shapes representing spherical and spheroidal dust.
The size-resolved DREE dataset allows us to calculate dust DRE of any DAOD climatology and dust PSD efficiently by using the DREE integration method presented in Sect. 4.1 without involving radiative transfer simulations. The DREE integration method is proven to be in good agreement with conventional DRE calculations. With the DREE integration methodology, we firstly calculated clear-sky regional mean DREESW and DREELW over the Sahara Desert and tropical Atlantic. The comparison of our calculations with those reported by field studies based on satellite and ground-based observations shows reasonable agreement. Secondly, we estimated global mean dust DRE with two satellite-based DAOD climatological datasets and two different global dust PSDs. We found that the global mean DAOD magnitude difference between the two DAOD climatological datasets is more important than the subtle difference in spatial patterns. Nevertheless, after scaling to the same global mean DAOD there is still more than 10 % difference between the two dust DRESW, with CALIOP-based being the more positive one. Moreover, our results explicitly show the uncertainty induced by each dust microphysical property (i.e., dust PSD, RI and shape) separately. When DAOD is constrained (a) dust nonsphericity induces negligible effects on dust DRE estimations. (b) The current understanding of observation-based dust PSD induces relatively large uncertainty (15 %–20 %) in dust DRE at TOA and in the atmosphere. (c) Dust RI turns out to be the most important factor in determining dust DRE, particularly in SW. This implies that better understanding of dust mineral composition and RI will significantly improve our understanding of dust DRE in the future.
The size-resolved dust DREE dataset and the codes to calculate dust DRE for any given dust PSD and DAOD are available at https://drive.google.com/drive/folders/15_e28Y9JiSWiJnIM_2flEmt2u6i9phEY?usp=sharing, (last access: 28 September 2022) CALIOP-based and MODIS-based DAOD climatological datasets are available at https://drive.google.com/drive/folders/1aQVupe7govPwR6qmsqUbR4fJQsp1DBCX?usp=sharing, (last access: 28 September 2022; Song et al., 2021)
The supplement related to this article is available online at: https://doi.org/10.5194/acp-22-13115-2022-supplement.
QS and ZZ conceived the scientific ideas. QS did the analysis and completed the initial draft of the manuscript. ZZ, HY, JK, CDB, SA, JZ and JD gave many suggestions for the study and contributed significantly to the revision of the manuscript.
The contact author has declared that none of the authors has any competing interests.
Publisher's note: Copernicus Publications remains neutral with regard to jurisdictional claims in published maps and institutional affiliations.
We would like to thank Claire L. Ryder for providing the Fennec and AER-D dust PSDs. Qianqian Song and Zhibo Zhang cordially acknowledge funding support from the Future Investigators in NASA Earth and Space Science and Technology (FINESST). Zhibo Zhang's research is supported by an NASA grant (80NSSC20K0130) from the CALIPSO and CloudSat program. S. Albani received funding from MIUR (Progetto Dipartimenti di Eccellenza 2018-2022). The computations in this study were performed at the UMBC High Performance Computing Facility (HPCF). The facility is supported by the US National Science Foundation through the MRI program (grant nos. CNS-0821258 and CNS-1228778) and the SCREMS program (grant no. DMS-0821311), with substantial support from UMBC.
This research has been supported by the National Aeronautics and Space Administration (grant nos. 80NSSC19K1345 and 80NSSC20K0130) and the National Science Foundation (grant nos. CNS-0821258 and CNS-1228778).
This paper was edited by Yuan Wang and reviewed by two anonymous referees.
Adebiyi, A. A. and Kok, J. F.: Climate models miss most of the coarse dust in the atmosphere, Sci. Adv., 6, eaaz9507, https://doi.org/10.1126/sciadv.aaz9507, 2020.
Adebiyi, A. A., Kok, J. F., Wang, Y., Ito, A., Ridley, D. A., Nabat, P., and Zhao, C.: Dust Constraints from joint Observational-Modelling-experiMental analysis (DustCOMM): comparison with measurements and model simulations, Atmos. Chem. Phys., 20, 829–863, https://doi.org/10.5194/acp-20-829-2020, 2020.
Albrecht, B. A.: Aerosols, Cloud Microphysics, and Fractional Cloudiness, Science, 80, 1227–1230, https://doi.org/10.1126/science.245.4923.1227, 1989.
Balkanski, Y., Schulz, M., Claquin, T., and Guibert, S.: Reevaluation of Mineral aerosol radiative forcings suggests a better agreement with satellite and AERONET data, Atmos. Chem. Phys., 7, 81–95, https://doi.org/10.5194/acp-7-81-2007, 2007.
Brindley, H. E. and Russell, J. E.: An assessment of Saharan dust loading and the corresponding cloud-free longwave direct radiative effect from geostationary satellite observations, J. Geophys. Res.-Atmos., 114, D23201, https://doi.org/10.1029/2008JD011635, 2009.
Choobari, O. A., Zawar-Reza, P., and Sturman, A.: The global distribution of mineral dust and its impacts on the climate system: A review, Atmos. Res., 138, 152–165, https://doi.org/10.1016/j.atmosres.2013.11.007, 2014.
Colarco, P. R., Nowottnick, E. P., Randles, C. A., Yi, B. Q., Yang, P., Kim, K. M., Smith, J. A., and Bardeen, C. G.: Impact of radiatively interactive dust aerosols in the NASA GEOS-5 climate model: Sensitivity to dust particle shape and refractive index, J. Geophys. Res., 119, 753–786, https://doi.org/10.1002/2013jd020046, 2014.
Di Biagio, C., Formenti, P., Balkanski, Y., Caponi, L., Cazaunau, M., Pangui, E., Journet, E., Nowak, S., Caquineau, S., Andreae, M. O., Kandler, K., Saeed, T., Piketh, S., Seibert, D., Williams, E., and Doussin, J.-F.: Global scale variability of the mineral dust long-wave refractive index: a new dataset of in situ measurements for climate modeling and remote sensing, Atmos. Chem. Phys., 17, 1901–1929, https://doi.org/10.5194/acp-17-1901-2017, 2017.
Di Biagio, C., Formenti, P., Balkanski, Y., Caponi, L., Cazaunau, M., Pangui, E., Journet, E., Nowak, S., Andreae, M. O., Kandler, K., Saeed, T., Piketh, S., Seibert, D., Williams, E., and Doussin, J.-F.: Complex refractive indices and single-scattering albedo of global dust aerosols in the shortwave spectrum and relationship to size and iron content, Atmos. Chem. Phys., 19, 15503–15531, https://doi.org/10.5194/acp-19-15503-2019, 2019.
Di Biagio, C., Balkanski, Y., Albani, S., Boucher, O., and Formenti, P.: Direct Radiative Effect by Mineral Dust Aerosols Constrained by New Microphysical and Spectral Optical Data, Geophys. Res. Lett., 47, e2019GL086186, https://doi.org/https://doi.org/10.1029/2019GL086186, 2020.
Drakaki, E., Amiridis, V., Tsekeri, A., Gkikas, A., Proestakis, E., Mallios, S., Solomos, S., Spyrou, C., Marinou, E., Ryder, C. L., Bouris, D., and Katsafados, P.: Modeling coarse and giant desert dust particles, Atmos. Chem. Phys., 22, 12727–12748, https://doi.org/10.5194/acp-22-12727-2022, 2022.
Dubovik, O., Sinyuk, A., Lapyonok, T., Holben, B. N., Mishchenko, M., Yang, P., Eck, T. F., Volten, H., Munoz, O., Veihelmann, B., van der Zande, W. J., Leon, J. F., Sorokin, M., and Slutsker, I.: Application of spheroid models to account for aerosol particle nonsphericity in remote sensing of desert dust, J. Geophys. Res., 111, D11208, https://doi.org/10.1029/2005jd006619, 2006.
Dufresne, J. L., Gautier, C., and Ricchiazzi, P.: Longwave scattering effects of mineral aerosols, J. Atmos. Sci., 59, 1959–1966, https://doi.org/10.1175/1520-0469(2002)059<1959:LSEOMA>2.0.CO;2, 2002.
García, O. E., Díez, A. M., Expósito, F. J., Díaz, J. P., Dubovik, O., Dubuisson, P., Roger, J. C., Eck, T. F., Sinyuk, A., Derimian, Y., Dutton, E. G., Schafer, J. S., Holben, B., and García, C. A.: Validation of AERONET estimates of atmospheric solar fluxes and aerosol radiative forcing by ground-based broadband measurements, J. Geophys. Res.-Atmos., 113, D21207, https://doi.org/10.1029/2008JD010211, 2008.
Gelaro, R., McCarty, W., Suárez, M. J., Todling, R., Molod, A., Takacs, L., Randles, C. A., Darmenov, A., Bosilovich, M. G., Reichle, R., Wargan, K., Coy, L., Cullather, R., Draper, C., Akella, S., Buchard, V., Conaty, A., da Silva, A. M., Gu, W., Kim, G. K., Koster, R., Lucchesi, R., Merkova, D., Nielsen, J. E., Partyka, G., Pawson, S., Putman, W., Rienecker, M., Schubert, S. D., Sienkiewicz, M., and Zhao, B.: The modern-era retrospective analysis for research and applications, version 2 (MERRA-2), J. Climate, 30, 5419–5454, https://doi.org/10.1175/JCLI-D-16-0758.1, 2017.
Ginoux, P., Prospero, J. M., Gill, T. E., Hsu, N. C., and Zhao, M.: Global-scale attribution of anthropogenic and natural dust sources and their emission rates based on MODIS Deep Blue aerosol products, Rev. Geophys., 50, RG3005, https://doi.org/10.1029/2012RG000388, 2012.
Gkikas, A., Proestakis, E., Amiridis, V., Kazadzis, S., Di Tomaso, E., Tsekeri, A., Marinou, E., Hatzianastassiou, N., and Pérez García-Pando, C.: ModIs Dust AeroSol (MIDAS): a global fine-resolution dust optical depth data set, Atmos. Meas. Tech., 14, 309–334, https://doi.org/10.5194/amt-14-309-2021, 2021.
Hansell, R. A., Tsay, S. C., Ji, Q., Hsu, N. C., Jeong, M. J., Wang, S. H., Reid, J. S., Liou, K. N., and Ou, S. C.: An assessment of the surface longwave direct radiative effect of airborne Saharan dust during the NAMMA field campaign, J. Atmos. Sci., 67, 1048–1065, https://doi.org/10.1175/2009JAS3257.1, 2010.
Hsu, N. C., Jeong, M.-J., Bettenhausen, C., Sayer, A. M., Hansell, R., Seftor, C. S., Huang, J., and Tsay, S.-C.: Enhanced Deep Blue aerosol retrieval algorithm: The second generation, J. Geophys. Res.-Atmos., 118, 9296–9315, https://doi.org/https://doi.org/10.1002/jgrd.50712, 2013.
Huang, X. L., Chen, X. H., Zhou, D. K., and Liu, X.: An Observationally Based Global Band-by-Band Surface Emissivity Dataset for Climate and Weather Simulations, J. Atmos. Sci., 73, 3541–3555, https://doi.org/10.1175/Jas-D-15-0355.1, 2016.
Huang, Y., Kok, J. F., Kandler, K., Lindqvist, H., Nousiainen, T., Sakai, T., Adebiyi, A., and Jokinen, O.: Climate Models and Remote Sensing Retrievals Neglect Substantial Desert Dust Asphericity, Geophys. Res. Lett., 47, e2019GL086592, https://doi.org/10.1029/2019GL086592, 2020.
Huneeus, N., Schulz, M., Balkanski, Y., Griesfeller, J., Prospero, J., Kinne, S., Bauer, S., Boucher, O., Chin, M., Dentener, F., Diehl, T., Easter, R., Fillmore, D., Ghan, S., Ginoux, P., Grini, A., Horowitz, L., Koch, D., Krol, M. C., Landing, W., Liu, X., Mahowald, N., Miller, R., Morcrette, J.-J., Myhre, G., Penner, J., Perlwitz, J., Stier, P., Takemura, T., and Zender, C. S.: Global dust model intercomparison in AeroCom phase I, Atmos. Chem. Phys., 11, 7781–7816, https://doi.org/10.5194/acp-11-7781-2011, 2011.
Kato, S., Rose, F. G., Sun-Mack, S., Miller, W. F., Chen, Y., Rutan, D. A., Stephens, G. L., Loeb, N. G., Minnis, P., Wielicki, B. A., Winker, D. M., Charlock, T. P., Stackhouse, P. W., Xu, K. M., and Collins, W. D.: Improvements of top-of-atmosphere and surface irradiance computations with CALIPSO-, CloudSat-, and MODIS-derived cloud and aerosol properties, J. Geophys. Res., 116, D19209, https://doi.org/10.1029/2011jd016050, 2011.
Kaufman, Y. J., Koren, I., Remer, L. A., Tanré, D., Ginoux, P., and Fan, S.: Dust transport and deposition observed from the Terra-Moderate Resolution Imaging Spectroradiometer (MODIS) spacecraft over the Atlantic Ocean, J. Geophys. Res.-Atmos., 110, 1–16, https://doi.org/10.1029/2003JD004436, 2005.
Koffi, B., Schulz, M., Bréon, F. M., Griesfeller, J., Winker, D., Balkanski, Y., Bauer, S., Berntsen, T., Chin, M., Collins, W. D., Dentener, F., Diehl, T., Easter, R., Ghan, S., Ginoux, P., Gong, S., Horowitz, L. W., Iversen, T., Kirkevg, A., Koch, D., Krol, M., Myhre, G., Stier, P., and Takemura, T.: Application of the CALIOP layer product to evaluate the vertical distribution of aerosols estimated by global models: AeroCom phase i results, J. Geophys. Res.-Atmos., 117, D10201, https://doi.org/10.1029/2011JD016858, 2012.
Kok, J. F., Ridley, D. A., Zhou, Q., Miller, R. L., Zhao, C., Heald, C. L., Ward, D. S., Albani, S., and Haustein, K.: Smaller desert dust cooling effect estimated from analysis of dust size and abundance, Nat. Geosci., 10, 274–278, https://doi.org/10.1038/Ngeo2912, 2017.
Li, F., Vogelmann, A. M., and Ramanathan, V.: Saharan dust aerosol radiative forcing measured from space, J. Climate, 17, 2558–2571, https://doi.org/10.1175/1520-0442(2004)017<2558:Sdarfm>2.0.Co;2, 2004.
Mahowald, N., Albani, S., Kok, J. F., Engelstaeder, S., Scanza, R., Ward, D. S., and Flanner, M. G.: The size distribution of desert dust aerosols and its impact on the Earth system, Aeolian Res., 15, 53–71, https://doi.org/10.1016/j.aeolia.2013.09.002, 2014.
Meloni, D., di Sarra, A., Di Iorio, T., and Fiocco, G.: Influence of the vertical profile of Saharan dust on the visible direct radiative forcing, J. Quant. Spectrosc. Ra. Transf., 93, 397–413, https://doi.org/10.1016/j.jqsrt.2004.08.035, 2005.
Meloni, D., Junkermann, W., di Sarra, A., Cacciani, M., De Silvestri, L., Di Iorio, T., Estellés, V., Gómez-Amo, J. L., Pace, G., and Sferlazzo, D. M.: Altitude-resolved shortwave and longwave radiative effects of desert dust in the Mediterranean during the GAMARF campaign: Indications of a net daily cooling in the dust layer, J. Geophys. Res., 120, 3386–3407, https://doi.org/10.1002/2014JD022312, 2015.
Meng, Z. K., Yang, P., Kattawar, G. W., Bi, L., Liou, K. N., and Laszlo, I.: Single-scattering properties of tri-axial ellipsoidal mineral dust aerosols: A database for application to radiative transfer calculations, J. Aerosol Sci., 41, 501–512, https://doi.org/10.1016/j.jaerosci.2010.02.008, 2010.
Meng, J., Huang, Y., Leung, D. M., Li, L., Adebiyi, A. A., Ryder, C. L., Mahowald, N. M., and Kok, J. F.: Improved parameterization for the size distribution of emitted dust aerosols reduces model underestimation of super coarse dust, Geophys. Res. Lett., 49, e2021GL097287, https://doi.org/10.1029/2021GL097287, 2022.
Mlawer, E. J. and Clough, S. A.: Shortwave and longwave enhancements in the rapid radiative transfer model, Proc. Seventh Atmos. Radiat. Meas. Sci. Team Meet., 409–413, 1998.
Mlawer, E. J., Taubman, S. J., Brown, P. D., Iacono, M. J., and Clough, S. A.: Radiative transfer for inhomogeneous atmospheres: RRTM, a validated correlated-k model for the longwave, J. Geophys. Res.-Atmos., 102, 16663–16682, https://doi.org/10.1029/97jd00237, 1997.
Myhre, G., Grini, A., Haywood, J. M., Stordal, F., Chatenet, B., Tanre, D., Sundet, J. K., and Isaksen, I. S. A.: Modeling the radiative impact of mineral dust during the Saharan Dust Experiment (SHADE) campaign, J. Geophys. Res., 108, 8579, https://doi.org/10.1029/2002jd002566, 2003.
Myhre, G., Samset, B. H., Mohr, C. W., Alterskjær, K., Balkanski, Y., Bellouin, N., Chin, M., Haywood, J., Hodnebrog, Ø., Kinne, S., Lin, G., Lund, M. T., Penner, J. E., Schulz, M., Schutgens, N., Skeie, R. B., Stier, P., Takemura, T., and Zhang, K.: Cloudy-sky contributions to the direct aerosol effect, Atmos. Chem. Phys., 20, 8855–8865, https://doi.org/10.5194/acp-20-8855-2020, 2020.
Patadia, F., Yang, E. S., and Christopher, S. A.: Does dust change the clear sky top of atmosphere shortwave flux over high surface reflectance regions?, Geophys. Res. Lett., 36, L15825, https://doi.org/10.1029/2009GL039092, 2009.
Pu, B. and Ginoux, P.: How reliable are CMIP5 models in simulating dust optical depth?, Atmos. Chem. Phys., 18, 12491–12510, https://doi.org/10.5194/acp-18-12491-2018, 2018.
Raisanen, P., Haapanala, P., Chung, C. E., Kahnert, M., Makkonen, R., Tonttila, J., and Nousiainen, T.: Impact of dust particle non-sphericity on climate simulations, Q. J. Roy. Meteorol. Soc., 139, 2222–2232, https://doi.org/10.1002/qj.2084, 2013.
Remer, L. A., Kaufman, Y. J., Tanré, D., Mattoo, S., Chu, D. A., Martins, J. V, Li, R. R., Ichoku, C., Levy, R. C., Kleidman, R. G., Eck, T. F., Vermote, E., and Holben, B. N.: The MODIS aerosol algorithm, products, and validation, J. Atmos. Sci., 62, 947–973, https://doi.org/10.1175/JAS3385.1, 2005.
Ryder, C. L., Highwood, E. J., Lai, T. M., Sodemann, H., and Marsham, J. H.: Impact of atmospheric transport on the evolution of microphysical and optical properties of Saharan dust, Geophys. Res. Lett., 40, 2433–2438, https://doi.org/10.1002/grl.50482, 2013a.
Ryder, C. L., Highwood, E. J., Rosenberg, P. D., Trembath, J., Brooke, J. K., Bart, M., Dean, A., Crosier, J., Dorsey, J., Brindley, H., Banks, J., Marsham, J. H., McQuaid, J. B., Sodemann, H., and Washington, R.: Optical properties of Saharan dust aerosol and contribution from the coarse mode as measured during the Fennec 2011 aircraft campaign, Atmos. Chem. Phys., 13, 303–325, https://doi.org/10.5194/acp-13-303-2013, 2013b.
Ryder, C. L., Marenco, F., Brooke, J. K., Estelles, V., Cotton, R., Formenti, P., McQuaid, J. B., Price, H. C., Liu, D., Ausset, P., Rosenberg, P. D., Taylor, J. W., Choularton, T., Bower, K., Coe, H., Gallagher, M., Crosier, J., Lloyd, G., Highwood, E. J., and Murray, B. J.: Coarse-mode mineral dust size distributions, composition and optical properties from AER-D aircraft measurements over the tropical eastern Atlantic, Atmos. Chem. Phys., 18, 17225–17257, https://doi.org/10.5194/acp-18-17225-2018, 2018.
Ryder, C. L., Highwood, E. J., Walser, A., Seibert, P., Philipp, A., and Weinzierl, B.: Coarse and giant particles are ubiquitous in Saharan dust export regions and are radiatively significant over the Sahara, Atmos. Chem. Phys., 19, 15353–15376, https://doi.org/10.5194/acp-19-15353-2019, 2019.
Sakai, T., Nagai, T., Zaizen, Y., and Mano, Y.: Backscattering linear depolarization ratio measurements of mineral, sea-salt, and ammonium sulfate particles simulated in a laboratory chamber, Appl. Opt., 49, 4441–4449, 2010.
Satheesh, S. K. and Ramanathan, V.: Large differences in tropical aerosol forcing at the top of the atmosphere and Earth's surface, Nature, 405, 60–63, https://doi.org/10.1038/35011039, 2000.
Sinyuk, A., Torres, O., and Dubovik, O.: Combined use of satellite and surface observations to infer the imaginary part of refractive index of Saharan dust, Geophys. Res. Lett., 30, 1081, https://doi.org/10.1029/2002GL016189, 2003.
Sokolik, I. N., Toon, O. B., and Bergstrom, R. W.: Modeling the radiative characteristics of airborne mineral aerosols at infrared wavelengths, J. Geophys. Res., 103, 8813–8826, https://doi.org/10.1029/98jd00049, 1998.
Song, Q., Zhang, Z., Yu, H., Kato, S., Yang, P., Colarco, P., Remer, L. A., and Ryder, C. L.: Net radiative effects of dust in the tropical North Atlantic based on integrated satellite observations and in situ measurements, Atmos. Chem. Phys., 18, 11303–11322, https://doi.org/10.5194/acp-18-11303-2018, 2018.
Song, Q., Zhang, Z., Yu, H., Ginoux, P., and Shen, J.: Global dust optical depth climatology derived from CALIOP and MODIS aerosol retrievals on decadal timescales: regional and interannual variability, Atmos. Chem. Phys., 21, 13369–13395, https://doi.org/10.5194/acp-21-13369-2021, 2021.
Stamnes, K., Tsay, S.-C., Wiscombe, W., and Jayaweera, K.: Numerically stable algorithm for discrete-ordinate-method radiative transfer in multiple scattering and emitting layered media, Appl. Opt., 27, 2502, https://doi.org/10.1364/ao.27.002502, 1988.
Tegen, I. and Lacis, A. A.: Modeling of particle size distribution and its influence on the radiative properties of mineral dust aerosol, J. Geophys. Res.-Atmos., 101, 19237–19244, https://doi.org/10.1029/95jd03610, 1996.
Tegen, I., Lacis, A. A., and Fung, I.: The influence on climate forcing of mineral aerosols from disturbed soils, Nature, 380, 419–422, https://doi.org/10.1038/380419a0, 1996.
Textor, C., Schulz, M., Guibert, S., Kinne, S., Balkanski, Y., Bauer, S., Berntsen, T., Berglen, T., Boucher, O., Chin, M., Dentener, F., Diehl, T., Easter, R., Feichter, H., Fillmore, D., Ghan, S., Ginoux, P., Gong, S., Grini, A., Hendricks, J., Horowitz, L., Huang, P., Isaksen, I., Iversen, I., Kloster, S., Koch, D., Kirkevåg, A., Kristjansson, J. E., Krol, M., Lauer, A., Lamarque, J. F., Liu, X., Montanaro, V., Myhre, G., Penner, J., Pitari, G., Reddy, S., Seland, Ø., Stier, P., Takemura, T., and Tie, X.: Analysis and quantification of the diversities of aerosol life cycles within AeroCom, Atmos. Chem. Phys., 6, 1777–1813, https://doi.org/10.5194/acp-6-1777-2006, 2006.
Twomey, S.: The influence of pollution on the shortwave albedo of clouds, J. Atmos. Sci., 34, 1149–1152, 1977.
van de Hulst, H. C.: Light scattering by small particles, Wiley, Hoboken, NJ, 103–113, ISBN 0-486-64228-3, 1957.
Van Der Does, M., Knippertz, P., Zschenderlein, P., Harrison, R. G., and Stuut, J.-B. W.: The mysterious long-range transport of giant mineral dust particles, Sci. Adv., 4, 1–9, 2018.
Voss, K. K. and Evan, A. T.: A New Satellite-Based Global Climatology of Dust Aerosol Optical Depth, J. Appl. Meteorol. Climatol., 59, 83–102, https://doi.org/10.1175/JAMC-D-19-0194.1, 2020.
VOUK, V.: Projected Area of Convex Bodies, Nature, 162, 330–331, https://doi.org/10.1038/162330a0, 1948.
Weinzierl, B., Ansmann, A., Prospero, J. M., Althausen, D., Benker, N., Chouza, F., Dollner, M., Farrell, D., Fomba, W. K., Freudenthaler, V., Gasteiger, J., Gross, S., Haarig, M., Heinold, B., Kandler, K., Kristensen, T. B., Mayol-Bracero, O. L., Muller, T., Reitebuch, O., Sauer, D., Schafler, A., Schepanski, K., Spanu, A., Tegen, I., Toledano, C., and Walser, A.: THE SAHARAN AEROSOL LONG-RANGE TRANSPORT AND AEROSOL-CLOUD-INTERACTION EXPERIMENT Overview and Selected Highlights, B. Am. Meteorol. Soc., 98, 1427–1451, https://doi.org/10.1175/Bams-D-15-00142.1, 2017.
Winker, D. M., Vaughan, M. A., Omar, A., Hu, Y., Powell, K. A., Liu, Z., Hunt, W. H., and Young, S. A.: Overview of the CALIPSO mission and CALIOP data processing algorithms, J. Atmos. Ocean. Technol., 26, 2310–2323, https://doi.org/10.1175/2009JTECHA1281.1, 2009.
Wiscombe, W. J.: Improved Mie Scattering Algorithms, Appl. Opt., 19, 1505–1509, https://doi.org/10.1364/Ao.19.001505, 1980.
Wu, M., Liu, X., Yu, H., Wang, H., Shi, Y., Yang, K., Darmenov, A., Wu, C., Wang, Z., Luo, T., Feng, Y., and Ke, Z.: Understanding processes that control dust spatial distributions with global climate models and satellite observations, Atmos. Chem. Phys., 20, 13835–13855, https://doi.org/10.5194/acp-20-13835-2020, 2020.
Yu, H., Kaufman, Y. J., Chin, M., Feingold, G., Remer, L. A., Anderson, T. L., Balkanski, Y., Bellouin, N., Boucher, O., Christopher, S., DeCola, P., Kahn, R., Koch, D., Loeb, N., Reddy, M. S., Schulz, M., Takemura, T., and Zhou, M.: A review of measurement-based assessments of the aerosol direct radiative effect and forcing, Atmos. Chem. Phys., 6, 613–666, https://doi.org/10.5194/acp-6-613-2006, 2006.
Yu, H., Chin, M., Remer, L. A., Kleidman, R. G., Bellouin, N., Bian, H., and Diehl, T.: Variability of marine aerosol fine-mode fraction and estimates of anthropogenic aerosol component over cloud-free oceans from the Moderate Resolution Imaging Spectroradiometer (MODIS), J. Geophys. Res.-Atmos., 114, D10206, https://doi.org/10.1029/2008JD010648, 2009.
Yu, H., Chin, M., Winker, D. M., Omar, A. H., Liu, Z., Kittaka, C., and Diehl, T.: Global view of aerosol vertical distributions from CALIPSO lidar measurements and GOCART simulations: Regional and seasonal variations, J. Geophys. Res.-Atmos., 115, 1–19, https://doi.org/10.1029/2009JD013364, 2010.
Yu, H., Tan, Q., Chin, M., Remer, L. A., Kahn, R. A., Bian, H., Kim, D., Zhang, Z., Yuan, T., Omar, A. H., Winker, D. M., Levy, R. C., Kalashnikova, O., Crepeau, L., Capelle, V., and Chédin, A.: Estimates of African Dust Deposition Along the Trans-Atlantic Transit Using the Decadelong Record of Aerosol Measurements from CALIOP, MODIS, MISR, and IASI, J. Geophys. Res.-Atmos., 124, 7975–7996, https://doi.org/10.1029/2019JD030574, 2019.
Yu, H., Yang, Y., Wang, H., Tan, Q., Chin, M., Levy, R. C., Remer, L. A., Smith, S. J., Yuan, T., and Shi, Y.: Interannual variability and trends of combustion aerosol and dust in major continental outflows revealed by MODIS retrievals and CAM5 simulations during 2003–2017, Atmos. Chem. Phys., 20, 139–161, https://doi.org/10.5194/acp-20-139-2020, 2020.
Zhang, J. L. and Christopher, S. A.: Longwave radiative forcing of Saharan dust aerosols estimated from MODIS, MISR, and CERES observations on Terra, Geophys. Res. Lett., 30, 2188, https://doi.org/10.1029/2003gl018479, 2003.
Zhang, Z., Meyer, K., Yu, H., Platnick, S., Colarco, P., Liu, Z., and Oreopoulos, L.: Shortwave direct radiative effects of above-cloud aerosols over global oceans derived from 8 years of CALIOP and MODIS observations, Atmos. Chem. Phys., 16, 2877–2900, https://doi.org/10.5194/acp-16-2877-2016, 2016.
Zhao, C., Liu, X., Leung, L. R., Johnson, B., McFarlane, S. A., Gustafson Jr., W. I., Fast, J. D., and Easter, R.: The spatial distribution of mineral dust and its shortwave radiative forcing over North Africa: modeling sensitivities to dust emissions and aerosol size treatments, Atmos. Chem. Phys., 10, 8821–8838, https://doi.org/10.5194/acp-10-8821-2010, 2010.
Zheng, J., Zhang, Z., Garnier, A., Yu, H., Song, Q., Wang, C., Dubuisson, P., and Di Biagio, C.: The thermal infrared optical depth of mineral dust retrieved from integrated CALIOP and IIR observations, Remote Sens. Environ., 270, 112841, https://doi.org/10.1016/j.rse.2021.112841, 2022.
Zhou, M., Yu, H., Dickinson, R. E., Dubovik, O., and Holben, B. N.: A normalized description of the direct effect of key aerosol types on solar radiation as estimated from Aerosol Robotic Network aerosols and Moderate Resolution Imaging Spectroradiometer albedos, J. Geophys. Res.-Atmos., 110, 1–10, https://doi.org/10.1029/2005JD005909, 2005.
- Abstract
- Introduction
- Data and models
- Methodology
- DRE calculation methodology and validation
- Regional and global dust DRE based on size-resolved DREE dataset
- Summary and conclusion
- Data availability
- Author contributions
- Competing interests
- Disclaimer
- Acknowledgements
- Financial support
- Review statement
- References
- Supplement