the Creative Commons Attribution 4.0 License.
the Creative Commons Attribution 4.0 License.
 | 11 Oct 2022
Dynamics of ENSO-driven stratosphere-to-troposphere transport of ozone over North America
Amy H. Butler
Andrew O. Langford
Dillon Elsbury
Melissa L. Breeden
The El Niño–Southern Oscillation (ENSO) is known to modulate the strength and frequency of stratosphere-to-troposphere transport (STT) of ozone over the Pacific–North American region during late winter to early summer. Dynamical processes that have been proposed to account for this variability include variations in the amount of ozone in the lowermost stratosphere that is available for STT and tropospheric circulation-related variations in the frequency and geographic distribution of individual STT events.
Here we use a large ensemble of Whole Atmosphere Community Climate Model (WACCM) simulations (forced by sea-surface temperature (SST) boundary conditions consistent with each phase of ENSO) to show that variability in lower-stratospheric ozone and shifts in the Pacific tropospheric jet constructively contribute to the amount of STT of ozone in the North American region during both ENSO phases. In terms of stratospheric variability, ENSO drives ozone anomalies resembling the Pacific–North American teleconnection pattern that span much of the lower stratosphere below 50 hPa. These ozone anomalies, which dominate over other ENSO-driven changes in the Brewer–Dobson circulation (including changes due to both the stratospheric residual circulation and quasi-isentropic mixing), strongly modulate the amount of ozone available for STT transport. As a result, during late winter (February–March), the stratospheric ozone response to the teleconnections constructively reinforces anomalous ENSO-jet-driven STT of ozone. However, as ENSO forcing weakens as spring progresses into summer (April–June), the direct effects of the ENSO-jet-driven STT transport weaken. Nevertheless, the residual impacts of the teleconnections on the amount of ozone in the lower stratosphere persist, and these anomalies in turn continue to cause anomalous STT of ozone. These results should prove helpful for interpreting the utility of ENSO as a subseasonal predictor of both free-tropospheric ozone and the probability of stratospheric ozone intrusion events that may cause exceedances in surface air quality standards.
Please read the corrigendum first before continuing.
-
Notice on corrigendum
The requested paper has a corresponding corrigendum published. Please read the corrigendum first before downloading the article.
-
Article
(11947 KB)
- Corrigendum
-
Supplement
(992 KB)
-
The requested paper has a corresponding corrigendum published. Please read the corrigendum first before downloading the article.
- Article
(11947 KB) - Full-text XML
- Corrigendum
-
Supplement
(992 KB) - BibTeX
- EndNote


Ozone transported from the stratosphere contributes to the North American background (NAB) ozone concentration in the free troposphere (Fiore et al., 2014; Cooper et al., 2015; Young et al., 2018) and to surface ozone exceedance events that affect human health (Fiore et al., 2014; Cooper et al., 2015; Young et al., 2018; Zhang et al., 2020; Langford et al., 2022). Unfortunately, estimating the stratospheric contribution to surface exceedances and the NAB is quite complex because atmospheric internal variability and low-frequency climate modes (e.g., the El Niño–Southern Oscillation and the quasi-biennial oscillation) combine to drive significant subseasonal-to-seasonal variations in stratosphere-to-troposphere transport.
On subseasonal-to-seasonal timescales, variability in stratosphere-to-troposphere transport (STT) is primarily modulated via two dynamical processes (Albers et al., 2018, and references therein): variations in the amount of ozone in the lowermost stratosphere available for STT and tropospheric circulation-related variations in the frequency, depth, and geographic distribution of individual STT events (e.g., Breeden et al., 2021). The El Niño–Southern Oscillation (ENSO) is thought to modulate both processes, but unfortunately, prior research yields somewhat conflicting results. For example, on hemispheric spatial scales, Neu et al. (2014) used Tropospheric Emission Spectrometer (TES) and Microwave Limb Sounder (MLS) data (2005–2010) and suggested that the warm phase of ENSO accelerates the Brewer–Dobson circulation (BDC), which leads to more ozone in the lowermost midlatitude stratosphere, and subsequently causes an increase in STT of ozone into the midlatitude troposphere (see also García-Herrera et al., 2006; Calvo et al., 2010; Simpson et al., 2011). This view is supported by Zeng and Pyle (2005), who found a positive correlation between ENSO and global STT for 1990–2001. On the other hand, Hsu and Prather (2009) find a weak correlation between hemispheric or global STT and ENSO during a slightly later period (2001–2005). If more localized spatial scales are considered, some conflicting results remain. For example, Lin et al. (2015) suggested that La Niña (1990–2012) shifts the Pacific storm track northward and increases its variability, leading to more frequent deep stratospheric intrusions transporting stratospheric ozone into the lower troposphere over western North America. However, Langford (1999) found that El Niño (1993–1998) extends the subtropical jet eastward, driving transverse circulations at the nose of the jet that can also increase ozone transport into the middle and upper troposphere over western North America.
It is difficult to discern whether the aforementioned results appear to conflict because of the relatively short data records used or whether both phases of ENSO can potentially increase STT of ozone but with some sensitivity to the specific geographic region. Here we address both possibilities by using a large ensemble of Whole Atmosphere Community Climate Model (WACCM) simulations to quantify how ENSO modulates subseasonal variations in STT of ozone over the Pacific–North American region. The WACCM simulations reveal that ENSO-driven changes in STT are highly dependent on the time of year and geography, with stratospheric and tropospheric processes combining to increase STT in one region while decreasing STT in a second region during the same ENSO phase. Moreover, the large number of simulated ENSO years, forced by the same sea-surface temperature patterns in order to reduce the influence of ENSO diversity, allows for the quantification of the relative importance of ENSO-induced changes in the midlatitude (Lin et al., 2015) and subtropical (Langford 1999) jets for modulating STT of ozone. And in contrast to some previous studies suggesting that the residual circulation and isentropic mixing aspects of the BDC are the primary mediating links between ENSO and stratospheric changes in STT, our results suggest that it is ozone teleconnections that are most important, a finding which is consistent with Zhang et al. (2015) and Olsen et al. (2016).
Ozone teleconnections, first recognized by Reed (1950) (see also Schoeberl and Krueger, 1983; Salby and Callaghan, 1993), result from vertical motion and horizontal advection induced by planetary wave geopotential height perturbations that are associated with opposite-signed ozone perturbations (i.e., a positive geopotential height anomaly is associated with a negative ozone anomaly). In the WACCM simulations, ENSO drives ozone anomalies resembling the Pacific–North American teleconnection pattern that extend from the lowermost stratosphere to at least 50 hPa in height. Here we provide a detailed analysis using a stratospheric ozone tracer (O3S from Tilmes et al., 2016) to demonstrate how the jet shifts and ozone teleconnections patterns caused by ENSO constructively contribute to drive changes in STT of ozone over North America.
Section 2 outlines the WACCM simulations used; Sect. 3 details how stratospheric and tropospheric processes constructively reinforce anomalous STT during different times of the seasonal cycle and for different portions of the Pacific–North American region. A discussion of the implications of our results for subseasonal prediction of STT of ozone is contained in Sect. 4.
2.1 WACCM simulations
Simulations were created using the National Center for Atmospheric Research Whole Atmosphere Community Climate Model (WACCM) version 4 (Mills et al., 2017). WACCM has fully interactive chemistry in the middle atmosphere, which includes a stratospheric ozone tracer (O3S) that evolves via full chemistry in the stratosphere and then decays at a tropospheric chemistry rate once it crosses the tropopause (the version of WACCM we use here includes ozone removal via tropospheric dry deposition). The O3S tracer should be interpreted to represent an upper bound of the stratospheric contribution to a stratosphere-to-troposphere ozone fold, in large part because it is missing some tropospheric chemistry that would likely decrease its tropospheric chemical lifetime (Emmons et al., 2003). WACCM has a limited representation of tropospheric chemistry but simulates background tropospheric interannual ozone variability quite well (Hess et al., 2015). The model extends to ∼ 140 km with 70 vertical levels and a horizontal resolution of 1.9∘ latitude by 2.5∘ longitude.
We conducted two sets of “time-slice” simulations, one set each for El Niño and La Niña conditions. Each simulation is 60 years long, with the first 10 years of each simulation used as model “spin-up” time and subsequently discarded. The simulations are forced via SST composites for each ENSO phase, which were created by averaging over all El Niño and La Niña events (defined as Niño 3.4>1 standard deviation from the March long-term mean) using Hadley Centre Global Sea Ice and Sea Surface Temperature data (HadISST2, years 1950–2008; for a description of the Niño 3.4 index, see https://climatedataguide.ucar.edu/climate-data/nino-sst-indices-nino-12-3-34-4-oni-and-tni, last access: 6 October 2022; Trenberth and National Center for Atmospheric Research Staff, 2022). SST anomalies evolve over a 2-year cycle, growing from zero SST anomaly in January of year 1 to a peak anomaly in January of year 2 and then back to zero anomaly by the end of December of year 2. Thus, over the course of a 60-year simulation, the cycle repeats itself 30 times. The SST anomalies are tapered in space via a half-cosine weighting function so that there is no SST anomaly poleward of latitude (see Supplement Fig. S1 for complete cycle). The ENSO SST composite was constructed to reproduce the largest March SST anomalies in the observational record, thus allowing us to establish an upper bound on the potential effects of ENSO-related control of spring season STT. However, even when constructed in this way, the SST anomalies still peak in January of the second year of the 2-year ENSO cycle. All composites are computed for year 2 of the 2-year ENSO cycle, which corresponds to the mature and decaying portion of the ENSO cycle. In all cases, radiative forcings, tropospheric emission precursors, and volcanic sulfates were set to preindustrial (year 1850) levels to avoid major influence from greenhouse gases or ozone-depleting substances. The simulations contain no tropical quasi-biennial oscillation, and for solar and geomagnetic parameters, a solar cycle average was used. WACCM anomalies are created by subtracting a climatology that is created from the average over all ensembles (El Niño and La Niña simulations, i.e., 100 years of data).
Eliassen–Palm flux vectors and the stratospheric residual circulation () are calculated on daily timescales using the transformed Eulerian mean formulation in spherical coordinates as defined in Andrews et al. (1987). Eddy kinetic energy () is calculated from daily data that are band-passed filtered. For eddy kinetic energy (EKE) near the tropopause, a 2–10 d filter is applied to highlight synoptic timescale variability, while for EKE in the upper stratosphere, a broader 2–120 d filter is applied to capture synoptic and more slowly evolving planetary-scale eddy variability (e.g., Albers et al., 2016).
In the results, most figures are shown for both ENSO phases (or the difference of El Niño minus La Niña) or are included in the Supplement. In all cases, the La Niña anomalies are essentially identical to the El Niño anomalies but opposite in sign, which is due to the symmetry in the prescribed Niño 3.4-based SST forcing for both ENSO phases.
The climatological seasonal cycle of the Northern Hemisphere (and North American) extratropical and high-latitude STT of ozone in the WACCM time-slice simulations is consistent with observations (e.g., Lefohn et al., 2001; Albers et al., 2018), with notable stratospheric ozone (O3S) present in the lower troposphere beginning in December, peaking in March and April, and then largely decreasing so that negligible O3S is present by mid-summer (Supplement Fig. S2). Interannual variability in high-latitude total column ozone can largely be accounted for by variability in the wave-driven BDC, with stratospheric chemistry accounting for less than 20 % of the interannual variance (Fusco and Salby, 1999; Salby and Callaghan, 2002; Weber et al., 2011). The vertical distribution of ozone within the column is controlled by a combination of the BDC (including both advective and eddy transport) in the stratosphere during winter and stratospheric intrusions along the tropopause during spring and early summer. Within the stratosphere, extratropical stratospheric planetary wave driving peaks in Northern Hemisphere winter (Charney and Drazin, 1961; Randel et al., 2002), which increases ozone transport along the deep branch of the BDC leading to a seasonal buildup of ozone in the high-latitude lowermost stratosphere (Konopka et al., 2015; Ploeger and Birner, 2016; Ray et al., 1999; Bönisch et al., 2009; Butchart, 2014; Hegglin and Shepherd, 2007). As spring proceeds into early summer, eddy activity (and hence stratospheric intrusion frequency) along the extratropical tropopause increases in vigor (Breeden et al., 2021, and references therein), which leads to a “flushing” of ozone from the stratosphere into the troposphere that accounts for the seasonal peak in STT of ozone over North America (James et al., 2003; Lefohn et al., 2001; Škerlak et al., 2014; Terao et al., 2008; Albers et al., 2018).

Figure 1Transformed Eulerian mean (TEM) residual circulation anomalies (red arrows) and TEM residual vertical velocity anomalies (, filled color contours) for (a) February–March and (b) April–May of the El Niño time-slice simulations and (c) February–March and (d) April–May of the La Niña time-slice simulations. Units for the residual circulation are millimeters per second (mm s−1) and the vertical axis is in units of millibars (mbar; abbreviated mb in the figures).
3.1 Stratospheric circulation
During late winter, El Niño accelerates the BDC along both the shallow and deep branches (Fig. 1a; the qualitatively but opposite-signed La Niña anomalies are shown Fig. 1c). Along the shallow branch (below roughly 70 hPa), there is strong upwelling between 0–10∘ N and strong downwelling between 10–30∘ N, which is driven by a combination of planetary and gravity waves in the subtropics as documented in previous studies (Garcia-Herrera et al., 2006; Calvo et al., 2010; Simpson et al., 2011; Diallo et al., 2019). Along the deep branch, there is enhanced poleward flow above 10 hPa (not shown) and enhanced downwelling poleward of 30∘ N (primarily above 40 hPa), which is consistent with the observed relationship between the Niño 3.4 index and the BDC (e.g., Rao et al., 2019, and references therein). By mid-spring the enhanced residual circulation along the shallow branch of the BDC persists (Figs. 1b and d), though the vertical extent is reduced, while the ENSO-induced changes along the deep branch of the BDC become negligible.
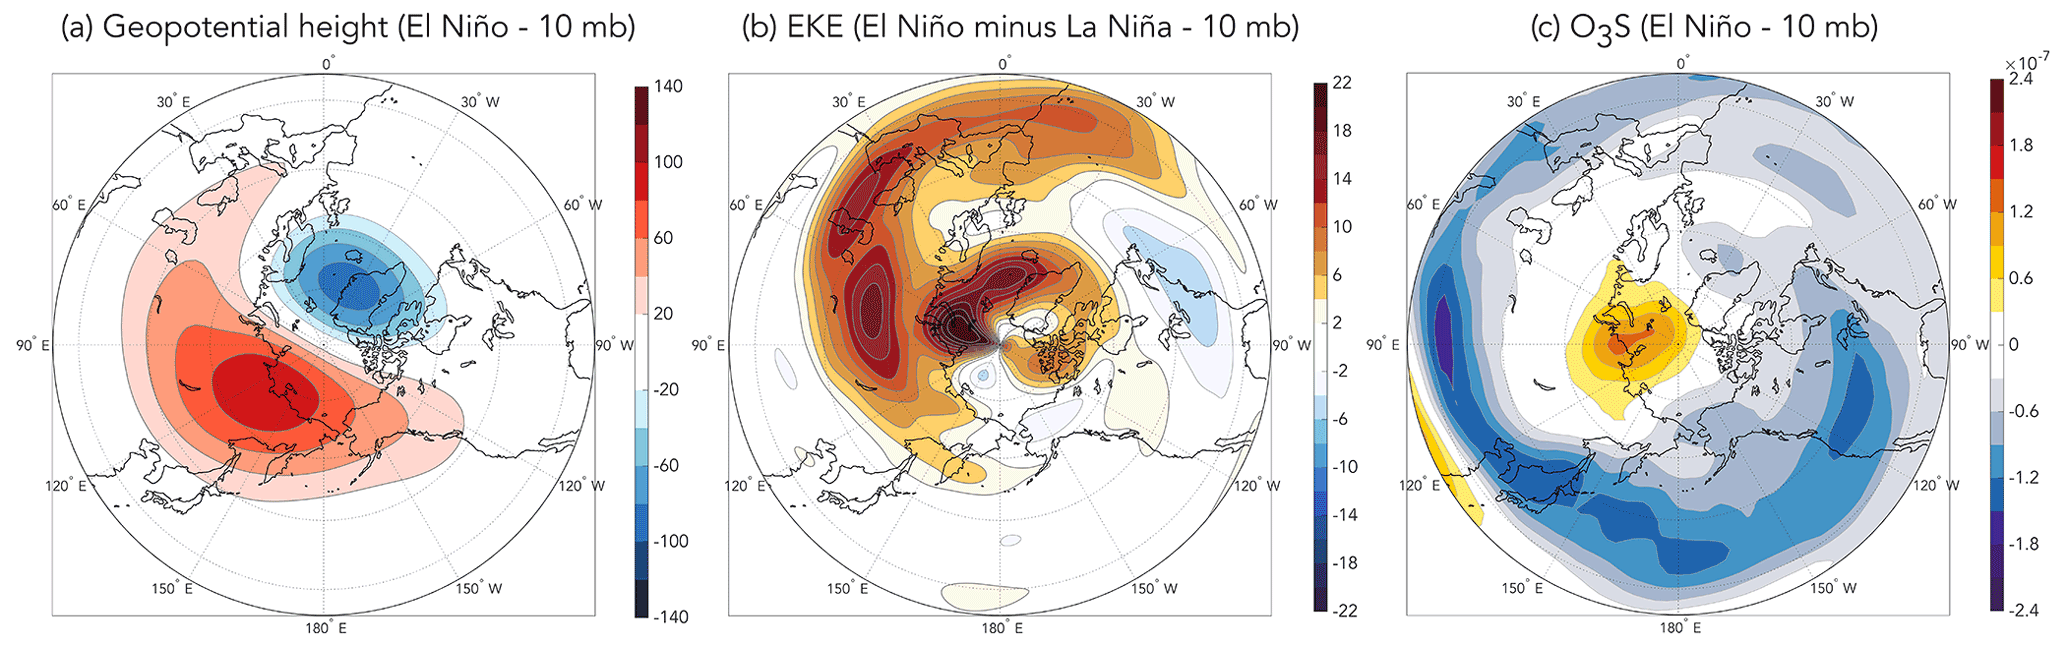
Figure 2February–March 10 hPa anomaly composites of (a) geopotential height (units: gpm, geopotential meter) for El Niño, (b) eddy kinetic energy (2 to 120 d filtered, units: m2 s−2) for El Niño minus La Niña, and (c) stratospheric O3S (units: mass mixing ratio) for El Niño. All figures are plotted on the 10 mbar pressure surface.
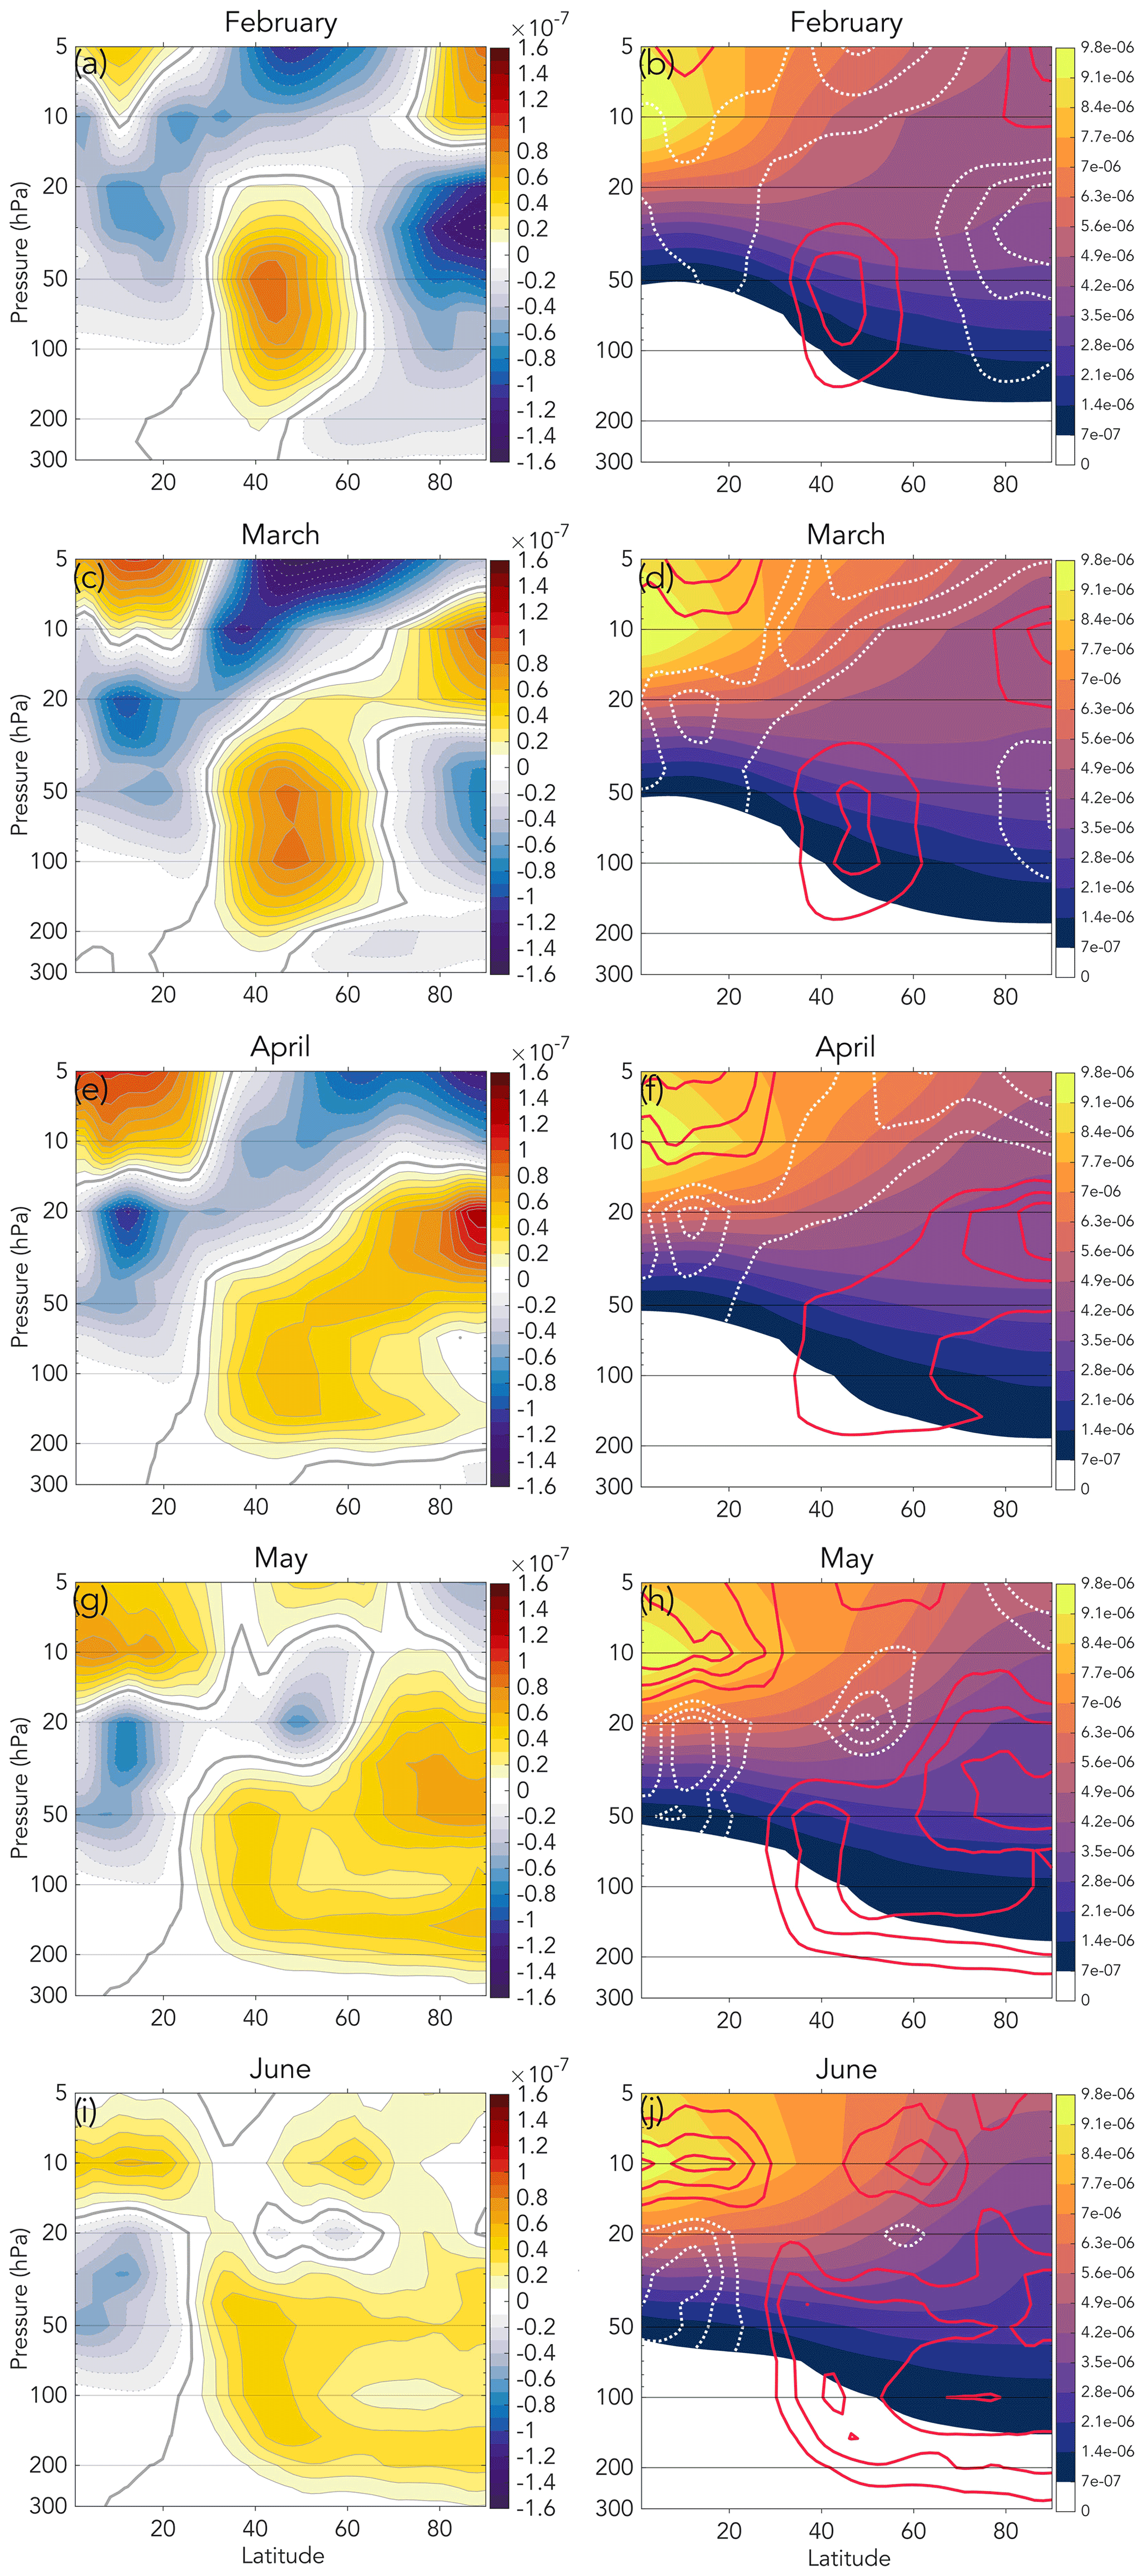
Figure 3February–June El Niño composites of (left column) O3S anomalies and (right column) climatological O3S (filled contours) with positive (red contours) and negative (white dashed contours) O3S anomalies from the left column overlaid. All units are the mass mixing ratio.
The accelerated residual circulation along the deep branch of the BDC reflects, in part, an increase in planetary wave driving in the extratropical upper stratosphere (not shown), which is dominated by planetary wavenumber 1 (Fig. 2a; see also Li and Lau, 2013, and Rao et al., 2019, for similar results). In addition to accelerating the residual circulation, the anomalous planetary waves are also associated with enhanced wave breaking (McIntyre and Palmer, 1983) as evidenced by anomalously large EKE extending from the North Atlantic eastward to the Kamchatka Peninsula (Fig. 2b). The time tendency of ozone is proportional to the negative residual circulation meridional wind times the meridional gradient of ozone and proportional to the eddy flux divergence (see Sect. 9.4 and Appendix 9A of Andrews et al., 1987 for details); thus, because the latitudinal gradient of O3S is negative (O3S decreases poleward; Fig. 3, right column), the enhanced residual circulation and planetary wave breaking (and associated quasi-isentropic mixing) increases O3S at high latitudes and decreases O3S in the extratropics (Fig. 2c). At the beginning of February, this O3S pattern is seen as the north–south dipole structure between 5–10 hPa in Fig. 3a. As spring proceeds, that O3S anomaly pattern is advected poleward and downward by the enhanced residual circulation so that the positive anomaly that is initially located between 80–90∘ N and 5–10 hPa during February (Fig. 3a–b) is advected downward to 20–30 hPa by April (Fig. 3e–f) and to 40–50 hPa by May and June (Fig. 3g–j). However, these anomalies never reach below 70–100 hPa and thus appear to be of negligible importance to spring season STT of O3S. This raises the following question: if it is not the deep branch of the BDC (i.e., the combined effects of quasi-isentropic mixing and the residual circulation) that governs the ENSO-induced O3S anomalies in the lowermost stratosphere (100–300 hPa), then what is responsible for the broad increase in extratropical O3S anomalies in the lowermost stratosphere from winter to spring during El Niño (Fig. 3, left column)?
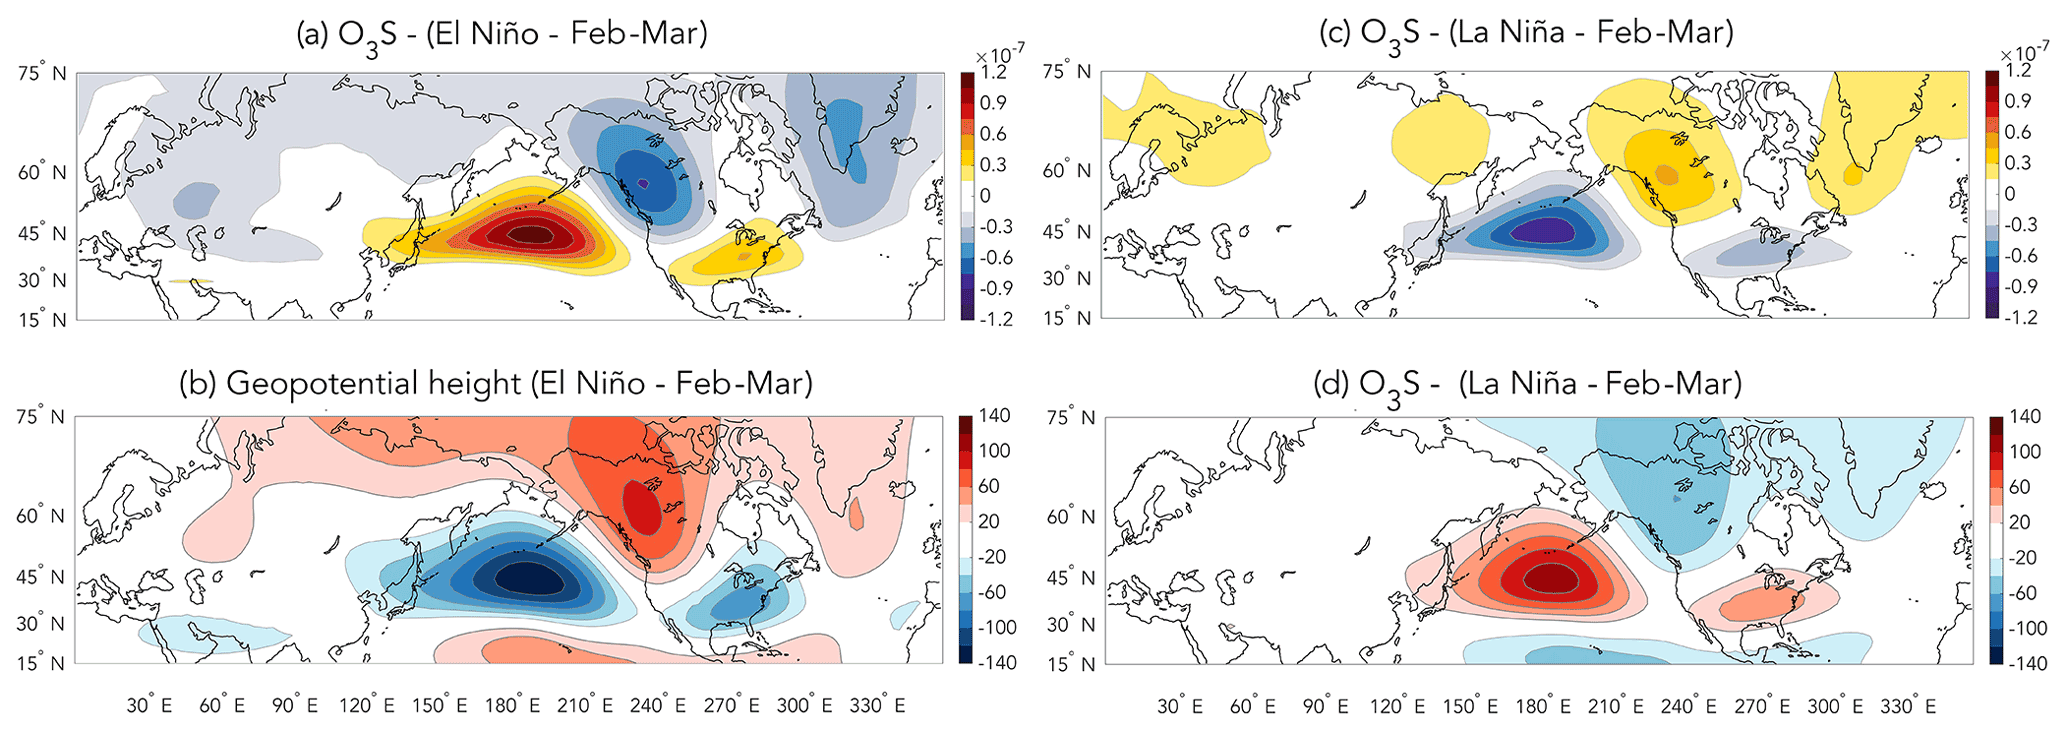
Figure 4February–March (200 hPa pressure level) anomaly composites of O3S (units: mass mixing ratio) for (a) El Niño and (b) La Niña and geopotential height (units: gpm) for (c) El Niño and (d) La Niña.
One possible explanation is hinted at in NASA Microwave Limb Sounder and GEOSCCM (Goddard Earth Observing System Chemistry-Climate Model) climate model simulations shown in Oman et al. (2013) and Olsen et al. (2016), where total column ozone was regressed onto the Niño 3.4 index to reveal a faint pattern of anomalies extending outwards from the tropics towards North America (see their Figs. 6 and 4, respectively). Similarly, Zhang et al. (2015) use National Institute of Water and Atmospheric Research column ozone (an observational product that assimilates satellite measurements) to show a similar pattern during January to March, though their column ozone patterns are a bit more difficult to interpret. Nevertheless, the suggestion of Zhang et al. that lower-stratospheric ozone anomalies arise due to teleconnections forced by ENSO convection is supported by our WACCM simulations. However, the WACCM results considered here suggest that the impact of the teleconnections extends far into the interior of the stratosphere and is thus not due solely to anomalies in tropopause height as suggested by Zhang et al. In particular, the O3S dipole between 20–200 hPa and poleward of 40∘ N (Fig. 3a–d) is almost completely explained by vertically deep teleconnections, where geopotential height and O3S are almost perfectly anticorrelated (cf. Fig. 4a–b and c–d, both on the 200 hPa surface). Similar geopotential height–O3S patterns are observed in our WACCM simulations all the way up to 20 hPa (not shown), where the geopotential height and O3S patterns transition to the wavenumber 1 structure shown in Fig. 2.
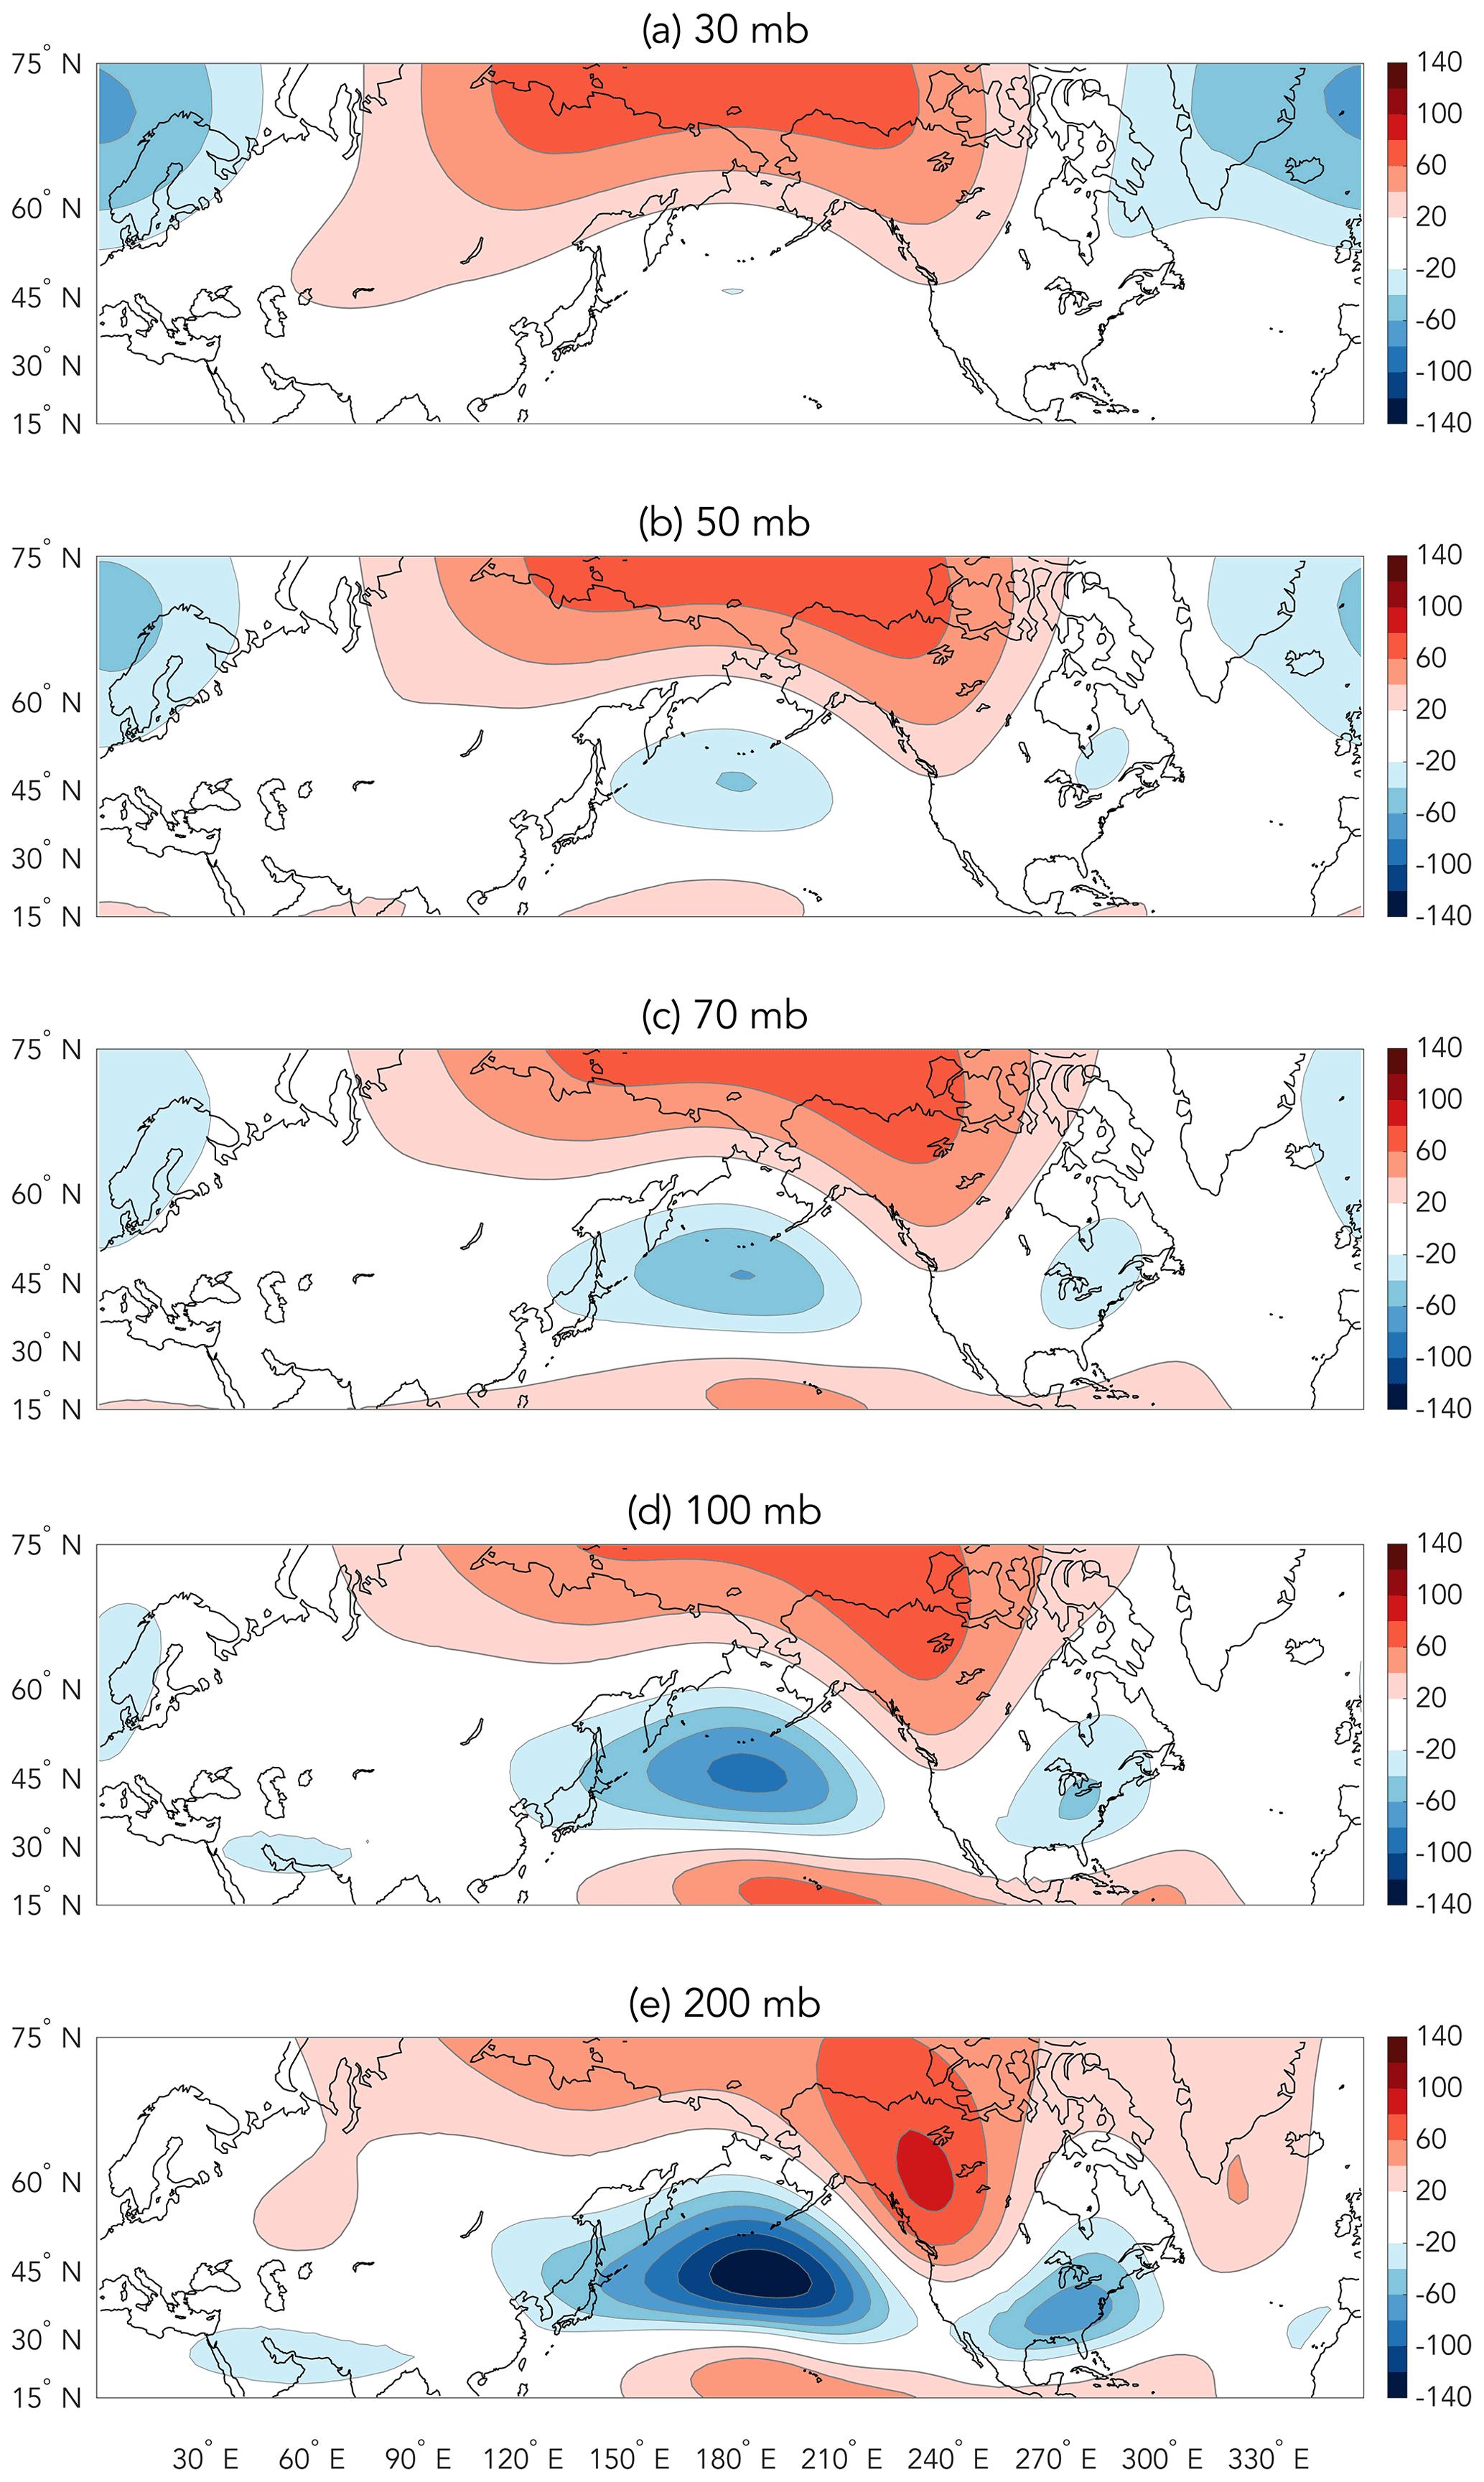
Figure 5February–March El Niño geopotential height (units: gpm) anomaly composites between 30–200 mbar (a to e).

Figure 6April–May (200 hPa pressure level) anomaly composites of O3S (units: mass mixing ratio) for (a) El Niño and (b) La Niña and geopotential height (units: gpm) for (c) El Niño and (d) La Niña.
The anticorrelated geopotential height–O3S patterns (Fig. 4) responsible for the high-latitude O3S dipole between 20–200 hPa (Fig. 3a–d) are consistent with the vertical motion and horizontal advection explanation first described and modeled by Reed (1950) using single-column vertical profiles of observed ozone and atmospheric circulation. The underlying dynamics of the synoptic-scale wave–ozone relationship suggested by Reed were later confirmed by Schoeberl and Krueger (1983) using Nimbus 7 Total Ozone Mapping Spectrometer ozone data and First Global GARP (Global Atmospheric Research Program) Experiment (FGGE) temperature (geopotential height) data (Salby, 1982; see also Salby and Callaghan, 1993). Schoeberl and Krueger conclude with several findings that are relevant to the current WACCM results, namely (1) for medium-scale waves, geopotential height and ozone anomalies should be anticorrelated; (2) vertical motion and horizontal advection are of equal importance to generating the ozone anomalies; and (3) evanescent waves in the lower stratosphere should produce the maximum ozone signal because they will have minimal phase tilt with height, and thus vertical motion and horizontal advection will cause additive anomalies in ozone. The signature of the medium-scale geopotential height waves shown in Fig. 4b and d are part of wave structures that exhibit very little phase tilt with height (Fig. 5), which is consistent with waves that are largely evanescent (Charney and Drazin, 1961). Thus, the anticorrelated (180∘ out of phase) geopotential height–O3S patterns shown in Fig. 4 are consistent with the findings of Schoeberl and Krueger, suggesting that the O3S anomalies are caused by vertical motion and horizontal advection associated with medium-scale evanescent waves (i.e., planetary wavenumber >2). This is in contrast to what would be expected from longer-scale vertically propagating planetary waves (planetary wavenumber <3), which are typically associated with significant poleward and downward eddy–ozone flux transport in the upper-stratospheric photochemical transition region where ozone and geopotential height are 180∘ out of phase but cause minimal transport in the lower stratosphere where ozone and geopotential height tend to be close to in phase (e.g., Fig. 8 of Hartmann and Garcia, 1979; see also Garcia and Hartmann, 1980; Gille et al., 1980; Hartmann, 1981; Albers and Nathan, 2012). While the stratospheric ozone anomalies due to medium-scale waves may be largely reversible in isolation (Salby and Callaghan, 1993; Fusco and Salby, 1999), nonconservative process typically cause irreversible transport of ozone to the troposphere. Thus, the primary role of the ozone teleconnections may be to simply temporarily modulate the amount of ozone in the lowermost stratosphere that is available for subsequent transport into the middle to lower troposphere via tropopause folds, potential vorticity streamers and cutoffs (Reed and Danielson, 1958; Hoerling et al., 1993; Langford and Reid, 1998; Shapiro, 1980; Sprenger et al., 2007; Škerlak et al., 2014, and transverse circulations in jet exit regions (Langford et al., 1998; Langford, 1999).
The geopotential height teleconnections, as well as associated O3S anomalies, peak in February and March (cf. Fig. 3a–d and Fig. 4 for February–March) and quickly decay thereafter (cf. Fig. 3e–h and Fig. 6 for April–May). As the teleconnections dissipate, at least a portion of the large positive O3S anomaly that was once located over the North Pacific (Fig. 4a) is mixed northward, leading to weak positive O3S anomalies over most of the Northern Hemisphere poleward of 50∘ N (Figs. 3e–j and 6a). This poleward mixing reflects the seasonal cycle of the stratospheric polar vortex and the buildup and breakdown of the polar transport barrier, which proceed as follows (e.g., Manney et al., 1994). During mid-winter, the polar night jet is typically located in the middle to upper stratosphere, which, because of the associated strong vortex edge potential vorticity gradient, creates a barrier to latitudinal transport. As spring onsets, the upper portions of the vortex weaken and the polar night jet descends and establishes a transport barrier in the lowermost stratosphere. However, once the stratospheric final warming occurs – typically sometime in March or April (Butler and Domeisen, 2021) – the transport barrier is erased and mixing between polar and midlatitude air rapidly ensues (Manney et al., 1994; Salby and Callaghan, 2007a, b); hence the anomalies shown in Figs. 3e–j and 6a. In the next section, we outline how the ENSO-induced O3S anomalies just described constructively reinforce ENSO-induced changes in synoptic wave activity (and hence stratospheric intrusions) that modulate STT.
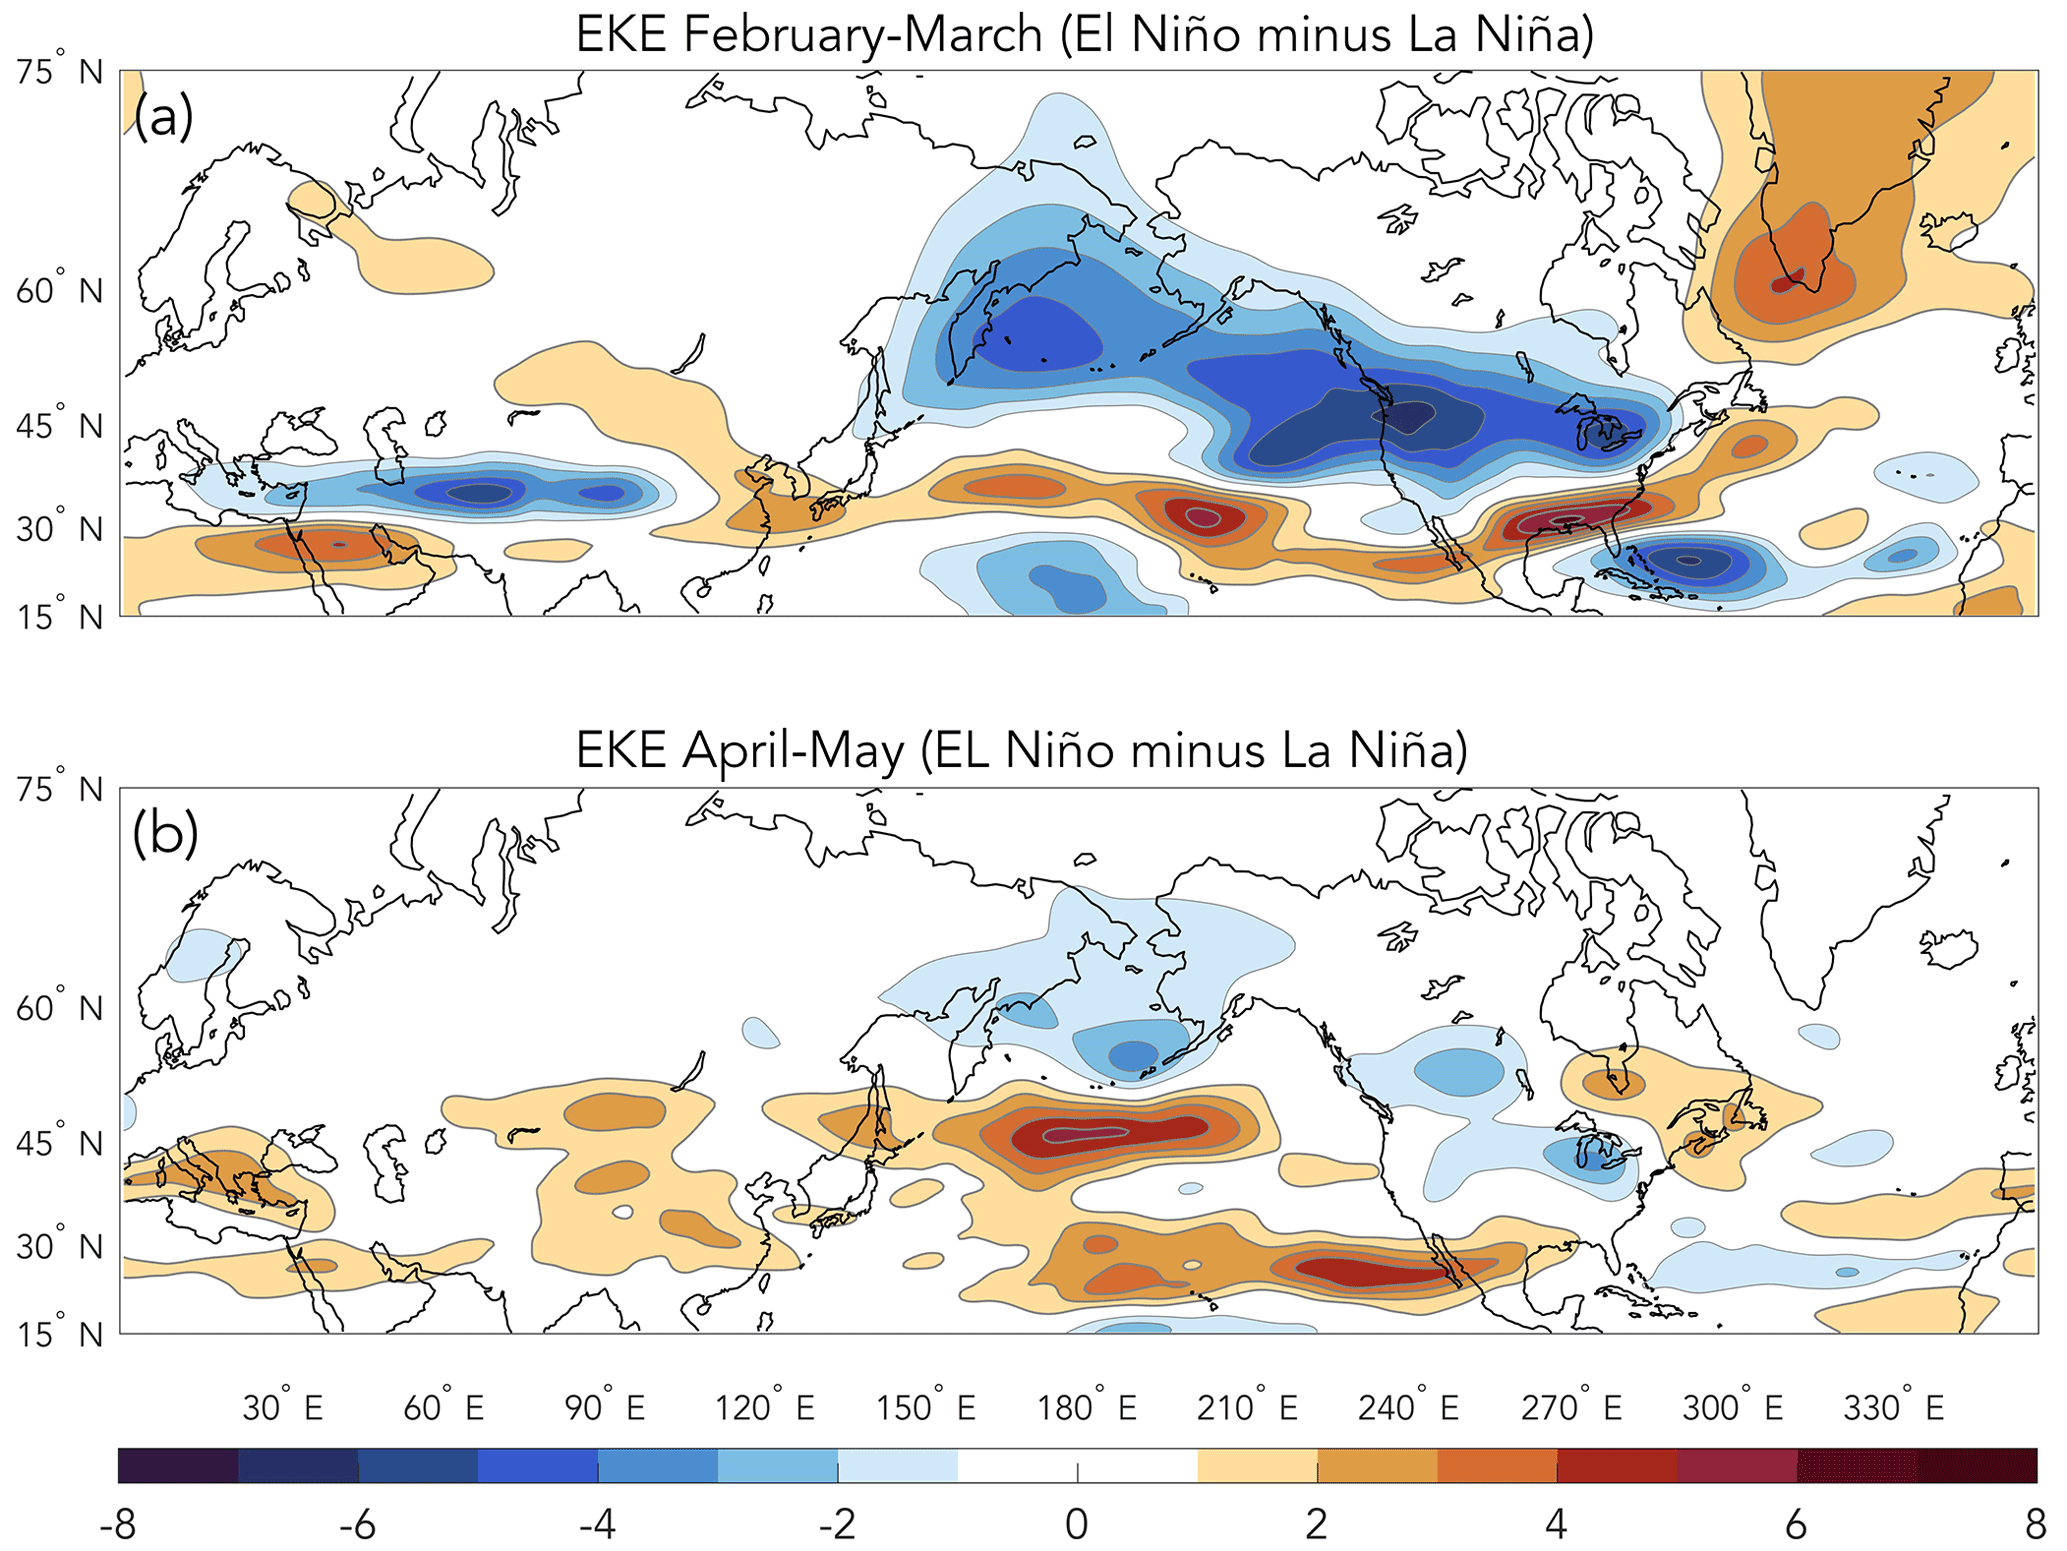
Figure 7Anomaly composites of 200 hPa pressure level eddy kinetic energy (2 to 10 d filtered) for (a) February–March (El Niño minus La Niña) and (b) April–May (El Niño minus La Niña). Units are square meters per square second (m2 s−2).
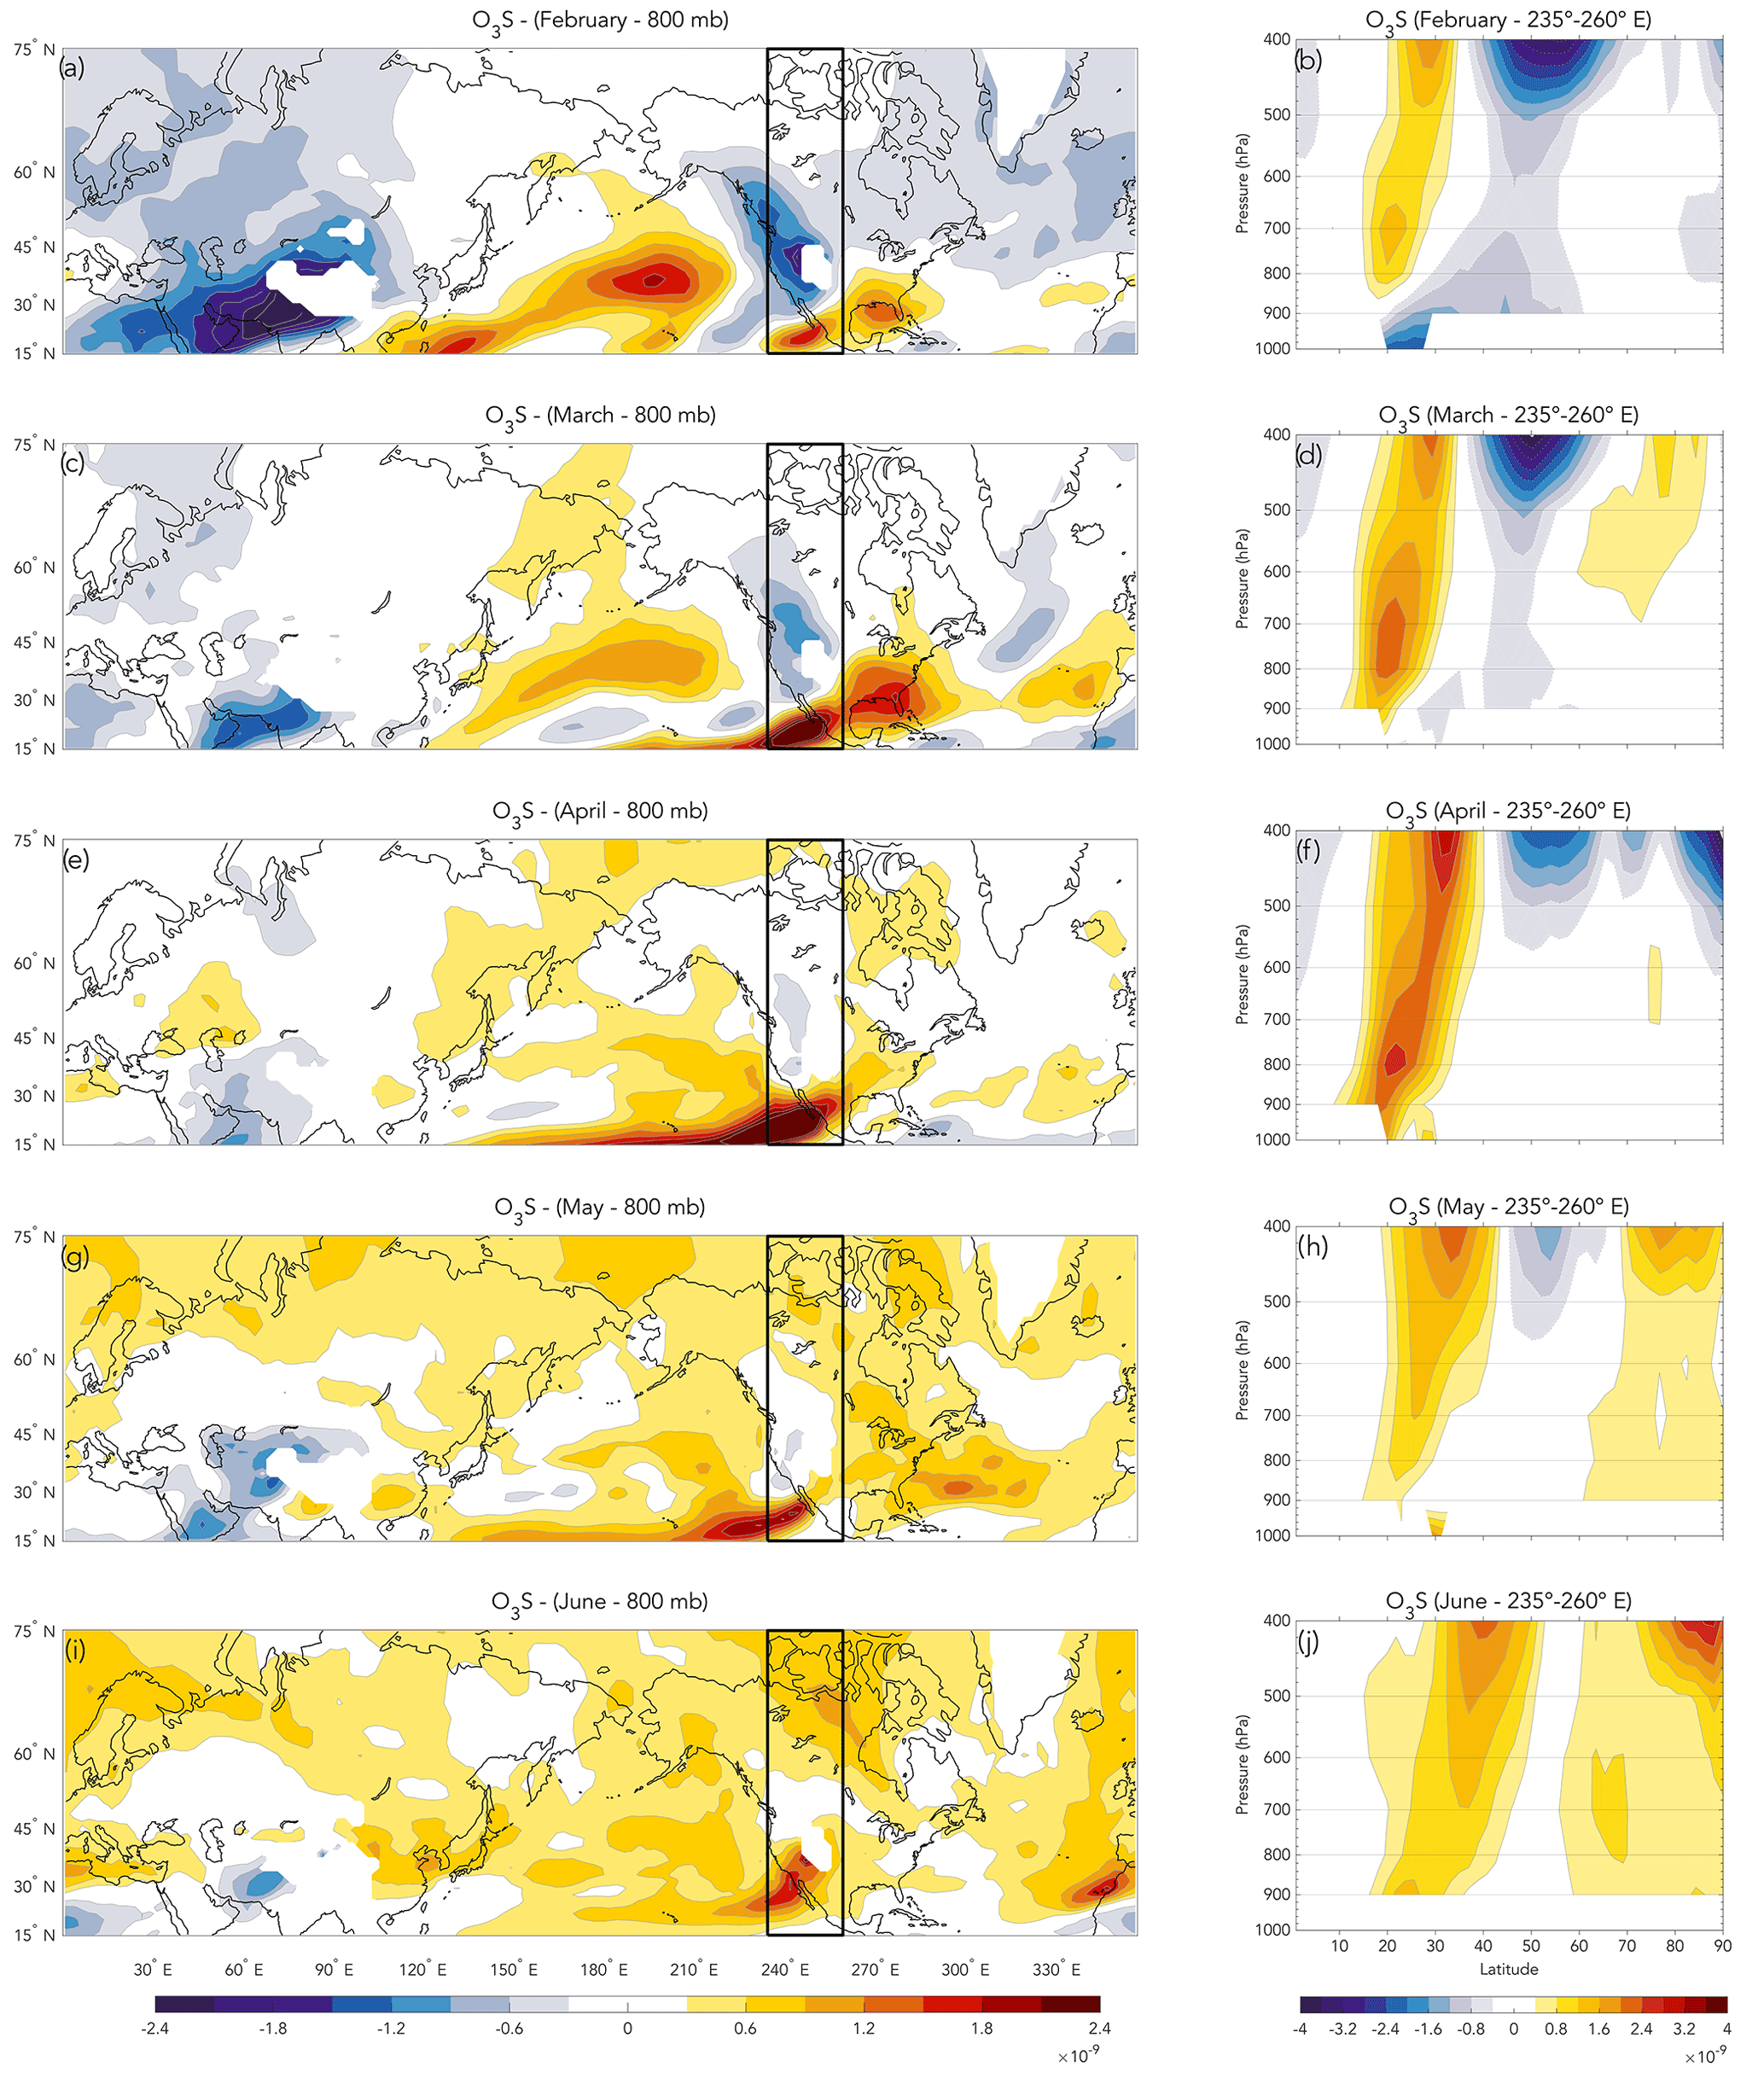
Figure 8February–June El Niño composites of (a, c, e, g, i) 800 hPa O3S anomalies and (b, d, f, h, j) zonal mean anomaly cross-sections of O3S where the longitudinal boundaries (235–260∘ E) of the zonal mean correspond to the box overlaying the left column composites and all figures in the left column are shown on the 800 mbar pressure surface. All units are the mass mixing ratio. White areas reflect missing data associated with topography.
3.2 Upper-tropospheric–lower-stratospheric circulation and STT
Lin et al. (2015) suggested that deep STT of ozone over western North America should increase when La Niña (measured by the Niño 3.4 index) perturbs the polar front jet northward and invigorates it so that the frequency of deep tropopause folds increases. Consistent with this hypothesis, Breeden et al. (2021) find that in reanalysis, EKE and deep mass transport (though not necessarily ozone transport) over the western US increase during time periods when the Niño 3.4 index is at least moderately negative (<−0.5 ∘C). However, Breeden et al. further show that most of the ENSO-jet-related changes occur in late winter and early spring before the Pacific jet structure transitions from its winter to summer-like state (i.e., the jet transitions from being strong and zonally contiguous to being weak, with a discontinuity over the Pacific basin, e.g., Fig. 2 of Breeden et al., 2021). As a result, tropopause fold depth and frequency are increased primarily in February to mid-April during La Niña, and there are only smaller jet-related changes in transport thereafter.
In agreement with the observed relationship between ENSO and EKE (e.g., Breeden et al., 2021; see their Supplement Fig. S6), the WACCM El Niño simulations show decreased EKE over the North Pacific and the western US and increased EKE over Baja California and the southern US during February and March (Fig. 7a) and vice versa for La Niña. The lower EKE to the north and higher to the south reflects the tendency for the time mean Pacific jet to shift southwards during El Niño and northward during La Niña (Shapiro et al., 2001). Here, as in Shapiro et al. (2001), the time mean tends to convolve aspects of the subtropical and polar front jets (see also Koch et al., 2006); however, what is important here is that synoptic timescale anomalies in EKE are associated with shifts in the location of either jet, which in turn are associated with anomalous STT via midlatitude tropopause folds and mixing (Shapiro et al., 2001; Breeden et al., 2021) or transverse circulations in the subtropical-jet exit region (Langford, 1999). Thus, comparing regions with anomalously high or low EKE (Fig. 7a) and high or low O3S in the lowermost stratosphere (Fig. 4a and c) allows us to assess whether changes in tropopause fold frequency and/or transverse circulations near the nose of the jet and stratospheric changes in the amount of ozone available for downward transport, respectively, act constructively or in opposition to generate the observed anomalies of O3S in the lowermost troposphere (Fig. 8 shows the case for El Niño; see Supplement Fig. S3 for the complementary La Niña composites).
During February and March, there is anomalously high STT of O3S to the lower troposphere over the North Pacific, maximizing between roughly 30–45∘ N (Fig. 8a and c). In the extratropics, isentropic surfaces slope downwards from the pole to the Equator (e.g., Fig. 2 of Gettelman et al., 2011), thus lower-tropospheric O3S anomalies associated with stratospheric intrusions should be located somewhat equatorward of the corresponding lower-stratospheric O3S and EKE anomalies (i.e., the EKE and ozone anomalies in the North Pacific in Figs. 4a and 7a, respectively). Because EKE is reduced over the North Pacific (Fig. 7a), which in isolation should correspond to a reduction in tropopause fold frequency (Breeden et al., 2021), the anomalously high stratospheric O3S availability in the North Pacific (Fig. 4a) is likely the controlling factor governing the enhanced O3S transport to the lower troposphere over the central Pacific. That said, transverse circulations (Langford, 1999) associated with the El Niño-induced southward shift in the subtropical jet (note the region of enhanced EKE running east–west just north of Hawaii, Fig. 7a) may also contribute to the lower-tropospheric O3S anomalies in the central Pacific. On the other hand, any isentropic mixing associated with the enhanced EKE north of Hawaii is unlikely to be contributing to the lower-tropospheric O3S anomalies because at these lower latitudes (near 30∘ N), isentropic surfaces in the upper troposphere–lower stratosphere are relatively flat (in the height plane) so that any isentropic mixing would result in STT of ozone into the tropical upper troposphere (e.g., Waugh and Polvani, 2000; Albers et al., 2016). In contrast to the situation over the Pacific Ocean, over the western US, reduced EKE and anomalously low O3S operate constructively to reduce STT of O3S. Similarly, though opposite in sign, the El Niño-induced increases in EKE and lower-stratospheric O3S constructively contribute to enhanced deep STT of O3S over Baja California and the southeastern US. By April–May, the lower-stratospheric O3S anomalies and EKE over the western US have weakened considerably (Figs. 6a and 7b, respectively), which is reflected in anomalous O3S only reaching the middle troposphere (Fig. 8e–h). However, enhanced EKE and anomalously high lower-stratospheric O3S continue to contribute to robust deep STT of O3S over Baja California and the southeastern US. By June, the peak in deep STT of O3S has receded westward and shifted northward so that the maximum transport is located over Baja California and the southwestern US (Fig. 8i, j). These results make clear that the sign of anomalous STT of O3S due to ENSO is highly dependent on the region and time of year. For example, for the western US between 30–45∘ N, February–March El Niño conditions suppress the transport of stratospheric O3S, but as spring progresses into summer (April–June), El Niño instead enhances O3S transport.
STT of ozone is modified by both stratospheric ozone variability and tropopause level jet dynamics (e.g., Lin et al., 2015; Albers et al., 2018; Langford et al., 2022, and references therein). Understanding the relative importance of these two processes is critical for both subseasonal prediction (Lin et al., 2015; Albers et al., 2018, 2021), as well as for assessing the interannual variability of tropospheric ozone concentrations relevant to the NAB (Fiore et al., 2003, 2014).
Our results suggest that there is no conflict between the results of Lin et al. (2015) versus Langford (1999), who hypothesize that La Niña versus El Niño, respectively, enhance western US STT of ozone during spring. Indeed, the two hypotheses can be reconciled by carefully accounting for the way that tropical-to-extratropical teleconnections modulate both lower-stratospheric ozone availability and jet-related transport variability, which are both strongly dependent on the geographic region and month of the year under consideration. For example, during February and March, our results confirm the hypothesis of Lin et al. (2015), suggesting that when La Niña conditions are present (as measured by the Niño 3.4 index), there will be enhanced STT over the western US (Supplement Fig. S3). However, in contrast to Lin et al., our results here suggest that both tropospheric jet dynamics and stratospheric ozone availability contribute to the anomalous transport. At the same time, our results also confirm the hypothesis of Langford (1999), as we find that El Niño conditions lead to enhanced STT of ozone over Baja California and the southern US during February and March (Fig. 8a–d) and enhanced ozone transport over the western US during May and June (Fig. 8g–j). Again, our results suggest that in the later spring period, both tropospheric jet processes and stratospheric ozone availability constructively reinforce each other.
The relatively large ensemble of WACCM time-slice simulations cleanly demonstrates which aspects of stratospheric transport are most important to ENSO-driven STT of ozone. Previous studies have highlighted that ENSO modulates the deep branch of the BDC on seasonal timescales via changes in the residual circulation and quasi-horizontal mixing (e.g., Calvo et al., 2010; Neu et al., 2014; Diallo et al., 2019; Benito-Barca et al., 2022), a result that is supported here (Figs. 1–3). However, owing to the slowness of the deep branch of the residual circulation, ENSO-driven ozone anomalies originating in the upper stratosphere do not reach the lowermost stratosphere by spring (Fig. 3) when STT of ozone maximizes over North America (James et al., 2003; Lefohn et al., 2001; Škerlak et al., 2014; Terao et al., 2008; Albers et al., 2018). In contrast to the vertically propagating planetary waves (zonal wavenumbers <3) that dominate the seasonal changes in the deep branch of the BDC in the upper stratosphere, significant extratropical lower-stratospheric ozone anomalies evolving on sub-monthly timescales can arise due to medium-scale planetary waves (Reed, 1950; Schoeberl and Krueger, 1983; Salby and Callaghan, 1993). Owing to their higher vertical wavenumber (zonal wavenumbers >3), these waves are largely evanescent (Charney and Drazin, 1961), yielding barotropic geopotential height and ozone anomalies that resemble the Pacific–North American teleconnection pattern (Fig. 4). As noted by previous studies (e.g., Salby and Callaghan, 1993; Fusco and Salby, 1999), the ozone transport associated with such medium-scale waves often involves only a conservative redistribution of ozone that is largely reversible. Indeed, our results suggest that, at least to some extent, the large ozone anomalies associated with the ENSO teleconnections are transient and reversible; for example, the large negative ozone anomalies seen at high latitudes over northern Canada in February and March (Figs. 3a and c and 4a) largely disappear by April–March (Figs. 3e and g and 6a), though as mentioned in Sect. 3.1, some amount of hemispheric-scale mixing may occur during the spring breakdown of the polar transport barrier. Nevertheless, even if the ENSO-induced lower-stratospheric ozone transport is, in isolation, largely reversible, processes including tropopause folds, potential vorticity streamers and cutoffs (Reed and Danielson, 1958; Hoerling et al., 1993; Langford and Reid, 1998; Shapiro, 1980; Sprenger et al., 2007; Škerlak et al., 2014), and transverse circulations in jet exit regions (Langford et al., 1998; Langford, 1999) can lead to significant irreversible STT of ozone extending downwards to the middle to lower troposphere (Fig. 8). Thus, our findings suggest that ENSO primarily modulates extratropical lower-stratospheric ozone abundances and hence STT of ozone via transient ozone teleconnections rather than via changes in the residual circulation and mixing, in agreement with the findings of Zhang et al. (2015). While the residual circulation and isentropic mixing tend to be the focus of most BDC studies, if the BDC is more broadly defined to include any process that contributes to mass transport from the tropical tropopause to its eventual exit back into the troposphere at high latitudes (see Butchart, 2014, for a historical discussion of the definition of the BDC), then reversible transport due to medium-scale waves coupled with irreversible STT represents an important process whereby subseasonal variability may contribute to BDC variability.
The sensitivity of ozone transport to the trajectory of tropical–extratropical teleconnections highlights a problematic aspect of attempting to use ENSO indices (e.g., Niño 3.4) to make subseasonal-to-seasonal predictions of STT of ozone. For example, a small northward shift in the location of the wave train depicted in Fig. 4 may change the sign of the western US ozone transport anomaly altogether (i.e., the positive ozone anomaly over Baja California could displace the negative ozone anomaly of the western US in Fig. 8a–d). Indeed, even during times when the Niño 3.4 index is strongly loaded, ENSO diversity (Capotondi et al., 2015) can yield distinctly different teleconnection patterns (e.g., Garfinkel et al., 2013). Moreover, when ENSO teleconnections are convolved with internal variability, the resulting anomaly patterns over North America can vary significantly (e.g., Deser et al., 2017, 2018), which further complicates using ENSO to predict STT of ozone. Thus, instead of using a Niño-based index as a predictor, a perhaps more reliable method is to use a measure of signal or the signal-to-noise ratio to identify time periods when the teleconnections themselves and therefore STT may be more predictable (e.g., Albers and Newman, 2019, 2021; Albers et al., 2021).
The code used to perform this analysis can be accessed by personal communication with the corresponding author. The WACCM simulation data used to create figures can be accessed at https://csl.noaa.gov/groups/csl8/modeldata/data/Albers_etal_2022/ (NOAA, 2022).
The supplement related to this article is available online at: https://doi.org/10.5194/acp-22-13035-2022-supplement.
JRA wrote climate model analysis code, created the figures, and wrote the manuscript. AHB conducted the climate model experiments. AHB, DE, MLB, and AOL provided comments and edited the manuscript.
The contact author has declared that none of the authors has any competing interests.
Publisher’s note: Copernicus Publications remains neutral with regard to jurisdictional claims in published maps and institutional affiliations.
The authors would like to thank Bill Randel and two anonymous reviewers for helpful discussions and comments that improved the paper.
John R. Albers and Dillon Elsbury were funded in part by the National Science Foundation (grant no. 1756958).
This paper was edited by Thomas von Clarmann and reviewed by two anonymous referees.
Albers, J. R. and Nathan, T. R.: Pathways for communicating the effects of stratospheric ozone to the polar vortex: Role of zonally asymmetric ozone, J. Atmos. Sci., 69, 785–801, https://doi.org/10.1175/JAS-D-11-0126.1, 2012.
Albers, J. R. and Newman, M.: A priori identification of skillful extratropical subseasonal forecasts, Geophys. Res. Lett., 46, 12527–12536, https://doi.org/10.1029/2019GL085270, 2019.
Albers, J. R. and Newman, M.: Subseasonal predictability of the North Atlantic Oscillation, Environ. Res. Lett., 16, 044024, https://doi.org/10.1088/1748-9326/abe781, 2021.
Albers, J. R., Kiladis, G. N., Birner, T., and Dias, J.: Tropical Upper-Tropospheric Potential Vorticity Intrusions during Sudden Stratospheric Warmings, J. Atmos. Sci., 73, 2361–2384, https://doi.org/10.1175/JAS-D-15-0238.1, 2016.
Albers, J. R., Perlwitz, J., Butler, A. H., Birner, T., Kiladis, G. N., Lawrence, Z. D., Manney, G. L., Langford, A. O., and Dias, J.: Mechanisms governing interannual variability of stratosphere-to-troposphere ozone transport, J. Geophys. Res., 123, 234–260, https://doi.org/10.1002/2017JD026890, 2018.
Albers, J. R., Butler, A. H., Breeden, M. L., Langford, A. O., and Kiladis, G. N.: Subseasonal prediction of springtime Pacific–North American transport using upper-level wind forecasts, Weather Clim. Dynam., 2, 433–452, https://doi.org/10.5194/wcd-2-433-2021, 2021.
Andrews, D. G., Holton, J. R., and Leovy, C. B.: Middle atmosphere dynamics, Academic Press, ISBN 9780120585762, 1987.
Benito-Barca, S., Calvo, N., and Abalos, M.: Driving mechanisms for the ENSO impact on stratospheric ozone, Atmos. Chem. Phys. Discuss. [preprint], https://doi.org/10.5194/acp-2022-378, in review, 2022.
Bönisch, H., Engel, A., Curtius, J., Birner, Th., and Hoor, P.: Quantifying transport into the lowermost stratosphere using simultaneous in-situ measurements of SF6 and CO2, Atmos. Chem. Phys., 9, 5905–5919, https://doi.org/10.5194/acp-9-5905-2009, 2009.
Brasseur, G., and Solomon, S.: Aeronomy of the middle atmosphere: Chemistry and physics of the stratosphere and mesosphere, Atmospheric and Oceanographic Sciences Library, 3rd edn., Springer, Berlin, Germany, vol. 32, 646 pp., ISBN 9781402038242, 2005.
Breeden, M. L., Butler, A. H., Albers, J. R., Sprenger, M., and Langford, A. O.: The spring transition of the North Pacific jet and its relation to deep stratosphere-to-troposphere mass transport over western North America, Atmos. Chem. Phys., 21, 2781–2794, https://doi.org/10.5194/acp-21-2781-2021, 2021.
Butchart, N.: The Brewer-Dobson circulation, Rev. Geophys., 52, 157–184, https://doi.org/10.1002/2013RG000448, 2014.
Butler, A. H. and Domeisen, D. I. V.: The wave geometry of final stratospheric warming events, Weather Clim. Dynam., 2, 453–474, https://doi.org/10.5194/wcd-2-453-2021, 2021.
Calvo, N., Garcia, R., Randel, W., and Marsh, D.: Dynamical mechanism for the increase in tropical upwelling in the lowermost tropical stratosphere during warm ENSO events, J. Atmos. Sci., 67, 2331–2340, https://doi.org/10.1175/2010JAS3433.1, 2010.
Capotondi, A., Wittenberg, A. T., Newman, M., Di Lorenzo, E., Yu, J.-Y., Braconnot, P., Cole, J., Dewitte, B., Giese, B., Guilyardi, E., Jin, F. F., Karnauskas, K., Kirtman, B., Lee, T., Schneider, N., Xue, Y., and Yeh, S.: Understanding ENSO diversity, Bull. Amer. Met. Soc., 96, 921–938, https://doi.org/10.1175/BAMS-D-13-00117.1, 2015.
Charney, J. and Drazin, P.: Propagation of planetary-scale disturbances from the lower into the upper atmosphere, J. Geophys. Res., 66, 83–109, https://doi.org/10.1029/JZ066i001p00083, 1961.
Cooper, O. R., Langford, A. O., Parrish, D. D., and Fahey, D. W.: Challenges of a lowered US ozone standard, Science, 348, 1096–1097, https://doi.org/10.1126/science.aaa5748, 2015.
Deser, C., Simpson, I. R., McKinnon, K. A., and Phillips, A. S.: The Northern Hemisphere extratropical atmospheric circulation response to ENSO: How well do we know it and how do we evaluate models accordingly?, J. Climate, 30, 5059–5082, https://doi.org/10.1175/JCLI-D-16-0844.1, 2017.
Deser, C., Simpson, I. R., Phillips, A. S., and McKinnon, K. A.: How well do we know ENSO's climate impacts over North America, and how do we evaluate models accordingly?, J. Climate, 31, 4991–5014, https://doi.org/10.1175/JCLI-D-17-0783.1, 2018.
Diallo, M., Konopka, P., Santee, M. L., Müller, R., Tao, M., Walker, K. A., Legras, B., Riese, M., Ern, M., and Ploeger, F.: Structural changes in the shallow and transition branch of the Brewer–Dobson circulation induced by El Niño, Atmos. Chem. Phys., 19, 425–446, https://doi.org/10.5194/acp-19-425-2019, 2019.
Emmons, L., Hess, P., Klonecki, A., Tie, X., Horowitz, L., Lamarque, J.-F., Kinnison, D., Brasseur, G., Atlas, E., Browell, E., Cantrell, C., Eisele, F., Mauldin, R. L., Merrill, J., Ridley, B., Shetter, R.: Budget of tropospheric ozone during TOPSE from two chemical transport models, J. Geophys. Res., 108, 8372, https://doi.org/10.1029/2002JD002665, 2003.
Fiore, A., Jacob, D. J., Liu, H., Yantosca, R. M., Fairlie, T. D., and Li, Q.: Variability in surface ozone background over the United States: Implications for air quality policy, J. Geophys. Res., 108, 4787, https://doi.org/10.1029/2003JD003855, 2003.
Fiore, A., Oberman, J., Lin, M., Zhang, L., Clifton, O., Jacob, D. J., Naik, V., Horowitz, L., Pinto, J., and Milly, G.: Estimating North American background ozone in US surface air with two independent global models: Variability, uncertainties, and recommendations, Atmos. Environ., 96, 284–300, https://doi.org/10.1016/j.atmosenv.2014.07.045, 2014.
Fusco, A. C. and Salby, M. L.: Interannual variations of total ozone and their relationship to variations of planetary wave activity, J. Climate, 12, 1619–1629, https://doi.org/10.1175/1520-0442(1999)012<1619:IVOTOA>2.0.CO;2, 1999.
Garcia, R. and Hartmann, D.: The Role of Planetary Waves in the Maintenance of the Zonally Averaged Ozone Distribution of the Upper Stratosphere., J. Atmos. Sci., 37, 2248–2264, https://doi.org/10.1175/1520-0469(1980)037<2248:TROPWI>2.0.CO;2, 1980.
García-Herrera, R., Calvo, N., Garcia, R., and Giorgetta, M.: Propagation of ENSO temperature signals into the middle atmosphere: A comparison of two general circulation models and ERA-40 reanalysis data, J. Geophys. Res., 111, D0610, https://doi.org/10.1029/2005JD006061, 2006.
Garfinkel, C., Hurwitz, M., Waugh, D., and Butler, A.: Are the teleconnections of Central Pacific and Eastern Pacific El Niño distinct in boreal wintertime?, Clim. Dynam., 41, 1835–1852, https://doi.org/10.1007/s00382-012-1570-2, 2013.
Gettelman, A., Hoor, P., Pan, L. L., Randel, W., Hegglin, M. I., and Birner, T.: The extratropical upper troposphere and lower stratosphere, Rev. Geophys., 49, RG3003, https://doi.org/10.1029/2011RG000355, 2011.
Gille, J. C., Bailey, P. L., Russell, J., and Russell, J.: Temperature and composition measurements from the LRIR and LIMS experiments on Nimbus 6 and 7, Phil. Trans. R. Soc. Lond. A, 296, 205–218, https://doi.org/10.1098/rsta.1980.0165, 1980.
Hartmann, D. L.: Some aspects of the coupling between radiation, chemistry, and dynamics in the stratosphere, J. Geophys. Res., 86, 9631–9640, https://doi.org/10.1029/JC086iC10p09631, 1981.
Hartmann, D. L. and Garcia, R. R.: A mechanistic model of ozone transport by planetary waves in the stratosphere, J. Atmos. Sci., 36, 350–364, https://doi.org/10.1175/1520-0469(1979)036<0350:AMMOOT>2.0.CO;2, 1979.
Hegglin, M. I. and Shepherd, T. G.: O3-N2O correlations from the Atmospheric Chemistry Experiment: Revisiting a diagnostic of transport and chemistry in the stratosphere, J. Geophys. Res., 112, D19301, https://doi.org/10.1029/2006JD008281, 2007.
Hess, P., Kinnison, D., and Tang, Q.: Ensemble simulations of the role of the stratosphere in the attribution of northern extratropical tropospheric ozone variability, Atmos. Chem. Phys., 15, 2341–2365, https://doi.org/10.5194/acp-15-2341-2015, 2015.
Hoerling, M. P., Schaack, T. K., and Lenzen, A. J.: A global analysis of stratospheric-tropospheric exchange during northern winter, Mon. Weather Rev., 121, 162–172, 1993.
Hsu, J. and Prather, M. J.: Stratospheric variability and tropospheric ozone, J. Geophys. Res., 114, D06102, https://doi.org/10.1029/2008JD010942, 2009.
James, P., Stohl, A., Forster, C., Eckhardt, S., Seibert, P., and Frank, A.: A 15-year climatology of stratosphere–troposphere exchange with a Lagrangian particle dispersion model 2, Mean climate and seasonal variability, J. Geophys. Res., 108, 8522, https://doi.org/10.1029/2002JD002639, 2003.
Koch, P., Wernli, H., and Davies, H. C.: An event-based jet-stream climatology and typology, Int. J. Climatol., 26, 283–301, https://doi.org/10.1002/joc.1255, 2006.
Konopka, P., Ploeger, F., Tao, M., Birner, T., and Riese, M.: Hemispheric asymmetries and seasonality of mean age of air in the lower stratosphere: Deep versus shallow branch of the Brewer-Dobson circulation, J. Geophys. Res., 120, 2053–2066, https://doi.org/10.1002/2014JD022429, 2015.
Langford, A. and Reid, S.: Dissipation and mixing of a small-scale stratospheric intrusion in the upper troposphere, J. Geophys. Res., 103, 31265–31276, 1998.
Langford, A., O'Leary, T., Masters, C., Aikin, K., and Proffitt, M.: Modulation of middle and upper tropospheric ozone at northern midlatitudes by the El Niño/Southern Oscillation, Geophys. Res. Lett., 25, 2667–2670, 1998.
Langford, A. O.: Stratosphere-troposphere exchange at the subtropical jet: Contribution to the tropospheric ozone budget at midlatitudes, Geophys. Res. Lett., 26, 2449–2452, https://doi.org/10.1029/1999GL900556, 1999.
Langford, A. O., Senff, C. J., Alvarez II, R. J., Aikin, K. C., Baidar, S., Bonin, T. A., Brewer, W. A., Brioude, J., Brown, S. S., Burley, J. D., Caputi, D. J., Conley, S. A., Cullis, P. D., Decker, Z. C. J., Evan, S., Kirgis, G., Lin, M., Pagowski, M., Peischl, J., Petropavlovskikh, I., Pierce, R. B., Ryerson, T. B., Sandberg, S. P., Sterling, C. W., Weickmann, A. M., and Zhang, L.: The Fires, Asian, and Stratospheric Transport–Las Vegas Ozone Study (FAST-LVOS), Atmos. Chem. Phys., 22, 1707–1737, https://doi.org/10.5194/acp-22-1707-2022, 2022.
Lefohn, A. S., Oltmans, S. J., Dann, T., and Singh, H. B.: Present-day variability of background ozone in the lower troposphere, J. Geophys. Res., 106, 9945–9958, https://doi.org/10.1029/2000JD900793, 2001.
Li, Y. and Lau, N.-C.: Influences of ENSO on stratospheric variability, and the descent of stratospheric perturbations into the lower troposphere, J. Climate, 26, 4725–4748, https://doi.org/10.1175/JCLI-D-12-00581.1, 2013.
Lin, M., Fiore, A. M., Horowitz, L. W., Langford, A. O., Oltmans, S. J., Tarasick, D., and Rieder, H. E.: Climate variability modulates western US ozone air quality in spring via deep stratospheric intrusions, Nat. Commun., 6, 7105, https://doi.org/10.1038/ncomms8105, 2015.
Manney, G., Zurek, R., O'Neill, A., and Swinbank, R.: On the motion of air through the stratospheric polar vortex, J. Atmos. Sci., 51, 2973–2994, https://doi.org/10.1175/1520-0469(1994)051<2973:OTMOAT>2.0.CO;2, 1994.
McIntyre, M. and Palmer, T.: Breaking planetary waves in the stratosphere, Nature, 305, 593–600, https://doi.org/10.1038/305593a0, 1983.
Mills, M. J., Richter, J. H., Tilmes, S., Kravitz, B., MacMartin, D. G., Glanville, A. A., Tribbia, J. J., Lamarque, J.-F., Vitt, F., Schmidt, A., Gettelman, A., Hannay, C., Bacmeister, J. T., Kinnison, D. E.: Radiative and chemical response to interactive stratospheric sulfate aerosols in fully coupled CESM1 (WACCM), J. Geophys. Res., 122, 13–061, https://doi.org/10.1002/2017JD027006, 2017.
Neu, J. L., Flury, T., Manney, G. L., Santee, M. L., Livesey, N. J., and Worden, J.: Tropospheric ozone variations governed by changes in stratospheric circulation, Nat. Geosci., 7, 340–344, https://doi.org/10.1038/ngeo2138, 2014.
NOAA: Index of /groups/csl8/modeldata/data/Albers_etal_2022, NOAA [data set], https://csl.noaa.gov/groups/csl8/modeldata/data/Albers_etal_2022/, last access: 6 October 2022.
Olsen, M. A., Wargan, K., and Pawson, S.: Tropospheric column ozone response to ENSO in GEOS-5 assimilation of OMI and MLS ozone data, Atmos. Chem. Phys., 16, 7091–7103, https://doi.org/10.5194/acp-16-7091-2016, 2016.
Oman, L. D., Douglass, A. R., Ziemke, J. R., Rodriguez, J. M., Waugh, D. W., and Nielsen, J. E.: The ozone response to ENSO in Aura satellite measurements and a chemistry-climate simulation, J. Geophys. Res., 118, 965–976, https://doi.org/10.1029/2012JD018546, 2013.
Ploeger, F. and Birner, T.: Seasonal and inter-annual variability of lower stratospheric age of air spectra, Atmos. Chem. Phys., 16, 10195–10213, https://doi.org/10.5194/acp-16-10195-2016, 2016.
Plumb, R. A.: Stratospheric transport, J. Meteorol. Soc. Jpn. Ser. II, 80, 793–809, https://doi.org/10.2151/jmsj.80.793, 2002.
Randel, W., Chanin, M.-L., and Michaut, C.: SPARC Intercomparison of Middle Atmosphere Climatologies, SPARC Report no. 3, https://www.sparc-climate.org/publications/sparc-reports/sparc-report-no-3/ (last access: 6 October 2022), 2002.
Rao, J., Yu, Y., Guo, D., Shi, C., Chen, D., and Hu, D.: Evaluating the Brewer–Dobson circulation and its responses to ENSO, QBO, and the solar cycle in different reanalyses, Earth and Planetary Physics, 3, 166–181, https://doi.org/10.26464/epp2019012, 2019.
Ray, E. A., Moore, F. L., Elkins, J. W., Dutton, G. S., Fahey, D. W., Vömel, H., Oltmans, S. J., and Rosenlof, K. H.: Transport into the Northern Hemisphere lowermost stratosphere revealed by in situ tracer measurements, J. Geophys. Res., 104, 26, https://doi.org/10.1029/1999JD900323, 1999.
Reed, R. J.: The role of vertical motions in ozone-weather relationships, J. Atmos. Sci., 7, 263–267, https://doi.org/10.1175/1520-0469(1950)007<0263:TROVMI>2.0.CO;2, 1950.
Reed, R. J. and Danielsen, E. F.: Fronts in the vicinity of the tropopause, Archiv für Meteorologie, Geophysik und Bioklimatologie, Ser. A, Meteorologie und Geophysik, 11, 1–17, 1958.
Salby, M. L.: A ubiquitous wavenumber-5 anomaly in the Southern Hemisphere during FGGE, Mon. Wea. Rev., 110, 1712–1721, https://doi.org/10.1175/1520-0493(1982)110<1712:AUWAIT>2.0.CO;2, 1982.
Salby, M. L., and Callaghan, P. F.: Fluctuations of total ozone and their relationship to stratospheric air motions, J. Geophys. Res.-Atmos., 98(D2), 2715-2727, 1993.
Salby, M. L. and Callaghan, P. F.: Interannual changes of the stratospheric circulation: Relationship to ozone and tropospheric structure, J. Climate, 15, 3673–3685, https://doi.org/10.1175/1520-0442(2003)015<3673:ICOTSC>2.0.CO;2, 2002.
Salby, M. L. and Callaghan, P. F.: On the wintertime increase of Arctic ozone: Relationship to changes of the polar-night vortex, J. Geophys. Res., 112, D06116, https://doi.org/10.1029/2006JD007948, 2007a.
Salby, M. L. and Callaghan, P. F.: Influence of planetary wave activity on the stratospheric final warming and spring ozone, J. Geophys. Res., 112, D20111, https://doi.org/10.1029/2006JD007536, 2007b.
Schoeberl, M. R. and Krueger, A. J.: Medium scale disturbances in total ozone during southern hemisphere summer, Bull. Amer. Met. Soc., 64, 1358–1365, https://doi.org/10.1175/1520-0477(1983)064<1358:MSDITO>2.0.CO;2, 1983.
Shapiro, M.: Turbulent mixing within tropopause folds as a mechanism for the exchange of chemical constituents between the stratosphere and troposphere, J. Atmos. Sci., 37, 994–1004, https://doi.org/10.1175/1520-0469(1980)037<0994:TMWTFA>2.0.CO;2, 1980.
Shapiro, M., Wernli, H., Bond, N., and Langland, R.: The influence of the 1997–99 El Niño Southern Oscillation on extratropical baroclinic life cycles over the eastern North Pacific, Quart. J. R. Met. Soc., 127, 331–342, https://doi.org/10.1002/qj.49712757205, 2001.
Simpson, I. R., Shepherd, T. G., and Sigmond, M.: Dynamics of the lower stratospheric circulation response to ENSO, J. Atmos. Sci., 68, 2537–2556, https://doi.org/10.1175/JAS-D-11-05.1, 2011.
Škerlak, B., Sprenger, M., and Wernli, H.: A global climatology of stratosphere–troposphere exchange using the ERA-Interim data set from 1979 to 2011, Atmos. Chem. Phys., 14, 913–937, https://doi.org/10.5194/acp-14-913-2014, 2014.
Sprenger, M., Wernli, H., and Bourqui, M.: Stratosphere–Troposphere Exchange and Its Relation to Potential Vorticity Streamers and Cutoffs near the Extratropical Tropopause, J. Atmos. Sci., 64, 1587–1602, https://doi.org/10.1175/JAS3911.1, 2007.
Terao, Y., Logan, J. A., Douglass, A. R., and Stolarski, R. S.: Contribution of stratospheric ozone to the interannual variability of tropospheric ozone in the northern extratropics, J. Geophys. Res., 113, D18309, https://doi.org/10.1029/2008JD009854, 2008.
Tilmes, S., Lamarque, J.-F., Emmons, L. K., Kinnison, D. E., Marsh, D., Garcia, R. R., Smith, A. K., Neely, R. R., Conley, A., Vitt, F., Val Martin, M., Tanimoto, H., Simpson, I., Blake, D. R., and Blake, N.: Representation of the Community Earth System Model (CESM1) CAM4-chem within the Chemistry-Climate Model Initiative (CCMI), Geosci. Model Dev., 9, 1853–1890, https://doi.org/10.5194/gmd-9-1853-2016, 2016.
Trenberth, K. and National Center for Atmospheric Research Staff: The Climate Data Guide: Nino SST Indices (Nino 1+2, 3, 3.4, 4; ONI and TNI), https://climatedataguide.ucar.edu/climate-data/nino-sst-indices-nino-12-3-34-4-oni-and-tni, last access: 6 October 2022.
Wang, J., Pawson, S., Tian, B., Liang, M.-C., Shia, R.-L., Yung, Y. L., and Jiang, X.: El Niño–Southern Oscillation in tropical and midlatitude column ozone, J. Atmos. Sci., 68, 1911–1921, https://doi.org/10.1175/JAS-D-11-045.1, 2011.
Waugh, D. W., and Polvani, L. M.: Climatology of intrusions into the tropical upper troposphere, Geophys. Res. Lett., 27, 3857–3860, https://doi.org/10.1029/2000GL012250, 2000.
Weber, M., Dikty, S., Burrows, J. P., Garny, H., Dameris, M., Kubin, A., Abalichin, J., and Langematz, U.: The Brewer-Dobson circulation and total ozone from seasonal to decadal time scales, Atmos. Chem. Phys., 11, 11221–11235, https://doi.org/10.5194/acp-11-11221-2011, 2011.
Young, P. J., Naik, V., Fiore, A. M., Gaudel, A., Guo, J., Lin, M., Neu, J., Parrish, D., Reider, H., Schnell, J., Tilmes, S., Wild, O., Zhang, L., Ziemke, J., Brandt, J., Delcloo, A., Doherty, R. M., Geels, C., Hegglin, M. I., Hu, L., Im, U., Kumar, R., Luhar, A., Murray, L., Plummer, D., Rodriguez, J., Saiz-Lopez, A., Schultz, M. G., Woodhouse, M. T., and Zeng, G.: Tropospheric Ozone Assessment Report: Assessment of global-scale model performance for global and regional ozone distributions, variability, and trends, Elem. Sci. Anth., 6, 1–49, https://doi.org/10.1525/elementa.265, 2018.
Zeng, G. and Pyle, J. A.: Influence of El Niño Southern Oscillation on stratosphere/troposphere exchange and the global tropospheric ozone budget, Geophys. Res. Lett., 32, L01814, https://doi.org/10.1029/2004GL021353, 2005.
Zhang, J., Tian, W., Wang, Z., Xie, F., and Wang, F.: The influence of ENSO on northern midlatitude ozone during the winter to spring transition, J. Climate, 28, 4774–4793, https://doi.org/10.1175/JCLI-D-14-00615.1, 2015.
Zhang, L., Lin, M., Langford, A. O., Horowitz, L. W., Senff, C. J., Klovenski, E., Wang, Y., Alvarez II, R. J., Petropavlovskikh, I., Cullis, P., Sterling, C. W., Peischl, J., Ryerson, T. B., Brown, S. S., Decker, Z. C. J., Kirgis, G., and Conley, S.: Characterizing sources of high surface ozone events in the southwestern US with intensive field measurements and two global models, Atmos. Chem. Phys., 20, 10379–10400, https://doi.org/10.5194/acp-20-10379-2020, 2020.
The requested paper has a corresponding corrigendum published. Please read the corrigendum first before downloading the article.
- Article
(11947 KB) - Full-text XML
- Corrigendum
-
Supplement
(992 KB) - BibTeX
- EndNote