the Creative Commons Attribution 4.0 License.
the Creative Commons Attribution 4.0 License.
 | 11 Oct 2022
Radiative impact of improved global parameterisations of oceanic dry deposition of ozone and lightning-generated NOx
Ian E. Galbally
Matthew T. Woodhouse
We investigated the radiative impact of recent process-based improvements to oceanic ozone (O3) dry deposition parameterisation and empirical improvements to lightning-generated oxides of nitrogen (LNOx) parameterisation by conducting a 5-year simulation of the Australian Community Climate and Earth System Simulator – United Kingdom Chemistry and Aerosol (ACCESS-UKCA) global chemistry–climate model, with radiative effects of O3, methane (CH4) and aerosol included. Compared to the base parameterisations, the global consequences of the two improved parameterisations on atmospheric composition are dominated by the LNOx change (which increases the LNOx production from 4.8 to 6.9 Tg N yr−1) and include (a) an increase in the O3 column of 3.75 DU, and this O3 change is centred on the tropical upper troposphere where O3 is most effective as a radiative forcer; (b) a decrease of 0.64 years in the atmospheric lifetime of CH4 due to an increase in hydroxyl radical, which corresponds to a decrease of 0.31 years in the CH4 lifetime per Tg N yr−1 change in LNOx; (c) an increase of 6.7 % in the column integrated condensation nuclei concentration; and (d) a slight increase in high-level cloud cover. The two combined parameterisation changes cause an increase of 86.3 mW m−2 in the globally-averaged all-sky net downward top-of-atmosphere (TOA) radiative flux (which is akin to instantaneous radiative forcing), and only 5 % of which is due to the dry deposition parameterisation change. Other global radiative changes from the use of the two parameterisations together include an increase in the downward longwave radiation and a decrease in the downward shortwave radiation at the earth's surface. The indirect effect of LNOx on aerosol and cloud cover can at least partly explain the differences in the downward shortwave flux at the surface. It is demonstrated that although the total global LNOx production may be the same, how LNOx is distributed spatially makes a difference to radiative transfer. We estimate that for a reported uncertainty range of 5±3 Tg N yr−1 in global estimates of LNOx, the uncertainty in the net downward TOA radiation is ±119 mW m−2. The corresponding uncertainly in the atmospheric methane lifetime is ±0.92 years. Thus, the value of LNOx used within a model will influence the effective radiative forcing (ERF) and global warming potential (GWP) of anthropogenic CH4, and influence the results of climate scenario modelling.
- Article
(9536 KB) - Full-text XML
-
Supplement
(488 KB) - BibTeX
- EndNote


Apart from water vapour, the principal greenhouse gases in the atmosphere are carbon dioxide (CO2), methane (CH4), ozone (O3), nitrous oxide (N2O), and fluorinated gases. Because they are radiatively active, these gases play an important role in the earth's energy budget and, hence, climate system. Together with aerosol, their concentrations govern the impedance to transfer and loss from the atmosphere of radiative energy. Radiative forcing is a change in the top-of-atmosphere (TOA) energy budget as a result of an imposed anthropogenic or natural perturbation (for example, changes in aerosol or greenhouse gas concentrations, in downwelling solar radiation, or in land use). The climate system responds to this change by cooling or warming. In the Sixth Assessment Report (AR6) of the United Nations Intergovernmental Panel on Climate Change (IPCC), an effective radiative forcing (ERF) is termed as a change in net downward radiative flux at the TOA following a perturbation, including the effects of any adjustments in both tropospheric and stratospheric temperatures, water vapour, clouds, and some surface properties, for example surface albedo from vegetation changes, but excluding any changes due to the global surface air temperature change (Forster et al., 2021). According to the IPCC AR6, the total abundance-based anthropogenic ERF due to increases in long-lived, well-mixed greenhouse gases over the years 1750–2019 is 3.32±0.29 W m−2, of which 2.16±0.26 W m−2 is due to CO2, 0.54±0.11 W m−2 to CH4, 0.21±0.03 W m−2 to N2O and 0.41±0.08 W m−2 to total halogens (Forster et al., 2021). Ozone is a short-lived climate forcer (SLCF), with a globally averaged lifetime of about 22 d in the troposphere (Young et al., 2013), and its anthropogenic ERF for the same years is estimated to be 0.47±0.23 W m−2, almost all (95 %) of which is due to tropospheric O3 changes. Thus, tropospheric O3 provides the third largest anthropogenic ERF, and overall O3 represents about 16 % of the net anthropogenic ERF of 2.72±0.76 W m−2; the latter includes an aerosol ERF of W m−2 (Forster et al., 2021).
Ozone interacts with downwelling and upwelling solar (or shortwave) and terrestrial (or longwave) radiation. Any changes in the atmospheric distribution of O3 contribute to changes in its radiative impact. Compared to the long-lived and well-mixed greenhouse gases, O3 exhibits a highly spatially inhomogeneous distribution in the troposphere because of its short chemical lifetime compared to transport timescales, and therefore, it has strong radiative effects on regional scales.
Ozone is not emitted directly into the atmosphere but is formed in both the stratosphere and troposphere by photochemical reactions involving natural and anthropogenic precursor species. Ozone is an oxidant as well as a precursor to the formation of hydroxyl (OH) and hydroperoxyl radicals, which play a critical role in the tropospheric chemical cycles of many trace gases, e.g. CH4 and carbon monoxide (CO), and the production of aerosol. The tropospheric budget of O3 is governed by its production through the photochemical oxidation of CH4, CO, and non-methane volatile organic compounds (NMVOC) in the presence of oxides of nitrogen (NOx), removal by several chemical reactions, removal by dry deposition at surface of the earth, and the downward transport of O3 from the stratosphere.
This paper extends recent work on improvements to the oceanic O3 dry deposition parameterisation (Luhar et al., 2018) and lightning-generated NOx (referred to as LNOx) parameterisation (Luhar et al., 2021) to investigate the impact on radiative transfer of these improvements via the use of the global Australian Community Climate and Earth System Simulator – United Kingdom Chemistry and Aerosol (ACCESS-UKCA) chemistry–climate model. One of the primary purposes of improving these physico-chemical processes is to improve the overall performance of chemistry–climate and Earth system models.
Dry deposition is a significant sink of O3 (Galbally and Roy, 1980; Luhar et al., 2017; Clifton et al., 2020), affecting O3 mixing ratio, and its long-range transport and lifetime. The improved dry deposition parameterisation by Luhar et al. (2018) is a mechanistic air–sea exchange scheme that accounts for the concurrent waterside processes of molecular diffusion, O3 solubility, first-order chemical reaction of O3 with dissolved iodide, and turbulent transfer. It is a significant improvement over the assumption in most chemical transport models that the controlling term of surface resistance in the scheme for dry deposition velocity of O3 at the ocean surface is constant based on Wesely (1989) (see Sect. 2.2), and results in a smaller averaged O3 dry deposition velocity to the ocean (by a factor of 2–3), in better agreement with observations, and an increase in the tropospheric O3 burden by 1.5 % and a decrease in the methane lifetime by 0.8 %.
Although LNOx accounts for only about 10 % of the global NOx source, it has a disproportionately large contribution to the tropospheric burdens of O3 and OH (Dahlmann et al., 2011; Murray, 2016). The impact of LNOx on O3 concentration, the CH4 lifetime against loss by tropospheric OH, and aerosol in turn influences atmospheric radiative transfer. Schumann and Huntrieser (2007) report a large uncertainty range of 5±3 Tg N (nitrogen) yr−1 in the global amount of LNOx generated. Other estimates of global LNOx emissions include 6±2 Tg N yr−1 (Martin et al., 2007) and ∼9 Tg N yr−1 (Nault et al., 2017).
(As a side note, while we estimate the globally-averaged direct energy dissipated from lightning flashes to be only ∼0.2 mW m−2 (see S1 in the Supplement for details), the radiative energy retained in the atmosphere due to the net impact of LNOx on O3 production and CH4 loss is ∼40 mW m−2 per Tg N yr−1 produced due to lightning (see Sect. 3.5), which implies a radiative impact of ∼80–320 mW m−2 corresponding to the above LNOx range of 5±3 Tg N yr−1. The atmospheric radiative change resulting from lightning is, thus, roughly three orders of magnitude larger than the direct energy release associated with the lightning flashes, a remarkable atmospheric amplifier.)
In most global chemistry models, lightning flash rates used to estimate LNOx are expressed in terms of convective cloud-top height via Price and Rind's (1992) (PR92) empirical parameterisations for land and ocean. Luhar et al. (2021) tested the PR92 flash-rate parameterisations within ACCESS-UKCA using satellite lightning data and found that while the PR92 parameterisation for land performs well, the oceanic parameterisation underestimates the observed global mean flash frequency by a factor of approximately 30, leading to LNOx being underestimated proportionally over the ocean. Luhar et al. (2021) improved upon the PR92 flash-rate parameterisations (see Sect. 2.3). They showed that the improved parameterisation for land performs very similarly to the corresponding PR92 one in simulating the continental spatial distribution of the global lightning flash rate. The improved oceanic parameterisation simulates the oceanic and total flash-rate observations much more accurately. Luhar et al. (2021) used the improved flash-rate parameterisations in ACCESS-UKCA and found that they resulted in a considerable impact on the modelled tropospheric composition compared to the default PR92 parameterisations, including an increase in the global LNOx from 4.8 to 6.6 Tg N yr−1, an increase in the O3 burden by 8.5%, a 13% increase in the volume-weighted global OH, and a decrease in the methane lifetime by 6.7 %. The improved flash-rate parameterisations also led to improved simulation of tropospheric NOx and ozone in the Southern Hemisphere and over the ocean compared to observations. Luhar et al. (2021) did not examine any changes in aerosol due to the changes in LNOx (this is done in the present work).
We conduct a number of ACCESS-UKCA model simulations to quantify the effects of the above two parameterisation changes on the net downward shortwave (SW) and longwave (LW) radiative fluxes at the TOA, and the downward surface SW and LW radiative fluxes, and these are reported here. A part of these changes arises due to the changes in atmospheric lifetime of CH4, and that is included in the discussion. The calculated changes in the radiative fluxes are also put into the context of the IPCC anthropogenic ERF estimates.
We use the United Kingdom Chemistry and Aerosol (UKCA) global atmospheric composition model (Abraham et al., 2012; https://www.ukca.ac.uk, last access: 7 October 2022) coupled to ACCESS (Australian Community Climate and Earth System Simulator) (Bi et al., 2013; Woodhouse et al., 2015). In the simulations carried out here, ACCESS is essentially the same as the UK Met Office's Unified Model (UM) (vn8.4), as the ACCESS specific land-surface and ocean components are not invoked. The UM's original land-surface scheme JULES (Joint UK Land Environment Simulator) is used, and the model is run in atmosphere-only mode with prescribed monthly mean sea surface temperature (SST) and sea ice fields. The atmosphere component of the UM vn8.4 is the Global Atmosphere (GA 4.0) (Walters et al., 2014). The UKCA configuration used here is the so-called StratTrop (or Chemistry of the Stratosphere and Troposphere – CheST) (Archibald et al., 2020), which also includes the Global Model of Aerosol Processes (GLOMAP)-mode aerosol scheme (Mann et al., 2010). Dust is treated outside of GLOMAP-mode as per the scheme described by Woodward (2001).
The tropospheric chemistry scheme includes the chemical cycles of Ox, HOx, and NOx, and the oxidation of CO, CH4, and other volatile organic carbon (VOC) species (for example, ethane, propane, and isoprene). The Fast-JX photolysis scheme reported by Neu et al. (2007) and Telford et al. (2013) is used. Ozone is coupled interactively between chemistry and radiation. The aerosol section includes sulfur chemistry. The total number of chemical reactions, including those in aerosol chemistry, is 306 across 86 species.
The horizontal resolution of the atmospheric model is 1.875∘ longitude × 1.25∘ latitude, with 85 staggered terrain-following hybrid-height levels extending from the surface to 85 km in altitude (the so-called N96L85 configuration). The vertical resolution becomes coarser with height, with the lowest 65 levels (altitudes up to ∼30 km) located within the troposphere and lower stratosphere. The model's dynamical timestep is 20 min, and the UKCA chemical solver is called every 60 min.
A global monthly varying emissions database for reactive gases and aerosol is used, which includes both anthropogenic, biomass burning and natural components (Woodhouse et al., 2015; Desservettaz et al., 2022). Pre-2000 anthropogenic emissions are prescribed from the Atmospheric Chemistry and Climate Model Intercomparison Project (ACCMIP) (Lamarque et al., 2010), and post-2000 from Representative Concentrations Pathway (RCP) 6.0 scenario (van Vuuren et al., 2011). Biomass burning emissions are from the GFED4s database (van der Werf et al., 2017). Concentrations of CO2, CH4, N2O, and O3 depleting substances are prescribed instead of emissions and are from the Coupled Model Intercomparison Project Phase 5 (CMIP5) and RCP6.0 recommendations. Terrestrial biogenic emissions are from the Model of Emissions of Gases and Aerosols from Nature – Monitoring Atmospheric Composition and Climate dataset (MEGAN-MACC; Sindelarova et al., 2014), excepting soil NOx, which is taken from the “global emissions initiative” (GEIA) project (https://www.geiacenter.org; last access: 11 August 2014). The “present and future surface emissions of atmospheric compounds” (POET) database (Olivier et al., 2003) is used for oceanic ethane, propane, and CO emissions. Details of required emissions of other species and their original sources, including biogenic emissions, chemical precursors, and primary aerosol are given by Woodhouse et al. (2015).
2.1 Radiation scheme
UKCA is coupled to ACCESS's radiation scheme to determine the impact of the UKCA aerosol and radiatively active trace gases (normally O3, CH4, N2O, and O3 depleting substances) for any specific model configuration. For radiatively active trace gases, the Edwards and Slingo (1996) scheme, with updates described by Walters et al. (2014), is used. For the major gases (i.e. the dominant absorbers) in the shortwave bands, absorption by water vapour (H2O), O3, CO2, and oxygen (O2) is included. The treatment of O3 absorption is as described by Zhong et al. (2008). For the major gases in the longwave bands, absorption by H2O, O3, CO2, CH4, N2O, and halocarbons is included. The treatment of CO2 and O3 absorption is as described by Zhong and Haigh (2000). Of the major gases considered, H2O and O3 are prognostic, whilst other gases are prescribed using either fixed or time-varying mass mixing ratios and are assumed to be well mixed. The method of equivalent extinction (Edwards, 1996) is used for the minor gases (i.e. the weak absorbers) in each band.
In the present UKCA configuration, aerosol (direct scattering and absorption), O3, CH4, and N2O are coupled to the radiation code where aerosol and O3 are passed from the modelled 3-D fields. Aerosol additionally influences the large-scale cloud and precipitation schemes through the cloud droplet number concentration, whereas convective rainfall and cloud formation are not directly coupled to the model aerosol scheme but can be indirectly influenced via changes in radiation, which can in turn influence properties such as temperature and moisture (Abraham et al., 2012; Bellouin et al., 2013; Fiddes et al., 2018).
LNOx is also a precursor of nitrate aerosol in the upper troposphere, and this aerosol can influence atmospheric radiation (Tost, 2017). However, ACCESS-UKCA as used here does not include nitrate aerosol, which is also the case with most global chemistry–climate models. Of the ten CMIP6 Earth system models that conducted the AerChemMIP (Aerosol and Chemistry Model Intercomparison Project) simulations, only three included nitrate aerosols (Thornhill et al., 2021b). Szopa et al. (2021) report that there is a relatively small negative contribution to ERF through formation of nitrate aerosols. Recently, a nitrate scheme was incorporated in UKCA (Jones et al., 2021), and this should be tested in the future to examine the impact of nitrate aerosol from lightning on radiation. Although our model does not include a nitrate aerosol scheme, the LNOx changes would impact aerosol through perturbations to background tropospheric oxidants, for example increases in aerosol abundances due to faster oxidation rates of sulfur to sulfate as LNOx is increased (Murray, 2016).
2.2 Ozone dry deposition scheme for the ocean
Dry deposition flux of O3 to earth's surface is modelled as the product of O3 concentration in the air near the surface and a (downward) dry deposition velocity, vd, which is calculated as (Wesely, 1989)
where ra is the aerodynamic resistance that is the resistance to transfer by turbulence in the atmospheric surface layer, rb is the atmospheric viscous (or quasi laminar) sublayer resistance that is the resistance to movement across a thin layer (0.1–1 mm) of air that is in direct contact with the surface, and rc is the surface resistance that is the resistance to uptake by the surface itself. Various parameterisations are used to calculate these resistances; rc is the dominant term in Eq. (1) for O3 dry deposition to water surfaces, and it is routinely assumed that rc for water is constant at ≈2000 s m−1 following Wesely's (1989) widely used dry deposition parameterisation. Most global chemical transport models, e.g. CAM-chem (Lamarque et al., 2012), GEOS-Chem (Mao et al., 2013), and UKCA, have followed this approach thus far by default, with ACCESS-UKCA using rc=2200 s m−1.
Recently, Luhar et al. (2017, 2018) concluded that the use of the above constant rc approach in ACCESS-UKCA overestimates O3 deposition velocities to the ocean by as much as a factor of 2 to 4 compared to measurements and does not simulate their observed spatial variability well. Luhar et al. (2018) developed a two-layer process-based parameterisation for rc that accounts for the concurrent waterside processes of molecular diffusion, O3 solubility, first-order chemical reaction of O3 with dissolved iodide, and turbulent transfer, and found that this parameterisation described the O3 deposition velocities much better and reduced the global oceanic O3 deposition to approximately one-third of the default value obtained using Wesely's (1989) rc approach. Using the improved (or new) parameterisation, Luhar et al. (2018) estimated an oceanic dry deposition of 98.4±30.0 Tg O3 yr−1 and a global one of 722.8±87.3 Tg O3 yr−1 (averaged over the years 2003–2012), which can be compared with the respective values 340 and 978±127 Tg O3 yr−1 obtained by Hardacre et al. (2015) based on 15 global chemistry transport models (for the year 2001) using Wesely's scheme, demonstrating the large reduction in the oceanic value using the new parameterisation. The new approach was recently evaluated by other researchers in both global and regional models with various changes to the input parameter values (Loades et al., 2020; Pound et al., 2020; Barten et al., 2021).
We use both the default and new oceanic dry deposition parameterisations (the latter corresponding to the Ranking 1 configuration in T 1 of Luhar et al., 2018).
2.3 Lightning-generated NOx
NOx, which is a mixture of nitrogen dioxide (NO2) and nitric oxide (NO), acts as a precursor to O3 and OH, which are the principal tropospheric oxidants. Lightning mainly happens in the tropics related to deep atmospheric convection and is the primary source of NOx in the middle to upper troposphere where lightning is mostly discharged. A tropospheric ozone radiative kernel for all-sky conditions (i.e. clear, cloud overcast, and partially cloudy skies) derived by Rap et al. (2015) suggests that ozone changes in the tropical upper troposphere are up to 10 times more efficient in altering the earth's radiative flux than other regions.
As stated earlier, Schumann and Huntrieser (2007) report a range of 5±3 Tg N yr−1 produced by lightning globally. The range of global LNOx in 16 ACCMIP models in CMIP5 varied between 1.2 and 9.7 Tg N yr−1 (Lamarque et al., 2013), whereas in five CMIP6 Earth system models LNOx ranged between 3.2 and 7.6 Tg N yr−1 (Griffiths et al., 2021; Szopa et al., 2021) for the present-day (nominal year 2000) conditions.
The LNOx amount in most global models is calculated as
where PNO is the quantity of NO generated per lightning flash, and F is the flash rate; F is calculated at every model time step within a model grid, and partitioned into cloud-to-ground (CG) and intracloud (IC) flash components. An emission factor of the amount of NO generated per CG/IC flash is applied, and the calculated mass of NO is then distributed vertically in the grid column (Luhar et al., 2021).
Of all the past techniques used to determine lightning flash rate in global chemistry–climate models and chemical transport models, including ACCESS-UKCA, the PR92 parameterisations are the most commonly used ones. They (or very similar parameterisations) have also been used in most CMIP5 and CMIP6 models.
The PR92 parameterisations for lightning flash rate (flashes per minute) over land (FL) and ocean (FO) are
where H is the height of the convective cloud top (km), which is passed from the model's convection parameterisation scheme. The above parameterisations yield flash rates over the ocean that are smaller by approximately two to three orders of magnitude compared to those calculated for clouds over land.
The oceanic parameterisation Eq. (4) is known to greatly underestimate flash rates. Recently, Luhar et al. (2021) evaluated the PR92 parameterisations for the year 2006 and found that while the land parameterisation Eq. (3) gave satisfactory predictions (an average value of 32.5 flashes per second compared to 34.9 flashes per second obtained from satellite observations), the oceanic parameterisation Eq. (4) yielded a global mean value of 0.33 flashes per second over the ocean, a much smaller value than the observed 9.16 flashes per second. They formulated the following improved flash-rate parameterisations using the scaling relationships between thunderstorm electric generator power and storm geometry developed by Boccippio (2002), together with the available data:
Flash rates obtained using Eq. (6) are approximately two orders of magnitude greater than those obtained using Eq. (4). Equation (5) performed very similarly to Eq. (3), giving an average value of 35.9 flashes per second compared to 34.9 flashes per second obtained from satellite observations, and the improved (or new) marine parameterisation Eq. (6) gave a global mean marine flash rate of 8.84 flashes per second, which is very close to the observed value of 9.16 flashes per second.
With PNO=330 moles NO per flash, the use of Eqs. (5) and (6) in ACCESS-UKCA increased the mean total global LNOx by 38% from the base value of 4.8 Tg N yr−1 (Luhar et al., 2021), with a considerable impact on the tropospheric composition as stated in Sect. 1.
We investigate the radiative effects of this change in LNOx.
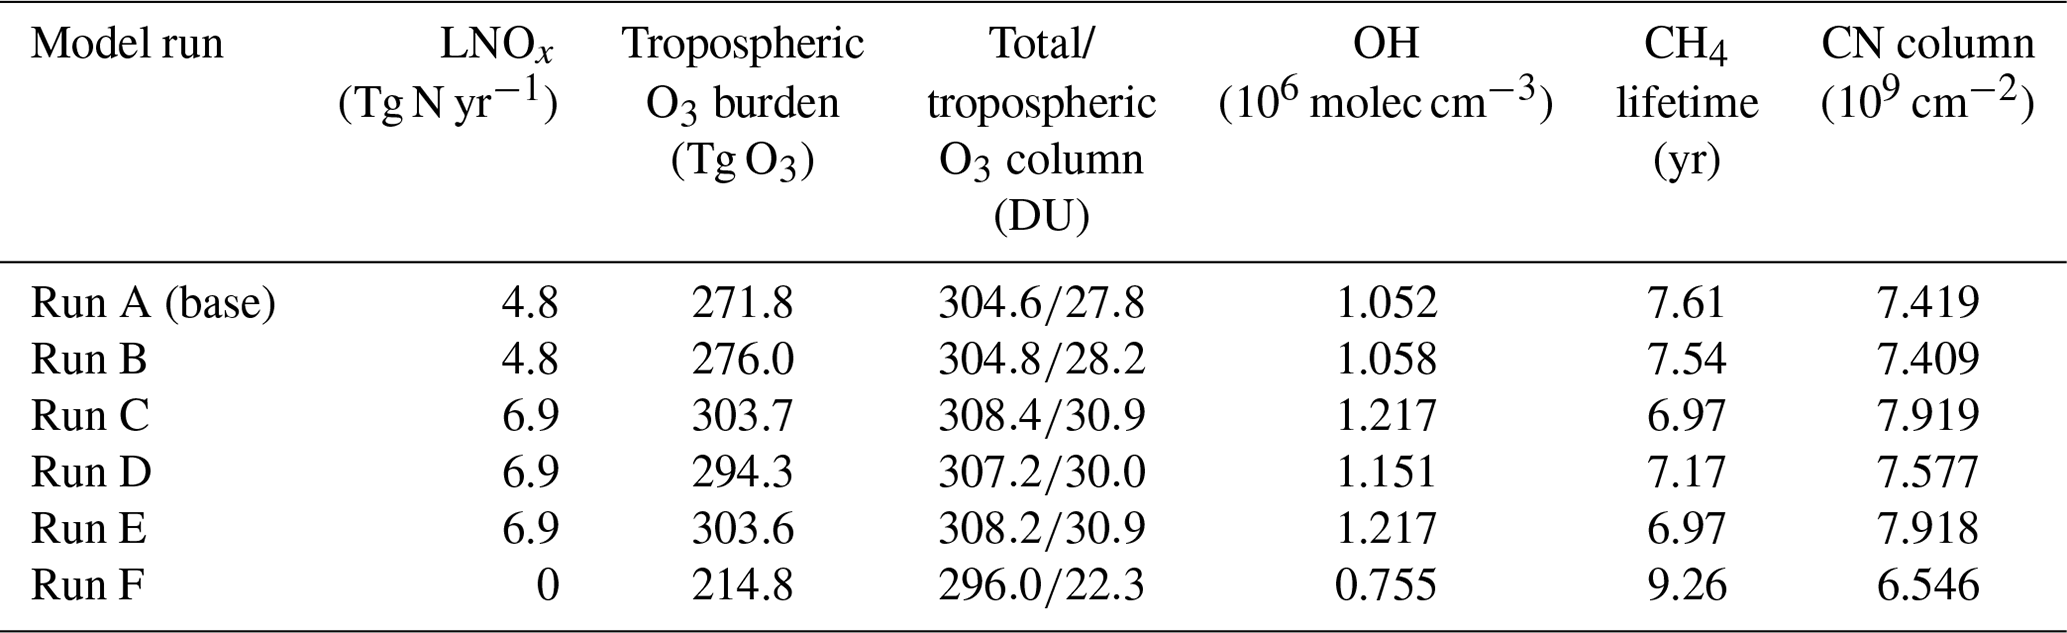
Table 1Globally averaged values obtained from the various model runs (for the period 2006–2010).
2.4 Global model simulations
We conducted the following six ACCESS-UKCA simulations for the years 2004–2010. Considering the first 2 simulation years as model spin-up time, the output from the model for the 5-year period 2006–2010 was used for the analysis reported below:
-
Base run (Run A): default model run, with rc=2200 s m−1 in the oceanic O3 deposition, and the PR92 lightning flash-rate parameterisation (LNOx=4.8 Tg N yr−1).
-
Run B: new process-based oceanic O3 deposition scheme and the PR92 lightning flash-rate parameterisation (LNOx=4.8 Tg N yr−1).
-
Run C: new process-based oceanic O3 deposition scheme and new lightning flash-rate parameterisation (LNOx=6.9 Tg N yr−1).
-
Run D: new process-based oceanic O3 deposition scheme and the PR92 lightning flash-rate parameterisation but scaled uniformly by a factor of 1.44 to give the total global LNOx the same as Run C (LNOx=6.9 Tg N yr−1) (to check the impact of the difference in spatial distribution of the lightning flashes).
-
Run E: the same as Run C but without the CH4 radiation feedback (to quantify its individual radiative impact) (LNOx=6.9 Tg N yr−1).
-
Run F: new process-based oceanic O3 deposition scheme and LNOx=0.
Apart from the above changes, the rest of the model setup is the same as described in Sect. 2 of Luhar et al. (2021). The simulations were nudged to the ECMWF's ERA-Interim reanalyses in the free troposphere involving horizontal wind components and potential temperature given on pressure levels at 6-hourly intervals (Dee et al., 2011; https://www.ecmwf.int/en/forecasts/datasets/reanalysis-datasets/era-interim, last access: 7 October 2022). Each model run was initialised using a previously spun-up model output with nudging and the default lightning and dry deposition schemes. The use of nudging does not allow the model changes to adjust synoptic-scale meteorology; hence the results here represent instantaneous radiative responses in the climate system, unlike the ERF, which is the sum of the instantaneous radiative forcing (IRF) and the contribution from such adjustments. Due to nudging, responses in the simulation may be dampened but can be attributed directly to the model perturbations (Fiddes et al., 2018).
The model results were averaged over 5 years for the globe, tropics, extra-tropics, land, and sea. Differences between the base model run and the other runs were calculated and indexed as follows on the x-axis in the relevant plots presented below:
-
1 (dep.) = Run B – base
-
2 (dep. + LNOx) = Run C – base
-
3 (dep. + scaled LNOx) = Run D – base
-
4 (dep. + LNOx + no CH4) = Run E – base
-
5 (dep. + no LNOx) = Run F – base.
Averaged model output obtained at monthly intervals for various radiative components and chemical species is used in the following analysis.
3.1 Modelled ozone, methane lifetime, and aerosol
With the new oceanic dry deposition scheme, the total global O3 dry deposition is decreased by 12.3 % (which is nearly the same as the 12.1 % decrease obtained by Pound et al. (2020) using this scheme in GEOS-Chem), and the improved lightning parameterisations increase the global LNOx by 44 % from 4.8 to 6.9 Tg N yr−1. Table 1 summarises the globally averaged impact of the various parameterisation changes in ACCESS-UKCA. With the new dry deposition scheme (Run B), the global tropospheric O3 burden increases by 1.5 % over the base run. With both the new dry deposition and LNOx schemes (Run C) this increase in the tropospheric O3 burden is 11.7 %. Similarly, the increase in the total O3 column is by 0.14 DU for the new dry deposition scheme and 3.75 DU (13 % of the tropospheric column or 1.2 % of the total column) for the new dry deposition and LNOx schemes combined. The global distribution of the O3 column difference between Run C and the base run in Fig. 1a shows that the biggest differences as high as ≈8 DU occur in the tropics between 140∘ W–100∘ E.

Figure 1(a) Modelled column ozone difference (DU) and (b) column condensation nuclei (CN) concentration difference (109 count per square centimetres) between Run C (i.e. the new dry deposition scheme and the new LNOx scheme) and the base run (mean over 2006–2010).
Changes in LNOx and O3 also affect the global mean lifetime of CH4 due to loss by OH () in the troposphere (Labrador et al., 2004). As Table 1 shows, there is a relatively small decrease of 0.07 years (0.9 %) in (corresponding to an increase of OH by 0.6 %) when the new oceanic O3 dry deposition scheme is used, and this decrease is 0.64 years (8.4 %) (corresponding to an increase of OH by 15.6 %) when the improved LNOx parameterisation is also used. In Table 1, the modelled methane lifetimes are lower than the ACCMIP multi-model mean 9.7±1.5 years reported by Naik et al. (2013), which, as pointed out by Luhar et al. (2021), could be due to a higher tropospheric burden of non-lightening related NOx in ACCESS-UKCA and/or a more intense photolysis. However, because we are mainly focusing on differences with respect to the base run, the lower absolute values of from ACCESS-UKCA are not considered to be critically important.
Table 1 also presents the modelled globally averaged column integrated condensation nuclei (CN, >3 nm dry diameter, also denoted as CN3) or aerosol number concentration. The column CN concentration increases with LNOx, and this increase for Run C is 6.7 % over the base run. The global distribution of the CN column difference between Run C and the base run in Fig. 1b shows that the biggest increases by as much as 5×109 cm−2 occur in the tropics over the Atlantic Ocean. (Changes in cloud cover are reported in Sect. 3.4.)
Results from the other model simulations are also presented in Table 1. The only difference between Run C and Run D is how the lightning flash rate is spatially distributed, and it is apparent that it makes a relatively significant difference in the results. As expected, the values from the simulations with and without the CH4 radiation feedbacks (Runs C and E) are virtually the same.
3.2 Model performance for all-sky radiative fluxes
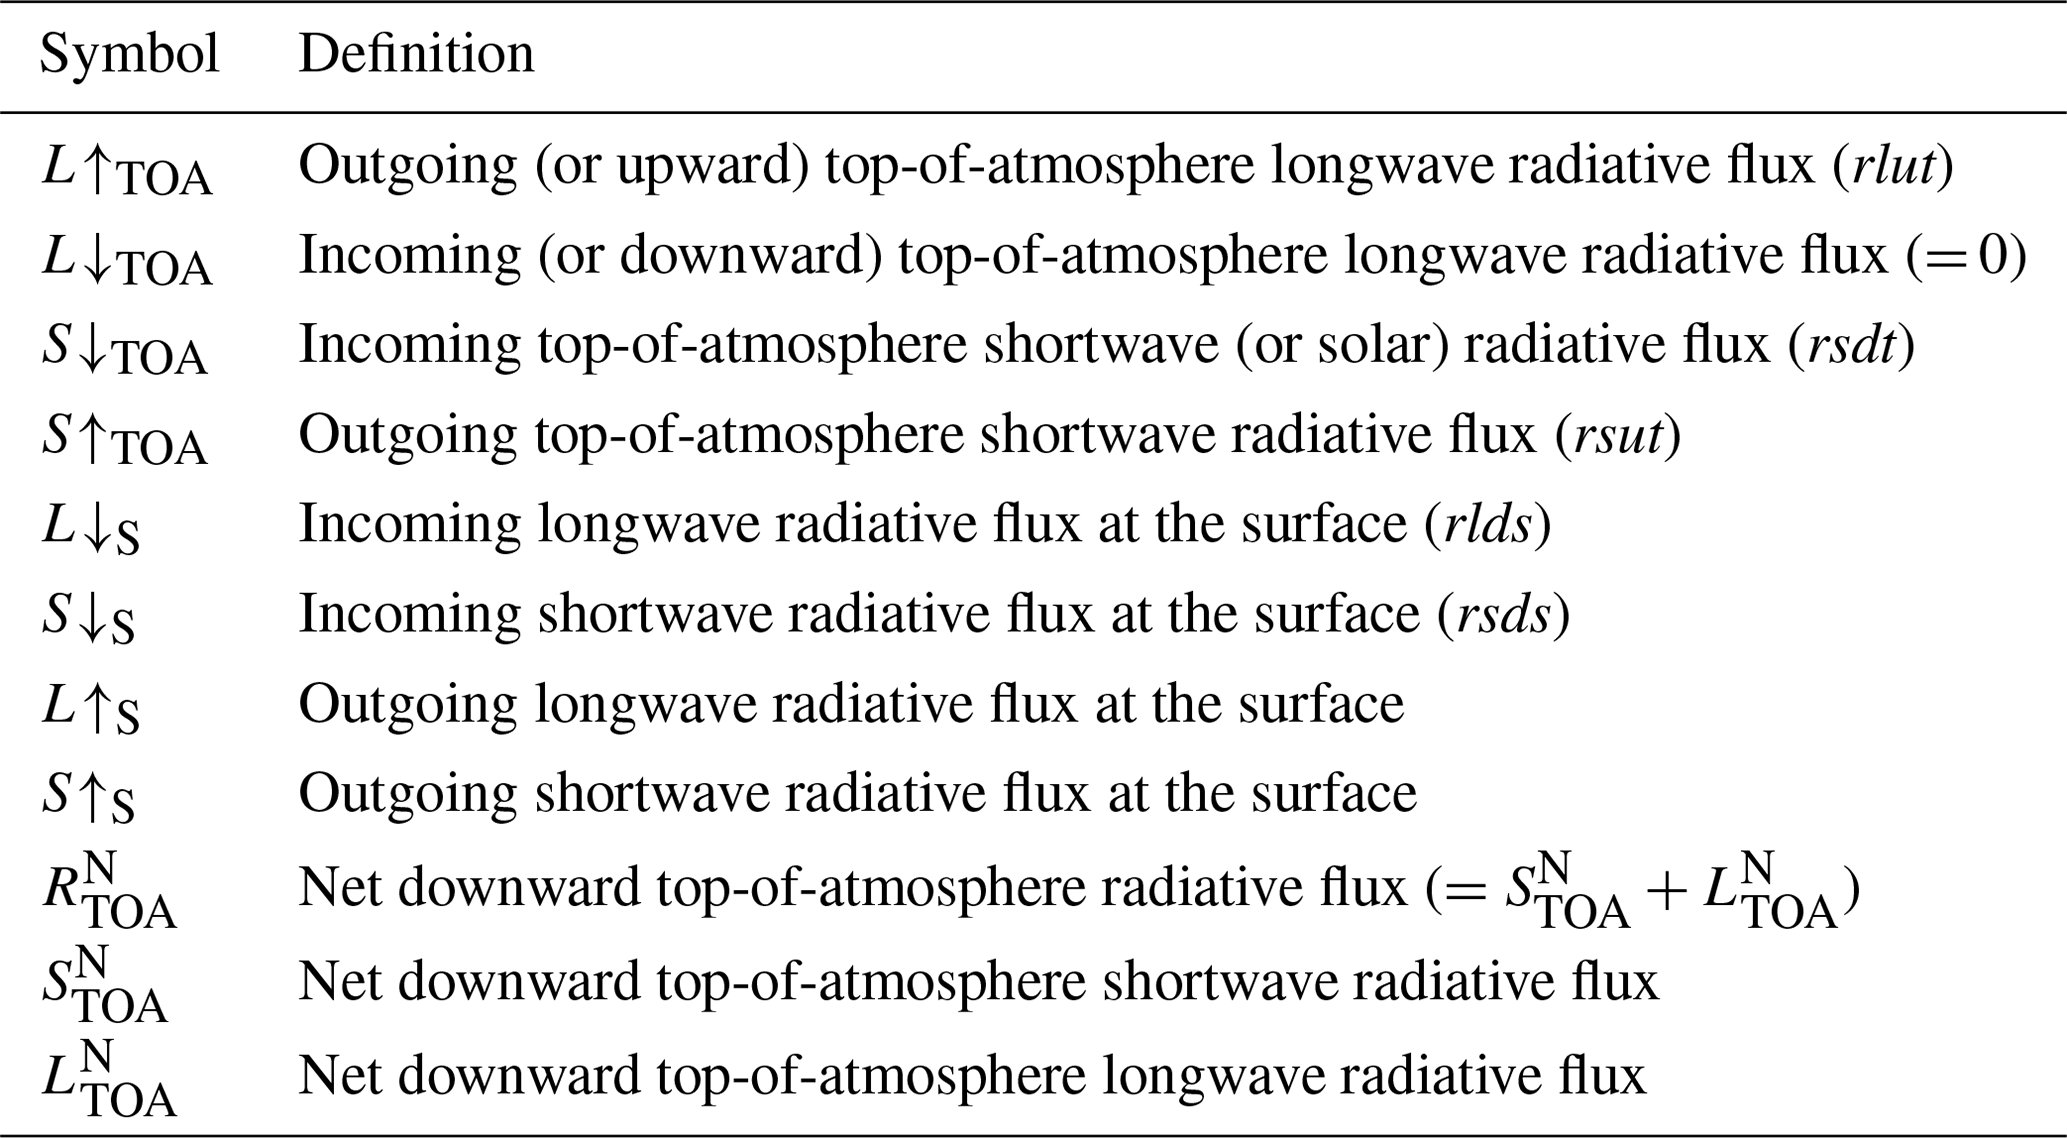
The model output for radiative components for all-sky conditions includes the incoming (or downward) TOA solar radiation (S↓TOA), outgoing (or upward) TOA longwave radiation (L↑TOA), outgoing TOA shortwave radiation (S↑TOA), incoming longwave radiation at the surface (L↓S), incoming shortwave radiation at the surface (S↓S), outgoing longwave radiation at the surface (L↑S), and outgoing shortwave radiation at the surface (S↑S). The total radiation is the sum of the longwave and shortwave components.
The net downward TOA radiative flux is
where the superscript “N” signifies net (note that S↓TOA is the same in all runs, and ). Additional definitions are: the net downward TOA shortwave radiative flux and the net downward TOA longwave radiative flux . The net downward longwave radiation at the surface (rls) is equal to (), and net downward shortwave radiation at the surface (rss) is equal to (). (Here, the radiation variable names in italics are based on standard CMIP convention used in model codes.) Table 2 gives a list of radiative flux symbols used. The model output for clear-sky L↑TOA (rlutcs), S↑TOA (rsutcs), L↓S (rldscs), S↓S (rsdscs) and S↑S (rsuscs) was also available. The clear-sky fluxes were calculated using “method II” whereby at every grid point the radiative flux is calculated using exactly the same physical inputs (gaseous mixing ratios, surface albedos, etc.) as for the all-sky calculation, except that the radiative effects of clouds are ignored. Unless stated otherwise the reported radiative fluxes are for all-sky conditions.
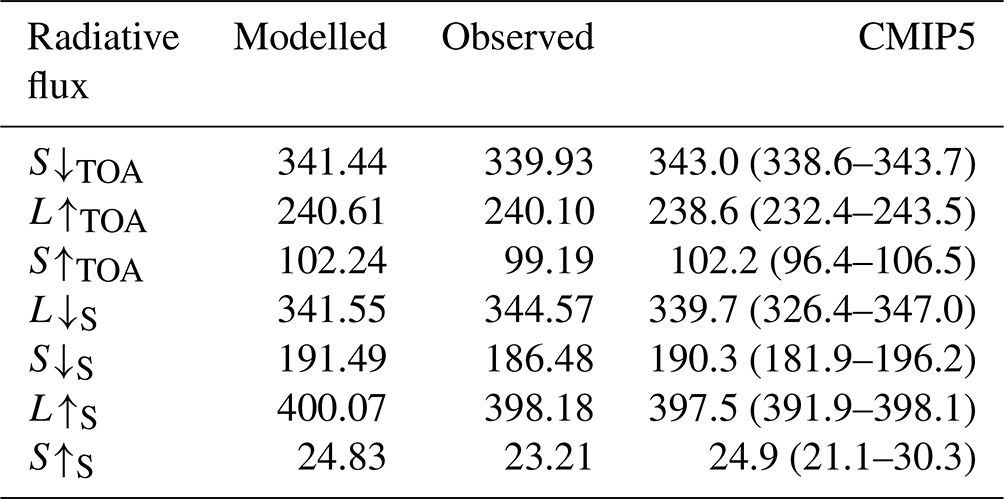
In Table 3, the area-weighted globally averaged modelled radiative fluxes from the base ACCESS-UKCA run are in good agreement with the observed values computed from NASA's Clouds and the Earth's Radiant Energy System (CERES) EBAF (Energy Balanced and Filled) Ed4.1 dataset (https://ceres.larc.nasa.gov/data/, last access: 10 March 2022) for the period 2006–2010 (Loeb et al., 2018; Kato et al., 2018), and with those from a 16-model ensemble from CMIP5 twentieth-century experiments (Stephens et al., 2012) (the range in terms of model minimum and maximum values is given in parenthesis).
Table 3Comparison of the globally averaged modelled (base run) and observed radiative fluxes (W m−2) for all-sky conditions for the period 2006–2010. The CMIP5 values and their range are also given.
A comparison of the zonal-averaged modelled , L↓S and S↓S with the corresponding CERES-EBAF data is made in Fig. 4 and discussed in Sect. 3.3.
Fiddes et al. (2018) obtained similar evaluation results for a very similar setup of ACCESS-UKCA vn8.4 for radiation components averaged over the period of 2000–2009.
3.3 Radiative effects of the parameterisation changes
Figure 2 presents bar charts of the modelled mean (2006–2010) difference (Δ) in the all-sky, area-weighted net downward TOA total radiation () and its longwave () and shortwave () components between the various model runs and the base model run for the globe, tropics (here ), extra-tropics (), land, and ocean (which includes all water bodies). The absolute values of the total outgoing TOA radiative flux (), L↑TOA and S↑TOA for the base run are also plotted as a reference (corresponding to the right y-axes). Table 4 presents values of , , , and ΔS↓S for the globe, tropics, and extra-tropics for all-sky conditions (Table S1 in the Supplement gives additional modelled flux differences). is akin to radiative forcing; a positive means that more radiation is retained in the atmosphere due to perturbation to the base model. It is apparent that with the new oceanic deposition scheme, is increased, but by only a relatively very small amount of 4.4 mW m−2. (Note that dry deposition is a surface process and, therefore, any changes to it would influence O3 in surface air to a much greater extent than that at higher altitudes, thus the radiative effects of these changes would be relatively small.) This small increase is due to an increase in the shortwave component, which dominates over a decrease in the longwave component. With the new lightning flash-rate parameterisation also included, this change in is much greater at 86.3 mW m−2 as LNOx increases to 6.9 from the base value 4.8 Tg N yr−1 with enhanced tropospheric O3 production. This increase in is due to an increase in both longwave and shortwave components, but the former dominates. Increased LNOx causes enhanced OH concentrations that reduce the tropospheric CH4 lifetime and would increase L↑TOA. If we turn off the radiative feedbacks of CH4 in the model, the increase in is 107.0 mW m−2. In other words, the CH4 feedback negates the positive radiative effect of O3 feedback by 20.7 mW m−2.
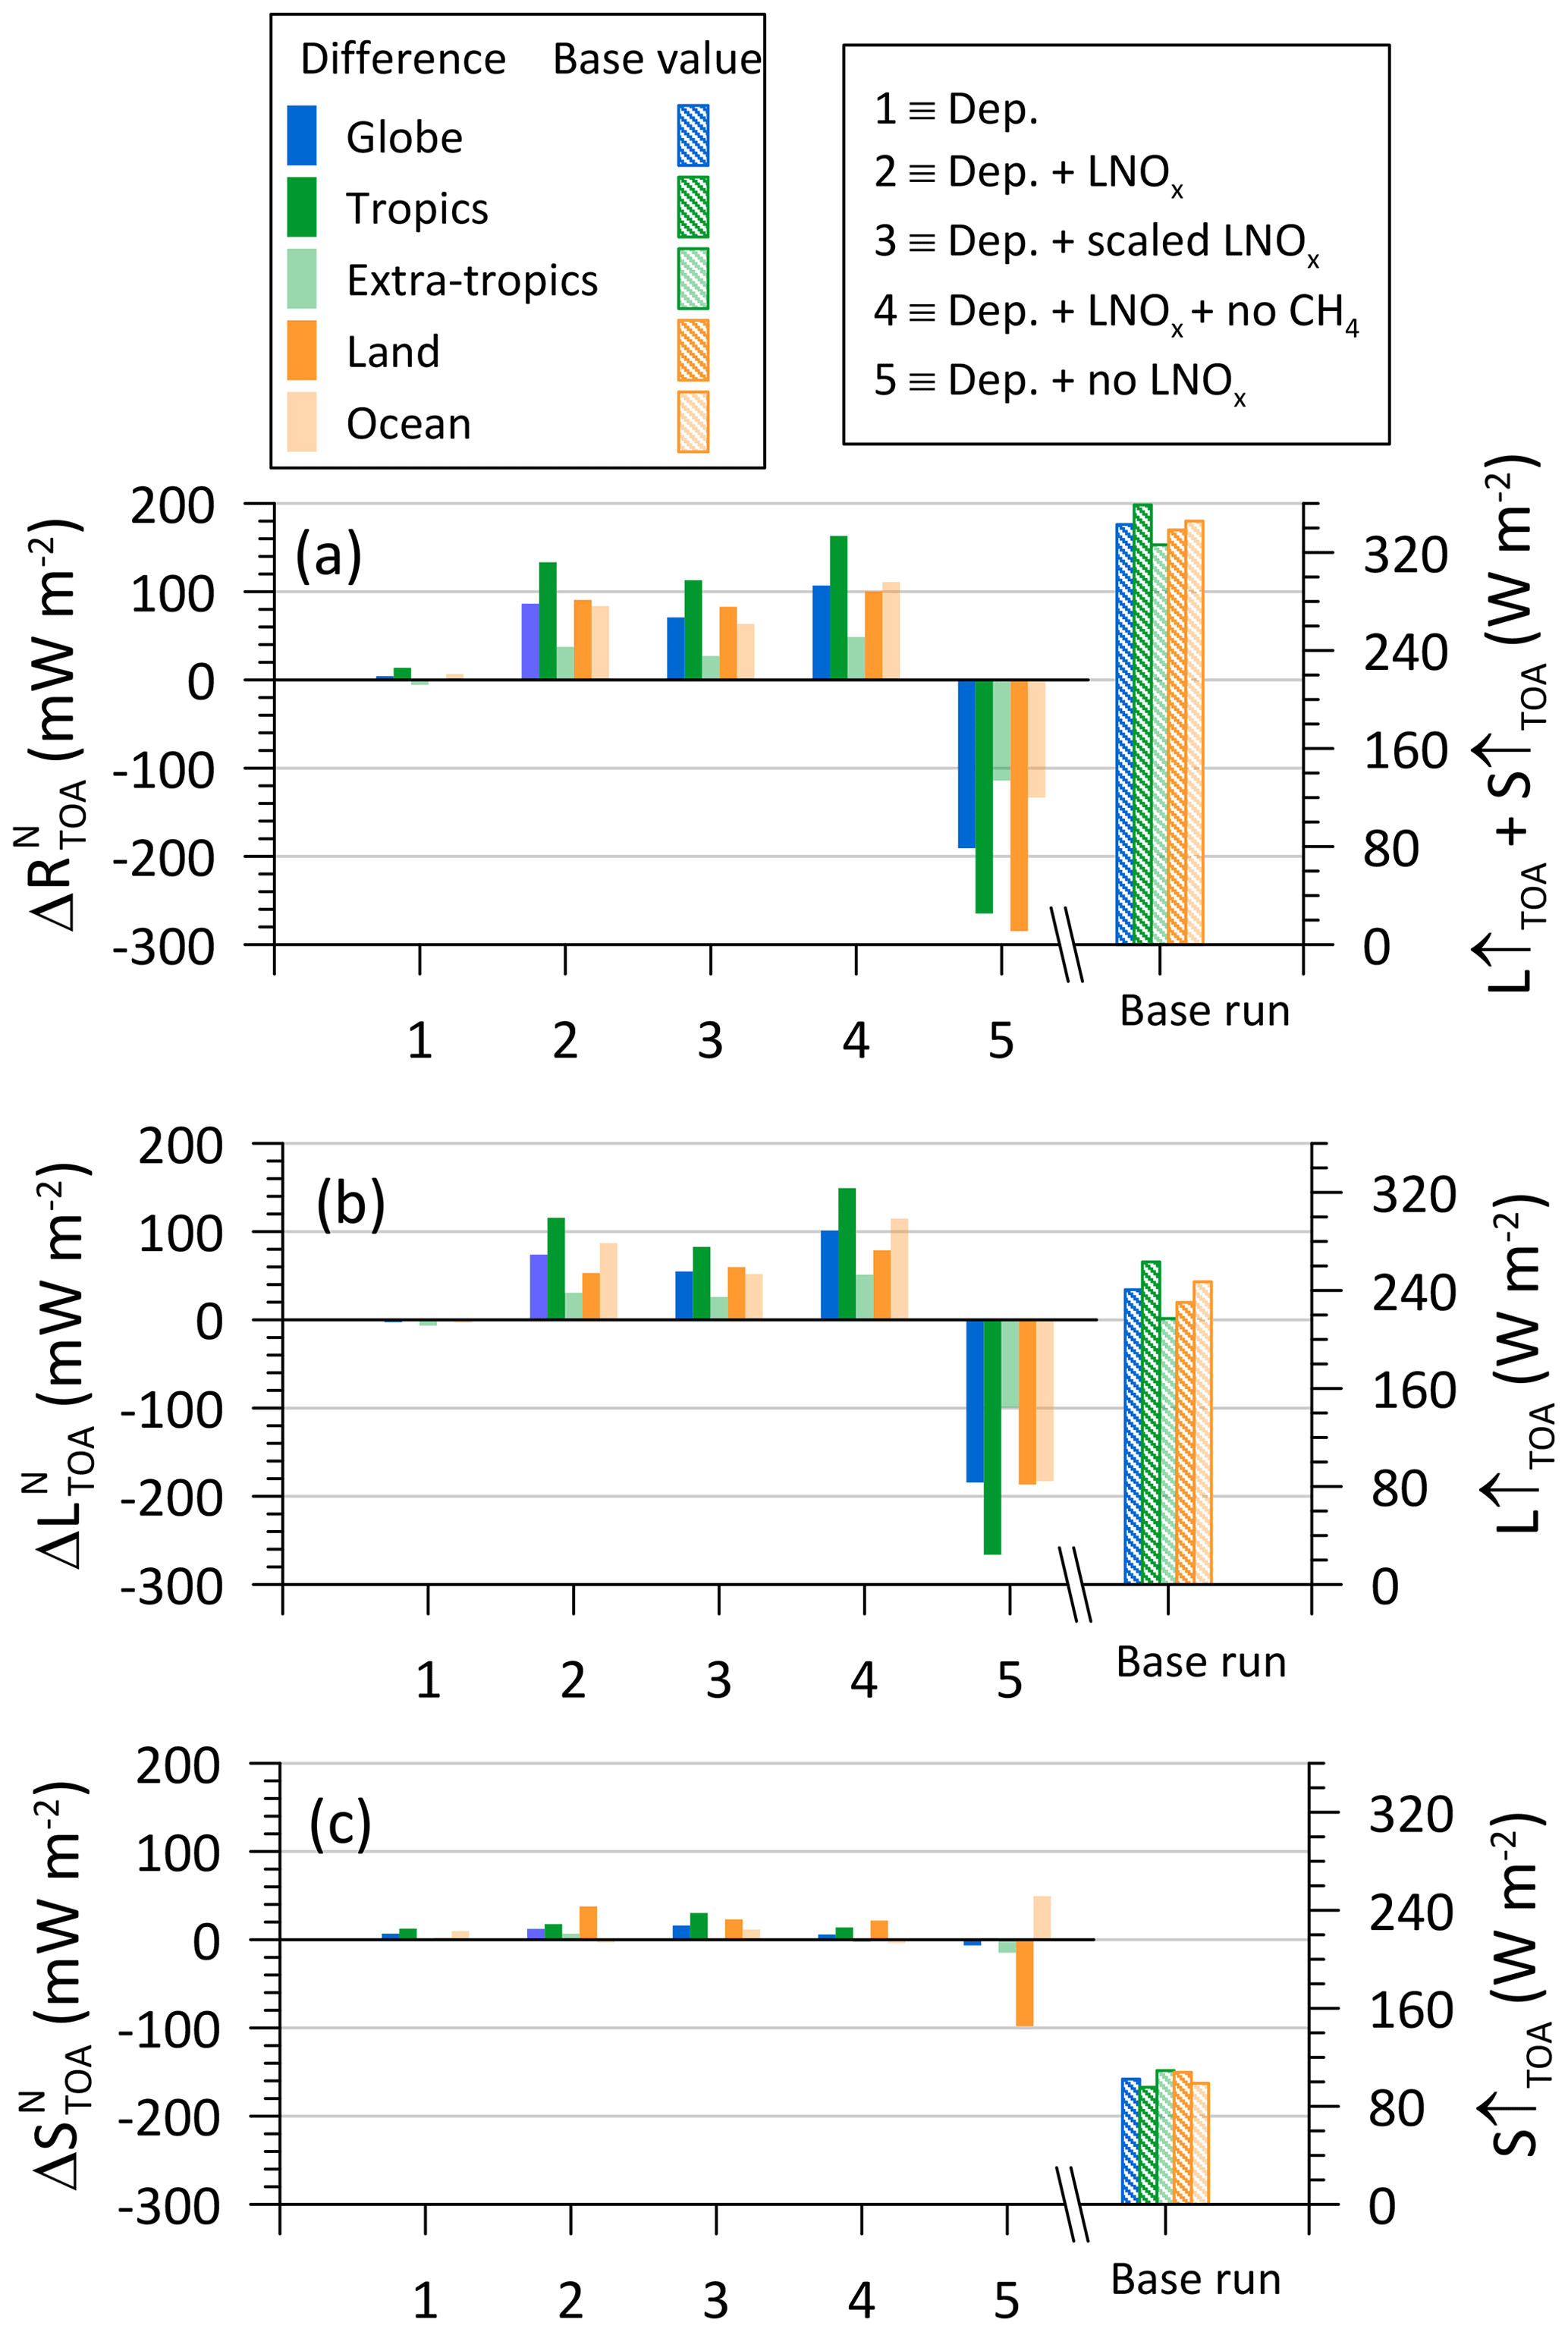
Figure 2Modelled mean (2006–2010) all-sky net downward TOA radiative flux difference between the various model runs and the base run (1 = Run B – base, 2 = Run C – base, 3 = Run D – base, 4 = Run E – base, 5 = Run F – base) for the globe, tropics, extra-tropics, land, and ocean. The plots are for the (a) total radiative flux difference (), (b) longwave radiative flux difference (), and (c) shortwave radiative flux difference (). The outgoing TOA flux values obtained from the base run are also plotted (corresponding to the right y-axis).
Table 4Changes in the modelled net downward total TOA radiative flux (), net downward TOA longwave radiative flux (), net downward TOA shortwave radiative flux (), and incoming longwave (ΔL↓S) and shortwave (ΔS↓S) radiative fluxes at the surface, with respect to the base model run. Values (mW m−2) are averages over 2006–2010.
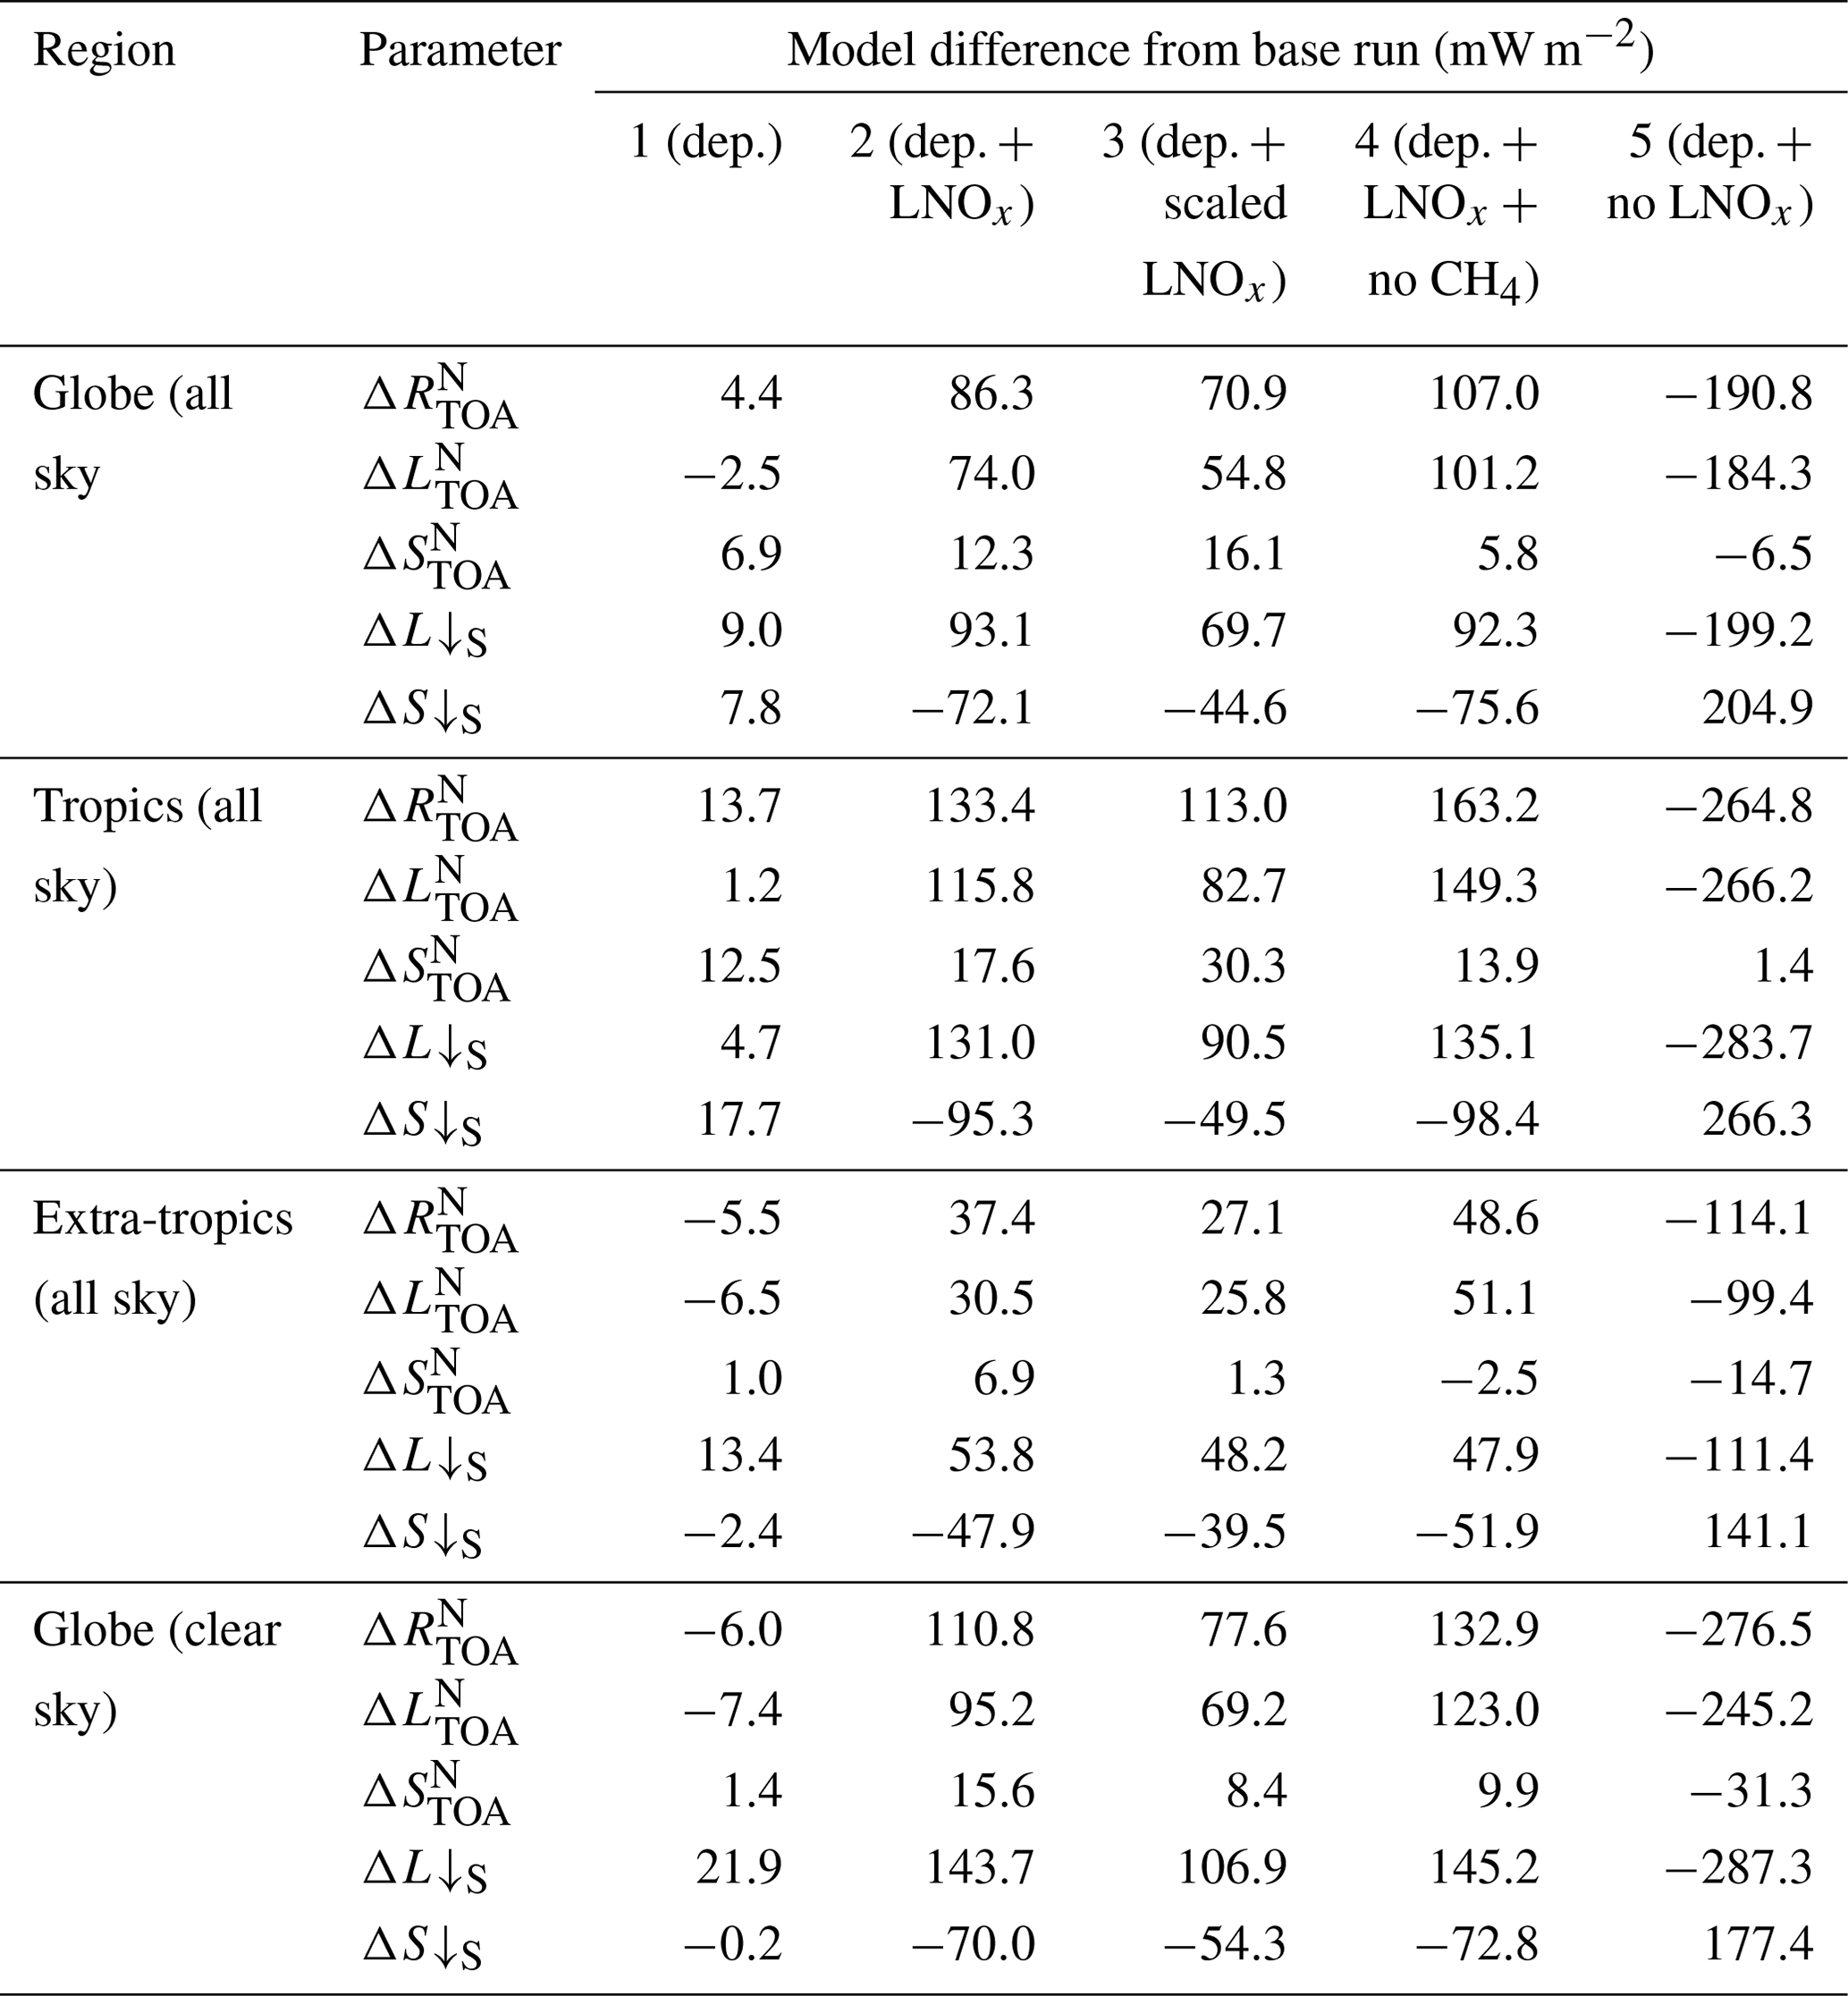
When the default PR92 lightning flash-rate scheme is used with a uniform global scaling (by a factor of 1.44) so as to give the total global LNOx the same as that obtained by Run C with the new lightning flash-rate scheme (i.e. 6.9 Tg N yr−1), the increase in is 70.9 mW m−2. As stated earlier, while the PR92 scheme for land performs very similarly to the new scheme in simulating the global spatial distribution of the lightning flash rate over land, the oceanic PR92 scheme underestimates the global mean flash-rate distribution considerably over the ocean. Therefore, this uniform scaling of the PR92-derived global flash-rate distribution would cause an over-adjustment of the flash rate (and hence LNOx) over land to compensate for the underestimation by the oceanic parameterisation. Therefore, although the total global LNOx is the same in both Runs C and D, there is a mismatch in its spatial distribution with Run D having larger LNOx over land and continue to have lower LNOx over the ocean than Run C. Thus, the new lightning flash-rate scheme leading to a larger increase in than that obtained by the scaled PR92 scheme implies that how LNOx is spatially distributed makes a difference in the radiation impact. This difference could possibly be because adding LNOx to the lower NOx levels in the marine upper troposphere causes greater ozone production than adding it to the NOx richer continental upper troposphere, and also because of differences in the photochemical reaction rates as a result of temperature differences over land and sea.
Turning off LNOx completely in the model causes an extra 190.8 mW m−2 to leave the atmosphere compared to the base run. This relates to the lower amount of O3 due to the absence of LNOx in the atmosphere. This increase in outgoing radiation related to the reduced upper tropospheric O3 dominates over the reverse radiative impact of no LNOx causing lower OH and, hence, a longer CH4 lifetime.
In Fig. 2a, the all-sky radiation changes relative to the base run are larger in magnitude in the tropics than elsewhere. With the new oceanic deposition scheme, the net downward TOA radiation is increased by 13.7 mW m−2 in the tropics but is reduced by 5.5 mW m−2 elsewhere. The contrast in radiation changes over land and ocean is not as stark as that over the tropical and extra-tropical regions, except for the no-LNOx case.
Figure 2b and c is the same as Fig. 2a except that they are for the differences in the net downward TOA radiation components and , respectively (Table 4 gives the values). These plots suggest that when the new LNOx scheme is used, the changes in the total net downward TOA radiation are dominated by the changes in the longwave component ().
Figure 3a is a bar chart of the modelled mean difference of the area-weighted downward surface longwave radiative flux (ΔL↓S) between the various runs and the base run. The absolute values of the surface longwave radiative flux for the base run are also plotted as a reference. Figure 3b is the corresponding plot for the downward surface shortwave radiative flux difference (ΔS↓S). The LNOx increases in the model, compared to the base run, lead to an increase in L↓S and a decrease in S↓S.
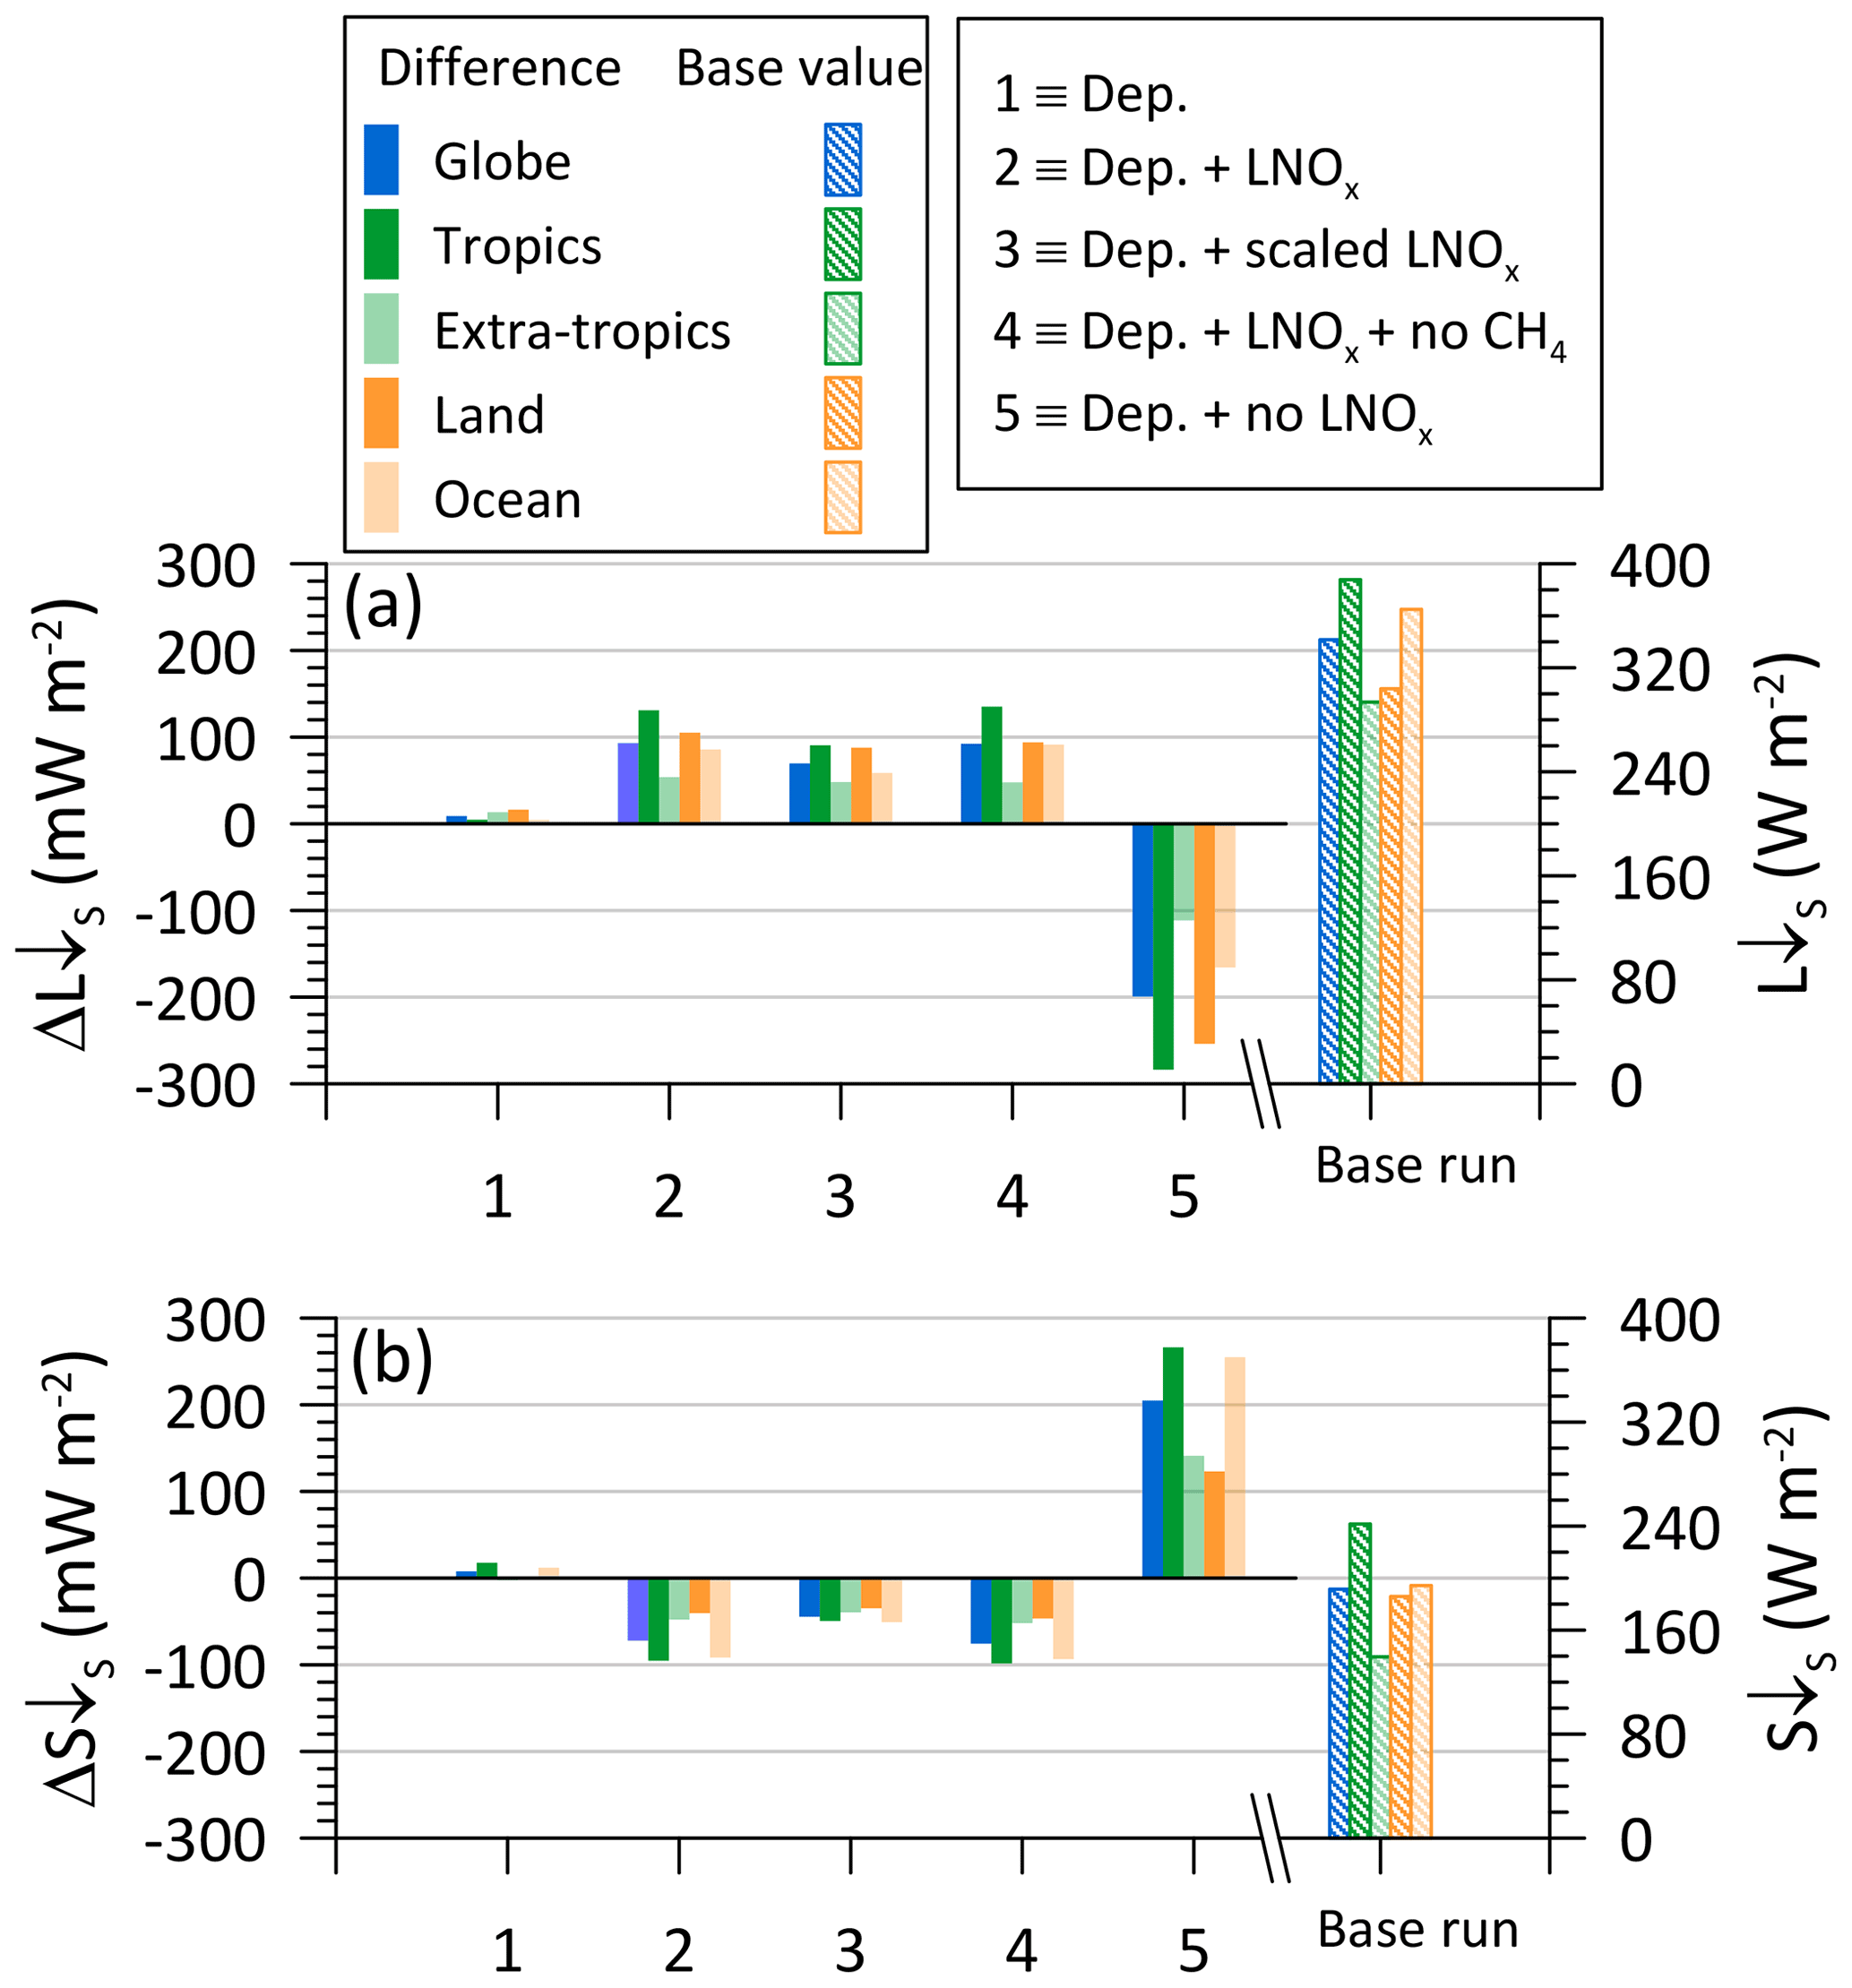
Figure 3Modelled mean (2006–2010) all-sky downward surface radiative flux difference between the various model runs and the base run (1 = Run B – base, 2 = Run C – base, 3 = Run D – base, 4 = Run E – base, 5 = Run F – base) for the globe, tropics, extra-tropics, land, and sea. The plots are for the (a) longwave radiative flux difference (ΔL↓S) and (b) shortwave radiative flux difference (ΔS↓S). The downward surface flux () values obtained from the base run are also plotted (corresponding to the right y-axis).
Table 4 also presents the mean global radiative flux differences for clear-sky conditions (Table S2 gives additional clear-sky modelled flux differences). For the case when the new deposition and lightning flash-rate parameterisations are used, the clear-sky is greater at 110.8 mW m−2 compared to the all-sky value of 86.3 mW m−2, and in both cases this change is dominated by the longwave component. For the case when only the new ozone dry deposition scheme is used, the clear-sky is again relatively very small at −6 mW m−2 (driven by a decrease in the longwave component) but is in the opposite direction compared to the corresponding all-sky case. The clear-sky mean global increases in the surface L↓S are larger compared to the all-sky increases. Thus, while the all-sky and clear-sky radiations show qualitatively similar changes in response to changes in LNOx, the differences in the magnitude of these changes imply an impact of LNOx on clouds; an analysis on this is given in Sect. 3.4.
In Fig. 4a–c, the variations of the modelled zonal means of , ΔL↓S and ΔS↓S are presented (solid lines). The zonal means of the absolute total outgoing TOA radiative flux (), L↓S and S↓S obtained from the base run are also plotted and compared with the corresponding CERES-EBAF data (dotted lines and solid circles, corresponding to the right y-axis).
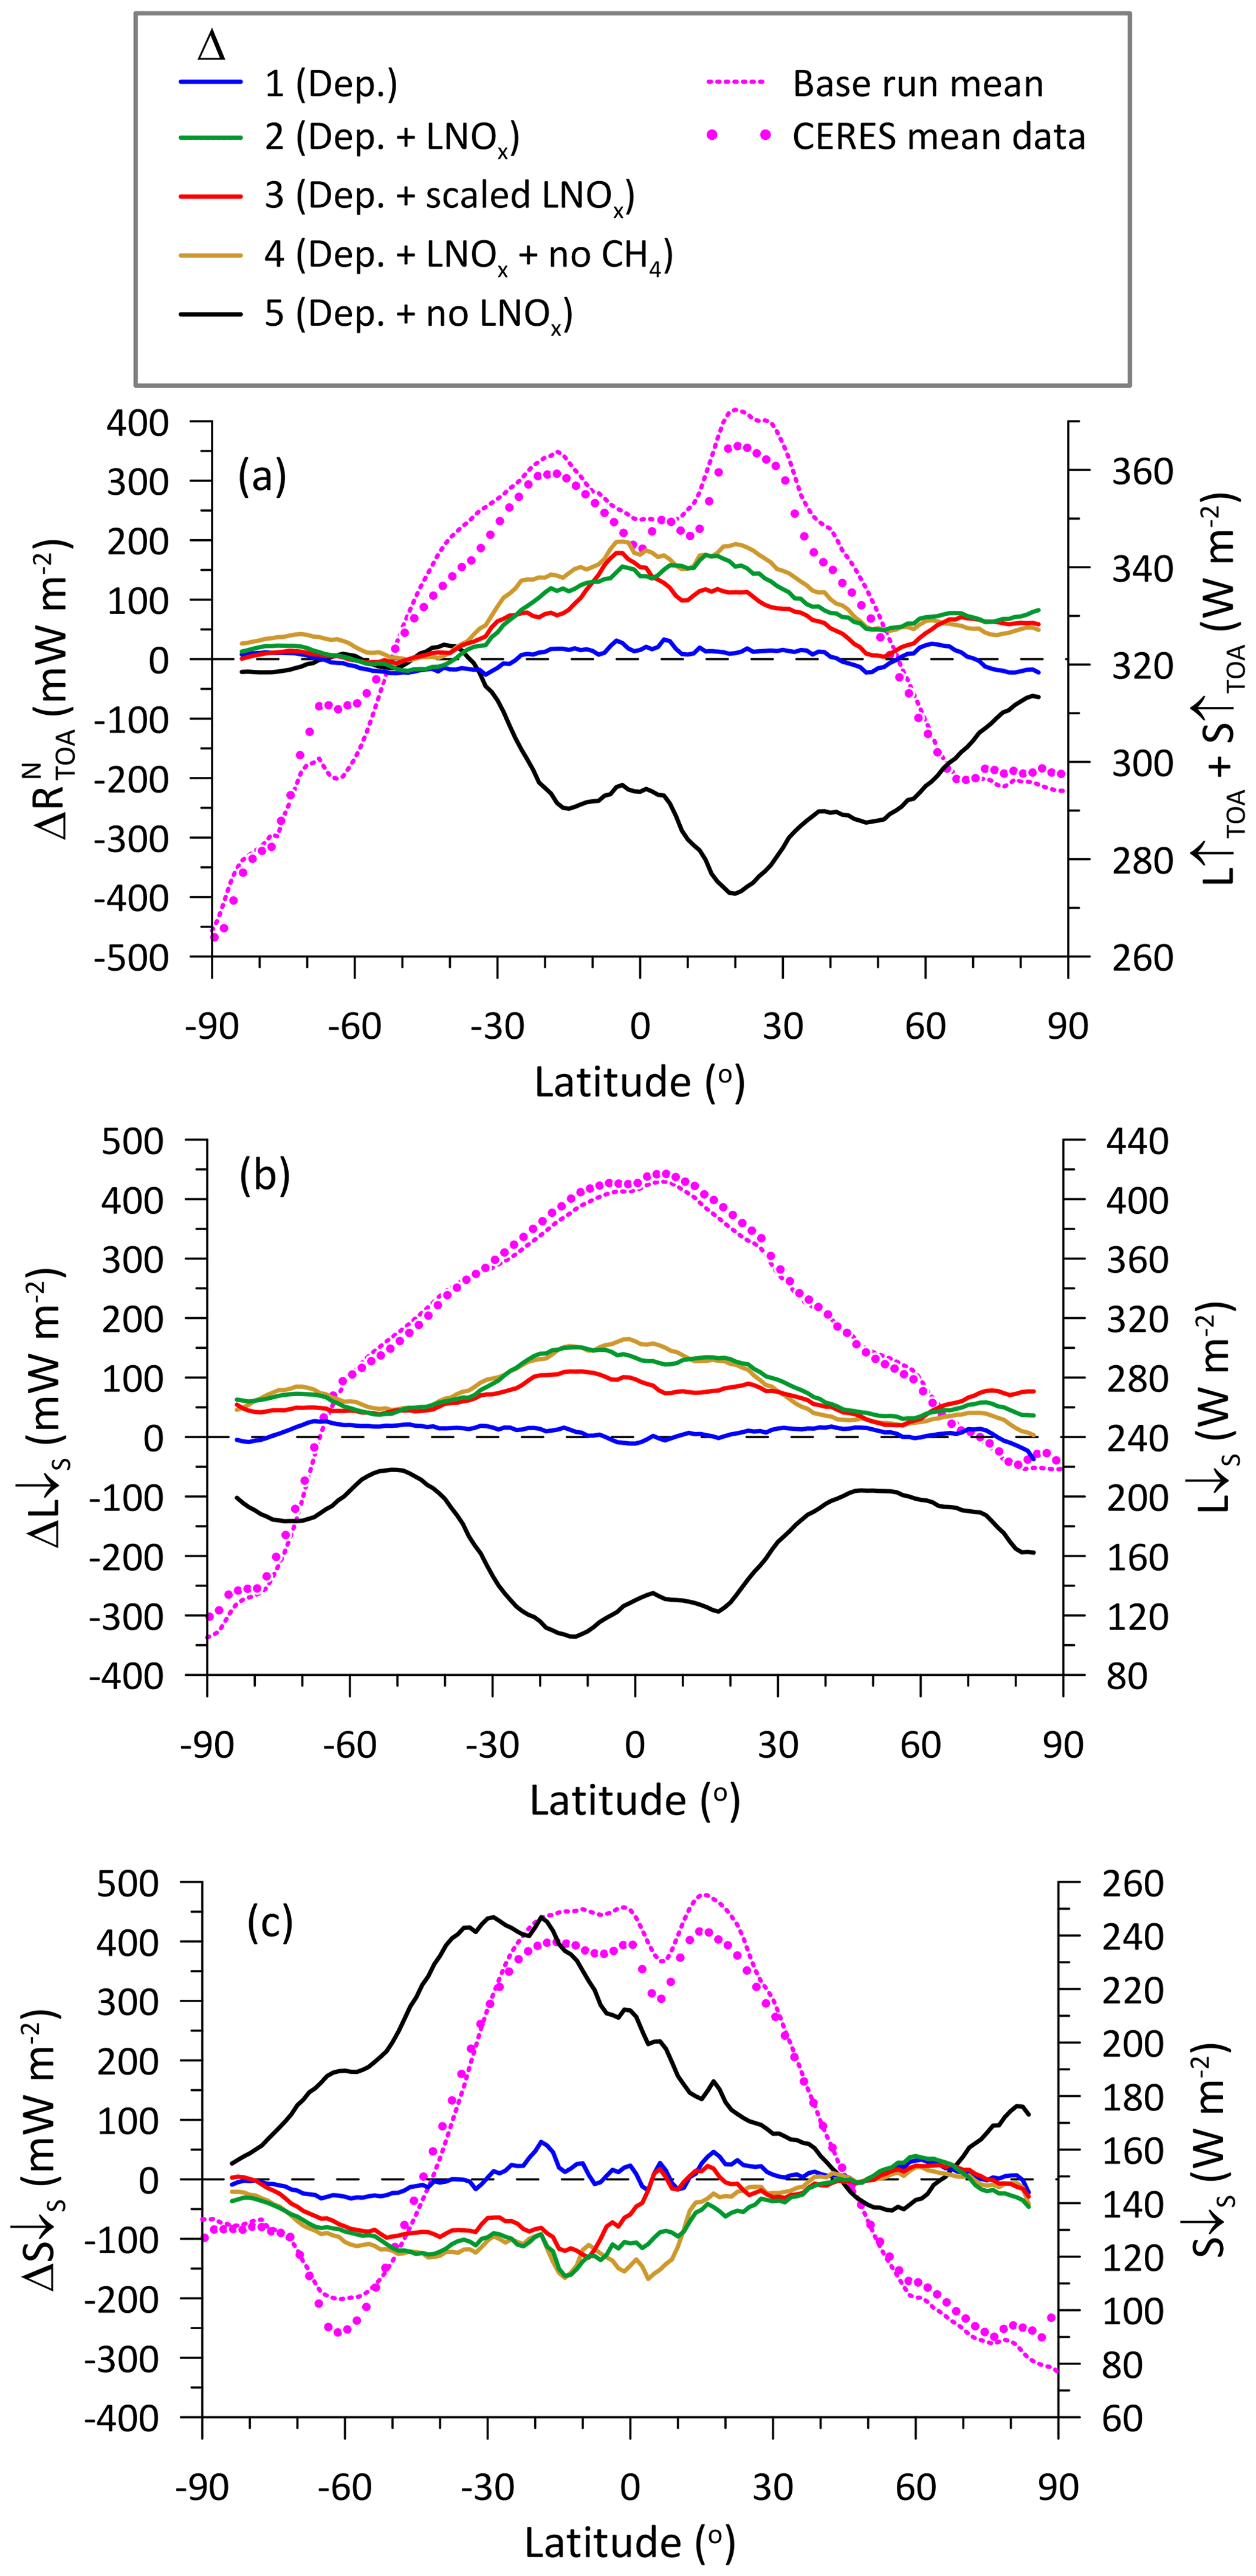
Figure 4Zonal mean (2006–2010) of the all-sky radiative flux difference between the various model runs and the base run (1 = Run B – base, 2 = Run C – base, 3 = Run D – base, 4 = Run E – base, 5 = Run F – base). The plots (solid lines) are for the (a) net downward TOA radiative flux difference (), (b) downward longwave radiative flux difference at the surface (ΔL↓S) and (b) downward shortwave radiative flux difference at the surface (ΔS↓S). The solid lines are running averages (over a moving window of ten points, i.e. 12.5∘). The zonal mean flux values obtained from the base run and the corresponding CERES-EBAF data are also plotted (dotted line and solid circles, corresponding to the right y-axis).
In Fig. 4a, the minimum in the modelled near the Equator is mostly due to the high cloud tops associated with the inter-tropical convergence zone (ITCZ), which is a region of persistent thunderstorms, and the subtropical maxima are associated with clear air over deserts and subtropical highs. The radiative flux diminishes towards the poles, with the minimum being in the Southern Hemisphere polar region. There is a good agreement with the CERES-EBAF data, with some model overestimation between 50 ∘N and 50 ∘S and underestimation within 50–70 ∘S. Looking at the differences , dry deposition has little effect, but increased LNOx increases the flux from ∼50∘ N to 30∘ S presumably due to increased emission of LW by O3 produced by the LNOx. Similarly, totally removing the LNOx decreases the TOA radiative flux particularly from approximately 30∘ S to virtually the north pole showing a marked hemispheric asymmetry towards the Northern Hemisphere. This contrasts, being in the opposite hemisphere, to the asymmetric effect of LNOx on the downward SW radiation at the surface (Fig. 4c).
The radiative flux L↓S primarily depends on water vapour and temperature in the lower atmosphere and varies with increasing CO2 and other greenhouse gases (Wang and Dickinson, 2013), including O3 (Rap et al., 2015). In Fig. 4b, L↓S has a characteristic peak in the tropics, and it diminishes poleward to a lower level in the northern polar region and to the lowest levels towards the Southern Hemisphere pole consistent with global climatologies (Wang and Dickinson, 2013). The model agreement with the CERES-EBAF data is excellent. In terms of ΔL↓S, dry deposition has little effect, but increased LNOx increases the downward flux from ∼40∘ N to 40∘ S, presumably due to increased emission of LW by O3 produced by the LNOx. Similarly, totally removing the LNOx decreases LW radiation particularly from ∼40∘ N to 40∘ S. This contrasts with the asymmetric effect of LNOx on SW radiation in Fig. 4c.
The radiative flux S↓S is affected by clouds which reflect and scatter solar radiation (see cloud climatology https://earthobservatory.nasa.gov/images/85843/cloudy-earth, last access: 7 October 2022). In Fig. 4c S↓S, apparent are the characteristic peak from overhead solar radiation in the tropics, the influence of the tropical cloud band, the radiative flux diminishing to a low level in the northern polar region presumably due to widespread cloud cover there, and diminishing fluxes in the mid latitudes of the Southern Hemisphere and then increasing towards the pole consistent with cloud climatologies (https://earthobservatory.nasa.gov/images/85843/cloudy-earth, last access: 7 October 2022). The model agreement with the CERES-EBAF data is good, with some model overestimation in the tropics. Considering the difference ΔS↓S, dry deposition has little effect, but increased LNOx decreases the downward flux from ∼20∘ N to 60∘ S. Similarly, totally removing the LNOx increases SW radiation from ∼40∘ N to 70∘ S, which illustrates the asymmetric effect of LNOx across the hemispheres (and consequent asymmetric heating contribution). Generally, most of the SW radiation in the wavelength spectrum that O3 can efficiently absorb is removed by the stratospheric O3 such that little penetrates to the earth's surface (Rap et al., 2015). Therefore, the decrease in S↓S with LNOx is possibly not directly caused by the increased O3 production as a result of the increased LNOx but could instead be driven by other factors such as changes in aerosol or cloud between the perturbed parameterisation experiments and the base run in response to changes in LNOx. We explore this in the next section.
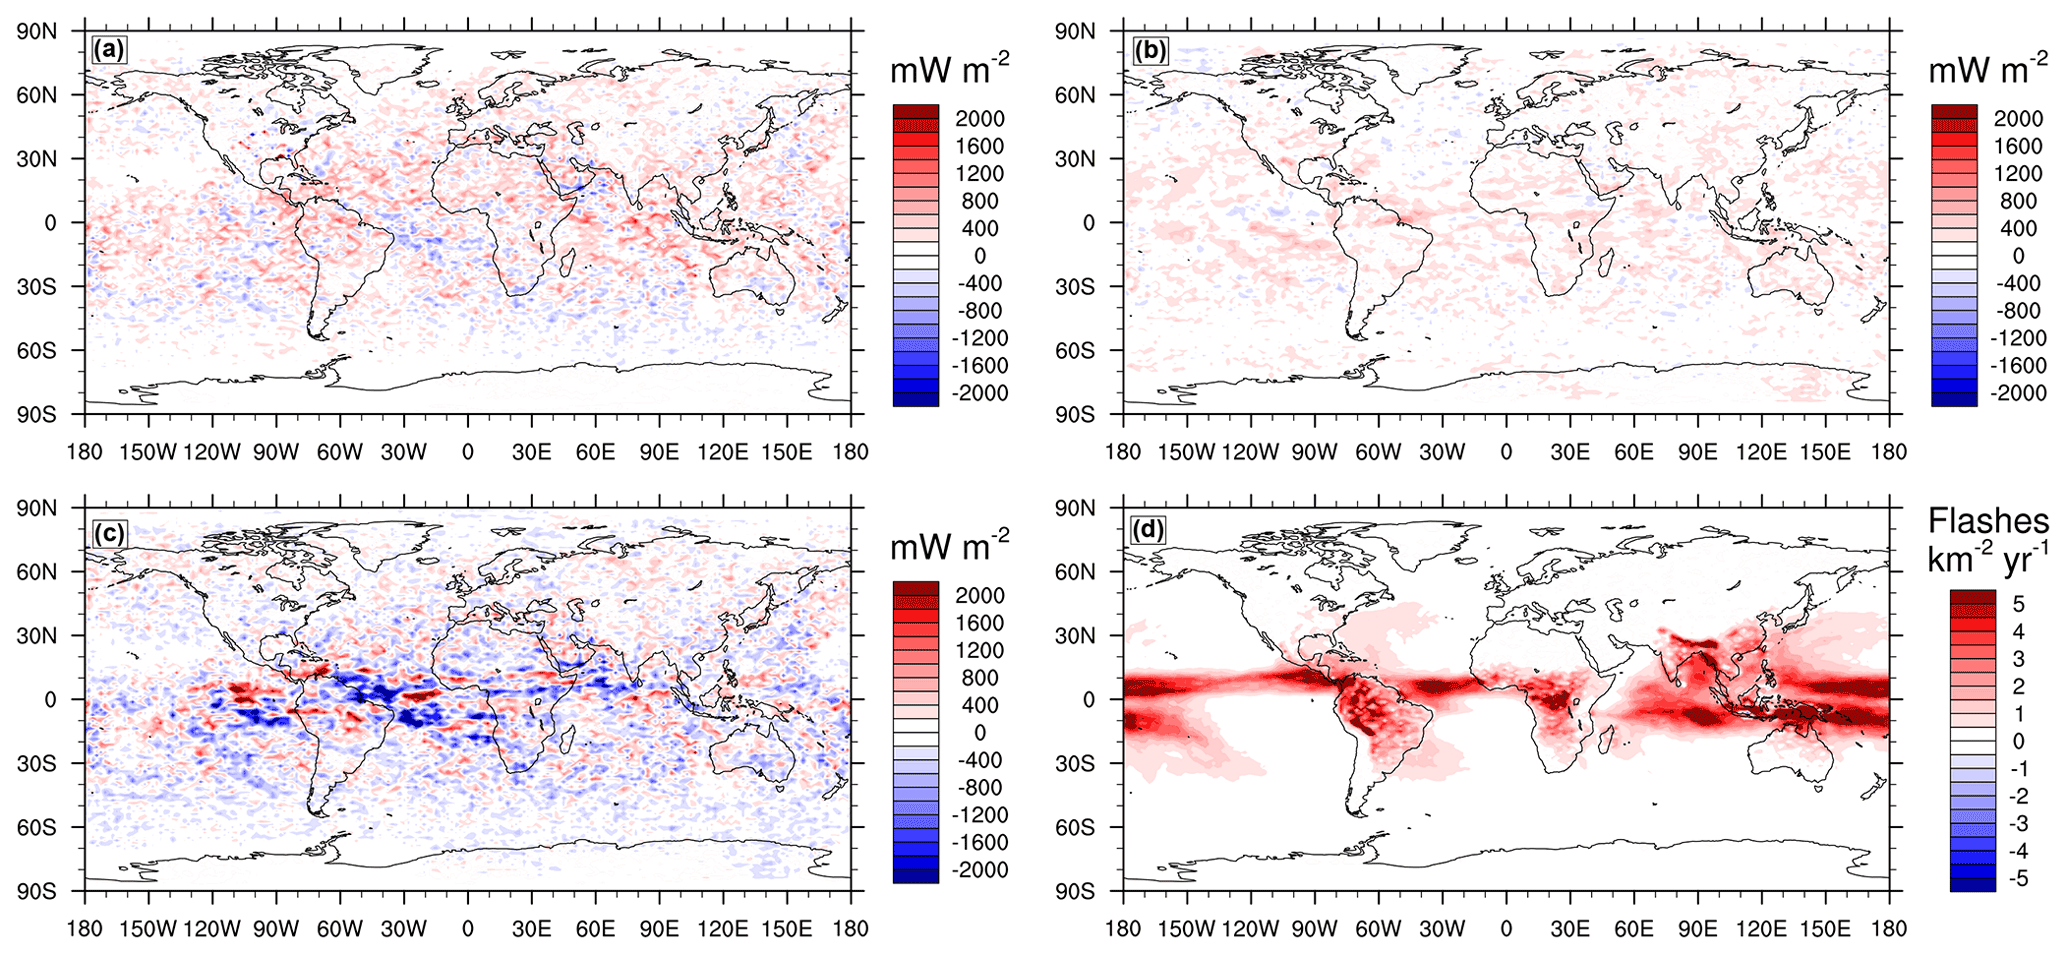
Figure 5Global distribution of the all-sky radiative flux difference (mW m−2) between Run C (i.e. the new dry deposition scheme and the new LNOx scheme) and the base run (mean over 2006–2010). The plots are for the (a) net downward TOA radiative flux difference (), (b) incoming longwave radiative flux difference at the surface (ΔL↓S) and (c) incoming shortwave radiative flux difference at the surface (ΔS↓S). In (d), the corresponding model difference in lightning flash density, given as flashes km−2 yr−1, is shown.
Global distribution of the difference between the model Run C (i.e. the new dry deposition scheme and the new LNOx scheme; Diff. 2) and the base run (Fig. 5a) is patchy with regions of both increased and decreased radiation compared to the base run, but with an overall increase. The difference in the incoming longwave radiative flux at the surface (ΔL↓S) (Fig. 5b) is positive almost everywhere over the globe, whereas that in the incoming shortwave radiative flux at the surface (ΔS↓S) (Fig. 5c) has a patchy global distribution with regions of both positive and negative values. The respective area-weighted global spatial means of these differences in Fig. 5a–c are 86.3±387.3, 93.1±184.1, and mW m−2, where the standard deviations were obtained from area-weighted variances, and their relatively large values reflect the spatial heterogeneity of the radiation response.
Figure 5d presents the corresponding difference in lightning flash density (Δf) between the two models, which shows a larger flash density predicted everywhere by the new LNOx scheme, particularly over the ocean in the tropics (LNOx is directly proportional to the lightning flash rate in our model). The area-weighted spatial pattern correlation (r) between Δf and is 0.15. The correlation of Δf with ΔL↓S is 0.33 and with ΔS↓S it is −0.14. These relatively low correlations imply that while the LNOx production occurs (and changes from model run to run) in one spatial pattern, time is required for chemical processing from NOx to O3 and CH4, and during this time advection and dispersion take place, and also the feedbacks from the impact on aerosol and cloud cover, so that the radiative effects occur in a different spatial pattern compared to the lightning flash rate. The area-weighted spatial pattern correlations between the difference in the ozone column (ΔDU) in Fig. 1, and , ΔL↓S and ΔS↓S are 0.24, 0.48 and −0.14, respectively.
3.4 Changes in incoming surface shortwave radiation, aerosol, and cloud cover
As stated earlier, the decrease in all-sky S↓S cannot not be explained by the increased O3 production as LNOx is increased, and therefore to further understand what drives the differences in the shortwave flux at the surface we look at any changes in aerosol fields and cloud cover that may explain this decrease. We only consider the parameter value differences between the model run with both the new oceanic O3 dry deposition scheme and the new lightning flash-rate parameterisation included (Run C) and the base model run, and the zonal means of these differences are shown in Fig. 6. The increased LNOx in Run C also leads to a decrease in the clear-sky ΔS↓S, and this corresponds to an increase in the column integrated CN (or aerosol) number concentration. Increases in the column integrated CN by as much as 2×109 cm−2 are found. In addition to reflecting and scattering solar radiation, these aerosol concentrations also affect clouds. The all-sky ΔS↓S is more asymmetric across the hemispheres than the clear-sky ΔS↓S, which could be due to the hemispheric asymmetric in ΔCN coupled with the influence of changes in cloud properties.

Figure 6Zonal mean (2006–2010) of parameter value differences between the model run with both the new oceanic O3 dry deposition scheme and the new lightning flash-rate parameterisation and the base model run (Run C – base): all-sky downward shortwave radiative flux difference at the surface (ΔS↓S); clear-sky ΔS↓S; differences in high, medium and low cloud cover (ΔCC); and column integrated condensation nuclei (CN) concentration difference (ΔCN). The lines are running averages (over a moving window of ten points, i.e. 12.5∘).
We also calculated changes in fractional cloud cover CC (which varies between 0–1) for low (<2 km), middle (2–6 km), and high (>6 km) level clouds. Cloud cover is important for the modelling of downward radiation (Chen et al., 2012), and the model output for this quantity was available for each grid box (volume fraction of a gridbox covered in cloud) at each model level. The total cloud cover within the above three cloud-height categories can be calculated approximately from the modelled cloud cover at each model layer using a cloud overlap assumption. We used the combined maximum-random cloud overlap assumption, which lies between the random overlap assumption (which overestimates the total cloud cover) and the maximum overlap assumption (which underestimates the cloud cover) (Oreopoulos and Khairoutdinov, 2003). Figure 6 shows the zonal means of cloud cover differences (ΔCC) between Run C and the base model run for the high, middle, and low level clouds. It is apparent that cloud cover is impacted at all levels by the model changes, with more high-level and less middle- and low-level cloud cover, although the degree of changes being small, all within ±0.05 %. The high-level zonal mean ΔCC appears to be noticeably anti-correlated with all-sky zonal mean ΔS↓S in the tropics, whereas for northern latitudes above about 40∘ both middle- and low-level zonal mean ΔCC are anti-correlated with ΔS↓S.
Figure 7 presents the global spatial distributions of ΔCC for the three cloud-height categories, which are patchy with regions of both positive and negative values. But visually comparing Fig. 7a for the high-level cloud cover with the all-sky ΔS↓S global distribution in Fig. 5c, one can clearly notice that regions of ΔS↓S are anti-correlated with ΔCC, and that this anti-correlation becomes progressively weaker for middle- and low-level ΔCC in Fig. 7b and c, respectively. The area-weighted spatial pattern correlation between ΔS↓S and ΔCC is −0.44, −0.39, and −0.30 for the high-, middle-, and low-level cloud, respectively.
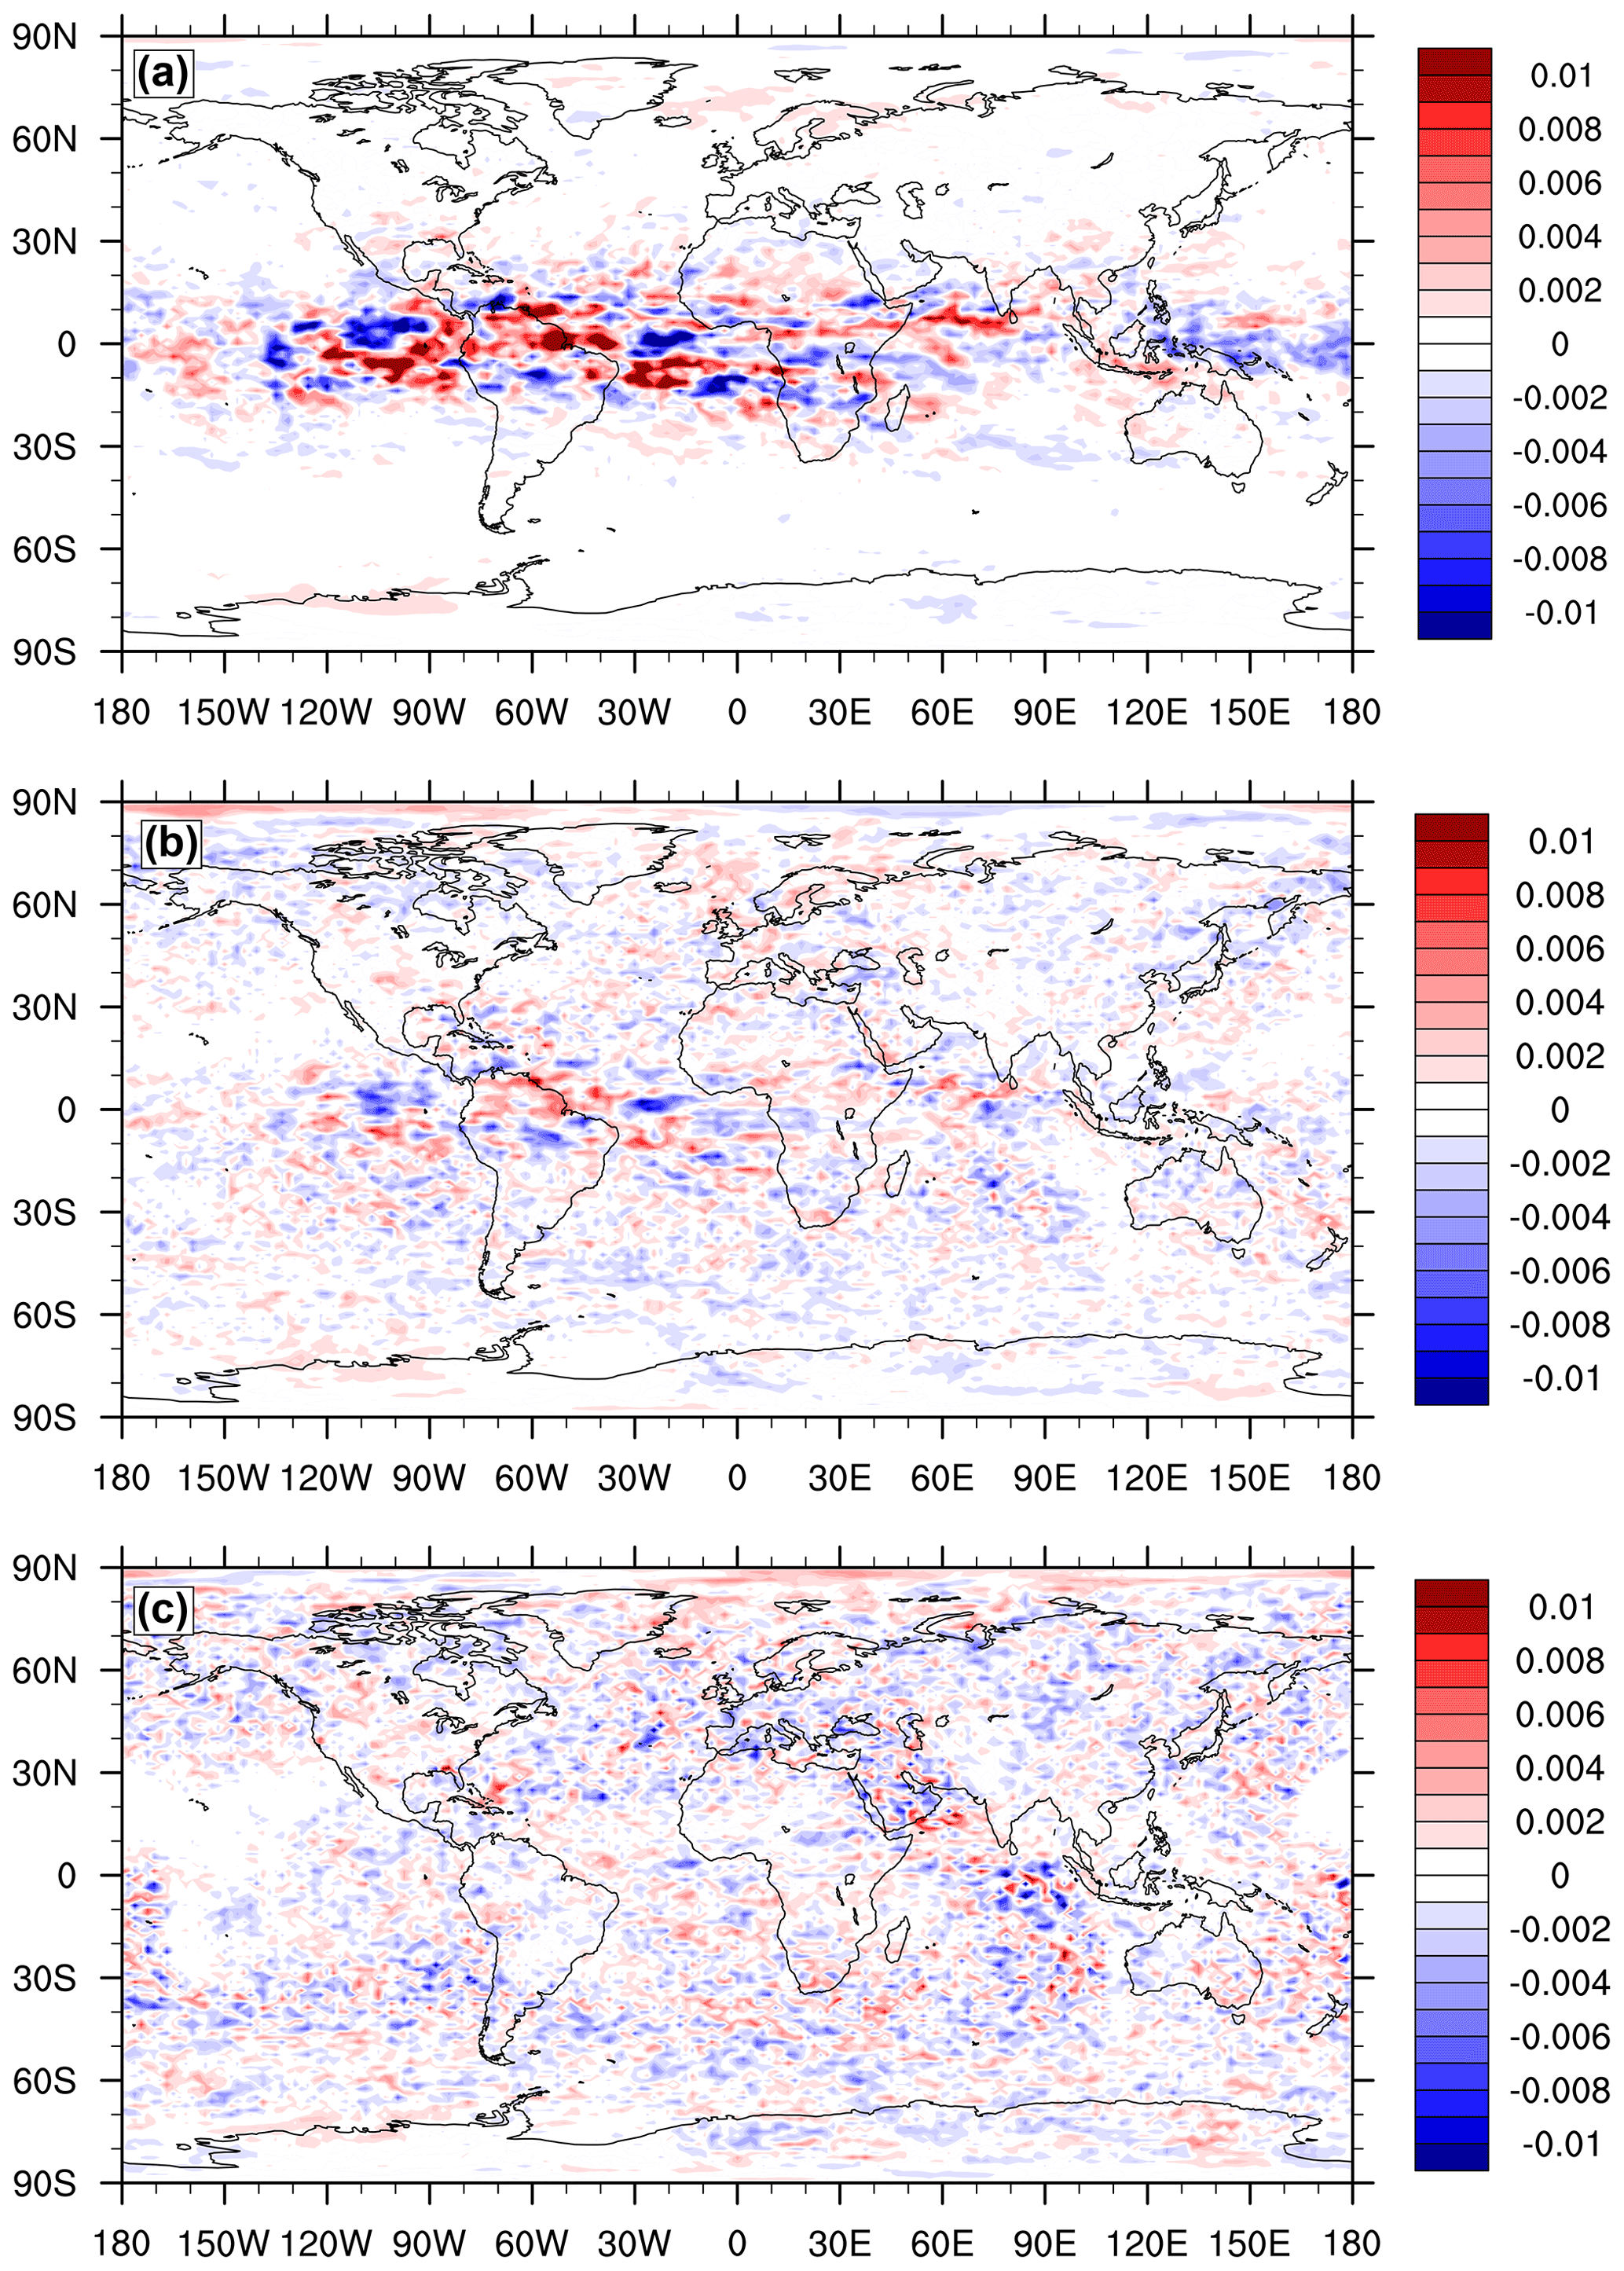
Figure 7Global distribution of the modelled fractional cloud cover difference (ΔCC) between Run C (i.e. the new dry deposition scheme and the new LNOx scheme) and the base run (mean over 2006–2010). The plots are for (a) high level (>6 km), (b) middle level (2–6 km) and (c) low level (<2 km) clouds.
The above results suggest that while the decrease in the all-sky ΔS↓S with increased LNOx may not possibly be explained in terms of the consequent O3 production, the indirect effect of LNOx on aerosol and cloud can at least partly explain the differences in the shortwave flux at the surface.
3.5 Radiative effects as a function of changes in LNOx
Lightning NOx production is a natural process with effects on the atmospheric radiation and energy budget via O3, CH4, and aerosol. Lightning NOx is different from the bulk of other natural and anthropogenic sources of NOx in the troposphere in that the release occurs in the upper portion of the troposphere rather than close to the earth's surface.
In Fig. 8a, we plot the change in the modelled net downward total TOA radiation () as a function of change in the annual average LNOx production relative to the base model run. The different points are for different years and different model runs. All runs except Run E (i.e. without the CH4 radiation feedback) are considered. The plot shows an approximately linear increasing change in the net downward total TOA radiation as a function of increase in the LNOx production due to the various model parameterisation and configuration changes considered. (There is a relatively large gap between the LNOx=0 case and the LNOx=4.8 Tg N yr−1 case. To confirm that the linear fit is not unduly dominated by the LNOx=0 case and that the linearity is appropriate, an additional model simulation the same as Run C but with the LNOx distribution scaled uniformly by 0.35 to give an averaged total LNOx=2.4 Tg N yr−1 was made, and the results from this simulation are also plotted in Figs. 8 and 9 enclosed by a dotted circle, and they are included in determining the linear fits.)
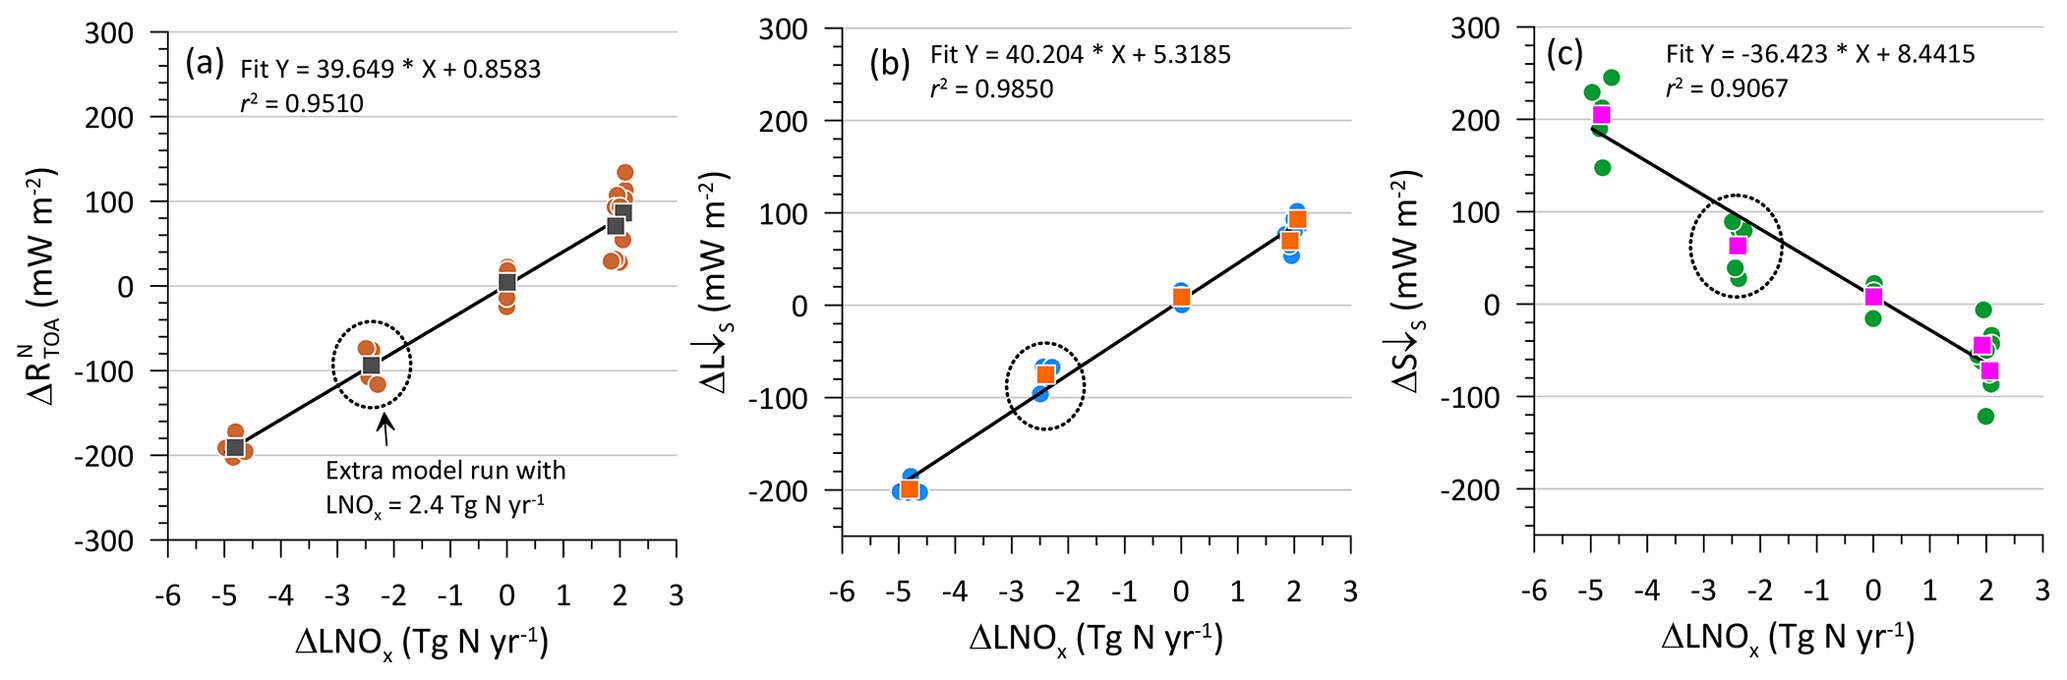
Figure 8Change in the modelled (a) net downward total TOA radiation (), (b) incoming surface longwave radiation (ΔL↓S), and (c) incoming surface shortwave radiation (ΔS↓S), as a function of change in the modelled lightning-generated NOx (ΔLNOx, Tg N yr−1) relative to the base model run. All runs except Run E (i.e. without the CH4 radiation feedback) are considered. Results from an additional model simulation the same as Run C but with averaged LNOx=2.4 Tg N yr−1 are also plotted (enclosed in a dotted circle) to check linearity. The solid circles are the annual means, whereas the squares are the mean over 2006–2010. The best fit line is based on all points.
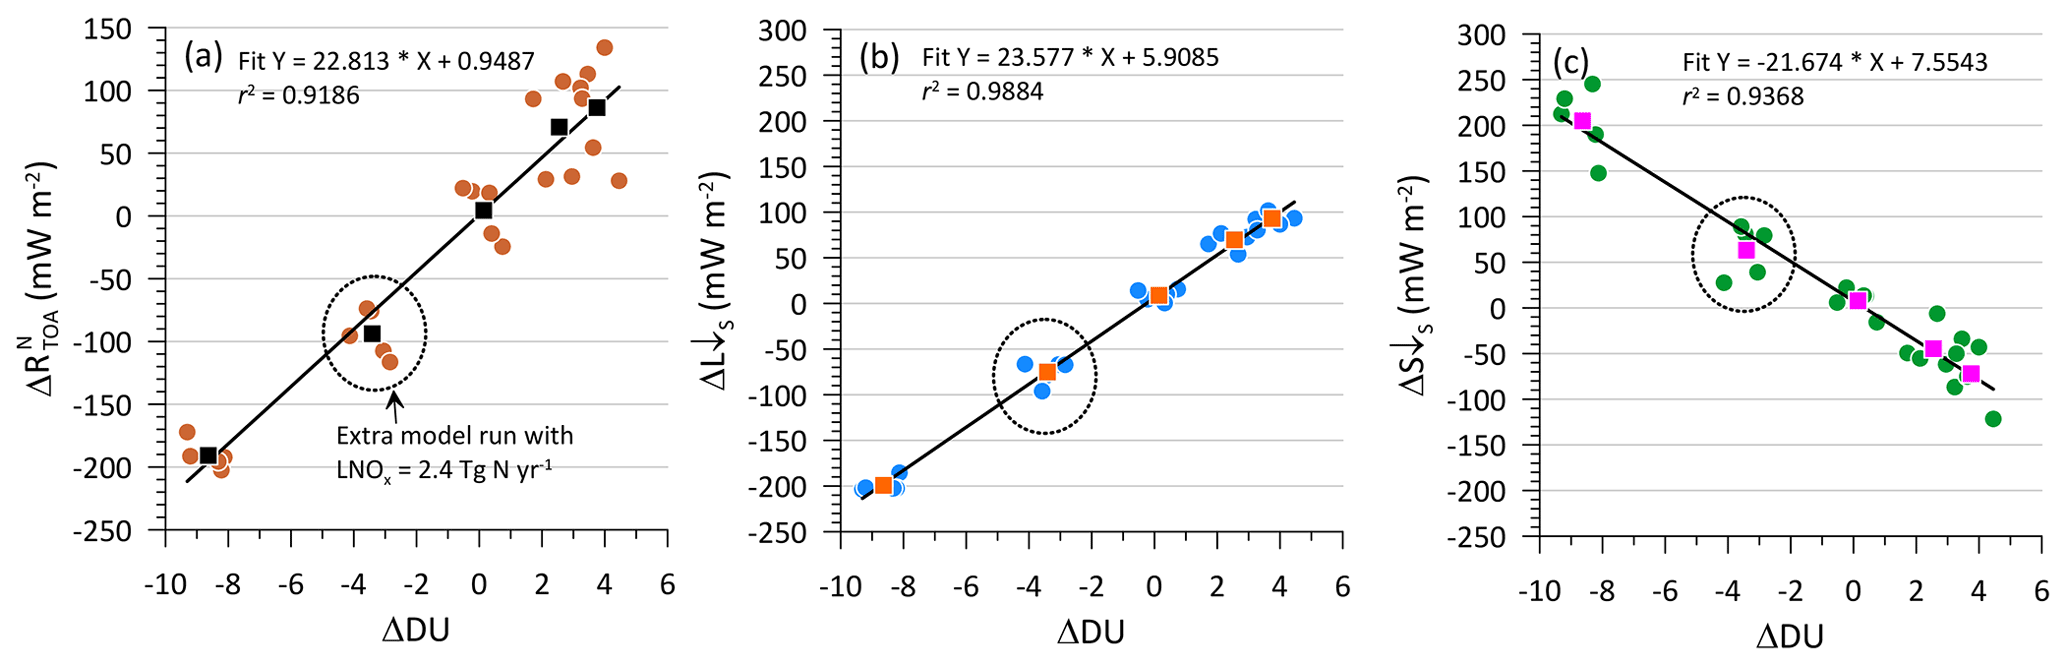
Figure 9Change in the modelled (a) net downward total TOA radiation (), (b) incoming surface longwave radiation (ΔL↓S), and (c) incoming surface shortwave radiation (ΔS↓S), as a function of change in the modelled O3 column (ΔDU) relative to the base model run. All runs except Run E (i.e. without the CH4 radiation feedback) are considered. Results from an additional model simulation the same as Run C but with averaged LNOx=2.4 Tg N yr−1 are also plotted (enclosed in a dotted circle) to check linearity. The solid circles are the annual means, whereas the squares are the mean over 2006–2010. The best fit line is based on all points.
The slope of the best fit lines in Fig. 8a suggests that with a per Tg increase in N production per year due to lightning, there is an increase of 39.6 mW m−2 in the net downward TOA radiation, or that much of radiation is retained by the atmosphere. Similarly, based on the slopes of the best fit lines in Fig. 8b and c, there is an increase of 40.2 mW m−2 (Tg N yr in the incoming surface longwave radiation and a decrease of 36.4 mW m−2 (Tg N yr in the incoming surface shortwave radiation.
3.6 Radiative effects as a function of changes in column O3
Radiation is examined with respect to O3 column changes (Fig. 9) caused by the dry deposition and LNOx parameterisation changes. Based on Fig. 9a, with a per DU increase in O3, there is an increase of 22.8 mW m−2 in the net downward TOA radiation, when the O3 change is dominated by an increase in LNOx. This can be compared to normalised radiative forcing calculations reported in the scientific literature. Using the results of 17 atmospheric chemistry models, Stevenson et al. (2013) derived a globally averaged normalised radiative forcing of 42 (range 36–45) mW m−2 DU−1 for tropospheric O3 increase from preindustrial (1750) to present day (2010). Gauss et al. (2003) calculated a normalized radiative forcing of 36±3 mW m−2 DU−1 due to changes in tropospheric O3 between 2000 and 2100 based on the results of 11 models. In our study, the changes in TOA radiative effects per DU, which are primarily driven by changes in the LNOx parameterisation and to a much lesser extent by the O3 deposition parameterisation (with CH4 feedbacks included), are about half the radiative forcing per DU as a result of climate-scale changes in tropospheric O3 (e.g. due to changes in precursor emissions and temperature). The climate-scale changes in radiation due to O3 are larger, possibly because there are co-emissions of non-NOx precursor species (e.g. CH4 and VOCs) and their feedbacks, whereas in the present case only LNOx and O3 dry deposition changes are considered (together with CH4 feedbacks). Methane levels and VOC emissions are unchanged. In any event, a clear distinction should be made between the expected column ozone changes arising from a change in LNOx emissions versus a change in anthropogenic NOx emissions.
Similarly, based on Fig. 9b and c, there is an increase in downward surface longwave radiation L↓S by 23.6 mW m−2 DU−1 and a decrease in downward surface shortwave radiation S↓S by 21.7 mW m−2 DU−1. (As discussed earlier, changes in S↓S can be explained at least in part by changes in aerosol fields and cloud cover as LNOx is increased, but it is clear here that there is a good statistical correlation between ΔS↓S and ΔDU).
The above changes in radiation were also examined as a function of changes in tropospheric O3 burden (plots not shown). The slopes of these plots indicate that there is an increase of 3.3 mW m−2 (Tg O3)−1 in the net downward TOA radiation, an increase of 3.3 mW m−2 (Tg O3)−1 in the incoming surface longwave radiation, and a decrease of 3.1 mW m−2 (Tg O3)−1 in the incoming surface shortwave radiation.
In this paper, we have not explored atmospheric temperature response or any changes in atmospheric heating rates caused by the changes in the radiation balance due to the use of the improved parameterisations.
3.7 LNOx and tropospheric lifetime of CH4
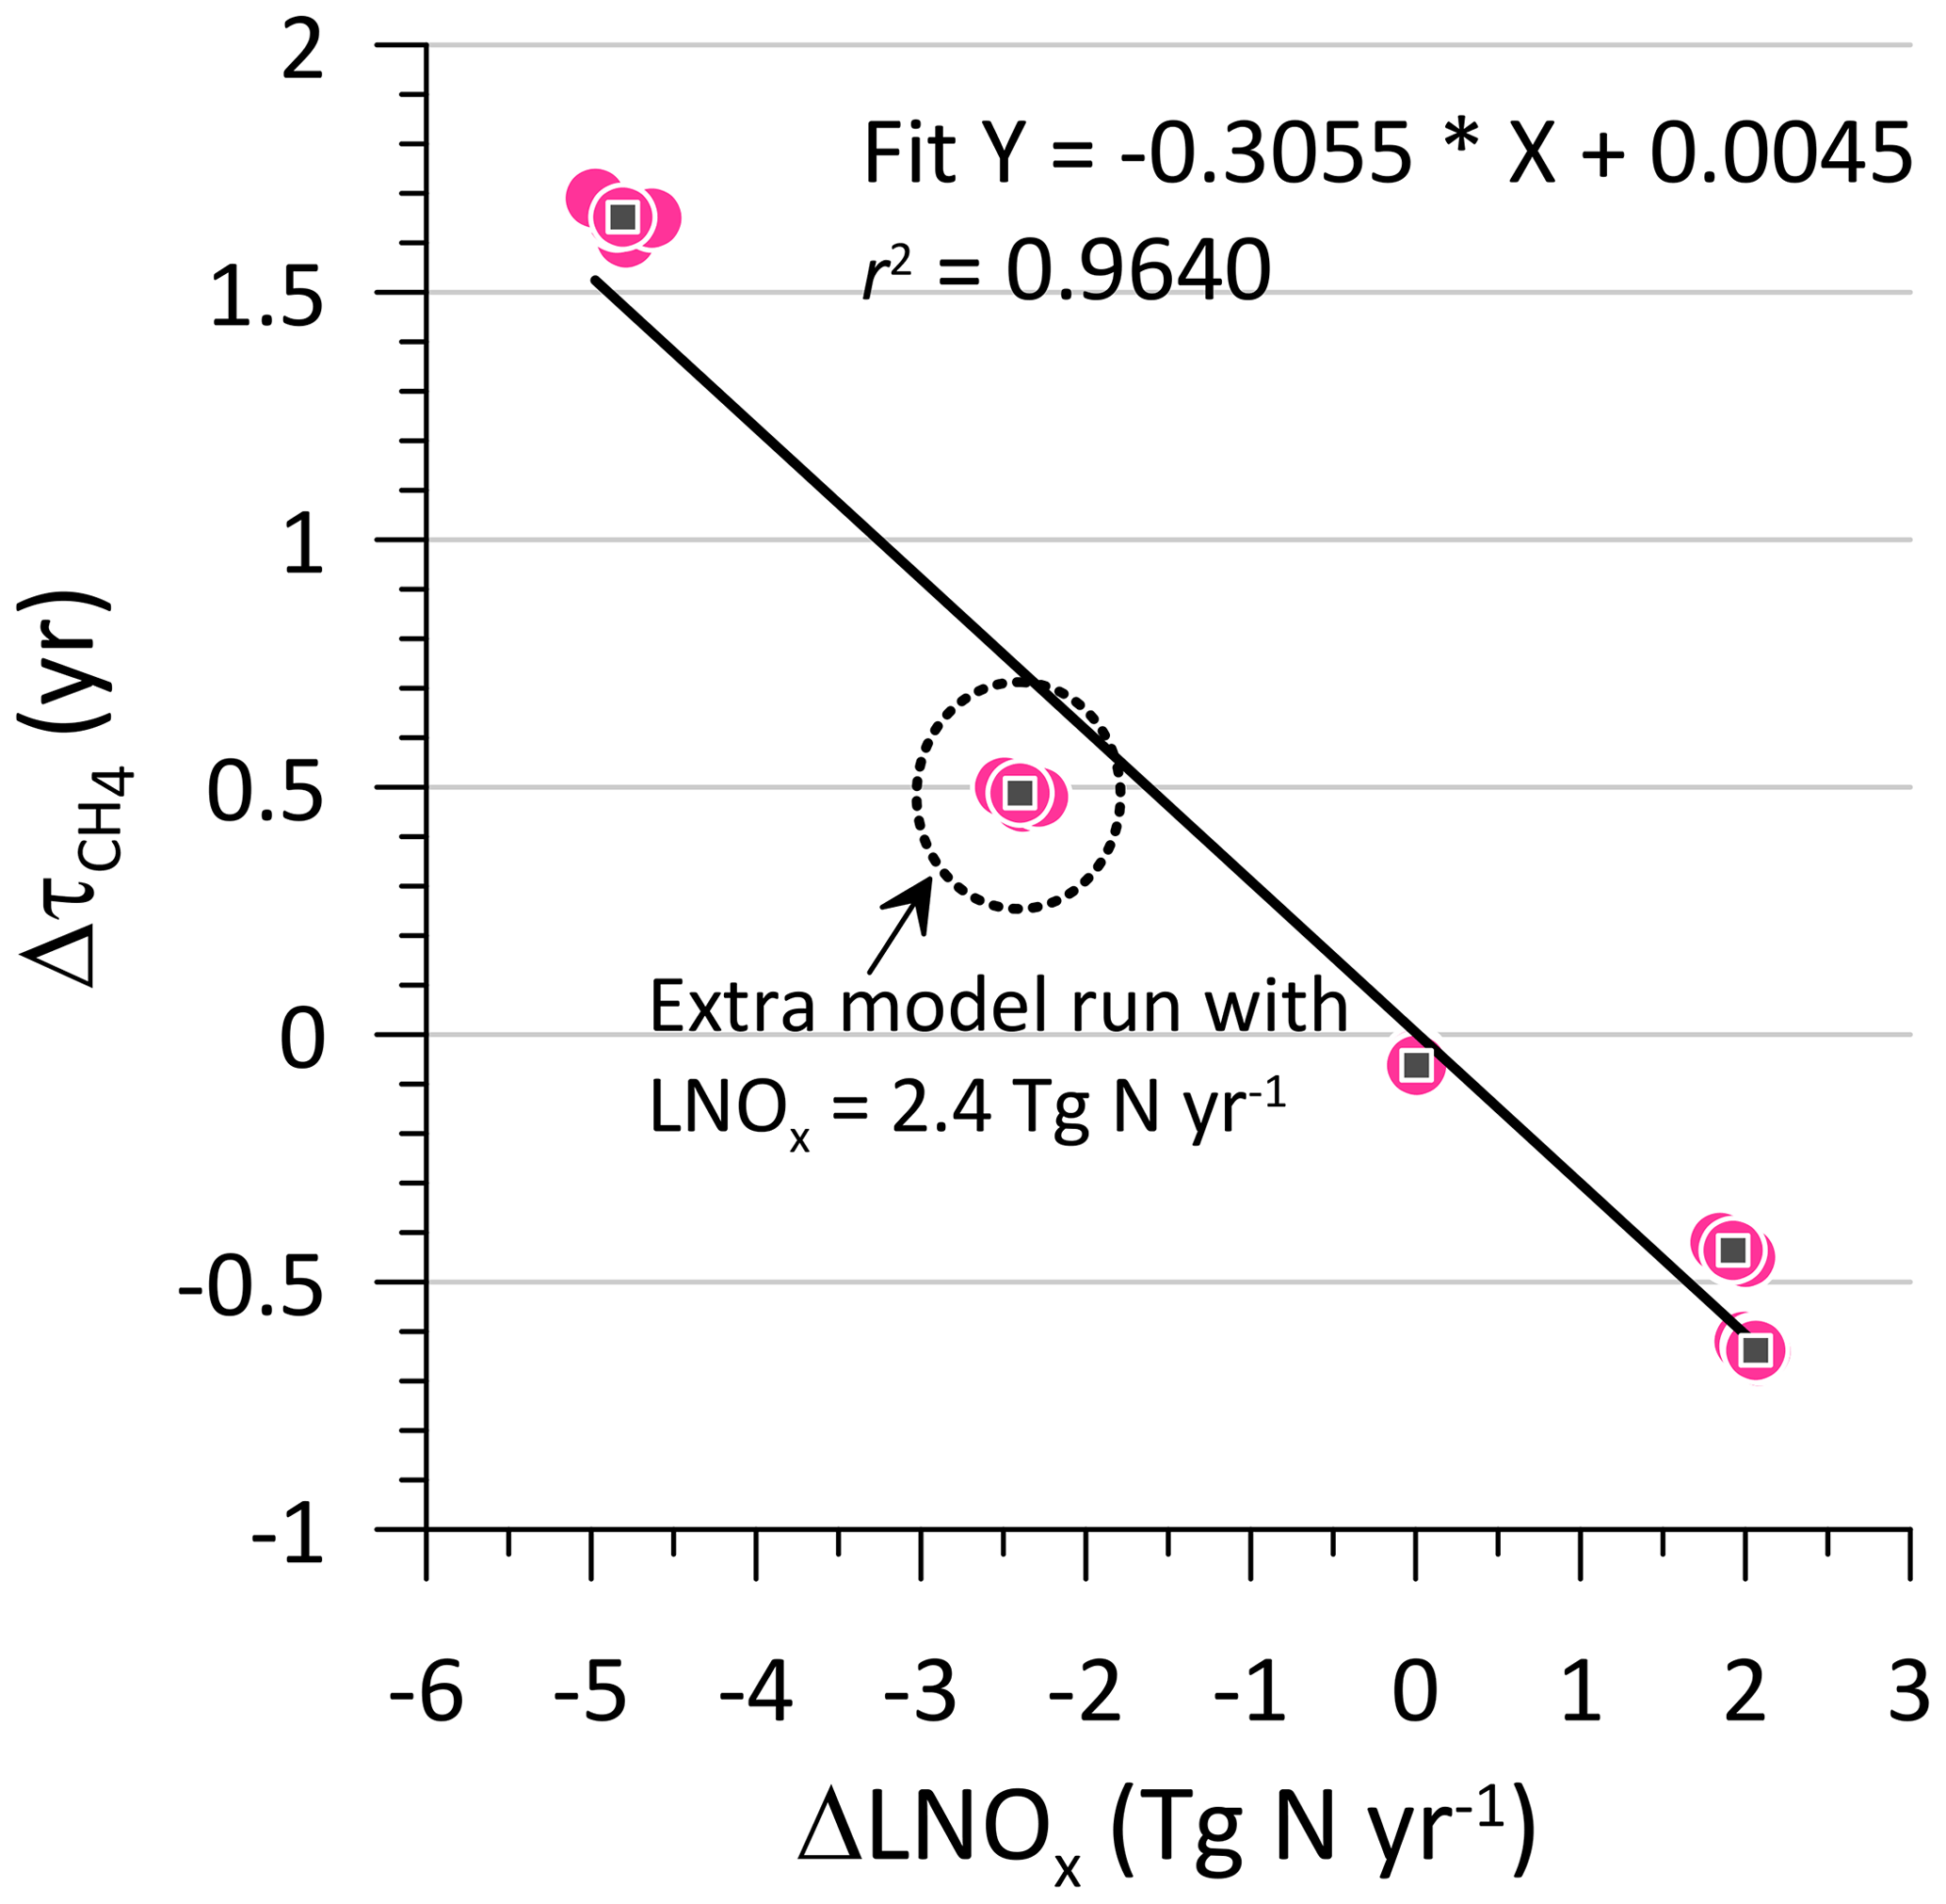
In Fig. 10, the change in plotted as a function of change in LNOx suggests that there is a shortening of the global mean CH4 lifetime by 0.31 years per Tg N yr−1 produced due to lightning. This change in is equivalent to a change of −4.4 % per Tg N yr−1 produced due to lightning (with respect to the Run C value of ), which is close to the average −4.8 (range −6.8 to −2.4) % per Tg N yr−1 given by Thornhill et al. (2021a) based on four other models. The uncertainty in corresponding to an LNOx uncertainty range of 5±3 Tg N yr−1 (Schumann and Huntrieser, 2007) would thus be ±0.92 years or ±13.5 % of from Run C.
3.8 LNOx and column integrated CN concentration
The change in the modelled global column integrated CN concentration is plotted as a function of change in LNOx in Fig. 11. The slope of the linear fit suggests that there is an increase in the column CN concentration by 0.163×109 cm−2 per Tg N yr−1 LNOx. Thus, the uncertainty in the column CN concentration corresponding to an LNOx uncertainty range of 5±3 Tg N yr−1 would be cm−2 or ±6.2 % of the column CN concentration obtained from Run C.
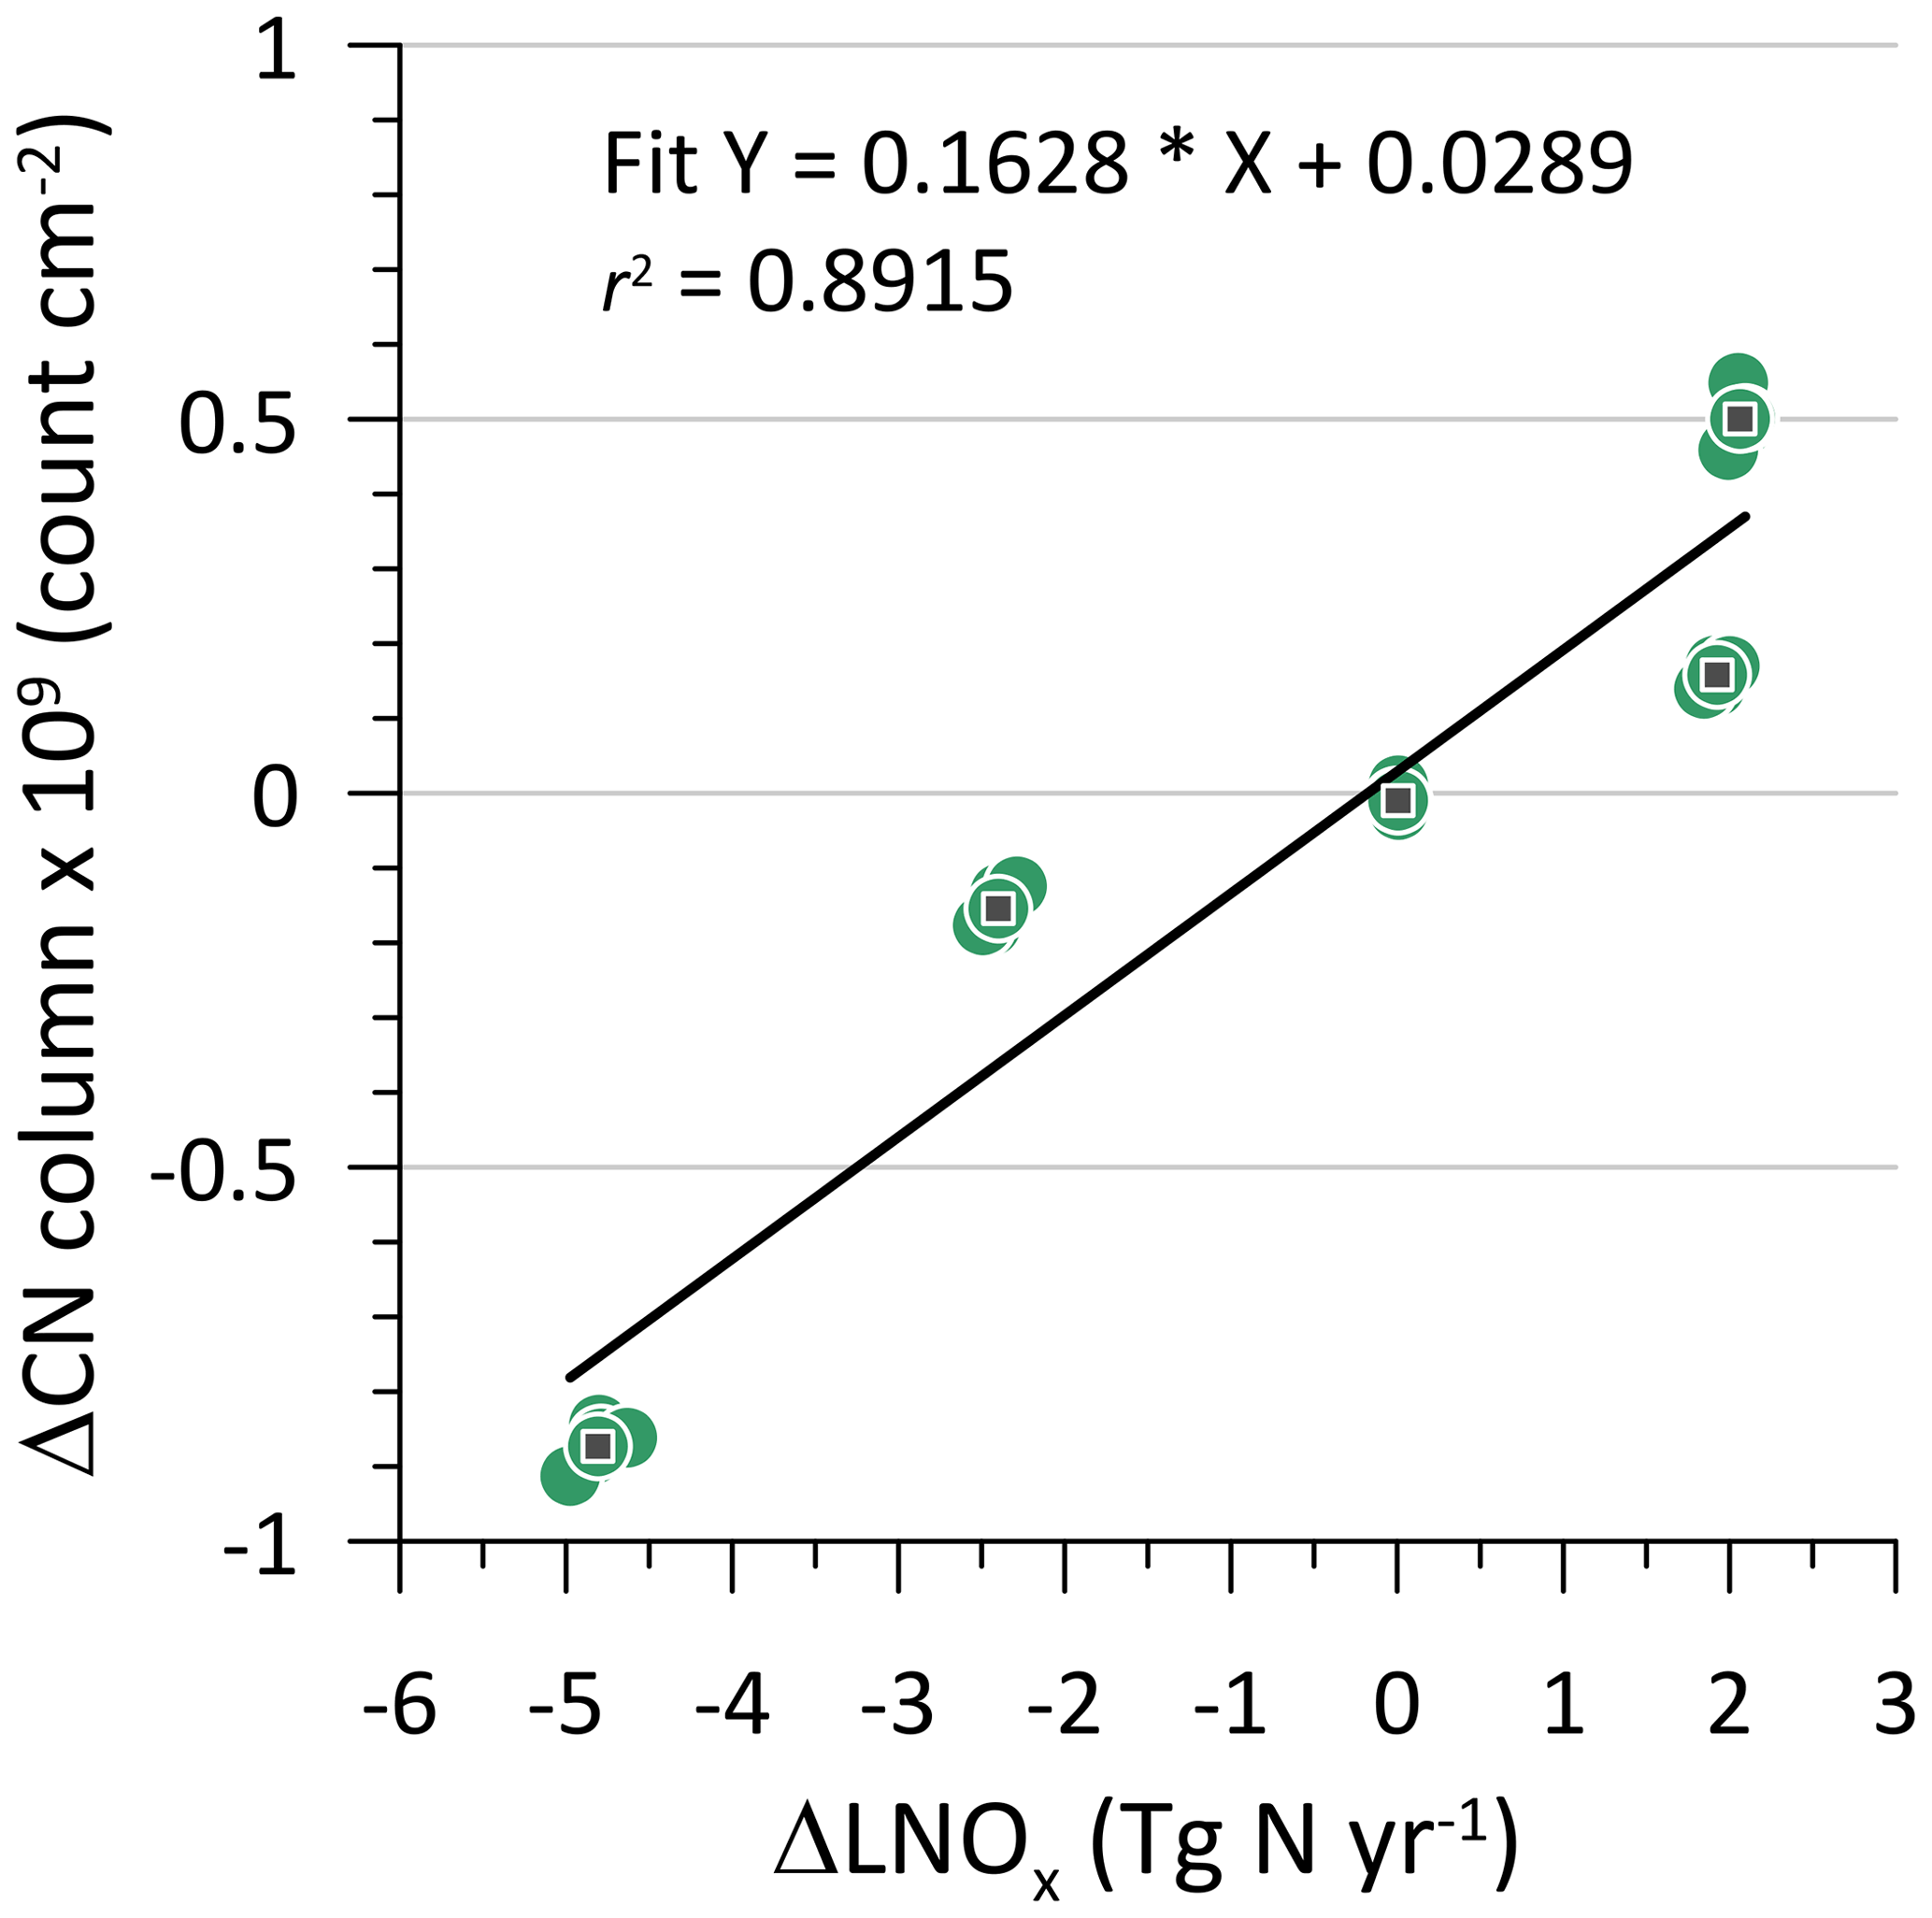
Figure 11Same as Fig. 8, except for change in the modelled global column integrated CN concentration.
3.9 LNOx and radiative forcing in a broader context
The magnitude of the modelled net downward TOA radiation differences () obtained (in Sect. 3.3) can be put in the context of the IPCC AR6 reported anthropogenic ERF due to O3 over the years 1750–2019 of 470±230 mW m−2 (Forster et al., 2021), noting that the radiation differences calculated here are akin to instantaneous radiative forcing, which excludes any adjustments (e.g. adjustments causing circulation changes) unlike the ERF, which is the sum of the IRF and the contribution from the adjustments. For example, the extra TOA radiation of 86.3 mW m−2 retained by the atmosphere when the new deposition and lightning flash-rate schemes are used, which represents the uncertainty in radiation due to two natural process representation in chemistry–climate models, is equivalent to 18 % of the IPCC AR6 reported anthropogenic O3 ERF of 470 mW m−2.
Using the amount of radiative flux change per Tg N change in LNOx from Sect. 3.5 and assuming an uncertainty range of 5±3 Tg N yr−1 in the global estimates of LNOx suggested by Schumann and Huntrieser (2007), the corresponding uncertainty range in the net downward TOA radiation retained in the atmosphere could thus be as much as ±119 mW m−2. (Although these cannot be compared directly, this is equivalent to 50 % of the IPCC AR6 reported anthropogenic O3 ERF.) Similarly, the corresponding uncertainty range is ±121 mW m−2 for the surface longwave radiation and ±109 mW m−2 for the surface shortwave radiation. Thus, the implications of this uncertainty in LNOx for global climate modelling needs investigation and clarification.
As demonstrated in this study, the net instantaneous radiative forcing of LNOx is positive with the enhanced O3 production dominating over the reduced CH4 lifetime. The emission-based ERF due to increases in anthropogenic NOx emissions (from 1750 to 2019) based on chemistry–climate models is reported to be negative (at W m−2), which is a net effect of a positive ERF through enhanced tropospheric O3 production, a negative ERF through reduced CH4 lifetime, and a small negative ERF contribution through formation of nitrate aerosols (Szopa et al., 2021). Notwithstanding the differences between ERF and IRF, this contrast between the LNOx and anthropogenic NOx forcings could at least be partially because (a) in the upper to middle troposphere within which LNOx is generated, the production efficiency of O3 per unit of NOx is much larger than that close to the earth's surface, where anthropogenic emissions are mostly released (Dahlmann et al., 2011), and (b) the historical anthropogenic NOx emissions were accompanied by emissions of reactive VOCs, which affects the subsequent chemistry.
As shown in Sect. 3.7, LNOx has a significant influence on the atmospheric lifetime of CH4, and the value of LNOx used within a model will influence the time integrated measures of radiative forcing including the ERF and the global warming potential (GWP) of anthropogenic CH4.
Recent chemistry–climate modelling studies have explored changes in LNOx in a future warming climate, but there remains a large uncertainty depending on how lightning flash-rate parameterisations are formulated. All CMIP6 Earth system models use flash-rate parameterisations that use convective cloud-top height (as is the case in the present paper), and they project an increase in lightning and hence in LNOx in a warmer world of 0.27–0.61 Tg N yr−1 ∘C−1 (Szopa et al., 2021; Thornhill et al., 2021a). Flux-based flash-rate parameterisations, e.g. that by Finney et al. (2018) using upward cloud ice flux, predict decrease in lightning under climate change. Thus, despite the improvements in understanding, LNOx remains a significant uncertainty for climate change and Earth system modelling.
The impact of recent process-based improvements to oceanic O3 dry deposition parameterisation (Luhar et al., 2018) and empirical improvements to lightning-generated NOx parameterisation (Luhar et al., 2021) on radiative transfer was investigated via the use of the ACCESS-UKCA chemistry-climate model, which includes radiative feedbacks of O3, CH4, and aerosol. The main radiation components examined were the net downward TOA radiative flux and the incoming longwave and shortwave radiation at the earth's surface.
The effects of the LNOx parameterisation change (which enhanced the LNOx production from 4.8 to 6.9 Tg N yr−1) were a factor of roughly 10 to 20 larger than those due to the dry deposition change. The two combined parameterisation changes increased the global tropospheric O3 burden by 31.9 Tg O3 (11.7 %), increased the global O3 column by 3.75 DU (13 % of the tropospheric column or 1.2 % of the total column), decreased the global mean tropospheric lifetime of CH4 by 0.64 years (8.4 %), increased the global column integrated aerosol number concentration by 0.5×109 cm−2 (6.7 %), and impacted the cloud cover somewhat (zonal mean value by as much as ±0.05 %).
The use of the improved oceanic dry deposition scheme resulted in a relatively small increase of 4.4 mW m−2 in the globally averaged all-sky net downward TOA radiative flux (i.e. that much of radiation is retained by the atmosphere), but this increase was much larger at 86.3 mW m−2, most of it longwave, when the improved LNOx parameterisation was also used (this increase was 107.0 mW m−2 when the CH4 radiative feedback was neglected). This change in the radiative flux represents a measure of uncertainty in radiation due to two natural processes represented in chemistry-climate models, and, for comparison, is equivalent to 18 % of the IPCC AR6 reported present-day anthropogenic radiative forcing due to O3 of 470 mW m−2.
Similarly, with the two parameterisation changes, there was an increase of 93 mW m−2 in the all-sky downward longwave radiation and a decrease of 72 mW m−2 in the all-sky downward shortwave radiation at the earth's surface. The changes in the all-sky downward shortwave radiation at the surface were consistent with the changes in the column aerosol number concentration and high-level cloud cover in response to the parameterisation changes.
The radiation changes due to the two improved parameterisations were larger in magnitude in the tropics than elsewhere. It was also found that when the default PR92 lightning flash-rate scheme (which underestimates the flash-rate distribution considerably over the ocean) was used with a uniform global scaling so as to give the total global LNOx the same as the improved scheme, the improved scheme yielded a larger net downward TOA radiation by ∼15 mW m−2, which implies that how LNOx is distributed spatially makes a difference to how the radiative transfer is impacted.
Based on the slopes of linear fits, with a per Tg N yr−1 increase in LNOx, there was an increase of 39.6 mW m−2 in the net downward TOA radiation, an increase of 40.2 mW m−2 in the incoming surface longwave radiation, a decrease of 36.4 mW m−2 in the incoming surface shortwave radiation, and a shortening of CH4 lifetime by 0.31 years (or ∼4 %).
The uncertainty range in the all-sky net downward TOA radiative flux due to a reported uncertainty range of 5±3 Tg N yr−1 in global estimates of LNOx could be as much as ±119 mW m−2. This value is equivalent to 50 % of the present-day anthropogenic radiative forcing due to O3 reported by the IPCC AR6. The corresponding modelled uncertainty range is ±121 mW m−2 for the surface longwave radiation, ±109 mW m−2 for the surface shortwave radiation, and ±0.92 years for CH4 lifetime.
The above results highlight the impact of LNOx on tropospheric O3 production, methane lifetime and aerosol, with ramifications for the earth's radiation budget, and suggest that the value of LNOx used within a model will influence the modelled ERF and GWP of anthropogenic methane. The inter-model uncertainty in the ERF for methane will be contributed to by the model choices of LNOx.
The global model used for this study is a licensed product of the UK Met Office and is available to specific users under a license agreement. For further information on how to apply for a licence, see http://www.metoffice.gov.uk/research/modelling-systems/unified-model (Met Office, 2022). The analysis of the model output and observations was performed using the NCAR Command Language (NCL) Software (Version 6.6.2, 2019); https://doi.org/10.5065/D6WD3XH5 (NCAR, 2019).
The global model output (in NetCDF) from the ACCESS-UKCA simulations made can be obtained by contacting the corresponding author (Ashok Luhar: ashok.luhar@csiro.au). Radiation observations used for model comparison purposes were available from NASA's Clouds and the Earth's Radiant Energy System (CERES) EBAF (Energy Balanced and Filled) Ed4.1 dataset (https://ceres.larc.nasa.gov/data/; NASA, 2022).
The supplement related to this article is available online at: https://doi.org/10.5194/acp-22-13013-2022-supplement.
All authors had the initial idea to carry out this work. AKL designed the study, performed the model simulations, analysed the model output and data, and prepared the manuscript. IEG co-designed the study, advised on various components of the paper, and contributed to the writing. MTW advised on the model setup. All authors contributed to revisions of the paper.
The contact author has declared that none of the authors has any competing interests.
Publisher's note: Copernicus Publications remains neutral with regard to jurisdictional claims in published maps and institutional affiliations.
This work was undertaken with the assistance of resources and services from the National Computational Infrastructure (NCI), which is supported by the Australian government. ERA-Interim data from the European Centre for Medium-Range Weather Forecasts (ECMWF) and radiation data from NASA's Clouds and the Earth's Radiant Energy System (CERES) were used in this research. We acknowledge Martin Dix of CSIRO for his help with model configuration issues, and Luke Abraham of the University of Cambridge and Mohit Dalvi of the UK Met Office for answering technical questions on the UM-UKCA model setup. We thank the two anonymous reviewers for their constructive comments.
This research has been supported by the Commonwealth Scientific and Industrial Research Organisation (project no. OD-204574) and the Climate Systems Hub of the National Environmental Science Program (NESP) funded by the Australian Government Department of Agriculture, Water and the Environment (project no. OD-226901, NESP2 CS1.7).
This paper was edited by Jeffrey Geddes and reviewed by two anonymous referees.
Abraham, N. L., Archibald, A. T., Bellouin, N., Boucher, O., Braesicke, P., Bushell, A., Carslaw, K. S., Collins, W., Dalvi, M., Emmerson, K. M., Folberth, G., Haywood, J., Johnson, C., Kipling, Z., Macintyre, H., Mann, G. W., Telford, P. J., Merikanto, J., Morgenstern, O., O'Connor, F., Ordonez, C., Osprey, S., Pringle, K. J., Pyle, J. A., Rae, J. G. L., Reddington, C. L., Savage, D., Spracklen, D., Stier, P., and West, R.: Unified Model Documentation Paper No. 84, United Kingdom Chemistry and Aerosol (UKCA) Technical Description MetUM Version 8.4, UK Met Office, Exeter, UK, 74 pp., http://www.ukca.ac.uk/images/b/b1/Umdp_084-umdp84.pdf (last access: 7 October 2022), 2012.
Archibald, A. T., O'Connor, F. M., Abraham, N. L., Archer-Nicholls, S., Chipperfield, M. P., Dalvi, M., Folberth, G. A., Dennison, F., Dhomse, S. S., Griffiths, P. T., Hardacre, C., Hewitt, A. J., Hill, R. S., Johnson, C. E., Keeble, J., Köhler, M. O., Morgenstern, O., Mulcahy, J. P., Ordóñez, C., Pope, R. J., Rumbold, S. T., Russo, M. R., Savage, N. H., Sellar, A., Stringer, M., Turnock, S. T., Wild, O., and Zeng, G.: Description and evaluation of the UKCA stratosphere–troposphere chemistry scheme (StratTrop vn 1.0) implemented in UKESM1, Geosci. Model Dev., 13, 1223–1266, https://doi.org/10.5194/gmd-13-1223-2020, 2020.
Barten, J. G. M., Ganzeveld, L. N., Steeneveld, G.-J., and Krol, M. C.: Role of oceanic ozone deposition in explaining temporal variability in surface ozone at High Arctic sites, Atmos. Chem. Phys., 21, 10229–10248, https://doi.org/10.5194/acp-21-10229-2021, 2021.
Bellouin, N., Mann, G. W., Woodhouse, M. T., Johnson, C., Carslaw, K. S., and Dalvi, M.: Impact of the modal aerosol scheme GLOMAP-mode on aerosol forcing in the Hadley Centre Global Environmental Model, Atmos. Chem. Phys., 13, 3027–3044, https://doi.org/10.5194/acp-13-3027-2013, 2013.
Bi, D. H., Dix, M., Marsland, S. J., O'Farrell, S., Rashid, H. A., Uotila, P., Hirst, A. C., Kowalczyk, E., Golebiewski, M., Sullivan, A., Yan, H. L., Hannah, N., Franklin, C., Sun, Z. A., Vohralik, P., Watterson, I., Zhou, X. B., Fiedler, R., Collier, M., Ma, Y. M., Noonan, J., Stevens, L., Uhe, P., Zhu, H. Y., Griffies, S. M., Hill, R., Harris, C., and Puri, K.: The ACCESS coupled model: description, control climate and evaluation, Aust. Meteorol. Oceanogr. J., 63, 41–64, https://doi.org/10.22499/2.6301.004, 2013.
Boccippio, D. J.: Lightning scaling relations revisited, J. Atmos. Sci., 59, 1086–1104, https://doi.org/10.1175/1520-0469(2002)059<1086:LSRR>2.0.CO;2, 2002.
Chen, L., Yan, G., Wang, T., Ren, H., Calbó, J., Zhao, J., and McKenzie, R.: Estimation of surface shortwave radiation components under all sky conditions: Modeling and sensitivity analysis, Remote Sens. Environ., 123, 457–469, https://doi.org/10.1016/j.rse.2012.04.006, 2012.
Clifton, O. E., Fiore, A. M., Massman, W. J., Baublitz, C. B., Coyle, M., Emberson, L., Fares, S., Farmer, D. K., Gentine, P., Gerosa, G, Guenther, A. B., Helmig, D., Lombardozzi, D. L., Munger, J. W., Patton, E. G., Pusede, S. E., Schwede, D. B., Silva, S. J., Sörgel, M., Steiner, A. L., and Tai, A. P. K.: Dry deposition of ozone over land: processes, measurement, and modelling, Rev. Geophys., 58, e2019RG000670, https://doi.org/10.1029/2019RG000670, 2020.
Dahlmann, K., Grewe, V., Ponater, M., and Matthes, S.: Quantifying the contributions of individual NOx sources to the trend in ozone radiative forcing, Atmos. Environ., 45, 2860–2868, https://doi.org/10.1016/j.atmosenv.2011.02.071, 2011.
Dee, D. P., Uppala, S. M., Simmons, A. J., Berrisford, P., Poli, P., Kobayashi, S., Andrae, U., Balmaseda, M. A., Balsamo, G., Bauer, P., Bechtold, P., Beljaars, A. C. M., van de Berg, L., Bidlot, J., Bormann, N., Delsol, C., Dragani, R., Fuentes, M., Geer, A. J., Haimberger, L., Healy, S. B., Hersbach, H., Holm, E. V., Isaksen, L., Kallberg, P., Kohler, M., Matricardi, M., McNally, A. P., Monge-Sanz, B. M., Morcrette, J.-J., Park, B.-K., Peubey, C., de Rosnay, P., Tavolato, C., Thepaut, J.-N., and Vitarta, F.: The ERA-Interim reanalysis: configuration and performance of the data assimilation system, Q. J. Roy. Meteorol. Soc., 137, 553–597, https://doi.org/10.1002/qj.828, 2011.
Desservettaz, M. J., Fisher, J. A., Luhar, A. K., Woodhouse, M. T., Bukosa, B., Buchholz, R. R., Wiedinmyer, C., Griffith, D. W. T., Krummel, P. B., Jones, N. B., Deutscher, N. M., and Greenslade, J. W.: Australian fire emissions of carbon monoxide estimated by global biomass burning inventories: Variability and observational constraints, J. Geophys. Res.-Atmos., 127, e2021JD035925, https://doi.org/10.1029/2021JD035925, 2022.
Edwards, J. M.: Efficient calculation of infrared fluxes and cooling rates using the two-stream equations, J. Atmos. Sci., 53, 1921–1932, https://doi.org/10.1175/1520-0469(1996)053<1921:ECOIFA>2.0.CO;2, 1996.
Edwards, J. M. and Slingo, A.: Studies with a flexible new radiation code. I: Choosing a configuration for a large-scale model, Q. J. Roy. Meteorol. Soc., 122, 689–719, https://doi.org/10.1002/qj.49712253107, 1996.
Fiddes, S. L., Woodhouse, M. T., Nicholls, Z., Lane, T. P., and Schofield, R.: Cloud, precipitation and radiation responses to large perturbations in global dimethyl sulfide, Atmos. Chem. Phys., 18, 10177–10198, https://doi.org/10.5194/acp-18-10177-2018, 2018.
Finney, D. L., Doherty, R. M., Wild, O., Stevenson, D. S., MacKenzie, I. A., and Blyth, A. M.: A projected decrease in lightning under climate change, Nat. Clim. Change, 8, 210–213, https://doi.org/10.1038/s41558-018-0072-6, 2018.
Forster, P., Storelvmo, T., Armour, K., Collins, W., Dufresne, J.-L., Frame, D., Lunt, D. J., Mauritsen, T., Palmer, M. D., Watanabe, M., Wild, M., and Zhang, H.: The Earth's Energy Budget, Climate Feedbacks, and Climate Sensitivity, in: Climate Change 2021: The Physical Science Basis, Contribution of Working Group I to the Sixth Assessment Report of the Intergovernmental Panel on Climate Change, edited by: Masson-Delmotte, V., Zhai, P., Pirani, A., Connors, S. L., Péan, C., Berger, S., Caud, N., Chen, Y., Goldfarb, L., Gomis, M. I., Huang, M., Leitzell, K., Lonnoy, E., Matthews, J. B. R., Maycock, T. K., Waterfield, T., Yelekçi, O., Yu, R., and Zhou, B., Cambridge University Press, Cambridge, UK and New York, NY, USA, 923–1054, https://doi.org/10.1017/9781009157896.009, 2021.
Galbally, I. E. and Roy, C. R.: Destruction of ozone at the Earth's surface, Q. J. Roy. Meteorol. Soc., 106, 599–620, https://doi.org/10.1002/qj.49710644915 1980.
Gauss, M., Myhre, G., Pitari, G., Prather, M. J., Isaksen, I. S. A., Berntsen, T. K., Brasseur, G. P., Dentener, F. J., Derwent, R. G., Hauglustaine, D. A., Horowitz, L. W., Jacob, D. J., Johnson, M., Law, K. S., Mickley, L. J., Muller, J.-F., Plantevin, P.-H., Pyle, J. A., Rogers, H. L., Stevenson, D. S., Sundet, J. K., van Weele, M., and Wild, O.: Radiative forcing in the 21st century due to ozone changes in the troposphere and the lower stratosphere, J. Geophys. Res., 108, 4292, https://doi.org/10.1029/2002JD002624, 2003.
Griffiths, P. T., Murray, L. T., Zeng, G., Shin, Y. M., Abraham, N. L., Archibald, A. T., Deushi, M., Emmons, L. K., Galbally, I. E., Hassler, B., Horowitz, L. W., Keeble, J., Liu, J., Moeini, O., Naik, V., O'Connor, F. M., Oshima, N., Tarasick, D., Tilmes, S., Turnock, S. T., Wild, O., Young, P. J., and Zanis, P.: Tropospheric ozone in CMIP6 simulations, Atmos. Chem. Phys., 21, 4187–4218, https://doi.org/10.5194/acp-21-4187-2021, 2021.
Hardacre, C., Wild, O., and Emberson, L.: An evaluation of ozone dry deposition in global scale chemistry climate models, Atmos. Chem. Phys., 15, 6419–6436, https://doi.org/10.5194/acp-15-6419-2015, 2015.
Jones, A. C., Hill, A., Remy, S., Abraham, N. L., Dalvi, M., Hardacre, C., Hewitt, A. J., Johnson, B., Mulcahy, J. P., and Turnock, S. T.: Exploring the sensitivity of atmospheric nitrate concentrations to nitric acid uptake rate using the Met Office's Unified Model, Atmos. Chem. Phys., 21, 15901–15927, https://doi.org/10.5194/acp-21-15901-2021, 2021.
Kato, S., Rose, F. G., Rutan, D. A., Thorsen, T. E., Loeb, N. G., Doelling, D. R., Huang, X., Smith, W. L., Su, W., and Ham, S.-H.: Surface irradiances of Edition 4.0 Clouds and the Earth's Radiant Energy System (CERES) Energy Balanced and Filled (EBAF) data product, J. Climate, 31, 4501–4527, https://doi.org/10.1175/JCLI-D-17-0523.1, 2018.
Labrador, L. J., von Kuhlmann, R., and Lawrence, M. G.: Strong sensitivity of the global mean OH concentration and the tropospheric oxidizing efficiency to the source of NOx from lightning, Geophys. Res. Lett., 31, L06102, https://doi.org/10.1029/2003GL019229, 2004.
Lamarque, J.-F., Bond, T. C., Eyring, V., Granier, C., Heil, A., Klimont, Z., Lee, D., Liousse, C., Mieville, A., Owen, B., Schultz, M. G., Shindell, D., Smith, S. J., Stehfest, E., Van Aardenne, J., Cooper, O. R., Kainuma, M., Mahowald, N., McConnell, J. R., Naik, V., Riahi, K., and van Vuuren, D. P.: Historical (1850–2000) gridded anthropogenic and biomass burning emissions of reactive gases and aerosols: methodology and application, Atmos. Chem. Phys., 10, 7017–7039, https://doi.org/10.5194/acp-10-7017-2010, 2010.
Lamarque, J.-F., Emmons, L. K., Hess, P. G., Kinnison, D. E., Tilmes, S., Vitt, F., Heald, C. L., Holland, E. A., Lauritzen, P. H., Neu, J., Orlando, J. J., Rasch, P. J., and Tyndall, G. K.: CAM-chem: description and evaluation of interactive atmospheric chemistry in the Community Earth System Model, Geosci. Model Dev., 5, 369–411, https://doi.org/10.5194/gmd-5-369-2012, 2012.
Lamarque, J.-F., Shindell, D. T., Josse, B., Young, P. J., Cionni, I., Eyring, V., Bergmann, D., Cameron-Smith, P., Collins, W. J., Doherty, R., Dalsoren, S., Faluvegi, G., Folberth, G., Ghan, S. J., Horowitz, L. W., Lee, Y. H., MacKenzie, I. A., Nagashima, T., Naik, V., Plummer, D., Righi, M., Rumbold, S. T., Schulz, M., Skeie, R. B., Stevenson, D. S., Strode, S., Sudo, K., Szopa, S., Voulgarakis, A., and Zeng, G.: The Atmospheric Chemistry and Climate Model Intercomparison Project (ACCMIP): overview and description of models, simulations and climate diagnostics, Geosci. Model Dev., 6, 179–206, https://doi.org/10.5194/gmd-6-179-2013, 2013.
Loades, D. C., Yang, M., Bell, T. G., Vaughan, A. R., Pound, R. J., Metzger, S., Lee, J. D., and Carpenter, L. J.: Ozone deposition to a coastal sea: comparison of eddy covariance observations with reactive air–sea exchange models, Atmos. Meas. Tech., 13, 6915–6931, https://doi.org/10.5194/amt-13-6915-2020, 2020.
Loeb, N. G., Doelling, D. R., Wang, H., Su, W., Nguyen, C., Corbett, J. G., Liang, L., Mitrescu, C., Rose, F. G., and Kato, S.: Clouds and the Earth's radiant energy system (CERES) energy balanced and filled (EBAF) top-of-atmosphere (TOA) edition-4.0 data product, J. Climate, 31, 895–918, https://doi.org/10.1175/JCLI-D-17-0208.1, 2018.
Luhar, A. K., Galbally, I. E., Woodhouse, M. T., and Thatcher, M.: An improved parameterisation of ozone dry deposition to the ocean and its impact in a global climate-chemistry model, Atmos. Chem. Phys., 17, 3749–3767, https://doi.org/10.5194/acp-17-3749-2017, 2017.
Luhar, A. K., Woodhouse, M. T., and Galbally, I. E.: A revised global ozone dry deposition estimate based on a new two-layer parameterisation for air–sea exchange and the multi-year MACC composition reanalysis, Atmos. Chem. Phys., 18, 4329–4348, https://doi.org/10.5194/acp-18-4329-2018, 2018.
Luhar, A. K., Galbally, I. E., Woodhouse, M. T., and Abraham, N. L.: Assessing and improving cloud-height-based parameterisations of global lightning flash rate, and their impact on lightning-produced NOx and tropospheric composition in a chemistry–climate model, Atmos. Chem. Phys., 21, 7053–7082, https://doi.org/10.5194/acp-21-7053-2021, 2021.
Mann, G. W., Carslaw, K. S., Spracklen, D. V., Ridley, D. A., Manktelow, P. T., Chipperfield, M. P., Pickering, S. J., and Johnson, C. E.: Description and evaluation of GLOMAP-mode: a modal global aerosol microphysics model for the UKCA composition-climate model, Geosci. Model Dev., 3, 519–551, https://doi.org/10.5194/gmd-3-519-2010, 2010.
Mao, J., Paulot, F., Jacob, D. J., Cohen, R. C., Crounse, J. D., Wennberg, P. O., Keller, C. A., Hudman, R. C., Barkley, M. P., and Horowitz, L. W.: Ozone and organic nitrates over the eastern United States: Sensitivity to isoprene chemistry, J. Geophys. Res.-Atmos., 118, 11256–11268, https://doi.org/10.1002/jgrd.50817, 2013.
Martin, R. V., Sauvage, B., Folkins, I., Sioris, C. E., Boone, C., Bernath, P., and Ziemke, J.: Space-based constraints on the production of nitric oxide by lightning, J. Geophys. Res., 112, D09309, https://doi.org/10.1029/2006JD007831, 2007.
Met Office: Unified Model, Met Office [code], http://www.metoffice.gov.uk/research/modelling-systems/unified-model, last access: 7 October 2022.
Murray, L. T.: Lightning NOx and impacts on air quality, Curr. Pollut. Rep., 2, 115–133, https://doi.org/10.1007/s40726-016-0031-7, 2016.
Naik, V., Voulgarakis, A., Fiore, A. M., Horowitz, L. W., Lamarque, J.-F., Lin, M., Prather, M. J., Young, P. J., Bergmann, D., Cameron-Smith, P. J., Cionni, I., Collins, W. J., Dalsøren, S. B., Doherty, R., Eyring, V., Faluvegi, G., Folberth, G. A., Josse, B., Lee, Y. H., MacKenzie, I. A., Nagashima, T., van Noije, T. P. C., Plummer, D. A., Righi, M., Rumbold, S. T., Skeie, R., Shindell, D. T., Stevenson, D. S., Strode, S., Sudo, K., Szopa, S., and Zeng, G.: Preindustrial to present-day changes in tropospheric hydroxyl radical and methane lifetime from the Atmospheric Chemistry and Climate Model Intercomparison Project (ACCMIP), Atmos. Chem. Phys., 13, 5277–5298, https://doi.org/10.5194/acp-13-5277-2013, 2013.
NASA: CERES Data Products, https://ceres.larc.nasa.gov/data/, last access: 7 October 2022.
Nault, B. A., Laughner, J. L.,Wooldridge, P. J., Crounse, J. D., Dibb, J., Diskin, G., Peischl, J., Podolske, J. R., Pollack, I. B., Ryerson, T. B., Scheuer, E., Wennberg, P. O., and Cohen, R. C.: Lightning NOx emissions: reconciling measured and modeled estimates with updated NOx Chemistry, Geophys. Res. Lett., 44, 9479–9488, https://doi.org/10.1002/2017GL074436, 2017.
NCAR: The NCAR Command Language (Version 6.6.2), Boulder, Colorado, UCAR/NCAR/CISL/TDD [code], https://doi.org/10.5065/D6WD3XH5, 2019.
Neu, J. L., Prather, M. J., and Penner, J. E.: Global atmospheric chemistry: Integrating over fractional cloud cover, J. Geophys. Res., 112, D11306, https://doi.org/10.1029/2006JD008007, 2007.
Olivier, J., Peters, J., Granier, C., Petron, G., Muller, J. F., and Wallens, S.: Present and future surface emissions of atmospheric compounds, POET Report #2 EU project EVK2-1999-00011, http://accent.aero.jussieu.fr/POET_metadata.php (last access: 25 May 2022), 2003.
Oreopoulos, L. and Khairoutdinov, M.: Overlap properties of clouds generated by a cloud-resolving model, J. Geophys. Res., 108, 4479, https://doi.org/10.1029/2002JD003329, 2003.
Pound, R. J., Sherwen, T., Helmig, D., Carpenter, L. J., and Evans, M. J.: Influences of oceanic ozone deposition on tropospheric photochemistry, Atmos. Chem. Phys., 20, 4227–4239, https://doi.org/10.5194/acp-20-4227-2020, 2020.
Price, C. and Rind, D.: A simple lightning parameterization for calculating global lightning distributions, J. Geophys. Res.-Atmos., 97, 9919–9933, https://doi.org/10.1029/92JD00719, 1992.
Rap, A., Richards, N. A. D., Forster, P. M., Monks, S. A., Arnold, S. R., and Chipperfield, M. P.: Satellite constraint on the tropospheric ozone radiative effect, Geophys. Res. Lett., 42, 5074–5081, https://doi.org/10.1002/2015GL064037, 2015.
Schumann, U. and Huntrieser, H.: The global lightning-induced nitrogen oxides source, Atmos. Chem. Phys., 7, 3823–3907, https://doi.org/10.5194/acp-7-3823-2007, 2007.
Sindelarova, K., Granier, C., Bouarar, I., Guenther, A., Tilmes, S., Stavrakou, T., Müller, J.-F., Kuhn, U., Stefani, P., and Knorr, W.: Global data set of biogenic VOC emissions calculated by the MEGAN model over the last 30 years, Atmos. Chem. Phys., 14, 9317–9341, https://doi.org/10.5194/acp-14-9317-2014, 2014.
Stephens, G. L., Li, J., Wild, M., Clayson, C. A., Loeb, N. G., Kato, S., L'Ecuyer, T., Stackhouse, P. W., Lebsock, M., and Andrews, T.: An update on Earth's energy balance in light of the latest global observations, Nat. Geosci., 5, 691–696, https://doi.org/10.1038/ngeo1580, 2012.
Stevenson, D. S., Young, P. J., Naik, V., Lamarque, J.-F., Shindell, D. T., Voulgarakis, A., Skeie, R. B., Dalsoren, S. B., Myhre, G., Berntsen, T. K., Folberth, G. A., Rumbold, S. T., Collins, W. J., MacKenzie, I. A., Doherty, R. M., Zeng, G., van Noije, T. P. C., Strunk, A., Bergmann, D., Cameron-Smith, P., Plummer, D. A., Strode, S. A., Horowitz, L., Lee, Y. H., Szopa, S., Sudo, K., Nagashima, T., Josse, B., Cionni, I., Righi, M., Eyring, V., Conley, A., Bowman, K. W., Wild, O., and Archibald, A.: Tropospheric ozone changes, radiative forcing and attribution to emissions in the Atmospheric Chemistry and Climate Model Intercomparison Project (ACCMIP), Atmos. Chem. Phys., 13, 3063–3085, https://doi.org/10.5194/acp-13-3063-2013, 2013.
Szopa, S., Naik, V., Adhikary, B., Artaxo, P., Berntsen, T., Collins, W. D., Fuzzi, S., Gallardo, L., Kiendler Scharr, A., Klimont, Z., Liao, H., Unger, N., and Zanis, P.: Short-Lived Climate Forcers, in: Climate Change 2021: The Physical Science Basis. Contribution of Working Group I to the Sixth Assessment Report of the Intergovernmental Panel on Climate Change, edited by: Masson-Delmotte, V., Zhai, P., Pirani, A., Connors, S. L., Péan, C., Berger, S., Caud, N., Chen, Y., Goldfarb, L., Gomis, M. I., Huang, M., Leitzell, K., Lonnoy, E., Matthews, J. B. R., Maycock, T. K., Waterfield, T., Yelekçi, O., Yu, R., and Zhou, B., Cambridge University Press, Cambridge, UK and New York, NY, USA, 817–922, https://doi.org/10.1017/9781009157896.008, 2021.
Telford, P. J., Abraham, N. L., Archibald, A. T., Braesicke, P., Dalvi, M., Morgenstern, O., O'Connor, F. M., Richards, N. A. D., and Pyle, J. A.: Implementation of the Fast-JX Photolysis scheme (v6.4) into the UKCA component of the MetUM chemistry-climate model (v7.3), Geosci. Model Dev., 6, 161–177, https://doi.org/10.5194/gmd-6-161-2013, 2013.
Thornhill, G., Collins, W., Olivié, D., Skeie, R. B., Archibald, A., Bauer, S., Checa-Garcia, R., Fiedler, S., Folberth, G., Gjermundsen, A., Horowitz, L., Lamarque, J.-F., Michou, M., Mulcahy, J., Nabat, P., Naik, V., O'Connor, F. M., Paulot, F., Schulz, M., Scott, C. E., Séférian, R., Smith, C., Takemura, T., Tilmes, S., Tsigaridis, K., and Weber, J.: Climate-driven chemistry and aerosol feedbacks in CMIP6 Earth system models, Atmos. Chem. Phys., 21, 1105–1126, https://doi.org/10.5194/acp-21-1105-2021, 2021a.
Thornhill, G. D., Collins, W. J., Kramer, R. J., Olivié, D., Skeie, R. B., O'Connor, F. M., Abraham, N. L., Checa-Garcia, R., Bauer, S. E., Deushi, M., Emmons, L. K., Forster, P. M., Horowitz, L. W., Johnson, B., Keeble, J., Lamarque, J.-F., Michou, M., Mills, M. J., Mulcahy, J. P., Myhre, G., Nabat, P., Naik, V., Oshima, N., Schulz, M., Smith, C. J., Takemura, T., Tilmes, S., Wu, T., Zeng, G., and Zhang, J.: Effective radiative forcing from emissions of reactive gases and aerosols – a multi-model comparison, Atmos. Chem. Phys., 21, 853–874, https://doi.org/10.5194/acp-21-853-2021, 2021b.
Tost, H.: Chemistry–climate interactions of aerosol nitrate from lightning, Atmos. Chem. Phys., 17, 1125–1142, https://doi.org/10.5194/acp-17-1125-2017, 2017.
van der Werf, G. R., Randerson, J. T., Giglio, L., van Leeuwen, T. T., Chen, Y., Rogers, B. M., Mu, M., van Marle, M. J. E., Morton, D. C., Collatz, G. J., Yokelson, R. J., and Kasibhatla, P. S.: Global fire emissions estimates during 1997–2016, Earth Syst. Sci. Data, 9, 697–720, https://doi.org/10.5194/essd-9-697-2017, 2017.
van Vuuren, D. P., Edmonds, J., Kainuma, M., Riahi, K., Thomson, A., Hibbard, K., Hurtt, G. C., Kram, T., Krey, V., Lamarque, J. F., Masui, T., Meinshausen, M., Nakicenovic, N., Smith, S. J., and Rose, S. K.: The representative concentration pathways: An overview, Climatic Change, 109, 5–31, https://doi.org/10.1007/s10584-011-0148-z, 2011.
Walters, D. N., Williams, K. D., Boutle, I. A., Bushell, A. C., Edwards, J. M., Field, P. R., Lock, A. P., Morcrette, C. J., Stratton, R. A., Wilkinson, J. M., Willett, M. R., Bellouin, N., Bodas-Salcedo, A., Brooks, M. E., Copsey, D., Earnshaw, P. D., Hardiman, S. C., Harris, C. M., Levine, R. C., MacLachlan, C., Manners, J. C., Martin, G. M., Milton, S. F., Palmer, M. D., Roberts, M. J., Rodríguez, J. M., Tennant, W. J., and Vidale, P. L.: The Met Office Unified Model Global Atmosphere 4.0 and JULES Global Land 4.0 configurations, Geosci. Model Dev., 7, 361–386, https://doi.org/10.5194/gmd-7-361-2014, 2014.
Wang, K. and Dickinson, R. E.: Global atmospheric downward longwave radiation at the surface from ground-based observations, satellite retrievals, and reanalyses, Rev. Geophys., 51, 150–185, https://doi.org/10.1002/rog.20009, 2013.
Wesely, M.: Parameterization of surface resistances to gaseous dry deposition in regional-scale numerical-models, Atmos. Environ., 23, 1293–1304, https://doi.org/10.1016/j.atmosenv.2007.10.058, 1989.
Woodhouse, M. T., Luhar, A. K., Stevens, L., Galbally, I., Thatcher, M., Uhe, P., Wolff, H., Noonan, J., and Molloy, S.: Australian reactive-gas emissions in a global chemistry-climate model and initial results, Air Qual. Clim.Change, 49, 31–38, 2015.
Woodward, S.: Modeling the atmospheric life cycle and radiative impact of mineral dust in the Hadley Centre climate model, J. Geophys. Res.-Atmos., 106, 18155–18166, https://doi.org/10.1029/2000JD900795, 2001.
Young, P. J., Archibald, A. T., Bowman, K. W., Lamarque, J.-F., Naik, V., Stevenson, D. S., Tilmes, S., Voulgarakis, A., Wild, O., Bergmann, D., Cameron-Smith, P., Cionni, I., Collins, W. J., Dalsøren, S. B., Doherty, R. M., Eyring, V., Faluvegi, G., Horowitz, L. W., Josse, B., Lee, Y. H., MacKenzie, I. A., Nagashima, T., Plummer, D. A., Righi, M., Rumbold, S. T., Skeie, R. B., Shindell, D. T., Strode, S. A., Sudo, K., Szopa, S., and Zeng, G.: Pre-industrial to end 21st century projections of tropospheric ozone from the Atmospheric Chemistry and Climate Model Intercomparison Project (ACCMIP), Atmos. Chem. Phys., 13, 2063–2090, https://doi.org/10.5194/acp-13-2063-2013, 2013.
Zhong, W. and Haigh, J. D.: An efficient and accurate correlated-k parameterization of infrared radiative transfer for troposphere–stratosphere–mesosphere GCMs, Atmos. Sci. Lett., 1, 125–135, https://doi.org/10.1006/asle.2000.0022, 2000.
Zhong, W., Osprey, S. M., Gray, L. J., and Haigh, J. D.: Influence of the prescribed solar spectrum on calculations of atmospheric temperature, Geophys. Res. Lett., 35, L22813, https://doi.org/10.1029/2008GL035993, 2008.
present-dayIPCC AR6 anthropogenic effective radiative forcing (ERF) due to ozone. Hence, uncertainty in LNOx needs to be explicitly addressed in relation to the GWP and ERF of anthropogenic methane.