the Creative Commons Attribution 4.0 License.
the Creative Commons Attribution 4.0 License.
In situ and satellite-based estimates of cloud properties and aerosol–cloud interactions over the southeast Atlantic Ocean
Greg M. McFarquhar
Joseph R. O'Brien
Michael R. Poellot
David J. Delene
Ian Chang
Feng Xu
Jens Redemann
In situ cloud probe data from the NASA ObseRvations of Aerosols above CLouds and their intEractionS (ORACLES) field campaign were used to estimate the effective radius (Re), cloud optical thickness (τ), and cloud droplet concentration (Nc) for marine stratocumulus over the southeast Atlantic Ocean. The in situ Re, τ, and Nc were compared with co-located Moderate Resolution Imaging Spectroradiometer (MODIS) retrievals of Re and τ and MODIS-derived Nc. For 145 cloud profiles, a MODIS retrieval was co-located with in situ data with a time gap of less than 1 h. On average, the MODIS Re and τ (11.3 µm and 11.7) were 1.6 µm and 2.3 higher than the in situ Re and τ with Pearson's correlation coefficients (R) of 0.77 and 0.73, respectively. The average MODIS Nc (151.5 cm−3) was within 1 cm−3 of the average in situ Nc with an R of 0.90.
The 145 cloud profiles were classified into 67 contact profiles where an aerosol concentration (Na) greater than 500 cm−3 was sampled within 100 m above cloud tops and 78 separated profiles where Na less than 500 cm−3 was sampled up to 100 m above cloud tops. Contact profiles had a higher in situ Nc (by 88 cm−3), higher τ (by 2.5), and lower in situ Re (by 2.2 µm) compared to separated profiles. These differences were associated with aerosol–cloud interactions (ACI), and MODIS estimates of the differences were within 5 cm−3, 0.5, and 0.2 µm of the in situ estimates when profiles with MODIS Re>15 µm or MODIS τ>25 were removed. The agreement between MODIS and in situ estimates of changes in Re, τ, and Nc associated with ACI was driven by small biases in MODIS retrievals of cloud properties relative to in situ measurements across different aerosol regimes. Thus, when combined with estimates of aerosol location and concentration, MODIS retrievals of marine stratocumulus cloud properties over the southeast Atlantic can be used to study ACI over larger domains and longer timescales than possible using in situ data.
- Article
(11331 KB) - Full-text XML
- BibTeX
- EndNote
Uncertainties in the effective radiative forcing due to aerosol–cloud interactions (ACI) lead to variability in climate model estimates of the earth's energy budget in future climate scenarios (e.g., Boucher et al., 2013). The ACI for warm, low-level clouds are particularly important due to their dominating impact on the aerosol indirect forcing (Christensen et al., 2016). Further, the shortwave cloud radiative forcing of −17.1 W m−2 (Loeb et al., 2009) is largely driven by the ubiquitous low-level clouds (Hartmann et al., 1992). Marine stratocumulus is the most common type of low-level cloud, with an annual mean coverage of 23 % of the earth's ocean surface (Wood, 2012). The radiative forcing due to well-mixed greenhouse gases (+2.83 W m−2) (Myhre et al., 2013) or the doubling of the CO2 concentration (about +2.5 W m−2) could be offset by the radiative forcing from just a 15 % to 20 % reduction in droplet size for low clouds (Slingo, 1990). Low-level clouds are thus strong modulators of planetary albedo and global climate.
ACI lead to changes in the cloud radiative forcing through processes that impact cloud extinction (β) and optical thickness (τ), which are closely related to microphysical properties such as cloud droplet concentration (Nc), effective radius (Re), and liquid water content (LWC). Cloud radiative forcing is a strong function of Re, which represents the mean droplet size retrieved from radiative transfer calculations (Hansen and Travis, 1974). An increase in aerosol concentration (Na) can increase the number of cloud condensation nuclei and lead to a higher Nc and lower Re when LWC remains constant. These aerosol-induced changes in Nc and Re lead to clouds with a higher reflectance or τ, which results in an indirect radiative forcing (Twomey, 1974, 1977). These changes in Nc and Re can lead to adjustments in precipitation formation processes and an increase in cloud lifetime (Albrecht, 1989). An increase in τ and a decrease in precipitation rates associated with these ACI were observed for marine stratocumulus clouds over the southeast Atlantic Ocean (Gupta et al., 2021, hereafter “G21”; Gupta et al., 2022, hereafter “G22”).
However, ACI are often masked by meteorological conditions (Mauger and Norris, 2007), cloud adjustments to increasing Na such as invigoration (Douglas and L'Ecuyer, 2021) or nonlinear liquid water path (LWP) responses to changes in Nc (Gryspeerdt et al., 2019), and the modulation of aerosol properties by clouds and precipitation (Wood et al., 2012). These confounding influences can be reduced by constraining meteorological variables that affect LWP and by comparing clouds with similar LWPs or low precipitation rates (e.g., McCoy et al., 2020; G22). Uncertainties in estimating the impact of ACI on cloud albedo are also driven by differences between process scales for ACI and the resolution of climate models or satellite retrievals (McComiskey and Feingold, 2012). The inconsistency in ACI estimates due to the scale differences is addressed by combining satellite retrievals with airborne observations for specific regimes such as marine stratocumulus clouds (Painemal and Zuidema, 2011, hereafter “PZ11”).
A regime of interest for ACI exists over the southeast Atlantic Ocean, where an extensive stratocumulus deck is overlaid by biomass burning aerosols from southern Africa (Haywood et al., 2004; Adebiyi and Zuidema, 2016). The biomass burning aerosols exert a direct radiative forcing by absorbing solar radiation (Cochrane et al., 2019), and heating due to the aerosol absorption can impact atmospheric stability (Cochrane et al., 2022). Changes in the thermodynamic profile can lead to changes in cloud properties and result in a semi-direct forcing (Johnson et al., 2004; McFarquhar and Wang, 2006; Wilcox, 2010). Climate models struggle to simulate these radiative effects and the altitude of the above-cloud aerosol layer over the southeast Atlantic, leading to biases in model estimates of low-cloud feedbacks and ACI (Das et al., 2020; Mallet et al., 2021).
Airborne campaigns have been conducted over the southeast Atlantic since 2016 to understand the ACI in this region and their impact on the global climate (Zuidema et al., 2016; Formenti et al., 2019; Haywood et al., 2021). During the NASA ObseRvations of Aerosols above CLouds and their intEractionS (ORACLES) field campaign (Redemann et al., 2021), in situ measurements of cloud droplet size distributions, from which Nc, Re, and τ can be estimated, were collected over the southeast Atlantic at locations with contact or separation between the base of the aerosol layer and stratocumulus cloud tops. Variable vertical separation between the aerosol and cloud layers was associated with aerosol-induced changes in Nc, Re, and τ (G21) and precipitation suppression (G22). Satellite retrievals of Nc, Re, and τ and aerosol-induced changes in Nc, Re, and τ could enable such investigations of ACI over larger domains and longer timescales than in situ measurements.
The Earth Observing System Terra and Aqua satellites provide global coverage of cloud microphysical properties using the Moderate Resolution Imaging Spectroradiometer (MODIS). MODIS acquires data for 36 atmospheric bands from 0.4 to 14.4 µm, including a non-absorbing band (0.86 µm over ocean) which provides information on τ and a water absorbing band (1.6, 2.1, or 3.7 µm) which provides information on Re (Platnick et al., 2003). Reflectance pairs from these bands allow simultaneous retrievals of Re and τ (Nakajima and King, 1990). In the absence of direct retrievals, MODIS Nc can be estimated assuming adiabatic LWC (Brenguier et al., 2000; Szczodrak et al., 2001). However, MODIS retrievals of cloud properties have biases relative to in situ Nc, Re, and τ that depend on the cloud type and sampling strategy (Gryspeerdt et al., 2022; Fu et al., 2022), the occurrence of drizzle (Zinner et al., 2010), the width and shape of the droplet size distribution (Chang and Li, 2002; Brenguier et al., 2011), the vertical profile of Re (McFarquhar and Heymsfield, 1998; Platnick, 2000), and cloud adiabaticity (Min et al., 2012; Merk et al., 2016; Braun et al., 2018). Results from comparisons of MODIS retrievals with in situ data also depend on the cloud probes used for in situ measurements (King et al., 2013; Witte et al., 2018) and the co-location of the MODIS and in situ datasets (PZ11).
A review of satellite-based estimates of Nc concluded that airborne datasets are underutilized for satellite retrieval evaluation (Grosvenor et al., 2018). This study compares in situ Nc, Re, and τ from ORACLES with MODIS retrievals of Re and τ (Platnick et al., 2017a) and the MODIS-derived Nc based on the assumption of adiabatic LWC. A number of studies have compared MODIS retrievals of marine stratocumulus cloud properties with in situ observations (e.g., PZ11; Min et al., 2012; Noble and Hudson, 2015; Braun et al., 2018; Witte et al., 2018). This study expands upon the existing literature by using a larger in situ dataset which provides cloud and aerosol measurements under conditions of variable vertical separation between the aerosol and cloud layers. Biases in MODIS retrievals of cloud properties are quantified as a function of the time gap between MODIS retrievals and in situ data. Biases in MODIS Aqua are compared with biases in MODIS Terra, and MODIS and in situ estimates of aerosol-induced changes in Nc, Re, and τ are compared.
The paper is organized as follows. In situ observations and satellite retrievals used in the study are described in Sect. 2 along with the methodology for spatiotemporal co-location of the in situ and satellite datasets. In Sect. 3, the MODIS Re, τ, and Nc are compared with in situ Re, τ, and Nc, potential sources of biases are discussed, and uncertainties and errors are quantified. In Sect. 4, MODIS estimates of aerosol-induced changes in Re, τ, and Nc over the southeast Atlantic are compared with in situ estimates. Implications for studies of ACI over the southeast Atlantic are discussed in Sect. 5. The conclusions are presented in Sect. 6.
2.1 In situ observations
In situ observations of marine stratocumulus over the southeast Atlantic were collected during ORACLES using the NASA P-3B aircraft (Redemann et al., 2021). In situ cloud sampling was conducted during vertical profiles through the stratocumulus layer (hereafter “cloud profiles”) between 10∘ W and 15∘ E and between 5∘ N and 20∘ S in September 2016, August 2017, and October 2018 (G22). For each cloud profile, data from in situ cloud probes were used to derive the number distribution function (n(D)) for droplets with diameters (D) between 3 and 19 200 µm. The cloud probes used during ORACLES included a cloud and aerosol spectrometer (CAS) (Baumgardner et al., 2001), three cloud droplet probes (CDPs) (Lance et al., 2010), a two-dimensional stereo probe (2D-S) (Lawson et al., 2006), a phase Doppler interferometer (PDI) (Chuang et al., 2008), and a high volume precipitation sampler (HVPS-3) (Lawson et al., 1998). A King hot-wire probe (King et al., 1978) measured LWC (hereafter, King LWC). A passive cavity aerosol spectrometer probe (PCASP) (Cai et al., 2013) measured n(D) for accumulation-mode aerosols (0.1<D<3 µm).
The Airborne Data Processing and Analysis software package (Delene, 2011) was used to process the CAS, CDP, King hot-wire, and PCASP data. The University of Illinois/Oklahoma Optical Array Probe Processing Software (UIOOPS) (McFarquhar et al., 2018) was used to process the 2D-S and HVPS-3 data. A merged droplet size distribution was calculated using the CAS or CDP dataset for 3<D<50 µm, the 2D-S dataset for 50<D<1050 µm, and the HVPS-3 dataset for D>1050 µm. Nc was calculated by integrating droplet n(D) from the merged size distribution. Each 1 Hz data sample with Nc>10 cm−3 and King LWC >0.05 g m−3 was identified as in cloud. Na was calculated by integrating the PCASP n(D) for out-of-cloud data samples.
Due to overlapping measurement ranges, the CAS, the CDPs, and the PDI provided at least two independent measurements of n(D) for 3<D<50 µm during each flight (G22). Data from one probe were chosen for inclusion in the merged size distribution based on the availability of valid measurements from the CAS, CDPs, or PDI and through comparisons of Nc and LWC between the CAS, CDP, and PDI datasets The CAS was used to represent droplets with 3<D<50 µm for research flights from ORACLES 2016 and the CDPs for research flights from ORACLES 2017 and 2018 (see G22 for justification and more details). The CAS n(D) for ORACLES 2016 was scaled using the King LWC for reference due to a potential sizing bias based on comparisons between the CAS LWC, CDP LWC, and King LWC (G22). The methodology for scaling the 2016 CAS n(D) is described in Appendix A, along with its impact on this study. The uncertainties associated with the in situ measurements of Nc, Re, and τ are discussed in Appendix B.
For each individual vertical transect through marine stratocumulus, cloud top height (ZT) and cloud base height (ZB) were defined as the highest and the lowest altitude, respectively, with Nc and King LWC greater than 10 cm−3 and 0.05 g m−3, respectively (G21). Cloud thickness (H) was defined as the difference between ZT and ZB. During the ORACLES deployments, the average H was about 201 m (G22). Re and the effective variance (Ve) for the merged size distribution were calculated following Hansen and Travis (1974) as
and
Re can also be defined in terms of Rv (the mean volume radius) as
where k is the droplet spectral width, which is a function of the skewness (a) and dispersion (d) of the droplet size distribution (Martin et al., 1994). K can vary depending on the aerosol conditions, occurrence of drizzle, cloud adiabaticity, and height in cloud (McFarquhar and Heymsfield, 2001; Brenguier et al., 2011). LWC was calculated as
where h is the height above ZB and pw is the liquid water density. At a height h in cloud, LWC is a function of the average Nc and Rv following Eq. (3). LWP and King LWP were calculated by integrating LWC and King LWC over h from ZB to ZT. τ was calculated as
where βext is the cloud extinction and the extinction efficiency (Qext) for cloud droplets is assumed to be 2 (Hansen and Travis, 1974) in the limit of geometric optics. The integrals in Eqs. (1), (3), and (4) were converted to discrete sums corresponding to the cloud probe size bins for D>3 µm with a maximum drop size limit of 19 200 µm.
2.2 Satellite retrievals
The MODIS instrument onboard Terra and Aqua acquires passive retrievals of radiance at non-absorbing and liquid water absorbing spectral bands (Platnick et al., 2003). Re and τ are retrieved using the bispectral retrieval method with the 0.86 µm band paired with the 1.6, 2.1, or 3.7 µm band (Nakajima and King, 1990). Re and τ from the MODIS Collection 6/6.1 Level 2 product (C6) (Platnick et al., 2017a) at 1 km resolution are used. Three retrievals were made for Re (Re16, Re21, and Re37) by pairing the 0.86 µm band with the 1.6, 2.1, and 3.7 µm band, respectively. Consistent with previous studies (e.g., PZ11), Re21 was used as the primary retrieval, and MODIS Re hereafter refers to Re21. The wavelength dependence of MODIS τ is not examined, as τ is mainly determined by the reflectance from the non-absorbing band (King et al., 1998).
Re16, Re21, and Re37 represent Re at two to four optical depths below the cloud top, depending on liquid water absorption and a weighting function based on the vertical penetration of photons into cloud (McFarquhar and Heymsfield, 1998; Platnick, 2000). Re37 corresponds to the level closest to the cloud top, followed by Re21 and Re16 in order of increasing distance from the cloud top. In an upgrade from the MODIS Collection 5.1 (C5) product, which reported Re21, Re21 minus Re16, and Re21 minus Re37, the MODIS C6 product reported Re16, Re21, and Re37 separately. Thus, biases in Re16 and Re37 associated with the condition of a successful Re21 retrieval are removed (Platnick et al., 2017b) and Re16, Re21, and Re37 can be compared (Sect. 3). Within the ORACLES sampling domain (10∘ W to 15∘ E and 5∘ N to 20∘ S; Fig. 1), Re16, Re21, and Re37 from the C6 product can be up to 2 µm lower than the corresponding retrievals from the C5 product (Rausch et al., 2017).
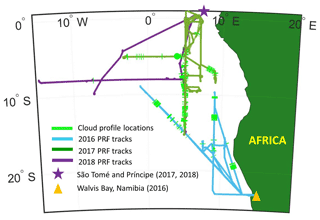
Figure 1ORACLES flight tracks, bases of operations, and sampling locations for profiles with a MODIS retrieval co-located with in situ data for ΔT less than 3600 s.
The MODIS retrievals are integrated quantities which do not describe the vertical structure of the cloud. In the absence of in situ data, the vertical profiles of LWC and Rv can be approximated using the adiabatic model to parameterize Nc and LWP as functions of τ and Re (Brenguier et al., 2000; Szczodrak et al., 2001). The adiabatic LWC was defined as
where Cw is the condensation rate and the subscript “ad” represents the adiabatic equivalent of a variable. Equations (1) to (4) were combined with Eq. (5) to determine τad and LWPad following Brenguier et al. (2000) and Szczodrak et al. (2001), respectively, as
and
Using Eq. (5), Nc was parameterized in terms of τ and Re following Szczodrak et al. (2001) as
where α is the adiabaticity, defined as LWP divided by LWPad. MODIS Nc was calculated using MODIS Re and τ based on Eq. (7).
2.3 Data selection and co-location
MODIS data with valid retrievals within the ORACLES sampling domain (10∘ W to 15∘ E and 5∘ N to 20∘ S; Fig. 1) were used. The Terra and Aqua satellites pass over the Equator at about 10:30 and 13:30 LT, respectively. Most cloud profiles from ORACLES were flown within 1 to 2 h of 12:00 UTC. The time range between the first and final cloud profiles during each flight is listed in Table 1. The time gap between the MODIS scan and the in situ sampling for a cloud profile was designated as ΔT. The analysis was limited to cloud profiles with a co-located MODIS retrieval with ΔT less than 3600 s. This assumes that the cloud layer did not undergo significant changes within 1 h. This assumption was tested by comparing MODIS retrievals against in situ measurements for different upper bounds of ΔT (Sect. 3).
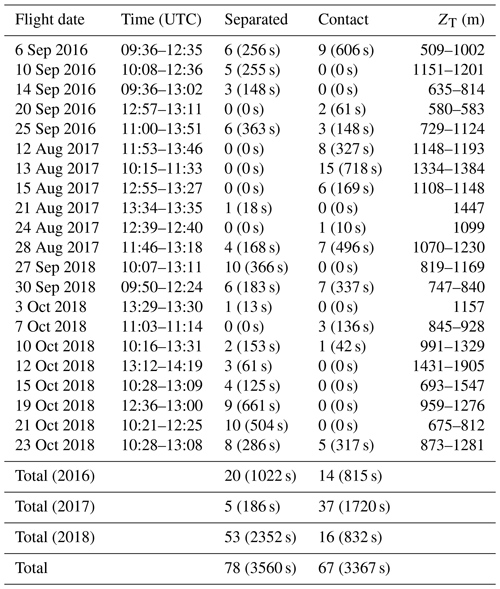
Table 1List of research flights analyzed and the time range, number, sampling duration (in parentheses), and cloud top height (ZT) for profiles with a co-located MODIS retrieval with a time gap (ΔT) of less than 3600 s. Number and duration are listed for profiles classified by above-cloud aerosol location.
MODIS retrievals were co-located with in situ data following the criteria outlined by PZ11. The pixel closest to the cloud top latitude and longitude during a cloud profile was selected. The location of the selected pixel was adjusted to account for advection of the cloud field using the mean wind speed and direction during the profile from the Turbulent Air Motion Measurement System (Thornhill et al., 2003) on the NASA P-3 aircraft. The wind speed was between 5 to 10 m s−1, which meant that the pixel location was adjusted by a distance of up to 18 to 36 km over an hour on average. The MODIS Re and τ were averaged over a 5 × 5 pixel domain centered on the adjusted pixel to account for spatial inhomogeneity. The profile was rejected if, after adjusting for advection, the pixel was less than three pixels from the edge of the MODIS scan and if more than 10 % of the retrievals within the 5 × 5 pixel domain, i.e., at least three out of the 25 pixels, were invalid. Estimates of ZT and cloud top temperature (TT) from the MODIS C6 product were used to limit the analysis to warm, boundary-layer clouds. Four profiles were excluded from the analysis since the MODIS ZT was greater than 2500 m or MODIS TT was less than 273 K.
With the above criteria, at least one cloud profile from 21 research flights conducted during ORACLES had a co-located MODIS retrieval with ΔT<3600 s (Table 1). There were 74 cloud profiles with co-located MODIS Terra retrievals and 71 cloud profiles with co-located MODIS Aqua retrievals (Table 2). ΔT was evenly distributed, with 10 to 15 cloud profiles within every 300 s bin from 0 to 3600 s (except from 1200 to 1800 s) (Fig. 2a). For 97 out of the 145 cloud profiles, the distance between the cloud profile location and the MODIS pixel after adjusting for advection was below 12 km (Fig. 2b). The distance was greater than 36 km for five profiles.
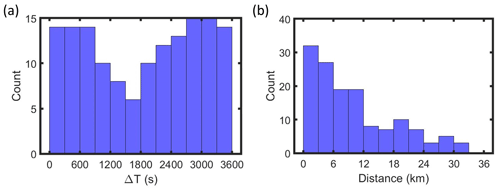
Figure 2Histograms of (a) the time gap between a cloud profile and the co-located MODIS scan (ΔT) and (b) the distance between a cloud profile and the co-located MODIS pixel after adjusting for advection.
3.1 Re comparisons
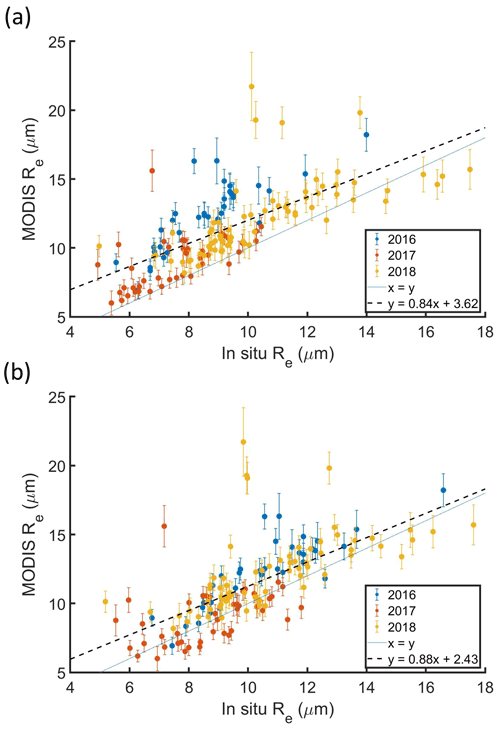
MODIS Re was compared with the in situ Re averaged over the top 10 % of the cloud layer sampled during cloud profiles with a co-located MODIS retrieval with ΔT<3600 s (Fig. 3a). The difference between the MODIS Re and in situ Re for a cloud profile was termed ΔRe, with a positive ΔRe indicating that the MODIS Re was greater than the in situ Re. The average MODIS Re (11.3 µm) was greater than the average in situ Re (9.7 µm), with Pearson's correlation coefficient (R) = 0.77 and the root mean square error (RMSE) = 2.5 µm. All but 12 cloud profiles had a positive ΔRe. The average ΔRe was 1.6 ± 1.8 µm, where the uncertainty estimate represents the sum of the average retrieval uncertainty for the MODIS Re from the C6 product and the measurement uncertainty for the average in situ Re (Appendix B). Previous comparisons between airborne measurements and MODIS retrievals of Re for warm clouds have shown similar ΔRe values. For example, the MODIS Re and in situ Re with ΔT<3600 s for marine stratocumulus over the southeast Pacific had an average ΔRe of 2.1 µm (PZ11). The MODIS Re and in situ Re with ΔT<1500 s for liquid clouds over the North Atlantic had an average ΔRe of 1.7 µm (Painemal et al., 2021).
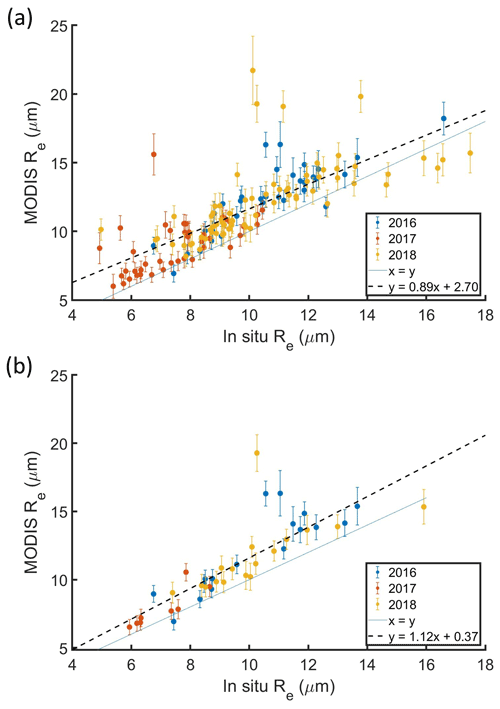
Figure 3MODIS Re versus in situ Re for profiles with a MODIS retrieval co-located with in situ data for ΔT (a) less than 3600 s and (b) less than 900 s, colored by ORACLES deployment year. Each point represents a cloud profile with the in situ Re averaged over the top 10 % of the cloud and the MODIS Re averaged over a 5 × 5 pixel domain.
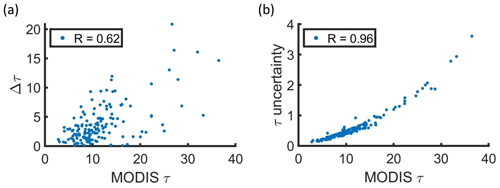
There were 104 profiles with ΔRe less than ±2 µm, while eight profiles had ΔRe>5 µm (Fig. 4a). ΔRe was well correlated with MODIS Re (R=0.62), and seven out of eight profiles with ΔRe>5 µm had MODIS Re>15 µm (Fig. 4a). The average ΔRe and RMSE decreased from 1.6 to 1.4 and 2.5 to 1.8, respectively, when 13 profiles with MODIS Re>15 µm were removed. The MODIS Re retrieval uncertainty (5 % to 15 %) was poorly correlated with ΔRe (Fig. 4b). For lower bounds of ΔT, the average ΔRe and RMSE decreased and the correlation between MODIS Re and in situ Re increased (Table 3). Among the 42 cloud profiles with a co-located MODIS retrieval with ΔT<900 s, three of the profiles had ΔRe>5 µm (Fig. 3b). All three of these profiles were associated with MODIS Re>15 µm.
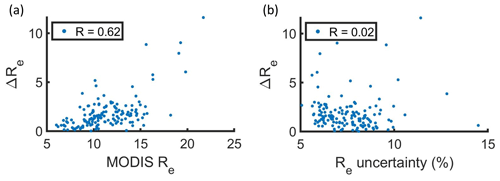
Figure 4Magnitude of the difference between MODIS Re and in situ Re (ΔRe) for profiles with a MODIS retrieval co-located with in situ data for ΔT less than 3600 s as functions of (a) MODIS Re and (b) MODIS Re uncertainty. Each point represents the average over a 5 × 5 pixel domain.
Table 3Average bias (Δ), root mean square error (RMSE), and Pearson's correlation coefficient (R) for MODIS (Terra, Aqua, combined) retrievals relative to in situ Re, τ, and Nc for different ΔT.
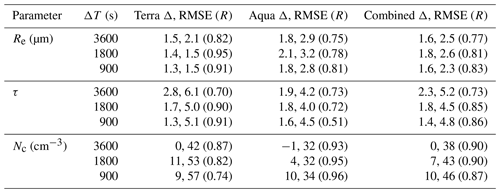
MODIS Re was retrieved by MODIS Aqua for five out of the eight profiles with ΔRe>5 µm. Consequently, retrievals from MODIS Aqua had a higher average ΔRe and a lower correlation with in situ Re compared to retrievals from MODIS Terra (Table 3). This was despite the lower average ΔT for retrievals from MODIS Aqua (1650 s) compared to retrievals from MODIS Terra (2020 s). The solar (μo) and sensor (μ) zenith angles for MODIS Aqua and MODIS Terra were obtained from the MODIS C6 product. There were minor differences between the average μo and μ for MODIS Terra (24.0 and 43.0∘) and MODIS Aqua (29.7 and 40.0∘) (Fig. 5). The MODIS Re and ΔRe had weak correlations with μo (R=0.18 and 0.16) and μ ( and −0.09), which suggests that μo and μ had little impact on the performance of MODIS Terra relative to MODIS Aqua.
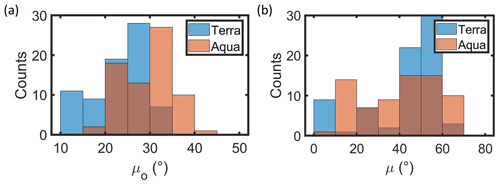
Figure 5Histograms of (a) solar zenith angle (μo) and (b) sensor zenith angle (μ) for MODIS retrievals co-located with in situ data for ΔT less than 3600 s.
Re16, Re21, and Re37 were compared (Fig. 6) to determine whether ΔRe was dependent on the use of Re21 as the primary retrieval. The average Re16, Re21, and Re37 were 10.4, 11.3, and 11.7 µm, respectively. The average Re16 and Re21 had statistically significant differences, while the average Re21 and Re37 had statistically insignificant differences. The latter was consistent with global analyses that found that Re37 minus Re21 depends on cloud regime, with positive values (0 to 0.6 µm) for homogeneous marine stratocumulus (Zhang and Platnick, 2011; Fu et al., 2019). Differences between Re16, Re21, and Re37 are associated with differences in the vertical penetration of photons into the cloud. The penetration depth decreases with increasing wavelength from 1.6 to 3.7 µm (Platnick, 2000). An increase in Re with height in cloud (G22) resulted in Re16<Re21<Re37. Although Re21 minus Re37 depends on μo, the average μo for ORACLES (26.8∘) was lower than the range of μo (65 to 70∘) for which Re37 minus Re21 exceeds 1 µm (Grosvenor and Wood, 2014). Consistent with Zhang and Platnick (2011), the correlation between Re21 and Re16 (or Re37) decreased for values above 15 µm (Fig. 6). For values below 15 µm, Re16, Re21, and Re37 had an average of 9.9, 10.8, and 11.1 µm, respectively, and there was high correlation between Re16 and Re21 (R=0.92) and Re21 and Re37 (R=0.95). Thus, MODIS Re had a positive bias regardless of the retrieval wavelength. On average, Re21 had lower retrieval uncertainty (0.8 µm) compared to Re16 (1.9 µm) and Re37 (1.1 µm), which suggests that Re21 gives a robust estimate of the average ΔRe.
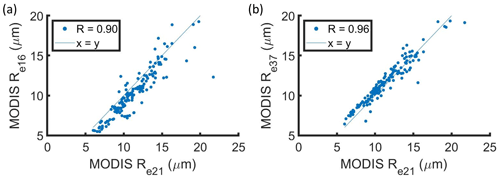
Figure 6(a) Re16 and (b) Re37 as functions of Re21 for MODIS retrievals co-located with in situ data for ΔT less than 3600 s. Each point represents average values over a 5 × 5 pixel domain.
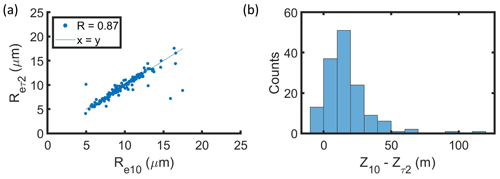
Since each MODIS Re retrieval penetrates at least two optical depths into cloud, the altitude and in situ Re at the level of two optical depths below the cloud top (Zτ2 and Reτ2) were compared with the altitude and in situ Re averaged over the top 10 % of the cloud (Re10 and Z10). Reτ2 and Re10 were strongly correlated (R=0.87), with average values of 9.4 and 9.7 µm, respectively (Fig. 7a). Reτ2 was less than Re10 because the average Zτ2 was 17 m lower than Z10 (Fig. 7b) and Re increased with height in cloud (G22). When five profiles with Re>15 µm were removed, Reτ2 and Re10 had average values of 9.3 and 9.4 µm, respectively, with improved correlation (R=0.95). The average difference between Reτ2 and Re10 (0.3 µm) was lower than the average ΔRe between MODIS Re and Re10 (1.7 µm). Thus, the choice of Re10 did not have a large impact on the average ΔRe.
3.2 τ comparisons
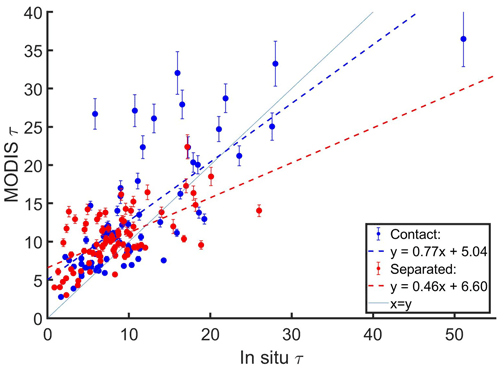
For profiles with a co-located MODIS retrieval with ΔT<3600 s, the average MODIS τ (11.7) was greater than the average in situ τ (9.4), with R=0.73 and RMSE = 5.2 (Fig. 8a). Δτ was defined as the difference between MODIS τ and in situ τ for a cloud profile, with positive values indicating that MODIS τ was higher. The average Δτ was 2.3 ± 3.4, where the uncertainty estimate represents the sum of the average retrieval uncertainty for MODIS τ from the C6 product and the measurement uncertainty for the average in situ τ (Appendix B). Nine profiles with MODIS τ>25 had an average Δτ of 8.1, with six of the profiles having Δτ>±10. When profiles with MODIS τ>25 were removed, the average Δτ and RMSE decreased from 2.3 to 2.0 and from 5.2 to 4.2, respectively. Retrievals from MODIS Terra had lower Δτ and better correlation with in situ τ compared to retrievals from MODIS Aqua (Table 3). The average Δτ decreased and the correlation between MODIS τ and in situ τ improved for profiles with lower ΔT (Table 3). This is consistent with the time-dependent improvement in correlations between MODIS τ and τ retrieved using the airborne Solar Spectral Flux Radiometer during ORACLES (Chang et al., 2021).
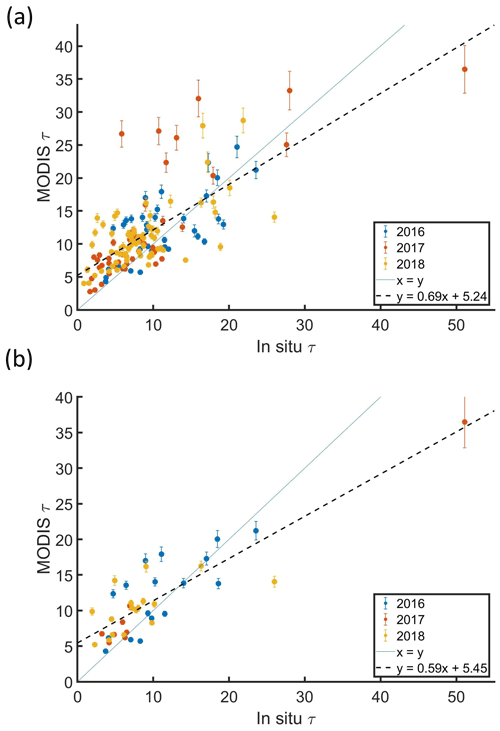
Figure 8MODIS τ versus in situ τ for profiles with a MODIS retrieval co-located with in situ data for ΔT (a) less than 3600 s and (b) less than 900 s, colored by ORACLES deployment year. Each point represents a cloud profile with the MODIS τ averaged over a 5 × 5 pixel domain.
Profiles with a co-located MODIS retrieval with ΔT<900 s had Δτ=1.4, σ(τ)=2.2, and MODIS τ uncertainty = 0.6 on average. For 24 out of the 42 profiles with a co-located MODIS retrieval with ΔT<900 s, Δτ was greater than ±2 (Fig. 8b). A single profile with ΔT<900 s had MODIS τ>25, which was associated with a Δτ of −14.6. MODIS τ can have biases relative to in situ τ due to spatial heterogeneity of the cloud field or MODIS τ retrieval uncertainties. On average, MODIS τ had a standard deviation (σ(τ)) of 2.2 over the 25 pixel domain for each cloud profile, and σ(τ) was correlated with MODIS τ (R=0.72). The Δτ increased with MODIS τ (Fig. 9a) and the MODIS τ retrieval uncertainty increased with MODIS τ (Fig. 9b). The latter is expected, given a decrease in the sensitivity of τ to the non-absorbing reflectance as τ increases (King et al., 1998). However, the average retrieval uncertainty for MODIS τ (0.6) was less than the average Δτ (2.3).
3.3 Nc comparisons
Nc calculated using MODIS Re and τ in Eq. (7) (hereafter “MODIS Nc”) was compared with in situ Nc. Figure 10 shows cloud properties as a function of normalized height above cloud base (ZN), where ZN equals Z−ZB divided by ZT−ZB. The in situ Nc was averaged over the top half of the cloud layer since entrainment mixing led to lower Nc over the top 10 % of the cloud height (Fig. 10a). Cloud-top entrainment did not affect Re near the cloud top (Fig. 10b) and hence did not impact the comparisons between MODIS and in situ Re. Eight profiles with MODIS τ<5 were removed from the Nc comparisons to avoid the impact of higher variability in MODIS retrievals for optically thin clouds (Zhang and Platnick, 2011). The exclusion of these profiles did not lead to significant changes in the Re or τ comparisons.
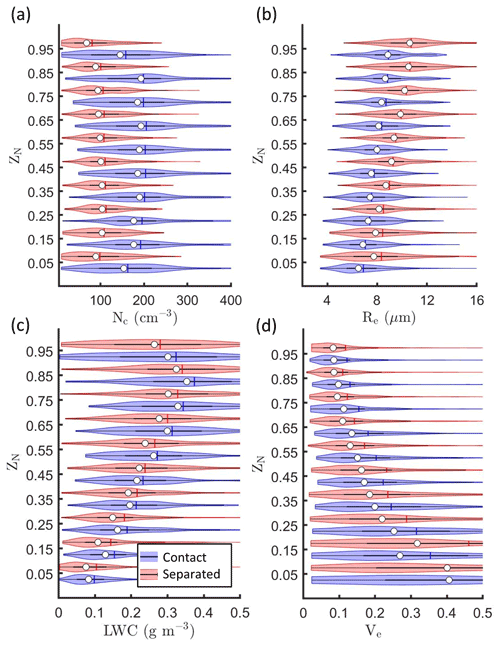
Figure 10Kernel density estimates (indicated by the width of the shaded area) and boxplots showing the mean (vertical line) and median (white circle) for (a) Nc, (b) Re, (c) LWC, and (d) Ve versus normalized height in cloud (ZN) for profiles with a MODIS retrieval co-located with in situ data for ΔT less than 3600 s.
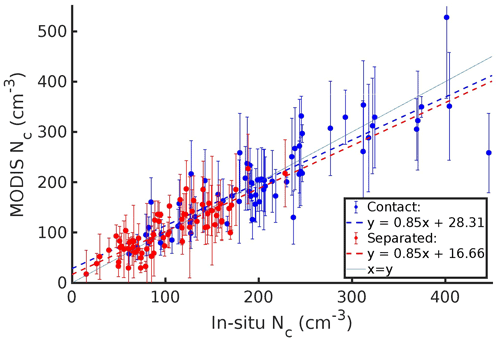
ΔNc was defined as the difference between MODIS Nc and in situ Nc for a cloud profile, with a positive ΔNc indicating that MODIS Nc was higher. For 137 profiles with a co-located MODIS retrieval with ΔT<3600 s and MODIS τ>5, the average MODIS Nc (151 cm−3) had good agreement with the average in situ Nc (151 cm−3), with R=0.90 and RMSE = 38 cm−3 (Fig. 11). The average ΔNc was 0 ± 64 cm−3, where the uncertainty estimate represents the sum of the error in calculating the average MODIS Nc (Sect. 3.3.3) and the measurement uncertainty for the average in situ Nc (Appendix B). In comparison, stratocumulus over the southeast Pacific had an average ΔNc of −4 cm−3 with R=0.94 (PZ11).
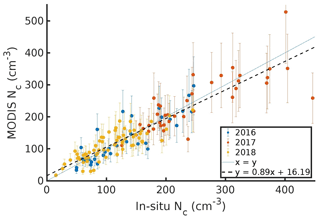
Figure 11MODIS Nc versus in situ Nc for profiles with a MODIS retrieval co-located with in situ data for ΔT less than 3600 s, colored by ORACLES deployment year. Each point represents a cloud profile with the in situ Nc averaged over the top half of the cloud and MODIS Nc calculated using MODIS Re and τ averaged over a 5 × 5 pixel domain.
Unlike the Re or τ comparisons, lower ΔT was not associated with lower ΔNc or better correlation between MODIS and in situ Nc. Further, MODIS Aqua Nc and MODIS Terra Nc had similar performance relative to in situ Nc (Table 3). There were 15 profiles with ΔNc greater than ± 50 cm−3 (average ΔNc=2 cm−3 and RMSE = 89 cm−3). These profiles were associated with higher variability in the in situ data, with an average standard deviation of 68 cm−3 for the in situ Nc. Similarly, the three profiles with ΔNc>±100 cm−3 had an average standard deviation of 86 cm−3 for the in situ Nc. The correlation between MODIS Nc and in situ Nc increased to 0.93 and the RMSE decreased to 31 cm−3 when these three profiles were removed. For 50 % of the profiles, ΔNc was below ±20 cm−3, which highlights the validity of the adiabatic assumption (Brenguier et al., 2000; Szczodrak et al., 2001) and the precision of the in situ estimates of k, Cw, and α (0.76, 2.94 g m−3 km−1, and 0.74). The agreement between the average MODIS Nc and in situ Nc was driven by compensating uncertainties associated with the parameters used in Eq. (7), as has been reported previously (PZ11; Grosvenor and Wood, 2014). These uncertainties were examined along with their impact on the calculation of MODIS Nc.
3.3.1 Uncertainties associated with Cw, α, and k
MODIS does not retrieve the vertical profile of LWC. Parameters that represent the estimated rate of condensation with height in cloud (Cw) and the ratio of the vertical integrals of LWC and LWCad (α) can provide the largest sources of error in MODIS Nc (Janssen et al., 2011; Min et al., 2012). α had a negative correlation with H (Fig. 12) (Min et al., 2012; Braun et al., 2018) and Cw was a function of cloud base pressure and temperature (Brenguier et al., 2000). Based on the range of estimates in the existing literature, Cw and α contribute a factor ranging from 0.9 to 1.5 in Eq. (7) (Merk et al., 2016, and references therein). For 142 profiles with a co-located MODIS retrieval with ΔT<3600 s and LWPad>5 g m−2, the average Cw and α were 2.94 ± 0.21 g m−3 km−1 and 0.74 ± 0.26, respectively, where the uncertainty estimates represent one standard deviation. These values of Cw and α resulted in a factor of 1.47 in Eq. (7). In comparison, PZ11 assumed Cw=2 g m−3 km−1 and α=1, with Cw and α contributing a factor of 1.41 in Eq. (7). Using Cw=2 and α=1 in Eq. (7) would decrease MODIS Nc, and the average ΔNc would change to −6 cm−3 (from 0.1 cm−3 when Cw=2.94 and α=0.74 were used) while the RMSE remained unchanged.
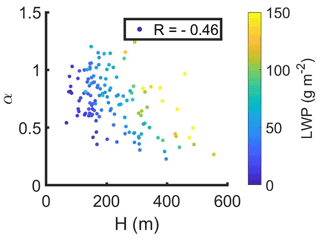
Figure 12Cloud adiabaticity (α) versus cloud thickness (H) colored by liquid water path (LWP) for profiles with a MODIS retrieval co-located with in situ data for ΔT less than 3600 s.
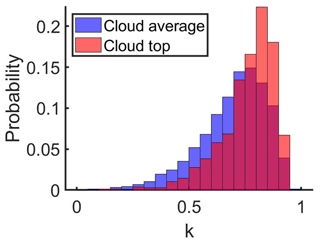
k represents the spectral width, which decreases when droplet size distributions get narrower. Consistent with PZ11, k averaged over the top 10 % of the cloud layer (0.76 ± 0.12) was higher than k averaged over the entire cloud layer (0.70 ± 0.15) (Fig. 13), where the uncertainty estimates represent one standard deviation. Since MODIS Re corresponds to values near the cloud top, k=0.76 was used in Eq. (7). Using k=0.70 would increase MODIS Nc and the average ΔNc and RMSE would change to 13 and 42 cm−3, respectively (from 0 and 38 cm−3 when k=0.76 was used). The value of the cloud top k (0.76) was consistent with the k calculated for marine clouds with entrainment mixing, where k decreased when α decreased (Brenguier et al., 2011). In comparison, a higher k (0.8) has been calculated for marine clouds without entrainment mixing (Martin et al., 1994). The decrease in Nc and LWC near the cloud top with increasing Re was indicative of inhomogeneous mixing (Fig. 10), and spectral broadening due to entrainment or drizzle (Sinclair et al., 2021) would explain the higher values for k near the cloud top (Fig. 13).
3.3.2 Uncertainties associated with MODIS Re and τ
The MODIS algorithm assumes a vertically homogeneous Re and LWC (King et al., 1998), but Re and LWC increased almost linearly with height (LWC decreased near the cloud top due to entrainment mixing) (Fig. 10b, c). The impact of this inconsistency was examined by quantifying ΔNc for profiles with large MODIS biases in Re or τ. The average ΔNc for nine profiles with MODIS τ>25 (average Δτ=8.1) and 10 profiles with MODIS τ>5 and MODIS Re>15 µm (average ΔRe=4.4 µm) was −8 and −15 cm−3, respectively. The magnitude of ΔNc was greater than 50 cm−3 for only two profiles with MODIS τ>25 and zero profiles with MODIS Re>15 µm. This suggests that a large bias in MODIS Re or τ did not necessarily result in a large bias in MODIS Nc.
The MODIS algorithm used a modified gamma distribution function to represent the droplet spectrum assuming Ve (Eq. 1) to be 10 % (Platnick et al., 2017b). For such size distributions, k is related to Ve as k= (1−Ve) × (1−2Ve) and Ve=10 % corresponds to k=0.72 (Grosvenor et al., 2018). For ORACLES, Ve decreased with height (Fig. 10d), with a median cloud top Ve of 8.4 %, corresponding to k=0.76. The a priori assumption of Ve=10 % could lead to biases of up to 1 µm for MODIS Re (Chang and Li, 2002). Radiative transfer simulations to quantify the MODIS Re bias associated with Ve were beyond the scope of this study. It is assumed the uncertainties associated with instrument error and atmospheric corrections were included in the retrieval uncertainty estimates in the MODIS C6 product.
The presence of drizzle could introduce biases into MODIS Re or Nc due to the lower k associated with spectral broadening (Sinclair et al., 2021), higher Ve for a bimodal size distribution (Nakajima et al., 2010), or lower α due to cloud water removal through precipitation (Braun et al., 2018). However, the average rain rate for ORACLES was too low (0.06 mm h−1) (G22) for drizzle to have a major impact on the Re retrievals (Zinner et al., 2010; PZ11). This was supported by the positive values for Re37 minus Re21, which represent size distributions without a significant drizzle mode (Nakajima et al., 2010). The impact of cloud water removal through precipitation was included by using the in situ α (0.74) in Eq. (7).
3.3.3 MODIS Nc error analysis
The total error for MODIS Nc from Eq. (7) was quantified using the propagation of measurement uncertainties associated with k, Cw, and α and retrieval uncertainties associated with MODIS Re and τ. Assuming that the covariances were normally distributed and random, the total error can be calculated using Gaussian error propagation as
where δ represents the error for each variable. For MODIS Re and τ, the error was defined as the average of the retrieval uncertainty provided within the MODIS C6 product (7.5 % and 5 %, respectively). For k, Cw, and α, the error was defined as one standard deviation (16 %, 7.1 %, and 35 % of their averages).
Based on Eq. (8), MODIS Nc had an error of 30.5 %. This was smaller than previous estimates of 38 % (Janssen et al., 2011) and 78 % (Grosvenor et al., 2018). Consistent with Grosvenor et al. (2018), Re was the parameter with the largest contribution to the total error in MODIS Nc, followed by α and k. Profiles with MODIS Re>15 µm and an average ΔRe of 4.4 µm had an average ΔNc of −15 cm−3, highlighting the compensation of the Re uncertainty in Eq. (7) by the other parameters. The MODIS Nc calculated using in situ estimates of k, Cw, and α from ORACLES was higher than the MODIS Nc determined using a priori assumptions for k, Cw, and α. For example, substituting Cw=2 g m−3 km−1, α=1 (PZ11), and k=0.8 (Martin et al., 1994) into Eq. (7) would introduce a factor which was 9 % lower than using Cw=2.94 g m−3 km−1, α=0.74, and k=0.76. The MODIS Nc calculated based on these a priori assumptions would have an average ΔNc and RMSE of −14 and 39 cm−3, respectively (compared to 0 and 38 cm−3 using the in situ estimates).
During the ORACLES research flights, variable vertical separation was observed between biomass burning aerosols from southern Africa and marine stratocumulus over the southeast Atlantic (Redemann et al., 2021). Cloud profiles were conducted at locations of both contact and separation between the base of the aerosol layer and the top of the cloud layer. Cloud profiles with an aerosol concentration (Na) of greater than 500 cm−3 within 100 m above the cloud top were termed “contact profiles”, and cloud profiles with Na<500 cm−3 up to 100 m above the cloud top were termed “separated profiles” (G21). Across the ORACLES campaigns, 173 contact profiles were conducted with higher in situ Nc (by 87 cm−3), lower in situ Re (by 1.5 µm), and higher in situ τ (by 1.8) compared to 156 separated profiles (G22). These differences between in situ Nc, Re, and τ for contact and separated profiles were statistically significant (p<0.02), based on a two-sample t-test. Given the statistically similar sea surface temperatures, lower tropospheric stabilities, and estimated inversion strengths at the locations of contact and separated profiles, the cloud microphysical differences were attributed to aerosol–cloud interactions (G22).
A co-located MODIS retrieval with ΔT less than 3600 s was available for 67 contact and 78 separated profiles (Table 1). When the in situ Nc and Re were averaged over the top 50 % and top 10 % of the cloud, respectively, contact profiles had a higher in situ Nc (by 93 cm−3) and a lower in situ Re (1.8 µm) compared to separated profiles. Differences between the in situ Nc, Re, and τ and the MODIS Nc, Re, and τ for contact and separated profiles were compared (Table 4). For simplicity, it is assumed that the MODIS and in situ uncertainties were consistent for contact and separated profiles. This assumption allows a direct comparison of MODIS estimates of the differences between cloud properties for contact and separated profiles with in situ estimates.
Table 4Differences between the average Re, τ, and Nc for contact and separated profiles based on MODIS retrievals (Terra, Aqua, and combined) and in situ measurements. Positive values indicate contact profiles had a higher value.
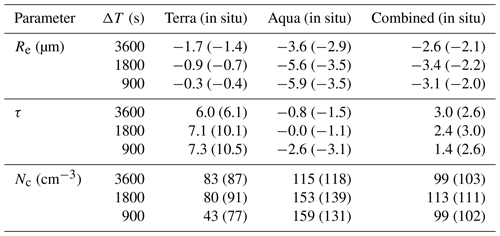
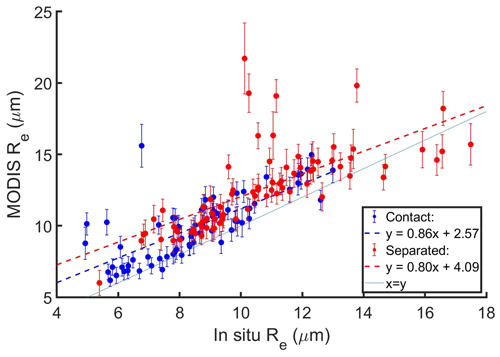
The average MODIS Re was greater than the average in situ Re for both contact and separated profiles (Fig. 14 and Table 5). Twelve out of the 13 profiles with MODIS Re>15 µm and a high average ΔRe (4.0 µm) (Fig. 4a) were classified as separated profiles, and the MODIS Re estimate (2.6 µm) for the aerosol-induced increase in Re was greater than the in situ Re estimate (2.1 µm). MODIS Re had a similar positive bias for contact and separated profiles with MODIS Re<15 µm (1.3 and 1.5 µm, respectively). Thus, when profiles with MODIS Re>15 µm were removed, the estimate of the Re difference between contact and separated profiles using MODIS Re and in situ Re were closer (1.8 and 1.6 µm, respectively). Fewer profiles with Re from MODIS Terra had MODIS Re>15 µm compared to MODIS Aqua, and closer agreement was observed between the in situ Re and MODIS Re estimates of the aerosol-induced change in Re for MODIS Terra compared to MODIS Aqua (Table 4).
Table 5The average in situ and MODIS Re, τ, and Nc for contact and separated profiles, along with R.

The average MODIS τ was greater than the average in situ τ for both contact and separated profiles (Fig. 15 and Table 5). The MODIS τ estimate (3.0) was greater than the in situ τ estimate (2.6) of the aerosol-induced increase in τ. The MODIS Terra τ underestimated the in situ τ increase from separated to contact profiles (Table 4) due to the profile with MODIS τ>25 and (Fig. 15). When nine contact profiles with MODIS τ>25 and a high average Δτ (8.1) were removed, the average MODIS τ for contact profiles (10.8) was 1.6 optical depths greater than the in situ τ. Subsequently, the MODIS τ estimate (0.5) was less than the in situ τ estimate (1.0) of the aerosol-induced increase in τ from separated to contact profiles.
The average MODIS and in situ Nc were within 5 cm−3 for both contact and separated profiles (Fig. 16 and Table 5). This meant that the MODIS estimate for the aerosol-induced increase in Nc was within 5 cm−3 of the in situ estimate. When three profiles with ΔNc>±100 cm−3 were removed, the MODIS and in situ estimates for the aerosol-induced increase in Nc were similar (95 and 94 cm−3, respectively). For MODIS Terra retrievals, the underestimation of the increase in in situ Nc from separated to contact profiles (Table 4) was driven by the profile with and MODIS τ>25 (Fig. 15). The MODIS Nc calculated using a priori assumptions for k, Cw, and α underestimated the in situ Nc for contact profiles (by 20 cm−3) and separated profiles (by 8 cm−3). The a priori MODIS Nc estimate (91 cm−3) for the increase in Nc from separated to contact profiles was slightly lower than the in situ Nc estimate (103 cm−3).
The positive biases in MODIS retrievals of cloud properties for marine stratocumulus over the southeast Atlantic were about 16 % for Re, 30 % for τ, and negligible for Nc on average. However, the biases were within the overall uncertainty (in situ + MODIS) associated with the data. In comparison, previous studies have reported MODIS biases for Re and τ of 15 to 20 % (PZ11), 17 to 24 % (Min et al., 2012), and 20 % to 40 % (Noble and Hudson, 2015), and negligible MODIS biases for Nc (PZ11, Braun et al., 2018; Gryspeerdt et al., 2022). Factors that frequently result in biases in MODIS retrievals of cloud properties include subpixel heterogeneity (Zhang and Platnick, 2011), solar and satellite viewing geometry (Grosvenor and Wood, 2014; Painemal et al., 2021), cloud thermodynamic phase (Ahn et al., 2018), and drizzle occurrence (Zinner et al., 2010; Sinclair et al., 2021). These factors had a limited impact on the MODIS retrievals used in this study due to the low latitude of the ORACLES domain and observations of homogeneous, warm, closed-cell marine stratocumulus over the southeast Atlantic with low precipitation rates (G21; G22). It is hypothesized that these biases could be reduced by addressing the in situ measurement uncertainty for k, the in situ derived uncertainty for α (e.g., Min et al., 2012; Merk et al., 2016; Braun et al., 2018; Witte et al., 2018), and the MODIS retrieval uncertainties associated with the bispectral retrieval technique (e.g., Fu et al., 2019, 2022).
Satellite estimates of the aerosol perturbation of Nc over the southeast Atlantic have biases of less than 10 % compared to the in situ estimates. The differences between the MODIS and in situ Re or τ were reduced by screening data with MODIS Re>15 µm or MODIS τ>25, respectively. This is consistent with the improvement in correlations between MODIS Nc and in situ Nc from multiple field campaigns when using a threshold of maximum Re of around 15 µm (Gryspeerdt et al., 2022). The MODIS-based screening led to MODIS estimates of aerosol-induced changes in Nc, Re, and τ that were within 5 cm−3, 0.5 µm, and 0.7 of the in situ estimates. The agreement between the MODIS and in situ estimates of aerosol-induced changes in Nc, Re, and τ was associated with consistent biases in MODIS retrievals of cloud properties across different aerosol regimes. Such agreement suggests that cloud properties for horizontally homogeneous, warm, closed-cell marine stratocumulus can be estimated using MODIS retrievals in the absence of in situ datasets.
Differences between climate model and observational estimates of the effective radiative forcing due to ACI are largely driven by uncertainties in observational estimates of the radiative forcing due to aerosol effects on cloud albedo (RFaci) (Gryspeerdt et al., 2020). Issues with satellite estimates of RFaci persist due to biases in satellite retrievals of Nc (Grosvenor et al., 2018), above-cloud aerosol properties (Meyer et al., 2015; Painemal et al., 2020; Chang et al., 2021), and aerosol perturbations of Nc (Quaas et al., 2020). Better accuracy in remote sensing retrievals of the aerosol layer is needed to constrain the uncertainties in satellite estimates of RFaci over the southeast Atlantic (Douglas and L'Ecuyer, 2020). In particular, biases in satellite estimates of the placement or optical and microphysical properties of the above-cloud aerosol layer need to be addressed (Rajapakshe et al., 2017; Painemal et al., 2020; Peers et al., 2021).
The High Spectral Resolution Lidar Generation 2 (HSRL-2) (Hair et al., 2008) was used to measure aerosol extinction and backscatter at 355, 532, and 1064 nm during all three ORACLES campaigns. Research using HSRL-2 data for estimating the vertical profile of cloud condensation nuclei is ongoing (Lenhardt, 2021). Accounting for the attenuation of upwelling solar radiation by above-cloud absorbing aerosols over the southeast Atlantic could increase the average MODIS τ and Re by up to 9 % and 2 %, respectively (Meyer et al., 2015). The Research Scanning Polarimeter (RSP) (Cairns et al., 1999) was used during ORACLES to collect polarimetric retrievals of cloud properties (Alexandrov et al., 2012) which do not operate under the assumptions required for MODIS retrievals. RSP retrievals can help examine biases in MODIS retrievals of clouds with higher precipitation rates or bimodal size distributions (Sinclair et al., 2021; Fu et al., 2022) or a complicated solar and viewing geometry (e.g., Painemal et al., 2021). Future work will use RSP retrievals combined with other airborne datasets to evaluate MODIS retrievals while accounting for above-cloud aerosols (e.g., Chang et al., 2021).
In situ measurements of Nc, Re, and τ for marine stratocumulus over the southeast Atlantic were collected during the NASA ORACLES field campaign. In situ data from 145 cloud profiles were co-located with MODIS retrievals from the Terra and Aqua satellites with ΔT less than 1 h. The average MODIS Re and τ (11.3 µm and 11.7) were greater than the average in situ Re and τ (9.7 µm and 9.4), with R=0.77 and 0.73, respectively. The average bias in MODIS Re was 1.6 ± 1.8 µm and the average bias in MODIS τ was 2.3 ± 3.4, where the uncertainty represents the sum of the average MODIS retrieval uncertainty and the in situ measurement uncertainty. MODIS Nc (151 cm−3) had an estimated calculation error of 30.5 % and showed good agreement with in situ Nc (151 cm−3), with R=0.90 and an average bias of 0 ± 64 cm−3. The retrieval uncertainty for MODIS Re provided the largest source of error in calculating MODIS Nc, but compensating uncertainties for τ, k, Cw, and α resulted in good agreement. Cloud profiles with an Nc bias greater than 50 cm−3 were associated with higher variability in the in situ Nc. The biases in MODIS Re and τ were lower for lower bounds of ΔT and for retrievals from MODIS Terra compared to MODIS Aqua. Profiles with MODIS Re>15 µm had larger biases in MODIS Re (average bias = 4.5 µm) and profiles with MODIS τ>25 had larger biases in MODIS τ (average bias = 8.1).
Variability in the vertical profile of absorbing aerosols over the southeast Atlantic was associated with changes in Nc, Re, and τ under similar meteorological conditions. There were 67 “contact” profiles where Na>500 cm−3 was sampled within 100 m above cloud tops, while 78 “separated” profiles had Na<500 cm−3 up to 100 m above cloud tops. Contact profiles had higher in situ Nc and τ (88 cm−3 and 2.5 higher) and lower in situ Re (2.2 µm lower) compared to separated profiles. MODIS retrievals were able to estimate the signs of these aerosol-induced changes in Nc, Re, and τ. The magnitude of the MODIS estimates of differences between contact and separated profiles was within 5 cm−3, 0.5, and 0.2 µm of the in situ estimates when profiles with MODIS Re>15 µm or MODIS τ>25 were removed.
The agreement between MODIS and in situ estimates of aerosol-induced changes in cloud microphysical properties over the southeast Atlantic was associated with similar biases in MODIS retrievals across different aerosol conditions. This motivates the use of MODIS retrievals to study ACI for homogeneous marine stratocumulus over a larger domain of the southeast Atlantic and over longer timescales than is possible using in situ data. Future work will be aimed at improving lidar and polarimetric retrievals of the vertical profile and microphysical and optical properties of absorbing aerosols over the southeast Atlantic layers and the underlying cloud properties (Zeng et al., 2014; Rajapakshe et al., 2017; Painemal et al., 2020; Lenhardt, 2021).
For ORACLES 2016, CAS data were used in the analysis since CDP measurements were invalid due to an instrument misalignment issue. G22 showed there were statistically significant differences between the average CAS LWC of 0.15 ± 0.09 g m−3 (± one standard deviation) and the average King LWC of 0.28 ± 0.15 g m−3 (R=0.80). The LWC comparison provides an estimate of the uncertainties in the CAS data due to known issues such as coincidence of particles in the sample volume (Lance, 2012) and uncertainties in the collection geometry (e.g., Baumgardner et al., 2017). Comparisons between CAS and CDP Nc (when CDP data were available) indicate that the CAS may be affected by coincidence of particles within the sample volume. However, accounting for coincidence while processing the CAS data affected Nc by less than 2 %. Based on a recommendation by the manufacturers of CAS (Droplet Measurement Technologies, DMT), a sample area of 0.26 mm2 was used to process CAS droplet counts to obtain Nc instead of using 0.13 mm2 from the CAS manual.
For the six flights selected for analysis, the King LWC and CAS LWC had a best-fit slope (a) between 0.46 and 0.63 and R=0.71 to 0.93 (Table A1). Therefore, an adjustment is used to increase the CAS LWC to match the King LWC. The simplest way to do this would be to increase the CAS sample area, which is a first-order adjustment that assumes the CAS is sizing the droplets correctly. However, based on the LWC differences, it is hypothesized the CAS was undersizing the droplets passing through the CAS sample volume. The methodology outlined by PZ11 was thus used to account for the sizing bias, wherein the CAS n(D) was scaled by adjusting the CAS size bins using the King LWC as a reference by setting
The scaled midpoint diameter for the ith CAS size bin () is determined as
where Di is the midpoint diameter for the ith CAS size bin. The Di used to calculate the CAS Re and LWC is replaced by to calculate the scaled CAS Re and LWC. The CAS size bin midpoints were thus increased (by up to 30 %), since for a<1 and each flight had a<1. The average in situ Re for the 34 profiles from ORACLES 2016 with a co-located MODIS retrieval (Table 2) increased from 8.6 µm for unscaled CAS n(D) to 10.6 µm for CAS n(D) scaled using Eqs. (A1) and (A2).
Table A1ORACLES 2016 flight dates with the best-fit slope (a) and intercept (c) between the average CAS LWC and King LWC from the flight.
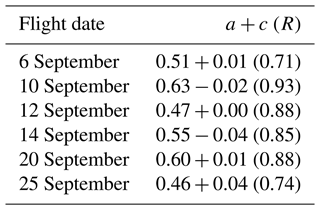
The average MODIS Re (12.4 µm) overestimated the average in situ Re from both the unscaled and the scaled CAS n(D). When the CAS n(D) was scaled, the number of profiles having in situ Re> MODIS Re increased from 0 to 2 and the average ΔRe decreased from 3.8 µm (R=0.83) to 1.8 µm (R=0.86) relative to when the CAS n(D) was unscaled. These changes were consistent with the hypothesis of CAS undersizing the droplets passing through the CAS sample volume. Since the average ΔRe for scaled CAS n(D) was consistent with previous studies (PZ11; Painemal et al., 2021), the scaled CAS n(D) was used in the analysis.
Valid CDP measurements were available for ORACLES 2017 and 2018. For the research flights from ORACLES 2017 and 2018, the average CDP LWC was 0.18 ± 0.16 and 0.21 ± 0.14 g m−3, the average King LWC was 0.21 ± 0.15 and 0.20 ± 0.12 g m−3, and the average CAS LWC was 0.09 ± 0.07 and 0.10 ± 0.07 g m−3, respectively (G22). The differences between the King LWC and the CDP LWC are within the typical uncertainties of these in situ cloud probes (Baumgardner et al., 2017). Nevertheless, the impact of scaling the CDP data was investigated using Eqs. (A1) and (A2) to determine if this would lead to qualitative changes in the results.
For 14 out of 18 flights from ORACLES 2017 and 2018, the King LWC and CDP LWC had 0.7<a<1.4 and the CDP size bin midpoints were adjusted by less than 13 % following Eq. (A2). When the CDP n(D) was scaled for the 42 profiles from ORACLES 2017, the average CDP Re increased from 7.6 to 8.7 µm, the number of profiles having in situ Re> MODIS Re increased from 2 to 21, and the average ΔRe decreased from 1.4 µm (R=0.57) to 0.3 µm (R=0.43) relative to when the CDP n(D) was unscaled. Scaling the CDP n(D) led to a decrease in the best-fit slope for MODIS Re as a function of in situ Re (0.73 to 0.50) along with an increase in the intercept (3.5 to 4.7 µm). These changes suggest the in situ Re might be overestimated when the CDP n(D) is scaled, and the unscaled CDP n(D) was thus used in the study for ORACLES 2017. Given this and the closer agreement between CDP LWC and King LWC (compared to CAS LWC and King LWC), it is unlikely that the CDP had a sizing bias like the CAS, and thus the unscaled CDP n(D) was used in the analysis.
When the CDP n(D) was scaled for the 73 profiles from ORACLES 2018, the average CDP Re increased from 10.5 to 10.8 µm, the number of profiles having in situ Re> MODIS Re increased from 9 to 15, and the average ΔRe decreased from 1.9 µm (R=0.68) to 1.6 µm (R=0.62) relative when the CDP n(D) was unscaled. The use of the scaled CDP n(D) led to small changes in the best-fit slope for MODIS Re as a function of in situ Re (0.77 to 0.73) and the intercept (4.3 to 4.5 µm). Scaling the CDP n(D) for ORACLES 2018 did not have a major impact on the CDP dataset. To remain consistent with the use of unscaled CDP data for ORACLES 2017, unscaled CDP data were used in the study for ORACLES 2018 as well.
When MODIS Re was compared with in situ Re calculated using unscaled n(D) for all three campaigns, the average ΔRe was 2.2 µm, with R=0.72 and a best-fit slope and intercept of 0.86 and 3.5 µm, respectively (Fig. A1a). In comparison, when MODIS Re was compared with in situ Re calculated using scaled n(D) for all three campaigns, the average ΔRe was 1.3 µm, with R=0.70 and a best-fit slope and intercept of 0.90 and 2.4 µm, respectively (Fig. A1b). The use of either scaled or unscaled n(D) for all three campaigns did not lead to qualitative changes in the results presented in the study. MODIS Re always had a positive bias greater than 1 µm relative to in situ Re. It must be noted that the quantitative changes highlight the uncertainties associated with in situ data, which must be considered when validating satellite retrievals using airborne datasets (Witte et al., 2018).
The error for in situ measurements of Nc, Re, and τ depend on droplet sizing and concentration uncertainties associated with limitations of instrument measurement principles and data processing algorithms (Baumgardner et al., 2017; McFarquhar et al., 2017). Although sources of in situ measurement uncertainty are relatively well known, there is no established methodology for calculating sizing and concentration uncertainties or propagating uncertainties to the error for in situ Nc, Re, or τ. A single probe is unable to characterize the entire spectrum of cloud droplets, and droplet size distributions are derived by combining number distribution functions from scattering and imaging probes (G22). This complicates uncertainty estimation and error propagation for in situ measurements. After accounting for instrument and data processing uncertainties, droplet sizing and concentration uncertainties can be ±20 % and ±50 % for imaging probes and ±50 % and ±20 % for scattering probes (Baumgardner et al., 2017).
Three approaches for estimating the error for in situ Nc, Re, and τ are examined. First, sizing and concentration uncertainties of 10 % each are assumed throughout the size distribution (Baumgardner et al., 2017) to derive a minimum estimate of the error. Second, uncertainties are estimated based on intercomparisons between cloud probes with similar measurement size ranges. Third, the standard error of the mean, defined as the standard deviation divided by the square root of the sample size, is calculated. For each variable, the maximum estimate out of the three approaches is designated as the error estimate.
For the first approach, the droplet concentration (Nc) uncertainty is 10 %. Sizing and concentration uncertainties are not always independent, and Gaussian error propagation can underestimate the error. Thus, the error (δ) in Re and τ is determined using the maximum and minimum concentrations and sizes as
where δD=0.1 D and δN(D)=0.1 N(D).
Following Eq. (B1), δτ equals 0.3 τ and δRe equals 0.1 Re. The fractional estimate for δτ is greater than the equivalent estimate from Gaussian error propagation (0.22 τ), while the estimate for δRe is equivalent to the Gaussian error estimate. Following this approach, the average in situ Nc, Re, and τ error estimates are 15 cm−3, 1.0 µm, and 2.8, respectively. For the second approach, average values of Nc, Re, and τ from the scaled CAS datasets (Appendix A) are compared with the PDI dataset for ORACLES 2016 and with the CDP datasets for ORACLES 2017 and 2018 based on data availability (G22). Across deployments, the relative difference between Nc, Re, and τ from the cloud probes was within 12.5 %, 10 %, and 21 %, respectively. Thus, the average in situ Nc, Re, and τ error estimates are 19 cm−3, 1.0 µm, and 2.0, respectively. For the third approach, the standard deviation is divided by the square root of the sample size to determine the standard error of the mean. The Nc, Re, and τ error estimates are 7.4 cm−3, 0.2 µm, and 0.5, respectively.
Using the highest error estimate out of the three approaches, the average in situ Nc, Re, and τ along with the error estimates are 150 ± 19 cm−3, 9.7 ± 1.0 µm, and 9.4 ± 2.8, respectively. Uncertainty estimates for biases in MODIS retrievals relative to in situ measurements (Sect. 3) are defined as the sum of the retrieval uncertainty and the calculation error for MODIS Nc, Re, and τ and the in situ measurement uncertainty. The average MODIS Nc was 150 ± 45 cm−3 and the bias in MODIS Nc was 0 ± 64 cm−3. The average MODIS Re was 11.3 ± 0.8 µm and the bias in MODIS Re was 1.6 ± 1.8 µm. The average MODIS τ was 11.7 ± 0.6 and the bias in MODIS τ was 2.3 ± 3.4. The average biases in MODIS retrievals relative to in situ measurements were within the MODIS retrieval and in situ measurement uncertainty for all three variables.
The University of Illinois/Oklahoma Optical Array Probe (OAP) Processing Software is available at https://doi.org/10.5281/zenodo.1285969 (McFarquhar et al., 2018). The Airborne Data Processing and Analysis software package is available at https://doi.org/10.5281/zenodo.3733448 (Delene et al., 2020).
All ORACLES data are accessible via digital object identifiers (DOIs) from the following websites: https://doi.org/10.5067/Suborbital/ORACLES/P3/2018_V2 (ORACLES Science Team, 2020a), https://doi.org/10.5067/Suborbital/ORACLES/P3/2017_V2 (ORACLES Science Team, 2020b), and https://doi.org/10.5067/Suborbital/ORACLES/P3/2016_V2 (ORACLES Science Team, 2020c). The MODIS Collection 6 Cloud Product is available at https://doi.org/10.5067/MODIS/MOD06_L2.061 (Platnick et al., 2017a).
SG designed the study and analyzed the data with guidance from GMM and inputs from IC, LG, FX, and JR. JRO'B, DJD, and MRP processed the cloud probe and PCASP data. SG processed 2D-S and HVPS-3 data. All authors were involved with the ORACLES field campaign. GMM, MRP, and JR acquired funding. SG wrote the manuscript with guidance from GMM and reviews from all co-authors.
The contact author has declared that none of the authors has any competing interests.
Publisher’s note: Copernicus Publications remains neutral with regard to jurisdictional claims in published maps and institutional affiliations.
This article is part of the special issue “New observations and related modelling studies of the aerosol–cloud–climate system in the Southeast Atlantic and southern Africa regions (ACP/AMT inter-journal SI)”. It is not associated with a conference.
We acknowledge the entire ORACLES science team for their contributions during data acquisition and analysis. We thank the NASA Ames Earth Science Project Office and the NASA P-3B crew for logistical and aircraft support. Some of the computing for this project was performed at the OU Supercomputing Center for Education & Research (OSCER) at the University of Oklahoma (OU).
This research has been supported by the NASA Award #80NSSC18K0222. ORACLES is funded by NASA Earth Venture Suborbital-2 grant NNH13ZDA001N-EVS2. Siddhant Gupta received funding by NASA headquarters under the NASA Earth and Space Science Fellowship grants (grant nos. NNX15AF93G, NNX16A018H, 80NSSC18K0222).
This paper was edited by Matthias Tesche and reviewed by two anonymous referees.
Adebiyi, A. A. and Zuidema, P.: The role of the southern African easterly jet in modifying the southeast Atlantic aerosol and cloud environments, Q. J. Roy. Meteor. Soc., 142, 1574–1589, https://doi.org/10.1002/qj.2765, 2016.
Ahn, E., Huang, Y., Siems, S. T., and Manton, M. J.: A comparison of cloud microphysical properties derived from MODIS and CALIPSO with in situ measurements over the wintertime Southern Ocean, J. Geophys. Res.-Atmos., 123, 11120–11140, https://doi.org/10.1029/2018JD028535, 2018.
Albrecht, B.: Aerosols, Cloud Microphysics, and Fractional Cloudiness, Science, 245, 1227–1230, 1989.
Alexandrov, M. D., Cairns, B., Emde, C., Ackerman, A. S., and van Diedenhoven, B.: Accuracy assessments of cloud droplet size retrievals from polarized reflectance measurements by the research scanning polarimeter, Remote Sens. Environ., 125, 92–111, https://doi.org/10.1016/j.rse.2012.07.012, 2012.
Baumgardner, D., Jonsson, H., Dawson, W., Connor, D. O., and Newton, R.: The cloud, aerosol and precipitation spectrometer (CAPS): A new instrument for cloud investigations, Atmos. Res., 59, 59–60, 2001.
Baumgardner, D., Abel, S. J., Axisa, D., Cotton, R., Crosier, J., Field, P., Gurganus, C., Heymsfield, A., Korolev, A., Kraemer, M., Lawson, P., McFarquhar, G., Ulanowski, Z., and Um, J.: Cloud ice properties: in situ measurement challenges, Meteor. Monographs, 58, 9.1–9.23, https://doi.org/10.1175/AMSMONOGRAPHS-D-16-0011.1, 2017.
Boucher, O., Randall, D., Artaxo, P., Bretherton, C., Feingold, G., Forster, P., Kerminen, V.-M., Kondo, Y., Liao, H., Lohmann, U., Rasch, P., Satheesh, S. K., Sherwood, S., Stevens, B., and Zhang, X. Y.: Clouds and Aerosols. In: Climate Change 2013: The Physical Science Basis, Contribution of Working Group I to the Fifth Assessment Report of the Intergovernmental Panel on Climate Change, edited by: Stocker, T. F., Qin, D., Plattner, G.-K., Tignor, M., Allen, S. K., Boschung, J., Nauels, A., Xia, Y., Bex, V., and Midgley, P. M., Cambridge University Press, Cambridge, United Kingdom and New York, NY, USA, 571–657, https://www.ipcc.ch/site/assets/uploads/2018/02/WG1AR5_Chapter07_FINAL-1.pdf (last access: 29 September 2022), 2013.
Braun, R. A., Dadashazar, H., MacDonald, A. B., Crosbie, E., Jonsson, H. H., Woods, R. K., Flagan, R. C., Seinfeld, J. H., and Sorooshian, A.: Cloud Adiabaticity and Its Relationship to Marine Stratocumulus Characteristics Over the Northeast Pacific Ocean, J. Geophys. Res.-Atmos., 123, 13790–13806, https://doi.org/10.1029/2018JD029287, 2018.
Brenguier, J.-L., Pawlowska, H., Schüller, L., Preusker, R., Fischer, J., and Fouquart, Y.: Radiative properties of boundary layer clouds: Droplet effective radius versus number concentration, J. Atmos. Sci., 57, 803–821, 2000.
Brenguier, J.-L., Burnet, F., and Geoffroy, O.: Cloud optical thickness and liquid water path – does the k coefficient vary with droplet concentration?, Atmos. Chem. Phys., 11, 9771–9786, https://doi.org/10.5194/acp-11-9771-2011, 2011.
Cai, Y., Snider, J. R., and Wechsler, P.: Calibration of the passive cavity aerosol spectrometer probe for airborne determination of the size distribution, Atmos. Meas. Tech., 6, 2349–2358, https://doi.org/10.5194/amt-6-2349-2013, 2013.
Cairns, B., Russell, E. E., and Travis, L. D.: The Research Scanning Polarimeter: Calibration and ground-based measurements, in: Polarization: Measurement, Analysis, and Remote Sensing II, Denver, Col., 18 July 1999, Proc. SPIE, vol. 3754, 186, https://doi.org/10.1117/12.366329, 1999.
Chang, F.-L. and Li, Z.: Estimating the vertical variation of cloud droplet effective radius using multispectral near-infrared satellite measurements, J. Geophys. Res., 107, 4257, https://doi.org/10.1029/2001JD000766, 2002.
Chang, I., Gao, L., Burton, S. P., Chen, H., Diamond, M., Ferrare, R. A., Flynn, C. J., Kacenelenbogen, M., LeBlanc, S. E., Meyer, K. G., Pistone, K., Schmidt, S., Segal-Rozenhaimer, M., Shinozuka, Y., Wood, R., Zuidema, P., Redemann, J., and Christopher, S. A.: Spatiotemporal heterogeneity of aerosol and cloud properties over the southeast Atlantic: An observational analysis, Geophys. Res. Lett., 48, e2020GL091469, https://doi.org/10.1029/2020GL091469, 2021.
Christensen, M. W., Chen, Y.-C., and Stephens, G. L.: Aerosol indirect effect dictated by liquid clouds, J. Geophys. Res.-Atmos., 121, 14636–14650, https://doi.org/10.1002/2016JD025245, 2016.
Chuang, P. Y., Saw, E. W., Small, J. D., Shaw, R. A., Sipperley, C. M., Payne, G. A., and Bachalo, W.: Airborne Phase 495 Doppler Interferometry for Cloud Microphysical Measurements, Aerosol Sci. Technol., 42, 685–703, 2008.
Cochrane, S. P., Schmidt, K. S., Chen, H., Pilewskie, P., Kittelman, S., Redemann, J., LeBlanc, S., Pistone, K., Kacenelenbogen, M., Segal Rozenhaimer, M., Shinozuka, Y., Flynn, C., Platnick, S., Meyer, K., Ferrare, R., Burton, S., Hostetler, C., Howell, S., Freitag, S., Dobracki, A., and Doherty, S.: Above-cloud aerosol radiative effects based on ORACLES 2016 and ORACLES 2017 aircraft experiments, Atmos. Meas. Tech., 12, 6505–6528, https://doi.org/10.5194/amt-12-6505-2019, 2019.
Cochrane, S. P., Schmidt, K. S., Chen, H., Pilewskie, P., Kittelman, S., Redemann, J., LeBlanc, S., Pistone, K., Segal Rozenhaimer, M., Kacenelenbogen, M., Shinozuka, Y., Flynn, C., Ferrare, R., Burton, S., Hostetler, C., Mallet, M., and Zuidema, P.: Biomass burning aerosol heating rates from the ORACLES (ObseRvations of Aerosols above CLouds and their intEractionS) 2016 and 2017 experiments, Atmos. Meas. Tech., 15, 61–77, https://doi.org/10.5194/amt-15-61-2022, 2022.
Das, S., Harshvardhan, H., and Colarco, P. R.: The influence of elevated smoke layers on stratocumulus clouds over the SE Atlantic in the NASA Goddard Earth Observing System (GEOS) model, J. Geophys. Res.-Atmos., 125, e2019JD031209, https://doi.org/10.1029/2019JD031209, 2020.
Delene, D., Skow, A., O'Brien, J., Gapp, N., Wagner, S., Hibert, K., Sand, K., and Sova, G.: Airborne Data Processing and Analysis Software Package (Version 3981), Zenodo [code], https://doi.org/10.5281/zenodo.3733448, 2020.
Delene, D. J.: Airborne Data Processing and Analysis Software Package, Earth Sci. Inform., 4, 29–44, 2011.
Douglas, A. and L'Ecuyer, T.: Quantifying cloud adjustments and the radiative forcing due to aerosol–cloud interactions in satellite observations of warm marine clouds, Atmos. Chem. Phys., 20, 6225–6241, https://doi.org/10.5194/acp-20-6225-2020, 2020.
Douglas, A. and L'Ecuyer, T.: Global evidence of aerosol-induced invigoration in marine cumulus clouds, Atmos. Chem. Phys., 21, 15103–15114, https://doi.org/10.5194/acp-21-15103-2021, 2021.
Formenti, P., D'Anna, B., Flamant, C., Mallet, M., Piketh, S. J., Schepanski, K., Waquet, F., Auriol, F., Brogniez, G., Burnet, F., Chaboureau, J.-P., Chauvigné, A., Chazette, P., Denjean, C., Desboeufs, K., Doussin, J.-F., Elguindi, N., Feuerstein, S., Gaetani, M., Giorio, C., Klopper, D., Mallet, M. D., Nabat, P., Monod, A., Solmon, F., Namwoonde, A., Chikwililwa, C., Mushi, R., Welton, E. J., and Holben, B.: The Aerosols, Radiation and Clouds in southern Africa (AEROCLO-sA) field campaign in Namibia: overview, illustrative observations and way forward, B. Am. Meteorol. Soc., 100, 1277–1298, https://doi.org/10.1175/BAMS-D-17-0278.1, 2019.
Fu, D., Di Girolamo, L., Liang, L., and Zhao, G.: Regional biases in MODIS marine liquid water cloud drop effective radius deduced through fusion with MISR, J. Geophys. Res.-Atmos., 124, 2019JD031063, https://doi.org/10.1029/2019JD031063, 2019.
Fu, D., Di Girolamo, L., Rauber, R. M., McFarquhar, G. M., Nesbitt, S. W., Loveridge, J., Hong, Y., van Diedenhoven, B., Cairns, B., Alexandrov, M. D., Lawson, P., Woods, S., Tanelli, S., Schmidt, S., Hostetler, C., and Scarino, A. J.: An evaluation of the liquid cloud droplet effective radius derived from MODIS, airborne remote sensing, and in situ measurements from CAMP2Ex, Atmos. Chem. Phys., 22, 8259–8285, https://doi.org/10.5194/acp-22-8259-2022, 2022.
Grosvenor, D. P. and Wood, R.: The effect of solar zenith angle on MODIS cloud optical and microphysical retrievals within marine liquid water clouds, Atmos. Chem. Phys., 14, 7291–7321, https://doi.org/10.5194/acp-14-7291-2014, 2014.
Grosvenor, D. P., Sourdeval, O., Zuidema, P., Ackerman, A., Alexandrov, M. D., Bennartz, R., Boers, R., Cairns, B., Chiu, J. C., Christensen, M., Deneke, H., Diamond, M., Feingold, G., Fridlind, A., Hünerbein, A., Knist, C., Kollias, P., Marshak, A., McCoy, D., Merk, D., Painemal, D., Rausch, J., Rosenfeld, D., Russchenberg, H., Seifert, P., Sinclair, K., Stier, P., van Diedenhoven, B., Wendisch, M., Werner, F., Wood, R., Zhang, Z., and Quaas, J.: Remote Sensing of Droplet Number Concentration in Warm Clouds: A Review of the Current State of Knowledge and Perspectives, Rev. Geophys., 56, 409–453, https://doi.org/10.1029/2017RG000593, 2018.
Gryspeerdt, E., Goren, T., Sourdeval, O., Quaas, J., Mülmenstädt, J., Dipu, S., Unglaub, C., Gettelman, A., and Christensen, M.: Constraining the aerosol influence on cloud liquid water path, Atmos. Chem. Phys., 19, 5331–5347, https://doi.org/10.5194/acp-19-5331-2019, 2019.
Gryspeerdt, E., Mülmenstädt, J., Gettelman, A., Malavelle, F. F., Morrison, H., Neubauer, D., Partridge, D. G., Stier, P., Takemura, T., Wang, H., Wang, M., and Zhang, K.: Surprising similarities in model and observational aerosol radiative forcing estimates, Atmos. Chem. Phys., 20, 613–623, https://doi.org/10.5194/acp-20-613-2020, 2020.
Gryspeerdt, E., McCoy, D. T., Crosbie, E., Moore, R. H., Nott, G. J., Painemal, D., Small-Griswold, J., Sorooshian, A., and Ziemba, L.: The impact of sampling strategy on the cloud droplet number concentration estimated from satellite data, Atmos. Meas. Tech., 15, 3875–3892, https://doi.org/10.5194/amt-15-3875-2022, 2022.
Gupta, S., McFarquhar, G. M., O'Brien, J. R., Delene, D. J., Poellot, M. R., Dobracki, A., Podolske, J. R., Redemann, J., LeBlanc, S. E., Segal-Rozenhaimer, M., and Pistone, K.: Impact of the variability in vertical separation between biomass burning aerosols and marine stratocumulus on cloud microphysical properties over the Southeast Atlantic, Atmos. Chem. Phys., 21, 4615–4635, https://doi.org/10.5194/acp-21-4615-2021, 2021.
Gupta, S., McFarquhar, G. M., O'Brien, J. R., Poellot, M. R., Delene, D. J., Miller, R. M., and Small Griswold, J. D.: Factors affecting precipitation formation and precipitation susceptibility of marine stratocumulus with variable above- and below-cloud aerosol concentrations over the Southeast Atlantic, Atmos. Chem. Phys., 22, 2769–2793, https://doi.org/10.5194/acp-22-2769-2022, 2022.
Hair, J. W., Hostetler, C. A., Cook, A. L., Harper, D. B., Ferrare, R. A., Mack, T. L., Welch, W., Izquierdo, L. R., and Hovis, F. E.: Airborne high spectral resolution lidar for profiling aerosol optical properties, Appl. Optics, 47, 6734–6752, 2008.
Hansen, J. and Travis, L. D.: Light scattering in planetary atmospheres, Space Sci. Rev., 16, 527–610, 1974.
Hartmann, D. L., Ockert-Bell, M. E., and Michelsen, M. L.: The effect of cloud type on Earth's energy balance: Global analysis, J. Climate, 5, 1281–1304, 1992.
Haywood, J. M., Osborne, S. R., and Abel, S. J.: The effect of overlying absorbing aerosol layers on remote sensing retrievals of cloud effective radius and cloud optical depth, Q. J. Roy. Meteor. Soc., 130, 779–800, 2004.
Haywood, J. M., Abel, S. J., Barrett, P. A., Bellouin, N., Blyth, A., Bower, K. N., Brooks, M., Carslaw, K., Che, H., Coe, H., Cotterell, M. I., Crawford, I., Cui, Z., Davies, N., Dingley, B., Field, P., Formenti, P., Gordon, H., de Graaf, M., Herbert, R., Johnson, B., Jones, A. C., Langridge, J. M., Malavelle, F., Partridge, D. G., Peers, F., Redemann, J., Stier, P., Szpek, K., Taylor, J. W., Watson-Parris, D., Wood, R., Wu, H., and Zuidema, P.: The CLoud–Aerosol–Radiation Interaction and Forcing: Year 2017 (CLARIFY-2017) measurement campaign, Atmos. Chem. Phys., 21, 1049–1084, https://doi.org/10.5194/acp-21-1049-2021, 2021.
Janssen, R. H. H., Ganzeveld, L. N., Kabat, P., Kulmala, M., Nieminen, T., and Roebeling, R. A.: Estimating seasonal variations in cloud droplet number concentration over the boreal forest from satellite observations, Atmos. Chem. Phys., 11, 7701–7713, https://doi.org/10.5194/acp-11-7701-2011, 2011.
Johnson, B. T., Shine, K. P., and Forster, P. M.: The semi-direct aerosol effect: Impact of absorbing aerosols on marine stratocumulus, Q. J. Roy. Meteor. Soc., 130, 1407–1422, 2004.
King, M. D., Tsay, S. C., Platnick, S., Wang, M., and Liou, K. N.: Cloud retrieval algorithms for MODIS: Optical thickness, effective particle radius, and thermodynamic phase, in: Algorithm Theor. Basis Doc. ATBD-MOD-05, Greenbelt, Md: Goddard Space Flight Center, https://modis.gsfc.nasa.gov/data/atbd/atbd_mod05.pdf (last access: 29 September 2022), 1998.
King, N. J., Bower, K. N., Crosier, J., and Crawford, I.: Evaluating MODIS cloud retrievals with in situ observations from VOCALS-REx, Atmos. Chem. Phys., 13, 191–209, https://doi.org/10.5194/acp-13-191-2013, 2013.
King, W. D., Parkin, D. A., and Handsworth, R. J.: A hot-wire liquid water device having fully calculable response characteristics, J. Appl. Meteorol., 17, 1809–1813, https://doi.org/10.1175/1520-0450(1978)017<1809:AHWLWD>2.0.CO;2, 1978.
Lance, S.: Coincidence Errors in a Cloud Droplet Probe (CDP) and a Cloud and Aerosol Spectrometer (CAS), and the Improved Performance of a Modified CDP, J. Atmos. Ocean. Tech., 29, 1532–1541, https://doi.org/10.1175/JTECH-D-11-00208.1, 2012.
Lance, S., Brock, C. A., Rogers, D., and Gordon, J. A.: Water droplet calibration of the Cloud Droplet Probe (CDP) and in-flight performance in liquid, ice and mixed-phase clouds during ARCPAC, Atmos. Meas. Tech., 3, 1683–1706, https://doi.org/10.5194/amt-3-1683-2010, 2010.
Lawson, R. P., Stewart, R. E., and Angus, L. J.: Observations and numerical simulations of the origin and development of very large snowflakes, J. Atmos. Sci., 55, 3209–3229, 1998.
Lawson, R. P., O'Connor, D., Zmarzly, P.,Weaver, K., Baker, B. A., Mo, Q., and Jonsson, H.: The 2D-S (Stereo) probe: Design and preliminary tests of a new airborne, high-speed, high-resolution imaging probe, J. Atmos. Ocean. Tech., 23, 1462–1477, 2006.
Lenhardt, E.: Relationships Between Lidar Aerosol Extinction and Backscatter Coefficients with CCN Number Concentrations in the Southeast Atlantic, OU – Theses [1749], https://hdl.handle.net/11244/330151 (last access: 28 September 2022), 2021.
Loeb, N. G., Wielicki, B. A., Doelling, D. R., Smith, G. L., Keyes, D. F., Kato, S., Manalo-Smith, N., and Wong, T.: Toward optimal closure of the Earth's Top-of-Atmosphere radiation budget, J. Climate, 22, 748–766, https://doi.org/10.1175/2008JCLI2637.1, 2009.
Mallet, M., Nabat, P., Johnson, B., Michou, M., Haywood, J. M., Chen, C., and Dubovik, O.: Climate models generally underrepresent the warming by Central Africa biomass-burning aerosols over the Southeast Atlantic, Sci. Adv., 7, eabg9998, https://doi.org/10.1126/sciadv.abg9998 2021.
Martin, G. M., Johnson, D. W., and Spice, A.: The measurement and parameterization of effective radius of droplets in warm stratocumulus clouds, J. Atmos. Sci., 51, 1823–1842, 1994.
Mauger, G. S. and Norris, J. R.: Meteorological bias in satellite estimates of aerosol-cloud relationships, Geophys. Res. Lett., 34, L16824, https://doi.org/10.1029/2007GL029952, 2007.
McComiskey, A. and Feingold, G.: The scale problem in quantifying aerosol indirect effects, Atmos. Chem. Phys., 12, 1031–1049, https://doi.org/10.5194/acp-12-1031-2012, 2012.
McCoy, D. T., Field, P., Gordon, H., Elsaesser, G. S., and Grosvenor, D. P.: Untangling causality in midlatitude aerosol–cloud adjustments, Atmos. Chem. Phys., 20, 4085–4103, https://doi.org/10.5194/acp-20-4085-2020, 2020.
McFarquhar, G. M. and Heymsfield, A. J.: The definition and significance of an effective radius for ice clouds, J. Atmos. Sci., 55, 2039–2052, 1998.
McFarquhar, G. M. and Heymsfield, A. J.: Parameterizations of INDOEX microphysical measurements and calculations of cloud susceptibility: Applications for climate studies, J. Geophys. Res., 106, 28675–28698, 2001.
McFarquhar, G. M. and Wang, H.: Effects of Aerosols on Trade Wind Cumuli over the Indian Ocean: Model Simulations, Q. J. Roy. Meteor. Soc., 132, 821–843, 2006.
McFarquhar, G. M., Baumgardner, D., Bansemer, A., Abel, S. J., Crosier, J., French, J., Rosenberg, P., Korolev, A., Schwarzoenboeck, A., Leroy, D., Um, J., Wu, W., Heymsfield, A. J., Twohy, C., Detwiler, A., Field, P., Neumann, A., Cotton, R., Axisa, D., Dong, J., McFarquhar, G. M., Baumgardner, D., Bansemer, A., Abel, S. J., Crosier, J., French, J., Rosenberg, P., Korolev, A., Schwarzoenboeck, A., Leroy, D., Um, J., Wu, W., Heymsfield, A. J., Twohy, C., Detwiler, A., Field, P., Neumann, A., Cotton, R., Axisa, D., and Dong, J.: Processing of Ice Cloud In Situ Data Collected by Bulk Water, Scattering, and Imaging Probes: Fundamentals, Uncertainties, and Efforts toward Consistency, Meteor. Mon., 58, 11.1–11.33, https://doi.org/10.1175/AMSMONOGRAPHS-D-16-0007.1, 2017.
McFarquhar, G. M., Finlon, J. A., Stechman, D. M., Wu, W., Jackson, R. C., and Freer, M.: University of Illinois/Oklahoma Optical Array Probe (OAP) Processing Software, Zenodo [code], https://doi.org/10.5281/zenodo.1285969, 2018.
Merk, D., Deneke, H., Pospichal, B., and Seifert, P.: Investigation of the adiabatic assumption for estimating cloud micro- and macrophysical properties from satellite and ground observations, Atmos. Chem. Phys., 16, 933–952, https://doi.org/10.5194/acp-16-933-2016, 2016.
Meyer, K., Platnick, S., and Zhang, Z.: Simultaneously inferring above-cloud absorbing aerosol optical thickness and underlying liquid phase cloud optical and microphysical properties using MODIS, J. Geophys. Res.-Atmos., 120, 5524–5547, https://doi.org/10.1002/2015JD023128, 2015.
Min, Q., Joseph, E., Lin, Y., Min, L., Yin, B., Daum, P. H., Kleinman, L. I., Wang, J., and Lee, Y.-N.: Comparison of MODIS cloud microphysical properties with in-situ measurements over the Southeast Pacific, Atmos. Chem. Phys., 12, 11261–11273, https://doi.org/10.5194/acp-12-11261-2012, 2012.
Myhre, G., Shindell, D., Bréon, F.-M., Collins, W., Fuglestvedt, J., Huang, J., Koch, D., Lamarque, J.-F., Lee, D., Mendoza, B., Nakajima, T., Robock, A., Stephens, G., Takemura, T., and Zhang, H.: Anthropogenic and Natural Radiative Forc-ing. In: Climate Change 2013: The Physical Science Basis. Contribution of Working Group I to the Fifth Assessment Report of the Intergovernmental Panel on Climate Change, edited by: Stocker, T. F., Qin, D., Plattner, G.-K., Tignor, M., Allen, S. K., Boschung, J., Nauels, A., Xia, Y., Bex, V., and Midgley, P. M., Cambridge University Press, 571–657, https://www.ipcc.ch/site/assets/uploads/2018/02/WG1AR5_Chapter08_FINAL.pdf (last access: 29 September 2022), 2013.
Nakajima, T. and King, M. D.: Determination of the optical thickness and effective particle radius of clouds from reflected solar radiation measurements. Part I: Theory, J. Atmos. Sci., 47, 1878–1893, 1990.
Nakajima, T. Y., Suzuki, K., and Stephens, G. L.: Droplet growth in warm water clouds observed by the A-Train. Part I: Sensitivity analysis of the MODIS-derived cloud droplet sizes, J. Atmos. Sci., 67, 1884–1896, 2010.
Noble, S. R. and Hudson, J. G.: MODIS comparisons with northeastern Pacific in situ stratocumulus microphysics, J. Geophys. Res.-Atmos., 120, 8332–8344, https://doi.org/10.1002/2014JD022785, 2015.
ORACLES Science Team: Suite of Aerosol, Cloud, and Related Data Acquired Aboard P3 During ORACLES 2018, Version 2, NASA Ames Earth Science Project Office [data set], https://doi.org/10.5067/Suborbital/ORACLES/P3/2018_V2, 2020a.
ORACLES Science Team: Suite of Aerosol, Cloud, and Related Data Acquired Aboard P3 During ORACLES 2017, Version 2, NASA Ames Earth Science Project Office [data set], https://doi.org/10.5067/Suborbital/ORACLES/P3/2017_V2, 2020b.
ORACLES Science Team: Suite of Aerosol, Cloud, and Related Data Acquired Aboard P3 During ORACLES 2016, Version 2, NASA Ames Earth Science Project Office [data set], https://doi.org/10.5067/Suborbital/ORACLES/P3/2016_V2, 2020c.
Painemal, D. and Zuidema, P.: Assessment of MODIS cloud effective radius and optical thickness retrievals over the Southeast Pacific with VOCALS-REx in situ measurements, J. Geophys. Res.-Atmos., 116, D24206, https://doi.org/10.1029/2011JD016155, 2011.
Painemal, D., Chang, F.-L., Ferrare, R., Burton, S., Li, Z., Smith Jr., W. L., Minnis, P., Feng, Y., and Clayton, M.: Reducing uncertainties in satellite estimates of aerosol–cloud interactions over the subtropical ocean by integrating vertically resolved aerosol observations, Atmos. Chem. Phys., 20, 7167–7177, https://doi.org/10.5194/acp-20-7167-2020, 2020.
Painemal, D., Spangenberg, D., Smith Jr., W. L., Minnis, P., Cairns, B., Moore, R. H., Crosbie, E., Robinson, C., Thornhill, K. L., Winstead, E. L., and Ziemba, L.: Evaluation of satellite retrievals of liquid clouds from the GOES-13 imager and MODIS over the midlatitude North Atlantic during the NAAMES campaign, Atmos. Meas. Tech., 14, 6633–6646, https://doi.org/10.5194/amt-14-6633-2021, 2021.
Platnick, S.: Vertical photon transport in cloud remote sensing problems, J. Geophys. Res., 105, 22919–22935, https://doi.org/10.1029/2000JD900333, 2000.
Platnick, S., King, M. D., Ackerman, S. A., Menzel, W. P., Baum, B. A., Riedi, J. C., and Frey, R. A.: The MODIS cloud products: Algorithms and examples from Terra, IEEE T. Geosci. Remote, 41, 459–473, https://doi.org/10.1109/tgrs.2002.808301, 2003.
Platnick, S., Ackerman, S., King, M., Wind, G., Meyer, K., Menzel, P., Frey, R., Holz, R., Baum, B., and Yang, P.: MODIS atmosphere L2 cloud product (06_L2), NASA MODIS Adaptive Processing System, Goddard Space Flight Center [data set], https://doi.org/10.5067/MODIS/MOD06_L2.061, 2017a.
Platnick, S., Meyer, K. G., King, M. D., Wind, G., Amarasinghe, N., Marchant, B., Arnold, G. T., Zhang, Z., Hubanks, P. A., Holz, R. E., Yang, P., Ridgway, W. L., and Riedi, J.: The MODIS cloud optical and microphysical products: Collection 6 updates and examples from Terra and Aqua, IEEE T. Geosci. Remote, 55, 502–525, 2017b.
Peers, F., Francis, P., Abel, S. J., Barrett, P. A., Bower, K. N., Cotterell, M. I., Crawford, I., Davies, N. W., Fox, C., Fox, S., Langridge, J. M., Meyer, K. G., Platnick, S. E., Szpek, K., and Haywood, J. M.: Observation of absorbing aerosols above clouds over the south-east Atlantic Ocean from the geostationary satellite SEVIRI – Part 2: Comparison with MODIS and aircraft measurements from the CLARIFY-2017 field campaign, Atmos. Chem. Phys., 21, 3235–3254, https://doi.org/10.5194/acp-21-3235-2021, 2021.
Quaas, J., Arola, A., Cairns, B., Christensen, M., Deneke, H., Ekman, A. M. L., Feingold, G., Fridlind, A., Gryspeerdt, E., Hasekamp, O., Li, Z., Lipponen, A., Ma, P.-L., Mülmenstädt, J., Nenes, A., Penner, J. E., Rosenfeld, D., Schrödner, R., Sinclair, K., Sourdeval, O., Stier, P., Tesche, M., van Diedenhoven, B., and Wendisch, M.: Constraining the Twomey effect from satellite observations: issues and perspectives, Atmos. Chem. Phys., 20, 15079–15099, https://doi.org/10.5194/acp-20-15079-2020, 2020.
Rajapakshe, C., Zhang, Z., Yorks, J. E., Yu, H., Tan, Q., Meyer, K., Platnick, S., and Winker, D. M.: Seasonally transported aerosol layers over southeast Atlantic are closer to underlying clouds than previously reported, Geophys. Res. Lett., 44, 5818–5825, https://doi.org/10.1002/2017GL073559, 2017.
Rausch, J., Meyer, K., Bennartz, R., and Platnick, S.: Differences in liquid cloud droplet effective radius and number concentration estimates between MODIS collections 5.1 and 6 over global oceans, Atmos. Meas. Tech., 10, 2105–2116, https://doi.org/10.5194/amt-10-2105-2017, 2017.
Redemann, J., Wood, R., Zuidema, P., Doherty, S. J., Luna, B., LeBlanc, S. E., Diamond, M. S., Shinozuka, Y., Chang, I. Y., Ueyama, R., Pfister, L., Ryoo, J.-M., Dobracki, A. N., da Silva, A. M., Longo, K. M., Kacenelenbogen, M. S., Flynn, C. J., Pistone, K., Knox, N. M., Piketh, S. J., Haywood, J. M., Formenti, P., Mallet, M., Stier, P., Ackerman, A. S., Bauer, S. E., Fridlind, A. M., Carmichael, G. R., Saide, P. E., Ferrada, G. A., Howell, S. G., Freitag, S., Cairns, B., Holben, B. N., Knobelspiesse, K. D., Tanelli, S., L'Ecuyer, T. S., Dzambo, A. M., Sy, O. O., McFarquhar, G. M., Poellot, M. R., Gupta, S., O'Brien, J. R., Nenes, A., Kacarab, M., Wong, J. P. S., Small-Griswold, J. D., Thornhill, K. L., Noone, D., Podolske, J. R., Schmidt, K. S., Pilewskie, P., Chen, H., Cochrane, S. P., Sedlacek, A. J., Lang, T. J., Stith, E., Segal-Rozenhaimer, M., Ferrare, R. A., Burton, S. P., Hostetler, C. A., Diner, D. J., Seidel, F. C., Platnick, S. E., Myers, J. S., Meyer, K. G., Spangenberg, D. A., Maring, H., and Gao, L.: An overview of the ORACLES (ObseRvations of Aerosols above CLouds and their intEractionS) project: aerosol–cloud–radiation interactions in the southeast Atlantic basin, Atmos. Chem. Phys., 21, 1507–1563, https://doi.org/10.5194/acp-21-1507-2021, 2021.
Sinclair, K., van Diedenhoven, B., Cairns, B., Alexandrov, M., Dzambo, A. M., and L'Ecuyer, T.: Inference of precipitation in warm stratiform clouds using remotely sensed observations of the cloud top droplet size distribution, Geophys. Res. Lett., 48, e2021GL092547, https://doi.org/10.1029/2021GL092547, 2021.
Slingo, A.: Sensitivity of the Earth's radiation budget to changes in low clouds, Nature, 343, 49–51, https://doi.org/10.1038/343049a0, 1990.
Szczodrak, M., Austin, P. H., and Krummel, P. B.: Variability of Optical Depth and Effective Radius in Marine Stratocumulus Clouds, J. Atmos. Sci., 58, 2912–2926, https://doi.org/10.1175/1520-0469(2001)058<2912:VOODAE>2.0.CO;2, 2001.
Thornhill, K. L., Anderson, B. E., Barrick, J. D. W., Bagwell, D. R., Friesen, R., and Lenschow, D.: Air motion inter-comparison flights during Transport and Chemical Evolution in the Pacific (TRACE-P)/ACE-ASIA, J. Geophys. Res., 108, 8783, https://doi.org/10.1029/2002JD003108, 2003.
Twomey, S.: Pollution and the Planetary Albedo, Atmos. Environ., 8, 1251–1256, 1974.
Twomey, S.: The influence of pollution on the shortwave albedo of clouds. J. Atmos. Sci., 34, 1149–1152, 1977.
Wilcox, E. M.: Stratocumulus cloud thickening beneath layers of absorbing smoke aerosol, Atmos. Chem. Phys., 10, 11769–11777, https://doi.org/10.5194/acp-10-11769-2010, 2010.
Witte, M. K., Yuan, T., Chuang, P. Y., Platnick, S., Meyer, K. G., Wind, G., and Jonsson, H. H.: MODIS retrievals of cloud effective radius in marine stratocumulus exhibit no significant bias, Geophys. Res. Lett., 45, 10656–10664, https://doi.org/10.1029/2018GL079325, 2018.
Wood, R.: Stratocumulus Clouds, Mon. Weather Rev., 140, 2373–2423, https://doi.org/10.1175/MWR-D-11-00121.1, 2012.
Wood, R., Leon, D., Lebsock, M., Snider, J., and Clarke, A. D.: Precipitation driving of droplet concentration variability in marine low clouds, J. Geophys. Res.-Atmos., 117, D19210, https://doi.org/10.1029/2012JD018305, 2012.
Zeng, S., Riedi, J., Trepte, C. R., Winker, D. M., and Hu, Y.-X.: Study of global cloud droplet number concentration with A-Train satellites, Atmos. Chem. Phys., 14, 7125–7134, https://doi.org/10.5194/acp-14-7125-2014, 2014.
Zhang, Z. and Plantnick, S.: An assessment of differences between cloud effective particle radius retrievals for marine water clouds from three MODIS spectral bands, J. Geophys. Res.-Atmos., 116, D20215, https://doi.org/10.1029/2011JD016216, 2011.
Zinner, T., Wind, G., Platnick, S., and Ackerman, A. S.: Testing remote sensing on artificial observations: impact of drizzle and 3-D cloud structure on effective radius retrievals, Atmos. Chem. Phys., 10, 9535–9549, https://doi.org/10.5194/acp-10-9535-2010, 2010.
Zuidema, P., Redemann, J., Haywood, J., Wood, R., Piketh, S., Hipondoka, M., and Formenti, P.: Smoke and Clouds above the Southeast Atlantic: Upcoming Field Campaigns Probe Absorbing Aerosol's Impact on Climate, B. Am. Meteorol. Soc., 97, 1131–1135, https://doi.org/10.1175/BAMS-D-15-00082.1, 2016.
- Abstract
- Introduction
- Data and methodology
- MODIS versus in situ
- Aerosol–cloud interactions
- Discussion
- Conclusions
- Appendix A: Scaling the CAS/CDP n(D) based on the King LWC
- Appendix B: In situ measurement uncertainties
- Code availability
- Data availability
- Author contributions
- Competing interests
- Disclaimer
- Special issue statement
- Acknowledgements
- Financial support
- Review statement
- References


