the Creative Commons Attribution 4.0 License.
the Creative Commons Attribution 4.0 License.
 | 30 Sep 2022
Measurement report: Characterisation and sources of the secondary organic carbon in a Chinese megacity over 5 years from 2016 to 2020
Meng Wang
Yusen Duan
Qiyuan Wang
Zhuozhi Zhang
Qi Yuan
Xinwei Li
Shuwen Han
Haijie Tong
Juntao Huo
Jia Chen
Shan Gao
Zhongbiao Wu
Long Cui
Yu Huang
Guangli Xiu
Junji Cao
Shun-cheng Lee
To investigate impact factors and source area of secondary organic aerosols in the Yangtze River Delta (YRD) region, a world-class urban agglomeration in China, long-term measurements of organic carbon (OC) and elementary carbon (EC) in particulate matter of less than 2.5 µm (PM2.5) with hourly time resolution were conducted at a regional site in Shanghai from 2016 to 2020. Based on the 5-year measurements, the interannual, monthly, seasonal, and diurnal variations in OC and EC, as well as OC subtypes, i.e. secondary OC (SOC) and primary OC (POC), apportioned by the novel statistical model of the minimum R2 method, and the formation pathways of SOC, are presented. By examining the relationship between SOC and temperature, as well as relative humidity (RH), we show that SOC formation is greatly enhanced at high temperatures (> 30 ∘C), whereas it correlates inversely with RH. In particular, we show that the photochemical formation of SOC is the major formation pathway even in winter, when solar radiation was supposedly less intense than in summer, which is different from that in the north China plain, where aqueous phase chemistry is found to be an important SOC formation pathway. Moreover, increased SOC concentrations are also found to be associated with high wind speed (> 5 m s−1) in winter, which is increased by 29.1 % (2.62 µg m−3) when compared with that during lower winds, suggesting regional sources of SOC in winter. By analysing the potential source regions using the concentration-weighted trajectory (CWT), the geographic regions of SOC are found to be mainly associated with transport from outside Shanghai (SOC > 3.5 µg m−3) including central and southern Anhui, Zhejiang, and Fujian. The results from this study provide critical information about the long-term trend of carbonaceous aerosol, in particular, SOC, in one of the largest megacities in the world, and are helpful for developing pollution control measures from a long-term planning perspective.
- Article
(3980 KB) - Full-text XML
-
Supplement
(1999 KB) - BibTeX
- EndNote


Carbonaceous aerosols account for 20 %–90 % of the submicron aerosol mass (Jimenez et al., 2009; Kroll et al., 2011). It affects the physical and chemical properties of the atmosphere, including radiative forcing, hygroscopicity, and toxicity (Hopke, 1991; Pope and Dockery, 2006; Bond et al., 2013). Carbonaceous components are classified experimentally into three fractions: elemental carbon (EC), carbonate carbon, and organic carbon (OC) (Turpin et al., 2000). EC is a primary pollutant that can be directly emitted from fossil fuel combustion and biomass burning (Cao et al., 2003; Galindo et al., 2019). Carbonate carbon is mainly in natural mineral dust and building/demolition dust and exists in the coarse fraction (Chow and Watson, 2002; Chang et al., 2017), whereas OC is composed of hundreds of organic compounds, forming a complex mixture with different chemical and physical properties and accounting for a major fraction of carbonaceous aerosol (Chatterjee et al., 2021). OC can either be emitted directly, for example, from combustion processes, vehicular exhaust, and cooking, and is termed primary OC (POC). It can also be formed in the atmosphere by gas-to-particle oxidation reactions, termed secondary organic carbon (SOC) (Salvador et al., 2021; Hallquist et al., 2009). Carbonaceous aerosols are among the major constituents of atmospheric aerosols and their quantification is necessary to understand the role of aerosols from regional visibility degradation to health effects and global climate change (Wu et al., 2012; Mauderly and Chow, 2008).
As carbonaceous aerosols are indispensable for probing atmospheric ageing processes of organic aerosols and formulating effective emission control policies, there have been a number of studies in China. In the 1980s, Dod et al. (1986) first published a study on carbonaceous aerosol in Beijing during three seasons (i.e. spring, summer, and winter), demonstrating that ambient carbonaceous aerosols (soot in the study) were derived principally from coal combustion, especially in winter. With the development of analytical techniques and in-depth research on carbonaceous aerosols, a number of studies on carbonaceous aerosols have emerged in many Chinese cities, such as Beijing (He et al., 2001; Zhang et al., 2007; Ji et al., 2019), Xi'an (Cao et al., 2005; Han et al., 2009; Shen et al., 2014), Chengdu (Wang et al., 2013; Tao et al., 2013), Shanghai (Cao et al., 2013; Zhu et al., 2015; Li et al., 2019), Guangzhou (Cao et al., 2004; Ho et al., 2014; Wang et al., 2016), and Hong Kong (Lee et al., 2006; Ho et al., 2002, 2019). However, long-term (e.g. 5 years) analysis of carbonaceous aerosols in the megacities is currently lacking, limiting our understanding of the trend evolution of carbonaceous aerosols and the ability to evaluate the effectiveness of air quality policies such as “Action Plan on Prevention and Control of Air Pollution” (Zhang et al., 2019).
Shanghai is one of the megacities with the most rapid economic and social development in the Yangtze River Delta (YRD), China (Lin et al., 2014). Along with rapid economic growth and urbanisation, the consequent degradation of air quality has been recognised (Fu et al., 2008; Wang et al., 2015). Hence, the Chinese government unveiled its 5-year “Action Plan on Prevention and Control of Air Pollution” in 2013, a comprehensive guideline that calls for nationwide improvements in air quality by 2017, aiming to cut PM2.5 levels by 20 % in the regions of the YRD (MEP, 2013). Over the past decade, extensive studies have been launched to investigate the impact of carbonaceous aerosol on air pollution in Shanghai. The PM2.5 reduction targets in Shanghai have been met to date (Zhang et al., 2019). However, it is not well understood how the PM2.5 components, particularly carbonaceous aerosol, have evolved over recent years, with different components likely demonstrating distinct temporal evolution. For example, although Shanghai has witnessed a decrease in EC concentration, from an annual average value of 2.81 µg m−3 in 2010 to 2.11 µg m−3 in 2014, it also saw a small increase in OC concentration, from an annual average value of 7.09 µg m−3 in 2010 to 7.83 µg m−3 in 2014 (Chang et al., 2017). To grasp more complete information on the variation, evolution, and sources of the carbonaceous aerosol, especially in the post-“Action Plan on Prevention and Control of Air Pollution” era, continuous and highly time-resolved measurements of carbonaceous aerosol over multiple years are necessary but are currently lacking.
In this study, we conducted a long-term field campaign at a regional site in the YRD region from 2016 to 2020. Hourly time-resolved OC and EC in PM2.5 were measured at a supersite in Shanghai. The secondary organic carbon (SOC) was estimated by the minimum R2 method (MRS) (Wu and Yu, 2016). The characteristics of carbonaceous aerosol pollution and their seasonal and diurnal variations are discussed. Furthermore, we explored the meteorological factor effects on carbonaceous aerosol concentrations in different levels of PM2.5. To attain a better understanding of the temporal variations of SOC at different PM2.5 levels and source areas, we identified the main source areas of SOC by employing backward trajectory clusters and the concentration-weighted trajectory (CWT) model based on Hybrid Single Particle Lagrangian Integrated Trajectory (HYSPLIT) analysis. The purpose of this study is to improve the understanding of the variation and sources of SOC in PM2.5. The long-term data presented in this study provide critical information that can evaluate the effectiveness of the current air pollution control policies and are informing development of future pollution control measures.
2.1 Observation site
The sampling site is in the Qingpu District of western Shanghai, named Dianshan Lake (DSL) supersite (31.09∘ N, 120.98∘ E, ∼ 15 m above ground) (Fig. S1 in the Supplement). It is ∼ 7 km east of Dianshan Lake, ∼ 50 km from downtown Shanghai, situated at the intersection area of Jiangsu, Shanghai, and Zhejiang. It is in a suburban area in the YRD, surrounded by farmland and vegetated lands. There are two highways (G318 and G50, ∼ 1 km to the site) but no large industries near the sampling site. DSL station is a supersite maintained by the Shanghai Environmental Monitoring Center and the monitoring data are incorporated into the national regional air automatic monitoring network of China. The site is considered suitable for investigating the regional air quality and transport of air pollutants in the YRD region (Jia et al., 2020). In this study, a 5-year intensive campaign was conducted at the DSL site from January 2016 to December 2020, although the observations were suspended from July to September 2019 (5 % of the data) owing to site maintenance.
2.2 Instruments and measurements
PM2.5 mass concentrations were determined automatically by a tapered-element oscillating microbalance monitor (TEOM, Thermo FH62C-14, USA). The sampling flow rate of the TEOM was 16.7 L min−1. The uncertainty of the hourly measurement is ± 1.50 mg m−3, and the detection limit is 0.1 µg m−3. In the study, the PM2.5 concentration was converted to hourly means. O3 and NO2 were measured by an online analyser (Model O342M, Environmental S.A, FRA; model 42i, Thermo Environmental Instruments, USA).
Organic carbon (OC) and elemental carbon (EC) were measured online by a Sunset Semi-Continuous Carbon Analyzer (Sunset Laboratory, Forest Grove, OR, USA) using the thermal–optical transmittance method at a flow rate of 8 L min−1. This instrument can provide hourly time-resolved OC and EC analyses. The detection limits of OC and EC are 0.2 and 0.04 µg m−3 respectively.
The meteorological parameters, including ambient temperature (T), relative humidity (RH), wind speed (WS), and wind direction (WD), were obtained at the sampling site using the Visala (WXT520, Vaisala Ltd., Finland) automatic weather station at hourly time resolution. The uncertainty of ambient temperature, RH, WS, and WD are ± 0.1 ∘C, ± 3 %, ± 0.3 m s−1, and 3∘ respectively. The data are collected every minute and converted to hourly means.
2.3 Estimation of secondary organic carbon by the minimum R2 method
As EC is a tracer for primary POC from combustion sources, the EC tracer method has been widely used for separating POC and SOC (Cao et al., 2007). In this study, an innovative EC tracer method was used to estimate SOC, named the minimum correlation coefficient (MRS) method (Wu and Yu, 2016). The concentrations of SOC were estimated as follows
where OC and EC are the concentrations measured in the sample, (OC EC)primary is an estimate of the primary OC EC ratio through calculating a hypothetical set of (OC EC)primary. The hypothetical (OC EC)primary that generates the MRS (R2) SOC values was determined by seeking the minimum R2 between SOC and EC. This method may result in negative SOC concentrations for those periods when the estimated (OC EC)primary value was higher than the measured OC EC ratio. Although these data increase the uncertainty of the method, we assumed that these points were free of SOC formation. As the relative contributions of different primary emission sources would vary from month to month (Table S1 in the Supplement), we calculated (OC EC)primary according to this method for each month from 2016 to 2020 in Shanghai (Figs. S2–S6).
2.4 Back trajectory and concentration-weighted trajectory model
To determine the influences of regional transport on SOC at Shanghai, we calculated 72 h air mass back trajectory of the central location at 500 m above the ground level. The trajectories were calculated with the NOAA Hybrid Single Particle Lagrangian Integrated Trajectory (HYSPLIT4.0) model (Draxler and Rolph, 2003). The meteorological data were from the Global Data Assimilation System (GDAS). The model was run eight times per day at starting times of 00:00, 03:00, 06:00, 09:00, 12:00, 15:00, 18:00, and 21:00 local time (LT) respectively. The relative parameter settings in the model had also been used in the literature (Wang et al., 2018; Lin et al., 2019).
The concentration-weighted trajectory (CWT) approach was used to investigate the potential transport of pollution (Fleming et al., 2012) on the interface of ZeFir (Petit et al., 2017). For the CWT calculations, the entire geographic region covered by the 3 d backward trajectories was separated into 7920 grid cells of 0.5∘ latitude × 0.5∘ longitude. Each grid cell was assigned a residence time-weighted concentration obtained by the hourly averaged SOC concentration associated with the trajectories that crossed that grid cell (Hsu et al., 2003). The CWT is defined as
where Cij is the average weighted concentration in the grid cell (ijth); Cl is the measured SOC concentration on the arrival of trajectory l; τijl is the number of trajectory endpoints in the ijth grid cell by trajectory l; and M is the total number of trajectories.
3.1 Temporal variations of carbonaceous aerosol
3.1.1 Interannual variations
Summary statistics for carbonaceous aerosol concentrations (EC, OC, POC, and SOC), as well as total PM2.5, from 1 January 2016 to 31 December 2020 are presented in Table 1. During the entire observation period, the EC concentration ranged from 0.01–11.6 µg m−3, and the 5-year average concentration was 1.28 ± 0.95 µg m−3. Annually, the EC concentration measured at Dianshan Lake has essentially decreased year by year in parallel over the 5 years. The average concentration of EC was highest in 2016, with an annual average of 1.50 ± 1.17 µg m−3, whereas the average concentration of EC in 2020 was the lowest (1.00 ± 0.6 4 µg m−3). Therefore, compared with EC in 2016, the annual EC concentration reduced by ∼ 50 % in 2020.
Table 1Averages (± one standard deviation), medians, and ranges (minimum to maximum) for the OC, EC, POC, SOC, and PM2.5 concentrations (in µg m−3) from January 2016 to December 2020.
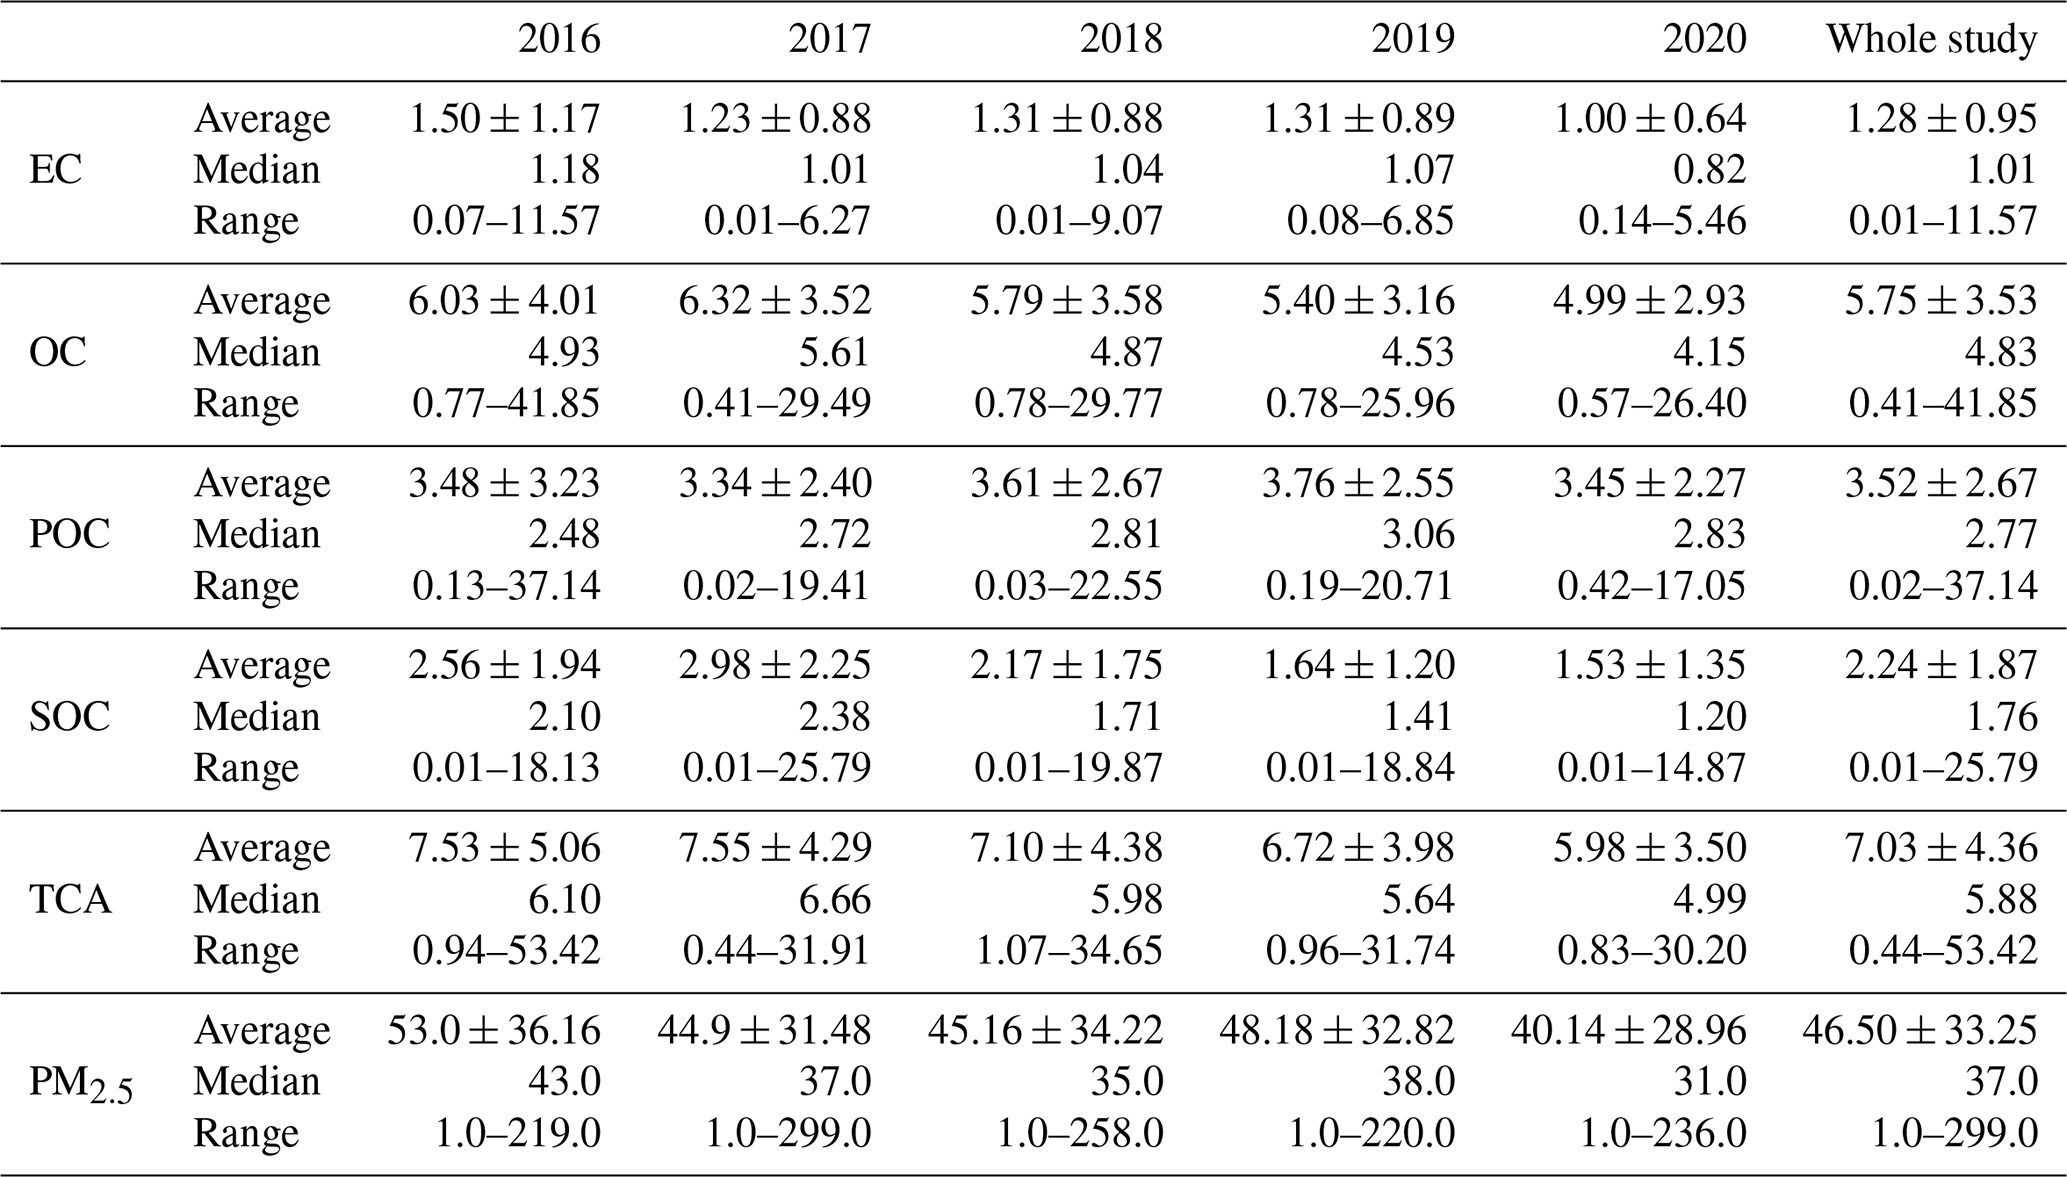
TCA (total carbon aerosol) = EC + OC. 2016: January 2016–December 2016; 2017: January 2017–December 2017; 2018: January 2018–December 2018; 2019: January 2019–December 2019; 2020: January 2016–December 2020.
Different from EC, the average concentration of OC was the highest in 2017 (average 6.32 ± 3.52 µg m−3). Since 2018, the average concentration of OC has decreased year by year, with the lowest annual level of 4.99 ± 2.93 µg m−3 found in 2020. It is worth noting that although the average concentration of OC in 2016 was lower than that in 2017, the maximum concentration of OC in 2016 was 1.41–1.61 times that of other years.
OC subtypes of POC and SOC were apportioned using the novel MRS statistical model (see the Experiment and method section). Different from the trend observed for EC, the apportioned POC increased year to year from 2016 to 2019, reaching the maximum value in 2019 (3.76 ± 2.55 µg m−3). However, it dropped sharply in 2020, likely due to the lockdown caused by the COVID-19 pandemic (Jia et al., 2020). Therefore, the POC/EC ratio was changing for different years, and using a fixed POC/EC value over multiple years might bias the POC as well as the SOC. In contrast, the changing trend of SOC was consistent with OC, which was the maximum in 2017 (average SOC concentration 2.98 ± 2.25 µg m−3). In the next 3 years, the annual average concentration of SOC decreased on a year-to-year basis, reaching the lowest in 2020 (1.53 ± 1.35 µg m−3).
3.1.2 Seasonal and monthly variations
The seasonal variations of carbonaceous aerosol concentrations are illustrated in Fig. 1. The season-wise average concentrations of EC ranged from 0.92 (summer of 2019) to 1.90 µg m−3 (winter of 2016), whereas OC ranged from 4.35 (summer of 2012) to 7.83 µg m−3 (winter of 2016). For EC, OC, as well as OC subtypes (POC and SOC), similar seasonal variations were observed, with generally higher average carbonaceous aerosol concentrations in autumn and winter and lower levels in spring and summer, except for a slightly higher concentration of EC in the summer of 2017 due to the boost in intensive pollution episodes (indicated by a significantly higher value in the 95th percentile than that in other years). Higher concentrations of EC were observed in winter for the other 4 years, which could be caused by the stagnation of the atmosphere and the stronger influence of regional transport during wintertime (Chen et al., 2017).
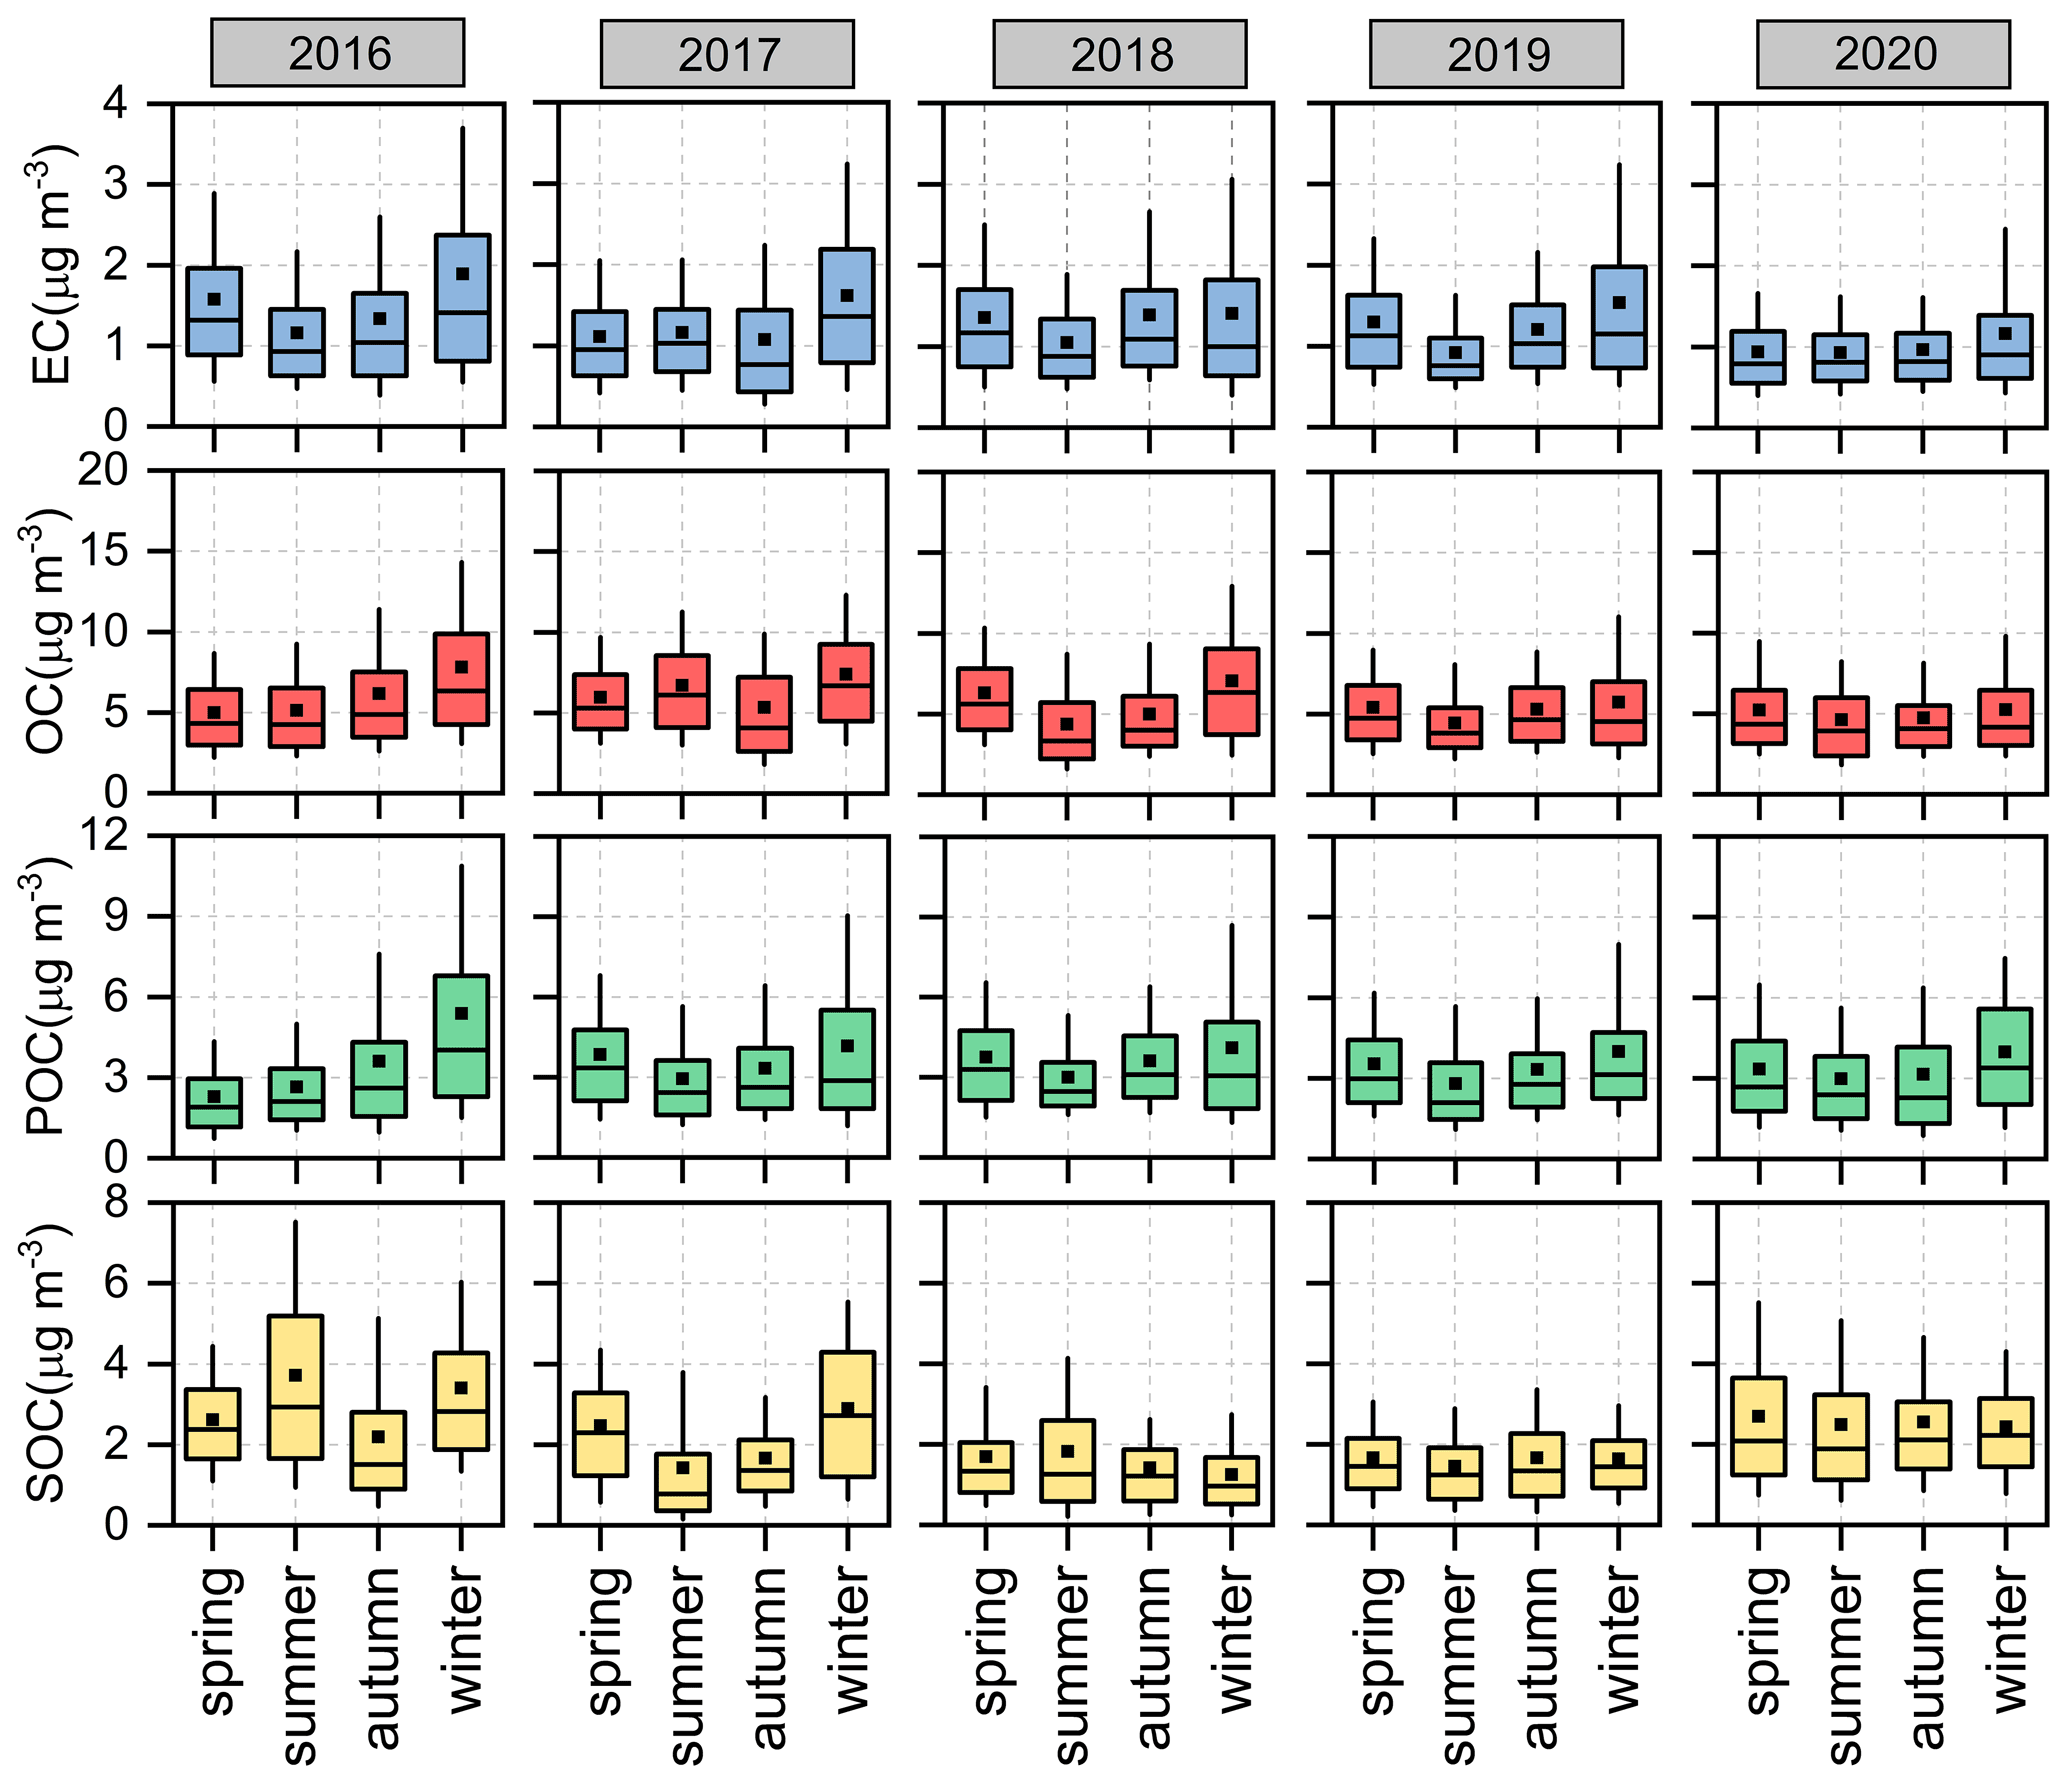
Figure 1Seasonal variations of carbonaceous aerosol concentrations during weekdays and weekends over different years in Dianshan Lake. (Spring: March, April, and May; summer: June, July, and August; autumn: September, October, and November; winter: January, February, and December). The box represents the 25th to 75th percentiles, the horizon line represents the median, and the 10th and the 90th percentiles are the bottom and top whiskers respectively.
There is a consistent pattern for the seasonal variations of POC concentrations, the concentration levels of POC in spring, summer, and autumn were generally lower than that in the winter, reflecting generally locally dominated POC emissions in Dianshan Lake. In particular, POC concentrations in winter were 5.40, 3.88, 4.10, 4.13, and 3.97 µg m−3, and 2.04, 1.31, 1.40, 1.38, and 1.41 times higher than those in the summer for 2016, 2017, 2018, 2019, and 2020 respectively.
SOC concentrations were estimated to be ranging from 0.13–10.70 µg m−3 (spring), 1.04–19.41 µg m−3 (summer), 0.02–25.37 µg m−3 (autumn), and 0.03–37.14 µg m−3 (winter) over the 5 years. Comparatively, there was no clear trend in the seasonal changes of SOC over the 5 years, which can be explained by their complexity in terms of the sources and formation processes. Indeed, in contrast to POC, SOC is the mixed product of the ageing of the primary emissions and secondary formation from precursor gases, which could vary significantly in different seasons. For instance, strong solar radiation tends to facilitate photochemical reactions and thus enhance the formation of volatile organic compounds (VOCs) to organic aerosols in summer (Tuet et al., 2017), whereas the increased anthropogenic emissions (e.g. biomass-burning and coal-burning emissions) will also lead to a significant increase in SOC during the harvest period and heating season (Zhang et al., 2013; Wang et al., 2020).
Monthly, the average mass concentrations of carbonaceous aerosols show relatively large variations in this study (Table S1), with the average value ranging from 0.56 (October 2017) to 2.22 (December 2017) µg m−3 for EC, whereas it ranged from 3.39 (October 2017) to 9.00 µg m−3 (December 2017) for OC. The month of December presented the highest EC and OC average concentration (EC: 1.81 ± 1.36 µg m−3; OC: 7.27 ± 5.03 µg m−3) throughout the study period. The lowest month for carbonaceous aerosol concentration was in August (EC: 0.94 ± 0.52 µg m−3; OC: 4.47 ± 2.56 µg m−3). These are consistent with the previous study in Shanghai from 2010 to 2014 (Chang et al., 2017). Table S1 also shows the monthly mean POC and SOC concentrations at our study site for the whole 5-year period. POC shows similar variations to OC, with higher average concentrations in the cold season (from November to February next year) and lower ones in the warm season (from April to October). The highest average POC concentration was 4.97 ± 3.97 µg m−3 (December), and the lowest POC average concentration was 2.23 ± 1.34 µg m−3 (August). In contrast, the SOC average concentration was the highest in July (3.43 ± 3.12 µg m−3), which accounted for 58.1 % on average of OC in the same month.
3.1.3 Weekend–weekday pattern and diurnal variations
Figure 2 shows diurnal patterns of carbonaceous aerosols during weekdays and weekends during four seasons, as well as over the entire study period. Consistently, EC shows a distinctive diurnal pattern for different seasons or the whole period (Fig. 2), which is characterised by two peaks occurring in the morning (around 08:00 local time) and during the evening (around 20:00 local time), corresponding well with the morning and evening rush hours, coupled by shallow mixing layer heights. It is worth noting that the peak of EC during the morning rush hour is higher than the evening peak, and the difference between the two peaks is largest in winter and smallest in spring.
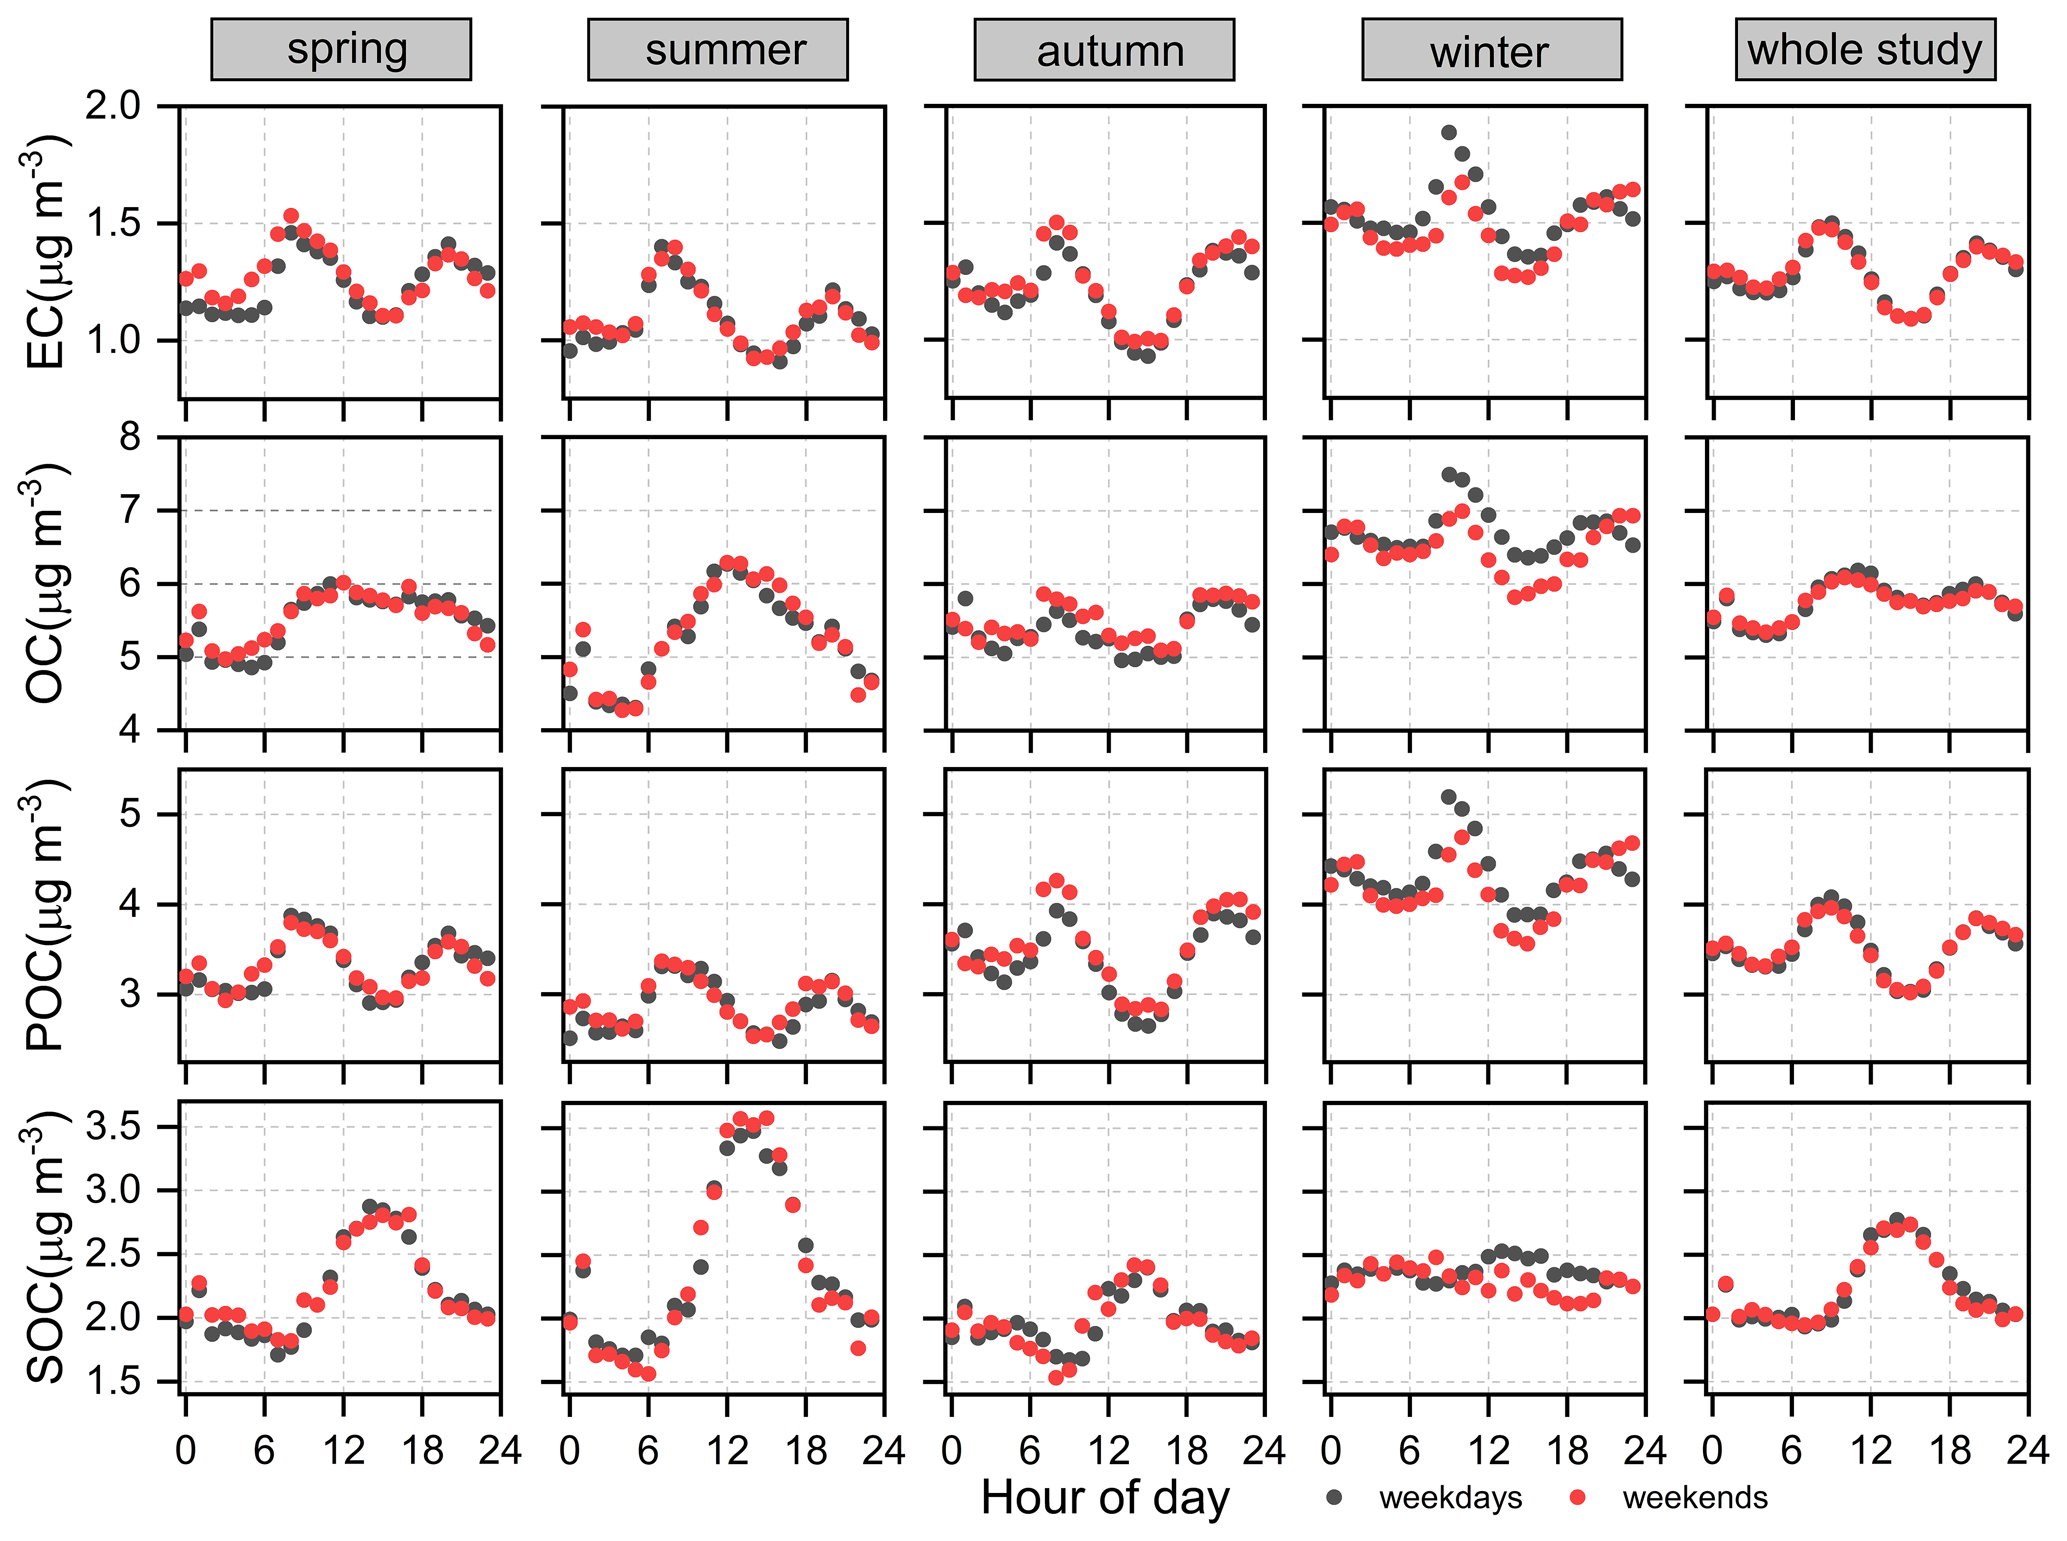
Figure 2Diurnal variations of carbonaceous aerosol concentrations on weekdays and at weekends during four seasons and the whole study period in Dianshan Lake.
Different from EC, the daily variation of OC does not show a consistent pattern (Fig. 2). OC shows a peak at around noon in spring and summer, whereas the peak time in autumn and winter is advanced to about 10:00 in the morning. The peak appearing near noon can reflect the contribution of photochemical reaction to OC. In particular, the apportioned SOC shows increased concentrations at a similar time. This phenomenon is especially obvious in spring and summer, whereas no clear change in the concentration of SOC is found in winter. Additionally, in autumn and winter, OC shows a peak at 22:00, which is partly due to the primary emission, as evident by the simultaneous increase in POC, whereas such an increase is absent in SOC (Fig. 2).
In terms of weekday and weekend variations, the average concentration of EC during weekends in spring and autumn is higher than that of weekdays (spring ECweekdays= 1.25 µg m−3; ECweekends= 1.30 µg m−3, autumn ECweekdays= 1.19 µg m−3; ECweekends= 1.24 µg m−3), whereas the difference between weekday and weekends is small in summer (both at ∼ 1.10 µg m−3). Only the winter ECweekdays (1.56 µg m−3) is higher than ECweekends (1.46 µg m−3). The weekday and weekend variations observed at this site are different from those of previous studies. Specifically, according to a previous literature report (Chang et al., 2017), the observational data from 2010 to 2014 showed that the concentration of EC on working days was greater than that at weekends because the traffic volume was significantly higher on weekdays than at weekends, consistent with the location of the sampling site, which is near national highways (2 km away). However, Shanghai officially implemented a traffic restriction system in 2016. In this study, the sampling site is located near tourist attractions and is not in the traffic-restricted area of Shanghai, which is near the national expressway entering and leaving Shanghai (the straight-line distance is no more than 2 km). It is speculated that the heavy traffic flow due to the attraction of the nearby tourist sites during spring and autumn weekends may lead to high EC emissions.
POC and SOC show different weekly patterns. Specifically, the concentration on working days in winter is higher than that at weekends, whereas the SOC at weekends in spring is slightly higher than that of weekdays, and the weekdays of other seasons are higher than weekends (Fig. 2). This indicates that there is no significant decline in anthropogenic activity at the weekends compared with weekdays. Enhanced anthropogenic emissions could be caused by no limit on driving vehicles based on license plates at weekends. Human activities increase near the sampling site, leading to increased VOC emissions and more SOC generation. Below, we discuss further the sources of SOC and the impact of meteorological parameters on its formation.
3.2 Insights into the formation pathways of SOC
3.2.1 Relationship between SOC and temperature
Examining the relationship between SOC versus meteorological parameters (e.g. temperature, RH, and WS) could provide more information on the formation and transformation of ambient SOC. Figure S7 shows the statistics on the concentration distribution of SOC in different temperature bins. Specifically, the mean value of SOC concentration was 2.42 µg m−3 (T < 0 ∘C), 2.32 µg m−3 (0 ∘C < T < 10 ∘C), 2.06 µg m−3 (10 ∘C < T < 20 ∘C), 1.98 µg m−3 (20 ∘C < T < 30 ∘C), and 3.82 µg m−3 (T > 30 ∘C) during the study period. Therefore, although the concentration of SOC does not show a linear increase with the increase in temperature, at T > 30∘, the SOC is significantly higher than in other groups. We further use the t test in different temperature groups and find that their difference is statistically significant (Fig. S8).
To investigate the temperature impacts on the formation of secondary organic aerosols, we divided the dataset into four groups based on PM2.5 concentrations for all seasons (Fig. 3). The clean periods were defined for PM2.5 concentration < 15 µg m−3, the transition periods were defined for 15 µg m−3 < PM2.5 < 35 µg m−3, the less polluted days were defined for 35 µg m−3 < PM2.5 < 100 µg m−3, and the severe haze periods were defined for conditions with PM2.5 > 100 µg m−3. The definition of clean and haze periods is based on the national primary ambient air quality standards for annual and daily mean PM2.5 concentrations (i.e. 15 and 35 µg m−3, respectively). Below we show that the promotion of SOC at high temperatures (> 30 ∘C) is held true for pollution levels in all seasons.
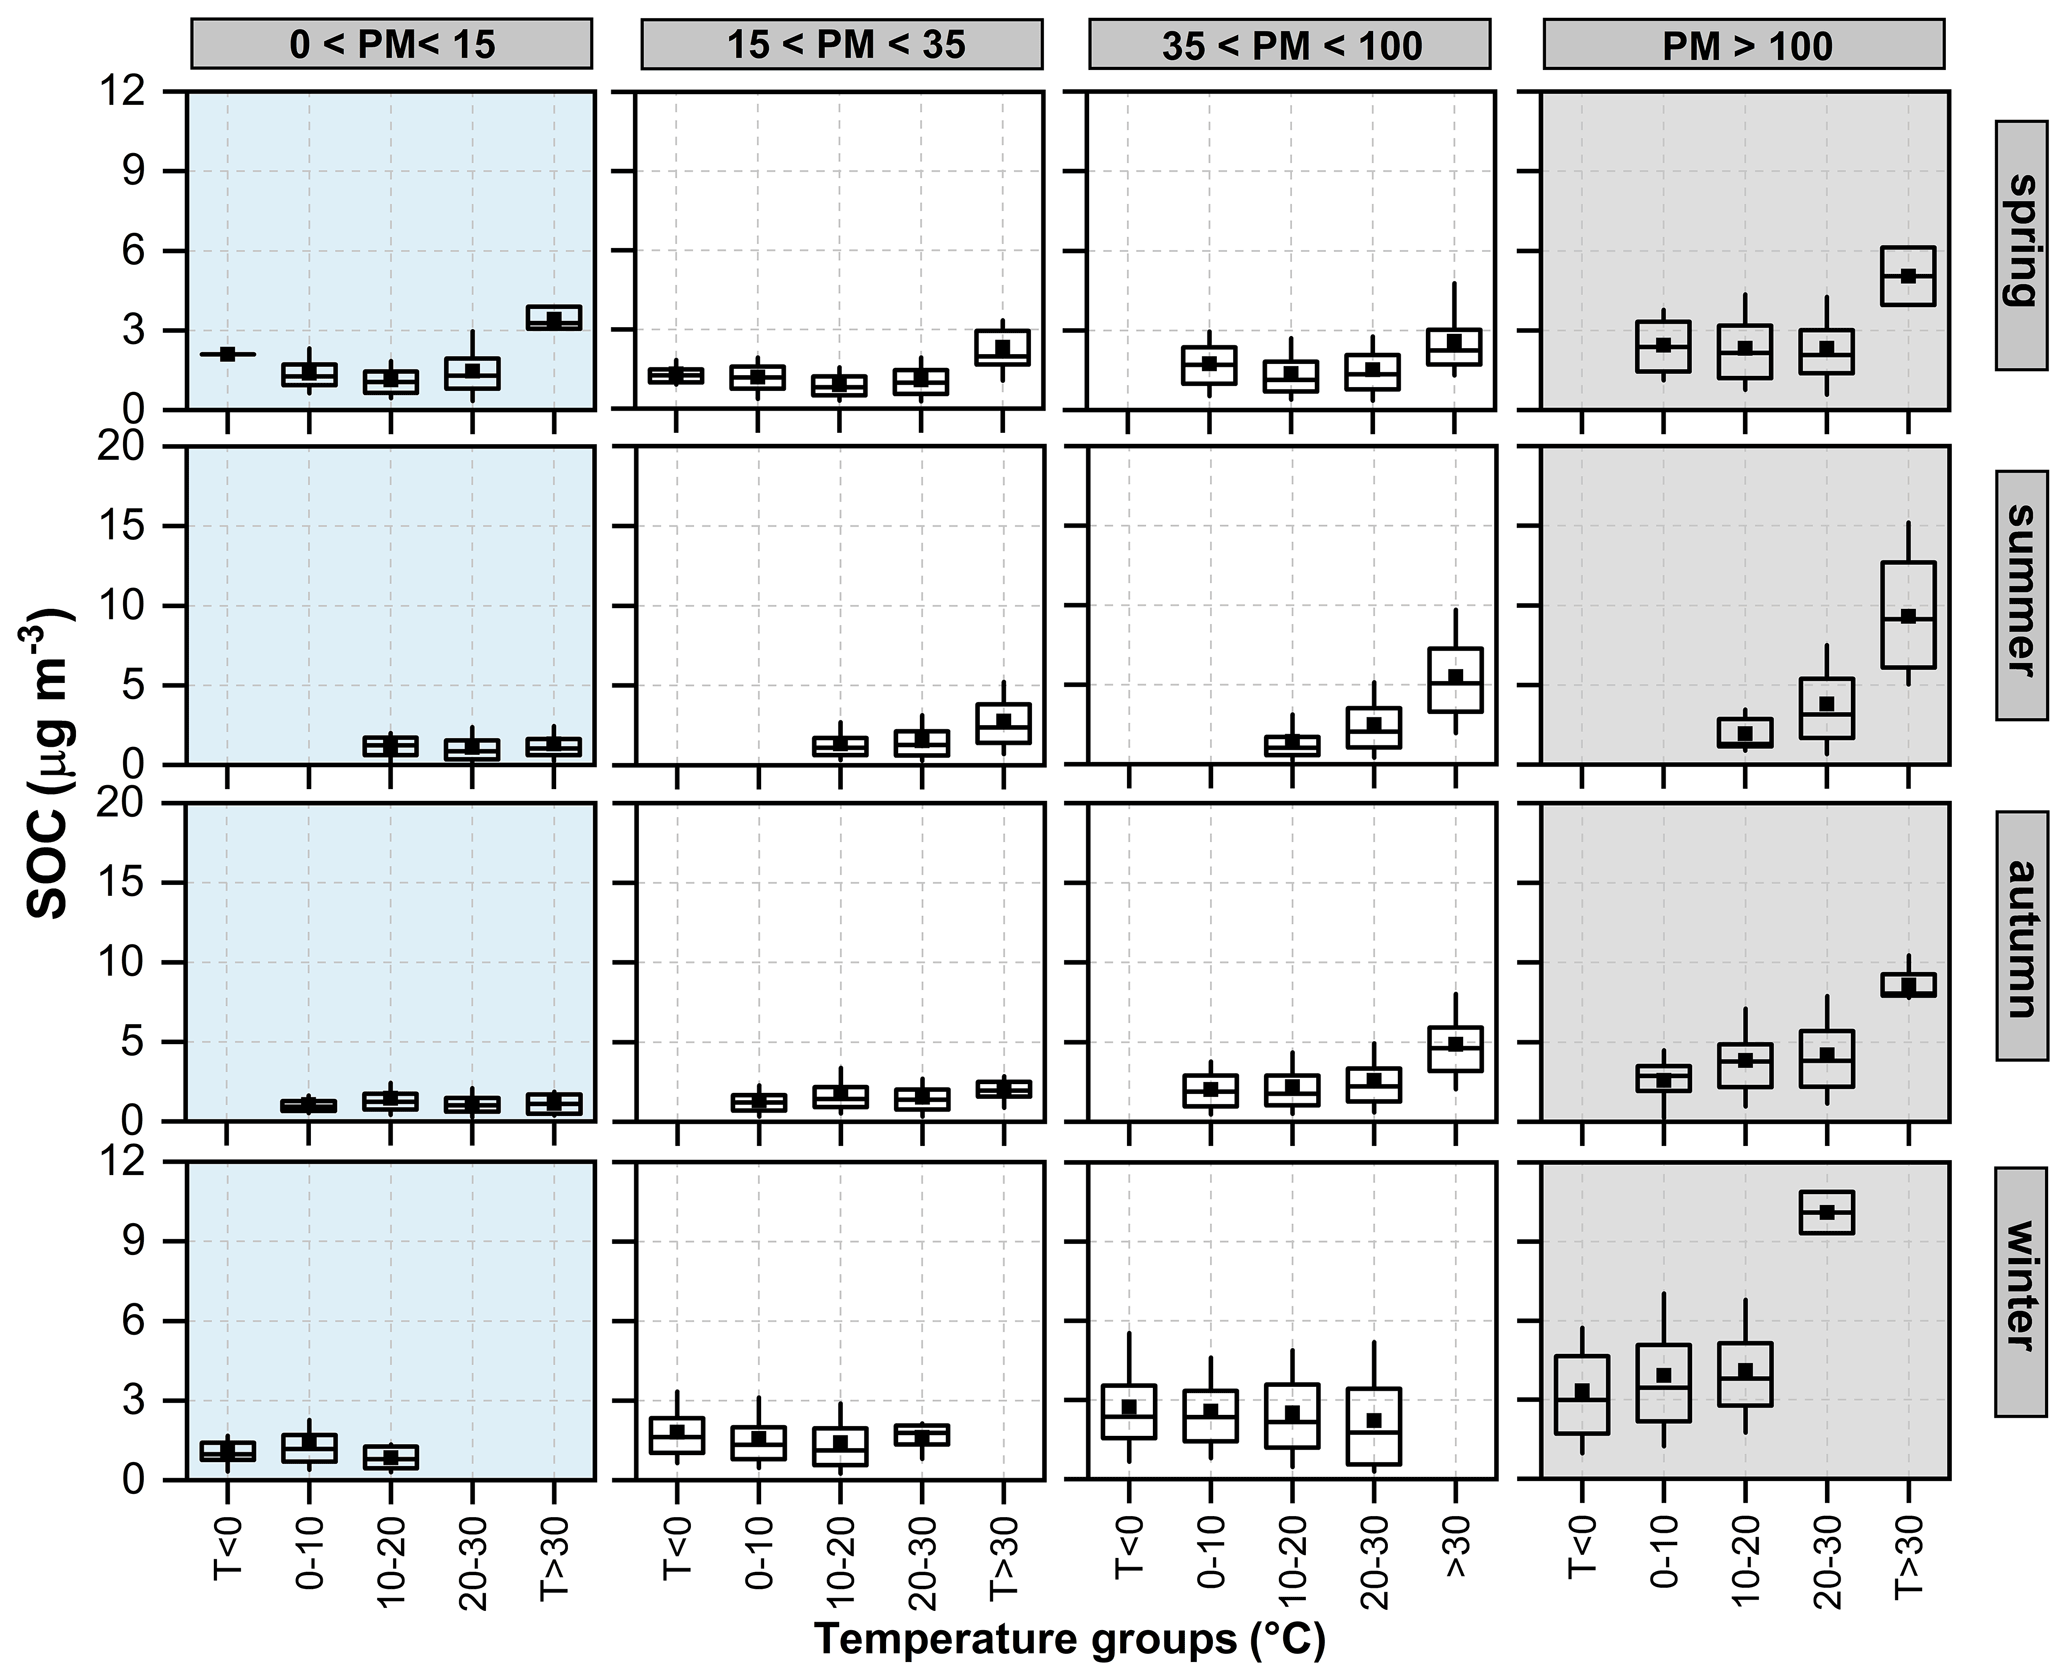
Figure 3The SOC dependence of temperature in four different PM2.5 groups for each season during 2016–2020. The box represents the 25th to 75th percentiles, the horizon line represents the median, and the 10th and the 90th percentiles are the bottom and top whiskers, respectively.
Specifically, during the clean period in spring, the SOC concentration in Dianshan Lake showed a trend of first decreasing and then increasing with temperature. When 10 ∘C < T < 20 ∘C, the average SOC concentration was the lowest (1.13 µg m−3). However, when T > 30 ∘C, the highest SOC concentration (3.41 µg m−3) more than doubled. Under the transition and mild pollution conditions, the change of SOC also showed a minimum value at 10 ∘C < T < 20 ∘C, but the concentration at this low point increased with the intensification of pollution. On heavy pollution days, when the temperature is less than 30 ∘C, the temperature has no obvious promoting effect on the generation of SOC. Similarly, during the clean period in summer, the effect of temperature increase on SOC was not significant. However, under transition and pollution conditions (including light pollution and severe pollution), the average concentration of SOC will increase significantly with the increase in temperature. Especially during periods of severe pollution, the SOC concentration increased from 1.93 µg m−3 (10 ∘C < T < 20 ∘C) to 9.30 µg m−3 (T > 30 ∘C). In autumn, except for the clean days when the mean SOC concentration was the highest (1.46 µg m−3) at 10 ∘C < T < 20 ∘C, the average SOC concentration in the pollution period increased with the increase in temperature for other periods. In comparison, winter SOC (bottom panel in Fig. 3) is most significantly affected by temperature during periods of severe pollution. During the severe pollution period, when 20 ∘C < T < 30 ∘C, the average concentration of SOC was higher than the average concentration of SOC under all conditions in other seasons, on average, reaching 10.0 µg m−3.
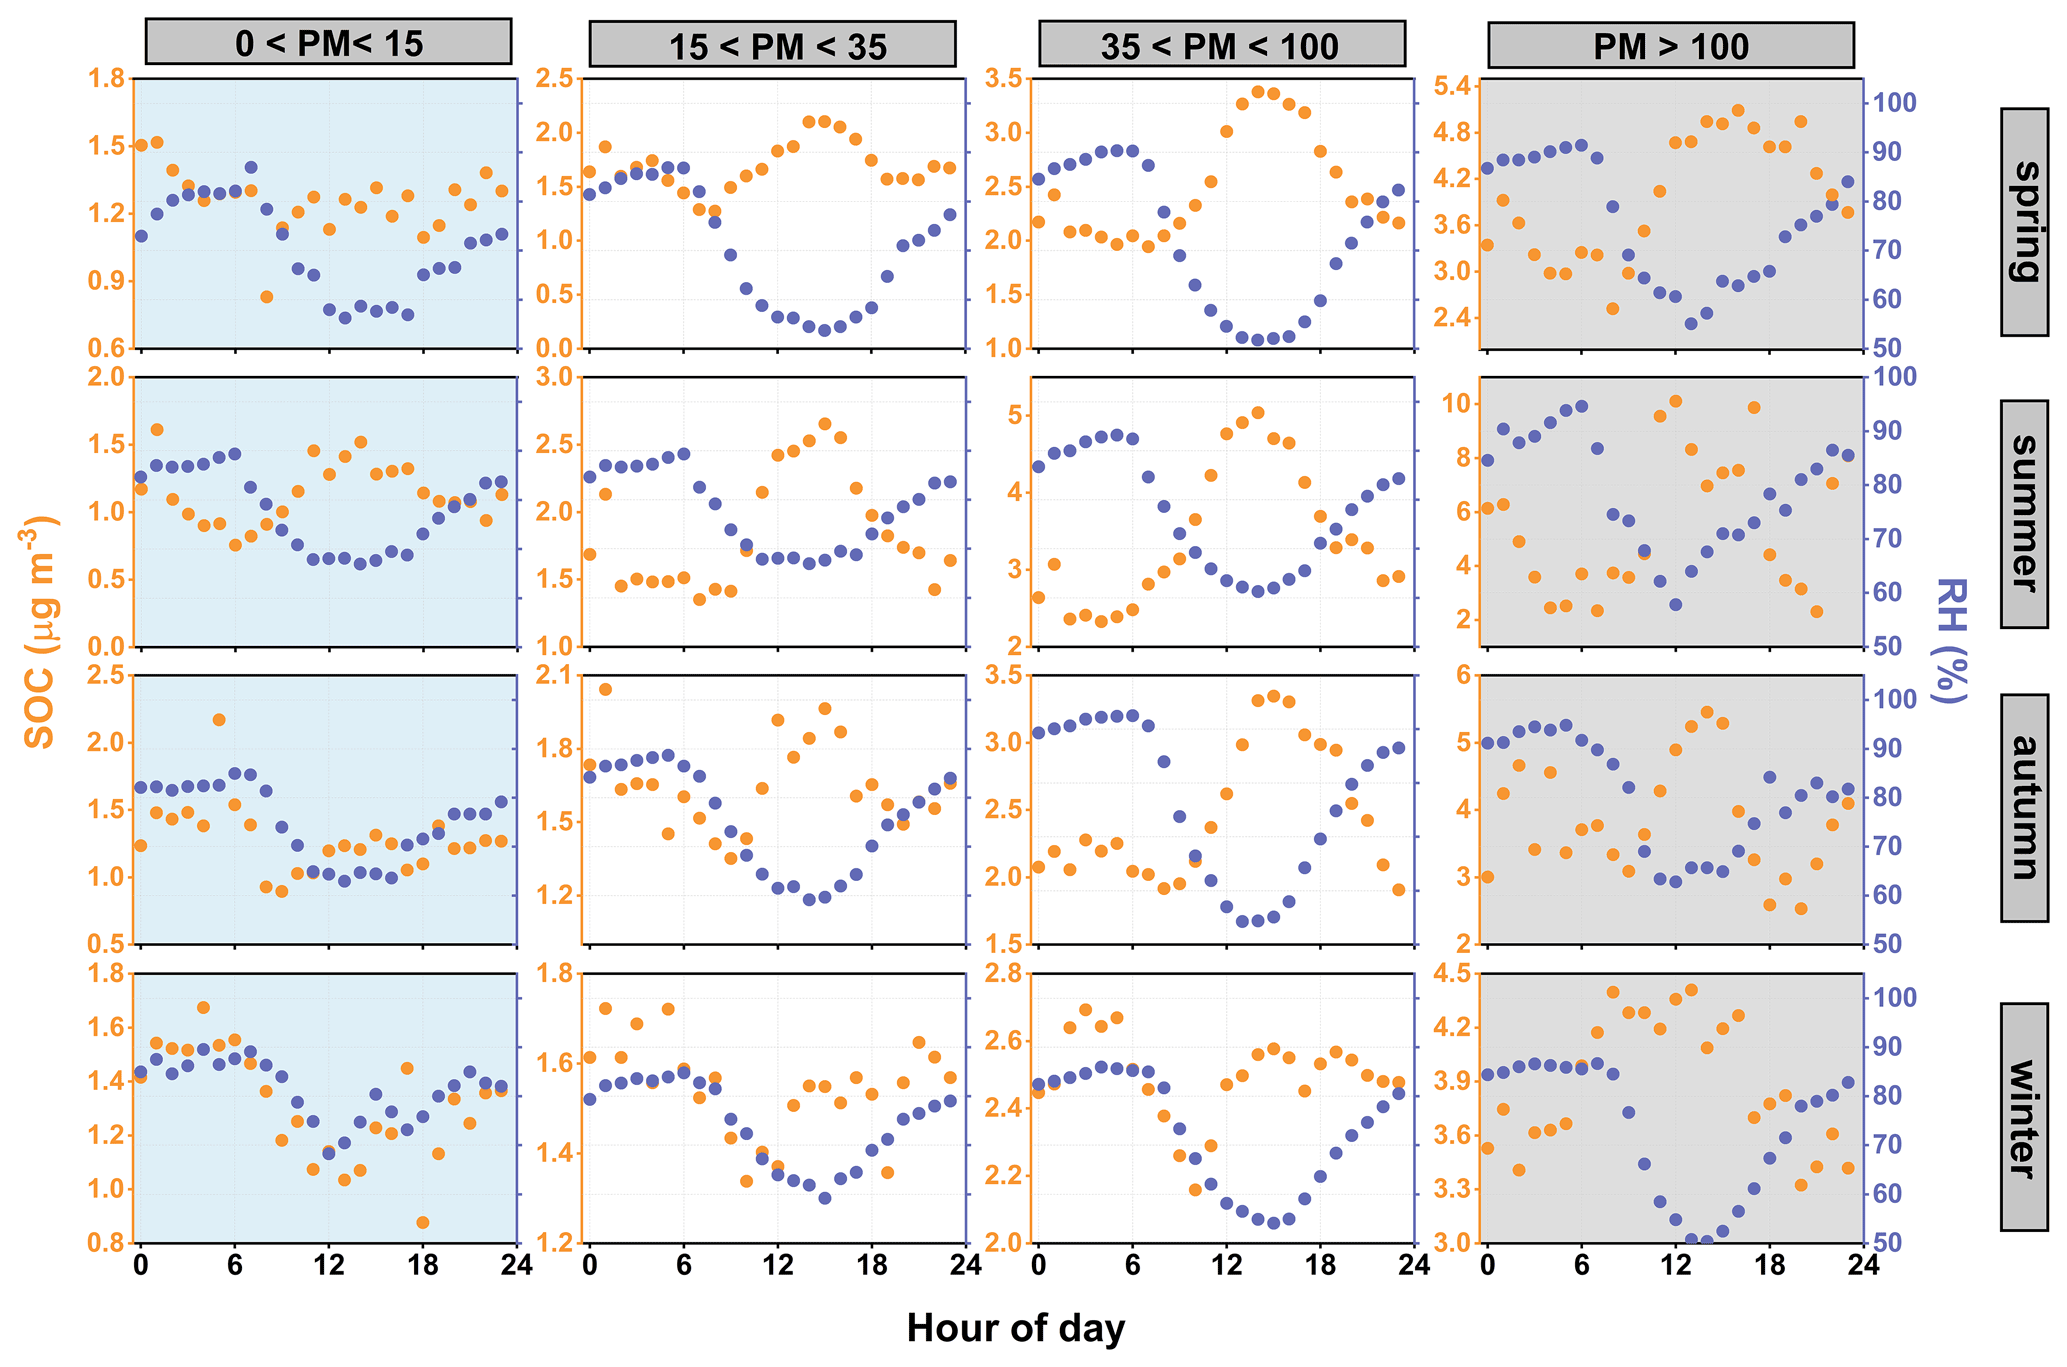
Figure 4Diurnal variations of SOC concentrations and RH in four different PM2.5 groups for each season during the period 2016–2020.
In order to further verify the effect of temperature on the SOC concentration under various pollution conditions, we conducted the Pearson correlation test between different temperature intervals and SOC concentration in each period (Fig. S9). The results show that during the clean period, the Pearson correlation coefficient between temperature and SOC concentration is only 0.31 (T < 0 ∘C), indicating that the effect of temperature on the average concentration of SOC is not significant during the clean period. The highest values of the Pearson correlation coefficient appeared at T > 30 ∘C under transitional and lightly polluted conditions, but none of them exceeded 0.5. However, during the period of heavy pollution at T > 30 ∘C, the Pearson correlation coefficient between SOC and the temperature increased to 0.62 (Fig. S9), demonstrating a more significant role of temperature in driving SOC formation during the heavy pollution periods. High temperatures can boost the emission of SOC precursors, e.g. biogenic VOCs as well as anthropogenic VOCs from, for example, solvent use (Zheng et al., 2018). Moreover, high temperatures are usually associated with strong solar radiation (Shrestha et al., 2019), which can promote the photochemical oxidation of both biogenic and anthropogenic VOCs, increasing SOC concentrations.
3.2.2 Relationship between SOC and RH
Figure 4 shows the diurnal variations of SOC concentrations and RH in four different PM2.5 groups. In general, RH is at its highest in the early morning and lowest between 13:00 and 15:00. Most of the peaks of SOC during the pollution period of each season appear at the lowest RH value at noon, whereas such a pattern is not observed during clean periods. Specifically, during clean periods in spring, the daily average of RH is 70.4 %, and the daily average concentration of SOC is 1.26 µg m−3. The peak of SOC appeared at 01:00 when the relative humidity reached 77.4 %, and then the relative humidity continues to increase gradually, reaching the highest value of the day (RH: 87.0 %) at 07:00. However, the concentration of SOC does not change significantly, all around 1.30 µg m−3. This indicates that on clean days, SOC is not significantly affected by photochemistry. In contrast, during more polluted periods in spring, SOC shows an increased concentration (> 2.10 µg m−3) at 15:00, due to photochemical oxidation, which overcomes the dilution effects caused by the increased planetary boundary layer in the afternoon. In summer, the change of RH in different PM2.5 ranges is not obvious with a mean RH of 78 %, but the difference in SOC concentration is significant. The daily average concentration of SOC in severe pollution is roughly 5 times that of clean days. In the clean periods of summer, the night-time peak of SOC is 1.61 µg m−3, which is larger than the daytime peak of 1.52 µg m−3. With the intensification of the degree of pollution, the difference between the peak daytime SOC and the peak night-time SOC gradually increased in summer with low RH associated with high SOC in the afternoon.
During heavy pollution in winter, RH does not change significantly between 00:00 and 06:00, and the night-time peak of SOC appears at 01:00 (SOC: 3.75 µg m−3). During the day, the RH gradually decreased to the lowest value of 50.4 % at 14:00. At the same time, the concentration of SOC increases significantly and remains at a high concentration level from 09:00 to 16:00, suggesting that the photochemical formation of SOC might still be very efficient and important, even in winter when solar radiation was supposedly less intense than in summer.
3.2.3 Photochemical formation of SOC
The concentration of oxidant Ox (Ox= O3+ NO2) is usually used as a proxy to indicate the atmospheric oxidising capacity associated with photochemical reactions (Wang et al., 2017). The daily Ox minimum occurred in the morning followed by a sharp increase to a peak in the afternoon in all seasons (Fig. S10). Similarly, SOC also showed a large increase in the afternoon in all seasons, with peak concentrations within the range 2.40–3.00 µg m−3 (Fig. S10). The concurrent increase in SOC and Ox in the afternoon suggests that photochemical formation might be a dominant formation pathway for SOC, even in winter. This is different from the formation pathways of SOC in north China, where aqueous phase chemistry is often reported to be the major formation pathway of SOC in winter (Lin et al., 2020; An et al., 2019; Sun et al., 2015; Chen et al., 2019).
The positive relationship between SOC and Ox was well presented in four different PM2.5 bins in different seasons (Fig. 5). In spring, SOC correlated positively with Ox, with the concentrations of SOC during the haze periods ∼ 1.8–3.2 times higher than those during the clean periods. The SOC in summer and autumn showed a similar trend, with higher levels of Ox significantly associated with the increased SOC concentrations. The average concentration of SOC reached its highest during the severe haze period in summer and autumn, with an average SOC of > 6.00 µg m−3 when Ox was > 200 µg m−3. For the PM2.5 bin of > 100 µg m−3 in winter, the concentration of SOC showed a significant increase (> 6.00 µg m−3; mean value) from < 4.00 µg m−3 when Ox increased to > 200 µg m−3 from < 50 µg m−3. In contrast, the increase in SOC for other PM2.5 bins was less significant in winter, owing to the generally low Ox for PM2.5 of < 100 µg m−3 (Fig. 5).
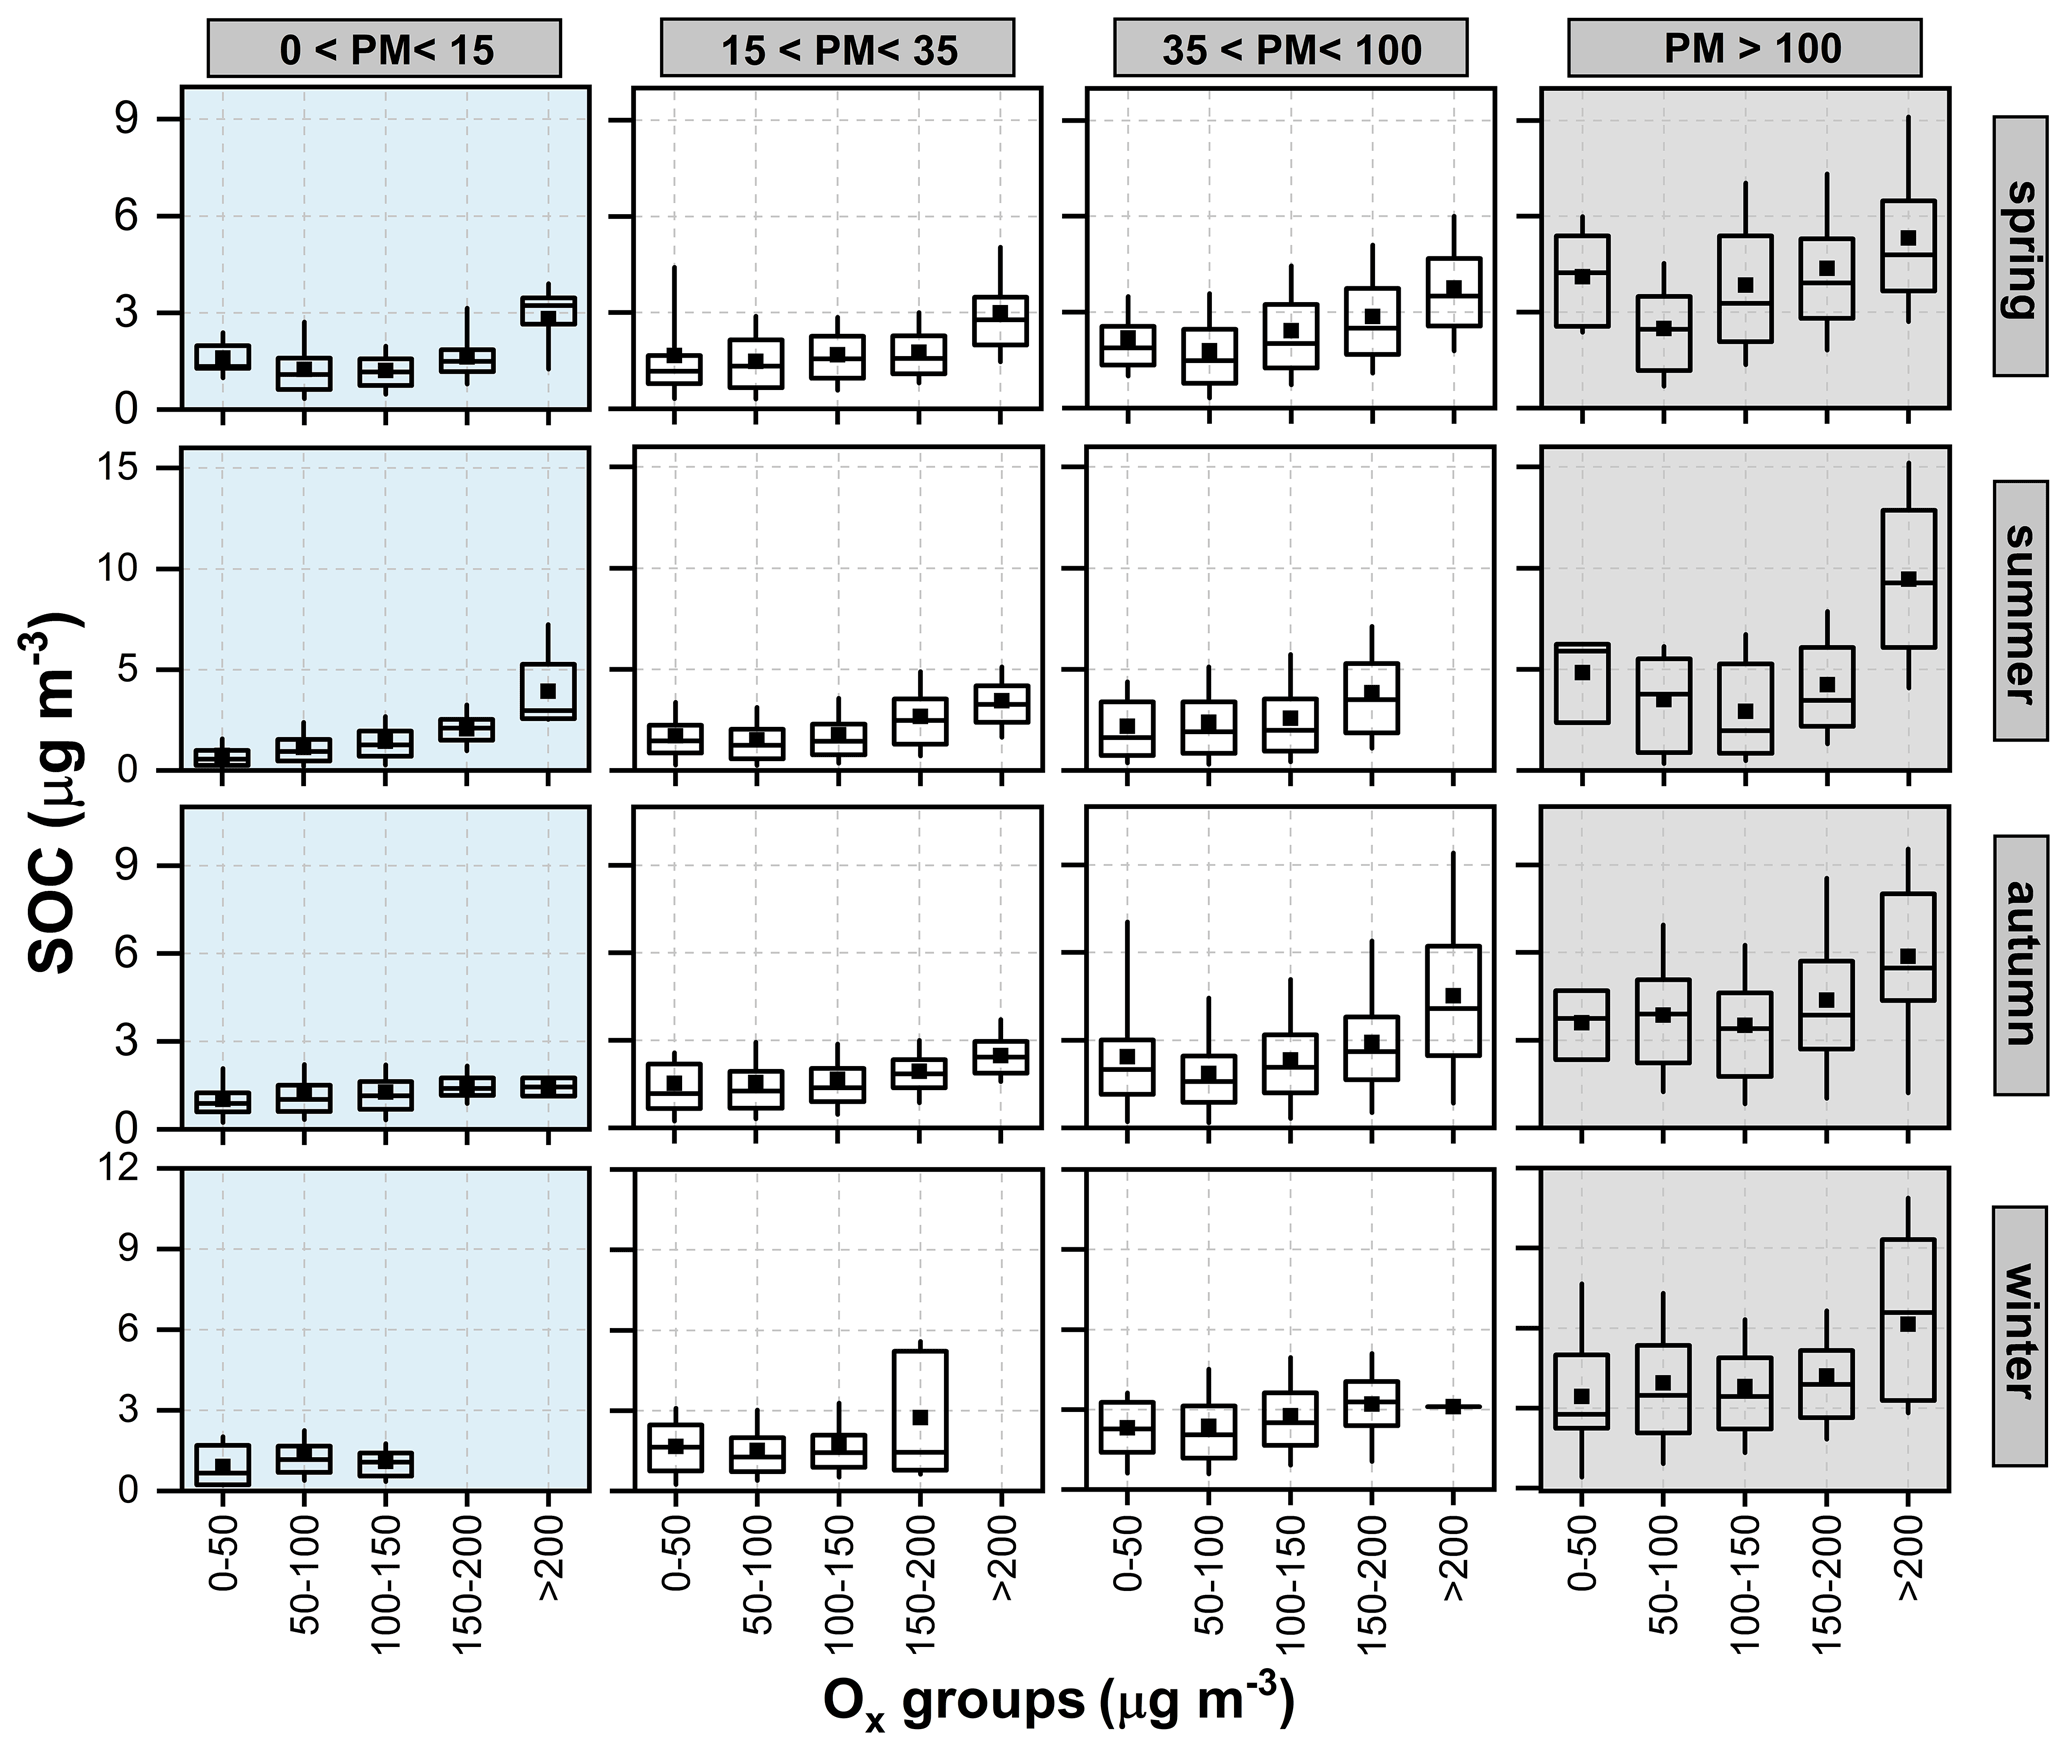
Figure 5The SOC dependence of Ox in four different PM2.5 groups for each season during the period 2016–2020. The box represents the 25th to 75th percentiles, the horizon line represents the median, and the 10th and the 90th percentiles are the bottom and top whiskers, respectively.
3.2.4 Relationship between SOC and wind speed/direction
Wind speed is an important factor controlling the concentrations of carbonaceous aerosols. In this study, EC and POC concentrations show evident WS dependence, with higher concentrations in association with lower WS (Fig. S11). This is consistent with the general pattern that pollution episodes are likely to occur under lower WS ( < 1 m s−1) (Ren, 2018). At the same time, the relationship between the concentration of carbonaceous aerosols and WS can also reflect that its main contribution comes from local emissions or regional transmission. In particular, in spring, summer, and autumn, the concentration of carbonaceous aerosols decreased with the increase in WS, indicating that in these seasons, local emissions at low WS are the main contribution of carbonaceous aerosols. It was worth noting that in winter, on the one hand, the concentration of carbonaceous aerosol under each WS gradient is higher than that of other seasons. On the other hand, when the WS is higher than 4.5 m s−1, the concentration of carbonaceous aerosol is also increased. Specifically, the concentration of EC increased by 12.4 %, whereas POC increased by 11.7 %, indicating the contribution of the transport in winter to carbonaceous aerosols.
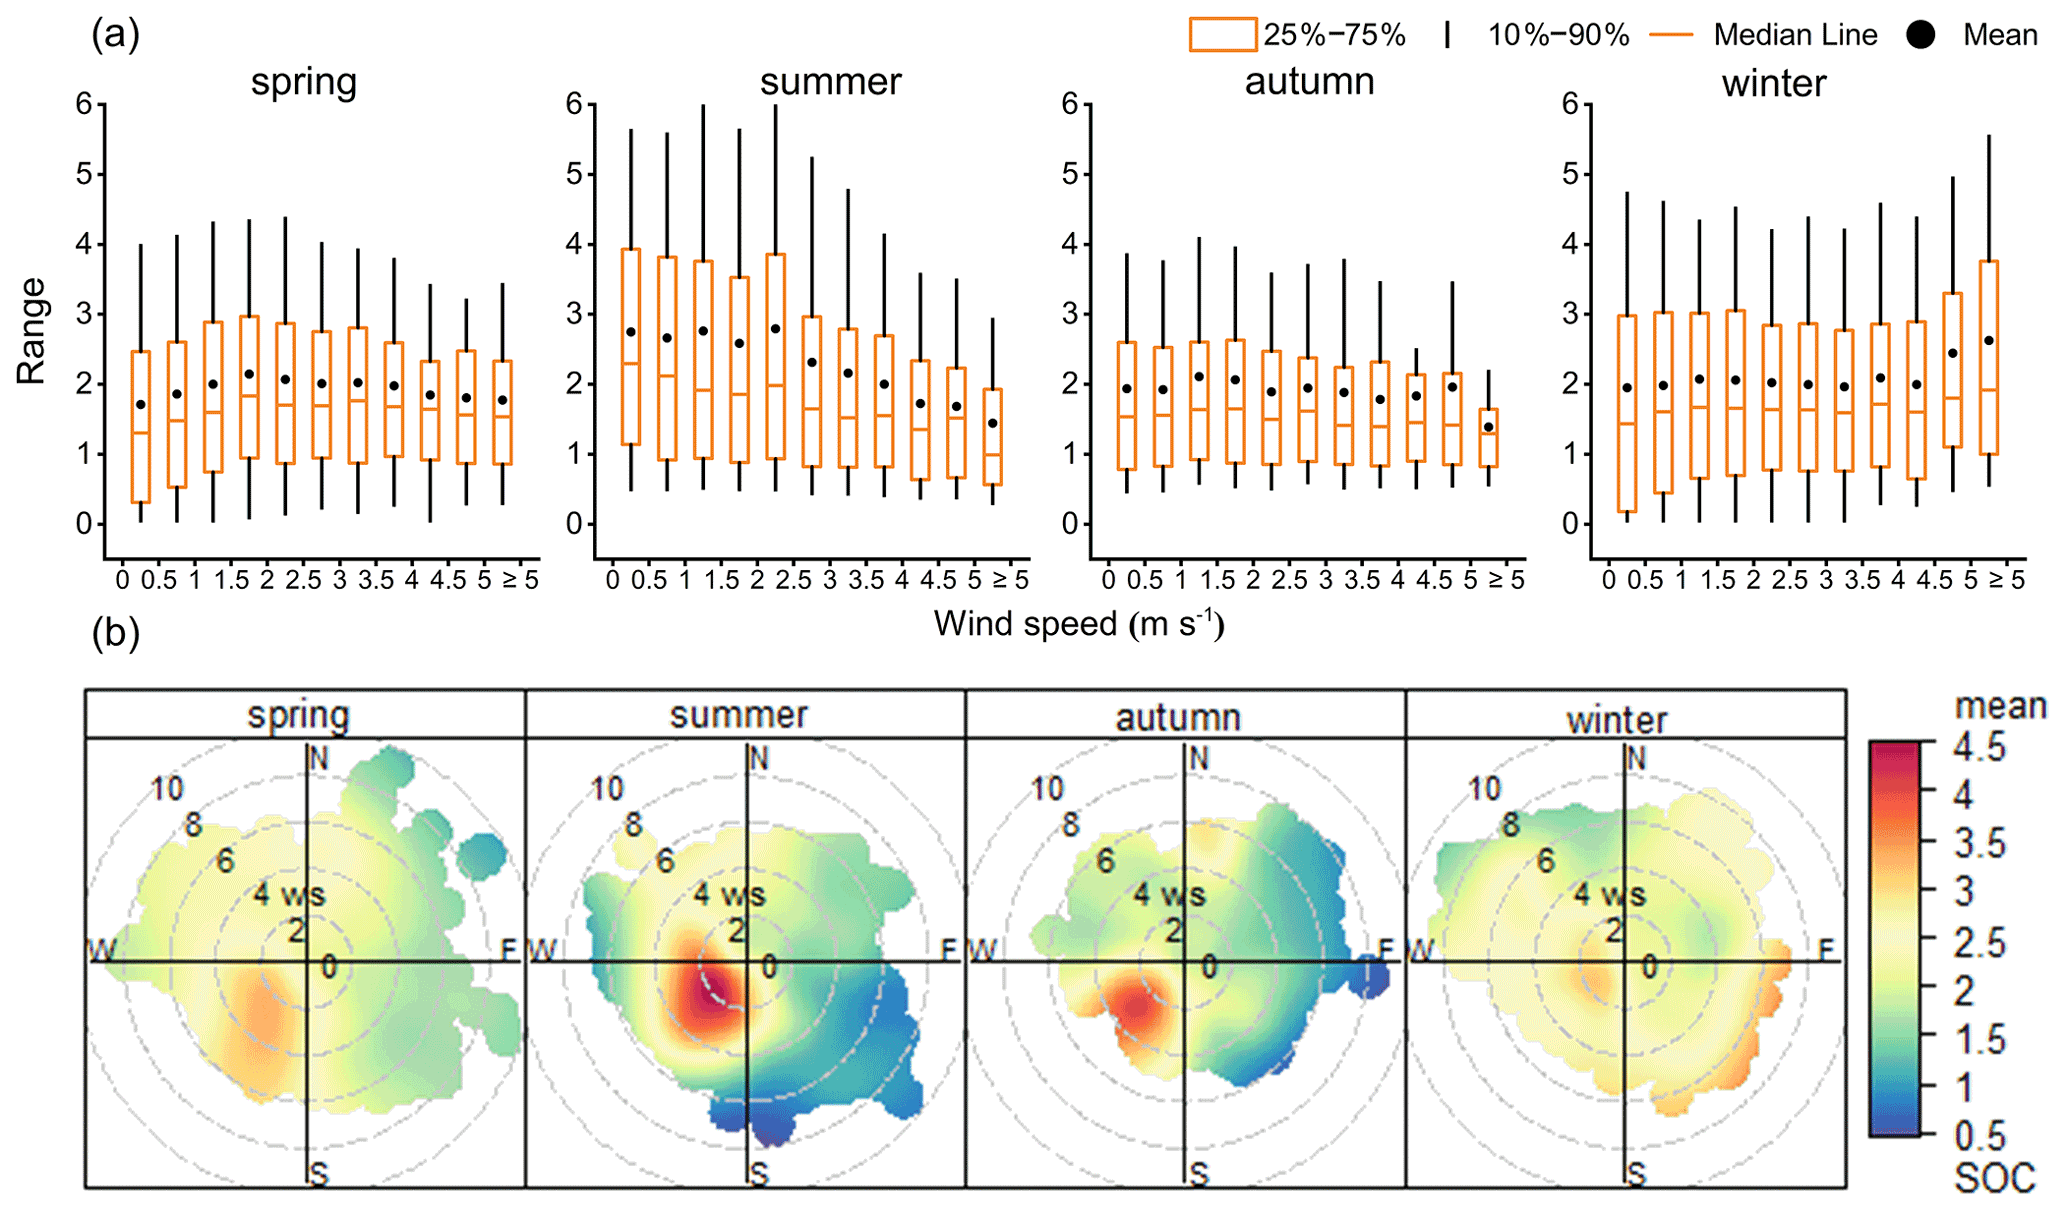
Figure 6(a) Box plots of SOC mass concentrations as a function of wind speed sectors over the entire sampling period. (b) Bivariate polar plots of seasonal SOC concentrations (µg m−3) over the entire sampling period in Dianshan Lake.
In contrast, SOC is affected differently by WS. The dependence of SOC concentrations on WS is shown in Fig. 6a. In spring, the concentration of SOC is about 2 µg m−3, and the concentration gradient of SOC increases slightly with the increase in WS. When the WS is greater than 1.5 m s−1 and less than 2 m s−1, the concentration of SOC reaches the highest value of 2.15 µg m−3. When the WS is less than 0.5 m s−1, the SOC concentration is 1.37 µg m−3, and when the WS is greater than 5 m s−1, the SOC concentration is 1.78 µg m−3, with an increase of 29.8 %. In summer, the concentration of SOC decreases with the WS gradient. When the WS is 2∼ 2.5 m s−1, the SOC concentration is the highest (2.79 µg m−3). When the WS is greater than 5 m s−1, the SOC concentration is at its lowest (1.40 µg m−3). In autumn, the SOC does not appear to change significantly (∼ 2 µg m−3) when the WS gradient gradually increased. In winter, when the WS is less than 4.5 m s−1, the SOC concentration is about 2 µg m−3 (mean value is 2.03 µg m−3). When the WS is greater than 4.5 m s−1, the SOC concentration increases to 2.45 µg m−3. It is worth noting that when the WS is greater than 5 m s−1, the concentration of SOC increases by 29.1 % (2.62 µg m−3), reaching the highest average concentration of SOC under different WS gradients in winter. This shows that the main contribution of Shanghai SOC in winter comes from regional transmission.
The seasonal bivariate polar plots of SOC concentrations for the period 2016–2020 are shown in Fig. 6b. The high concentration load of SOC near the sampling site in all seasons mainly occurs in the southwest direction and under the condition of low WS (less than 4 m s−1). The concentration distributions of SOC (Fig. 6b) and OC were similar in spring (Fig. S12c), and the highest concentration area appeared in the southwest region. The distribution and loading of SOC with a high concentration in summer (SOC > 4 µg m−3) is closer to the sampling point (dense distribution in WS around 2 m s−1), further proving the previous conclusion that the main contribution of SOC in summer is from a local build. The relationship between SOC and WD remains unchanged in autumn. However, the high SOC loading area is still located southwest of the sampling point, but the concentration is significantly lower than that in summer and autumn, which is closer to the sampling point. In addition, in the southeast direction, the area with WS greater than 6 m s−1 has a high loading area of SOC, and it is speculated that this part of SOC may be transmitted from the area near the east coast.
3.3 Analysis of potential source regions of SOC
The CWT results demonstrate the spatial distributions of SOC in the form of the SOC weighted 72 h backward trajectories (Fig. 7). The CWT results are generally consistent with the corresponding polar plots, as shown in Sect. 3.2.4. Specifically, the potential source areas with high CWT values for SOC were located in the surrounding areas of Shanghai. In spring, SOC mainly comes from North China and the middle and lower reaches of the Yangtze River, specifically from central Anhui, southern Jiangsu, central and northern Zhejiang, and northern Fujian; in summer, the high SOC values in southern Shanghai (SOC > 3.5 µg m−3) mainly come from central and southern Anhui, Zhejiang, Fujian; there are also great contributions from offshore (the northern South China Sea and East China Sea). The SOC in Shanghai in autumn mainly comes from the northern and central regions of Zhejiang. Southern Jiangsu is the main source of SOC in Shanghai in winter, followed by northern Zhejiang; on the other hand, the northern long-distance transmission from the North China Plain further extends to Inner Mongolia, Mongolia, and the Russian border.
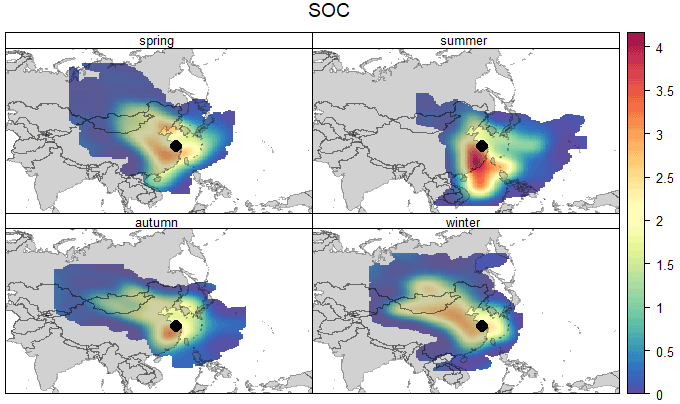
Figure 7Back trajectory concentrations showing mean SOC concentrations (µg m−3) based on the CWT approach in four seasons.
We further analysed the potential sources of Shanghai SOC under different PM concentrations (Fig. 8). The concentrations of SOC during the clean period were all lower than 2 µg m−3, and there were three main source pathways, namely, the northern part of the North China Plain, Inner Mongolia, and eastern Mongolia; the Yellow Sea and the Korean Peninsula; Zhejiang Province and northern Fujian Province. The source area of SOC during the transition period was further expanded, and the concentration of SOC in the main area was between 2 and 3 µg m−3, which was basically consistent with the source area coverage during the cleaning period. It is worth noting that a high SOC loading appeared in the coastal area of Fujian, presumably related to secondary aerosols transported by oceanic air masses. During the transition periods (35 < PM < 100 µg m−3), the source area of SOC expanded, and the area with SOC concentration greater than 3.5 µg m−3 became clearer, mainly concentrated in Zhejiang, Fujian, and offshore areas. The main transmission areas are eastern Inner Mongolia, Hebei Province, and the North China Plain, all the way southward to Anhui, connecting with the source areas of Zhejiang Province and Fujian Province. During high pollution periods, the areas with SOC concentrations higher than 4 µg m−3 were mainly concentrated in two areas, one was from southeastern Mongolia in the north, through eastern Inner Mongolia and Hebei Province, through Shandong and Jiangsu and finally to Shanghai; the other source area was in the south of Shanghai Zhejiang Province, Fujian Province, and eastern Jiangxi Province. Overall, the main potential source areas of Shanghai SOC are the YRD, the North China Plain, northern China, Inner Mongolia, and eastern China provinces and offshore areas, such as Zhejiang Province, Fujian Province, and the South China Sea.
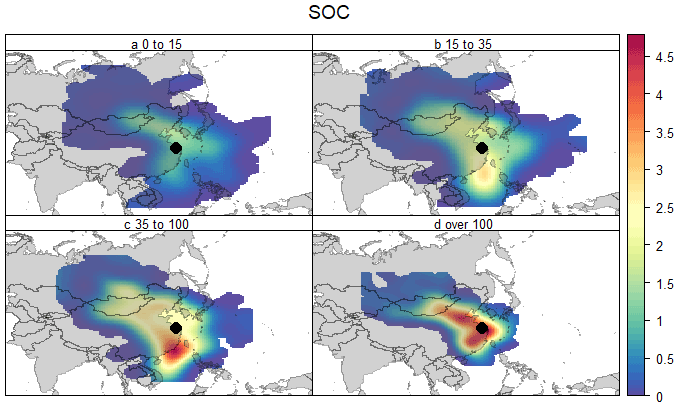
Figure 8Back trajectory concentrations showing mean SOC concentrations (µg m−3) based on the CWT approach in four different PM groups.
In this study, the hourly mass concentrations of OC and EC in PM2.5 were continuously measured from 1 January 2016 to 31 December 2020 at a supersite in Shanghai. OC subtypes of POC and SOC were estimated using the novel MRS method. Based on the 5-year measurements, the interannual, monthly, seasonal, and diurnal variations in OC and EC, as well as OC subtypes, are presented. By examining the relationship between SOC and meteorological parameters (e.g., temperature, RH, and WS), as well as Ox, the sources, formation, and transformation mechanisms of ambient SOC are revealed. We show that SOC formation is greatly enhanced at high temperatures (> 30 ∘C), whereas it correlates inversely with RH. In particular, we show that the photochemical formation of SOC is still very efficient and is the major formation pathway, even in winter when solar radiation was supposedly less intense than in summer. High EC and POC concentrations are found to be associated with low WS, which is consistent with their primary nature from local emission. Moreover, increased SOC concentrations are also found to be associated with high WS (> 5 m s−1) in winter, which is increased by 29.1 % (2.62 µg m−3) when compared with that during lower winds, suggesting regional sources of SOC in winter. By analysing the potential source regions using the CWT algorithm, the geographic regions of SOC are found to be mainly associated with transport from outside Shanghai (SOC > 3.5 µg m−3) including central and southern Anhui, Zhejiang, and Fujian. Our results elucidate the trends in SOC and POC over recent years in Shanghai, which are important for evaluating the effectiveness of the air pollution control measures and holding important implications for policy making. Given that SOC was associated with high temperature and regional transport, global warming is likely increasing the importance of SOC. As SOC is regional, combined efforts in reducing regional sources of SOC precursors are needed to further reduce the air pollution events in Shanghai.
The data presented in this study are available at the Zenodo data archive https://doi.org/10.5281/zenodo.6473085 (Wang et al., 2022).
The supplement related to this article is available online at: https://doi.org/10.5194/acp-22-12789-2022-supplement.
MW, QW, ZZ, QY and HT designed the study. YD, JH, JC and SG conducted field campaign. MW, WX, ZZ, XL, SH and LC performed data analysis. MW prepared the manuscript with input from all co-authors, ZW, YH, GX, JC, QF and SL provided input for revision before submission.
The contact author has declared that none of the authors has any competing interests.
Publisher’s note: Copernicus Publications remains neutral with regard to jurisdictional claims in published maps and institutional affiliations.
This work was supported by the Environment and Conservation Fund – Environmental Research, Technology Demonstration, and Conference Projects (ECF 63/2019), the RGC Theme-based Research Scheme (T24-504/17-N), the RGC Theme-based Research Scheme (T31-603/21-N), the Key Research and Development Projects of Shanghai Science and Technology Commission (20dz1204000), the Key Research and Development Projects of Shanghai Science and Technology Commission (19dz1205000), and Hangzhou Qianjiang Distinguished Experts Project. We also thank the contribution of the State Ecology and Environment Scientific Observation and Research Station for the Yangtze River Delta at Dianshan Lake.
This work was supported by the Environment and Conservation Fund – Environmental Research, Technology Demonstration, and Conference Projects (ECF 63/2019), the RGC Theme-based Research Scheme (T24-504/17-N), the RGC Theme-based Research Scheme (T31-603/21-N), the Key Research and Development Projects of Shanghai Science and Technology Commission (20dz1204000), the Key Research and Development Projects of Shanghai Science and Technology Commission (19dz1205000), and the Hangzhou Qianjiang Distinguished Experts Project.
This paper was edited by Harald Saathoff and reviewed by two anonymous referees.
An, Z., Huang, R.-J., Zhang, R., Tie, X., Li, G., Cao, J., Zhou, W., Shi, Z., Han, Y., Gu, Z., and Ji, Y.: Severe haze in northern China: A synergy of anthropogenic emissions and atmospheric processes, P. Natl. Acad. Sci. USA, 116, 8657, https://doi.org/10.1073/pnas.1900125116, 2019.
Bond, T. C., Doherty, S. J., Fahey, D. W., Forster, P. M., Berntsen, T., DeAngelo, B. J., Flanner, M. G., Ghan, S., Kärcher, B., Koch, D., Kinne, S., Kondo, Y., Quinn, P. K., Sarofim, M. C., Schultz, M. G., Schulz, M., Venkataraman, C., Zhang, H., Zhang, S., Bellouin, N., Guttikunda, S. K., Hopke, P. K., Jacobson, M. Z., Kaiser, J. W., Klimont, Z., Lohmann, U., Schwarz, J. P., Shindell, D., Storelvmo, T., Warren, S. G., and Zender, C. S.: Bounding the role of black carbon in the climate system: A scientific assessment, J. Geophys. Res.-Atmos., 118, 5380-5552, https://doi.org/10.1002/jgrd.50171, 2013.
Cao, J. J., Lee, S. C., Ho, K. F., Zhang, X. Y., Zou, S. C., Fung, K., Chow, J. C., and Watson, J. G.: Characteristics of carbonaceous aerosol in Pearl River Delta Region, China during 2001 winter period, Atmos. Environ., 37, 1451–1460, https://doi.org/10.1016/S1352-2310(02)01002-6, 2003.
Cao, J. J., Lee, S. C., Ho, K. F., Zou, S. C., Fung, K., Li, Y., Watson, J. G., and Chow, J. C.: Spatial and seasonal variations of atmospheric organic carbon and elemental carbon in Pearl River Delta Region, China, Atmos. Environ., 38, 4447–4456, https://doi.org/10.1016/j.atmosenv.2004.05.016, 2004.
Cao, J. J., Wu, F., Chow, J. C., Lee, S. C., Li, Y., Chen, S. W., An, Z. S., Fung, K. K., Watson, J. G., Zhu, C. S., and Liu, S. X.: Characterization and source apportionment of atmospheric organic and elemental carbon during fall and winter of 2003 in Xi'an, China, Atmos. Chem. Phys., 5, 3127–3137, https://doi.org/10.5194/acp-5-3127-2005, 2005.
Cao, J. J., Lee, S. C., Chow, J. C., Watson, J. G., Ho, K. F., Zhang, R. J., Jin, Z. D., Shen, Z. X., Chen, G. C., Kang, Y. M., Zou, S. C., Zhang, L. Z., Qi, S. H., Dai, M. H., Cheng, Y., and Hu, K.: Spatial and seasonal distributions of carbonaceous aerosols over China, J. Geophys. Res.-Atmos., 112, D22S11, https://doi.org/10.1029/2006JD008205, 2007.
Cao, J.-J., Zhu, C.-S., Tie, X.-X., Geng, F.-H., Xu, H.-M., Ho, S. S. H., Wang, G.-H., Han, Y.-M., and Ho, K.-F.: Characteristics and sources of carbonaceous aerosols from Shanghai, China, Atmos. Chem. Phys., 13, 803–817, https://doi.org/10.5194/acp-13-803-2013, 2013.
Chang, Y., Deng, C., Cao, F., Cao, C., Zou, Z., Liu, S., Lee, X., Li, J., Zhang, G., and Zhang, Y.: Assessment of carbonaceous aerosols in Shanghai, China – Part 1: long-term evolution, seasonal variations, and meteorological effects, Atmos. Chem. Phys., 17, 9945–9964, https://doi.org/10.5194/acp-17-9945-2017, 2017.
Chatterjee, A., Mukherjee, S., Dutta, M., Ghosh, A., Ghosh, S. K., and Roy, A.: High rise in carbonaceous aerosols under very low anthropogenic emissions over eastern Himalaya, India: Impact of lockdown for COVID-19 outbreak, Atmos. Environ., 244, 117947, https://doi.org/10.1016/j.atmosenv.2020.117947, 2021.
Chen, D., Cui, H., Zhao, Y., Yin, L., Lu, Y., and Wang, Q. g.: A two-year study of carbonaceous aerosols in ambient PM2.5 at a regional background site for western Yangtze River Delta, China, Atmos. Res., 183, 351–361, 2017.
Chen, L., Zhu, J., Liao, H., Gao, Y., Qiu, Y., Zhang, M., Liu, Z., Li, N., and Wang, Y.: Assessing the formation and evolution mechanisms of severe haze pollution in the Beijing–Tianjin–Hebei region using process analysis, Atmos. Chem. Phys., 19, 10845–10864, https://doi.org/10.5194/acp-19-10845-2019, 2019.
Chow, J. C. and Watson, J. G.: Review of PM2.5 and PM10 Apportionment for Fossil Fuel Combustion and Other Sources by the Chemical Mass Balance Receptor Model, Energ. Fuel., 16, 222–260, https://doi.org/10.1021/ef0101715, 2002.
Dod, R. L., Giauque, R. D., Novakov, T., Weihan, S., Quipeng, Z., and Wenzhi, S.: Sulfate and carbonaceous aerosols in Beijing China, Atmos. Environ., 20, 2271–2275, https://doi.org/10.1016/0004-6981(86)90317-3, 1986.
Draxler, R. R. and Rolph, G. D.: HYSPLIT (HYbrid Single-Particle Lagrangian Integrated Trajectory) model access via NOAA ARL READY website, NOAA Air Resources Laboratory, Silver Spring, http://www.arl.noaa.gov/ready/hyspit4.html (last access: 21 January 2021), 2003.
Fleming, Z. L., Monks, P. S., and Manning, A. J.: Review: Untangling the influence of air-mass history in interpreting observed atmospheric composition, Atmos. Res., 104/105, 1–39, https://doi.org/10.1016/j.atmosres.2011.09.009, 2012.
Fu, Q., Zhuang, G., Wang, J., Xu, C., Huang, K., Li, J., Hou, B., Lu, T., and Streets, D. G.: Mechanism of formation of the heaviest pollution episode ever recorded in the Yangtze River Delta, China, Atmos. Environ., 42, 2023–2036, https://doi.org/10.1016/j.atmosenv.2007.12.002, 2008.
Galindo, N., Yubero, E., Clemente, A., Nicolás, J., Navarro-Selma, B., and Crespo, J.: Insights into the origin and evolution of carbonaceous aerosols in a mediterranean urban environment, Chemosphere, 235, 636–642, 2019.
Hallquist, M., Wenger, J. C., Baltensperger, U., Rudich, Y., Simpson, D., Claeys, M., Dommen, J., Donahue, N. M., George, C., Goldstein, A. H., Hamilton, J. F., Herrmann, H., Hoffmann, T., Iinuma, Y., Jang, M., Jenkin, M. E., Jimenez, J. L., Kiendler-Scharr, A., Maenhaut, W., McFiggans, G., Mentel, Th. F., Monod, A., Prévôt, A. S. H., Seinfeld, J. H., Surratt, J. D., Szmigielski, R., and Wildt, J.: The formation, properties and impact of secondary organic aerosol: current and emerging issues, Atmos. Chem. Phys., 9, 5155–5236, https://doi.org/10.5194/acp-9-5155-2009, 2009.
Han, Y. M., Cao, J. J., Chow, J. C., Watson, J. G., An, Z. S., and Liu, S. X.: Elemental carbon in urban soils and road dusts in Xi'an, China and its implication for air pollution, Atmos. Environ., 43, 2464–2470, https://doi.org/10.1016/j.atmosenv.2009.01.040, 2009.
He, K., Yang, F., Ma, Y., Zhang, Q., Yao, X., Chan, C. K., Cadle, S., Chan, T., and Mulawa, P.: The characteristics of PM2. 5 in Beijing, China, Atmos. Environ., 35, 4959–4970, 2001.
Ho, K. F., Lee, S. C., Yu, J. C., Zou, S. C., and Fung, K.: Carbonaceous characteristics of atmospheric particulate matter in Hong Kong, Sci. Total Environ., 300, 59–67, https://doi.org/10.1016/S0048-9697(02)00281-4, 2002.
Ho, K. F., Engling, G., Ho, S. S. H., Huang, R. J., Lai, S. C., Cao, J. J., and Lee, S. C.: Seasonal variations of anhydrosugars in PM2.5 in the Pearl River Delta Region, China, Tellus B, 66, 22577, https://doi.org/10.3402/tellusb.v66.22577, 2014.
Ho, S. S. H., Li, L., Qu, L., Cao, J., Lui, K. H., Niu, X., Lee, S.-C., and Ho, K. F.: Seasonal behavior of water-soluble organic nitrogen in fine particulate matter (PM2.5) at urban coastal environments in Hong Kong, Air Qual. Atmos. Hlth., 12, 389–399, https://doi.org/10.1007/s11869-018-0654-5, 2019.
Hopke, P.: Receptor Modeling for Air Quality Management, Environ. Sci. Technol., 8, 289–300, 1991.
Hsu, Y.-K., Holsen, T. M., and Hopke, P. K.: Comparison of hybrid receptor models to locate PCB sources in Chicago, Atmos. Environ., 37, 545–562, 2003.
Ji, D., Gao, M., Maenhaut, W., He, J., Wu, C., Cheng, L., Gao, W., Sun, Y., Sun, J., Xin, J., Wang, L., and Wang, Y.: The carbonaceous aerosol levels still remain a challenge in the Beijing-Tianjin-Hebei region of China: Insights from continuous high temporal resolution measurements in multiple cities, Environ. Int., 126, 171–183, https://doi.org/10.1016/j.envint.2019.02.034, 2019.
Jia, H., Huo, J., Fu, Q., Duan, Y., Lin, Y., Jin, X., Hu, X., and Cheng, J.: Insights into chemical composition, abatement mechanisms and regional transport of atmospheric pollutants in the Yangtze River Delta region, China during the COVID-19 outbreak control period, Environ. Pollut., 267, 115612, https://doi.org/10.1016/j.envpol.2020.115612, 2020.
Jimenez, J. L., Canagaratna, M. R., Donahue, N. M., Prevot, A. S. H., Zhang, Q., Kroll, J. H., DeCarlo, P. F., Allan, J. D., Coe, H., Ng, N. L., Aiken, A. C., Docherty, K. S., Ulbrich, I. M., Grieshop, A. P., Robinson, A. L., Duplissy, J., Smith, J. D., Wilson, K. R., Lanz, V. A., Hueglin, C., Sun, Y. L., Tian, J., Laaksonen, A., Raatikainen, T., Rautiainen, J., Vaattovaara, P., Ehn, M., Kulmala, M., Tomlinson, J. M., Collins, D. R., Cubison, M. J., Dunlea, J., Huffman, J. A., Onasch, T. B., Alfarra, M. R., Williams, P. I., Bower, K., Kondo, Y., Schneider, J., Drewnick, F., Borrmann, S., Weimer, S., Demerjian, K., Salcedo, D., Cottrell, L., Griffin, R., Takami, A., Miyoshi, T., Hatakeyama, S., Shimono, A., Sun, J. Y., Zhang, Y. M., Dzepina, K., Kimmel, J. R., Sueper, D., Jayne, J. T., Herndon, S. C., Trimborn, A. M., Williams, L. R., Wood, E. C., Middlebrook, A. M., Kolb, C. E., Baltensperger, U., and Worsnop, D. R.: Evolution of Organic Aerosols in the Atmosphere, Science, 326, 1525–1529, https://doi.org/10.1126/science.1180353, 2009.
Kroll, J. H., Donahue, N. M., Jimenez, J. L., Kessler, S. H., Canagaratna, M. R., Wilson, K. R., Altieri, K. E., Mazzoleni, L. R., Wozniak, A. S., and Bluhm, H.: Carbon oxidation state as a metric for describing the chemistry of atmospheric organic aerosol, Nat. Chem., 3, 133–139, 2011.
Lee, S. C., Cheng, Y., Ho, K. F., Cao, J. J., Louie, P. K. K., Chow, J. C., and Watson, J. G.: PM1.0 and PM2.5 Characteristics in the Roadside Environment of Hong Kong, Aerosol Sci. Technol., 40, 157–165, https://doi.org/10.1080/02786820500494544, 2006.
Li, H., Wang, D., Cui, L., Gao, Y., Huo, J., Wang, X., Zhang, Z., Tan, Y., Huang, Y., Cao, J., Chow, J. C., Lee, S.-c., and Fu, Q.: Characteristics of atmospheric PM2.5 composition during the implementation of stringent pollution control measures in shanghai for the 2016 G20 summit, Sci. Total Environ., 648, 1121–1129, https://doi.org/10.1016/j.scitotenv.2018.08.219, 2019.
Lin, C., Ceburnis, D., Huang, R.-J., Canonaco, F., Prévôt, A. S. H., Dowd, C., and Ovadnevaite, J.: Summertime Aerosol over the West of Ireland Dominated by Secondary Aerosol during Long-Range Transport, Atmosphere, 10, 59–70, 2019.
Lin, C., Huang, R.-J., Xu, W., Duan, J., Zheng, Y., Chen, Q., Hu, W., Li, Y., Ni, H., Wu, Y., Zhang, R., Cao, J., and O'Dowd, C.: Comprehensive Source Apportionment of Submicron Aerosol in Shijiazhuang, China: Secondary Aerosol Formation and Holiday Effects, ACS Earth Space Chem., 4, 947–957, https://doi.org/10.1021/acsearthspacechem.0c00109, 2020.
Lin, Y., Huang, K., Zhuang, G., Fu, J. S., Wang, Q., Liu, T., Deng, C., and Fu, Q.: A multi-year evolution of aerosol chemistry impacting visibility and haze formation over an Eastern Asia megacity, Shanghai, Atmos. Environ., 92, 76–86, https://doi.org/10.1016/j.atmosenv.2014.04.007, 2014.
Mauderly, J. L. and Chow, J. C.: Health Effects of Organic Aerosols, Inhal. Toxicol., 20, 257–288, https://doi.org/10.1080/08958370701866008, 2008.
MEP (Ministry Environmental Protection of China): The state council issues action plan on prevention and control of air pollution introducing ten measures to improve air quality, https://english.mee.gov.cn/News_service/infocus/201309/t20130924_260707.shtml (last access: 1 September 2022), 2013.
Petit, J. E., Favez, O., Albinet, A., and Canonaco, F.: A user-friendly tool for comprehensive evaluation of the geographical origins of atmospheric pollution: Wind and trajectory analyses, Environ. Model. Softw., 88, 183–187, https://doi.org/10.1016/j.envsoft.2016.11.022, 2017.
Pope, C. A. and Dockery, D. W.: Health Effects of Fine Particulate Air Pollution: Lines that Connect, J. Air Waste Manag. Ass., 56, 709–742, https://doi.org/10.1080/10473289.2006.10464485, 2006.
Ren, H.: The organic molecular composition, diurnal variation, and stable carbon isotope ratios of PM2.5 in Beijing during the 2014 APEC summit, Environ. Pollut., 243, 919–928, https://doi.org/10.1016/j.envpol.2018.08.094, 2018.
Salvador, C. M. G., Tang, R., Priestley, M., Li, L., Tsiligiannis, E., Le Breton, M., Zhu, W., Zeng, L., Wang, H., Yu, Y., Hu, M., Guo, S., and Hallquist, M.: Ambient nitro-aromatic compounds – biomass burning versus secondary formation in rural China, Atmos. Chem. Phys., 21, 1389–1406, https://doi.org/10.5194/acp-21-1389-2021, 2021.
Shen, Z. X., Cao, J. J., Zhang, L. M., Liu, L., Zhang, Q., Li, J. J., Han, Y. M., Zhu, C. S., Zhao, Z. Z., and Liu, S. X.: Day-night differences and seasonal variations of chemical species in PM10 over Xi'an, northwest China, Environ. Sci. Pollut. Res., 21, 3697–3705, https://doi.org/10.1007/s11356-013-2352-z, 2014.
Shrestha, A. K., Thapa, A., and Gautam, H.: Solar Radiation, Air Temperature, Relative Humidity, and Dew Point Study: Damak, Jhapa, Nepal, Int. J. Photoenerg., 2019, 8369231, https://doi.org/10.1155/2019/8369231, 2019.
Sun, Y. L., Wang, Z. F., Du, W., Zhang, Q., Wang, Q. Q., Fu, P. Q., Pan, X. L., Li, J., Jayne, J., and Worsnop, D. R.: Long-term real-time measurements of aerosol particle composition in Beijing, China: seasonal variations, meteorological effects, and source analysis, Atmos. Chem. Phys., 15, 10149–10165, https://doi.org/10.5194/acp-15-10149-2015, 2015.
Tao, J., Zhang, L. M., Engling, G., Zhang, R. J., Yang, Y. H., Cao, J. J., Zhu, C. S., Wang, Q. Y., and Luo, L.: Chemical composition of PM2.5 in an urban environment in Chengdu, China: Importance of springtime dust storms and biomass burning, Atmos. Res., 122, 270–283, https://doi.org/10.1016/j.atmosres.2012.11.004, 2013.
Tuet, W. Y., Chen, Y., Xu, L., Fok, S., Gao, D., Weber, R. J., and Ng, N. L.: Chemical oxidative potential of secondary organic aerosol (SOA) generated from the photooxidation of biogenic and anthropogenic volatile organic compounds, Atmos. Chem. Phys., 17, 839–853, https://doi.org/10.5194/acp-17-839-2017, 2017.
Turpin, B. J., Saxena, P., and Andrews, E.: Measuring and simulating particulate organics in the atmosphere: problems and prospects, Atmos. Environ., 34, 2983–3013, https://doi.org/10.1016/S1352-2310(99)00501-4, 2000.
Wang, J. Z., Ho, S. S. H., Ma, S. X., Cao, J. J., Dai, W. T., Liu, S. X., Shen, Z. X., Huang, R. J., Wang, G. H., and Han, Y. M.: Characterization of PM2.5 in Guangzhou, China: uses of organic markers for supporting source apportionment, Sci. Total Environ., 550, 961–971, https://doi.org/10.1016/j.scitotenv.2016.01.138, 2016.
Wang, M., Duan, Y., Xu, W., Wang, Q., Zhang, Z., Yuan, Q., Li, X., Han, S., Tong, H., Huo, J., Chen, J., Gao, S., Wu, Z., Cui, L., Huang, Y., Xiu, G., Cao, J., Fu, Q., and Lee, S.-c.: Measurement report: characterization and sources of the ambient secondary organic carbon in a Chinese megacity over five years from 2016 to 2020, Zenodo [data set], https://doi.org/10.5281/zenodo.6473085, 2022.
Wang, Q., Cao, J., Shen, Z., Tao, J., Xiao, S., Luo, L., He, Q., and Tang, X.: Chemical characteristics of PM2.5 during dust storms and air pollution events in Chengdu, China, Particuology, 11, 70–77, 2013.
Wang, Q., Huang, R., Zhao, Z., Cao, J., Ni, H., Tie, X., Zhu, C., Shen, Z., Wang, M., Dai, W., Han, Y., Zhang, N., and Prévôt, A. S. H.: Effects of photochemical oxidation on the mixing state and light absorption of black carbon in the urban atmosphere of China, Environ. Res. Lett., 12, 044012, https://doi.org/10.1088/1748-9326/aa64ea, 2017.
Wang, Q., Cao, J., Han, Y., Tian, J., Zhu, C., Zhang, Y., Zhang, N., Shen, Z., Ni, H., Zhao, S., and Wu, J.: Sources and physicochemical characteristics of black carbon aerosol from the southeastern Tibetan Plateau: internal mixing enhances light absorption, Atmos. Chem. Phys., 18, 4639–4656, https://doi.org/10.5194/acp-18-4639-2018, 2018.
Wang, S., Nan, J., Shi, C., Fu, Q., Gao, S., Wang, D., Cui, H., Saiz-Lopez, A., and Zhou, B.: Atmospheric ammonia and its impacts on regional air quality over the megacity of Shanghai, China, Sci. Rep., 5, 15842, https://doi.org/10.1038/srep15842, 2015.
Wang, Y., Wang, Q., Ye, J., Li, L., Zhou, J., Ran, W., Zhang, R., Wu, Y., and Cao, J.: Chemical composition and sources of submicron aerosols in winter at a regional site in Beijing-Tianjin-Hebei region: Implications for the Joint Action Plan, Sci. Total Environ., 719, 137547, https://doi.org/10.1016/j.scitotenv.2020.137547, 2020.
Wu, C. and Yu, J. Z.: Determination of primary combustion source organic carbon-to-elemental carbon (OC EC) ratio using ambient OC and EC measurements: secondary OC-EC correlation minimization method, Atmos. Chem. Phys., 16, 5453–5465, https://doi.org/10.5194/acp-16-5453-2016, 2016.
Wu, C., Ng, W. M., Huang, J., Wu, D., and Yu, J. Z.: Determination of elemental and organic carbon in PM2.5 in the Pearl River Delta region: inter-instrument (Sunset vs. DRI model 2001 thermal/optical carbon analyzer) and inter-protocol comparisons (IMPROVE vs. ACE-Asia protocol), Aerosol Sci. Technol., 46, 610–621, 2012.
Zhang, Q., Zheng, Y., Tong, D., Shao, M., Wang, S., Zhang, Y., Xu, X., Wang, J., He, H., Liu, W., Ding, Y., Lei, Y., Li, J., Wang, Z., Zhang, X., Wang, Y., Cheng, J., Liu, Y., Shi, Q., Yan, L., Geng, G., Hong, C., Li, M., Liu, F., Zheng, B., Cao, J., Ding, A., Gao, J., Fu, Q., Huo, J., Liu, B., Liu, Z., Yang, F., He, K., and Hao, J.: Drivers of improved PM2.5 air quality in China from 2013 to 2017, P. Natl. Acad. Sci. USA, 116, 24463–24469, https://doi.org/10.1073/pnas.1907956116, 2019.
Zhang, R., Jing, J., Tao, J., Hsu, S. C., Wang, G., Cao, J., Lee, C. S. L., Zhu, L., Chen, Z., Zhao, Y., and Shen, Z.: Chemical characterization and source apportionment of PM2.5 in Beijing: seasonal perspective, Atmos. Chem. Phys., 13, 7053–7074, https://doi.org/10.5194/acp-13-7053-2013, 2013.
Zhang, R. J., Cao, J. J., Lee, S. C., Shen, Z. X., and Ho, K. F.: Carbonaceous aerosols in PM10 and pollution gases in winter in Beijing, J. Environ. Sci., 19, 564–571, https://doi.org/10.1016/S1001-0742(07)60094-1, 2007.
Zheng, B., Tong, D., Li, M., Liu, F., Hong, C., Geng, G., Li, H., Li, X., Peng, L., Qi, J., Yan, L., Zhang, Y., Zhao, H., Zheng, Y., He, K., and Zhang, Q.: Trends in China's anthropogenic emissions since 2010 as the consequence of clean air actions, Atmos. Chem. Phys., 18, 14095–14111, https://doi.org/10.5194/acp-18-14095-2018, 2018.
Zhu, C. S., Cao, J. J., Zhou, J. M., Liu, S. X., Dai, W. T., Zhang, T., Zhao, Z. Z., Shen, Z. X., Li, H., and Wang, P.: A Case Study of Chemical Characteristics of Daytime and Nighttime Ambient Particles in Shanghai, China, Atmosphere, 6, 1141–1153, https://doi.org/10.3390/atmos6081141, 2015.