the Creative Commons Attribution 4.0 License.
the Creative Commons Attribution 4.0 License.
 | 29 Sep 2022
Modeling coarse and giant desert dust particles
Vassilis Amiridis
Alexandra Tsekeri
Antonis Gkikas
Emmanouil Proestakis
Sotirios Mallios
Stavros Solomos
Christos Spyrou
Eleni Marinou
Claire L. Ryder
Demetri Bouris
Petros Katsafados
Dust particles larger than 20 µm in diameter have been regularly observed to remain airborne during long-range transport. In this work, we modify the parameterization of the mineral dust cycle in the GOCART-AFWA dust scheme of WRFV4.2.1 to also include such coarse and giant particles, and we further discuss the underlying misrepresented physical mechanisms which hamper the model in reproducing adequately the transport of the coarse and giant mineral particles. The initial particle size distribution is constrained by observations over desert dust sources. Furthermore, the Stokes drag coefficient has been updated to account for realistic dust particle sizes (Re < 105). The new code was applied to simulate dust transport over Cabo Verde in August 2015 (AER-D campaign). Model results are evaluated against airborne dust measurements and the CALIPSO-LIVAS pure dust product. The results show that the modeled lifetimes of the coarser particles are shorter than those observed. Several sensitivity runs are performed by reducing artificially the particles' settling velocities in order to compensate underrepresented mechanisms, such as the non-spherical aerodynamics, in the relevant parameterization schemes. Our simulations reveal that particles with diameters of 5.5–17 and 40–100 µm are better represented under the assumption of an 80 % reduction in the settling velocity (UR80), while particles with sizes ranging between 17 and 40 µm are better represented in a 60 % reduction in settling velocity (UR60) scenario. The overall statistical analysis indicates that the best agreement with airborne in situ measurements downwind (Cabo Verde) is achieved with a 40 % reduction in settling velocity (UR40). Moreover, the UR80 experiment improves the representation of the vertical structure of the dust layers as those are captured by the CALIPSO-LIVAS vertically resolved pure dust observations. The current study highlights the necessity of upgrading the existing model parameterization schemes of the dust life-cycle components towards improving the assessment of the dust-related impacts within the Earth–atmosphere system.
- Article
(9073 KB) - Full-text XML
-
Supplement
(1631 KB) - BibTeX
- EndNote


Dust is the most prominent contributor to the global aerosol burden in terms of dry mass, and it ranks second in aerosol emissions (Gliß et al., 2021; Huneeus et al., 2011; Textor et al., 2006). The major sources of dust are situated across the “dust belt” (Prospero et al., 2002) stretching in the Northern Hemisphere hosting deserts and erodible soils (e.g., Goudie and Middleton, 2006) that are prone to windblown dust. Most of the global dust budget comes from the Sahara, followed by deserts in the Middle East and Asia (Ginoux et al., 2012; Huneeus et al., 2011; Kok et al., 2021; Li and Osada, 2007). Spatially more limited desert regions in the Southern Hemisphere emit lower amounts of mineral particulate matter (Ginoux et al., 2012; Huneeus et al., 2011; Kok et al., 2021; Li and Osada, 2007), and less than 5 % comes from high-latitude sources (Bullard et al., 2016).
Dust particles act as ice nuclei (IN) in cold cloud processes (Marinou et al., 2019; Solomos et al., 2011), and when mixed or coated with hygroscopic material, they can affect warm cloud processes (Twohy et al., 2009) and serve as cloud condensation nuclei (CCN). Dust particles rich in key micronutrients such as iron (Fe) and phosphorus (P) affect biogeochemical processes in marine and terrestrial ecosystems (Jickells et al., 2005; Okin et al., 2004; Stockdale et al., 2016; Tagliabue et al., 2017) and disrupt the carbon cycle (Jickells et al., 2014) after their wet and dry deposition. Severe dust episodes can affect aviation and telecommunications (Harb et al., 2013; Weinzierl et al., 2012; Nickovic et al., 2021), human health (e.g., Du et al., 2016; Giannadaki et al., 2014), and solar energy production (Kosmopoulos et al., 2018).
Apart from the dust load intensity, the size of the suspended mineral particles plays a determinant role in the related impacts on weather and climate, among others. Larger dust particles act more efficiently as CCN (Petters and Kreidenweis, 2013) and IN (Diehl et al., 2014), altering cloud microphysical processes and subsequently the hydrological cycle. Recent studies suggest that coarser dust aerosols are more effective absorbers of the incoming solar radiation, enhancing atmospheric warming (Mahowald et al., 2014; Ryder et al., 2019). Therefore, it is imperative to represent realistically the dust particle size distribution (PSD), facilitating a thorough investigation on the dust transport processes and the dust-induced impacts.
Airborne dust particles have been observed to sizes up to 300 µm, whereas even larger particles with diameters up to 450 µm have been recorded from in situ deposition measurements acquired at buoys mounted across the tropical Atlantic Ocean (van der Does et al., 2018). Dust particles are usually divided into three different modes (fine, coarse, and giant) without strictly defined bounds of their sizes (Goudie, 2014; Knippertz and Stuut, 2014). According to Ryder et al. (2019), the fine mode represents dust particles with D≤2 µm, the coarse mode those with diameters between 2 and 20 µm, and the giant mode particles with D≥20 µm. A recent study (Claire Ryder, personal communication, 2021) suggests that the above modes can be further discretized into four categories, namely, fine (D<2.5 µm), coarse (2.5–10 µm), super-coarse (10–62.5 µm), and giant (D>62.5 µm).
The existence of dust particles larger than 20 µm in diameter was already demonstrated in the 1970s based on measurements in the Caribbean (Prospero et al., 1970). Nevertheless, these sizes were neglected in atmospheric dust models since giant particles were assumed to be rare. This assumption has been disproved in recent decades by a large number of airborne campaigns equipped with state-of-the-art in situ and remote sensing instruments. Specifically, in the framework of the SAMUM1 (Weinzierl et al., 2009) and SAMUM2 (Liu et al., 2018) experimental campaigns, it has been justified that, above sources, dust aerosols up to 40 µm in diameter were recorded in 20 % of the identified dust layers, while over Cabo Verde mineral particles up to 30 µm in diameter were measured (Weinzierl et al., 2011). This reduction in dust particle sizes, along the transport pathway, is attributed to the gravitational settling. Similar findings were reported in the FENNEC campaign (Ryder et al., 2013b), with mean effective particle diameter ranges of 22 to 28 µm and 15 to 18 µm for fresh and aged dust, respectively. During the AER-D campaign, in the Saharan outflow zone near Cabo Verde and the Canary Islands, mineral particles with diameters larger than 20 µm were systematically recorded, while in 36 % of the studied cases, particles with diameters larger than 40 µm were recorded (Ryder et al., 2018). Dust particles with diameters of 10 to 30 µm were detected during the SALTRACE campaign in Barbados (Weinzierl et al., 2017), revealing that they were suspended far away from their sources at about 2000 km more than what would be expected from Stokes theory (Weinzierl et al., 2017). Atmospheric dust models are the optimal tool to simulate the components of the dust cycle and therefore to study the dust-related effects. However, the state-of-the-art atmospheric dust models are characterized by inherent limitations in accounting for realistic emission and transport dust size distributions (Huang et al., 2020; Kok, 2010; Mahowald et al., 2014). To overcome these model drawbacks, we need to extend the PSD towards the giant particle size spectrum in order to shed light on the processes that sustain larger dust aerosols in the atmosphere for longer periods than expected.
Ginoux (2003) modeled dust aerosols up to 70 µm in diameter using the Global Ozone Chemistry Aerosol Radiation and Transport (GOCART) model and examined the effects of non-sphericity assuming randomly oriented ellipsoidal particles. His results showed that the reduction in the settling velocity results in better agreement with observations when the aspect ratio is equal to or greater than 5. The new modeled PSDs were in generally better agreement with the AERONET observations, although the PSDs were significantly underestimated for diameters near 10 µm. The aspect ratio of 5 results in a reduction in settling velocity of about 45 % for particles with sphere-volume-equivalent diameters near 10 µm and 60 % for particles with sphere-volume-equivalent diameters near 30 µm. Maring et al. (2003) applied a simple empirical model and suggested that an upward velocity of 0.0033 m s−1 (0.33 cm s−1) is required to accurately predict PSD changes during transport. Although their comparisons were limited to sizes up to 25 µm, they pointed out that unknown or not well-known processes counteract gravity settling. Possible mechanisms which can interpret the aforementioned findings are (i) vertical mixing within the Saharan air layer during the day (Gasteiger et al., 2017), (ii) the lower settling velocities of non-spherical dust particles (Huang et al., 2020; Mallios et al., 2022), (iii) the underrepresented meteorological conditions (O'Sullivan et al., 2020), (iv) the unresolved turbulence (Gu et al., 2021), (v) the electrification of dust (Daskalopoulou et al., 2021; Mallios et al., 2021a, 2022; Toth et al., 2020; Renard et al., 2018; Nicoll et al., 2011), and (vi) the numerical errors that perturb the mass balance (Ginoux, 2003).
In this work, we demonstrate for the first time a method for incorporating coarse and giant desert dust particles (D>20 µm, following the definition of the dust modes proposed in Ryder et al., 2019) into the Advanced Research Weather version of the Weather Research and Forecasting (WRF-ARW) model in conjunction with the GOCART (Ginoux, 2001) aerosol model and the Air Force Weather Agency (AFWA) dust emission scheme (LeGrand et al., 2019) (WRF-GOCART-AFWA model). After pinpointing that the model quickly deposits coarse and giant dust particles, we investigate the reasons behind those findings: we use sophisticated in situ PSD measurements to initialize the model over the sources and to evaluate the simulated PSD over the receptor areas. We also use pure-dust spaceborne retrievals to assess the model performance in terms of reproducing the vertical structure of the dust layers. In addition, we perform a series of sensitivity tests by reducing the settling velocity of mineral particles in the model, and we investigate the concomitant effects on dust fields. The article is organized as follows. In Sect. 2, we describe the methodology in terms of the changes we made to the code of WRF-GOCART-AFWA, the setup of the model and the experiments performed, and the observational data we used for model validation. The results of our work are presented in Sect. 3, Sect. 4 contains the discussion, and Sect. 5 contains the summary and conclusions of this work.
2.1 WRF-GOCART-AFWA model
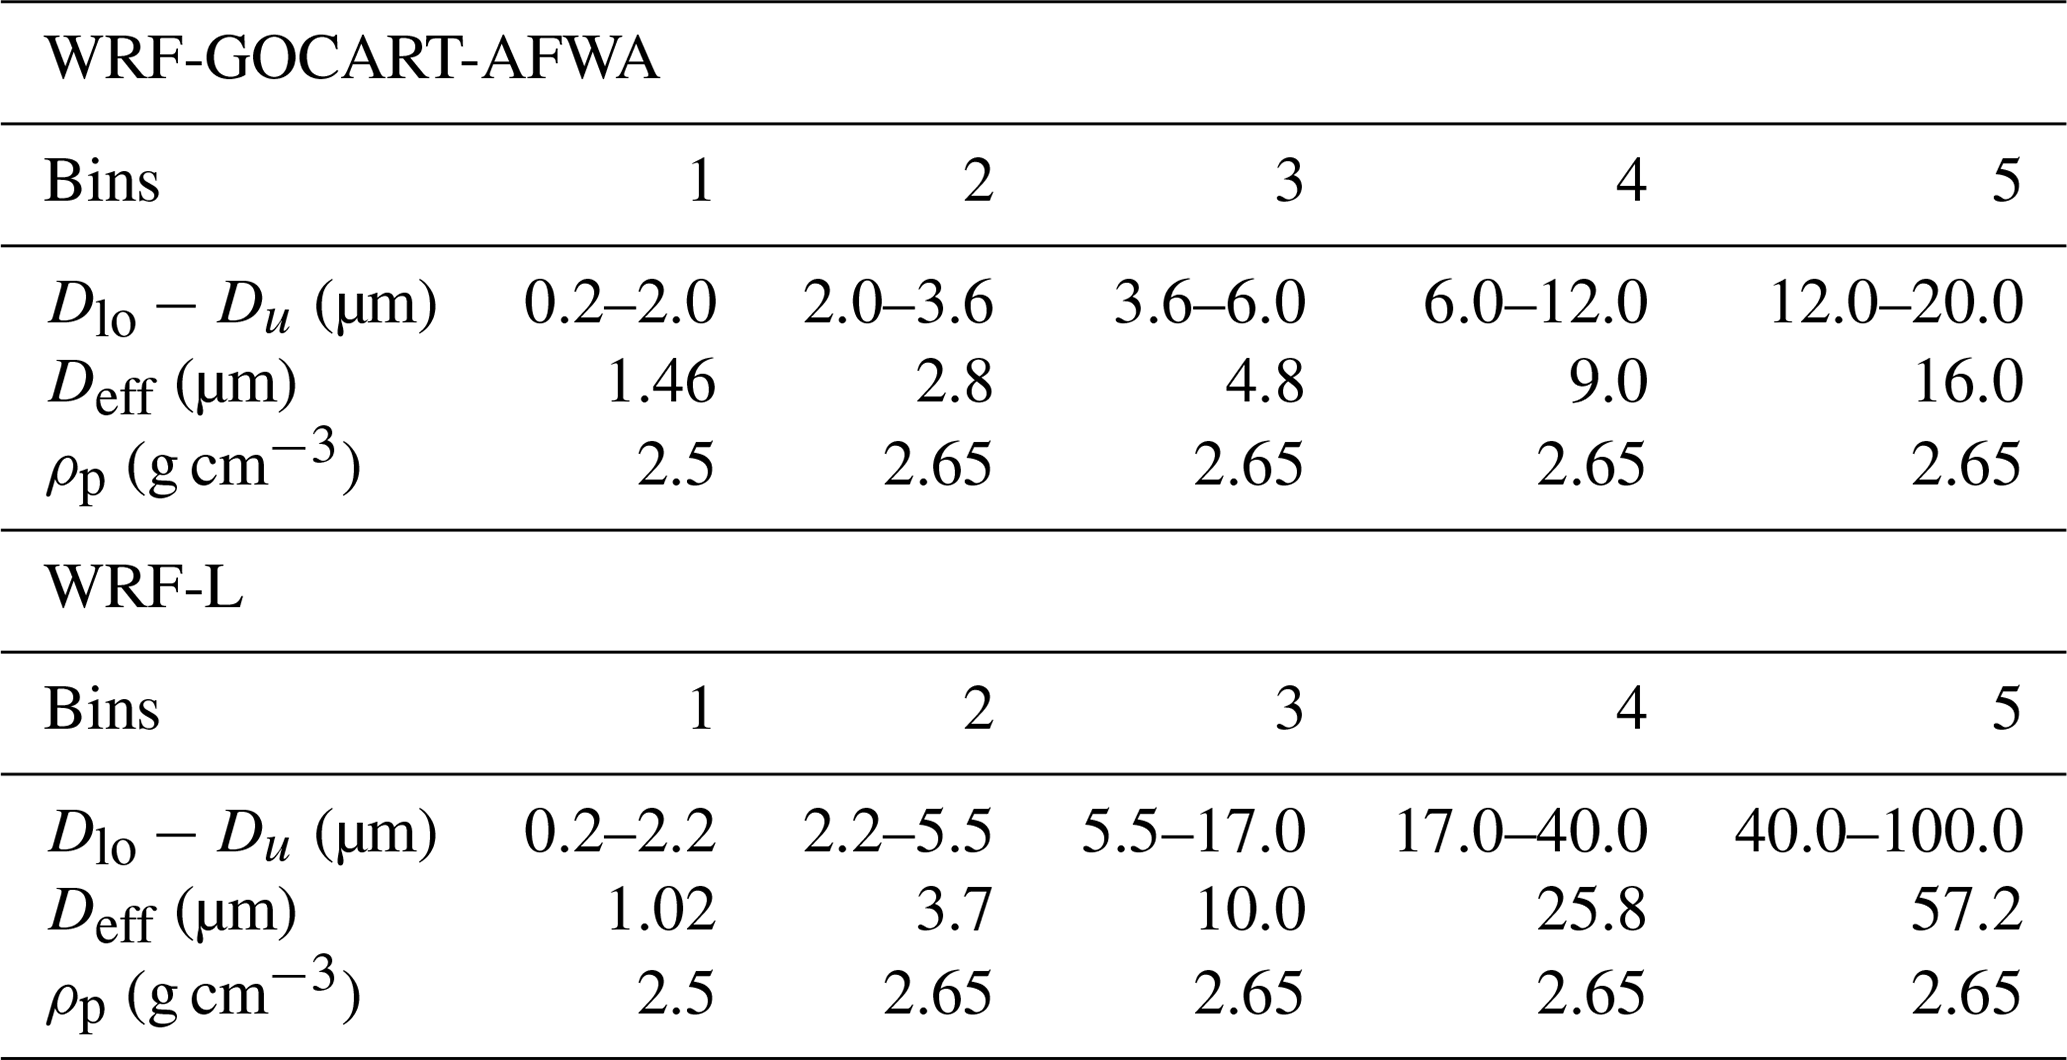
In our numerical experiments to study the transport of coarse and giant dust aerosols, we use the WRF-ARWv4.2.1 model coupled with the GOCART aerosol model and the AFWA dust emission scheme (LeGrand et al., 2019). The current version of the WRF-GOCART-AFWA model accounts for giant dust particles in the calculated dust emission fluxes (up to 125 µm) and assumes that the transported dust particles are up to 20 µm in diameter. To extend the transport PSD to coarser and giant mineral particles, we implemented several developments in the standard WRF-GOCART-AFWA model, which are discussed in Sect. 2.1.1 and 2.1.2. Figure 1 shows a sketch of the workflow: the first three steps refer to the implemented modifications in the standard WRF-GOCART-AFWA code. In step 1, we establish the definition of a prescribed PSD for the emitted dust particles at the source based on in situ reference measurements, and we distribute the total emitted dust accordingly. In step 2, we define five size ranges (five model size bins) for the transported PSD covering dust particle sizes (in diameter) spanning from 0.2 to 100 µm (Sect. 2.1.1). In step 3, we implement an updated drag coefficient that applies to the sizes of the entire range of aeolian dust PSD (Sect. 2.1.2). These code upgrades are integrated into the new WRF-L model. Table 1 shows the properties of the size bins in the standard WRF-GOCART-AFWA code and the size classes defined in the new WRF-L code. In step 4 we perform model experiments and validate the model results using different model configurations against observations (Sect. 2.2), as described in detail in Sect. 3.
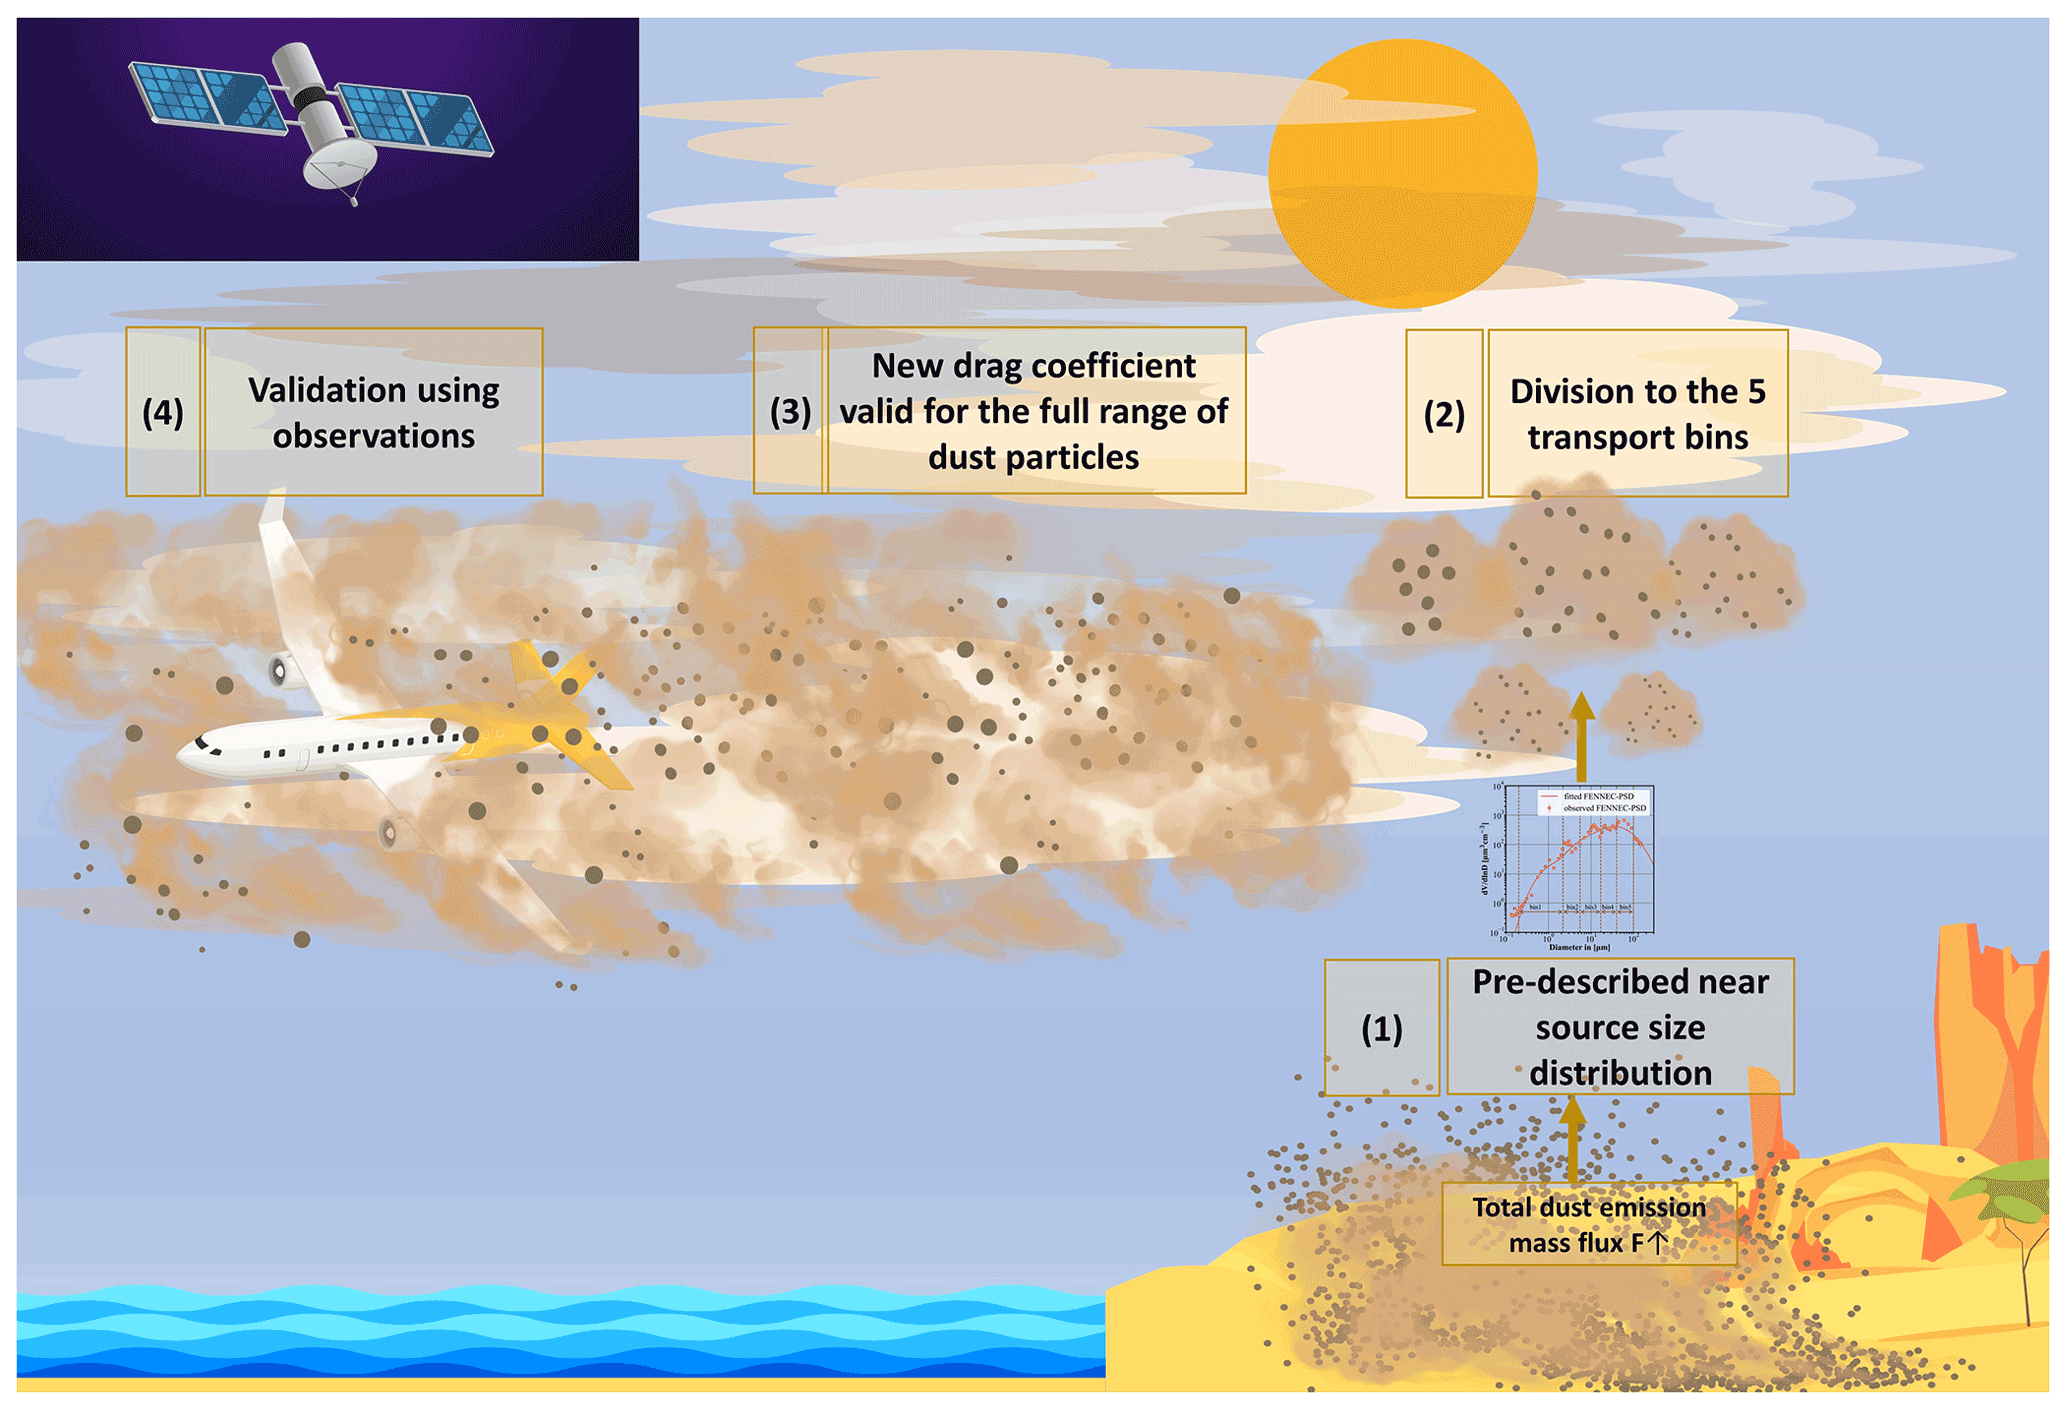
Figure 1The structure of the presented work. Steps (1), (2) and (3) correspond to the appropriate modifications implemented in the WRF-Chem GOCART-AFWA dust scheme for the inclusion of the giant dust particles and the development of WRF-L. Step (4) refers to model validation activities.
Table 1Size ranges and properties of model size bins in the default WRF-GOCART-AFWA scheme.
2.1.1 Dust size distribution
In observational studies of non-spherical particles, it is customary to describe their size in terms of sphere-volume-equivalent diameter. Here, to describe particles' sizes distributed within the five size bins of the WRF-L model, we use the sphere-volume-equivalent effective diameter (Deff), which is more relevant to the optical properties of the particles (Hansen and Travis, 1974). In this way, we simplify the comparison between the model calculations and the observations of the optical properties of the particles (e.g., dust optical depth). The Deff (µm) of each size bin is calculated as shown in Eq. (1) and is provided in Table 1.
where D is the particle diameter in meters and is the particle number size distribution in number of particles per cubic meter. The parameters in each size bin k are listed in Table 1. Henceforward, references about the size of the particle correspond to particle-volume-equivalent effective diameter, unless mentioned otherwise.
In the default GOCART-AFWA dust emission scheme of WRF, the total emitted vertical dust flux is estimated at each grid point prone to dust emission when favorable conditions are met. The dust flux is then distributed over five transport size bins, based on the fragmentation theory of Kok (2011), bounded to diameters up to 20 µm. Since our goal is to consider larger dust particles than those commonly used in the current atmospheric dust models, we redefine the five transport model bins including particles with diameters up to 100 µm (Table 1). We rely on prescribed PSD for the emitted dust particles at the source based on the airborne in situ measurements acquired during the FENNEC campaign of 2011 (Ryder et al., 2013a). More specifically, for the freshly uplifted dust we use the mean PSD at the lowest available height (i.e., 1 km), obtained by averaging profile measurements above the Sahara (Mauritania and Mali), hereafter called the “observed FENNEC-PSD”, which is shown in Fig. 2a with red squares. Figure 2a also shows the “fitted FENNEC-PSD” (solid red line), which is the fit of the “observed FENNEC-PSD” using five lognormal modes (Table 4). In Sect. 2.2.1 more information is provided on the derivation of the mean “observed FENNEC-PSD”, also including the description of the FENNEC 2011 campaign, the in situ instrumentation used, and the processing of the acquired data. Based on the FENNEC-PSD we calculate the mass fraction (kfactors) distributed among the redefined transport model size bins in Eq. (2). The weighting factors kfactors are shown in Fig. 2b.
where D is the particle diameter, is the volume size distribution (µm3 cm−3), and Dlo, k and Du,k are the margins of each size bin k (µm).

Figure 2Prescribed dust size distribution used in the WRF-L for the distribution of total dust mass to the transport model size bins: (a) “observed FENNEC-PSD” (µm3 cm−3) (red squares) and the respective “fitted FENNEC-PSD” (red solid line). The “observed FENNEC-PSD” corresponds to the PSD observations at 1 km, obtained by averaging profile-measured data of freshly uplifted dust cases over 500 m. The arrows indicate the model transport size bins in WRF-L. Error bars indicate the standard deviations of the observed values. (b) The kfactors of the transport size bins calculated based on “fitted FENNEC-PSD” provide the mass fraction of the emitted dust for each bin.
2.1.2 Updated gravitational scheme
In the GOCART-AFWA dust scheme of WRF, the forces acting on a dust particle moving along the vertical direction are the gravitational force Fg and the aerodynamic drag force Fdrag, which are mathematically expressed in Eqs. (3) and (4), respectively.
where ρp stands for particle density (kg m−3), g corresponds to the gravitational acceleration (m s−2), is the particle volume in cubic meters, is the particle's projected area normal to the flow in square meters, ρair is the air density (kg m−3), and Deff represents the particles' diameter in m for each model size bin (assuming spherical particles as defined in Sect. 2.1.1). CD is the aerodynamic drag coefficient (unitless) and Ccun is the slip correction to account for slip boundary conditions (Davies, 1945), and it is expressed as a function of the air mean free path (λ, in meters) (Eq. 5):
The constant velocity that a particle builds up when falling vertically within the Earth's atmosphere is defined as the terminal settling velocity uterm, and it can be estimated by solving the 1-D equation of motion at the steady-state limit, where net force is assumed to be equal to zero:
In the default GOCART-AFWA dust scheme, the drag coefficient is given by the Stokes law and is defined as
where Re is the Reynolds number (unitless) given by the following equation as a function of the particle-volume-equivalent effective diameter Deff:
where μ is the air dynamic viscosity (kg m s−1) defined as a function of air temperature T (K) by the following equation (Hilsenrath et al., 1955; United States Committee on Extension to the Standard Atmosphere, 1976):
where S is the Sutherland constant which equals 110.4 K and β is a constant which equals kg m−1 s−1 K, and the air mean free path is expressed as
where T is the air temperature (K) and P is the air pressure (hPa).
The slip-corrected drag coefficient of the Stokes law () is valid only for Re≪1, and thus it is not representative of particles with Deff larger than ∼ 10 µm. Therefore, an adaptation of the drag coefficient is needed in order to be valid for higher Re values (i.e., 0<Re<16), since in our work dust particles with diameters larger than 20 µm are considered. To realize this, we use the drag coefficient (Eq. 11) proposed by Clift and Gauvin (1971):
Mallios et al. (2020) used the same as a reference for the development of a drag coefficient for prolate ellipsoids as more suitable for Re<105. The departures between the drag coefficients given by Stokes and Clift and Gauvin (1971) become more evident for increasing particle sizes. More specifically, the drag coefficient given by Clift and Gauvin (1971) can be up to 2 times higher than those of the Stokes law for coarse and giant particles (Fig. S1).
In the default WRF code the slip correction is applied unconditionally for all the Re values, probably without affecting the solution significantly due to the small particle sizes (Deff<20 µm). However, in our work a condition is required for applying the slip correction only in the Stokes regime (e.g., Re<0.1, Mallios et al., 2020). Hence, we apply the bisection method to calculate the terminal velocity for each model size bin using the revised drag coefficient and, at first, ignoring the slip correction. When the solution lies in the Stokes regime (e.g., Re<0.1), we recalculate the settling velocity using the corrected drag coefficient , where with λ′ is the mean free path obtained by Jennings (1988):
2.1.3 Model experiments
Using the WRF-L code, we first run the CONTROL experiment. Our simulation period coincides with the AER-D experimental campaign (29 July–25 August 2015) for a domain bounded between the 1.42 and 39.99∘ N parallels and stretches between the 30.87∘ W and 46.87∘ E meridians (Fig. 3). The simulation area encompasses the major Saharan desert, also including the downwind areas in the eastern tropical Atlantic. We use an equal-distance grid with a spatial grid spacing of 15 km × 15 km consisting of 550 × 300 points, whereas in the vertical, 70 vertical sigma pressure levels of up to 50 hPa are utilized (defined by the model). The simulation period consists of nine 84 h forecast runs, which are initialized at 12:00 UTC, using the 6 h Global Forecast System Final Analysis (GFS–FNL) reanalysis product, available at a 0.25×0.25 spatial grid spacing. The sea surface temperatures (SSTs), acquired by the NCEP daily global SST analysis (RTG_SST_HR), are updated every 6 h along with the lateral boundary conditions. Topography is interpolated from the 30 s Global Multi-resolution Terrain Elevation Data 2010 (GMTED2010, Danielson and Gesch, 2011). Land use is defined based on the Moderate-resolution Imaging Spectroradiometer (MODIS) observational data, modified by the University of Boston (Gilliam and Pleim, 2010). From each 84 h cycle, the first 12 h are discarded due to model spinup. Likewise, the first week of the simulation served as a spinup run for the accumulation of the background dust loading, and it is excluded from the analysis. The simulation runs are performed in dust-only mode, neglecting the radiative feedback from aerosols. We scale the dust source strength by tuning the empirical proportionality constant in the horizontal saltation flux equation (in Eq. 10 in LeGrand et al., 2019) in order to obtain the best match between the modeled DOD and the AERONET AOD (RMSE = 0.34, bias = −0.07) acquired at eight desert stations: Banizoumbou, Dakar, El_Farafra, Medenine-IRA, Oujda, Tizi_Ouzou, Tunis_Carthage, Ben_Salem. Note that we take into account only AERONET records when AODs are higher than 0.2 (Version 3.0, Level 1.5, Giles et al., 2019; Sinyuk et al., 2020), and the Angström exponent is lower than 0.75. The tuning constant is equal to 3 and is applied throughout the model domain. The complete configuration options for the run are listed in Table 2. The resolution applied in this study (15 km grid spacing) is adequate for the scale of phenomena we want to study, improves the representation of topography, and increases the accuracy of the reproduced weather and dust fields compared to coarser resolution such as used in global datasets (e.g., 0.5∘ GFS) (Cowie et al., 2015; Basart et al., 2016; Roberts et al., 2017; Solomos et al., 2018). The WRF-Chem solver uses a fifth-order horizontal advection scheme and a third-order vertical advection scheme to solve the scalar conservation equation, along with the third-order Runge–Kutta time integration scheme (Grell et al., 2005). The use of such high-order advective schemes eliminates the numerical errors of diffusion in the code. We should note though that in the deposition parameterization of the GOCART-AFWA dust scheme the vertical advection of the losses due to the gravitational settling is solved by a first-order explicit scheme, which is notoriously too diffusive (Versteeg and Malalasekera, 2007), and thus it can possibly induce numerical errors in the mass conservation (Ginoux, 2003). A series of additional sensitivity runs has been performed, aiming to resemble possible mechanisms (misrepresented or even absent in the model), counteracting gravitational settling towards reducing the differences between the CONTROL run calculations and the in situ observations (shown in Sect. 3.4). To be more specific, we gradually reduced (with an incremental step of 20 %) the settling velocity by up to 80 %, with the corresponding runs named URx (“x” corresponds to the reduction in percentage terms). Under such theoretical conditions, it is expected that the giant dust particles will be suspended for longer periods and that they will be transported at larger distances than the current state-of-the-art models simulate, failing to reproduce what is observed in the real world. Based on these sensitivity experiments, we defined a constant (by percentage) relevant reduction in the particle settling, which in its absolute value varies with size. Therefore, it is more similar to the effects that are related to aerodynamic forces due to the non-spherical shape and the orientation of the suspended dust particles (Ginoux, 2003; Loth, 2008; Zastawny et al., 2012; Shao et al., 2017; Sanjeevi et al., 2018; Mallios et al., 2020). Finally, the full list of the performed experiments is given in Table 3.
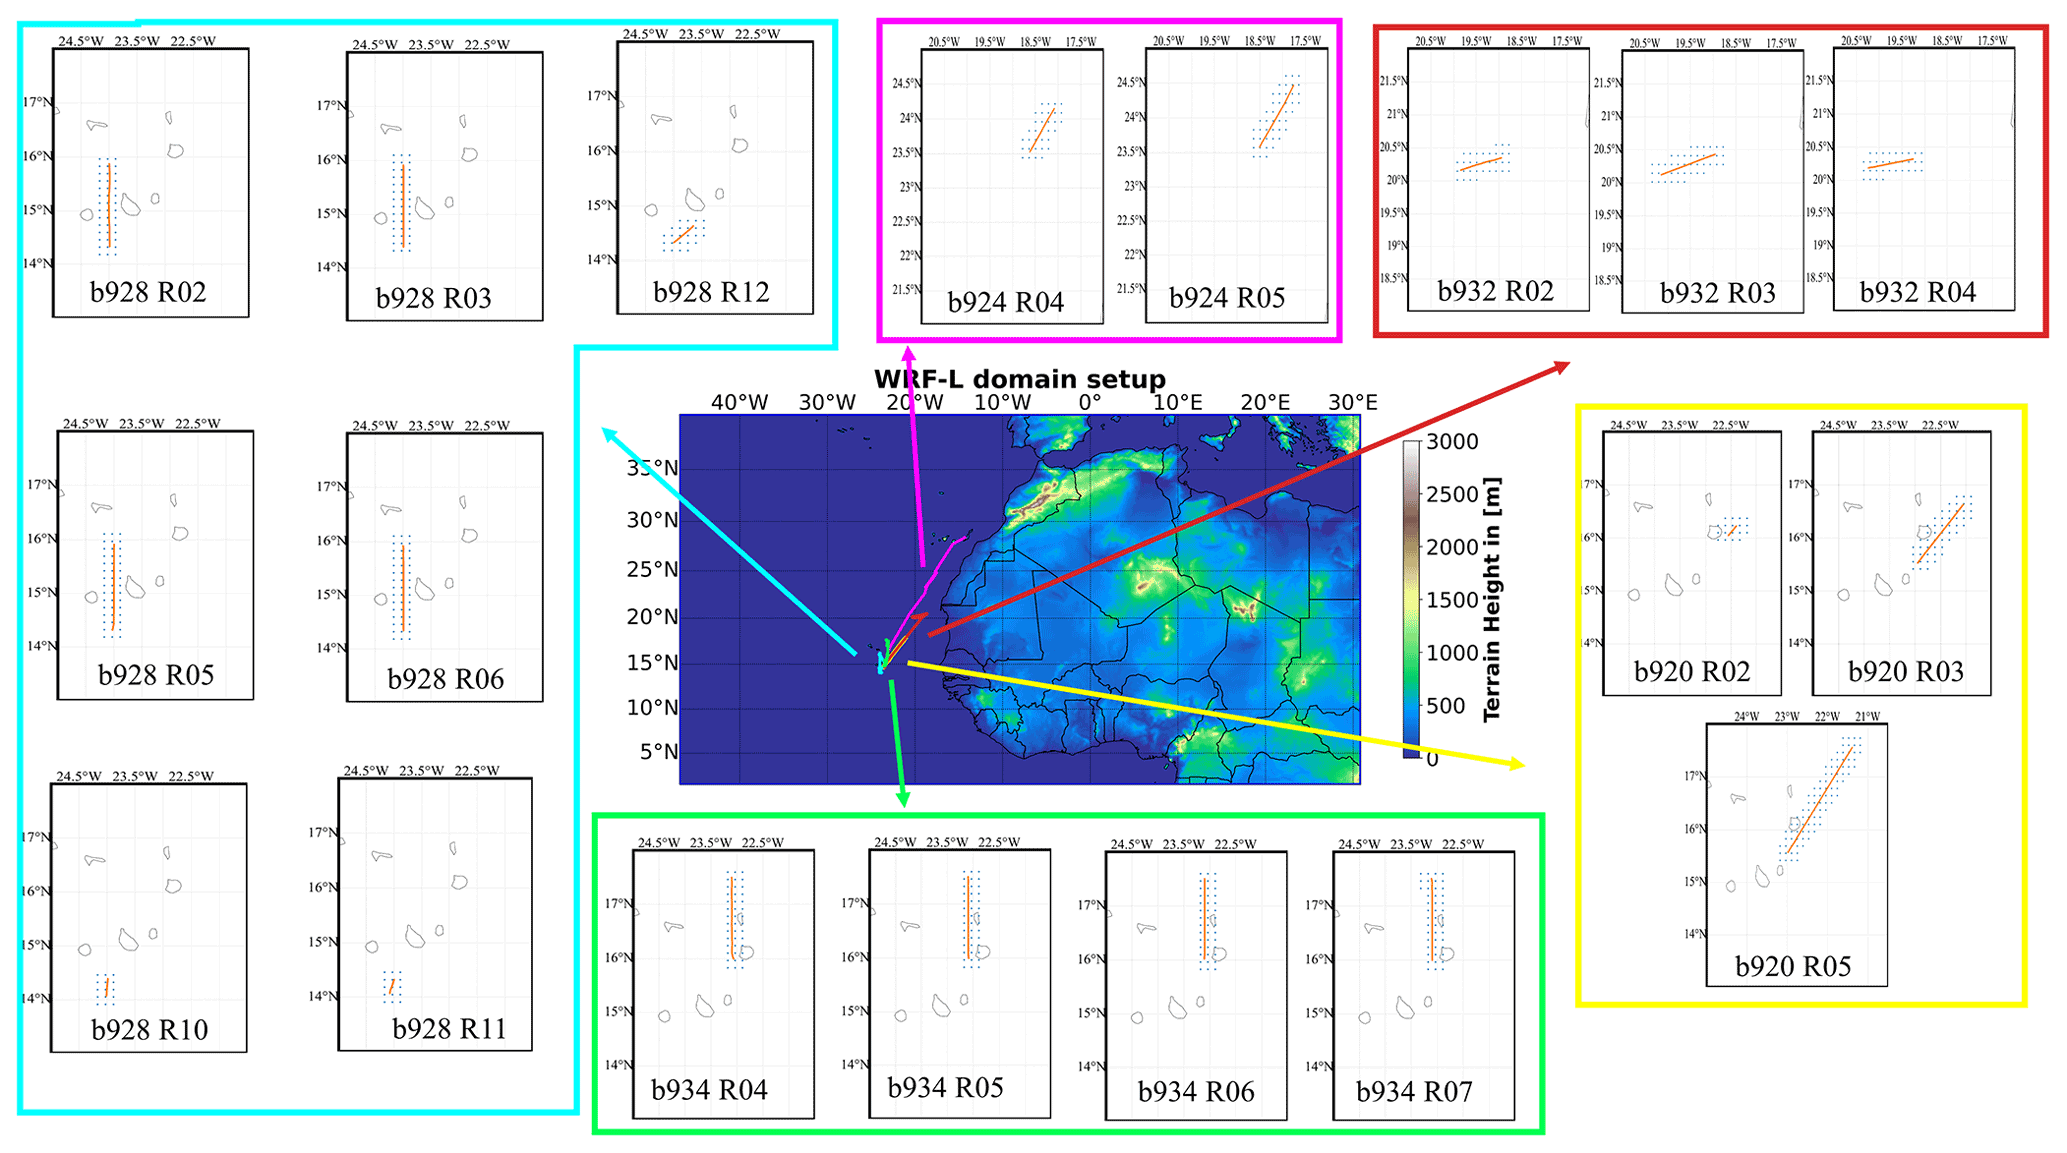
Figure 3Domain and topography map of the WRF-L model simulations, with a horizontal grid spacing of 15 km and 70 vertical levels. The tracks of the AER-D flights, used in this study (b920, b924, b928, b932, and b934), are depicted in the central plot with different colors. In the surrounding maps, the orange dots indicate the aircraft tracks of each flight run. The blue dots correspond to the collocated model grid points.


2.1.4 Dust extinction coefficient
For the evaluation of the model mid-visible (550 nm) dust extinction profiles, the corresponding products from the Lidar climatology of Vertical Aerosol Structure for space-based lidar simulation studies (LIVAS) dataset are used as a reference. For the spatiotemporal matching between the modeled and observed dust extinction, we first project the two datasets onto a common horizontal grid by converting the model outputs from their native horizontal grid spacing (15 km × 15 km) to the structured equal lat–long grid of LIVAS. The model extinction coefficient for each size bin k (EC) is then calculated at each grid cell n and within each model level l, as shown in Eq. (13).
where , ρk, Deff,k, and Qext550,k are the grid cell dust mass concentration (g m−3), the particle density (g m−3), the effective diameter (m), and the extinction efficiency factor at 550 nm of size bin k.
Qext550,k is calculated using the Mie scattering code (Mie, 1908), considering spherical dust particles, and a refractive index of 1.55+i0.005, which is representative of dust (e.g., Dubovik et al., 2002). Although the extinction coefficient values for spherical particles may be different from the extinction coefficient values of the dust particles, which have irregular shapes, to our knowledge there are no data available for the extinction coefficient of the latter. The extinction coefficient values of spheroidal shapes, commonly used as a proxy of the dust shapes, are not substantially different compared to the spherical particles (Tsekeri et al., 2022), at least when considering the aspect ratios measured for dust particles in the Sahara (Kandler et al., 2009). To simplify the computations, we assume that the particles in each size bin have the same size (i.e., Deff,k) and thus the same Qext550,k. In the vertical, the fine-resolution LIVAS dust extinction coefficient is rescaled (averaging) to match the model layers' vertical margins. In the time dimension, the model outputs at the closest lead times to the satellite overpass are selected.
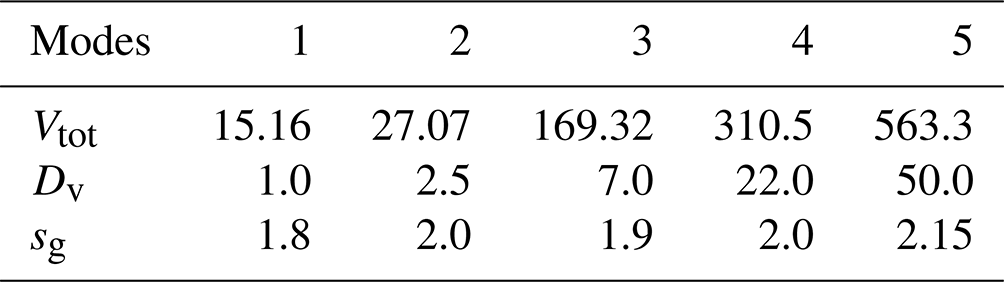
Table 4Lognormal -mode parameters of the fitted FENNEC-PSD. Diameters are given in µm and volume concentrations in µm3 cm−3.
2.2 Observational datasets
2.2.1 Airborne in situ observations
During the FENNEC field campaign in 2011 (Ryder et al., 2013a, b) and the AER-D field campaign in 2015 (Ryder et al., 2018, 2019), airborne in situ observations were collected with the FAAM BAE research aircraft. In this study we use size distributions from the FENNEC field campaign, acquired during aircraft profiles over the Sahara (Mauritania and Mali), as described in Ryder et al. (2013a). We select size distributions from “freshly uplifted dust” cases when dust particles are in the atmosphere for less than 12 h. Additionally, from these profiles we use data from the lowest available altitude, centered at 1 km, covering altitudes between 0.75 and 1.25 km. The derived PSD is depicted in Fig. 2a, hereafter referred to as the “observed FENNEC-PSD”. Error bars in Fig. 2a indicate the standard deviation of the observed values across the profiles and altitudes we used. The instrumentation for those measurements was the Passive Cavity Aerosol Spectrometer Probe (PCASP, 0.13–3.5 µm), the Cloud Droplet Probe (CDP, 2.9–44.6 µm), using light scattering measurements, assuming a refractive index (RI) of 1.53–0.001i (which is constant with particle size) and spherical shape for the particles, and using Mie calculations to convert from optical to geometric diameter, as well as the Cloud Imaging Probe (CIP15, 37.5–300 µm). The instruments and data processing are described in Ryder et al. (2013a). The midpoint size bin diameters do not overlap, though there is some overlap in bin edges between the instruments. A fit on the observations is provided in Fig. 2a (the “fitted FENNEC-PSD” with solid red line), which is used in the parameterization of the emitted dust, as described in Sect. 2.1.1, to modify the GOCART-AFWA dust scheme in WRF.
We also use PSD observations during horizontal flight legs at a constant height (referred to either as RUNs or flight segments) over the Atlantic Ocean during AER-D. We use measurements taken with PCASP (D=0.12–3.02 µm) for fine dust particles. For the coarse and giant modes of dust we used measurements from CDP (D=3.4–20 µm, although CDP measurement availability extends up to 95.5 µm as explained below) and the two-dimensional Stereo probe (2DS, D=10–100 µm – although the instrument measures up to 1280 µm, few particles larger than 100 µm were detected). For the light scattering techniques of PCASP and CDP, a RI = 1.53–0.001i is assumed for the conversion of the optical to geometric diameter (as in the FENNEC 2011 campaign). CDP observations extend up to the size of 95.5 µm, and thus data from CDP and 2DS partly overlap in their size range. Since 2DS observations are more reliable in the overlapping size range, we used the CDP observations for particles with sizes up to 20 µm. Also, 2DS-XY observations are preferred over the 2DS-CC, since they better represent the non-spherical particles. A more detailed description of the in situ instruments and the corresponding processing of the data acquired during the AER-D campaign is included in Ryder et al. (2018). The error bars represent the total (random and systematic) measurement error due to the counting error, the discretization error, the uncertainties in the sample area, and the uncertainties in the bin size due to Mie singularities (Ryder et al., 2018). All PSD measurements are at ambient atmospheric conditions. The locations of the flights of AER-D used in this study are depicted in Fig. 3.
2.2.2 LIVAS product
For the validation of the vertical distribution of dust from the model (see Sect. 3.5), we utilize the pure-dust profiles provided by the LIVAS dataset, originally presented in Amiridis et al. (2013, 2015) and updated in Marinou et al. (2017). The LIVAS pure-dust product is a global dataset, covering the period between June 2006 and May 2020, and is provided (a) on a per-granule level with a similar resolution to the original Cloud-Aerosol Lidar and Infrared Pathfinder Satellite Observations (CALIPSO) L2 profile products (i.e., 5 km horizontal and 60 m vertical) and (b) as a global three-dimensional database of monthly mean averaged profiles of aerosol properties, on a uniform horizontal grid spacing of . LIVAS was developed by applying the dust-separation technique described in Tesche et al. (2009) on the CALIPSO level-2 version 4 products (Winker et al., 2009). The LIVAS pure-dust product has been used in a variety of dust-oriented studies, including the investigation of the dust sources and the seasonal transition of the dust transport pathways (Marinou et al., 2017; Proestakis et al., 2018), the evaluation of the performance of atmospheric and dust transport models (e.g., Tsikerdekis et al., 2017; Solomos et al., 2017; Georgoulias et al., 2018; Konsta et al., 2018), the evaluation of new satellite-based products (e.g., Georgoulias et al., 2016; Chimot at al., 2017; Georgoulias et al., 2020; Gkikas et al., 2021), and dust assimilation experiments (Escribano et al., 2022). Herein, the LIVAS pure-dust extinction product is used for the assessment of the simulated dust vertical patterns. In the geographical region of our study, the uncertainty of the product is estimated to be less than 20 % at altitudes up to 6 km (Marinou et al., 2017).
3.1 Settling velocities
Figure 4 shows the altitude profiles of the settling velocities for each size bin from the CONTROL run, averaged over the simulation domain, and the period of interest. Settling velocity increases for larger mineral particles. The terminal velocities for particles within bin 5 are 2 orders of magnitude higher than those in bin 2 and bin 3 and 1 order of magnitude with respect to bin 4. An altitude dependency, regulated by the thermodynamic state of the atmosphere, of the terminal velocities is also apparent in Fig. 4, showing that they increase with height due to the reduction either of temperature or air density (Eqs. 9 and 13). For the CONTROL run, the average settling velocities near the surface are lower by approximately 10 % than those at 6 km height, and this non-negligible reduction can be critical, particularly for coarser and giant particles where velocities are higher.
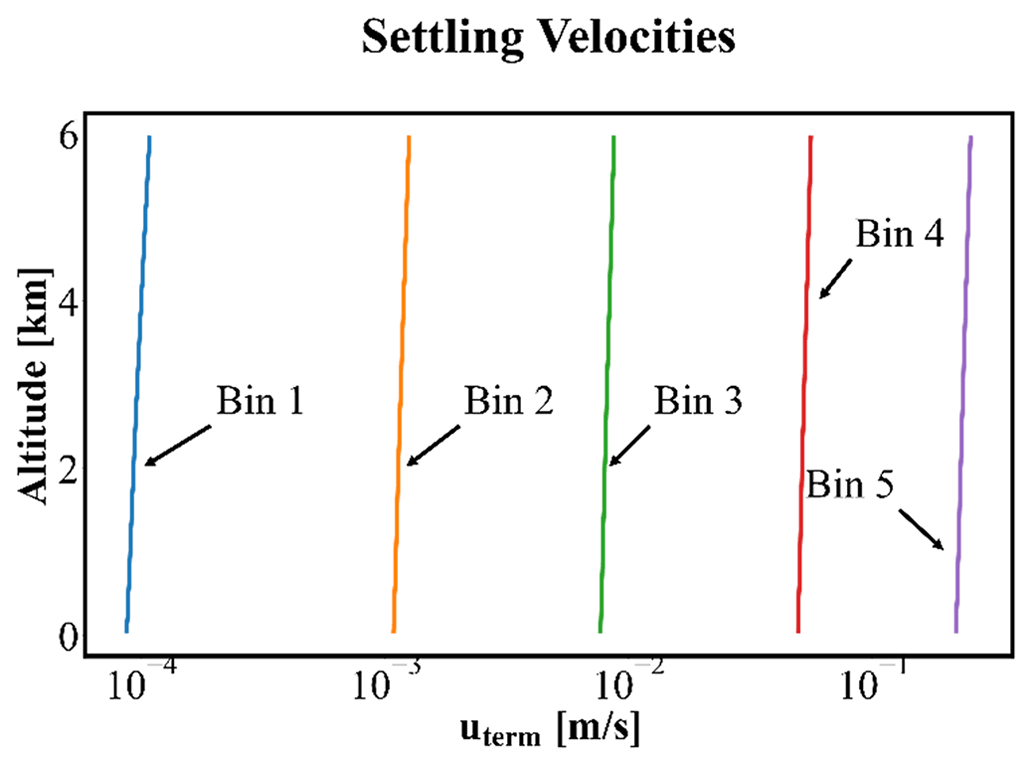
Figure 4Terminal velocities of the CONTROL experiment, averaged for the simulation time and the domain. Each colored line corresponds to one of the new model size bins, with blue: bin 1, orange: bin 2, green: bin 3, red: bin 4, and purple: bin 5.
3.2 Dust above the sources
In Fig. 5 we present how the PSD varies with height above an emission point (latitude = 24.9 and longitude = 9.2∘) in Mali on 11 August 2015 at 14:00 UTC. The model PSDs are only from that grid model box interpolated at 1, 2, and 3 km height and for the particular timestep (11 August 2015 at 14:00 UTC). The red squares correspond to the “observed FENNEC-PSD” sorted into the five bins. The error bars provide the maximum and minimum limits of the “observed FENNEC-PSD”, sorted into the five model size bins after including the standard deviation of “observed FENNEC-PSD”. The “observed FENNEC-PSD” (see Sect. 2.2.1) has been derived from several flights above dust sources, and thus it is representative of the PSDs above Saharan sources and is used here as a reference. The black squares depict the “fitted FENNEC-PSD” sorted into five bins, used in the model parameterization to calculate the emitted dust mass of the corresponding five model transport bins. The difference between the “fitted FENNEC-PSD” and the “fitted FENNEC-PSD” occurs due to the fitting process. The modeled volume concentration is reduced with height by an order of magnitude between 2 and 3 km for particles with diameters 17–40 µm (bin 4). At 3 km the simulated concentrations of particles in bin 4 and bin 5 are very low compared to the measurements in Fig. S2a of Ryder et al. (2013a), which indicate the removal of giant particles above 4 km (Ryder et al., 2013a, Fig. S2a). Although a direct comparison between the modeled and observed PSD for this particular emission point is not feasible, since the FENNEC campaign took place on different dates than the AER-D and there are no available measurements above dust sources for the period, we performed our simulations and we note a modification of the PSD shape for both model and observations at 1 km. It is evident that the model overestimates the PSD for bins 1–3, while the opposite is found in the size spectrum of the super-coarse (bin 4) and giant (bin 5) dust particles. Therefore, a model weakness is revealed in the very early phase of the dust transport. Those differences can be attributed to an overestimation of their loss during uplift from the surface to 1 km or to higher updrafts that remain unresolved in our numerical experiment. Another possible source of this underestimation could be the utilization of an ill-defined PSD shape constraining the distribution of emitted dust mass to the model transport size bins. The use of a PSD with a higher contribution of coarse and giant dust particles could possibly improve the representation of the coarse and giant particles aloft (Figs. S2 and S3) and can be assessed in future studies. Additionally, comparing the “observed FENNEC-PSD” with the modeled PSD of the scenario with the maximum relative reduction in the settling velocities (UR80) in Fig. 5, we find a significant increase in the modeled volume concentrations, reducing the differences seen in volume concentrations in bin 4 and bin 5 without the reduction in the settling velocity, although the underestimation in bin 5 is still evident.

Figure 5Dust size distribution above an emission model grid point (latitude = 24.9 and longitude = 9.2∘) in Mali on 11 August 2015 at 14:00 UTC. Blue solid line: the dust PSD of the CONTROL run interpolated at 1 km altitude above the dust source, orange solid line: the dust PSD of the CONTROL run interpolated at 2 km altitude above the dust source, green solid line: the dust PSD of the CONTROL run interpolated at 3 km altitude above the dust source, blue dotted line: the dust PSD of the UR80 run interpolated at 1 km altitude above the dust source, red squares: the “observed FENNEC-PSD” at 1 km altitude (sorted into five bins), and black squares: the “fitted FENNEC-PSD” at 1 km (sorted into five bins) which has been used for the distribution of the model emission to the five size bins.
3.3 Mean dust load
In Fig. 6, the spatial patterns of the columnar dust concentrations are depicted, averaged over the period of 5–25 August 2015, for the total mass as well as for each one of the five size bins simulated with the CONTROL run. Among the first three bins, there are evidently many similarities of the dust load spatial features, with maximum values in the western Sahara, whereas the dust advection pathways towards the Atlantic Ocean are clearly seen. In terms of intensity, the mass increases from bin 1 to bin 3 (5.5–17 µm), yielding the maximum values throughout the size ranges. Dust particles with diameters between 17 and 40 µm (bin 4) are found mainly over land and are subjected to short-range transport westwards (i.e., off the Moroccan coast). Giant particles (bin 5) are found at very low concentrations (<0.5 gr m−2) in isolated areas over/near dust sources, since the strong impact of gravitational settling prohibits their accumulation and transport.
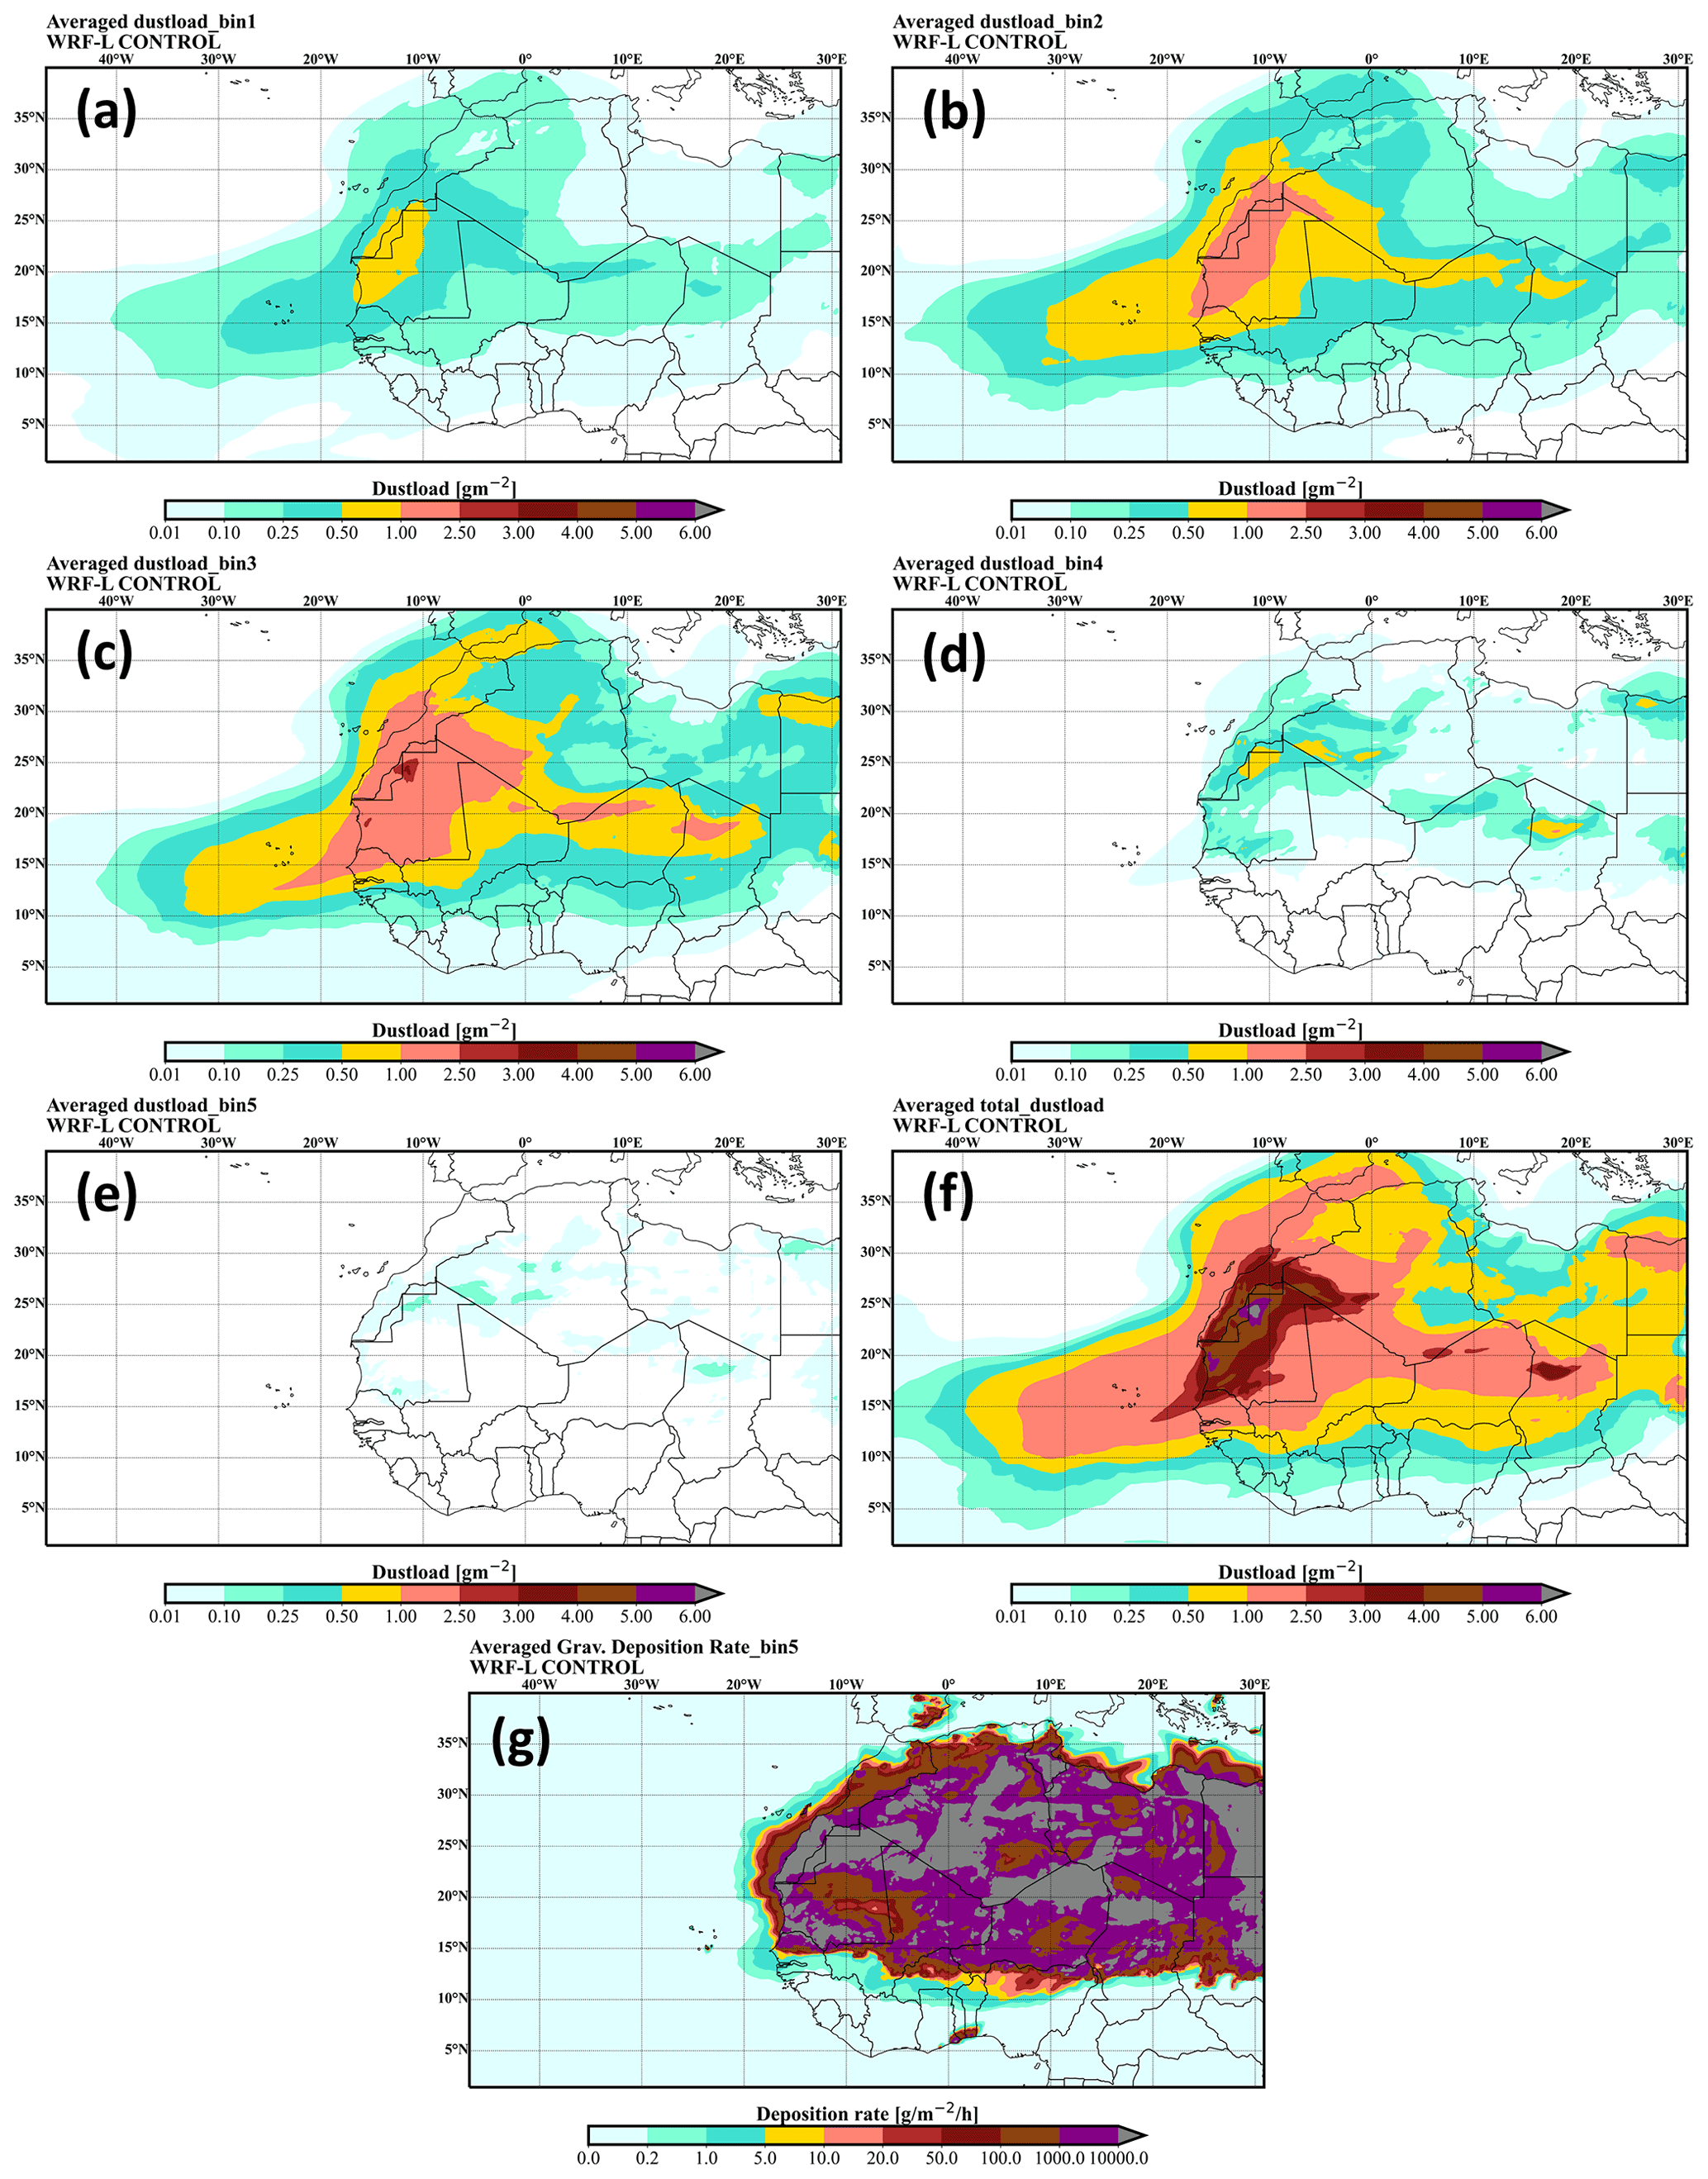
Figure 6The dust load provided by the model, averaged for the whole simulation period, for (a) bin 1, (b) bin 2, (c) bin 3, (d) bin 4, (e) bin 5, and (f) the whole range of the PSD. The dust load is in g m−2. (g) The gravitational deposition rate for bin 5 in g m−2 h−1.
3.4 Dust size distribution
Figure 7 illustrates the simulated PSDs, from each experiment (i.e., CONTROL and URx), along with those acquired by the airborne in situ measurements at different segments and altitudes of flight b928 in the surrounding area of Cabo Verde (downwind region). For the other AER-D flights (i.e., b920, b924, b932, and b934), similar findings are drawn and for brevity reasons are omitted here and included in the Supplement (Fig. S4). All AER-D measurements demonstrate the impacts of the processes that are associated with dust transport. The red squares represent the observations, and the error bars represent the total (random and systematic) measurement error (see Sect. 2.2.1). The modeled PSDs are collocated in space and time with the measurements of each flight segment. For each flight segment, we extract the modeled PSD by interpolating the dust field to the specific altitude of the flight RUN. Additionally, we average the dust field of the nearest grid cell to each coordinate pair along the flight segment track and the eight neighboring grid cells of the same altitude. The coordinates of the flight leg track are depicted with orange dots and the collocated grid points used for deriving the modeled PSD (at the specific height of each flight leg) with blue dots. In the time dimension, we average the 2-hourly model outputs that contain the times of the measurement. In case the time of measurement coincides with the exact hourly output, the model output at that hour along with the outputs prior to and after that are averaged. The error bars in the model PSDs indicate the standard deviation of the collocated grid point averaging in space and time.

Figure 7Modeled and observed dust PSD of flight b928 for straight-level runs (a) R02, (b) R03, (c) R05, (d) R06, (e) R10, (f) R11, and (g) R12. The in situ observations are shown with red squares (along with the total instrumentation error). The collocated modeled PSDs are shown with lines for the CONTROL run (black), UR20 (blue), UR40 (orange), UR60 (green), and UR80 (purple) and the corresponding standard deviation with the associated error bars. The brown vertical lines indicate the limits of the model size bins. The inlet maps show the flight segment track and the collocated model grid points.
Based on our findings, for the CONTROL run, the model performs considerably well, particularly near the surface and above 4 km, reproducing the volume concentration of the particles residing within bins 1 and 2. Underestimations are found for the third bin, with the simulated volume concentration falling however within the measurement uncertainties' envelope. As expected, for bins 4 and 5, the model is not capable of reproducing the observed PSD in distant areas since quite significant underestimations have been already notified above sources (see Fig. 5a). The reduction in the settling velocity (i.e., URx runs; see Table 3) has a negligible impact on the level of agreement between model and observations for bins 1 and 2; it is moderate for bin 3 but is determinant for the super-coarse (bin 4) and giant (bin 5) dust particles. Nevertheless, to achieve the best model–observations matching, the necessary reduction (expressed in percentage) in the settling velocity is not constant among the defined transport bins. Focusing on bin 4, the UR60 run (i.e., reduction in the settling velocity by 60 %) outperforms the other numerical experiments, and focusing on bin 5, the UR80 run outperforms.
The overall comparison of the observed and modeled average PSDs is presented in Fig. 8. We are considering all the in situ airborne measurements and the WRF-L numerical outputs satisfying the defined spatiotemporal collocation criteria. Error bars indicate the corresponding standard deviation. Figure 8a shows that the best model performance is found for the UR80 experiments resembling satisfactorily the bin 4 and bin concentrations, respectively. These “artificial” reductions translate to settling velocities equal to ∼ 0.066 for bin 3 (D=5.5–17 µm), ∼ 0.32 m s−1 for bin 4 (D=17–40 µm), and ∼ 1.88 m s−1 for bin 5 (D=40–100 µm). It is also notable that for the same experiment the best agreement against the FENNEC-PSD above dust sources has been achieved (see Fig. 5 and the relevant discussion).
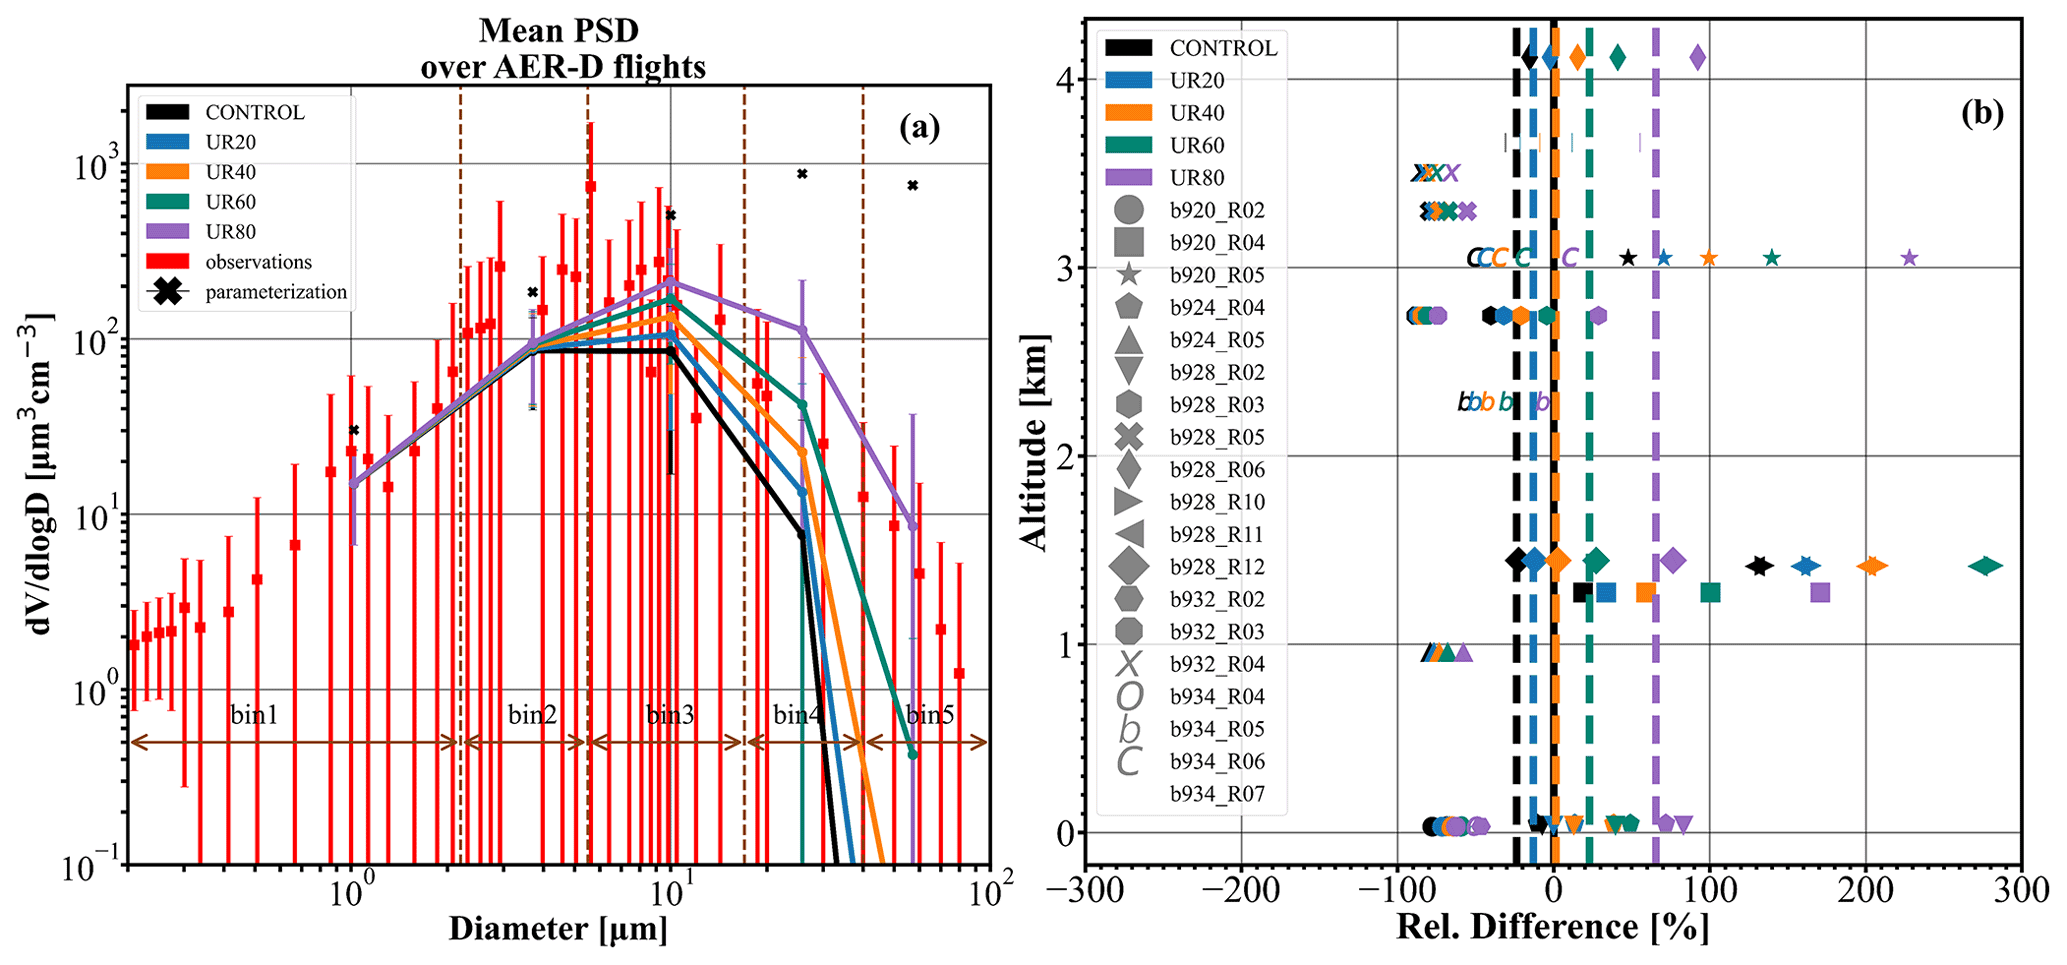
Figure 8(a) Mean PSD of the AER-D/ICE-D campaign. The observations are shown with red squares, whereas the simulations are shown with solid lines for the CONTROL run (black), UR20 (blue), UR40 (orange), UR60 (green), and UR80 (purple). (b) The relative difference between the observations and the model simulations of the total volume of dust particles, at different altitudes. The observations from different flight segments (i.e., b920 R02, b920 R04, b920 R05, b924 R04, b924 R05, b928 R03, b928 R05, b928 R06, b932 R02, b932 R03, b932 R04, b934 R04, b934 R05, b934 R06, and b934 R07) are denoted with different markers. The average relative difference of the observations and the simulations are denoted with dashed lines for the CONTROL run (black), UR20 (blue), UR40 (orange), UR60 (green), and UR80 (purple).
An alternative comparison between observations and model volume concentrations, for the selected AER-D samples (each flight segment is denoted with a different marker), has been performed, and the obtained results, at each flight altitude, are depicted in Fig. 8b. More specifically, we calculate for each model experiment (denoted with a different color) the relative differences (expressed in percentage) of the total dust volume concentration with respect to the in situ measurements. In addition, the corresponding differences (in percentage terms) that are representative of the altitudes spanning from the near surface up to ∼ 4.2 km are denoted with the vertical colored dashed thick lines (WRF-L experiments). Those differences are derived by averaging the relative differences of each flight segment. Overall, the model tends to underestimate the total dust volume concentration (relative differences up to 100 % in absolute terms) even though occasionally positive departures are found, as indicated by the spread of the individual biases around zero. Nevertheless, the main finding from this analysis is that the model–observation declinations reduce when the settling velocity reduces too (i.e., URx runs). Among the WRF-L experiments, the minimum biases (∼ 5 %) are obtained for the UR40 scenario (i.e., the vertical orange dashed line resides close to zero). Through the inspection of the vertically resolved “behavior” of the individual runs, it is revealed that in some cases the model–observation biases can be minimized for the UR60 and UR80 runs, and this “variability” highlights the complexity of the underlying mechanisms governing the suspension of airborne dust.
3.5 Dust vertical distribution
Figure 9a shows the profile of the mean extinction coefficient at 532 nm, provided by the LIVAS pure-dust product (black line), and the profile of the mean extinction coefficients at 550 nm, provided by the CONTROL, UR20, UR40, UR60, and UR80 experiments. The orange area indicates the standard deviation of the LIVAS profiles. Figure 9b depicts the mean absolute model bias with respect to LIVAS profiles for the different simulations, and the vertical dashed lines show the corresponding bias averaged over different altitudes. The mean LIVAS profile is provided by averaging the nighttime profiles over the region between 25.5∘ W and 12.5∘ E and between 11.5 and 35.5∘ N during 5 to 25 August 2015. This area includes the main dust sources that affected the vicinity of Cabo Verde (Ryder et al., 2018) and the region of the dust outflow over the ocean as well. The nighttime profiles excel in accuracy over the daytime ones due to the lower signal-to-noise ratio (SNR) during the night. The model profiles are collocated in space and time with the LIVAS profiles, as described in Sect. 2.1.4, and the model extinction coefficient is provided with Eq. (13).
The intercompared profiles are in good agreement, with the simulations falling well within the variability of the dust observations, although discrepancies are also present, especially close to the dust sources, in the nighttime boundary layer (Fig. 9b – region I) and within the upper free troposphere (Fig. 9b – region III). The assessment of the different model experiments against the ESA-LIVAS pure-dust product is performed in the region between 1.5 and 6.4 km a.m.s.l. (Fig. 9 – region II) to avoid possible biases propagating into the analysis (i.e., complex topography and surface returns – region I, SNR, and tenuous aerosol layers – region II). According to the comparison of observations and simulations of the mean extinction coefficient (Fig. 9a), the statistical overall analysis reveals that the UR40 experiment demonstrates a better performance compared to LIVAS, reducing the mean bias close to zero. For the same experiment the minimum mean bias with respect to the total volume concentration is achieved (see the discussion of Fig. 9b in Sect. 3.4). However, the UR80 experiment provides a more constant (positive) bias with height, which suggests a better distribution of the dust mass in the vertical.

Figure 9(a) Profile of the mean extinction coefficient at 532 nm by the LIVAS pure-dust product (black red line) and profiles of the mean extinction coefficient at 532 nm simulated from the different experiments of Table 3 (CONTROL, UR20/40/60/80). The orange shading indicates the standard deviation of the LIVAS profile averaging. (b) The mean absolute biases between the LIVAS profile and the simulated profiles from the different experiments, in the domain of interest, between 5 and 25 August 2015. The vertical dashed lines are the mean absolute bias between the LIVAS profile and the simulated profiles from the different experiments averaged over the altitudes of region II. (c) The domain of interest and the daytime (red) and nighttime (blue) CALIPSO overpasses. The vertical dashed lines are the mean absolute bias between the LIVAS profile and the simulated profiles from the different experiments averaged over the altitudes of region II. Layer: (c) Google Maps background.
The frequent presence of large desert dust particles (D>20 µm) far from their sources is well established by numerous observational studies over the last decade (van der Does et al., 2018; Liu et al., 2018; Ryder et al., 2013a, b, 2018, 2019a; Weinzierl et al., 2009, 2011, 2017). However, the processes that result in the particle retainment in the atmosphere, and subsequently their travel at greater distances than predicted, remain unrevealed. In this study we extend the particle size range applied in the transport parameterization of the GOCART-AFWA dust scheme of WRF to include particles with diameters up to 100 µm. The evaluation against airborne in situ observations of the size distribution shows that the concentrations of the larger particles are underestimated, above both dust sources and distant areas. This suggests that there are atmospheric processes that are not taken into account in the model simulations. We investigate the effect of reducing the settling velocity of the dust particles due to these unknown processes, and we see that for reductions of 60 % and (especially) 80 %, the simulations of the PSD in Cabo Verde are improved with respect to the observations. The reduction of 80 % corresponds to a reduction in settling velocity of 0.0066 m s−1 for particles with D between 5.5 and 17 µm, which is double the value reported by Maring et al. (2003) for similar sizes. It should be noted though that Maring et al. (2003) derived this settling velocity using observations that were taken with a 5-year difference. Ginoux (2003) also reported an improvement in model simulations for a reduction in settling velocity of approximately 45 % and 60 % for particles with diameters 10 to 30 µm. Though the differences in the model resolution, the dust scheme, and the drag coefficient in Ginoux (2003) compared to this study could cause the different values of the required corrections in the settling velocities, the difference with the values suggested herein can mainly be attributed to the different drag coefficient used in Ginoux (2003), which results in lower settling velocities for the spherical particles. Meng et al. (2022) performed a study, similar to this, where after reducing the settling velocity by 13 % for accounting for particles' asphericity based on Huang et al. (2020), they performed sensitivity tests reducing the dust particles' density from 2500 kg m−3 to 1000, 500, 250, and 125 kg m−3. They found that a decrease in the modeled dust aerosol density by 10–20 times its physical value (2500 kg m−3) is needed to improve the comparison between the model and the long-range dust observations of coarse particles. A 10 times reduction in particle density is almost equal to a 90 % reduction in the settling velocity (starting from the Clift and Gauvin (1971) drag coefficients and assuming conditions of United States Committee on Extension to the Standard Atmosphere, 1976, Fig. S1). It is clear that a huge reduction in the settling velocity in both the Meng et al. (2022) methodology and this work is required, although the physical processes occurring to explain this reduction are not clear.
One of the processes proposed in the literature to explain the longer atmospheric lifetimes of large mineral dust particles is the particle asphericity. Ginoux (2003) compared randomly oriented prolate spheroids and spheres of the same cross section. He showed that spheroids fall slightly more slowly than their spherical counterparts, with their difference being negligible for spheroids with aspect ratio values of less than 5. Huang et al. (2020) compared randomly oriented ellipsoids and spheres of the same volume. They showed that ellipsoids fall around 20 % more slowly than spheres. Mallios et al. (2020) compared prolate spheroids and spheres of the same maximum dimension and of the same volume. Moreover, they did not assume randomly oriented particles but particles of specific orientation (horizontal and vertical). They showed that the results of the comparison change when the maximum dimension or the volume-equivalent size is used in the comparison. Prolate spheroids, with aspect ratio values in the range of 1.4–2.4, fall more slowly than spheres of the same maximum dimension, regardless of orientation, with the relative difference between the settling velocities reaching the value of 52 %. On the other hand, prolate spheroids, in the same aspect ratio value range, fall more quickly than spheres of the same volume, regardless of orientation. The comparison with in situ observations of the maximum dimension of particles is not so common, since most of the in situ measurements do not provide the sizing of the particles in terms of their maximum dimension, with some exceptions, e.g., the observations shown in van der Does et al. (2016) of individual giant mineral particles (larger than 100 µm in maximum dimension).
All the above show that more work is needed for the definite and accurate quantification of the particle asphericity effect on their settling. Nevertheless, there are indications that aspherical particles remain in the atmosphere longer and that asphericity can be one of the reasons for the differences between the modeling results and the observations.
Another process that can influence mineral dust settling has to do with the electrical properties of dust particles. The dust particles are charged in the atmosphere either due to the attachment of atmospheric ions on them (Mallios et al., 2021b) or/and due to collisions, a process known as the triboelectric effect (Ette, 1971; Eden and Vonnegut, 1973; Mills, 1977; Jayaratne, 1991; Mallios et al., 2022). Moreover, there is a large-scale atmospheric electric field due to the potential difference between the lower part of the ionosphere and the Earth's surface (Rycroft et al., 2008). The electric field is modified by an ion attachment process (Mallios et al., 2021b) or by the charge separation caused by updrafts (Krauss et al., 2003). Therefore, electrical forces are generated that might influence the particle settling process by balancing the gravity or changing the particle orientation. The quantification of the particles' electrical properties is still an open question.
Another possible source of error in the gravitational losses simulated by the model as proposed by Ginoux (2003) is the numerical diffusion in the advection equation of gravitational settling. Since in the GOCART-AFWA dust scheme of WRF (and WRF-L) a first-order upwind scheme is adapted for the gravitational losses, which is rather diffusive (Versteeg and Malalasekera, 2007), an investigation of the possible improvement in the results by the replacement of the scheme with a less diffusive one would be of interest. A possible limitation of this study is the accuracy of the PSD which is used for the distribution on the model transport bins of the emitted fluxes. The simplification in the assumption that the shape of the PSD at 1 km above the sources remains unchanged at lower heights near the ground could possibly introduce errors into the representation of the presence of dust particles aloft.
In any case, the proposed scheme presented here provides a useful tool for the investigation of the physical processes in the transport of coarse and giant particles along with their impacts on other physical processes in the atmosphere, such as ice nucleation and radiation interactions. The artificial reduction in the settling velocity is not attributed to a known physical mechanism (although results from the past literature reveal some candidates that can give results on the same order of magnitude). Thus, despite the encouraging results, more research is needed towards understanding the physical or numerical processes driving this finding, including the estimation of the impact of non-spherical particles, electricity, the radiation impact on thermodynamics, and the disturbance of the mass balance due to the numerical diffusion.
In the current state-of-the-art atmospheric dust models, several physical processes governing dust life-cycle components are not well represented, or they are not included in the relevant parameterization schemes. This drawback, along with the lack of knowledge on the underlying mechanisms, results in the failure of the numerical simulations to reproduce adequately the long-range transport of super-coarse and giant mineral particles, as has been justified via their evaluation versus sophisticated dust observations. Among the model limitations, well documented in the literature, one of the most critical is the neglect of mineral particles with diameters larger than 20 µm under the erroneous assumption that they deposit quickly after their emission.
In the current study, we modify the transport particle size distribution in WRF, expanding at size ranges up to 100 µm in diameter, by constraining the shape of the modeled PSD with the observed one above dust sources, acquired in the framework of the FENNEC 2011 campaign. A novelty of our work constitutes the upgrade of the drag coefficient, determining the settling velocity of dust particles to account for realistic dust particle sizes (Re<105), contrary to what is assumed in traditional Stokes theory. After optimally tuning the CONTROL run, we performed a series of sensitivity experiments in which the settling velocity has been reduced, aiming to artificially resemble the real forces acting on particles moving vertically and to counteract gravitational settling. Our period of interest spans from 5 to 25 August 2015, when the AER-D campaign took place in the surrounding area of Cabo Verde, residing in the core of the “corridor” of the Saharan dust transport along the tropical Atlantic Ocean. In our experiments, the simulation domain covers most of the Sahara (encompassing the most active dust sources worldwide) and the eastern sector of the tropical Atlantic Ocean (receiving large amounts of mineral particles from the nearby Saharan dust sources). The dust-related numerical outputs produced by the CONTROL and URx (referring to the reduction in the settling velocity by 20 %, 40 %, 60 %, and 80 %, and it is expressed by the term x) experiments are evaluated against the LIVAS satellite datasets providing pure dust extinction vertical profiles. Nevertheless, special attention is given to the evaluation of the WRF-L PSD against airborne in situ measurements acquired in the framework of the AER-D campaign.
Based on our results, in the CONTROL experiment, the model tends to underestimate the dust volume concentration of coarse and giant dust particles (FENNEC) since the very early stage of dust transport, when the emitted mineral particles are uplifted at 1 km above the sources. Subsequently, the initially obtained model underestimation becomes more pronounced, against those measured in AER-D, particularly for the super-coarse (bin 4, diameters from 17 to 40 µm) and giant (bin 5, diameters from 40 to 100 µm) dust particles in the vicinity of Cabo Verde (i.e., downwind region). Our findings are in line with the already stated underestimation of the presence of coarse and giant dust particles' presence during their long-range dust transport. Nevertheless, when we gradually reduce the settling velocity (URx runs), the model performance steadily improves. Overall, among the numerical experiments, the best match of the simulated and observed PSDs is achieved for the UR80 scenario (i.e., reduction in the settling velocity by 80 %), thus highlighting the misrepresentation or the absence of forces within the model parameterization schemes acting on dust particles and counteracting gravitational settling. Through the case-by-case inspection, it is revealed that the UR60 and UR40 scenarios can also occasionally provide the optimum model–observation agreement, thus highlighting the complexity of the real physical processes that regulate dust particles' settling velocity and suspension. From the evaluation of the vertically resolved simulated dust extinction against the corresponding measurements from the LIVAS dataset, it is revealed that, for the UR40 run, the model and observations are minimized (oscillating around zero), whereas the UR80 run outperforms them in reproducing the vertical structure of the dust layers within the Saharan Air Layer. In summary, our work demonstrated an innovative approach in order to overcome existing drawbacks of the atmospheric dust models towards improving the simulations of dust transport along the tropical Atlantic Ocean. There are several candidate mechanisms, along with inappropriate definition and treatment of mineral particles in the parameterization schemes, hampering models in reproducing adequately the observed dust patterns. Despite our encouraging results, there are many mandatory steps towards upgrading the current state-of-the-art atmospheric dust models in anticipation of an optimum assessment of the multifaceted role of dust aerosols within the Earth–atmosphere system.
The source code of WRF-L is available upon request from Vassilis Amiridis (vamoir@noa.gr) and/or Eleni Drakaki (eldrakaki@noa.gr).
The model outputs and the data used for the analysis are available upon request from Vassilis Amiridis (vamoir@noa.gr) and/or Eleni Drakaki (eldrakaki@noa.gr). The LIVAS dust products are available upon request from Vassilis Amiridis (vamoir@noa.gr), Emmanouil Proestakis (proestakis@noa.gr), and/or Eleni Marinou (elmarinou@noa.gr).
The supplement related to this article is available online at: https://doi.org/10.5194/acp-22-12727-2022-supplement.
ED, VA, and AT designed the study. SM guided ED on the methodology for the replacement of the drag coefficient. AT provided useful assistance in the treatment of airborne observations. CLR provided the data from the airborne in situ measurements and provided useful information about the instrumentation methods. ED developed the code, performed the simulations, and analyzed the results. AG and CLR consulted ED on the methodology of in situ and WRF datasets. VA, EM, and EP provided the LIVAS dataset, led the collocation methodology, and helped in the interpretation of the results. ED plotted the model and observation data (apart from LIVAS). EP treated and plotted LIVAS data. ED wrote the manuscript draft. VA, AT, AG, EP, SM, CS, SS, EM, CLR, DB, and PK provided critical feedback and reviewed and edited the manuscript.
The contact author has declared that none of the authors has any competing interests.
Publisher’s note: Copernicus Publications remains neutral with regard to jurisdictional claims in published maps and institutional affiliations.
This article is part of the special issue “Dust aerosol measurements, modeling and multidisciplinary effects (AMT/ACP inter-journal SI)”. It is not associated with a conference.
This work was supported by computational time granted from the National Infrastructures for Research and Technology S.A. (GRNET S.A.) in the National HPC facility – AIS – under project ID pa210502-TRAP-P. We thank the PANhellenic GEophysical observatory of Antikythera (PANGEA) for providing access to the LIVAS data used in this study and their computational center. The National Centers for Environmental Prediction (NCEP) are thanked for the provision of the Global Forecasting System (GFS) operational analyses and the real-time global (RTG) sea surface temperature (SST) analyses. We would like to thank the NASA CALIPSO team and NASA/LaRC/ASDC for making the CALIPSO products available, which have been used to build the LIVAS products, and ESA, who funded the LIVAS project (contract no. 4000104106/11/NL/FF/fk).
This research was supported by “PANhellenic infrastructure for Atmospheric Composition and climatE change” project 75 (no. MIS 5021516), which is implemented under action “Reinforcement of the Research and Innovation Infrastructure”, funded by the “Competitiveness, Entrepreneurship and Innovation” operational program (NSRF 2014–2020) and co-financed by Greece and the European Union (European Regional Development Fund). Support was also provided by D-TECT (grant agreement no. 725698) funded by the European Research Council (ERC). Eleni Drakaki was funded by Greece and the Stavros Niarhos Foundation (SNF). Claire L. Ryder was funded by NERC grant reference NE/M018288/1. Eleni Marinou was funded by the European Research Council 661 (grant no. 725698, D-TECT) and by a DLR VO-R young investigator group and the Deutscher Akademischer Austauschdienst (grant no. 57370121). Antonis Gkikas was supported by the Hellenic Foundation for Research and Innovation (H.F. R. I.) under the “2nd Call for H. F. R. I. Research Projects to support Post-Doctoral Researchers” (project acronym 90 ATLANTAS, project no. 544).
This paper was edited by Stelios Kazadzis and reviewed by three anonymous referees.
Amiridis, V., Wandinger, U., Marinou, E., Giannakaki, E., Tsekeri, A., Basart, S., Kazadzis, S., Gkikas, A., Taylor, M., Baldasano, J., and Ansmann, A.: Optimizing CALIPSO Saharan dust retrievals, Atmos. Chem. Phys., 13, 12089–12106, https://doi.org/10.5194/acp-13-12089-2013, 2013.
Amiridis, V., Marinou, E., Tsekeri, A., Wandinger, U., Schwarz, A., Giannakaki, E., Mamouri, R., Kokkalis, P., Binietoglou, I., Solomos, S., Herekakis, T., Kazadzis, S., Gerasopoulos, E., Proestakis, E., Kottas, M., Balis, D., Papayannis, A., Kontoes, C., Kourtidis, K., Papagiannopoulos, N., Mona, L., Pappalardo, G., Le Rille, O., and Ansmann, A.: LIVAS: a 3-D multi-wavelength aerosol/cloud database based on CALIPSO and EARLINET, Atmos. Chem. Phys., 15, 7127–7153, https://doi.org/10.5194/acp-15-7127-2015, 2015.
Basart, S., Vendrell, L., and Baldasano, J. M.: High-resolution dust modelling over complex terrains in West Asia, Aeolian Res., 23, 37–50, https://doi.org/10.1016/j.aeolia.2016.09.005, 2016.
Bullard, J. E., Baddock, M., Bradwell, T., Crusius, J., Darlington, E., Gaiero, D., Gassó, S., Gisladottir, G., Hodgkins, R., McCulloch, R., McKenna-Neuman, C., Mockford, T., Stewart, H., and Thorsteinsson, T.: High-latitude dust in the Earth system, Rev. Geophys., 54, 447–485, 2016.
Chimot, J., Veefkind, J. P., Vlemmix, T., de Haan, J. F., Amiridis, V., Proestakis, E., Marinou, E., and Levelt, P. F.: An exploratory study on the aerosol height retrieval from OMI measurements of the 477 nm O2 − O2 spectral band using a neural network approach, Atmos. Meas. Tech., 10, 783–809, https://doi.org/10.5194/amt-10-783-2017, 2017.
Clift, R. and Gauvin, W. H.: Motion of entrained particles in gas streams, Can. J. Chem. Eng., 49, 439–448, https://doi.org/10.1002/cjce.5450490403, 1971.
Cowie, S. M., Knippertz, P., and Marsham, J. H.: A climatology of dust emission events from Northern Africa using long-term surface observations, Atmos. Chem. Phys., 14, 8579–8597, https://doi.org/10.5194/acp-14-8579-2014, 2014.
Danielson, J. J. and Gesch, D. B.: Global multi-resolution terrain elevation data 2010 (GMTED2010), Open-File Report, https://doi.org/10.3133/ofr20111073, 2011.
Daskalopoulou, V., Mallios, S. A., Ulanowski, Z., Hloupis, G., Gialitaki, A., Tsikoudi, I., Tassis, K., and Amiridis, V.: The electrical activity of Saharan dust as perceived from surface electric field observations, Atmos. Chem. Phys., 21, 927–949, https://doi.org/10.5194/acp-21-927-2021, 2021.
Davies, C. N.: Definitive equations for the fluid resistance of spheres, Proc. Phys. Soc., 57, 259–270, https://doi.org/10.1088/0959-5309/57/4/301, 1945.
Diehl, K., Debertshäuser, M., Eppers, O., Schmithüsen, H., Mitra, S. K., and Borrmann, S.: Particle surface area dependence of mineral dust in immersion freezing mode: Investigations with freely suspended drops in an acoustic levitator and a vertical wind tunnel, Atmos. Chem. Phys., 14, 12343–12355, https://doi.org/10.5194/acp-14-12343-2014, 2014.
Du, Y., Xu, X., Chu, M., Guo, Y., and Wang, J.: Air particulate matter and cardiovascular disease: The epidemiological, biomedical and clinical evidence, J. Thorac. Dis., 8, E8–E19, https://doi.org/10.3978/j.issn.2072-1439.2015.11.37, 2016.
Dubovik, O., Holben, B. N., Lapyonok, T., Sinyuk, A., Mishchenko, M. I., Yang, P., and Slutsker, I.: Non-spherical aerosol retrieval method employing light scattering by spheroids, Geophys. Res. Lett., 29, 54-1–54-4, 2002.
Eden, H. F. and Vonnegut, B.: Electrical Breakdown Caused by Dust Motion in Low-Pressure Atmospheres: Considerations for Mars, Science, 180, 962–963, https://doi.org/10.1126/science.180.4089.962, 1973.
Escribano, J., Di Tomaso, E., Jorba, O., Klose, M., Gonçalves Ageitos, M., Macchia, F., Amiridis, V., Baars, H., Marinou, E., Proestakis, E., Urbanneck, C., Althausen, D., Bühl, J., Mamouri, R.-E., and Pérez García-Pando, C.: Assimilating spaceborne lidar dust extinction can improve dust forecasts, Atmos. Chem. Phys., 22, 535–560, https://doi.org/10.5194/acp-22-535-2022, 2022.
Ette, A. I. I.: The effect of the Harmattan dust on atmospheric electric parameters, J. Atmos.-Terr. Phys., 33, 295–300, https://doi.org/10.1016/0021-9169(71)90208-X, 1971.
Gasteiger, J., Groß, S., Sauer, D., Haarig, M., Ansmann, A., and Weinzierl, B.: Particle settling and vertical mixing in the Saharan Air Layer as seen from an integrated model, lidar, and in situ perspective, Atmos. Chem. Phys., 17, 297–311, https://doi.org/10.5194/acp-17-297-2017, 2017.
Georgoulias, A. K., Alexandri, G., Kourtidis, K. A., Lelieveld, J., Zanis, P., Pöschl, U., Levy, R., Amiridis, V., Marinou, E., and Tsikerdekis, A.: Spatiotemporal variability and contribution of different aerosol types to the aerosol optical depth over the Eastern Mediterranean, Atmos. Chem. Phys., 16, 13853–13884, https://doi.org/10.5194/acp-16-13853-2016, 2016.
Georgoulias, A. K., Tsikerdekis, A., Amiridis, V., Marinou, E., Benedetti, A., Zanis, P., Alexandri, G., Mona, L., Kourtidis, K. A., and Lelieveld, J.: A 3-D evaluation of the MACC reanalysis dust product over Europe, northern Africa and Middle East using CALIOP/CALIPSO dust satellite observations, Atmos. Chem. Phys., 18, 8601–8620, https://doi.org/10.5194/acp-18-8601-2018, 2018.
Georgoulias, A. K., Boersma, K. F., Van Vliet, J., Zhang, X., Van Der A, R., Zanis, P., and De Laat, J.: Detection of NO2 pollution plumes from individual ships with the TROPOMI/S5P satellite sensor, Environ. Res. Lett., 15, 124037, https://doi.org/10.1088/1748-9326/abc445, 2020.
Giannadaki, D., Pozzer, A., and Lelieveld, J.: Modeled global effects of airborne desert dust on air quality and premature mortality, Atmos. Chem. Phys., 14, 957–968, https://doi.org/10.5194/acp-14-957-2014, 2014.
Giles, D. M., Sinyuk, A., Sorokin, M. G., Schafer, J. S., Smirnov, A., Slutsker, I., Eck, T. F., Holben, B. N., Lewis, J. R., Campbell, J. R., Welton, E. J., Korkin, S. V., and Lyapustin, A. I.: Advancements in the Aerosol Robotic Network (AERONET) Version 3 database – Automated near-real-time quality control algorithm with improved cloud screening for Sun photometer aerosol optical depth (AOD) measurements, Atmos. Meas. Tech., 12, 169–209, https://doi.org/10.5194/amt-12-169-2019, 2019.
Gilliam, R. C. and Pleim, J. E.: Performance Assessment of New Land Surface and Planetary Boundary Layer Physics in the WRF-ARW, J. Appl. Meteorol. Climatol., 49, 760–774, https://doi.org/10.1175/2009JAMC2126.1, 2010.
Ginoux, P.: Effects of nonsphericity on mineral dust modeling, J. Geophys. Res., 108, 4052, https://doi.org/10.1029/2002jd002516, 2003.
Ginoux, P., Chin, M., Tegen, I., Goddard, T., and In, G.: Sources and distributions of dust aerosols simulated with the GOCART model, J. Geophys. Res., 106, 20255–20273, 2001.
Ginoux, P., Prospero, J. M., Gill, T. E., Hsu, N. C., and Zhao, M.: Global-scale attribution of anthropogenic and natural dust sources and their emission rates based on MODIS Deep Blue aerosol products, Rev. Geophys., 50, 1–36, https://doi.org/10.1029/2012RG000388, 2012.
Gkikas, A., Proestakis, E., Amiridis, V., Kazadzis, S., Di Tomaso, E., Tsekeri, A., Marinou, E., Hatzianastassiou, N., and Pérez Garciá-Pando, C.: ModIs Dust AeroSol (MIDAS): A global fine-resolution dust optical depth data set, Atmos. Meas. Tech., 14, 309–334, https://doi.org/10.5194/amt-14-309-2021, 2021.
Gliß, J., Mortier, A., Schulz, M., Andrews, E., Balkanski, Y., Bauer, S. E., Benedictow, A. M. K., Bian, H., Checa-Garcia, R., Chin, M., Ginoux, P., Griesfeller, J. J., Heckel, A., Kipling, Z., Kirkeväg, A., Kokkola, H., Laj, P., Le Sager, P., Tronstad Lund, M., Lund Myhre, C., Matsui, H., Myhre, G., Neubauer, D., Van Noije, T., North, P., Olivié, D. J. L., Rémy, S., Sogacheva, L., Takemura, T., Tsigaridis, K., and Tsyro, S. G.: AeroCom phase III multi-model evaluation of the aerosol life cycle and optical properties using ground- And space-based remote sensing as well as surface in situ observations, Atmos. Chem. Phys., 21, 87–128, https://doi.org/10.5194/acp-21-87-2021, 2021.
Goudie, A. S.: Desert dust and human health disorders, Environ. Int., 63, 101–113, https://doi.org/10.1016/j.envint.2013.10.011, 2014.
Goudie, A. S. and Middleton, N. J.: Desert Dust in the Global System, Springer, Berlin, Heidelberg, https://doi.org/10.1007/3-540-32355-4, 2006.
Grell, G. A., Peckham, S. E., Schmitz, R., McKeen, S. A., Frost, G., Skamarock, W. C., and Eder, B.: Fully coupled “online” chemistry within the WRF model, Atmos. Environ., 39, 6957–6975, https://doi.org/10.1016/j.atmosenv.2005.04.027, 2005.
Gu, Z., He, Y., Zhang, Y., Su, J., Zhang, R., Yu, C. W., and Zhang, D.: An overview of triggering mechanisms and characteristics of local strong sandstorms in china and haboobs, Atmosphere, 12, 1–17, https://doi.org/10.3390/atmos12060752, 2021.
Hansen, J. E. and Travis, L. D.: Light scattering in planetary atmospheres, Space Sci. Rev., 16, 527–610, https://doi.org/10.1007/BF00168069, 1974.
Harb, K., Butt, O., Abdul-jauwad, S., and Al-yami, A. M.: Systems Adaptation for Satellite Signal under Dust, Sand and Gaseous Attenuations, J. Wirel. Netw. Commun., 3, 39–49, 2013.
Hilsenrath J. , Beckett C. W., Benedict W. S., Fano L., Hoge H. J., Masi J. F., Nuttall R. L., Touloukian Y. S., and Woolley H. W.: Tables of thermal properties of gases: comprising tables of thermodynamic and transport properties of air argon carbon dioxide carbon monoxide hydrogen nitrogen oxygen and steam, U.S. Government Printing Office, 1955.
Huang, Y., Kok, J. F., Kandler, K., Lindqvist, H., Nousiainen, T., Sakai, T., Adebiyi, A., and Jokinen, O.: Climate Models and Remote Sensing Retrievals Neglect Substantial Desert Dust Asphericity, Geophys. Res. Lett., 47, 1–11, https://doi.org/10.1029/2019GL086592, 2020,
Huneeus, N., Schulz, M., Balkanski, Y., Griesfeller, J., Prospero, J., Kinne, S., Bauer, S., Boucher, O., Chin, M., Dentener, F., Diehl, T., Easter, R., Fillmore, D., Ghan, S., Ginoux, P., Grini, A., Horowitz, L., Koch, D., Krol, M. C., Landing, W., Liu, X., Mahowald, N., Miller, R., Morcrette, J.-J., Myhre, G., Penner, J., Perlwitz, J., Stier, P., Takemura, T., and Zender, C. S.: Global dust model intercomparison in AeroCom phase I, Atmos. Chem. Phys., 11, 7781–7816, https://doi.org/10.5194/acp-11-7781-2011, 2011.
Jayaratne, E. R.: Charge separation during the impact of sand on ice and its relevance to theories of thunderstrom electrification, Atmos. Res., 26, 407–424, doi:https://doi.org/10.1016/0169-8095(91)90061-Z, 1991.
Jennings, S. G.: The mean free path in air, J. Aerosol Sci., 19, 159–166, https://doi.org/10.1016/0021-8502(88)90219-4, 1988.
Jickells, T., Boyd, P., and Hunter, K. A.: Biogeochemical Impacts of Dust on the Global Carbon Cycle, in: Mineral Dust: A Key Player in the Earth System, edited by: Knippertz, P. and Stuut, J.-B. W., 359–384, Springer Netherlands, Dordrecht, ISBN 978-940178978-3, 2014.
Jickells, T. D., An, Z. S., Andersen, K. K., Baker, A. R., Bergametti, C., Brooks, N., Cao, J. J., Boyd, P. W., Duce, R. A., Hunter, K. A., Kawahata, H., Kubilay, N., LaRoche, J., Liss, P. S., Mahowald, N., Prospero, J. M., Ridgwell, A. J., Tegen, I., and Torres, R.: Global iron connections between desert dust, ocean biogeochemistry, and climate, Science, 308, 67–71, https://doi.org/10.1126/science.1105959, 2005.
Kandler, K., SchüTZ, L., Deutscher, C., Ebert, M., Hofmann, H., JäCKEL, S., Jaenicke, R., Knippertz, P., Lieke, K., Massling, A., Petzold, A., Schladitz, A., Weinzierl, B., Wiedensohler, A., Zorn, S., and Weinbruch, S.: Size distribution, mass concentration, chemical and mineralogical composition and derived optical parameters of the boundary layer aerosol at Tinfou, Morocco, during SAMUM 2006, Tellus B, 61, 32–50, https://doi.org/10.1111/j.1600-0889.2008.00385.x, 2009.
Knippertz, P. and Stuut, W. J.-B. (Eds.): Mineral Dust: A Key Player in the Earth System, Springer Science, 2014.
Kok, J. F.: An improved parameterization of wind-blown sand flux on Mars that includes the effect of hysteresis, Geophys. Res. Lett., 37, https://doi.org/10.1029/2010GL043646, 2010.
Kok, J. F.: A scaling theory for the size distribution of emitted dust aerosols suggests climate models underestimate the size of the global dust cycle, P. Natl. Acad. Sci. USA, 108, 1016–1021, https://doi.org/10.1073/pnas.1014798108, 2011.
Kok, J. F., Adebiyi, A. A., Albani, S., Balkanski, Y., Checa-Garcia, R., Chin, M., Colarco, P. R., Hamilton, D. S., Huang, Y., Ito, A., Klose, M., Leung, D. M., Li, L., Mahowald, N. M., Miller, R. L., Obiso, V., Pérez García-Pando, C., Rocha-Lima, A., Wan, J. S., and Whicker, C. A.: Improved representation of the global dust cycle using observational constraints on dust properties and abundance, Atmos. Chem. Phys., 21, 8127–8167, https://doi.org/10.5194/acp-21-8127-2021, 2021.
Konsta, D., Binietoglou, I., Gkikas, A., Solomos, S., Marinou, E., Proestakis, E., Basart, S., García-Pando, C. P., El-Askary, H., and Amiridis, V.: Evaluation of the BSC-DREAM8b regional dust model using the 3D LIVAS-CALIPSO product, Atmos. Environ., 195, 46–62, https://doi.org/10.1016/j.atmosenv.2018.09.047, 2018.
Kosmopoulos, P. G., Kazadzis, S., El-Askary, H., Taylor, M., Gkikas, A., Proestakis, E., Kontoes, C., and El-Khayat, M. M.: Earth-observation-based estimation and forecasting of particulate matter impact on solar energy in Egypt, Remote Sens., 10, 1–23, https://doi.org/10.3390/rs10121870, 2018.
Krauss, C. E., Horányi, M., and Robertson, S.: Experimental evidence for electrostatic discharging of dust near the surface of Mars, New J. Phys., 5, 70 pp., https://doi.org/10.1088/1367-2630/5/1/370, 2003.
LeGrand, S. L., Polashenski, C., Letcher, T. W., Creighton, G. A., Peckham, S. E., and Cetola, J. D.: The AFWA dust emission scheme for the GOCART aerosol model in WRF-Chem v3.8.1, Geosci. Model Dev., 12, 131–166, https://doi.org/10.5194/gmd-12-131-2019, 2019.
Li, J. and Osada, K.: Preferential settling of elongated mineral dust particles in the atmosphere, Geophys. Res. Lett., 34, 17807, https://doi.org/10.1029/2007GL030262, 2007.
Liu, D., Taylor, J. W., Crosier, J., Marsden, N., Bower, K. N., Lloyd, G., Ryder, C. L., Brooke, J. K., Cotton, R., Marenco, F., Blyth, A., Cui, Z., Estelles, V., Gallagher, M., Coe, H., and Choularton, T. W.: Aircraft and ground measurements of dust aerosols over the west African coast in summer 2015 during ICE-D and AER-D, Atmos. Chem. Phys., 18, 3817–3838, https://doi.org/10.5194/acp-18-3817-2018, 2018.
Loth, E.: Drag of non-spherical solid particles of regular and irregular shape, Powder Technol., 182, 342–353, https://doi.org/10.1016/j.powtec.2007.06.001, 2008.
Mahowald, N., Albani, S., Kok, J. F., Engelstaeder, S., Scanza, R., Ward, D. S., and Flanner, M. G.: The size distribution of desert dust aerosols and its impact on the Earth system, Aeolian Res., 15, 53–71, https://doi.org/10.1016/j.aeolia.2013.09.002, 2014.
Mallios, S. A., Drakaki, E., and Amiridis, V.: Effects of dust particle sphericity and orientation on their gravitational settling in the earth's atmosphere, J. Aerosol Sci., 150, 105634, https://doi.org/10.1016/j.jaerosci.2020.105634, 2020.
Mallios, S. A., Papangelis, G., Hloupis, G., Papaioannou, A., Daskalopoulou, V., and Amiridis, V.: Modeling of Spherical Dust Particle Charging due to Ion Attachment, Front. Earth Sci., 9, 1–22, https://doi.org/10.3389/feart.2021.709890, 2021a.
Mallios, S. A., Daskalopoulou, V., and Amiridis, V.: Orientation of non spherical prolate dust particles moving vertically in the Earth's atmosphere, J. Aerosol Sci., 151, 105657, https://doi.org/10.1016/j.jaerosci.2020.105657, 2021b.
Mallios, S. A., Daskalopoulou, V., and Amiridis, V.: Modeling of the electrical interaction between desert dust particles and the Earth's atmosphere, J. Aerosol Sci., 165, 106044, doi:https://doi.org/10.1016/j.jaerosci.2022.106044, 2022.
Maring, H.: Mineral dust aerosol size distribution change during atmospheric transport, J. Geophys. Res., 108, 8592, https://doi.org/10.1029/2002JD002536, 2003.
Marinou, E., Amiridis, V., Binietoglou, I., Tsikerdekis, A., Solomos, S., Proestakis, E., Konsta, Di., Papagiannopoulos, N., Tsekeri, A., Vlastou, G., Zanis, P., Balis, Di., Wandinger, U., and Ansmann, A.: Three-dimensional evolution of Saharan dust transport towards Europe based on a 9-year EARLINET-optimized CALIPSO dataset, Atmos. Chem. Phys., 17, 5893–5919, https://doi.org/10.5194/acp-17-5893-2017, 2017.
Marinou, E., Tesche, M., Nenes, A., Ansmann, A., Schrod, J., Mamali, D., Tsekeri, A., Pikridas, M., Baars, H., Engelmann, R., Voudouri, K. A., Solomos, S., Sciare, J., Groß, S., Ewald, F., and Amiridis, V.: Retrieval of ice-nucleating particle concentrations from lidar observations and comparison with UAV in situ measurements, Atmos. Chem. Phys., 19, 11315–11342, https://doi.org/10.5194/acp-19-11315-2019, 2019.
Meng, J., Huang, Y., Leung, D. M., Li, L., Adebiyi, A. A., Ryder, C. L., Mahowald, N. M., and Kok, J. F.: Improved Parameterization for the Size Distribution of Emitted Dust Aerosols Reduces Model Underestimation of Super Coarse Dust, Geophys. Res. Lett., 49, e2021GL097287, doi:https://doi.org/10.1029/2021GL097287, 2022.
Mie, G.: Beiträge zur Optik trüber Medien, speziell kolloidaler Metallösungen, Ann. Phys., 330, 377–445, doi:https://doi.org/10.1002/andp.19083300302, 1908.
Mills, A. A.: Dust clouds and frictional generation of glow discharges on Mars, Nature, 268, 614, https://doi.org/10.1038/268614a0, 1977.
Nakanishi, M. and Niino, H.: An improved Mellor-Yamada Level-3 model: Its numerical stability and application to a regional prediction of advection fog, Bound. Lay. Meteorol., 119, 397–407, https://doi.org/10.1007/s10546-005-9030-8, 2006.
Nickovic, S., Cvetkovic, B., Petković, S., Amiridis, V., Pejanović, G., Solomos, S., Marinou, E., and Nikolic, J.: Cloud icing by mineral dust and impacts to aviation safety, Sci. Rep., 11, 6411, https://doi.org/10.1038/s41598-021-85566-y, 2021.
Nicoll, K. A., Harrison, R. G., and Ulanowski, Z.: Observations of Saharan dust layer electrification, Environ. Res. Lett., 6, 1–8, https://doi.org/10.1088/1748-9326/6/1/014001, 2011.
Okin, G. S., Mahowald, N., Chadwick, O. A., and Artaxo, P.: Impact of desert dust on the biogeochemistry of phosphorus in terrestrial ecosystems, Global Biogeochem. Cy., 18, https://doi.org/10.1029/2003GB002145, 2004.
O'Sullivan, D., Marenco, F., Ryder, C. L., Pradhan, Y., Kipling, Z., Johnson, B., Benedetti, A., Brooks, M., McGill, M., Yorks, J., and Selmer, P.: Models transport Saharan dust too low in the atmosphere: a comparison of the MetUM and CAMS forecasts with observations, Atmos. Chem. Phys., 20, 12955–12982, https://doi.org/10.5194/acp-20-12955-2020, 2020.
Petters, M. D. and Kreidenweis, S. M.: A single parameter representation of hygroscopic growth and cloud condensation nucleus activity-Part 3: Including surfactant partitioning, Atmos. Chem. Phys., 13, 1081–1091, https://doi.org/10.5194/acp-13-1081-2013, 2013.
Proestakis, E., Amiridis, V., Marinou, E., Georgoulias, A. K., Solomos, S., Kazadzis, S., Chimot, J., Che, H., Alexandri, G., Binietoglou, I., Daskalopoulou, V., Kourtidis, K. A., De Leeuw, G., and Van Der A, R. J.: Nine-year spatial and temporal evolution of desert dust aerosols over South and East Asia as revealed by CALIOP, Atmos. Chem. Phys., 18, 1337–1362, https://doi.org/10.5194/acp-18-1337-2018, 2018.
Prospero, J. M., Bonatti, E., Schubert, C., and Carlson, T. N.: Dust in the Caribbean atmosphere traced to an African dust storm, Earth Planet. Sc. Lett., 9, 287–293, https://doi.org/10.1016/0012-821X(70)90039-7, 1970.
Prospero, J. M., Ginoux, P., Torres, O., Nicholson, S. E., and Gill, T. E.: Environmental characterization of global sources of atmospheric soil dust identified with the Nimbus 7 Total Ozone Mapping Spectrometer (TOMS) absorbing aerosol product, Rev. Geophys., 40, 1002, https://doi.org/10.1029/2000RG000095, 2002.
Renard, J. B., Dulac, F., Durand, P., Bourgeois, Q., Denjean, C., Vignelles, D., Couté, B., Jeannot, M., Verdier, N., and Mallet, M.: In situ measurements of desert dust particles above the western Mediterranean Sea with the balloon-borne Light Optical Aerosol Counter/sizer (LOAC) during the ChArMEx campaign of summer 2013, Atmos. Chem. Phys., 18, 3677–3699, https://doi.org/10.5194/acp-18-3677-2018, 2018.
Roberts, A. J., Marsham, J. H., Knippertz, P., Parker, D. J., Bart, M., Garcia-Carreras, L., Hobby, M., McQuaid, J. B., Rosenberg, P. D., and Walker, D.: New Saharan wind observations reveal substantial biases in analysed dust-generating winds, Atmos. Sci. Lett., 18, 366–372, https://doi.org/10.1002/asl.765, 2017.
Rycroft, M. J., Harrison, R. G., Nicoll, K. A., and Mareev, E. A.: An Overview of Earth's Global Electric Circuit and Atmospheric Conductivity, Space Sci. Rev., 137, 83–105, https://doi.org/10.1007/s11214-008-9368-6, 2008.
Ryder, C. L., Highwood, E. J., Lai, T. M., Sodemann, H., and Marsham, J. H.: Impact of atmospheric transport on the evolution of microphysical and optical properties of Saharan dust, Geophys. Res. Lett., 40, 2433–2438, https://doi.org/10.1002/grl.50482, 2013a.
Ryder, C. L., Highwood, E. J., Rosenberg, P. D., Trembath, J., Brooke, J. K., Bart, M., Dean, A., Crosier, J., Dorsey, J., Brindley, H., Banks, J., Marsham, J. H., McQuaid, J. B., Sodemann, H., and Washington, R.: Optical properties of Saharan dust aerosol and contribution from the coarse mode as measured during the Fennec 2011 aircraft campaign, Atmos. Chem. Phys., 13, 303–325, https://doi.org/10.5194/acp-13-303-2013, 2013b.
Ryder, C. L., Marenco, F., Brooke, J. K., Estelles, V., Cotton, R., Formenti, P., McQuaid, J. B., Price, H. C., Liu, D., Ausset, P., Rosenberg, P. D., Taylor, J. W., Choularton, T., Bower, K., Coe, H., Gallagher, M., Crosier, J., Lloyd, G., Highwood, E. J., and Murray, B. J.: Coarse-mode mineral dust size distributions, composition and optical properties from AER-D aircraft measurements over the tropical eastern Atlantic, Atmos. Chem. Phys., 18, 17225–17257, https://doi.org/10.5194/acp-18-17225-2018, 2018.
Ryder, C. L., Highwood, E. J., Walser, A., Seibert, P., Philipp, A., and Weinzierl, B.: Coarse and giant particles are ubiquitous in Saharan dust export regions and are radiatively significant over the Sahara, Atmos. Chem. Phys., 19, 15353–15376, https://doi.org/10.5194/acp-19-15353-2019, 2019.
Sanjeevi, S. K. P., Kuipers, J. A. M., and Padding, J. T.: Drag, lift and torque correlations for non-spherical particles from Stokes limit to high Reynolds numbers, Int. J. Multiph. Flow, 106, 325–337, https://doi.org/10.1016/j.ijmultiphaseflow.2018.05.011, 2018.
Shao, B., Liu, G. R., Lin, T., Xu, G. X., and Yan, X.: Rotation and orientation of irregular particles in viscous fluids using the gradient smoothed method (GSM), Eng. Appl. Comput. Fluid Mech., 11, 557–575, https://doi.org/10.1080/19942060.2017.1329169, 2017.
Sinyuk, A., Holben, B. N., Eck, T. F., Giles, D. M., Slutsker, I., Korkin, S., Schafer, J. S., Smirnov, A., Sorokin, M., and Lyapustin, A.: The AERONET Version 3 aerosol retrieval algorithm, associated uncertainties and comparisons to Version 2, Atmos. Meas. Tech., 13, 3375–3411, https://doi.org/10.5194/amt-13-3375-2020, 2020.
Solomos, S., Kallos, G., Kushta, J., Astitha, M., Tremback, C., Nenes, A., and Levin, Z.: An integrated modeling study on the effects of mineral dust and sea salt particles on clouds and precipitation, Atmos. Chem. Phys., 11, 873–892, https://doi.org/10.5194/acp-11-873-2011, 2011.
Solomos, S., Ansmann, A., Mamouri, R. E., Binietoglou, I., Patlakas, P., Marinou, E., and Amiridis, V.: Remote sensing and modelling analysis of the extreme dust storm hitting the Middle East and eastern Mediterranean in September 2015, Atmos. Chem. Phys., 17, 4063–4079, https://doi.org/10.5194/acp-17-4063-2017, 2017.
Solomos, S., Kalivitis, N., Mihalopoulos, N., Amiridis, V., Kouvarakis, G., Gkikas, A., Binietoglou, I., Tsekeri, A., Kazadzis, S., Kottas, M., Pradhan, Y., Proestakis, E., Nastos, P. T., and Marenco, F.: From tropospheric folding to Khamsin and Foehn winds: How atmospheric dynamics advanced a record-breaking dust episode in Crete, Atmosphere, 9, 240, https://doi.org/10.3390/atmos9070240, 2018.
Stockdale, A., Krom, M. D., Mortimer, R. J. G., Benning, L. G., Carslaw, K. S., Herbert, R. J., Shi, Z., Myriokefalitakis, S., Kanakidou, M., and Nenes, A.: Understanding the nature of atmospheric acid processing of mineral dusts in supplying bioavailable phosphorus to the oceans, P. Natl. Acad. Sci. USA, 113, 14639–14644, https://doi.org/10.1073/pnas.1608136113, 2016.
Tagliabue, A., Bowie, A. R., Boyd, P. W., Buck, K. N., Johnson, K. S., and Saito, M. A.: The integral role of iron in ocean biogeochemistry, Nature, 543, 51–59, https://doi.org/10.1038/nature21058, 2017.
Tesche, M., Ansmann, A., Müller, D., Althausen, D., Mattis, I., Heese, B., Freudenthaler, V., Wiegner, M., Esselborn, M., Pisani, G., and Knippertz, P.: Vertical profiling of Saharan dust with Raman lidars and airborne HSRL in southern Morocco during SAMUM, Tellus B, 61, 144–164, https://doi.org/10.1111/j.1600-0889.2008.00390.x, 2009.
Textor, C., Schulz, M., Guibert, S., Kinne, S., Balkanski, Y., Bauer, S., Berntsen, T., Berglen, T., Boucher, O., Chin, M., Dentener, F., Diehl, T., Easter, R., Feichter, H., Fillmore, D., Ghan, S., Ginoux, P., Gong, S., Grini, A., Hendricks, J., Horowitz, L., Huang, P., Isaksen, I., Iversen, T., Kloster, S., Koch, D., Kirkevåg, A., Kristjansson, J. E., Krol, M., Lauer, A., Lamarque, J. F., Liu, X., Montanaro, V., Myhre, G., Penner, J., Pitari, G., Reddy, S., Seland, Stier, P., Takemura, T., and Tie, X.: Analysis and quantification of the diversities of aerosol life cycles within AeroCom, Atmos. Chem. Phys., 6, 1777–1813, https://doi.org/10.5194/acp-6-1777-2006, 2006.
Toth III, J. R., Rajupet, S., Squire, H., Volbers, B., Zhou, J., Xie, L., Sankaran, R. M., and Lacks, D. J.: Electrostatic forces alter particle size distributions in atmospheric dust, Atmos. Chem. Phys., 20, 3181–3190, https://doi.org/10.5194/acp-20-3181-2020, 2020.
Tsekeri, A., Amiridis, V., Tsichla, M., Fountoulakis, I., Nersesian, A., Proestakis, E., Gkikas, A., Papachristopoulou, K., Barlakas, V., and Kazadzis, S.: The effect of large dust size on solar radiation fluxes, Oral presentation at the International Radiation Symposium, Thessaloniki, Greece, 4–8 July 2022.
Tsikerdekis, A., Zanis, P., Steiner, A. L., Solmon, F., Amiridis, V., Marinou, E., Katragkou, E., Karacostas, T., and Foret, G.: Impact of dust size parameterizations on aerosol burden and radiative forcing in RegCM4, Atmos. Chem. Phys., 17, 769–791, https://doi.org/10.5194/acp-17-769-2017, 2017.
Twohy, C. H., Kreidenweis, S. M., Eidhammer, T., Browell, E. V., Heymsfield, A. J., Bansemer, A. R., Anderson, B. E., Chen, G., Ismail, S., DeMott, P. J., and Van Den Heever, S. C.: Saharan dust particles nucleate droplets in eastern Atlantic clouds, Geophys. Res. Lett., 36, 1–6, https://doi.org/10.1029/2008GL035846, 2009.
United States Committee on Extension to the Standard Atmosphere.: U.S. standard atmosphere, 1976, National Oceanic and Amospheric Administration : For sale by the Supt. of Docs., U.S. Govt. Print. Off., Washington., 1976.
van Der Does, M., Korte, L. F., Munday, C. I., Brummer, G. J. A., and Stuut, J. B. W.: Particle size traces modern Saharan dust transport and deposition across the equatorial North Atlantic, Atmos. Chem. Phys., 16, 13697–13710, https://doi.org/10.5194/acp-16-13697-2016, 2016.
van der Does, M., Knippertz, P., Zschenderlein, P., Giles Harrison, R., and Stuut, J. B. W.: The mysterious long-range transport of giant mineral dust particles, Sci. Adv., 4, eaau2768, https://doi.org/10.1126/sciadv.aau2768, 2018.
Versteeg, H. K. and Malalasekera, W.: An introduction to computational fluid dynamics : the finite volume method, 2nd Edn., Pearson Education, ISBN 978-0-13-127498-3, 2007.
Weinzierl, B., Petzold, A., Esselborn, M., Wirth, M., Rasp, K., Kandler, K., SchüTZ, L., Koepke, P., and Fiebig, M.: Airborne measurements of dust layer properties, particle size distribution and mixing state of Saharan dust during SAMUM 2006, Tellus B, 61, 96–117, https://doi.org/10.1111/j.1600-0889.2008.00392.x, 2009.
Weinzierl, B., Sauer, D., Esselborn, M., Petzold, A., Veira, A., Rose, M., Mund, S., Wirth, M., Ansmann, A., Tesche, M., Gross, S., and Freudenthaler, V.: Microphysical and optical properties of dust and tropical biomass burning aerosol layers in the Cape Verde region-an overview of the airborne in situ and lidar measurements during SAMUM-2, Tellus B, 63, 589–618, https://doi.org/10.1111/j.1600-0889.2011.00566.x, 2011.
Weinzierl, B., Sauer, D., Minikin, A., Reitebuch, O., Dahlkötter, F., Mayer, B., Emde, C., Tegen, I., Gasteiger, J., Petzold, A., Veira, A., Kueppers, U., and Schumann, U.: On the visibility of airborne volcanic ash and mineral dust from the pilot's perspective in flight, Phys. Chem. Earth, 45/46, 87–102, https://doi.org/10.1016/j.pce.2012.04.003, 2012.
Weinzierl, B., Ansmann, A., Prospero, J. M., Althausen, D., Benker, N., Chouza, F., Dollner, M., Farrell, D., Fomba, W. K., Freudenthaler, V., Gasteiger, J., Groß, S., Haarig, M., Heinold, B., Kandler, K., Kristensen, T. B., Mayol-Bracero, O. L., Müller, T., Reitebuch, O., Sauer, D., Schäfler, A., Schepanski, K., Spanu, A., Tegen, I., Toledano, C., and Walser, A.: The Saharan aerosol long-range transport and aerosol-cloud-interaction experiment: Overview and selected highlights, Bull. Am. Meteorol. Soc., 98, 1427–1451, https://doi.org/10.1175/BAMS-D-15-00142.1, 2017.
Winker, D. M., Vaughan, M. A., Omar, A., Hu, Y., Powell, K. A., Liu, Z., Hunt, W. H., and Young, S. A.: Overview of the CALIPSO Mission and CALIOP Data Processing Algorithms, J. Atmos. Ocean. Technol., 26, 2310–2323, https://doi.org/10.1175/2009JTECHA1281.1, 2009.
Zastawny, M., Mallouppas, G., Zhao, F., and van Wachem, B.: Derivation of drag and lift force and torque coefficients for non-spherical particles in flows, Int. J. Multiph. Flow, 39, 227–239, https://doi.org/10.1016/j.ijmultiphaseflow.2011.09.004, 2012.