the Creative Commons Attribution 4.0 License.
the Creative Commons Attribution 4.0 License.
 | 23 Sep 2022
Reconciling the total carbon budget for boreal forest wildfire emissions using airborne observations
Katherine L. Hayden
Shao-Meng Li
John Liggio
Michael J. Wheeler
Jeremy J. B. Wentzell
Amy Leithead
Peter Brickell
Richard L. Mittermeier
Zachary Oldham
Cristian M. Mihele
Ralf M. Staebler
Samar G. Moussa
Andrea Darlington
Mengistu Wolde
Daniel Thompson
Jack Chen
Debora Griffin
Ellen Eckert
Jenna C. Ditto
Drew R. Gentner
Wildfire impacts on air quality and climate are expected to be exacerbated by climate change with the most pronounced impacts in the boreal biome. Despite the large geographic coverage, there is limited information on boreal forest wildfire emissions, particularly for organic compounds, which are critical inputs for air quality model predictions of downwind impacts. In this study, airborne measurements of 193 compounds from 15 instruments, including 173 non-methane organics compounds (NMOG), were used to provide the most detailed characterization, to date, of boreal forest wildfire emissions. Highly speciated measurements showed a large diversity of chemical classes highlighting the complexity of emissions. Using measurements of the total NMOG carbon (NMOGT), the ΣNMOG was found to be 50 % ± 3 % to 53 % ± 3 % of NMOGT, of which, the intermediate- and semi-volatile organic compounds (I/SVOCs) were estimated to account for 7 % to 10 %. These estimates of I/SVOC emission factors expand the volatility range of NMOG typically reported. Despite extensive speciation, a substantial portion of NMOGT remained unidentified (47 % ± 15 % to 50 % ± 15 %), with expected contributions from more highly-functionalized VOCs and I/SVOCs. The emission factors derived in this study improve wildfire chemical speciation profiles and are especially relevant for air quality modelling of boreal forest wildfires. These aircraft-derived emission estimates were further linked with those derived from satellite observations demonstrating their combined value in assessing variability in modelled emissions. These results contribute to the verification and improvement of models that are essential for reliable predictions of near-source and downwind pollution resulting from boreal forest wildfires.
- Article
(7507 KB) - Full-text XML
-
Supplement
(12532 KB) - BibTeX
- EndNote


Wildfires play a natural role in maintaining forest health and diversity through the release of nutrients, seed germination, removal of aging vegetation, and reducing the spread of forest diseases. Wildfires are, however, one of the largest global sources of trace gases and aerosols to the atmosphere (Andreae, 2019; Yu et al., 2019) and can have deleterious impacts on human health (Cascio, 2018; Cherry and Haynes, 2017; Reid et al., 2016; Finlay et al., 2012; Matz et al., 2020), air quality (Landis et al., 2018; Miller et al., 2011; Rogers et al., 2020), ecosystems (Kou-Giesbrecht and Menge, 2019; Campos et al., 2019; Kallenborn et al., 2012; Johnstone et al., 2010), and climate (Randerson et al., 2006). Not only can wildfire pollutants fumigate local source areas, they can be transported over long distances resulting in degraded air quality in locations far from fire sources (Miller et al., 2011; Rogers et al., 2020), and pose threats to downwind ecosystems through wet and dry deposition processes (Kou-Giesbrecht et al., 2019; Kallenborn et al., 2012; Campos et al., 2019).
The severity and frequency of wildfires is expected to increase in response to climate change (Bush and Lemmen, 2019; Seidl et al., 2017; Whitman et al., 2019) with evidence to suggest that such impacts are expected to be most pronounced in the boreal biome (Seidl et al., 2017; Whitman et al., 2019). The boreal forest zone is the most northerly of all forest biomes accounting for 1.2×10⁹ ha of mostly coniferous forest and comprising about 33 % of the global forest area, or 14 % of the earth's land surface (https://www.nrcan.gc.ca/our-natural-resources/forests/sustainable-forest-management/boreal-forest/8-facts-about-canadas-boreal-forest/17394, last access: 31 July 2022). On a global basis, boreal forest wildfires are responsible for an estimated 20 % of yearly global biomass burning emissions (van der Werf et al., 2017). Canada's boreal forests account for ∼28 % of the global boreal zone area and encompasses 75 % of Canada's 347×106 ha of forested land (Fig. S1 in the Supplement) (https://www.nrcan.gc.ca/our-natural-resources/forests/sustainable-forest-management/boreal-forest/8-facts-about-canadas-boreal-forest/17394.) In the past decade, Canada has experienced unprecedented fire seasons, with large numbers of evacuations, major property damage, poor air quality, and significant economic impacts (NRCan, 2018; Landis et al., 2018; McGee et al., 2015). Model predictions have suggested that Canadian fire occurrences will increase by 25 % by 2030 from a 1975 to 1990 baseline scenario (Wotton et al., 2010).
To adequately assess and mitigate the risks of wildfire emissions to human and ecosystem health, reliable pollutant predictions are required which depend on accurate and detailed fire emissions data. Such emissions data are developed by multiplying emission factors with the mass of biomass burned (Chen et al., 2019). In Canada, Environment and Climate Change Canada (ECCC) provides predictions of particulate matter (PM) (<2.5 µm in diameter) from wildfire smoke to the public using the FireWork modelling system that combines forecast meteorology, emissions inputs (e.g. emission factors), forest fire and fuel data (e.g. fuel maps, plume height parameterization), and a regional air quality model, GEM-MACH (details in Chen et al., 2019). FireWork is also used for air quality research studies with significantly more complex chemical mechanisms for emissions characterization and detailed physical processes. Wildfire field studies, as well as prescribed burns and laboratory work, have resulted in valuable global databases of fire emission factors covering a broad range of ecosystems and geographic areas (e.g. Andreae, 2019; Akagi et al., 2011), however, they are primarily concentrated on the temperate forests of the American mid-west and savannah/grasslands of Africa (e.g. Andreae, 2019; Permar et al., 2021; Palm et al., 2020; Lindaas et al., 2020; Roberts et al., 2020; Juncosa-Calaharrano et al., 2021; Coggon et al., 2019; Koss et al., 2018; Hatch et al., 2017). Until now, the most complete characterization of boreal forest wildfire emissions in Canada was provided by Simpson et al. (2011) which relied on whole air canisters with offline analysis for organic compounds. Due to limited comprehensive emission data specific for boreal wildfires, air quality models for northern regions face significant challenges resulting in uncertain predictions of emissions, exposure, and associated impacts.
In the summer 2018, a research aircraft was deployed to measure emissions and subsequent transformation processes from a boreal forest wildfire in western Canada (Figs. 1 and S1). In this paper, measurements of a comprehensive suite of gas- and particle-phase compounds are used to provide a detailed characterization of smoldering wildfire emissions. The highly speciated non-methane organic gas (NMOG) measurements are described by broad chemical classes and across a range of volatilities extending from VOCs (volatile organic compounds) to SVOCs (semi-volatile organic compounds). The wide range of measured NMOGs, along with concurrent total NMOG carbon (NMOGT) measurements, provides a unique opportunity to reconcile the total carbon budget. Emission factors are derived for 193 compounds which represents the most extensive chemical speciation of wildfire emissions to date, almost tripling the number of reported values for the boreal forest ecosystem in the Andreae (2019) compilation paper. Emission estimates are also combined with those from satellite observations to evaluate modelled diurnal variability. The purpose of this work is to provide relevant emissions information for boreal forest wildfires to ultimately contribute towards improved emissions quantification and chemical speciation representations in air quality models.
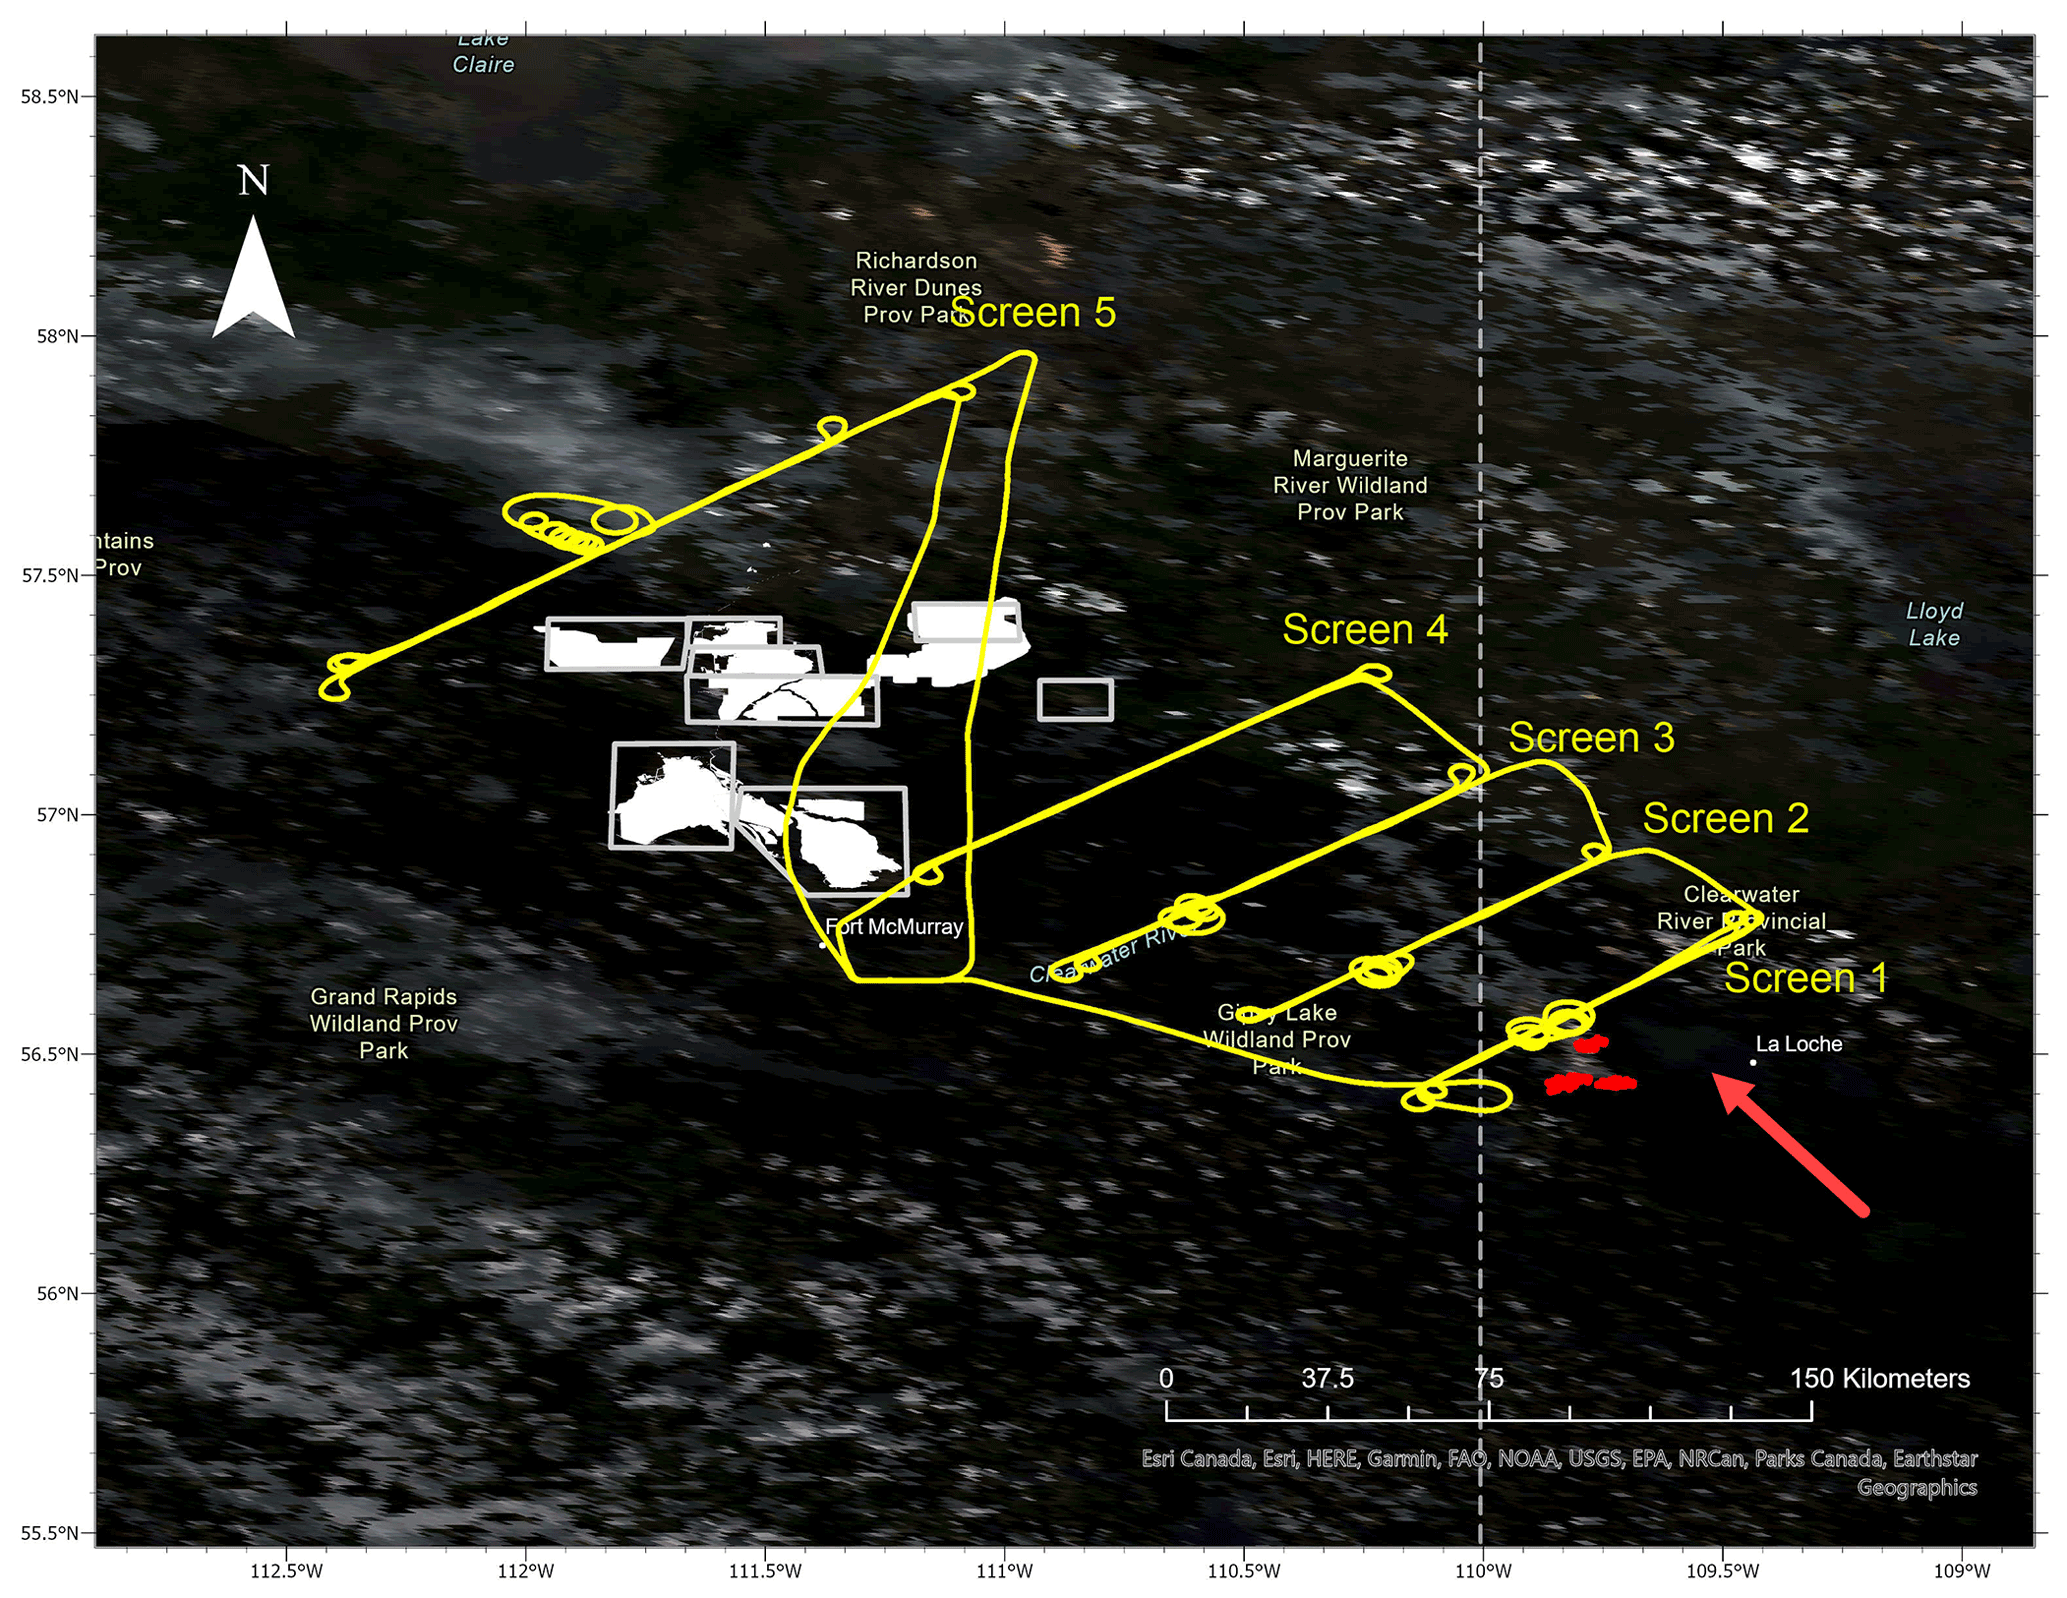
Figure 1Corrected reflectance satellite image from the VIIRS spectroradiometer on the Suomi NPP and NOAA-20 satellites taken on 25 June 2018. The fire hot spots for the wildfire of interest are indicated by the red dots. Flight tracks were flown at Lagrangian distances downwind of the wildfire. Multiple transects at varying altitudes perpendicular to the plume direction formed five virtual screens. Plume direction of travel is indicated by the red arrow. The location of the Alberta oil sands mining facilities are shown in white.
2.1 Aircraft measurements
The NRC's Convair-580 research aircraft was deployed on 25 June 2018 to sample a wildfire detected to the east of the Alberta/Saskatchewan border (56.4∘ N, 109.7∘ W) (Fig. 1). Measurements of a comprehensive suite of trace gases, particles, and meteorology were made with high time resolution. Meteorological measurements including relative humidity, temperature, wind direction, and speed, and aircraft state parameters such as altitude (m a.s.l.) and geographic coordinates were conducted at 1 s time resolution. A detailed description of the various measurement methods with references is provided in the supporting information (Sect. S1.1, Tables S1 and S2 in the Supplement), with only a brief description provided here.
2.1.1 Trace gas measurements
In situ measurements of NO, NO2, NOy, O3, and SO2 were conducted using commercial instruments (Thermo Scientific Inc.) modified to measure at 1 s time resolution. Ammonia (NH3) measurements were made at 1 s time resolution using a Los Gatos Research (LGR) Analyzer, model 911-0039. Gas phase elemental Hg (GEM) was measured with a Tekran 237X instrument (Tekran Instruments Corporation) modified to allow a reduced sampling time of 2 min (McLagan et al., 2021; Cole et al., 2014). CO, CO2, and CH4 were measured with a cavity ring down spectroscopy instrument (Picarro G2401 m). A second Picarro G2401 m instrument was used to measure total carbon (TC, in units of ppm C) by passing the sample air through a catalyst to convert all carbon species to CO2. Total non-methane organic gases (NMOGT), in mixing ratios units of ppm C, was quantified by subtracting the ambient CH4, CO, and CO2 measurements (instrument without the catalyst) from the TC measurements (see Sect. S1.0 in the Supplement for more details).
Individually speciated NMOGs (and some inorganic species) were measured with a chemical ionization mass spectrometer (CIMS), with a proton transfer time-of-flight mass spectrometer (PTRMS), and through an advanced whole air sampler (AWAS) using canisters. In addition, integrated cartridge-based samples were taken. The CIMS (a modified Tofwerk/Aerodyne Api-ToF) was operated using iodide as the reagent ion providing 1 s time resolved measurements for 30 compounds (Table S2). The PTRMS (Ionicon Analytik GmbH, Austria) used chemical ionization with H3O+ as the primary reagent ion providing 1 s measurements for a suite of organic compounds. For those compounds with no available gas standard, a relative response factor was calculated with reaction rate constants using the method described in Sekimoto et al. (2017) and guided by the work of Koss et al. (2018) (“calculated” compounds). Integrated “grab” samples (20–30 s) were collected from the aircraft using the AWAS with offline analysis. The AWAS provided speciated measurements of hydrocarbons (≤C10), but no oxygenates. Overlapping compounds/isomers that were measured by both the PTRMS and AWAS, and between the PTRMS and CIMS, were handled as described in Sect. S1.1.4 in the Supplement. Integrated gas-phase samples were collected using an automated adsorbent tube (i.e. cartridge) sampling assembly with offline analysis (Ditto et al., 2021; Sheu et al., 2018; Khare et al., 2019). These samples provided targeted measurements of gas-phase compounds ranging in volatility from C10 volatile organic compounds (VOCs) to C25 semivolatile organic compounds (SVOCs) including hydrocarbons (CH), and functionalized compounds containing 1 oxygen atom (CHO1) and 1 sulfur atom (CHS1).
2.1.2 Particle measurements
Particle chemistry was obtained with a high-resolution aerosol mass spectrometer (AMS) (Aerodyne) providing mass concentrations of particle species including total organics (OA), NO3, SO4, and NH4 for particles less than ∼1 µm. Particle size distributions were measured between 60 and 1000 nm at 1 s time resolution using the ultra high sensitivity aerosol spectrometer (UHSAS; Droplet Measurement Technologies). Refractory black carbon (rBC) was measured using a single-particle soot photometer (SP2; Droplet Measurement Technologies).
2.2 Flight and fire description
A wildfire located near Lac La Loche in Saskatchewan (56.40∘ N, 109.90∘ W) was detected by satellite on 23 June (Figs. 1 and S1). The fire was ignited by lightning on 23 June 2018 at 19:45 UTC and lasted 50 h to 25 June 21:41 UTC, burning an estimated 10 000 ha before being extinguished by rain. The area burned was mostly mature Jack pine and boreal spruce forest with a smaller fraction of boreal mixed-wood forest. Satellite images from the VIIRS spectroradiometer on the Suomi NPP and NOAA-20 satellites taken on 25 June showed merged fire hot spots with a visible smoke plume moving in a north-westerly direction (Fig. 1; see Sect. S2.0 in the Supplement for more details). Lagrangian flight tracks were flown downwind of the wildfire to follow the fire plumes. Multiple horizontal transects, vertically stacked and perpendicular to the plume direction, were made at different altitudes from 640 to 1460 m a.s.l. (∼220–1040 m a.g.l., based on 420 m a.s.l. at Lac La Loche) forming virtual screens. Five screens were completed over two flights with the closest screen ∼10 km and the farthest screen 164 km downwind of the fire, with the screens spaced such that the instruments sampled the same air parcels as they were transported downwind. A vertical profile which typically reached ∼2500 m a.s.l. was conducted in the plume at each screen to gather information on its vertical structure and the height of the plume. As demonstrated by the elevated CO mixing ratios in Fig. 2, two distinct plumes were identified – a south plume (SP) and north plume (NP) – that were transported in parallel in a northwesterly direction. The SP is estimated to be ∼42 min-old based on the measured wind speed at screen 1 and the distance from the closest edge of the VIIRS fire hot spots (∼10 km). The NP is estimated to be an additional 30 min older than the SP (further details in Sect. S2.0). For the purposes of this investigation, only data from screen 1 are used to characterize the direct emissions from this fire. There were no significant anthropogenic sources like upwind urban or industrial areas impacting the screen 1 measurements. Plume evolution during transport from screen 1 to downwind screens 2 to 5 is discussed in other papers (Ditto et al., 2021; McLagan et al., 2021).
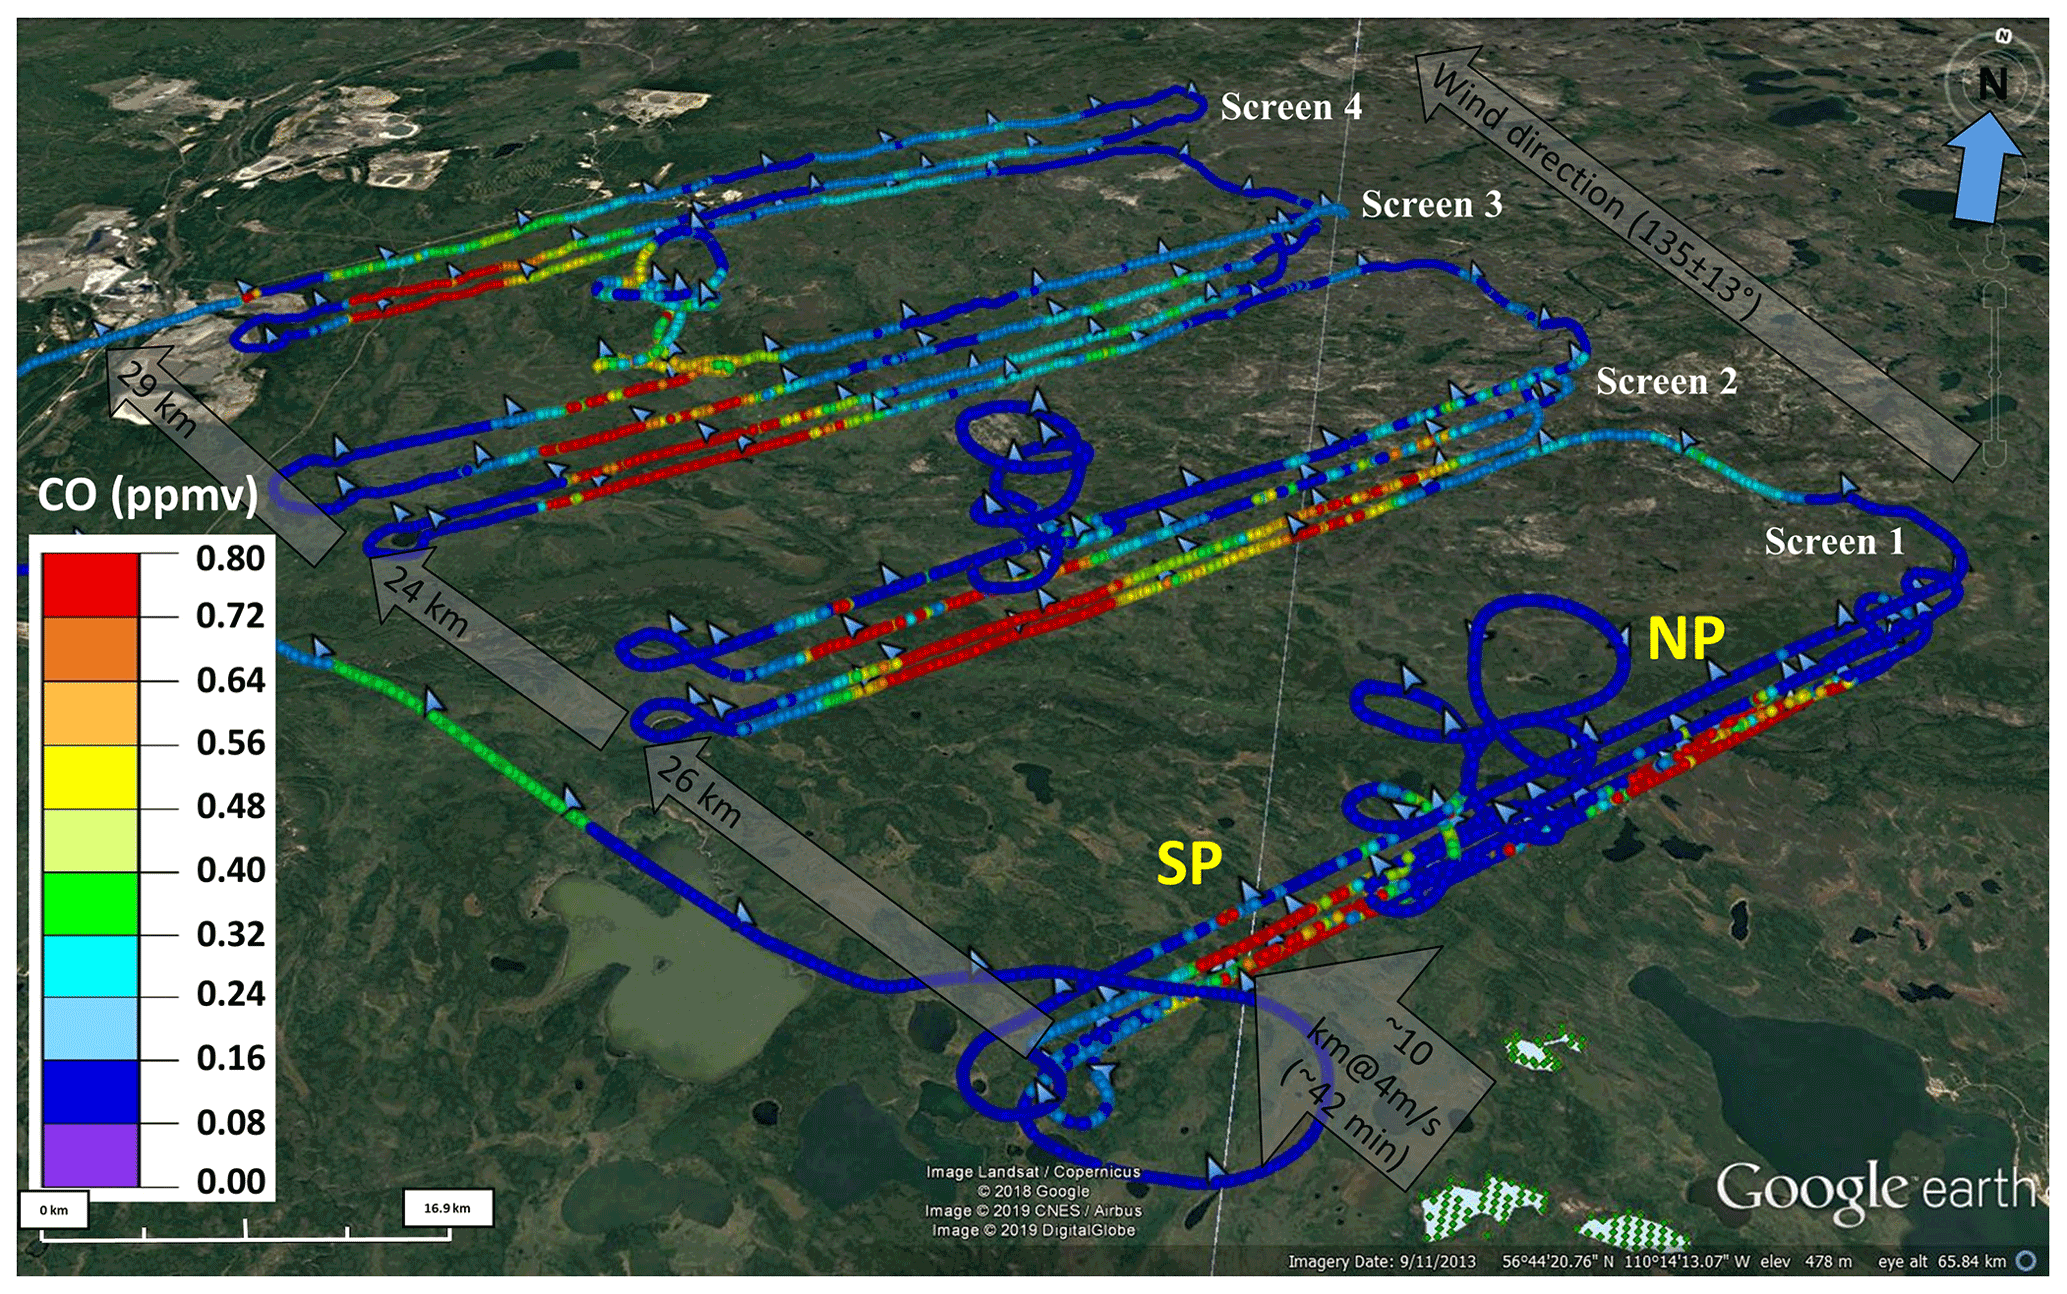
Figure 2Flight tracks coloured by CO mixing ratio (ppmv) for screens 1 to 4. The two plumes are identified as south plume (SP) and north plume (NP). The fire perimeter surrounding the detected MODIS-derived “hot spots” on 25 June 2018 is shown in the green hatched area. The source of the NP is expected to be the same hot spots as the SP but ∼30 min older; see Sect. 2.2. The small blue arrows along the flight tracks indicate the aircraft-measured wind direction with the average wind direction depicted with the large grey arrow. Distances between screens are shown in the grey arrows. © Google Earth.
2.3 Emission ratios
Emission ratios (ERs) were calculated using an integration method (e.g. Yokelson et al., 2009; Garofalo et al., 2019) using the in-plume measurements for the SP and NP. The integration method was carried out for the real-time measurements by first subtracting a background from the in-plume measurements. Background measurements were defined as the average over short time segments (∼30 s) outside and at the same altitude as inside the plume, and typically selected at the ends of the horizontal transects. The background-subtracted plume measurements yielded enhanced plume values (e.g. ΔX(t)) which were then integrated using the plume start and end times guided by when CO mixing ratios were above the CO background. Nominal plume time periods are indicated by the vertical grey bars in Fig. 3 which shows time series for CO, NMOGT, OA, and acetonitrile for the first four of five transects on screen 1. Integrated pollutant values were subsequently normalized by the integrated values of CO (Eq. 1) to account for changes due to dilution producing emission ratios (ERs) for the SP and NP for each transect on screen 1.
CO is known to be a suitable dilution tracer as it has a long atmospheric lifetime of 1–4 months (Seinfeld and Pandis, 1998) and is therefore unreactive on the timescale of the measurements. In this study, ERs were calculated using CO as it was enhanced above a background of ∼0.119 ± 0.005 ppmv for the plumes measured, there were no other significant CO sources in the study area, and CO is a particularly good tracer for smoldering fires (e.g. Simpson et al., 2011).
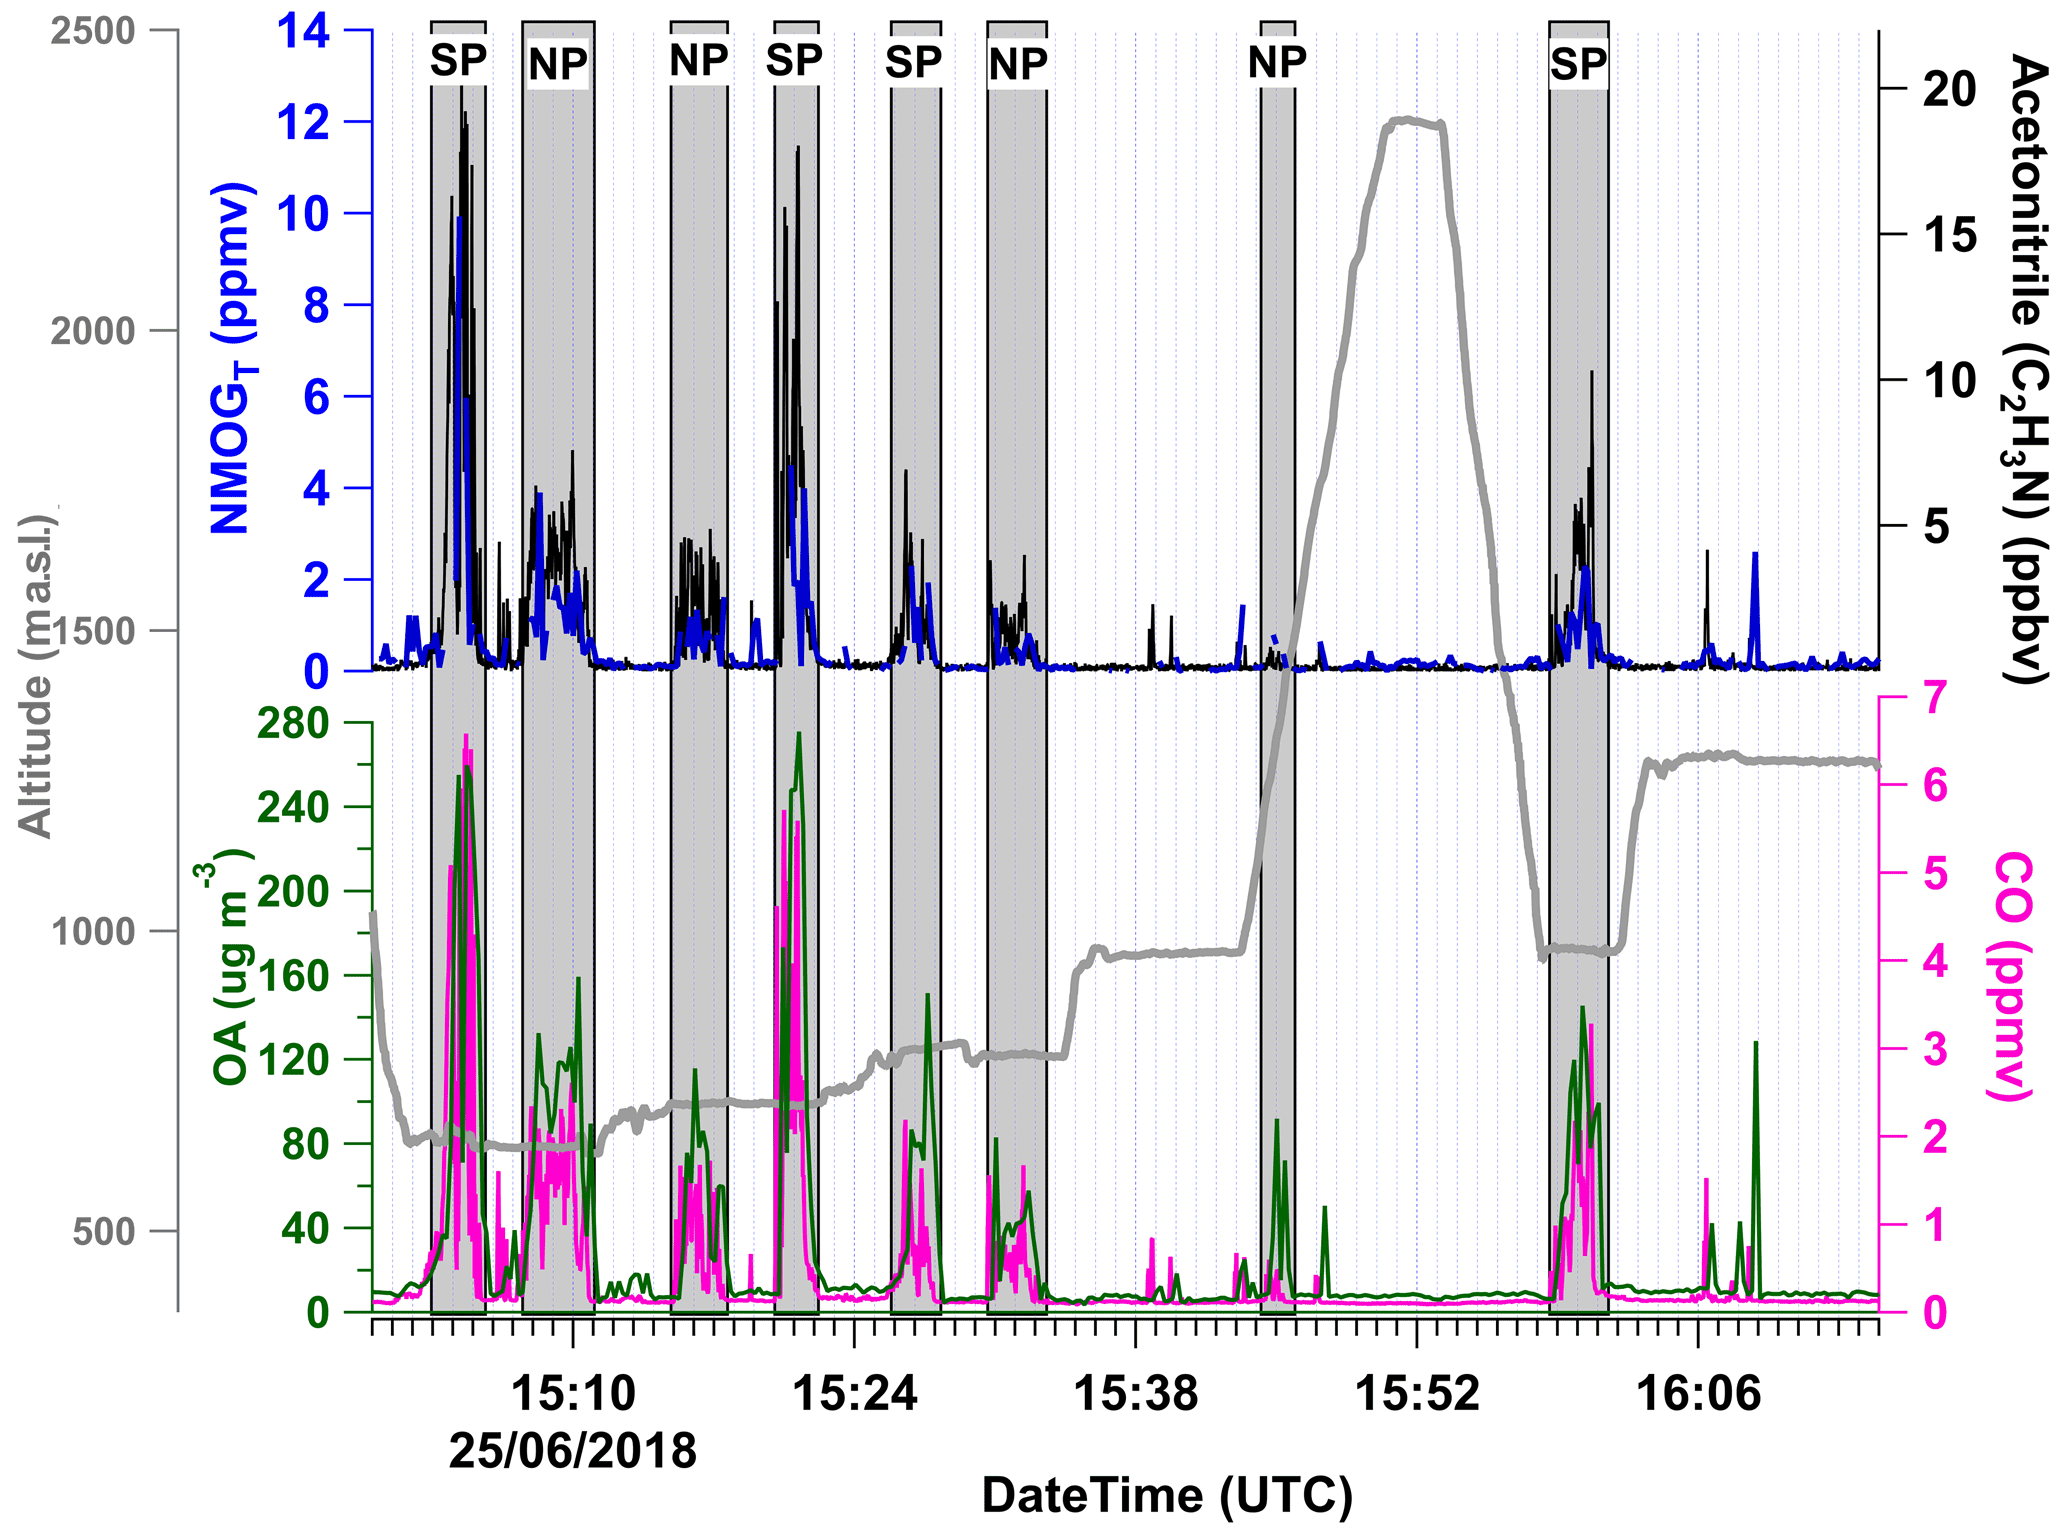
Figure 3Time series of NMOGsT (ppmv), acetonitrile (C2H3N; ppbv), and CO (ppmv), and OA concentrations (µg m−3) and altitude for screen 1. The in-plume portions are indicated by the vertical grey bars. The aircraft flew back and forth across the plumes at increasing altitudes to complete five transects; a transect represents one pass across the SP and NP at the same altitude.
ERs for the AWAS compounds were determined using the average mixing ratio of three samples taken in the SP and two in the NP, and the average mixing ratio of two background samples. CO mixing ratios were averaged across the AWAS sample time period. For the integrated cartridges, samples were collected over the lower set of aircraft transects (“LOW”) and higher set of transects (“HIGH”), resulting in two integrated cartridge samples for each screen. The HIGH sample was used as the background. The HIGH sample was collected largely outside the wildfire plume, but may have been influenced to some extent from emissions. However, this impact is expected to be minimal as average CO mixing ratios during the HIGH sample were at background levels (∼0.14 ppmv). Nevertheless, to address the potential for influence of the plume in the HIGH sample, the ERs are presented as ranges with the lower estimates derived by subtracting the HIGH background sample, and the upper estimates without subtracting the HIGH sample. This calculation is described in Eq. (2), where CartridgeLOW represents the LOW cartridge sample measurements, CartridgeBKGD is the background derived from the HIGH cartridge sample measurements, and COLOW and COBKGD are the average CO concentrations during the respective LOW and HIGH cartridge integration time periods. The uncertainty with this bounding analysis is acknowledged, but the I/SVOCs ERs within a plume are likely to vary similar to other work (Hatch et al., 2018).
2.4 Emission factors
Emission factors (EFs) were determined as the mass of the compound of interest emitted per unit mass of dry fuel burned in g kg−1 assuming that all of the carbon in the fuel was released into the atmosphere and measured (Ward and Radke, 1993; Yokelson et al., 2007), and that the mass fraction of carbon in the fuel is constant. EFs were determined using Eq. (3), where Fc is the mass fraction of carbon in the fuel and estimated to be 0.5 (de Groot et al., 2009, and references therein), mmx is the molar mass of the compound of interest and mmc is the molar mass of carbon, 12 g mol−1, ΔX is the integrated background-subtracted mixing ratio or concentration of the species of interest, and ΔTC is the integrated background-subtracted TC. TC (see Sect. 2.1.1) was directly measured and includes all the carbon mass in CO2, CO, CH4, and NMOGT, and that from particulate black carbon (rBC) and particulate organic carbon (OC) (which were added to the TC), for a complete accounting of all the emitted carbon. For species measured in mass concentration units, Eq. (3) was modified by converting TC to mass concentrations using the measured temperature and pressure, and removing the molar mass ratio term. The EFs for the AWAS and the cartridge samples were derived using the average measurements as discussed for the ER, but with TC as the denominator.
EFs were determined for the SP and NP for each transect, and then averaged to obtain screen-averaged EFs for the SP and the NP, and for both plumes together.
2.5 Emissions uncertainties
There is the potential for inherent uncertainties using a plume integration method for calculating EFs and ERs as the ratios derived this way represent the average plume composition and ignore the spatial heterogeneity in wildfire plumes (Palm et al., 2020; Decker et al., 2021; Garofalo et al., 2019), chemical transformation processes, and can also be affected by changing background levels. Pollutants released by wildfires can be influenced by photochemical and physical changes that may take place between the time of emission and the time of measurement, particularly for more reactive compounds (e.g. Palm et al., 2021; Lindaas et al., 2020; Peng et al., 2020; Akagi et al., 2011). Although controlled laboratory studies are well-suited to examine direct emissions with minimal aging, they cannot reproduce realistic burning conditions. Field measurements are critical to understand emissions that are impacted by factors such as complex burning dynamics, fuel moisture, temperature, and winds (Andreae, 2019). Recognizing the challenges of measuring primary emissions by aircraft, at 10 km (<1 h) away from the fire source, screen 1 measurements represent some of the freshest emissions measured under wildfire conditions, thus providing best estimates of initial conditions.
Uncertainties in the EFs and ERs are estimated by summing in quadrature the standard error of the average EF (or ER) and the propagated measurement uncertainties. The standard error is used as description of the uncertainty on the average EF (and ER) characterizing repeated transects across the SP and NP for a total of 20 min of in-plume sampling. The standard error is expected to at least partially capture uncertainties associated with plume aging and vertical plume heterogeneity. As many compounds exhibited significant in-plume enhancements above background levels, uncertainties in the integrated ΔX, ΔCO, and ΔTC values were assumed to be dominated by instrumental (measurement) uncertainties (Tables S1 and S2). Emissions are not reported for compounds where the average mixing ratios were within 1σ of the background average. The low and high I/SVOCs EFs (and ERs) are provided as estimates of their uncertainties (as described in Sect. 2.3). The derivation of AWAS and cartridge EFs (and ERs) may have potential limitations as they rely on a limited number of samples, with the potential of the AWAS discrete samples capturing only part of a plume.
2.6 Combustion efficiency
Combustion efficiency (CE) is a useful indicator of the relative proportion of flaming vs. smoldering stages of combustion which has a significant influence on the chemical composition of the smoke (see Sect. S3.0 in the Supplement for further details). Flaming fires have CE>0.90 (Yokelson et al., 1996) and smoldering fires are typically ∼0.8 with a range of 0.65 to 0.85 reported in the literature (Akagi et al., 2011; Yokelson et al., 2003). A modified combustion efficiency (MCE) is commonly calculated assuming that CO2+CO adequately represents all of the fuel carbon that has been volatilized and detected in ambient air. Here, as the TC in the plume was directly measured, ΔTC was used in Eq. (4) to improve on the estimation of the CE by accounting for all the sources of carbon. ΔCO2 and ΔTC in Eq. (4) are the integrated, background-subtracted mixing ratios.
3.1 Fire combustion state
The plume-averaged CE for the SP (transects 1 to 4) was 0.84 ± 0.04, and for the NP (transects 1 to 3), 0.82 ± 0.01. Transect 4 was excluded from the calculations for the NP because only a portion of the plume was detectable at this altitude (Fig. 3). The derived CE indicates that the fire was predominantly in a low intensity smoldering phase which is consistent with the satellite-derived fire intensities during the flight (see Fig. 10) and ground-based meteorological observations, and may reflect some residual smoldering combustion (RSC). It is estimated that emissions from this fire were sampled 14 h post flaming. Other chemical measurements from this flight also support that the fire was largely smoldering including the detection of elevated (levoglucosan fragment from the AMS; Fig. S4 in the Supplement), and no detectable K+ (from the AMS) (Lee et al., 2010). Significant spatial variability in the concentrations of many of the measured species were observed closest to the fire source, while the plumes became more well-mixed as they were transported downwind (Fig. S5 in the Supplement). This highlights the complexities of assessing wildfire combustion processes (Ward and Radke, 1993), and in particular, boreal forests have been observed to exhibit greater variability in combustion efficiencies than for other vegetation types (Urbanski et al., 2009).
3.2 General plume features
Table A1 shows mixing ratios (or concentrations) and background levels of 193 pollutants that were enhanced in the fire plumes. The quantification of this suite of compounds provides new and additional emission estimates to those reported in Simpson et al. (2011) and compiled in Andreae (2019) for the boreal forest ecosystem. Several sulfur-containing compounds and a few other VOCs were not detected (Table S6 in the Supplement), and although not part of the measurement suite in the present study, Simpson et al. (2011) did not observe emissions of anthropogenic halocarbons from wildfires in the same boreal forest ecosystem. In Fig. 3, the in-plume portions are highlighted by the grey vertical bars, and the SP and NP are indicated as the aircraft flew at increasing altitudes to complete five horizontal transects. The lowest four transects showed enhanced pollutant levels while the fifth transect (not shown) was predominantly above the height of the plumes. Higher concentrations were generally observed in the SP compared to the NP, possibly because of some plume dilution in the NP resulting from a change in wind direction prior to sampling. The SP and NP were distinctly separated from each other, with pollutants typically dropping to background levels between the plumes. NMOGT mixing ratios varied between background levels of ∼375 ppbv to near 10 ppmv in-plume. CO and acetonitrile, often used as tracers of biomass burning (e.g. Wiggins et al., 2021; Landis et al., 2018; Simpson et al., 2011; de Gouw et al., 2006), reached 6.6 ppmv and 20 ppbv, respectively in the SP, while maximum OA concentrations reached 276 µg m−3, above a background level of ∼12.5 ± 0.83 µg m−3. OA was the largest contributor to particulate mass (PM) comprising over 90 % of the measured submicron mass with remaining portion comprised of BC, NO3, NH4, and SO4 (Fig. S6 in the Supplement). Integrated filter samples taken from the aircraft across screen 1 also showed the presence of a diverse set of functionalized particle-phase organic compounds (Ditto et al., 2021).
The most abundant reactive nitrogen compounds (Nr) were in the forms of reduced nitrogen (79 %) with NH3 comprising 42 % of ΣNr (Fig. 4) and substantially lower nitrogen oxides i.e. NOx<1 ppbv. Dominant proportions of reduced nitrogen in biomass burning emissions were also reported previously (Lindaas et al., 2020; Burling et al., 2011; Yokelson et al., 1996). Nitrogen-containing organics were detected in the present study totalling 3.9 ppbv and 18 % of ΣNr (Fig. 4), however other such compounds that were not included with the instrument suite used in this study were also likely emitted. Such compounds could include organic nitrates, amines, amides, heterocyclic compounds, nitriles, and nitro compounds that have been found in biomass burning emissions (Roberts et al., 2020; Lindaas et al., 2020; Andreae, 2019; Koss et al., 2018; Tomaz et al., 2018; Stockwell et al., 2015). Alkyl nitrates have been identified in biomass burning emissions, but their contributions to total Nr appeared to be small (Juncosa-Calahorrano et al., 2021; Roberts et al., 2020; Lindaas et al., 2020; Simpson et al., 2011; Alvarado et al., 2010; Singh et al., 2010).

Figure 4Background-subtracted average screen 1 in-plume mixing ratios of measured gas- and particle-phase N-containing species (Nr) and their fractional contribution to the total summed Nr species. The Nr species are grouped into categories of reduced inorganics, reduced organics, oxidized inorganics, and oxidized organics with reduced species in shades of red and oxidized species in shades of blue.
3.3 Total carbon budget
3.3.1 NMOG chemical classes – PTRMS, CIMS, AWAS
In-plume mixing ratios and the relative contribution of individually measured NMOG species to the sum of those species (ΣNMOG) are shown for 13 chemical classes in Fig. 5. (See Fig. S7 in the Supplement for separate SP and NP chemical classes). The largest chemical classes include carbonyls (acids, aldehydes, and ketones), alcohols, hydrocarbons (alkanes, alkenes, alkynes), aromatics (including furans, phenol, benzene, and toluene), and nitriles. Hydrocarbons (i.e. CxHy, including some aromatics) were responsible for just over half of the ΣNMOG (53 %) (Fig. S8 in the Supplement), with 29 % identified as alkenes such as ethene, propadiene, and propene, 19 % alkanes, predominantly ethane, and 3 % alkynes, almost entirely acetylene. Non-aromatic oxygenates accounted for an additional 36 % of the ΣNMOG with roughly equal contributions (9 % to 12 %) from acids, aldehydes and alcohols, and a smaller fraction from ketones (5 %). Including other oxygenated compounds such as furanoids and phenol/phenol derivatives, all oxygenates (CxHyOz) comprised 42 % (Fig. S8) of the ΣNMOG.
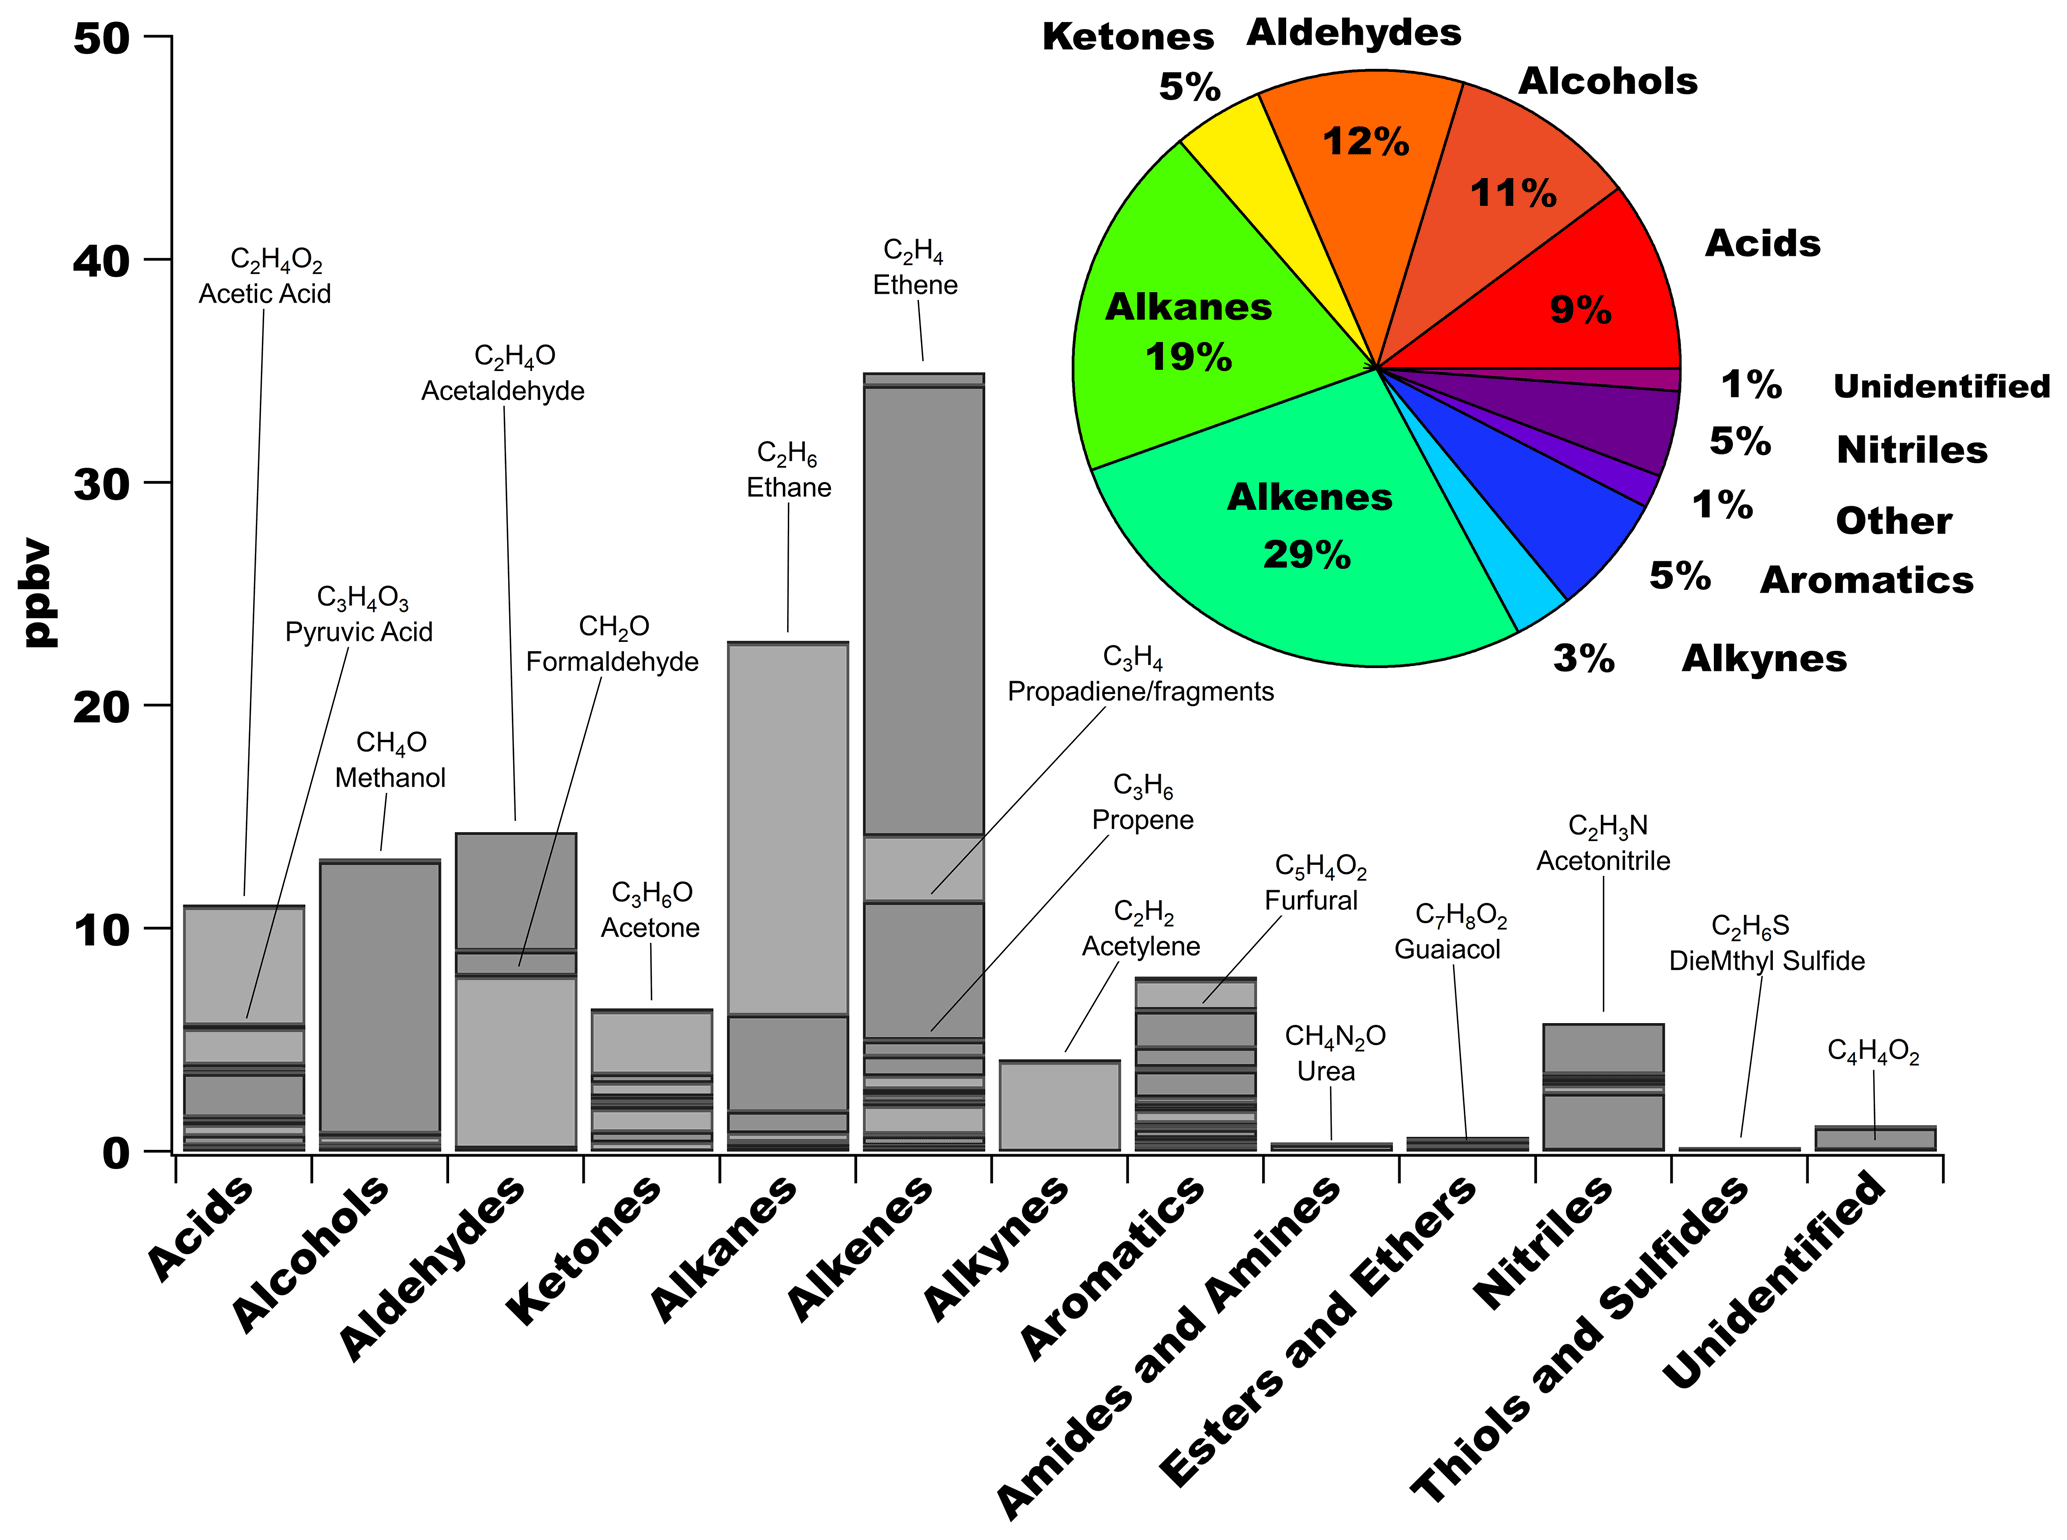
Figure 5Background-subtracted average mixing ratios of individually measured NMOGs shown for 13 chemical classes. In some cases, compounds are double- (or triple-) counted if they can be identified in more than one category. For example, phenol is an alcohol + an aromatic; guaiacol is an alcohol + an ether + an aromatic. In the pie chart, the other category includes amides, amines, ethers, thiols, and sulfides. The unidentified category contains molecular formulas detected, but the compound(s) could not be identified.
A similar range of compound classes has been observed in previous field and laboratory studies, noting that the measured compound suite between studies varies to some extent. For example, Simpson et al. (2011) found a similar distribution of compound classes with 57 measured NMOG species, based on discrete canister samples, in boreal forest wildfires. In that study, oxygenates (non-aromatic) comprised a smaller portion of NMOG (29 %) as major emitted species like acetaldehyde and acetic acid (Fig. 8) were not included. Other studies have also found oxygenates to be a large portion of NMOG emissions across multiple fuel types, including those similar to the current study, ranging from 51 %–68 % (Permar et al., 2021; Koss et al., 2018; Gilman et al., 2015; Akagi et al., 2011) with a range of 25 %–55 % reported in Hatch et al. (2017). The fraction of NMOG oxygenates in the present study (42 %) was closer to those reported in Hatch et al. (2017) when only the most relevant fuel types of pine and spruce were considered (55 % and 43 %, respectively). Similar to previous work (Koss et al., 2018; Stockwell et al., 2015; Hatch et al., 2015), emissions of substituted oxygenates like furanoids (furans + derivatives) and phenolic compounds were observed. Furanoids contributed 4 % of the ΣNMOG mostly due to furfural, furan, and methyl furan, while phenolic compounds e.g. guaiacol, methyl guaiacol, contributed 0.5 % of the ΣNMOG (Fig. S9 in the Supplement). Although these emissions were less abundant in the present study, they represent important OH reactants (Coggon et al., 2019; Koss et al., 2018; Gilman et al., 2015) with phenols being implicated as precursors to brown carbon formation in secondary organic aerosol (SOA) (Palm et al., 2020).
Biogenic emissions of terpenoids including isoprene, monoterpenes, carvone, sesquiterpenes, camphor/isomers, and terpine-4-ol/cineole/isomers were elevated in the plumes collectively reaching ∼2.4 ppbv, and contributing ∼2 % to the ΣNMOGs (Fig. S9). Isoprene was ∼66 % of these compounds with an additional 32 % from monoterpenes. Emissions of isoprene from biomass burning has been observed from a wide range of fuel types (Hatch et al., 2019). As isoprene is not stored by plants and the measurements were taken ∼14 h post flaming, it was likely emitted as a combustion product.
In this study, furfural was the most abundant oxygenated aromatic compound and a factor of 5 times higher than that of phenol. Although Koss et al. (2018) found that phenol and furfural emissions were similar for most fuels tested in the laboratory, furfural emissions derived from multiple wildfires sampled in Permar et al. (2021) were similar to those in the present study, and a factor of 1.6 higher for phenol. As phenol emissions are associated with lignin pyrolysis (Stockwell et al., 2015; Simoneit et al., 1999), the lower emissions in the current study could be because the lignin content in the fuel mixture was lower than fuels used in previous laboratory studies or that most of the phenolic compounds were emitted during the earlier phases of the fire. Several modelling studies have indicated that aromatics and terpenes are insufficient to explain SOA formation in biomass burning plumes (e.g. Hodshire et al., 2019) suggesting the importance of inclusion of other aromatic species such as phenolics and furanoid compounds. However, models typically do not include reactions involving phenolic and furanoids species, especially substituted compounds like furfural, guaiacol, and methyl guaiacol. Box model simulations have also shown that incorporation of OH oxidation of furan, 2-methyfuran, 2,5-dimethylfuran, furfural, 5-methylfurfural, and guaiacol leads to 10 % more O3 formed (Coggon et al., 2019).
3.3.2 Intermediate-volatility and semivolatile organic compounds (I/SVOCs)
Offline analysis of cartridge samples showed a wider range of hydrocarbons and functionalized gas-phase organic compounds not observed in the PTRMS, CIMS, and AWAS measurements, including I/SVOC compounds in the wildfire plume. ERs (Table S7 in the Supplement) for species containing carbon and hydrogen, and with either sulfur or oxygen (i.e. CH (hydrocarbon), CHS1, and CHO1 type molecules) accounted for a sizeable fraction of carbon in the C10 to C25 range. Additional contributions are expected from more highly functionalized organics in the gas (and particle) phase not reflected in the CH, CHO1, and CHS1 compound classes (e.g. gas-phase species with multiple oxygen atoms like vanillic acid or acetovanillone, and gas-phase species containing combinations of oxygen and nitrogen atoms (CHONs), Ditto et al., 2021, 2022). ERs in the plume varied across the carbon number range; in general, the highest ratios were observed for the complex mixture of hydrocarbons (i.e. CH compounds) broadly peaking at C20–C23 in the SVOC range, with a larger contribution from C10 compounds including monoterpenes. By comparison, the complex mixture of CHO1 compounds was slightly lower in abundance than CH with contributions from C10 monoterpenoid emissions or monoterpene oxidation products. CHS1 IVOC–SVOCs were the lowest abundance species quantified. CHN1 compounds represent another observed contributor of IVOCs–SVOCs; the sum of all CHN1 compound ion abundances was two orders of magnitude smaller than the sum of all CHO1 species. We note that for CHN1, this qualitative comparison is in terms of ion abundances only, given a lack of appropriate standards to calibrate for the mass spectrometer's response to the complex mixture of reduced nitrogen-containing I/SVOCs.
EFs were estimated to be 1.4 ± 0.037–2.4 ± 0.063 g kg−1 for CH, 0.81 ± 0.078–0.81 ± 0.079 g kg−1 for CHO1, and 0.21 ± 0.0033–0.22 ± 0.0060 g kg−1 for CHS1 species, for a total EF of 2.4 ± 0.12–3.5 ± 0.15 g kg−1 (Table A1). Here, the uncertainty represents measurement uncertainty associated with the conversion from signal to mass, and the reported ranges show lower and upper limit EF values that account for a contaminated background and that assume no background concentrations, respectively (as described above). These estimates accounted for C11–C25 species and focused on I/SVOCs to avoid double counting the monoterpenes and C10 monoterpenoid species, as they were already accounted for in the PTRMS data. It is noted that the concentrations estimated for the cartridge samples may be sensitive to variations in sampling efficiency within the under-wing sampling pod across C10–C25 though these effects are expected to be minimal for the adsorbent tubes used in this study (Ditto et al., 2021; Sheu et al., 2018). These emission estimates expanded the characterized spectrum of organic species to include IVOC/SVOCs in boreal forest fire emissions, which until now, had only been available from laboratory measurements (Hatch et al., 2018). However, the observed emissions of the complex mixture of hydrocarbons and functionalized species may include contributions from the re-volatilization of compounds previously emitted from upwind oil sands operations and deposited in the forest ecosystem, as noted in Ditto et al. (2021).
3.3.3 Accounting for the observed carbon
Measurements of TC, along with the speciated measurements from the PTRMS, CIMS, AWAS, and cartridges, provided a unique opportunity to reconcile the TC budget in a wildfire. Figure 6 shows the TC partitioning based on derived EFs (Sect. 3.4); overlapping compounds from the individual measurement methods were handled as described in Sect. S1.1.4. The total EF for all carbon-containing compounds was 1652 g kg−1 and, as expected, CO2 was the dominant contributor comprising >90 % of TC. CO contributed 7.0 % followed by a contribution from NMOGT of 1.9 %, with even smaller contributions observed from CH4 (0.5 %) followed by OC and BC (not shown) at <0.5 %. The two magnified pie charts (right side), representing the low and high I/SVOC EF estimates, show the percent breakdown of the measured NMOGs, and the remaining unidentified portion of NMOGT. The EF values (g C kg−1) are identified in the box below. The ΣNMOG EFs (for PTRMS + CIMS + AWAS measurements), totalling 13.6 ± 0.9 g C kg−1, accounted for 43 % ± 3 % of the NMOGT EF of 31.2 ± 4.7 g C kg−1 (refer to Fig. S10 in the Supplement for the individual SP and NP breakdowns). The ΣNMOG uncertainties were estimated by summing in quadrature the individual compound EF uncertainties for the SP and NP separately, with these uncertainties subsequently summed in quadrature to derive the average ΣNMOG uncertainty (Fig. 6). The cartridge data showed the presence of a range of larger molecular weight I/SVOC compounds between C10 and C25 with an additional 2.1 to 3.0 g C kg−1 representing 7 % to 10 % of NMOGT. Together, all of the speciated NMOG measurements in this study accounted for 50 % ± 3 % to 53 % ± 3 % of NMOGT. The remaining carbon mass was unidentified comprising 47 % ± 15 % to 50 % ± 15 % of NMOGT. Despite using four state-of-the-art measurement techniques resulting in an extensive measurement suite, almost half of NMOGT remained unidentified. This is consistent with previous work estimating ∼50 % of NMOGT by mass as unidentified (Akagi et al., 2011). It is noted, however, that the magnitude of the unidentified portion is partly affected by uncertainties in the speciated measurements. For example, many of the “calculated” PTRMS compounds are uncertain by an estimated factor of ∼2 (Sect. S1.1.1 and Table S1 in the Supplement). Nevertheless, a portion of the unidentified species likely consisted of challenging-to-measure-VOCs and larger I/SVOCs that were highly functionalized or contained molecular features like reduced nitrogen groups (e.g. amines) that have been observed in the gas and particle phase at various sites (Ditto et al., 2020, 2022). The presence of I/SVOCs in biomass burning emissions has been previously observed in laboratory experiments (e.g. Koss et al., 2018; Hatch et al., 2018, 2017; Bruns et al., 2016) with smoldering more likely to emit a higher fraction of compounds with low volatility than higher temperature processes (Koss et al., 2018). The unidentified portion may also have been comprised of nitrogen-containing organics (Sect. 3.1). Studies that included measurements of a larger range of nitrogen-containing organics in biomass burning emissions estimated that they comprised <5 %–6 % of the total nitrogen budget (Lindaas et al., 2020; Gilman et al., 2015), and thus an even smaller fraction of NMOGT. Advancing analytical techniques to expand the suite of NMOG speciation will enable further reconciliation of the TC budget which is important for assessing secondary formation processes in the atmosphere.
Figure 6Total carbon (TC) partitioning based on EFs (carbon fractions). The bar chart shows the stacked EFs for carbon-containing compounds with the middle pie chart showing their percent contributions to the TC. The two magnified pie charts (right side), representing the low and high I/SVOC EF estimates, show the percent breakdown of the measured NMOGs and the remaining unidentified portion. The EF values (g C kg−1) are provided in the box. Note that all the EFs shown in Table A1 were converted to g C kg−1 for this breakdown.
3.3.4 Volatility distribution of NMOG
Volatility distributions can help track the full range of organic species to assess their partitioning between the condensed and gas phases (Donahue et al., 2011). Figure 7 shows the fractional sum of all NMOG EFs within each volatility bin in terms of saturation concentration ranges (log 10Co, µg m−3) for the low I/SVOC EF estimate. Co values were estimated using the parameterization developed by Li et al. (2016). NMOG emissions from this fire spanned a large range of volatilities from log 10Co of −2 to 10 µg m−3 across SVOC to VOC categories. The bin-averaged ratio based on the measurements increased with reduced volatility reflecting the presence of compounds with additional oxygen-containing functional groups. The highest fraction of emissions was present as VOCs with 81 % having log 10Co>6 µg m−3, 9 % as IVOCs having , and 10 % as SVOCs having log 10Co<3 µg m−3. These results align with laboratory studies showing that oxygenates comprised more than >75 % of IVOCs across a range of biomass types with IVOCs accounting for ∼11 % of the ΣNMOG (Hatch et al., 2018). Figure 7 encompasses the range of volatilities based on all the identified NMOGs in this study that is expected to represent initial emission conditions for modelling downwind chemistry. However, improved speciation, particularly of lower volatility compounds, is needed to further expand the range of volatilities and advance knowledge in gas-to-particle partitioning processes.
Figure 7Fraction of total ΣNMOG emissions in each volatility bin, and the bin-averaged ratio spanning VOCs, IVOCs, and SVOCs. Data are included from PTRMS, CIMS, AWAS, and cartridge measurements. The ratio is derived for only the PTRMS, CIMS, and AWAS measurements, and the error bars indicate the standard deviation of the average ratio.
3.4 Emission factors and comparisons with other studies
EFs (and ERs) in this study are derived for 193 compounds from 15 instruments of which 173 are NMOG species (Table A1). This dataset represents the most extensive range of field-based EFs ever determined for a wildfire in the boreal forest ecosystem. In Fig. 8, average EFs are shown for compounds grouped by (a) particles, (b) gas-phase inorganics, and (c) gas-phase organics. Separate EFs and ERs for the SP and NP are shown in Figs. S11–S13 in the Supplement. In Fig. 9a–c, EFs are compared with those from other relevant studies. Figure 9a shows a comparison with boreal forest field measurements largely taken from a compilation by Andreae (2019) (https://edmon.mpdl.mpg.de/imeji/collection/op2vVE8m0us_gcGC, file version 14Apr2021, last access: 31 July 2022) referred to as BFF19, and values from Akagi et al. (2011) and Liu et al. (2017). This results in a comparison for 50 compounds (35 organics and 15 inorganics/particulate species) with the largest suite of EFs from one study conducted in a similar boreal region as the present study (Simpson et al., 2011). EFs are also compared with laboratory-derived EFs for lodgepole pine Koss et al. (2018; referred to as LAB18) (Fig. 9b), a similar fuel type in the current study, with a total of 99 NMOGs and 3 inorganics in common. In Fig. 9c, EFs are compared with those recently reported in Permar et al. (2021) (referred to as TFF21) based on aircraft measurements of temperate forest wildfires in areas mostly dominated by pine, fir, and spruce trees, which provides the closest suitable comparison with similar speciated NMOGs under wildfire conditions. Comparisons include 111 NMOGs and 4 inorganics/black carbon. While the Permar et al. (2021) study was conducted in a temperate forest region, it was at high elevation locations with similar vegetation types as the current study.

Figure 8Average emission factors (g kg−1) of (a) particle species, (b) inorganic gas-phase species, and (c) the top 25 measured gas-phase organic species. C4 acids = C4 oxo-carboxylic acids; propadiene = fragments/propadiene; hydroxy acetone = hydroxy acetone/ethyl formate. Organic species measurements are from the PTRMS, CIMS, and AWAS.

Figure 9Comparison of averaged emission factors with (a) boreal forest field-based measurements (Andreae, 2019; Akagi et al., 2011; Liu et al., 2017), (b) laboratory-based measurements of lodgepole pine (Koss et al., 2018), (c) temperate forest field-based measurements (Permar et al., 2021), and (d) those used in CFFEPS (Urbanski, 2014). See Table S8 in the Supplement for compound comparisons that do not have exact matches.
3.4.1 Particle species
The PM1 EF (6.8 ± 0.8 g kg−1) represents the total of all particle component species as measured by the AMS. The PM1 EF of 6.8 ± 1.1 g kg−1 (Fig. 8a) (accounting for estimated mass differences due to particle diameters (Sect. S1.1.2 in the Supplement)) falls in the lower end of the large range previously observed for boreal forest wildfires (18.7 ± 15.9 g kg−1; Fig. 9a). The few PM EFs for BFF19 (n=5) over a limited range of MCEs (i.e. 0.89 to 0.93) shows significant variability consistent with previous work (Jolleys et al., 2015; Akagi et al., 2011; Cubison et al., 2011; Hosseini et al., 2013). OA, accounting for 90 % of PM1, has the largest EF, with comparatively lower EFs for NO3, BC, NH4, and SO4 (Figs. 8a and S6). This reflects the dominant particle-phase organic carbon content of the burned fuel and correspondingly lower fractions of nitrogen and sulfur-containing compounds. Similar high organic fractions have been previously observed in biomass burning emissions (Liu et al., 2017; May et al., 2014; Hecobian et al., 2011). ERs similarly highlight the dominant OA emissions. Although the magnitude of EFs between the SP and NP are within their derived uncertainties (Fig. S11), the ERs showed differences by up to 70 % for NH4 (Fig. S12) suggesting some differences in photochemistry between the two plumes. EFs and ERs for chemically-speciated particle species derived in this study represent the first such measurements under boreal forest wildfire conditions. EFs for chemically-speciated compounds are not found in BFF19 (except BC), but when compared with available values for US temperate forest wildfires (Liu et al., 2017), are found to be lower for OA (Fig. 9a), SO4, NO3, and NH4 by factors of 3.7, 5.0, 5.3, and 3.0, respectively. Although differences in fuel type burned between the present study (mature Jack pine, boreal spruce, boreal mixed-wood) and Liu et al. (2017) (mixed conifer, grass, brush, and chaparral) may influence the chemical composition of emissions, these large differences suggest the importance of other factors in controlling OA emissions. The lower OA emissions under smoldering conditions in the current study compared to Liu et al. (2017) with higher combustion efficiencies (0.877 to 0.935) conflicts with some findings showing increased OA emissions with lower fire intensities (Liu et al., 2017; Burling et al., 2011). However, the relationship between EFOA and combustion efficiency can be impacted by multiple factors such as OA loading, gas–particle partitioning related to dilution, and fuel moisture content (May et al., 2014). The EFOA in the current study (6.6 ± 2.6 g kg−1) lies in the range of EFOA reported for prescribed burns across three temperate ecosystems (2.8 ± 1.6 to 11.2 ± 2.7 g kg−1) (May et al., 2014). This may imply that the low intensity, surface, and smoldering wildfire conditions in the present study (Sect. 3.1) may be similar to prescribed burn conditions which are typically low intensity fires that are restricted to the forest floor and understory, and conducted under controlled and consistent meteorological and fuel moisture conditions (Yokelson et al., 2013; Carter and Foster, 2004). Inorganic PM emissions, however, are likely more dependent on fuel elemental composition than combustion efficiency (Liu et al., 2017). Differences in fuel composition between boreal and temperate forest ecosystems are inferred through comparisons of NOx and SO2 emissions. For example, the average NOx and SO2 EFs for boreal forests are lower than the average EFs for temperate forests by factors of 2.5 and 3.0, respectively. The lower NOx and SO2 emissions from boreal vs. temperate forest wildfires are likely reflective of the reduced S and N content in boreal biomass (Bond-Lamberty et al., 2006) relative to conifer (Miesel, 2012) fuels in the western US, and the possible influence of lower anthropogenic sources of nitrogen and sulfur atmospheric deposition in boreal forests (Jia et al., 2016).
3.4.2 Gas-phase inorganic species
The largest average EFs for inorganic gases (Fig. 8b; separate NP and SP Fig. S11) were from reduced nitrogen compounds dominated by NH3 (0.63 ± 0.14 g kg−1) and followed by HCN (0.31 ± 0.07 g kg−1), with lower EFs for oxidized nitrogen compounds such as NO2 (0.15 ± 0.04 g kg−1) and HONO (0.02 ± 0.012 g kg−1). This is consistent with previous work identifying elevated emissions of NH3 and HCN during smoldering conditions, whereas emissions of HONO and NOx are primarily associated with flaming combustion (e.g. Roberts et al., 2020; Akagi et al., 2013; Yokelson et al., 1997; Griffith et al., 1991). The EFs for CO2 and CO from the present study are comparable within uncertainties of that previously reported for BFF19 (Table A1). However, EFs for most other gaseous inorganic species were lower than the BFF19 EF average including NH3, HONO, and NOx by factors of 4.0, 20, and 7.1, respectively (Fig. 9a). There are only a limited number of studies reporting EFs for these compounds in the BFF19 category. For example, there are only four previously reported BFF19 EFs for NH3 (2.5 ± 1.8 g kg−1) showing a large range of values. Although these comparisons are limited by the few reported values in the literature, the differences indicate a strong sensitivity towards factors like fire intensity, chemical reactivity, fuel type and moisture, and meteorology. In contrast, EFs for HCN derived in the current study (0.31 ± 0.07 g kg−1) lie within the range of BFF19, LAB18, and TFF21 values (0.28 ± 0.06 to 0.53 ± 0.30 g kg−1), (Fig. 9a–c, respectively), and does not vary widely suggesting that HCN may be less sensitive to burning characteristics. HCN is of concern due to its impacts on human health particularly since biomass burning emissions are responsible for the majority of the global HCN (Moussa et al., 2016, and references therein).
3.4.3 Gas-phase organic species
In Fig. 8c, the top 25 average EFs for gas-phase organic species are shown in decreasing order of magnitude. The most abundant emissions were from the lower molecular weight compounds; such trends are generally in agreement with previous field-based measurements for a range of fuel types (e.g. Permar et al., 2021; Andreae, 2019; Liu et al., 2017; Simpson et al., 2011; Urbanski et al., 2009). Excluding CH4, the largest EFs were associated with methanol, followed by ethene, ethane, acetic acid, acetaldehyde, formaldehyde, and acetone ranging from 1.9 ± 0.4 to 0.82 ± 0.22 g kg−1 for these compounds. Noting some variations related to differences in measurement methods, other studies have identified many of these same species as dominating biomass burning emissions (e.g. Permar et al., 2021; Simpson et al., 2011; Akagi et al., 2011). For example, Simpson et al. (2011) found that five of the same compounds in the present study including formaldehyde, methanol, ethene, ethane, and acetone were in the top 10 NMOG EFs from aircraft-based measurements made of boreal forest wildfires in northern Saskatchewan, Canada, and within ∼300 km of the current study. In the present study, the top 24 NMOG compounds accounted for 81 % of the ΣNMOG by total molecular mass with lower emissions from the remaining 149 measured compounds. In western US wildfires, small emissions from 151 species were found to account for almost half of ΣNMOG (Permar et al., 2021). EFs for the NP and SP generally agreed within their uncertainties with larger differences for some of the more reactive species like isoprene, monoterpenes, and furan. For example, the SP EF for isoprene was a factor of 3.4 lower than that for the NP (0.64 ± 0.34 g kg−1) (Fig. S13). Although the reasons for these differences are not yet known, observations of higher O3 in the SP (52.4 ± 3.0 ppbv) compared to the NP (44.7 ± 3.6 ppbv) suggest the influence of higher oxidant chemistry in the SP emissions compared to the NP.
To compare the total NMOG derived in the present study with those from previous studies that typically sum up their speciated measurements, i.e. ΣNMOG, estimates were made using two methods: (1) increasing the ΣNMOG to account for the unidentified portion of NMOGT; and (2) adjusting the NMOGT to reflect the total molecular mass (not just the carbon portion). For method 1, the ΣNMOG EF (including the I/SVOCs) in this study (24.5 ± 1.6 to 25.6 ± 1.6 g kg−1) was increased by 50 % and 47 % (Fig. 6), respectively, equalling 36.8 ± 11.3 to 37.6 ± 12.2 g kg−1. This estimate assumes that the carbon distribution is the same as the identified, speciated measurements. For method 2, based on the speciated measurements, the average molecular mass was 100 g mol−1 and the average carbon number was 6 resulting in ∼28 % ± 24 % of the molecular fraction represented by atoms other than carbon. Adjusting the NMOGT of 31.2 ± 3.8 g C kg−1 upwards by 28 % ± 24 % to reflect the additional molecular mass results in a NMOG of 39.9 ± 5.8 g kg−1. The resulting estimated NMOG in this study of 36.8 ± 11.3 to 39.9 ± 5.8 g kg−1 lies between the estimated average of 58.7 g kg−1 for the BFF19 (Fig. 9a) and those estimated from the ΣNMOG EFs of 25.0 g kg−1 (LAB18) (Fig. 9b), and 26.1 ± 6.9 g kg−1 (TFF21) (Fig. 9c) derived from laboratory- and field-based studies (Table A1). In contrast to the current work, previous estimates of NMOGT are likely to underestimate total NMOG emissions as they typically represent the sum of measured species only. Some studies have attempted to account for NMOGT by including the sum of measured plus estimates of “unknown” portions of NMOGs (ΣNMOGs) (Permar et al., 2021; Koss et al., 2018; Stockwell et al., 2015; Gilman et al., 2015). The BFF19 EF was recently doubled from 29.3 ± 10.1 to 58.7 g kg−1 to account for unidentified NMOGs where the ΣNMOGs were measured by FTIR, GC, and PTRMS (Andreae, 2019; Akagi et al., 2011). These results support that doubling the ΣNMOG provides a reasonable estimate of the NMOGT. It is noted that the average BFF19 NMOG EF is ∼1.5 times higher than that derived in the present study, however this may reflect variability in NMOG emissions even within the same boreal biome.
Although it is known that acidic compounds are emitted from biomass burning, few studies have quantified their emissions, particularly under field conditions (Andreae, 2019; Veres et al., 2010; Yokelson et al., 2009; Goode et al., 2000). In this study, EFs for 22 organic acidic compounds were derived (Table A1) representing the most detailed set of organic acid EFs from biomass burning for any ecosystem (Andreae, 2019). The largest EFs for these compounds include acetic acid, C4 oxo-carboxylic acids, and pyruvic acid, all of which are found among the top 24 NMOGs (Fig. 8c). For those measurements that are available for comparison, EFs in the present study were lower for formic acid and acetic acid compared to BFF19, and were also lower than in LAB18 and TFF21, ranging from factors of 1.7 to 8.8 (Fig. 9a–c). Organic acids that were in common with TFF21 and LAB18 (Table A1) had lower EFs, with the exception of pyruvic acid, which was substantially higher (> factor of 37) in the present study. Differences in fuel type may be an important factor in the variability of these comparisons. Based on laboratory experiments, Veres et al. (2010) found a large range (factor of 5 to 13) of organic acid emissions with different fuel types suggesting that the lignin content of the fuel could be a source of biomass burning organic acid emissions. Emissions for 10 organic acids that have not previously been reported, and several inorganic acids including nitrous acid, isocyanic acid, and peroxynitric acid, are included in Table A1. These acids, representing 9 % of the ΣNMOGs (Fig. 5), are an important class of oxygenates as they can form additional PM (Reid et al., 2005) and influence the hygroscopicity of smoke particles (Rogers et al., 1991; Kotchenruther and Hobbs, 1998).
Isoprene and monoterpenes, with similar EFs ∼0.41 ± 0.19 g kg−1, represented 16th and 18th, respectively, of the top 24 NMOG EFs in this study. Terpenes are known to be emitted from a range of biomass burning fuels (Andreae, 2019, and references therein), but there have been few measurements in boreal forest wildfire plumes (Simpson et al., 2011; Andreae, 2019). It is noted that PTRMS measurements of IVOCs like sesquiterpenes likely represent lower limits as they tend to be easily lost to sample inlet lines due to their low volatility. The isoprene average EF of 0.42 ± 0.26 g kg−1 was more than a factor of 5 higher, while the monoterpenes EF, 0.41 ± 0.19 g kg−1, was substantially lower than the only reported EF for boreal forest wildfires (Simpson et al., 2011). The difference in EFs for isoprene would be even greater if only the NP EF (0.64 ± 0.34 g kg−1) is compared (if it is assumed that isoprene emissions were influenced by photochemical losses in the SP). As the present study and the Simpson et al. (2011) study were conducted in similar locations (i.e. boreal forest region within ∼300 km of each other), and comparable background levels, these differences are likely driven by fire combustion state, despite having similar study-averaged MCEs. The majority of monoterpenes are stored in plant tissues (resin stores) for long periods of time, but isoprene is synthesized and immediately released by plants, and can also be emitted as a combustion product (Ciccioli et al., 2014; Akagi et al., 2013). Hatch et al. (2019) found that a wide range of terpenoids are released across a variety of biomass types with variable emissions that were dependent on plant species, and specifically related to their fuel resin stores. In the present study, monoterpenes may have “boiled-off” through distillation processes in the early stages of the fire resulting in lower monoterpenes emissions at the aircraft sampling time, ∼14 h post-flaming. In contrast, the Simpson et al. (2011) study sampled comparatively earlier and more intense fire stages where higher monoterpene emissions were likely released from live or recently fallen trees that still contained significant resin stores. The monoterpenes EF reported by Simpson et al. (2011) was likely even higher given only two monoterpenes were speciated and emissions of other terpenes were likely (Hatch et al., 2019). Higher isoprene emissions in the present study compared to Simpson et al. (2011) could be related to the comparatively larger smoldering component. Although limited data exist on the release of isoprene as a function of fire intensity, negative relationships between isoprene and MCE were observed in Australian temperate forest fires (Guérette et al., 2018) and wheat fields (Kumar et al., 2018).
Several furanoid compounds also exhibited significant emissions (Fig. 8c) including furfural, furan, and methyl furan ranking 12th, 19th, and 22nd of the top 24 organic compounds, respectively. Emissions of furanoids have been observed for a wide range of fuel types (Hatch et al., 2017; Simpson et al., 2011). Agreement within uncertainties was found with BFF19 for furfural and furan (Fig. 9a). The EFs for furan (0.39 ± 0.19 g kg−1) and furfural (0.65 ± 0.31 g kg−1) were also similar to that in LAB18 (Fig. 9b) and TFF21 (Fig. 9c), and other ecosystems (Andreae, 2019), suggesting their emissions were relatively insensitive to fire intensity and fuel mixture. The comparisons in Fig. 9 indicate that for the higher emitting species, the current results are fairly similar, but for the lower emitting species, these results are lower than previous reported values. These comparisons provide context for the emissions reported in the present study and moves towards improved statistics to better constrain wildfire emissions. Additional factors are considered to explain variability in emissions between this study and other reported values, and within this study (NP vs. SP). Differences and variability in burn conditions (e.g. fire intensity, winds, fuel density, flame dynamics, fuel moisture) likely influence these comparisons; the screen 1 measurements in the present study were taken from 09:00–10:00 LT when the fire was in a low intensity, smoldering state, while those in Permar et al. (2021) and Simpson et al. (2011) took place during mid-day under active wildfire conditions. Aircraft measurements in general have a higher probability of sampling variable burn conditions compared to laboratory studies (Hodshire et al., 2019), and as such, aircraft-derived EFs are likely to reflect variability for reactive species as speculated earlier with isoprene. Particularly for reactive species that can exhibit complex variation across plumes, EFs (and ERs) derived by integrating across plumes can be biased low, (Sect. 2.5; Peng et al., 2020; Decker et al., 2021). Also, EFs derived using TC in this study may result in lower, albeit small, EFs compared to reported values that do not account for all the carbon (estimated to be 1 %–2 %, Akagi et al., 2011).
3.5 Evaluation of emissions models
3.5.1 Comparison of EFs with the model emissions speciation profile
EFs derived in the present study are compared with those that are currently incorporated into the emissions component of the FireWork modelling system using the Forest Fire Emissions Prediction System (CFFEPS). CFFEPS uses EFs allocated for three combustion states (flaming, smoldering, and residual) and for eight species including lumped non-methane hydrocarbons (NMHC) based on United States vegetation data compiled in Urbanski (2014) (Table 3 in Chen et al., 2019). Figure 9d (bolded compounds) shows that the smoldering EFs in the present study were comparable for CO, CH4, and NMOG, but lower for PM1 (PM2.5), NH3, SO2, and NOx by factors of 3.4, 2.4, 6.6, and 17, respectively. The lower EFs for these species implies that the CFFEPS EFs would not adequately capture their total emissions under smoldering conditions for the boreal fuel in the current measurement study.
For incorporation into numerical air quality models, total organic gas () emissions are typically split into detailed chemical components using chemical mass speciation profiles, and converted to lumped chemical mechanism species. In the FireWork modelling system, the smoldering combustion TOG is split into components based on EPA's SPECIATEv4.5 profile (#95428) (US EPA, 2022; Urbanski, 2014 – Supplement Table A.2, boreal forest duff/organic soil). This profile is ultimately compiled using laboratory data from Yokelson et al. (2013), Bertschi et al. (2003), and Yokelson et al. (1997) based entirely on US fuel types. EFs in the present study were found to be generally lower than the laboratory-based EFs for 74 species in common ranging from factors of 1.7 to 8.5 including for monoterpenes, formic acid, phenol, and furan (Fig. 9d). A few species including furfural, propane nitrile, and ethyl styrene are comparable, while isoprene and pyruvic acid are notably higher by factors 2 to 5.3.
For a research version of the FireWork system, the component speciation is mapped to the SAPRC-11 chemical mechanism species (Carter and Heo, 2013) with detailed oxygenated compounds and aromatic species, largely to better represent SOA formation processes. For comparison with the measurement-derived speciation profile in this study, EFs were first mapped to SAPRC-11 species and normalized by the total identified mass species fraction without unknowns to obtain mass fractions of relevant model mechanism species (Table S9 in the Supplement). Comparing the normalized mass fractions for similar mechanism species (Fig. S14 in the Supplement) showed a substantially lower fraction of reactive alkanes (ALK5) with an estimated 5 % in this study compared to 28 % in the SPECIATEv4.5 wildfire smoldering profile. Mass fractions in this study are notably higher for the ACYL, ETHE, and ISOP lumped model species by factors of 13, 7, and 51. The mass fraction of CH4 is also different with 24 % of TOG in this study compared to 4 % from the SPECIATE4.5 profile. The measurement-derived chemical speciation profile is expected to be different from the average speciation profile from EPA's SPECIATEv4.5 due to differences in chemical species identification, fuel type, fire and measurement conditions, and uncertainties on how measured compounds are mapped to lumped mechanism species. The emissions profile developed in the present study can be used to improve predictions of wildfire smoldering emissions specific to the Canadian boreal forest.
3.5.2 Linking aircraft and satellite observations to evaluate modelled emissions diurnal variability
Wildfires generally exhibit a diurnal cycle with fire intensities maximizing late afternoon and diminishing at night having important implications for fire emissions (Chen et al., 2019). Evaluating modelled emissions throughout the diurnal cycle with observations is a critical step in verifying smoke predictions. Emissions models mostly parameterize diurnal fire emissions with prescribed profiles that distribute daily total emissions to hourly. In CFFEPS, a diurnal profile is applied to allocate daily burn area to hourly intervals, with highest activity in the late afternoon. The actual fuel consumed, and thus, hourly emissions, is then calculated with depth of burn estimates driven by hourly meteorology (Chen et al., 2019). In Fig. 10, for the wildfire in the present study, the hourly CFFEPS-predicted emissions (orange dots) for selected compounds are shown between 24 June 2018 17:00 UTC and 25 June 2018 21:00 UTC, spanning the aircraft sample time (red arrow at 15:00 UTC). After 21:00 UTC, the discrepancy between the CFFEPS-predicted emissions and FRP increased as a result of rain that passed through the area that is not considered in the model bottom-up emission estimates (not shown in the figure). The burning phases are outlined in the figure where flaming (light pink background) is assumed to occur when the atmospheric conditions alongside fire behaviour and emissions model outputs infer a fireline intensity >4000 kW m−1 (Stocks et al., 1989), and a smoldering fire (blue background) for intensity <4000 kW m−1. The fire intensity distinction between flaming and smoldering roughly aligns with the observed minimum for this particular fire with the fire radiative power (FRP, grey dots) retrieval from the GOES-16 satellite sensor of 500 MW where smoldering occurs <500 MW and flaming for >500 MW. The 500 MW threshold over the approximately 1700 ha of actively smoldering area observed by overnight VIIRS thermal detections gives an estimated energy density of 0.29 MW ha−1. This energy density threshold for smoldering <0.29 MW ha−1 found in this study is in agreement with O'Brien et al. (2015) who found flaming combustion at >0.4 MW ha−1 for lower intensity flaming fires and smoldering combustion at lower energy densities. The FRP represents the sum over all hotspots of this fire for each 15 min observation period. Emission rates in metric tonnes per hour (t h−1) were derived from selected aircraft measurements using a mass balance method that was designed to estimate pollutant transfer rates through virtual screens using aircraft flight data (Gordon et al., 2015) (see Sect. S1.2). Emission rates were estimated to be 29 ± 2.1 t h−1 for PM1, 433 ± 26.7 t h−1 for CO, 0.65 ± 0.03 t h−1 for NOx (as NO), and 2.7 ± 0.16 t h−1 for NH3 (red arrows). Emission rates were also derived from satellite observations (black arrows) for CO, NOx, and NH3. Emissions of CO were estimated using a flux method as described in Stockwell et al. (2022) using TROPOMI satellite observations yielding 1670 ± 670 t h−1 at 19:06 UTC and 4050 ± 1620 t h−1 at 20:48 UTC. NOx emissions (9.1 ± 3.4; scaled to t NO h−1 at 19:06 UTC) were derived from the TROPOMI NO2 dataset using an exponentially modified Gaussian approach (Griffin et al., 2021) (not enough high-quality observations for the 20:48 UTC overpass). NH3 emission rates (5.6 ± 3.9 t h−1) were derived from CRIS satellite observations at the satellite overpass time of 19:00 UTC by applying a flux method (Adams et al., 2019).
Figure 10Fire radiative power (FRP; in MW) from GOES-R (grey dots) and emissions from the CFFEPS model (orange dots) from 24 June 2018 17:00 UTC to 25 June 2018 21:00 UTC. h. Aircraft-derived emission rates are shown for (a) PM1, (b) CO, (c) NOx (as NO), and (d) NH3 (in t h−1; red arrow) at 15:00 UTC when the aircraft flew closest to the fire. The corresponding TROPOMI satellite-derived emission rates are also shown (in t h−1; black arrows). Note that the aircraft flight time occurred when the fire intensity reflected a surface, smoldering fire and the satellite overpass time took place when the fire had transitioned to a crown (flaming) fire. The smoldering and flaming time periods are coloured in blue and pink, respectively.
The aircraft measurements were taken when the FRP was low reflecting a smoldering surface fire. However, the satellite overpass occurred ∼4 h later than the aircraft measurements close to the FRP daily maximum, after which rain passed through the area. The CFFEPS model, exhibiting a prescribed diurnal pattern, captures the increase in NOx and NH3 emissions between that derived from the aircraft and satellites transitioning from a smoldering to predominantly flaming fire; NOx emissions increased by a factor >10, whereas the NH3 emissions increased by a factor of approximately 2. This is in agreement with recent laboratory measurements that found that the release of NOx is favoured during the flaming stage and the release of reduced forms of nitrogen, such as NH3, is favoured during the smoldering phase (Roberts et al., 2020) (also see Fig. 4). However, the CFFEPS CO emission rates do not track the increase in CO emissions between the aircraft-derived value and the two TROPOMI values, indicating that the CO EF for flaming is low in the model. This highlights the need to validate model emission rates with measurements to adjust and update the EFs accordingly.
The aircraft- and satellite-derived emission rates for CO, NOx, and NH3 were each ratioed to FRP (in units of , referred to as Rspecies/FRP) to represent the two end burning states, ie. smoldering and flaming conditions. Rspecies/FRP values were estimated for the flaming and smoldering phases of the fire and it was assumed that flaming occurred for FRP>500 MW and smoldering for FRP<500 MW. The CO Rspecies/FRP values were roughly twice as large during smoldering compared to flaming. For the two satellite overpasses during the flaming phase of the fire, the RCO/FRP values were within the uncertainties (19:06 UTC RCO/FRP=0.47 ± 0.25 ; 20:48 UTC RCO/FRP=0.43 ± 0.23 ). The value for NOx is also twice as large for flaming compared to smoldering, and for NH3, the value is ∼5 times larger for smoldering than flaming. Total emissions were then estimated by integrating the GOES FRP over the period 24 June 2018 17:00 UTC to 25 June 2018 23:00 UTC (after which no more hot spots were detected by GOES and the fire presumably extinguished), and applying the derived smoldering and flaming Rspecies/FRP values. Assuming that the fire went out when GOES did not observe any hot spots, total emissions for this fire of CO, NOx, and NH3 are estimated at 22 000 ± 8700, 104 ± 42, and 84 ± 33 t, respectively. If the fire is assumed to have continued burning when GOES did not detect any fire hot spots (between 22:00–04:00 UTC and 07:00–15:00 UTC, with an FRP of 150 MW (∼GOES detection limit; Roberts et al., 2015), the emissions increase to 24 000±9600, 106 ± 43, and 98 ± 39 t, respectively, providing an upper limit of emissions. The combination of aircraft- and satellite-derived emission estimates for multiple species helps to obtain the diurnal variability of emissions and to obtain more complete details on the emission information across different burning stages.
This study provides detailed emissions information for boreal forest wildfires under smoldering combustion conditions. Consistent with previous results, highly speciated airborne measurements showed a large diversity of chemical classes highlighting the complexity of emissions. Despite extensive speciation across a range of NMOG volatilities, a substantial portion of NMOGT remained unidentified (47 % ± 15 % to 50 % ± 15 %) and is expected to be comprised of more highly functionalized VOCs and I/SVOCs. Although these compounds are challenging to measure, their characterization is necessary to more fully understand particle–gas partitioning processes related to the formation of SOA. Methodological advancements to achieve higher time-resolution speciated measurements of I/SVOCs would move towards further NMOGT closure and span a more complete range of volatilities. A detailed suite of EFs that were derived in this study builds on previous work (e.g. Simpson et al., 2011; Andreae, 2019) and can be used to improve chemical speciation profiles that are relevant for air quality modelling of boreal forest wildfires. Aircraft-derived emission estimates were paired with those from satellite observations demonstrating their combined usefulness in assessing modelled emissions diurnal variability. As satellite instrumentation and methodologies advance, linking emissions derived from aircraft (and ground) observations for additional compounds will improve the ability to simulate and predict the diurnal variation in wildfire emissions.
The results presented here represent only one smoldering boreal forest wildfire with limited in-plume sampling times. Additional measurements are needed under a variety of fire conditions (combustion state, fire stage, biomass mixtures, time of day, etc.) in order to elucidate the major controlling factors and improve statistical representation for constraining and modelling these sources. For example, measurements are needed to assess dark chemistry reactions in biomass burning emissions which have been shown to be important in the formation of OA (Kodros et al., 2020) and brown carbon (Palm et al., 2020). In addition, reduced actinic flux associated with high particle loadings in biomass burning emissions can influence plume chemistry (e.g. Juncosa-Calahorrano et al., 2021; Parrington et al., 2013). The emissions information in this work can be used for evaluation and improvements of models that are essential for reliable predictions of boreal forest wildfire pollutants and their downwind chemistry.
Table A1Summary of in-plume and background average mixing ratios (or concentrations), emission factors (g kg−1) (EF), and emission ratios (ppbv ppmv−1 except CO2 which is in units of ppmv ppmv−1; particulates in and GEM in ) (ER) for the SP, NP, and the EF average of the two plumes. In-plume and background averages are in units of ug m−3 for particulates, ppbv for gas-phase compounds, except GEM which is ng m−3, and CO2 is ppmv. Compounds are grouped by particulate species, and inorganic and organic gas-phase species and sorted by increasing molecular weight. PM1 is the sum of the AMS-derived particulate species. The CE was 0.84 ± 0.04 and 0.82 ± 0.01 for the SP and NP, respectively. For comparison, EFs are also included from previously published literature including a Andreae (2019), b Koss et al. (2018), c Permar et al. (2021), and d Liu et al. (2017). The Andreae (2019) PM EF represents PM2.5. See Table S8 for compounds that did not have exact matches for comparison to literature values. To derive the EF for species measured in mass concentration units, Eq. (3) was modified by converting TC to mass concentrations using the measured temperature and pressure, and removing the molar mass ratio term. * indicates that the compound was “calculated” (Sect. S1.1.1) while the remaining compounds were calibrated. Uncertainties were estimated by summing in quadrature the standard error of the average EF (or ER) and the measurement uncertainties (see Sect. 2.5).
Data and code are available on request.
The supplement related to this article is available online at: https://doi.org/10.5194/acp-22-12493-2022-supplement.
KH, SML, JL, MJW, JJBW, AL, PB, RLM, CM, AS, RMS, SM, AD, and MW all contributed to the collection and analyses of the aircraft observations in the field. JCD, MH, and DRG analysed the cartridge samples. ZO contributed to the analyses and created many of the figures. DT contributed to the analyses of the physical and combustion state of the wildfire fire. DG and EE provided the satellite observations, and DG wrote the satellite comparison section. JC contributed to the comparisons with the model emission speciation profile. KH wrote the paper with input from all co-authors.
At least one of the (co-)authors is a member of the editorial board of Atmospheric Chemistry and Physics. The peer-review process was guided by an independent editor, and the authors also have no other competing interests to declare.
Publisher's note: Copernicus Publications remains neutral with regard to jurisdictional claims in published maps and institutional affiliations.
The authors acknowledge the significant technical and scientific contributions towards the success of this study from the AQRD technical and data teams, the NRC team, and excellent program management by Stewart Cober. The authors would like to thank Mark Shephard for his work on the CRIS NH3 retrievals and making those available. Also, we acknowledge the anonymous reviewers for their detailed comments, which helped improve the paper considerably.
This research has been supported by Environment and Climate Change Canada's Climate Change and Air Pollutants Program. Jenna C. Ditton, Megan He, and Drew R. Gentner have been supported by the National Science Foundation (grant no. AGS1764126) and GERSTEL for their collaboration with the thermal desorption unit used as part of this study, and Megan He has also been supported by the Goldwater Scholarship Foundation. Shao-Meng Li has been supported by the Ministry of Science and Technology of China (grant no. 2019YFC0214700).
This paper was edited by Tanja Schuck and reviewed by two anonymous referees.
Adams, C., McLinden, C. A., Shephard, M. W., Dickson, N., Dammers, E., Chen, J., Makar, P., Cady-Pereira, K. E., Tam, N., Kharol, S. K., Lamsal, L. N., and Krotkov, N. A.: Satellite-derived emissions of carbon monoxide, ammonia, and nitrogen dioxide from the 2016 Horse River wildfire in the Fort McMurray area, Atmos. Chem. Phys., 19, 2577–2599, https://doi.org/10.5194/acp-19-2577-2019, 2019.
Akagi, S. K., Yokelson, R. J., Wiedinmyer, C., Alvarado, M. J., Reid, J. S., Karl, T., Crounse, J. D., and Wennberg, P. O.: Emission factors for open and domestic biomass burning for use in atmospheric models, Atmos. Chem. Phys., 11, 4039–4072, https://doi.org/10.5194/acp-11-4039-2011, 2011.
Akagi, S. K., Yokelson, R. J., Burling, I. R., Meinardi, S., Simpson, I., Blake, D. R., McMeeking, G. R., Sullivan, A., Lee, T., Kreidenweis, S., Urbanski, S., Reardon, J., Griffith, D. W. T., Johnson, T. J., and Weise, D. R.: Measurements of reactive trace gases and variable O3 formation rates in some South Carolina biomass burning plumes, Atmos. Chem. Phys., 13, 1141–1165, https://doi.org/10.5194/acp-13-1141-2013, 2013.
Alvarado, M. J., Logan, J. A., Mao, J., Apel, E., Riemer, D., Blake, D., Cohen, R. C., Min, K.-E., Perring, A. E., Browne, E. C., Wooldridge, P. J., Diskin, G. S., Sachse, G. W., Fuelberg, H., Sessions, W. R., Harrigan, D. L., Huey, G., Liao, J., Case-Hanks, A., Jimenez, J. L., Cubison, M. J., Vay, S. A., Weinheimer, A. J., Knapp, D. J., Montzka, D. D., Flocke, F. M., Pollack, I. B., Wennberg, P. O., Kurten, A., Crounse, J., Clair, J. M. St., Wisthaler, A., Mikoviny, T., Yantosca, R. M., Carouge, C. C., and Le Sager, P.: Nitrogen oxides and PAN in plumes from boreal fires during ARCTAS-B and their impact on ozone: an integrated analysis of aircraft and satellite observations, Atmos. Chem. Phys., 10, 9739–9760, https://doi.org/10.5194/acp-10-9739-2010, 2010.
Andreae, M. O.: Emission of trace gases and aerosols from biomass burning – an updated assessment, Atmos. Chem. Phys., 19, 8523–8546, https://doi.org/10.5194/acp-19-8523-2019, 2019.
Bertschi, I., Yokelson, R. J., Ward, D. E., Babbitt, R. E., Susott, R. A., Goode, J. G., and Hao, W. M.: Trace gas and particle emissions from fires in large diameter and belowground biomass fuels, J. Geophys. Res.-Atmos., 108, 8472, https://doi.org/10.1029/2002JD002100, 2003.
Bond-Lamberty, B., Gower, S. T., Wang, C., Cyr, P., and Veldhuis, H.: Nitrogen dynamics of a boreal black spruce wildfire chronosequence, Biogeochemistry, 81, 1–16, https://doi.org/10.1007/s10533-006-9025-7, 2006.
Bruns, E. A., El Haddad, I., Slowik, J. G., Kilic, D., Klein, F., Baltensperger, U., and Prevot, A. S. H.: Identification of significant precursor gases of secondary organic aerosols from residential wood combustion, Sci. Rep., 6, 1–9, https://doi.org/10.1038/srep27881, 2016.
Burling, I. R., Yokelson, R. J., Akagi, S. K., Urbanski, S. P., Wold, C. E., Griffith, D. W. T., Johnson, T. J., Reardon, J., and Weise, D. R.: Airborne and ground-based measurements of the trace gases and particles emitted by prescribed fires in the United States, Atmos. Chem. Phys., 11, 12197–12216, https://doi.org/10.5194/acp-11-12197-2011, 2011.
Bush, E. and Lemmen, D. S.: Canada's changing climate report, Government of Canada, Ottawa, ON, 444 pp., https://www.ChangingClimate.ca/CCCR2019 (last access: 31 July 2022), 2019.
Campos, I., Abrantes, N., Pereira, P., Micaelo, A. C., Vale, C., and Keizer, J. J.: Forest fires as potential triggers for production and mobilization of polycyclic aromatic hydrocarbons to the terrestrial ecosystem, Land Degrad. Dev., 30, 2360–2370, https://doi.org/10.1002/ldr.3427, 2019.
Carter, M. C. and Foster, C. D., Prescribed burning and productivity in southern pine forests: a review, Forest Ecol. Manag., 191, 93–109, 2004.
Carter, W. P. L. and Heo, G.: Development of revised SAPRC aromatics mechanisms, Atmos. Environ., 77, 404–414, https://doi.org/10.1016/j.atmosenv.2013.05.021, 2013.
Cascio, W. E.: Wildland fire smoke and human health, Sci. Total Environ., 624, 586–595, https://doi.org/10.1016/j.scitotenv.2017.12.086, 2018.
Chen, J., Anderson, K., Pavlovic, R., Moran, M. D., Englefield, P., Thompson, D. K., Munoz-Alpizar, R., and Landry, H.: The FireWork v2.0 air quality forecast system with biomass burning emissions from the Canadian Forest Fire Emissions Prediction System v2.03, Geosci. Model Dev., 12, 3283–3310, https://doi.org/10.5194/gmd-12-3283-2019, 2019.
Cherry, N. and Haynes, W.: Effects of the Fort McMurray wildfires on the health of evacuated workers: follow-up of 2 cohorts, Can. Med. Assoc. J., 5, E638–E645, https://doi.org/10.9778/cmajo.20170047, 2017.
Ciccioli, P., Centritto, M., and Loreto, F.: Biogenic volatile organic compound emissions from vegetation fires, Plant Cell Environ., 37, 1810–1825, https://doi.org/10.1111/pce.12336, 2014.
Coggon, M. M., Lim, C. Y., Koss, A. R., Sekimoto, K., Yuan, B., Gilman, J. B., Hagan, D. H., Selimovic, V., Zarzana, K. J., Brown, S. S., Roberts, J. M., Müller, M., Yokelson, R., Wisthaler, A., Krechmer, J. E., Jimenez, J. L., Cappa, C., Kroll, J. H., de Gouw, J., and Warneke, C.: OH chemistry of non-methane organic gases (NMOGs) emitted from laboratory and ambient biomass burning smoke: evaluating the influence of furans and oxygenated aromatics on ozone and secondary NMOG formation, Atmos. Chem. Phys., 19, 14875–14899, https://doi.org/10.5194/acp-19-14875-2019, 2019.
Cole, A. S., Steffen, A., Eckley, C. S., Narayan, J., Pilote, M., Tordon, R., Graydon, J. A., St. Louis, V. L., Xu, X., and Branfireun, B. A.: A survey of mercury in air and precipitation across Canada: Patterns and trends, Atmosphere, 5, 635–668, https://doi.org/10.3390/atmos5030635, 2014.
Cubison, M. J., Ortega, A. M., Hayes, P. L., Farmer, D. K., Day, D., Lechner, M. J., Brune, W. H., Apel, E., Diskin, G. S., Fisher, J. A., Fuelberg, H. E., Hecobian, A., Knapp, D. J., Mikoviny, T., Riemer, D., Sachse, G. W., Sessions, W., Weber, R. J., Weinheimer, A. J., Wisthaler, A., and Jimenez, J. L.: Effects of aging on organic aerosol from open biomass burning smoke in aircraft and laboratory studies, Atmos. Chem. Phys., 11, 12049–12064, https://doi.org/10.5194/acp-11-12049-2011, 2011.
de Gouw, J. A., Warneke, C., Stohl, A., Wollny, A. G., Brock, C. A., Cooper, O. R., Holloway, J. S., Trainer, M., Fehsenfeld, F. C., Atlas, E. L., Donnelly, S. G., Stroud, V., and Lueb, A.: The VOC composition of merged and aged forest fire plumes from Alaska and Western Canada, J. Geophys. Res.-Atmos., 111, D10303, https://doi.org/10.1029/2005JD006175, 2006.
de Groot, W. J., Pritchard, J. M., and Lynham, T. J.: Forest floor fuel consumption and carbon emissions in Canadian boreal forest fires, Can. J. Forest Res., 39, 367–382, https://doi.org/10.1139/x08-192, 2009.
Decker, Z. C. J., Wang, S., Bourgeois, I., Campuzano Jost, P., Coggon, M. M., DiGangi, J. P., Diskin, G. S., Flocke, F. M., Franchin, A., Fredrickson, C. D., Gkatzelis, G. I., Hall, S. R., Halliday, H., Hayden, K., Holmes, C. D., Huey, L. G., Jimenez, J. L., Lee, Y. R., Lindaas, J., Middlebrook, A. M., Montzka, D. D., Neuman, J. A., Nowak, J. B., Pagonis, D., Palm, B. B., Peischl, J., Piel, F., Rickly, P. S., Robinson, M. A., Rollins, A. W., Ryerson, T. B., Sekimoto, K., Thornton, J. A., Tyndall, G. S., Ullmann, K., Veres, P. R., Warneke, C., Washenfelder, R. A., Weinheimer, A. J., Wisthaler, A., Womack, C., and Brown, S. S.: Novel analysis to quantify plume crosswind heterogeneity applied to biomass burning smoke, Environ. Sci. Technol., 55, 15646–15657, https://doi.org/10.1021/acs.est.1c03803, 2021.
Ditto, J. C., Joo, T., Slade, J. H., Shepson, P. B., Ng, N. L., and Gentner, D. R.: Nontargeted Tandem Mass Spectrometry Analysis Reveals Diversity and Variability in Aerosol Functional Groups across Multiple Sites, Seasons, and Times of Day, Environ. Sci. Tech. Let., 7, 60–69, https://doi.org/10.1021/acs.estlett.9b00702, 2020.
Ditto, J. C., He, M., Hass-Mitchell, T. N., Moussa, S. G., Hayden, K., Li, S.-M., Liggio, J., Leithead, A., Lee, P., Wheeler, M. J., Wentzell, J. J. B., and Gentner, D. R.: Atmospheric evolution of emissions from a boreal forest fire: the formation of highly functionalized oxygen-, nitrogen-, and sulfur-containing organic compounds, Atmos. Chem. Phys., 21, 255–267, https://doi.org/10.5194/acp-21-255-2021, 2021.
Ditto, J. C., Machesky, J., and Gentner, D. R.: Analysis of reduced and oxidized nitrogen-containing organic compounds at a coastal site in summer and winter, Atmos. Chem. Phys., 22, 3045–3065, https://doi.org/10.5194/acp-22-3045-2022, 2022.
Donahue, N. M., Epstein, S. A., Pandis, S. N., and Robinson, A. L.: A two-dimensional volatility basis set: 1. organic-aerosol mixing thermodynamics, Atmos. Chem. Phys., 11, 3303–3318, https://doi.org/10.5194/acp-11-3303-2011, 2011.
Finlay, S. E., Moffat, A., Gazzard, R., Baker, D., and Murray, V.: Health impacts of wildfires, PLoS Curr., 4, e4f959951cce959952c, https://pubmed.ncbi.nlm.nih.gov/23145351/, 2012.
Garofalo, L. A., Pothier, M. A., Levin, E. J. T., Campos, T., Kreidenweis, S. M., and Farmer, D. K.: Emission and evolution of submicron organic aerosol in smoke from wildfires in the Western United States, ACS Earth Space Chem., 3, 1237–1247, https://doi.org/10.1021/acsearthspacechem.9b00125, 2019.
Gilman, J. B., Lerner, B. M., Kuster, W. C., Goldan, P. D., Warneke, C., Veres, P. R., Roberts, J. M., de Gouw, J. A., Burling, I. R., and Yokelson, R. J.: Biomass burning emissions and potential air quality impacts of volatile organic compounds and other trace gases from fuels common in the US, Atmos. Chem. Phys., 15, 13915–13938, https://doi.org/10.5194/acp-15-13915-2015, 2015.
Goode, J. G., Yokelson, R. J., Ward, D. E., Susott, R. A., Babbitt, R. E., Davies, M. A., and Hao, W. M.: Measurements of excess O3, CO2, CO, CH4, C2H4, C2H2, HCN, NO, NH3, HCOOH, CH3COOH, HCHO, and CH3OH in 1997 Alaskan biomass burning plumes by airborne fourier transform infrared spectroscopy (AFTIR), J. Geophys. Res., 105, 22147–22166, https://doi.org/10.1029/2000JD900287, 2000.
Gordon, M., Li, S.-M., Staebler, R., Darlington, A., Hayden, K., O'Brien, J., and Wolde, M.: Determining air pollutant emission rates based on mass balance using airborne measurement data over the Alberta oil sands operations, Atmos. Meas. Tech., 8, 3745–3765, https://doi.org/10.5194/amt-8-3745-2015, 2015.
Griffin, D., McLinden, C. A., Dammers, E., Adams, C., Stockwell, C. E., Warneke, C., Bourgeois, I., Peischl, J., Ryerson, T. B., Zarzana, K. J., Rowe, J. P., Volkamer, R., Knote, C., Kille, N., Koenig, T. K., Lee, C. F., Rollins, D., Rickly, P. S., Chen, J., Fehr, L., Bourassa, A., Degenstein, D., Hayden, K., Mihele, C., Wren, S. N., Liggio, J., Akingunola, A., and Makar, P.: Biomass burning nitrogen dioxide emissions derived from space with TROPOMI: methodology and validation, Atmos. Meas. Tech., 14, 7929–7957, https://doi.org/10.5194/amt-14-7929-2021, 2021.
Griffith, D. W. T., Mankin, W. G., Coffey, M. T., Ward, D. E., and Riebau, A.: FTIR remote sensing of biomass burning emissions of CO2, CO, CH4, CH2O, NO, NO2, NH3, and N2O, in: Global Biomass Burning: Atmospheric, Climatic, and Biospheric Implications, edited by: Levine, J. S., MIT Press, Cambridge, MA, United States, 230–241, ISBN 0-262-12159-X, 1991.
Guérette, E.-A., Paton-Walsh, C., Desservettaz, M., Smith, T. E. L., Volkova, L., Weston, C. J., and Meyer, C. P.: Emissions of trace gases from Australian temperate forest fires: emission factors and dependence on modified combustion efficiency, Atmos. Chem. Phys., 18, 3717–3735, https://doi.org/10.5194/acp-18-3717-2018, 2018.
Hatch, L. E., Luo, W., Pankow, J. F., Yokelson, R. J., Stockwell, C. E., and Barsanti, K. C.: Identification and quantification of gaseous organic compounds emitted from biomass burning using two-dimensional gas chromatography–time-of-flight mass spectrometry, Atmos. Chem. Phys., 15, 1865–1899, https://doi.org/10.5194/acp-15-1865-2015, 2015.
Hatch, L. E., Yokelson, R. J., Stockwell, C. E., Veres, P. R., Simpson, I. J., Blake, D. R., Orlando, J. J., and Barsanti, K. C.: Multi-instrument comparison and compilation of non-methane organic gas emissions from biomass burning and implications for smoke-derived secondary organic aerosol precursors, Atmos. Chem. Phys., 17, 1471–1489, https://doi.org/10.5194/acp-17-1471-2017, 2017.
Hatch, L. E., Rivas-Ubach, A., Jen, C. N., Lipton, M., Goldstein, A. H., and Barsanti, K. C.: Measurements of I/SVOCs in biomass-burning smoke using solid-phase extraction disks and two-dimensional gas chromatography, Atmos. Chem. Phys., 18, 17801–17817, https://doi.org/10.5194/acp-18-17801-2018, 2018.
Hatch, L. E., Jen, C. N., Kreisberg, N. M., Selimovic, V., Yokelson, R. J., Stamatis, C., York, R. A., Foster, D., Stephens, S. L., Goldstein, A. H., and Barsanti, K. C.: Highly speciated measurements of terpenoids emitted from laboratory and mixed-conifer forest prescribed fires, Environ. Sci. Technol., 53, 9418–9428, https://doi.org/10.1021/acs.est.9b02612, 2019.
Hecobian, A., Liu, Z., Hennigan, C. J., Huey, L. G., Jimenez, J. L., Cubison, M. J., Vay, S., Diskin, G. S., Sachse, G. W., Wisthaler, A., Mikoviny, T., Weinheimer, A. J., Liao, J., Knapp, D. J., Wennberg, P. O., Kürten, A., Crounse, J. D., Clair, J. St., Wang, Y., and Weber, R. J.: Comparison of chemical characteristics of 495 biomass burning plumes intercepted by the NASA DC-8 aircraft during the ARCTAS/CARB-2008 field campaign, Atmos. Chem. Phys., 11, 13325–13337, https://doi.org/10.5194/acp-11-13325-2011, 2011.
Hodshire, A. L., Akherati, A., Alvarado, M. J., Brown-Steiner, B., Jathar, S. H., Jimenez, J. L., Kreidenweis, S. M., Lonsdale, C. R., Onasch, T. B., Ortega, A. M., and Pierce, J. R.: Aging effects on biomass burning aerosol mass and composition: A critical review of field and laboratory studies, Environ. Sci. Technol., 53, 10007–10022, https://doi.org/10.1021/acs.est.9b02588, 2019.
Hosseini, S., Urbanski, S., Dixit, P., Li, Q., Burling, I., Yokelson, R., Johnson, T. E., Sharivastava, M., Jung, H., Weise, D. R., Miller, W., and Cocker, D.: Laboratory characterization of PM emissions from combustion of wildland biomass fuels, J. Geophys. Res., 118, 9914–9929, https://doi.org/10.1002/jgrd.50481, 2013.
Jia, Y., Yu, G., Gao, Y., He, N., Wang, Q., Jiao, C., and Zuo, Y.: Global inorganic nitrogen dry deposition inferred from ground- and space-based measurements, Sci. Rep., 6, 19810, https://doi.org/10.1038/srep19810, 2016.
Johnstone, J. F., Hollingsworth, T. N., Chapin III, F. S., and Mack, M. C.: Changes in fire regime break the legacy lock on successional trajectories in Alaskan boreal forest, Global Change Biol., 16, 1281–1295, https://doi.org/10.1111/j.1365-2486.2009.02051.x, 2010.
Jolleys, M. D., Coe, H., McFiggans, G., Taylor, J. W., O'Shea, S. J., Le Breton, M., Bauguitte, S. J.-B., Moller, S., Di Carlo, P., Aruffo, E., Palmer, P. I., Lee, J. D., Percival, C. J., and Gallagher, M. W.: Properties and evolution of biomass burning organic aerosol from Canadian boreal forest fires, Atmos. Chem. Phys., 15, 3077–3095, https://doi.org/10.5194/acp-15-3077-2015, 2015.
Juncosa-Calahorrano, J. F., Lindaas, J., O'Dell, K., Palm, B. B., Peng, Q., Flocke, F., Pollack, I. B., Garofalo, L. A., Farmer, D. K., Pierce, J. R., Collett Jr., J. L., Weinheimer, A., Campos, T., Hornbrook, R. S., Hall, S. R., Ullmann, K., Pothier, M. A., Apel, E. C., Permar, W., Hu, L., Hills, A. J., Montzka, D., Tyndall, G., Thornton, J. A., and Fischer, E. V.: Daytime oxidized reactive nitrogen partitioning in western U. S. wildfire smoke plumes, J. Geophys. Res.-Atmos., 126, e2020JD033484, https://doi.org/10.1029/2020JD033484, 2021.
Kallenborn, R., Halsall, C., Dellong, M., and Carlsson, P.: The influence of climate change on the global distribution and fate processes of anthropogenic persistent organic pollutants, J. Environ. Monitor., 14, 2854–2869, https://doi.org/10.1039/c2em30519d, 2012.
Khare, P., Marcotte, A., Sheu, R., Walsh, A. N., Ditto, J. C., and Gentner, D. R.: Advances in offline approaches for trace measurements of complex organic compound mixtures via soft ionization and high-resolution tandem mass spectrometry, J. Chromatogr. A, 1598, 163–174, https://doi.org/10.1016/j.chroma.2019.03.037, 2019.
Kodros, J. K., Papanastasiou, D. K., Paglione, M., Masiol, M., Squizzato, S., Florou, K., Skyllakou, K., Kaltsonoudis, C., Nenes, A., and Pandis, S. N.: Rapid dark aging of biomass burning as an overlooked source of oxidized organic aerosol, P. Natl. Acad. Sci. USA, 117, 33028–33033, https://doi.org/10.1073/pnas.2010365117, 2020.
Koss, A. R., Sekimoto, K., Gilman, J. B., Selimovic, V., Coggon, M. M., Zarzana, K. J., Yuan, B., Lerner, B. M., Brown, S. S., Jimenez, J. L., Krechmer, J., Roberts, J. M., Warneke, C., Yokelson, R. J., and de Gouw, J.: Non-methane organic gas emissions from biomass burning: identification, quantification, and emission factors from PTR-ToF during the FIREX 2016 laboratory experiment, Atmos. Chem. Phys., 18, 3299–3319, https://doi.org/10.5194/acp-18-3299-2018, 2018.
Kotchenruther, R. A. and Hobbs, P. V.: Humidification factors of aerosols from biomass burning in Brazil, J. Geophys. Res.-Atmos., 103, 32081–32089, https://doi.org/10.1029/98JD00340, 1998.
Kou-Giesbrecht, S. and Menge, D.: Nitrogen-fixing trees could exacerbate climate change under elevated nitrogen deposition, Nat. Commun., 10, 1493, https://doi.org/10.1038/s41467-019-09424-2, 2019.
Kumar, V., Chandra, B. P., and Sinha, V.: Large unexplained suite of chemically reactive compounds present in ambient air due to biomass fires, Sci. Rep., 8, 626, https://doi.org/10.1038/s41598-017-19139-3, 2018.
Landis, M. S., Edgerton, E. S., White, E. M., Wentworth, G. R., Sullivan, A. P., and Dillner, A. M.: The impact of the 2016 Fort McMurray Horse River Wildfire on ambient air pollution levels in the Athabasca Oil Sands Region, Alberta, Canada, Sci. Total Environ., 618, 1665–1676, https://doi.org/10.1016/j.scitotenv.2017.10.008, 2018.
Lee, T., Sullivan, A. P., Mack, L., Jimenez, J. L., Kreidenweis, S. M., Onasch, T. B., Worsnop, D. R., Malm, W., Wold, C. E., Hao, W. M., and Collett Jr., J. L.: Chemical smoke marker emissions during flaming and smoldering phases of laboratory open burning of wildland fuels, Aerosol Sci. Tech., 44, i–v, https://doi.org/10.1080/02786826.2010.499884, 2010.
Li, Y., Pöschl, U., and Shiraiwa, M.: Molecular corridors and parameterizations of volatility in the chemical evolution of organic aerosols, Atmos. Chem. Phys., 16, 3327–3344, https://doi.org/10.5194/acp-16-3327-2016, 2016.
Lindaas, J., Pollack, I. B., Garofalo, L. A., Pothier, M. A., Farmer, D. K., Kreidenweis, S. M., Campos, T. L., Flocke, F., Weinheimer, A. J., Montzka, D. D., Tyndall, G. S., Palm, B. B., Peng, Q., Thornton, J. A., Permar, W., Wielgasz, C., Hu, L., Ottmar, R. D., Restaino, J. C., Hudak, A. T., Ku, I.-T., Zhou, Y., Sive, B. C., Sullivan, A., Collett Jr., J. L., and Fischer, E. V.: Emissions of reactive nitrogen from western U. S. wildfires during summer 2018, J. Geophys. Res.-Atmos., 125, e2020JD032657, https://doi.org/10.1029/2020JD032657, 2020.
Liu, X., Huey, L. G., Yokelson, R. J., Selimovic, V., Simpson, I. J., Müller, M., Jimenez, J. L., Campuzano-Jost, P., Beyersdorf, A. J., Blake, D. R., Butterfield, Z., Choi, Y., Crounse, J. D., Day, D. A., Diskin, G. S., Dubey, M. K., Fortner, E., Hanisco, T. F., Hu, W., King, L. E., Kleinman, L., Meinardi, S., Mikoviny, T., Onasch, T. B., Palm, B. B., Peischl, J., Pollack, I. B., Ryerson, T. B., Sachse, G. W., Sedlacek, A. J., Shilling, J. E., Springston, S., St. Clair, J. M., Tanner, D. J., Teng, A. P., Wennberg, P. O., Wisthaler, A., and Wolfe, G. M.: Airborne measurements of western U. S. wildfire emissions: Comparison with prescribed burning and air quality implications, J. Geophys. Res.-Atmos., 122, 6108–6129, https://doi.org/10.1002/2016JD026315, 2017.
Matz, C. J., Egyed, M., Xi, G., Racine, J., Pavlovic, R., Rittmaster, R., Henderson, S. B., and Stieb, D. M.: Health impact analysis of PM2.5 from wildfire smoke in Canada (2013–2015, 2017–2018), Sci. Total Environ., 725, 138506, https://doi.org/10.1016/j.scitotenv.2020.138506, 2020.
May, A. A., McMeeking, G. R., Lee, T., Taylor, J. W., Craven, J. S., Burling, I., Sullivan, A. P., Akagi, S., Collett Jr., J. L., Flynn, M., Coe, H., Urbanski, S. P., Seinfeld, J. H., Yokelson, R. J., and Kreidenweis, S. M.: Aerosol emissions from prescribed fires in the United States: A synthesis of laboratory and aircraft measurements, J. Geophys. Res.-Atmos., 119, 11826–11849, https://doi.org/10.1002/2014JD021848, 2014.
McGee, T., McFarlane, B., and Tymstra, C.: Chapter 3 – Wildfire: A Canadian Perspective, in: Wildfire Hazards, Risks and Disasters, edited by: Shroder, J. F. and Paton, D., Elsevier, Amsterdam, the Netherlands, 35–58, https://doi.org/10.1016/B978-0-12-410434-1.00003-8, 2015.
McLagan, D. S., Stupple, G. W., Darlington, A., Hayden, K., and Steffen, A.: Where there is smoke there is mercury: Assessing boreal forest fire mercury emissions using aircraft and highlighting uncertainties associated with upscaling emissions estimates, Atmos. Chem. Phys., 21, 5635–5653, https://doi.org/10.5194/acp-21-5635-2021, 2021.
Miesel, J. R.: Differential responses of Pinus ponderosa and Abies concolor foliar characteristics and diameter growth to thinning and prescribed fire treatments, Forest Ecol. Manag., 284, 163–173, https://doi.org/10.1016/j.foreco.2012.07.054, 2012.
Miller, D. J., Sun, K., Zondlo, M. A., Kanter, D., Dubovik, O., Welton, E. J., Winker, D. M., and Ginoux, P.: Assessing boreal forest fire smoke aerosol impacts on U. S. air quality: A case study using multiple data sets, J. Geophys. Res.-Atmos., 116, D22209, https://doi.org/10.1029/2011JD016170, 2011.
Moussa, S. G., Leithead, A., Li, S. M., Chan, T. W., Wentzell, J. J. B., Stroud, C., Zhang, J. H., Lee, P., Lu, G., Brook, J. R., Hayden, K., Narayan, J., and Liggio, J.: Emissions of hydrogen cyanide from on-road gasoline and diesel vehicles, Atmos. Environ., 131, 185–195, https://doi.org/10.1016/j.atmosenv.2016.01.050, 2016.
NRCan: Blueprint for wildland fire science in Canada (2019–2029), Sankey, S., Technical Coordinator, Canadian Forest Service, Northern Forestry Centre, Edmonton, AB, 45 pp., https://cfs.nrcan.gc.ca/publications?id=39429 (last access: 31 July 2022), 2018.
O'Brien, J. J., Loudermilk, E. L., Hornsby, B. S., Hudak, A. T., Bright, B. C., Dickinson, M. B., Hiers, J. K., Teske, C., and Ottmar, R. D.: High-resolution infrared thermography for capturing wildland fire behaviour: RxCADRE 2012, Int. J. Wildland Fire, 25, 62–75, https://doi.org/10.1071/WF14165, 2015.
Palm, B. B., Peng, Q., Fredrickson, C. D., Lee, B. H., Garofalo, L. A., Pothier, M. A., Kreidenweis, S. M., Farmer, D. K., Pokhrel, R. P., Shen, Y., Murphy, S. M., Permar, W., Hu, L., Campos, T. L., Hall, S. R., Ullmann, K., Zhang, X., Flocke, F., Fischer, E. V., and Thornton, J. A.: Quantification of organic aerosol and brown carbon evolution in fresh wildfire plumes, P. Natl. Acad. Sci. USA, 117, 29469–29477, https://doi.org/10.1073/pnas.2012218117, 2020.
Peng, Q., Palm, B. B., Melander, K. E., Lee, B. H., Hall, S. R., Ullmann, K., Campos, T., Weinheimer, A. J., Apel, E. C., Hornbrook, R. S., Hills, A. J., Montzka, D. D., Flocke, F., Hu, L., Permar, W., Wielgasz, C., Lindaas, J., Pollack, I. B., Fischer, E. V., Bertram, T. H., and Thornton, J. A.: HONO Emissions from Western U. S. Wildfires Provide Dominant Radical Source in Fresh Wildfire Smoke, Environ. Sci. Technol., 54, 5954–5963, https://doi.org/10.1021/acs.est.0c00126, 2020.
Parrington, M., Palmer, P. I., Lewis, A. C., Lee, J. D., Rickard, A. R., Di Carlo, P., Taylor, J. W., Hopkins, J. R., Punjabi, S., Oram, D. E., Forster, G., Aruffo, E., Moller, S. J., Bauguitte, S. J.-B., Allan, J. D., Coe, H., and Leigh, R. J.: Ozone photochemistry in boreal biomass burning plumes, Atmos. Chem. Phys., 13, 7321–7341, https://doi.org/10.5194/acp-13-7321-2013, 2013.
Permar, W., Wang, Q., Selimovic, V., Wielgasz, C., Yokelson, R. J., Hornbrook, R. S., Hills, A. J., Apel, E. C., Ku, I.-T., Zhou, Y., Sive, B. C., Sullivan, A. P., Collett Jr., J. L., Campos, T. L., Palm, B. B., Peng, Q., Thornton, J. A., Garofalo, L. A., Farmer, D. K., Kreidenweis, S. M., Levin, E. J. T., DeMott, P. J., Flocke, F., Fischer, E. V., and Hu, L.: Emissions of trace organic gases from western U. S. wildfires based on WE-CAN aircraft measurements, J. Geophys. Res.-Atmos., 126, e2020JD033838, https://doi.org/10.1029/2020JD033838, 2021.
Randerson, J. T., Liu, H., Flanner, M. G., Chambers, S. D., Jin, Y., Hess, P. G., Pfister, G., Mack, M. C., Treseder, K. K., Welp, L. R., Chapin, F. S., Harden, J. W., Goulden, M. L., Lyons, E., Neff, J. C., Schuur, E. A., and Zender, C. S.: The impact of boreal forest fire on climate warming, Science, 314, 1130–1132, https://doi.org/10.1126/science.1132075, 2006.
Reid, C. E., Brauer, M., Johnston, F. H., Jerrett, M., Balmes, J. R., and Elliott, C. T.: Critical review of health impacts of wildfire smoke exposure, Environ. Health Persp., 124, 1334–1343, https://doi.org/10.1289/ehp.1409277, 2016.
Reid, J. S., Koppmann, R., Eck, T. F., and Eleuterio, D. P.: A review of biomass burning emissions part II: intensive physical properties of biomass burning particles, Atmos. Chem. Phys., 5, 799–825, https://doi.org/10.5194/acp-5-799-2005, 2005.
Roberts, G., Wooster, M. J., Xu, W., Freeborn, P. H., Morcrette, J.-J., Jones, L., Benedetti, A., Jiangping, H., Fisher, D., and Kaiser, J. W.: LSA SAF Meteosat FRP products – Part 2: Evaluation and demonstration for use in the Copernicus Atmosphere Monitoring Service (CAMS), Atmos. Chem. Phys., 15, 13241–13267, https://doi.org/10.5194/acp-15-13241-2015, 2015.
Roberts, J. M., Stockwell, C. E., Yokelson, R. J., de Gouw, J., Liu, Y., Selimovic, V., Koss, A. R., Sekimoto, K., Coggon, M. M., Yuan, B., Zarzana, K. J., Brown, S. S., Santin, C., Doerr, S. H., and Warneke, C.: The nitrogen budget of laboratory-simulated western US wildfires during the FIREX 2016 Fire Lab study, Atmos. Chem. Phys., 20, 8807–8826, https://doi.org/10.5194/acp-20-8807-2020, 2020.
Rogers, C. F., Hudson, J. G., Hallett, J., and Penner, J. E.: Cloud Droplet Nucleation by Crude-Oil Smoke and Coagulated Crude-Oil Wood Smoke Particles, Atmos. Environ. A-Gen., 25, 2571–2580, https://doi.org/10.1016/0960-1686(91)90174-6, 1991.
Rogers, H. M., Ditto, J. C., and Gentner, D. R.: Evidence for impacts on surface-level air quality in the northeastern US from long-distance transport of smoke from North American fires during the Long Island Sound Tropospheric Ozone Study (LISTOS) 2018, Atmos. Chem. Phys., 20, 671–682, https://doi.org/10.5194/acp-20-671-2020, 2020.
Seidl, R., Thom, D., Kautz, M., Martin-Benito, D., Peltoniemi, M., Vacchiano, G., Wild, J., Ascoli, D., Petr, M., Honkaniemi, J., Lexer, M. J., Trotsiuk, V., Mairota, P., Svoboda, M., Fabrika, M., Nagel, T. A., and Reyer, C. P. O.: Forest disturbances under climate change, Nat. Clim. Change, 7, 395–402, https://doi.org/10.1038/nclimate3303, 2017.
Seinfeld, J. H. and Pandis, S. N.: Atmospheric chemistry and physics: from air pollution to climate change, John Wiley & Sons, New York, ISBN 978-1-118-94740-1, 1998.
Sekimoto, K., Li, S.-M., Yuan, B., Koss, A., Coggon, M., Warneke, C., and de Gouw, J.: Calculation of the sensitivity of proton-transfer-reaction mass spectrometry (PTR-MS) for organic trace gases using molecular properties, Int. J. Mass Spectrom., 421, 71–94, https://doi.org/10.1016/j.ijms.2017.04.006, 2017.
Sheu, R., Marcotte, A., Khare, P., Charan, S., Ditto, J. C., and Gentner, D. R.: Advances in offline approaches for chemically speciated measurements of trace gas-phase organic compounds via adsorbent tubes in an integrated sampling-to-analysis system, J. Chromatogr. A, 1575, 80–90, https://doi.org/10.1016/j.chroma.2018.09.014, 2018.
Simoneit, B. R. T., Schauer, J. J., Nolte, C. G., Oros, D. R., Elias, V. O., Fraser, M. P., Rogge, W. F., and Cass, G. R.: Levoglucosan, a tracer for cellulose in biomass burning and atmospheric particles, Atmos. Environ., 33, 173–182, https://doi.org/10.1016/S1352-2310(98)00145-9, 1999.
Simpson, I. J., Akagi, S. K., Barletta, B., Blake, N. J., Choi, Y., Diskin, G. S., Fried, A., Fuelberg, H. E., Meinardi, S., Rowland, F. S., Vay, S. A., Weinheimer, A. J., Wennberg, P. O., Wiebring, P., Wisthaler, A., Yang, M., Yokelson, R. J., and Blake, D. R.: Boreal forest fire emissions in fresh Canadian smoke plumes: C1–C10 volatile organic compounds (VOCs), CO2, CO, NO2, NO, HCN and CH3CN, Atmos. Chem. Phys., 11, 6445–6463, https://doi.org/10.5194/acp-11-6445-2011, 2011.
Singh, H. B., Anderson, B. E., Brune, W. H., Cai, C., Cohen, R. C., Crawford, J. H., Cubison, M. J., Czech, E. P., Emmons, L., Fuelberg, H. E., Huey, G., Jacob, D. J., Jimenez, J. L., Kaduwela, A., Kondo, Y., Mao, J., Olson, J. R., Sachse, G. W., Vay, S. A., Weinheimer, A., Wennberg, P. O., and Wisthaler, A.: Pollution influences on atmospheric composition and chemistry at high northern latitudes: Boreal and California forest fire emissions, Atmos. Environ., 44, 4553–4564, https://doi.org/10.1016/j.atmosenv.2010.08.026, 2010.
Stocks, B. J., Lynham, T. J., Lawson, B. D., Alexander, M. E., Wagner, C. E. V., McAlpine, R. S., and Dubé, D. E.: The Canadian Forest Fire Danger Rating System: an overview, Forestry Chronicle, 65, 450–457, https://doi.org/10.5558/tfc65450-6, 1989.
Stockwell, C. E., Veres, P. R., Williams, J., and Yokelson, R. J.: Characterization of biomass burning emissions from cooking fires, peat, crop residue, and other fuels with high-resolution proton-transfer-reaction time-of-flight mass spectrometry, Atmos. Chem. Phys., 15, 845–865, https://doi.org/10.5194/acp-15-845-2015, 2015.
Stockwell, C. E., Bela, M. M., Coggon, M. M., Gkatzelis, G. I., Wiggins, E., Gargulinski, E. M., Shingler, T., Fenn, M., Griffin, D., Holmes, C. D., Ye, X., Saide, P. E., Bourgeois, I., Peischl, J., Womack, C. C., Washenfelder, R. A., Veres, P. R., Neuman, J. A., Gilman, J. B., Lamplugh, A., Schwantes, R. H., McKeen, S. A., Wisthaler, A., Piel, F., Guo, H., Campuzano-Jost, P., Jimenez, J. L., Fried, A., Hanisco, T. F., Huey, L. G., Perring, A., Katich, J. M., Diskin, G. S., Nowak, J. B., Bui, T. P., Halliday, H. S., DiGangi, J. P., Pereira, G., James, E. P., Ahmadov, R., McLinden, C. A., Soja, A. J., Moore, R. H., Hair, J. W., and Warneke, C.: Airborne emission rate measurements validate remote sensing observations and emission inventories of western U.S. wilfires, Environ. Sci. Technol., 56, 7564–7577, https://doi.org/10.1021/acs.est.1c07121, 2022.
Tomaz, S., Cui, T., Chen, Y., Sexton, K. G., Roberts, J. M., Warneke, C., Yokelson, R. J., Surratt, J. D., and Turpin, B. J.: Photochemical cloud processing of primary wildfire emissions as a potential source of secondary organic aerosol, Environ. Sci. Technol., 52, 11027–11037, https://doi.org/10.1021/acs.est.8b03293, 2018.
Urbanski, S.: Wildland fire emissions, carbon, and climate: Emission factors, Forest Ecol. Manag., 317, 51–60, https://doi.org/10.1016/j.foreco.2013.05.045, 2014.
Urbanski, S. P., Hao, W. M., and Baker, S.: Chap. 4 Chemical Composition of Wildland Fire Emissions, in: Developments in Environmental Science, edited by: Bytnerowicz, A., Arbaugh, M. J., Riebau, A. R., and Andersen, C., Elsevier, Amsterdam, the Netherlands, 79–107, https://doi.org/10.1016/S1474-8177(08)00004-1, 2009.
US EPA: SPECIATE Version 4.5 Database Development Documentation, Final Report EPA/600/R-16/294, https://www.epa.gov/air-emissions-modeling/speciate, last access: 31 July 2022.
van der Werf, G. R., Randerson, J. T., Giglio, L., van Leeuwen, T. T., Chen, Y., Rogers, B. M., Mu, M., van Marle, M. J. E., Morton, D. C., Collatz, G. J., Yokelson, R. J., and Kasibhatla, P. S.: Global fire emissions estimates during 1997–2016, Earth Syst. Sci. Data, 9, 697–720, https://doi.org/10.5194/essd-9-697-2017, 2017.
Veres, P., Roberts, J. M., Burling, I. R., Warneke, C., de Gouw, J., and Yokelson, R. J.: Measurements of gas-phase inorganic and organic acids from biomass fires by negative-ion proton-transfer chemical-ionization mass spectrometry, J. Geophys. Res.-Atmos., 115, D23302, https://doi.org/10.1029/2010JD014033, 2010.
Ward, D. E. and Radke, L. F.: Emissions measurements from vegetation fires: A comparative evaluation of methods and results, in: Fire in the Environment: The Ecological, Atmospheric, and Climatic Importance of Vegetation Fires. Dahlem Workshop Reports: Environmental Sciences Research Report 13, edited by: Crutzen, P. J. and Goldammer, J. G., Chischester, England, John Wiley & Sons, 53–76, 1993.
Whitman, E., Parisien, M. A., Thompson, D. K., and Flannigan, M. D.: Short-interval wildfire and drought overwhelm boreal forest resilience, Sci. Rep., 9, 18796, https://doi.org/10.1038/s41598-019-55036-7, 2019.
Wiggins, E. B., Andrews, A., Sweeney, C., Miller, J. B., Miller, C. E., Veraverbeke, S., Commane, R., Wofsy, S., Henderson, J. M., and Randerson, J. T.: Boreal forest fire CO and CH4 emission factors derived from tower observations in Alaska during the extreme fire season of 2015, Atmos. Chem. Phys., 21, 8557–8574, https://doi.org/10.5194/acp-21-8557-2021, 2021.
Wotton, B. M., Nock, C. A., and Flannigan, M. D.: Forest fire occurrence and climate change in Canada, Int. J. Wildland Fire, 19, 253–271, https://doi.org/10.1071/WF09002, 2010.
Yokelson, R. J., Griffith, D. W. T., and Ward, D. E.: Open-path Fourier transform infrared studies of large-scale laboratory biomass fires, J. Geophys. Res.-Atmos., 101, 21067–21080, https://doi.org/10.1029/96JD01800, 1996.
Yokelson, R. J., Susott, R., Ward, D. E., Reardon, J., and Griffith, D. W. T.: Emissions from smoldering combustion of biomass measured by open-path Fourier transform infrared spectroscopy, J. Geophys. Res.-Atmos., 102, 18865–18877, https://doi.org/10.1029/97JD00852, 1997.
Yokelson, R. J., Bertschi, I. T., Christian, T. J., Hobbs, P. V., Ward, D. E., and Hao, W. M.: Trace gas measurements in nascent, aged, and cloud-processed smoke from African savanna fires by airborne Fourier transform infrared spectroscopy (AFTIR), J. Geophys. Res.-Atmos., 108, 8478, https://doi.org/10.1029/2002JD002322, 2003.
Yokelson, R. J., Karl, T., Artaxo, P., Blake, D. R., Christian, T. J., Griffith, D. W. T., Guenther, A., and Hao, W. M.: The Tropical Forest and Fire Emissions Experiment: overview and airborne fire emission factor measurements, Atmos. Chem. Phys., 7, 5175–5196, https://doi.org/10.5194/acp-7-5175-2007, 2007.
Yokelson, R. J., Crounse, J. D., DeCarlo, P. F., Karl, T., Urbanski, S., Atlas, E., Campos, T., Shinozuka, Y., Kapustin, V., Clarke, A. D., Weinheimer, A., Knapp, D. J., Montzka, D. D., Holloway, J., Weibring, P., Flocke, F., Zheng, W., Toohey, D., Wennberg, P. O., Wiedinmyer, C., Mauldin, L., Fried, A., Richter, D., Walega, J., Jimenez, J. L., Adachi, K., Buseck, P. R., Hall, S. R., and Shetter, R.: Emissions from biomass burning in the Yucatan, Atmos. Chem. Phys., 9, 5785–5812, https://doi.org/10.5194/acp-9-5785-2009, 2009.
Yokelson, R. J., Burling, I. R., Gilman, J. B., Warneke, C., Stockwell, C. E., de Gouw, J., Akagi, S. K., Urbanski, S. P., Veres, P., Roberts, J. M., Kuster, W. C., Reardon, J., Griffith, D. W. T., Johnson, T. J., Hosseini, S., Miller, J. W., Cocker III, D. R., Jung, H., and Weise, D. R.: Coupling field and laboratory measurements to estimate the emission factors of identified and unidentified trace gases for prescribed fires, Atmos. Chem. Phys., 13, 89–116, https://doi.org/10.5194/acp-13-89-2013, 2013.
Yu, P., Toon, O. B., Bardeen, C. G., Zhu, Y., Rosenlof, K. H., Portmann, R. W., Thornberry, T. D., Gao, R.-S., Davis, S. M., Wolf, E. T., de Gouw, J., Peterson, D. A., Fromm, M. D., and Robock, A.: Black carbon lofts wildfire smoke high into the stratosphere to form a persistent plume, Science, 365, 587–590, https://doi.org/10.1126/science.aax1748, 2019.