the Creative Commons Attribution 4.0 License.
the Creative Commons Attribution 4.0 License.
 | 16 Sep 2022
The influence of multiple groups of biological ice nucleating particles on microphysical properties of mixed-phase clouds observed during MC3E
Sachin Patade
Deepak Waman
Akash Deshmukh
Ashok Kumar Gupta
Arti Jadav
Vaughan T. J. Phillips
Aaron Bansemer
Jacob Carlin
Alexander Ryzhkov
A new empirical parameterization (EP) for multiple groups of primary biological aerosol particles (PBAPs) is implemented in the aerosol–cloud model (AC) to investigate their roles as ice nucleating particles (INPs). The EP describes the heterogeneous ice nucleation by (1) fungal spores, (2) bacteria, (3) pollen, (4) detritus of plants, animals, and viruses, and (5) algae. Each group includes fragments from the originally emitted particles. A high-resolution simulation of a midlatitude mesoscale squall line by AC is validated against airborne and ground observations.
Sensitivity tests are carried out by varying the initial vertical profiles of the loadings of individual PBAP groups. The resulting changes in warm and ice cloud microphysical parameters are investigated. The changes in warm microphysical parameters, including liquid water content and cloud droplet number concentration, are minimal (<10 %). Overall, PBAPs have little effect on the ice number concentration (<6 %) in the convective region. In the stratiform region, increasing the initial PBAP loadings by a factor of 1000 resulted in less than 40 % change in ice number concentrations. The total ice concentration is mostly controlled by various mechanisms of secondary ice production (SIP). However, when SIP is intentionally shut down in sensitivity tests, increasing the PBAP loading by a factor of 100 has an effect of less than 3 % on the ice phase. Further sensitivity tests revealed that PBAPs have little effect on surface precipitation and on the shortwave and longwave flux (<4 %) for a 100-fold perturbation in PBAPs.
- Article
(8060 KB) - Full-text XML
-
Supplement
(1815 KB) - BibTeX
- EndNote


In most climate models, the largest source of uncertainty for estimating the total anthropogenic forcing is associated with cloud–aerosol interactions (Pörtner et al., 2022). Atmospheric aerosol particles can act as cloud condensation nuclei (CCN), and a few of them act as ice nucleating particles (INPs), thereby influencing the microphysical properties of clouds, and depending on the cloud type (Fan et al., 2010; Chen et al., 2019), the treatment of INP in climate models can strongly affect the atmospheric radiation budget (DeMott et al., 2010). Various sources of aerosol particles, including dust/metallic, marine aerosols, anthropogenic carbonaceous emissions, and primary biological aerosol particles (PBAPs), contribute to the observed INPs (Kanji et al., 2017).
A significant amount of global precipitation is associated with the ice phase in cold clouds (Field and Heymsfield, 2015; Mülmenstädt et al., 2015, Heymsfield et al., 2020). In particular, mixed-phase clouds are vital for the global climate (Dong and Mace, 2003; Zuidema et al., 2005; Matus and L'Ecuyer, 2017; Korolev et al., 2017, and references therein). In a multimodel simulation study, Tsushima et al. (2006) showed that the doubling of CO2 concentrations caused the changes in the distribution of cloud water in the mixed-phase clouds in a climate simulation to be significant.
PBAPs are solid particles of biological origin and are emitted from the Earth's surface (Després et al., 2012). They are highly active in initiating ice as INPs and include bacteria, fungal spores, pollen, algae, lichens, archaea, viruses, and biological fragments (e.g., leaf litter and insects) and molecules (e.g., proteins, polysaccharides, and lipids; Després et al., 2012; Fröhlich-Nowoisky et al., 2015; Knopf et al., 2011; Szyrmer and Zawadzki, 1997). Considering the onset temperature of freezing, some ice nucleation active fungi and bacteria (especially Pseudomonas syringae, with an onset freezing temperature around C) are among the most active INPs present in the atmosphere (Després et al., 2012; Hoose and Möhler, 2012). The potential impact of PBAP INPs on cloud microphysical characteristics has been recognized for many years; however, this topic remains a subject of debate (DeMott and Prenni, 2010; Spracklen and Herald, 2014; Hoose et al., 2010b). Some previous modeling studies have shown that, on a global scale, PBAPs have only a limited influence on clouds and precipitation (Hoose et al., 2010a; Sesartic et al., 2012, 2013; Spracklen and Heald, 2014). On a global scale, the percentage contribution of PBAPs to the immersion freezing (ice nucleation by INP immersed in supercooled water drop) is predicted to be much smaller (0.6 %) compared to dust (87 %) and soot (12 %; Hoose et al., 2010).
Many studies have used cloud models to highlight the potential impact of PBAP INPs on cloud microphysics and precipitation (e.g., Levin et al., 1987; Grützun et al., 2008; Phillips et al., 2009). For example, the mesoscale aerosol–cloud model by Phillips et al. (2009) had a 3-D domain of about 100 km in width, and many cloud types were present in the mesoscale convective system that was simulated. Their simulations revealed that the cloud cover, domain radiative fluxes, and surface precipitation rate were significantly altered by boosting organic aerosols representing PBAPs. According to Hummel et al. (2018), in shallow mixed-phase clouds (i.e., altostratus), when the cloud top temperature is below C, PBAPs have the potential to influence the cloud ice phase and produce ice crystals in the absence of other INPs.
The quest for insights into the broader atmospheric role of PBAP INPs for cloud microphysical properties and precipitation is hampered by the limited availability of observations of both their ice nucleation activities for various species and their aerosol distributions in the real atmosphere (Huang et al., 2021). More generally, there is incomplete knowledge about the chemical identity of the key INPs, whether biological or otherwise (Murray et al., 2012). In many global and regional models, the ice nucleation activity of bioaerosols is represented either empirically or theoretically, based on laboratory measurements of specific biological species of PBAPs that are assumed as representative candidates (e.g., Pseudomonas syringae). This assumption of representativeness introduces uncertainties that would be expected to impact the model results, potentially introducing a bias into the estimation of the effects of bioaerosols on clouds (e.g. Sahyoun et al., 2016; Hoose et al., 2010b; Spracklen and Herald, 2014, Huang et al., 2021, and references therein).
In addition to primary ice nucleation, ice formation in clouds can occur because of processes generating new particles from pre-existing ice, and these are known as secondary ice production (SIP) mechanisms (Korolev and Leisner, 2020; Korolev et al., 2020). SIP can have a considerable impact on cloud micro- and macro-physical properties, such as precipitation rate, glaciation time, cloud lifetime, and cloud electrification by increasing the ice number concentrations by a few orders of magnitude (e.g., Blyth and Latham, 1993; Crawford et al., 2012; Lawson et al., 2015; Phillips et al., 2017b, 2018, 2020; Phillips and Patade, 2022; Sotiropoulou et al., 2021a, b). This, in turn, can influence the global hydrological cycle and climate (Zhao and Liu, 2021).
However, in many cloud models, the representations of these SIP mechanisms are uncertain, as most of the cloud models include only the Hallett–Mossop (hereafter HM; Hallett and Mossop, 1974) process and neglect other SIP mechanisms (e.g., Fan et al., 2017; Han et al., 2019). A few secondary ice formation processes (e.g., the HM process) have been suggested to be active in the temperature range where active PBAP INPs exhibit strong ice nucleation activity. The INPs of biological origin, such as bacteria, are highly active in the temperature range of the HM process (−3 to C) compared with non-biological INPs (Möhler et al., 2008; Patade et al., 2021; henceforth PT21). At temperatures warmer than −15 ∘C, some of the PBAPs generated by biologically active landscapes (e.g., forests and woodlands) can promote ice formation and crystal growth in clouds (Morris et al., 2014).
In the USA, about 18 % of the total landmass is used as cropland, farmland, and for agricultural activities (Garcia et al., 2012). These are major sources of biological particles in the atmosphere. Biogenic particles released from crops, either pre- or post-harvest, have previously been shown to serve as INPs (in Colorado and Nebraska; Garcia et al., 2012). Huffman et al. (2013) found that airborne biological particles increase significantly in concentration, by an order of magnitude or more, during rainfall in a forest in the western USA and that bioaerosols are well correlated with INPs. Prenni et al. (2012) observed a similar increase in concentrations of ground-level INPs during rain at a forested site in Colorado, which was associated with increased biological particles. Convective clouds can efficiently transport lower tropospheric aerosol particles into the upper troposphere where they can affect the cloud properties (Cui and Carslaw, 2006).
The current study aims to simulate realistic concentrations of multiple groups of PBAP INPs, including bacterial and fungal particles, to investigate their interactions with convective clouds observed during the Midlatitude Continental Convective Clouds Experiment field campaign (MC3E) in the USA (Jensen et al., 2016). In view of the literature noted above about the effects of PBAP INPs, there is a need for more detailed analyses of their role in altering cloud microphysical properties and precipitation because the realistic treatment of ice nucleation activity for major PBAP groups was not available prior to our empirical scheme (PT21). Hitherto, laboratory measurements of isolated biological species (e.g., Pseudomonas syringae and Cladosporium sp.) have been the basis for attempts to simulate biological ice nucleation in clouds, but the representativeness of the choice of such species has been a long-standing issue. For example, Hummel et al. (2018) considered three highly ice nucleation active PBAP species in their model, which may not represent the ice nucleation activity of PBAP in the atmosphere. It is not known which biological species of ice nucleation active (INA) PBAPs contribute the most to biological ice nucleation. Consequently, there is a need for a new approach oriented toward laboratory measurements of biological INPs sampled from the atmosphere, thus optimizing the representativeness of the data for studies of clouds.
In this paper, such an approach is followed to investigate the effect on cloud properties from various major groups of PBAP. We incorporated a recent empirical parameterization for various PBAP groups by PT21 into our 3-D aerosol–cloud model (AC). PT21 created an empirical formulation resolving the ice nucleation of each group of PBAPs, including (1) fungal spores and their fragments, (2) bacteria and their fragments, (3) pollen and their fragments, (4) detritus of plants, animals, and viruses, and (5) algae. We also examine the relative importance of various secondary ice processes in their role in mediating the PBAP effects on cloud microphysical properties, given the weakness of PBAP effects on cloud microphysical properties.
2.1 Selected case of a deep convective system
In the current study, we simulated a squall line that occurred on 20 May 2011 during MC3E (Jensen et al., 2016). The MC3E campaign took place from 22 April through to 6 June 2011 and was centered at the Atmospheric Radiation Measurement (ARM) Southern Great Plains (SGP) Central Facility (CF; 36.6∘ N, 97.5∘ W) in north-central Oklahoma. The surface meteorological analysis on 20 May indicated a southerly flow at the surface, which provided enough moisture from the Gulf of Mexico to trigger convection. Deep convection, organized in the form of a squall line, passed over the measurement site between 10:30 and 11:00 UTC, resulting in convective precipitation. It was followed by widespread stratiform precipitation that was well observed by both airborne and ground-based measurements. Vertical sounding characteristics of this case are described in Fig. S1 in the Supplement, based on the Skew-T plot.
2.2 Aircraft observations
The in situ cloud microphysical observations used in this study were obtained from a University of North Dakota Citation II aircraft. The aircraft collected observations of cloud microphysical parameters from the cloud base (1.8 km above mean sea level; hereafter a.m.s.l.) to a maximum altitude of 7.5 km a.m.s.l. The MC3E campaign collected extensive airborne measurements of aerosols and cloud microphysical properties over north-central Oklahoma. A detailed description of the scientific objectives of the MC3E program, including the field experiment strategy, airborne, and ground-based instrumentation, is given in the paper by Jensen et al. (2016). A summary of the airborne instrumentation during MC3E is provided in the Supplement.
2.3 Ground-based measurements
A comprehensive instrumentation suite deployed at the ARM SGP central facility provided continuous measurements of atmospheric gases, aerosols, clouds, and local meteorological conditions (e.g., wind, temperature, precipitation, and atmospheric profiles). A cloud condensation nuclei (CCN) counter (CCN-100; DMT) measured the CCN number concentration at seven supersaturation values with a temporal resolution of 1 h. Surface precipitation was measured with 16 rain gauge pairs placed within a 6 km radius of the SGP CF.
During the MC3E campaign, the measurement facility deployed at CF measured the spatial variability in surface fluxes of heat, moisture, and momentum. A radiosonde array of six sites, covering an area of 300×300 km, was designed to capture the large-scale variability in the atmospheric state. Radiosonde observations (Vaisala RS92-SGP) were conducted with a 6 h frequency (four times daily) at around 05:30, 11:30, 16:30, and 22:30 UTC, providing vertical profiles of atmospheric state variables (pressure, temperature, humidity, and winds) of the environment surrounding the ARM SGP site. When aircraft operations were planned based on forecasted convective conditions, the sounding frequency was increased to a 3 h frequency, with the starting time at 05:30 UTC.
In addition to airborne observations, the ARM radar network was used to conduct unique radar observations during the MC3E campaign. The information about various radar assets during MC3E is given by Jensen et al. (2016). The surface precipitation used for model validation in this study is a radar-based precipitation estimate, as described by Giangrande et al. (2014). Their radar-based rainfall retrievals were in good agreement with observations, with an absolute bias of less than 0.5 mm for accumulations less than 20 mm.
The Interagency Monitoring of Protected Visual Environments (IMPROVE) network stations close to the location of airborne observations provided ground-level measurements of various chemical species. These included carbonaceous compounds (black and organic carbon), salt, ammonium sulfate, and dust. The details of the measurement techniques used for the mass mixing ratios of these compounds are summarized in Malm et al. (1994). The measurements of these aerosol species from various IMPROVE sites, including sites at Ellis (36.08∘ N, 99.93∘ W), Stilwell (35.75∘ N, 94.66∘ W), and Wichita Mountains (34.73∘ N, 98.71∘ W) in Oklahoma, were averaged to provide inputs to AC.
Initial mass concentrations for the aerosol species of AC (11 species) including sulfate, sea salt, dust, black carbon, soluble organic, and biological and non-biological insoluble organic (five groups of PBAPs) were derived from the Goddard Chemistry Aerosol Radiation and Transport (GOCART) model (Chin et al., 2000). The prescribed mass mixing ratios of aerosol species in our aerosol–cloud model (AC) are based on IMPROVE observations and are listed in Table S2. It should be noted that, for the MC3E case considered in this study, coincident IMPROVE measurements were not available. The mean values of the IMPROVE measurements conducted on 18 and 21 May are used to prescribe the mass of various aerosol species.
3.1 Model description
The AC used in this study is a cloud-resolving model (CRM) with a hybrid spectral bin/two-moment bulk microphysics, interactive radiation, and semi-prognostic aerosol schemes (Phillips et al., 2017b, 2020). The model predicts the mass and number concentrations for five types of hydrometeors, namely cloud liquid, cloud ice (or crystals), rain, graupel/hail, and snow. The mixing ratios of the total number and mass of all particles in each microphysical species are treated as model prognostic variables. AC treats all known microphysical processes such as droplet nucleation, ice initiation, through primary and secondary processes, and growth processes, such as the deposition/sublimation of ice particles, condensation/evaporation of drops, freezing/melting, and coagulation by collisions between various hydrometeor types. Both the cloud base and in-cloud activation of aerosols to form cloud droplets are treated explicitly, with the predicted in-cloud supersaturation resolved on the model grid being used to activate aerosols aloft. Bin-resolved size distributions of each aerosol species are predicted for the interstitial and immersed components of each aerosol species. Extra prognostic variables track the number of aerosols in each aerosol species that have been lost by INP and CCN activation.
Secondary ice formation is represented by the following four types of fragmentation:
-
breakup in ice–ice collisions (Phillips et al., 2017a, b; most active between −10 to −20 ∘C),
-
rime splintering (most active between −3 to −8 ∘C; Hallett and Mossop 1974),
-
fragmentation of freezing rain/drizzle by modes 1 and 2 (Phillips et al., 2018; most active around −15 ∘C), and
-
sublimation breakup (Deshmukh et al., 2021; most active between −0 to −18 ∘C).
The empirical parameterization (EP; Phillips et al., 2013) of heterogeneous ice nucleation treats all known modes of ice formation (deposition mode, condensation /immersion freezing, and inside-out and outside-in contact freezing) in terms of dependencies on the loading, size, and chemistry of multiple aerosol species. In the previous version of the EP, prior to PT21, there were four species of INP aerosol. One of these was PBAP INPs. However, that version of the EP did not resolve the individual types of PBAP INP, which exhibit a wide range of ice nucleating abilities. The current version of AC also includes the ice nucleation (IN) activity of dust and black carbon. The ice nucleation parameterization of dust, and black carbon, is based on studies by Phillips et al. (2008, 2013). The activation of dust and black carbon INP starts at temperatures colder than −10 and C.
There are two types of homogeneous freezing represented, i.e., that of cloud droplets near C and that of solute aerosols at colder temperatures. Both schemes are described by Phillips et al. (2007, 2009). For cloud droplets, a lookup table from simulations with a spectral bin microphysics parcel model treats the fraction of all supercooled cloud droplets that evaporate without freezing near C, depending on the ascent, initial droplet concentration, and supersaturation. The size dependence of the temperature of homogeneous freezing is represented.
Cloud processes and rainfall formation have been detected using different radar variables, such as a specific differential phase KDP. Moisseev et al. (2015), for example, noted an increase in observed KDP because of aggregation. In addition, a few studies have hypothesized evidence of SIP via KDP (e.g., Sinclair et al., 2016; Kumjian and Lombardo, 2017; Carlin et al., 2021). In this study, we attempted to detect secondary ice formation signatures by implementing KDP estimations into AC. Based on Ryzhkov et al. (2011), KDP values were estimated for various hydrometeor types, including cloud drops, raindrops, cloud ice, snow, and graupel (their Eqs. 22, 23, 24, 26, and 29).
3.2 Empirical formulation for PBAP INPs
In a recent study, PT21 provided an empirical formulation for multiple groups of PBAP INPs based on field observations over the central Amazon. In this study, we modified AC by implementing the recent empirical parameterization of PBAP INPs by PT21. The empirical formulation by PT21 is based on observations of PBAP collected at the Amazon Tall Tower Observatory (ATTO), a research site located in the middle of the Amazon rainforest in northern Brazil. The empirical formulation by PT21 for multiple groups of PBAPs includes (1) fungal spores (FNG), (2) bacteria (BCT), (3) pollen (PLN), (4) viral particles and plant/animal detritus (DTS), and (5) algae (ALG) and their respective fragments, which are implemented in AC. This formulation has empirically derived dependencies on the surface area of each group (except algae), and it applies to particles with diameters greater than 0.1 µm. Additional details about the formulation by PT21 are given in the Supplement.
3.3 Model setup
AC was driven by initial and evolving boundary data for meteorological conditions. The large-scale advection of humidity and temperature tendencies maintained the convection. Convection was initiated by imposing perturbations onto the initial field of vapor mixing ratio. The large-scale forcing condition used for the simulation was derived using the constrained variational analysis method described in Xie et al. (2014). Based on this method, the so-called large-scale forcing, including large-scale vertical velocity and advective tendencies of temperature and moisture, were derived from the sounding measurements network. During the MC3E campaign, the sounding network consisted of five sounding stations centered on a sixth site at the ARM SGP central facility. An area with a diameter of approximately 300 km was covered by this sounding network covers. Figure S2 shows the time–height evolution of potential temperature and water vapor mixing ratio from large-scale forcing data. It also shows the time variation of convective available potential energy (CAPE) based on observations. The maximum value of CAPE 2400 J kg−1 was noticed at around 12:00 UTC on 20 May.
The model simulations were carried out for a three-dimensional domain of 80×80 km with horizontal grid spacings of 2 km. In the vertical, the model resolution was 0.5 km, and the model top was located at about 16 km. The lateral boundary conditions are doubly periodic on all sides of the domain. The initial time of the simulations was at 12:00 UTC on 19 May 2011, and all simulations were performed for 48 h at a time step of 10 s.
The GOCART model (Chin et al., 2000) was used to initialize the seven chemical species associated with the EP. The data from the three IMPROVE sites mentioned above (Sect. 2.3) were used to rescale the mass concentration profiles at all levels so that they match the measurements near the surface. Table S2 lists the mass mixing ratios of various aerosol species after the corrections. The corresponding vertical profiles of various aerosol species, including sulfate, dust, sea salt, black carbon, and total organic carbon, are shown in Fig. S3a–e. The corresponding IMPROVE measurements are also shown in the same figure. There were no direct measurements of PBAP mass during IMPROVE, and therefore, it was derived from the measured mass of the total organic carbon (TOC). The relative contribution of insoluble and soluble organic carbon to TOC was assumed to be 20 % and 80 %, respectively, by assuming a water-soluble fraction of 80 % for carbonaceous aerosol (Phillips et al., 2017b). AC takes into account the soluble fraction of each type of aerosol. The values of this factor are 0.15 for dust and 0.8 for carbonaceous species. The value of this fraction for all PBAP groups is 0.1.
There are very few observations available in the literature that show the fraction of PBAP in the insoluble organics or total aerosol particles. For example, observations by Matthias-Maser et al. (2000) found that 25 % of the total insoluble particles are biological. PBAPs can contribute a significant fraction to the number concentrations of total aerosol particles (Mattias-Maser et al., 1999). Mattias-Maser and Jaenicke (1995) showed that PBAPs can amount to 20 % and 30 % of the total aerosol particles. The observation by Jaenicke (2005) in a semi-rural location showed that cellular particles can contribute up to about 50 % of the total particles. Based on these studies, we assumed that 50 % of the insoluble organics were biological in origin. The total PBAP loading was prescribed, partly based on observations of insoluble organics. The mass fraction of each PBAP group in the total PBAP mass is prescribed, based on the PT21 observations. The fraction of mass mixing ratio for various PBAP groups is FNG=0.39, BCT=0.13, PLN=0.31, DTS=0.17, and .
It should be noted that the observations of PBAPs over different geographical locations (including the region where we carried out the simulation) are rare, which prevents us from using the region-specific PBAP observations for the present study. Hence, PT21's default observations were used to calculate the relative contribution of various PBAP groups to insoluble organics. The parameters for the shape of the particle size distribution (PSD) of each PBAP group (modal mean diameters, standard deviation ratios, and relative numbers in various modes) are prescribed, based on observations from Amazon (PT21). Figure S4 depicts the corresponding size distribution of various PBAP groups in AC. To check the validity of the observation from PT21 over the region considered in the current study, the model-estimated values of one of the major PBAP bacteria are compared with the observations, as shown Fig. S5. It shows that the estimated values of bacterial number concentration are overall in fair agreement with previous observations (e.g. Bowers et al., 2009; Bauer et al., 2002; Burrows et al., 2009). The simulated bacterial (∼104 m−3) and fungal (∼103 m−3) number concentration by AC is in good agreement with their typical concentration in the atmosphere (Després et al., 2012). The resulting vertical profiles of mass of the various PBAP groups are shown in Fig. S3f.
From these prescribed loadings of aerosol species, AC predicts their size distribution and, hence, the CCN activity spectrum. Using the initial sounding and aerosol profile, AC can predict the in-cloud size distribution of aerosols in each species and in-cloud supersaturation. Figure S6 shows the predicted CCN spectrum comparison with observations from the CCN counter at the surface at the SGP site. It should be noted that the aerosol mass loading from IMPROVE observations showed variations of 20 %–30 % for the simulated case. The uncertainties in the input aerosol mass loading can result in simulated CCN concentration and are shown by the errors in the CCN concentration predicted by the AC. During 19–20 May, the measured number concentration of active CCN at the SGP CF ranged from 400 to 3000 cm−3 at 1 % supersaturation (Fridlind et al., 2017). The measurements were made on 20 May before the start of the rain in clear air. The normalized CCN number concentrations at 1 % supersaturation from observations and AC are ∼1000 and ∼940 cm−3, respectively. Given the wide range of observed CCN concentrations at each supersaturation and the uncertainties in the model-predicted CCN concentration, the predicted and observed CCN activity spectra are in acceptable agreement.
4.1 Overview of the control simulation
An intense north-to-south-oriented squall line moved over the ARM SGP CF on 20 May 2011, from 11:00 to 14:00 UTC (Sect. 2.1). The new version of AC simulated this case, after implementing the empirical formulation by PT21, for multiple groups of PBAP INPs (control simulation; Sect. 3). It should be noted that five ensemble runs were carried out for the control simulation (see Table S3), varying the perturbation in the initial water vapor mixing ratio.
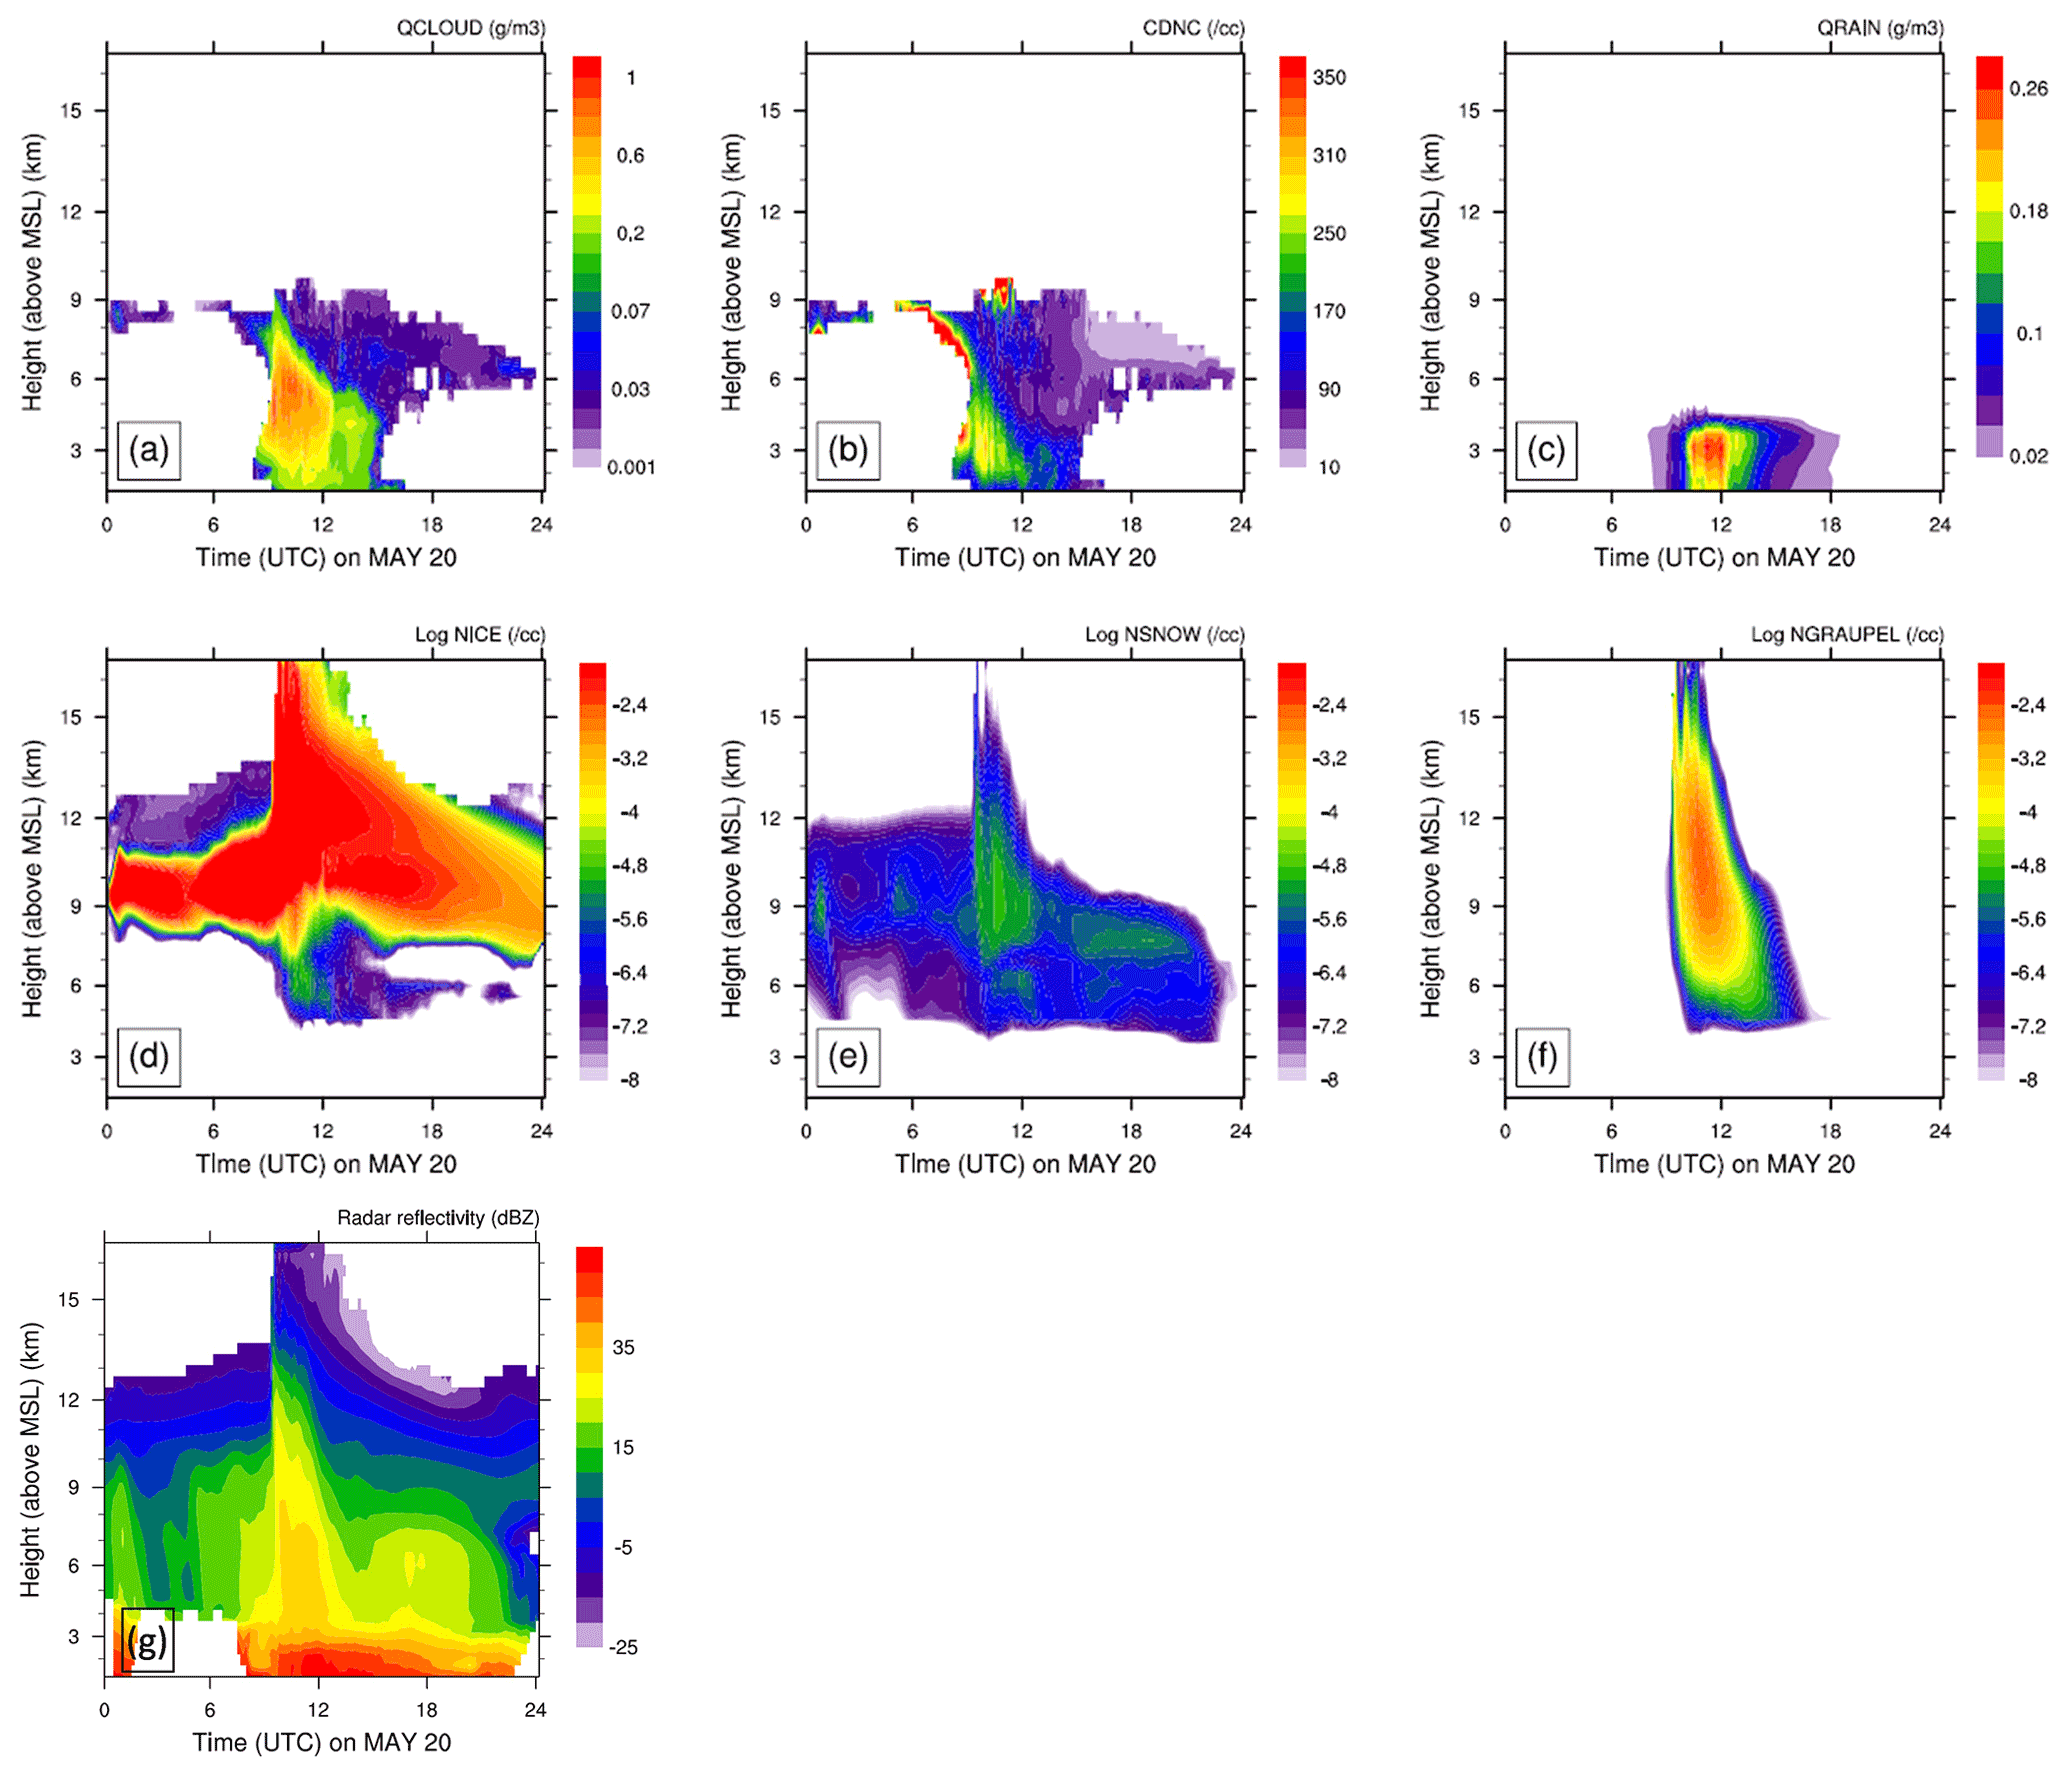
Figure 1Time–height contours of the domain-averaged (a) cloud water mixing ratio (QCLOUD), (b) cloud droplet number concentration (CDNC), (c) rainwater mixing ratio (QRAIN), (d) number concentration of cloud ice (NICE), (e) number concentration of snow (NSNOW), and (f) number concentration of graupel (NGRAUPEL). Due to a wide range of values, the log values number concentrations are plotted. The surface height is ∼500 m. The averaging was done for cloud points with LWC>0.001 g m−3 or total water content (TWC) >10−6 g m−3. Also shown is the time–height evolution of the domain-averaged (g) radar reflectivity.
Figure 1 shows the time–height evolution of various liquid and ice cloud microphysical parameters derived from the control simulation conditionally averaged over cloudy regions. The maximum average cloud droplet number concentration was around 250 cm−3. The liquid water content (LWC) was typically less than 0.5 g m−3. The freezing level (0 ∘C) was around 4.1 km a.m.s.l. The deep convection began at around 10:00 UTC, followed by intense precipitation at around 11:00 UTC, and reached its peak at around 12:00 UTC. The time–height evolution of cloud ice, snow, and graupel number concentrations shows maxima shortly before 12:00 UTC, which coincides with the time of peak precipitation. This suggests that the ice phase was important in precipitation formation.
The time–height map of simulated radar reflectivity during 20 May, unconditionally averaged over the whole domain, is shown in Fig. 1g. It shows the well-defined squall line passing over the domain from 11:00 to 15:00 UTC. The maximum of this domain-wide simulated reflectivity was around 40 dBZ when deep convection was happening. The instantaneous maximum of reflectivity at any grid point (not shown here) was about 50 dBZ. At other times, the average reflectivity was typical of the stratiform cloud of about 15 dBZ. The cloud top height of the squall line decreases after 14:00 UTC.
4.2 Model validation against coincident observations of the storm
The extended stratiform region of the squall line while in the vicinity of the SGP CF was sampled by the Citation aircraft equipped with a full suite of cloud microphysical instrumentation. The aircraft started sampling the stratiform precipitation region at around 13:00 UTC and continued the observations at sub-freezing temperatures from 13:35 to 15:15 UTC. Occasionally, the aircraft encountered weak convective updrafts (<6 m s−1). The aircraft actively avoided convection that was more vigorous than that. In this section, we validate various microphysical and dynamical quantities from the control simulation against aircraft and ground measurements. The control run includes all primary and SIP processes of ice initiation. The vertical profiles shown here are an average of five ensemble runs.
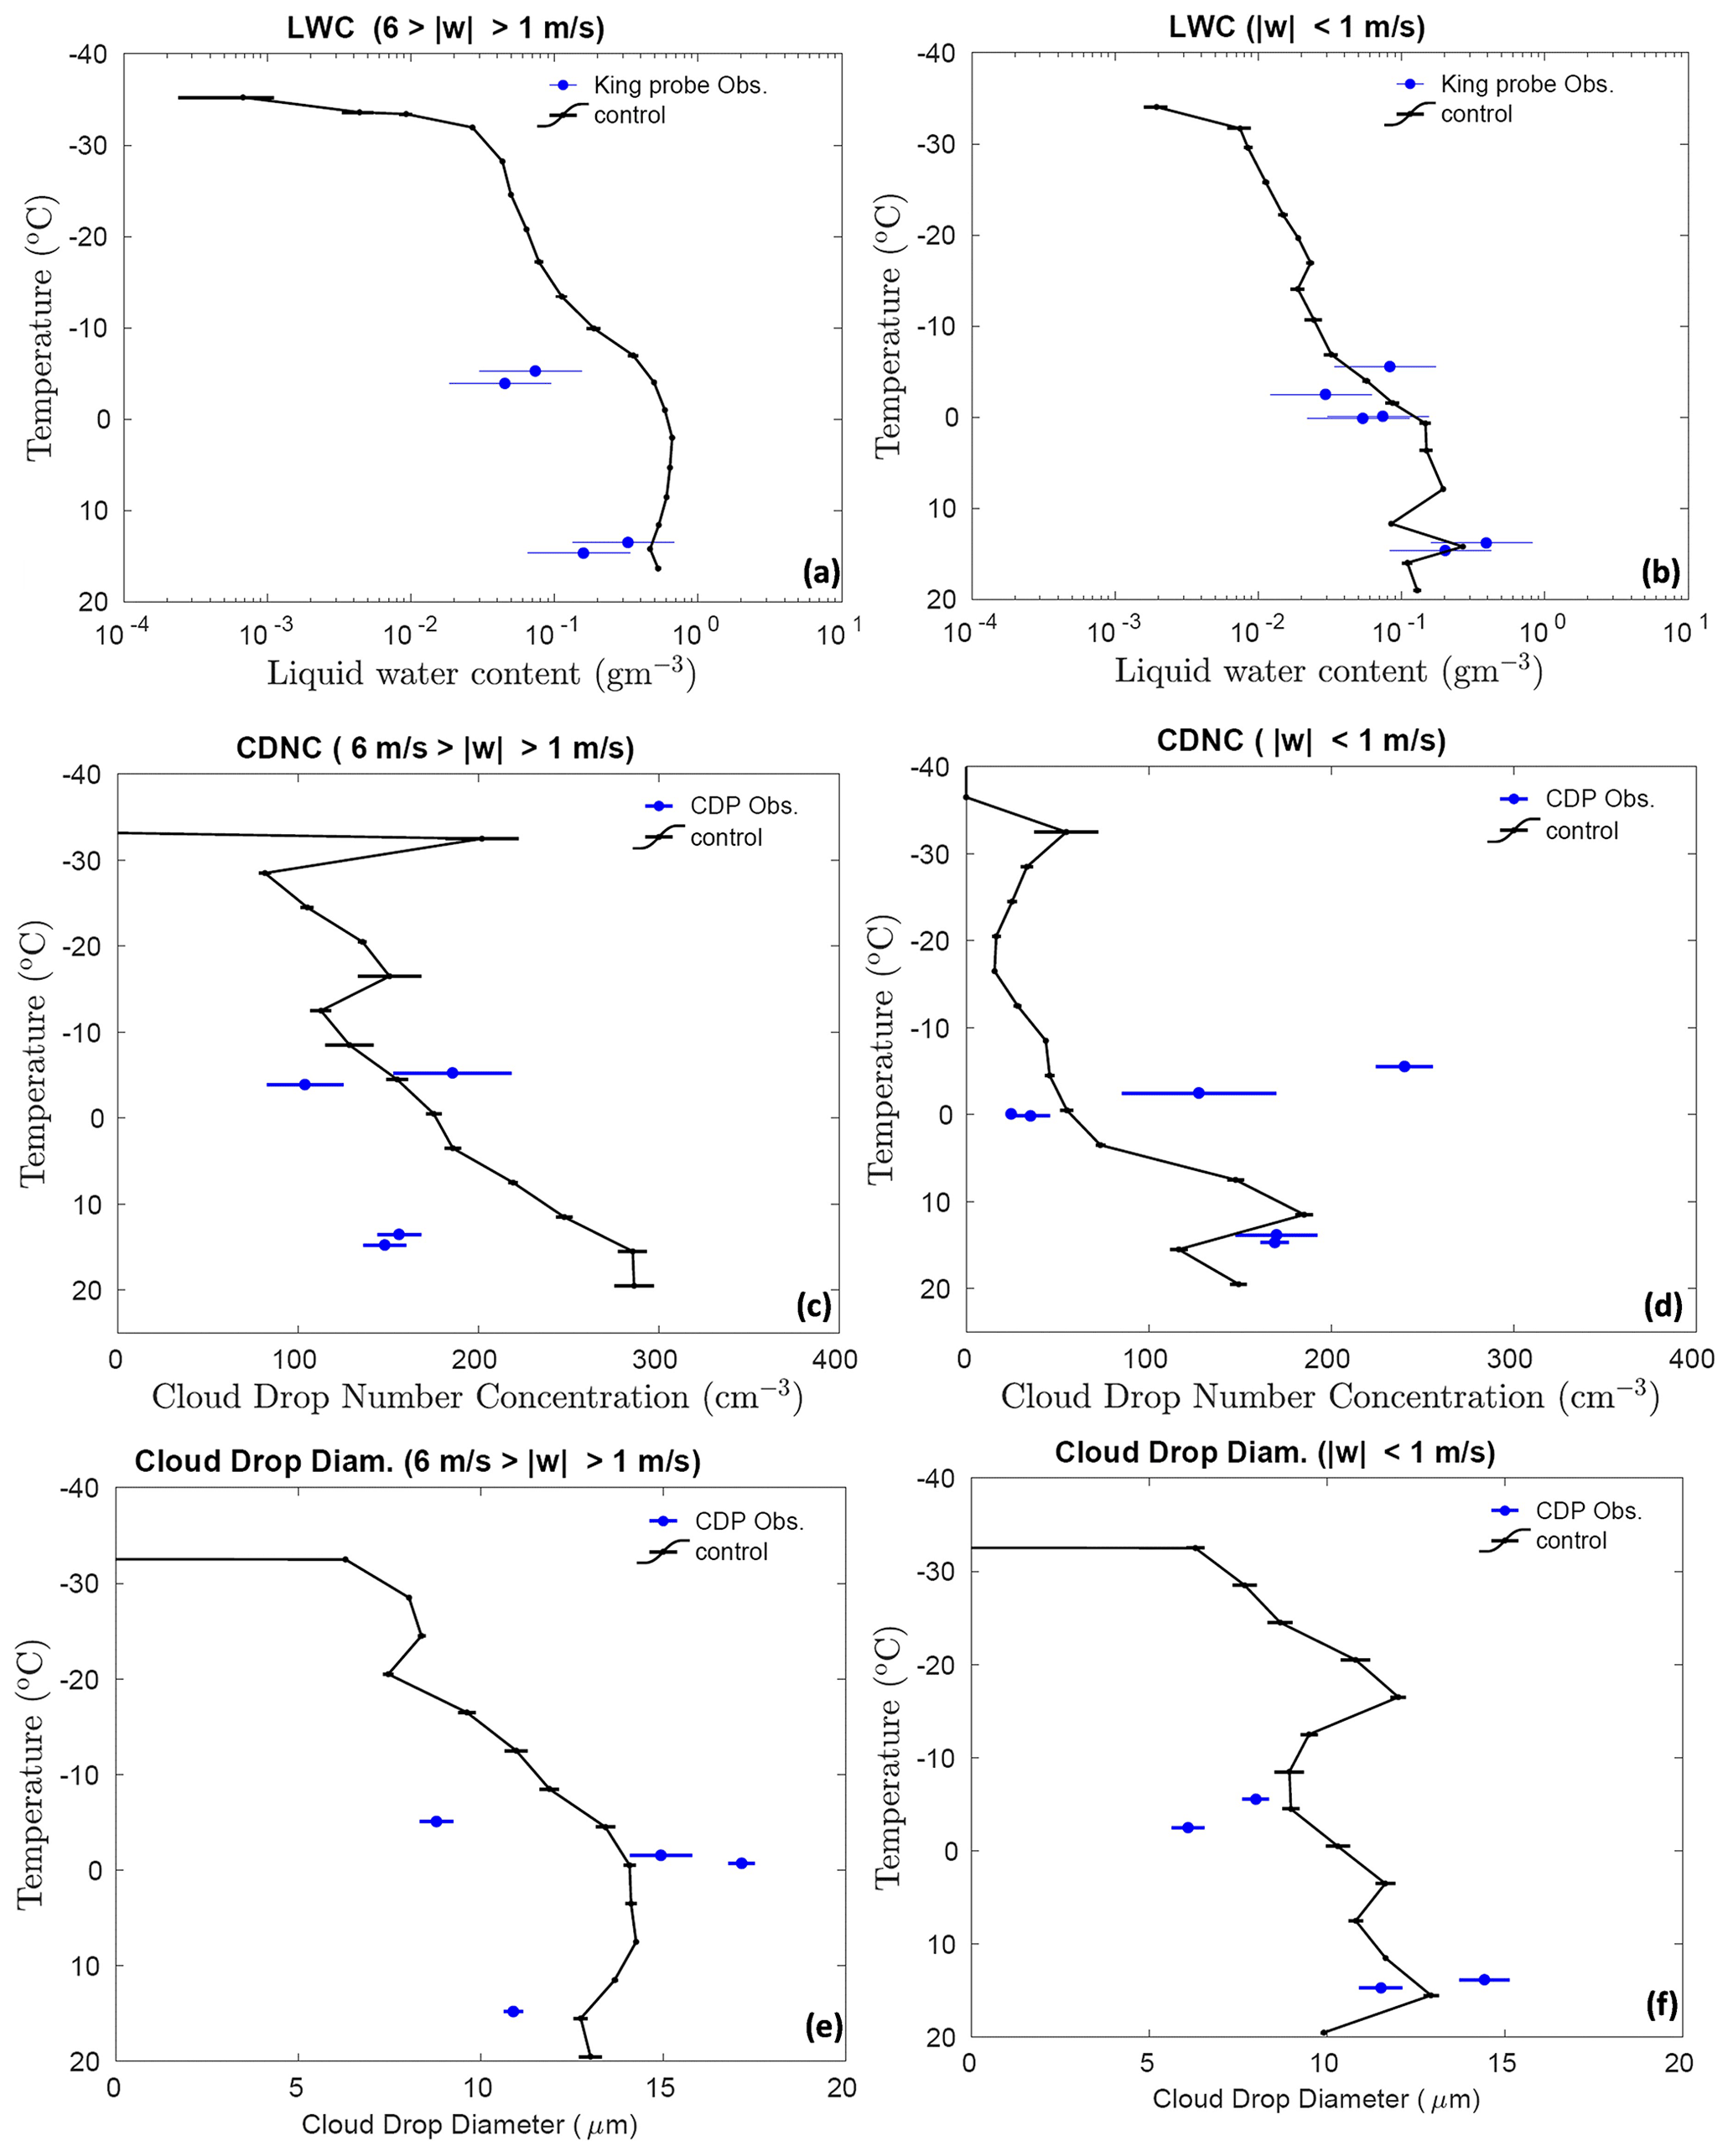
Figure 2Comparison of the control simulations by AC with aircraft observations for the liquid water content conditionally averaged over (a) convective (6 m s m s−1) and (b) stratiform ( m s−1) regions, cloud drop number concentration over (c) convective and (d) stratiform regions, and average size of cloud droplets (<20 µm) conditionally averaged over (e) convective and (f) stratiform regions. All the vertical profiles shown here are averaged for the whole domain. The error bars were estimated based on five ensemble runs.
Figure 2 compares the aircraft observations against predicted microphysical quantities, with both the predictions and observations identically averaged, conditionally over convective ( m s−1) and stratiform regions m s−1). The simulated LWC decreases exponentially with height above the cloud base. There is considerable scatter in the observed LWC at each level. The various degrees of dilution of sampled parts of the cloud can cause these variations in LWC at a given altitude. The maximum simulated LWC of 0.5 g m−3 was observed in the convective region at temperatures warmer than C. In the convective region around C, the measured LWC is lower than the simulated LWC by a factor of 3. For the stratiform region, simulated values of LWC are in adequate agreement with observations. Overall, the means of observed LWC are in acceptable agreement with the model results for convective and stratiform regions.
The vertical profiles of simulated and observed cloud drop number concentration (CDNC; Fig. 2c and d) showed that the CDNC was lower than 300 cm−3. In the convective region, the measured CDNC is 40 % lower than the simulated CDNC at 15 ∘C. However, an adequate agreement between them is found around C. For the stratiform region, simulated CDNC is much higher in the mixed-phase region. However, at a temperature warmer than 0 ∘C the values of observed CDNC are in acceptable agreement with observations. The observed and simulated mean diameter of cloud droplets varied between 6 to 16 µm (Fig. 2e and f). There are few points in the convective region e.g., around C, where the observed cloud drop diameter is 50 % lower than the simulated value. An adequate agreement between simulated and observed cloud drop diameter was found for the stratiform region. Overall, the predictions of the average CDNC and cloud droplet diameter, in both convective and stratiform regions, show a fair agreement with observations.

Figure 3Comparison of the control simulations by AC with aircraft observations for the ice number concentration of all particles >0.2(NT200) mm in the maximum dimension of all microphysical species (cloud ice, graupel/hail, and snow), averaged over (a) convective (6 m s m s−1) and (b) stratiform ( m s−1) regions. (c) The vertical profile of simulated radar reflectivity conditionally averaged over all regions of significant reflectivity (>−20 dBZ) at each level is compared with observations from ground-based radars. The temperature corresponding to each altitude is mentioned on the right axes, and the (d) predicted precipitation rate (mm h−1) is compared with ground observations at the SGP CF. All the vertical profiles shown here are averaged for the whole domain. The error bars were estimated based on five ensemble runs.
The ice particle number concentration from observations and the control simulation is also compared as shown in Fig. 3a and b for convective and stratiform regions, respectively. It should be noted that the observed number concentration of ice particle particles smaller than 200 µm is prone to shattering, even with the use of the shattering correction algorithm. This can introduce a significant bias in the observed ice number concentration (Korolev et al., 1991). To avoid these biases, we have compared the number concentration of ice particles with a diameter greater than 200 µm from both observation and model (denoted by NT200). However, in the rest of the paper (in sensitivity studies), the number concentration from the model included ice particles of all size ranges.
Observations show that the concentration of ice particles gradually increases as the temperature decreases, as expected. The maximum ice number concentration from the aircraft observations (with D>200 µm) is ∼0.06 cm−3 around C. Good agreement to within 50 %, at most levels, was found between the model-simulated NT200 and that observed for the convective region.
In the stratiform region, at most levels, model values of NT200 have the same order of magnitude as observations. However, between about the −10 and C levels, the stratiform NT200 values are about half an order of magnitude lower than the observations. In similar simulations of the 20 May case, Fan et al. (2015) and Fridlind et al. (2017) also showed an underestimation of simulated ice number concentrations. Compared to the observations, their simulations showed half an order of magnitude bias in ice crystal number concentration. Comparatively, for the convective region, our model-predicted ice number concentrations were in better agreement with the observations. As mentioned in Sect. 2.2, imaging probe data are prone to shattering, and various corrections were used to rectify this. However, there are currently no ways of determining how many undetected artifacts remain after shattering corrections have been applied (Baumgardner et al., 2017). Such uncertainties in measured ice number concentration could result in such bias in observed and simulated ice number concentrations. In summary, though the AC model is not totally perfect, it did a fair job in simulating observed ice number concentrations.
In Fig. 3c, the radar reflectivity from vertically pointing Ka-band ARM zenith radar is compared with the mean profile from model simulations. This figure illustrates that simulated reflectivity profiles below roughly 3 km and 8 km a.m.s.l. altitudes are in good agreement with observations. Between 3 and 8 km a.m.s.l. (temperatures of 2 and C), the bias in the reflectivity from model simulations and observations is about 10 dBZ. Thus, the simulated reflectivity is substantially higher than the observed, particularly at levels where the aircraft sampled the clouds. Fridlind et al. (2017), and Fan et al. (2015), noticed similar overestimations of reflectivity within stratiform outflow of the squall line case on 20 May. They attributed the reflectivity biases to significantly larger ice particles in the simulations than in the observed.
Figure 3d compares the time series of the precipitation rate from the control simulation with the radar-based precipitation estimates. In both the control simulation and observations, a maximum precipitation rate of about 5 mm h−1 was noticed, with an error in the prediction of less than 5 %. In comparison to observations, the simulated squall line arrives 1–2 h later. The lack of resolution of the 3-D turbulence in the planetary boundary layer and uncertainties associated with the 3-D structure of initial and boundary conditions can all have an independent impact on the simulated rainfall structure, resulting in a delayed peak. Nonetheless, AC has done a fair job of simulating the peak in the predicted precipitation rate.
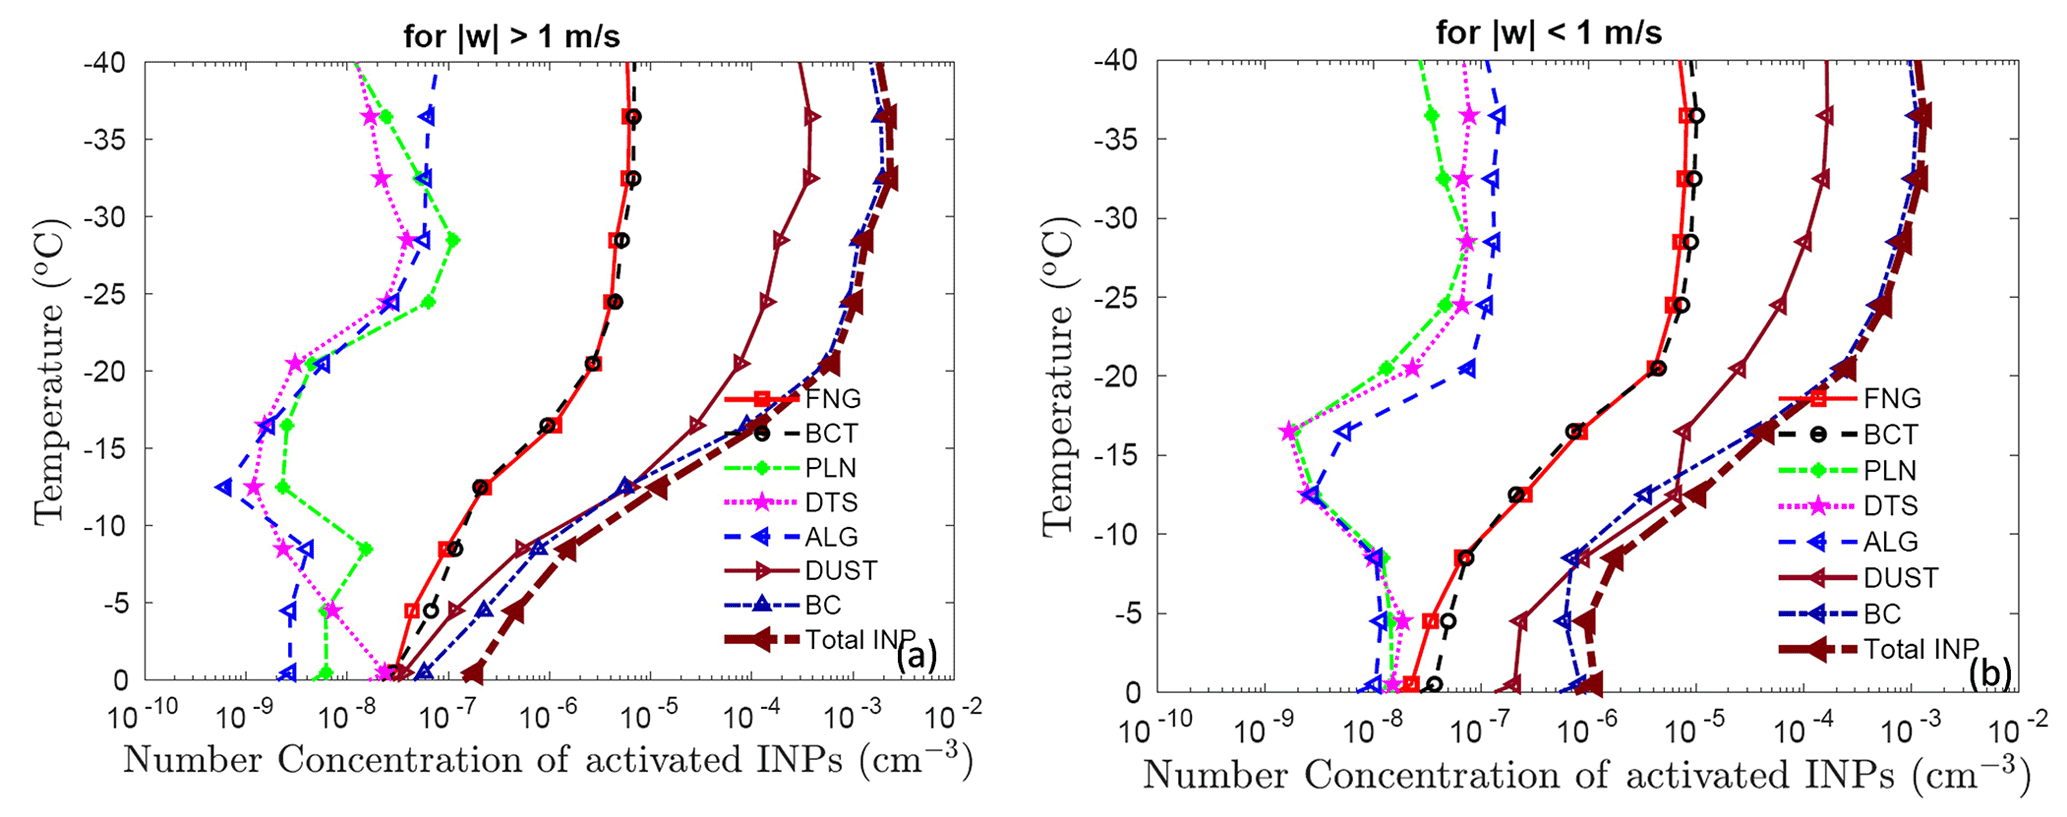
Figure 4The activated number concentration of INPs from various PBAP groups are shown along with dust (DUST) and black carbon (BC) and total INPs at various temperatures for (a) convective and (b) stratiform regions. All the vertical profiles shown here are averaged for the whole domain.
4.3 Analysis of simulation with ice particle budgets and tagging tracers
The activated PBAP INPs from the control run are shown in Fig. 4 for the convective and stratiform regions. In addition to the PBAP INPs, Fig. 4 also shows the activated INPs from dust and black carbon. It should be noted that these concentrations shown here are based on advective tagging tracers that follow the diffusion, ascent, and descent inside cloud motions. Overall, bacterial and fungal particles dominate the biological INP concentration in the simulated cloud. For example, at C, the activated INPs from bacteria and fungi are higher than the other three groups of PBAP INPs (detritus, pollen, and algae) by 2 orders of magnitude in both convective and stratiform regions. At that level in convective regions, the average concentration of simulated active PBAP INPs is about cm−3, which is 2 orders of magnitude less than the maximum total for all active INPs (about cm−3) in the whole simulation. Overall, the predicted total INP concentration is dominated by black carbon and dust. At C, the activated INPs from dust and black carbon differ by an order of magnitude from the total PBAP INPs in convection.
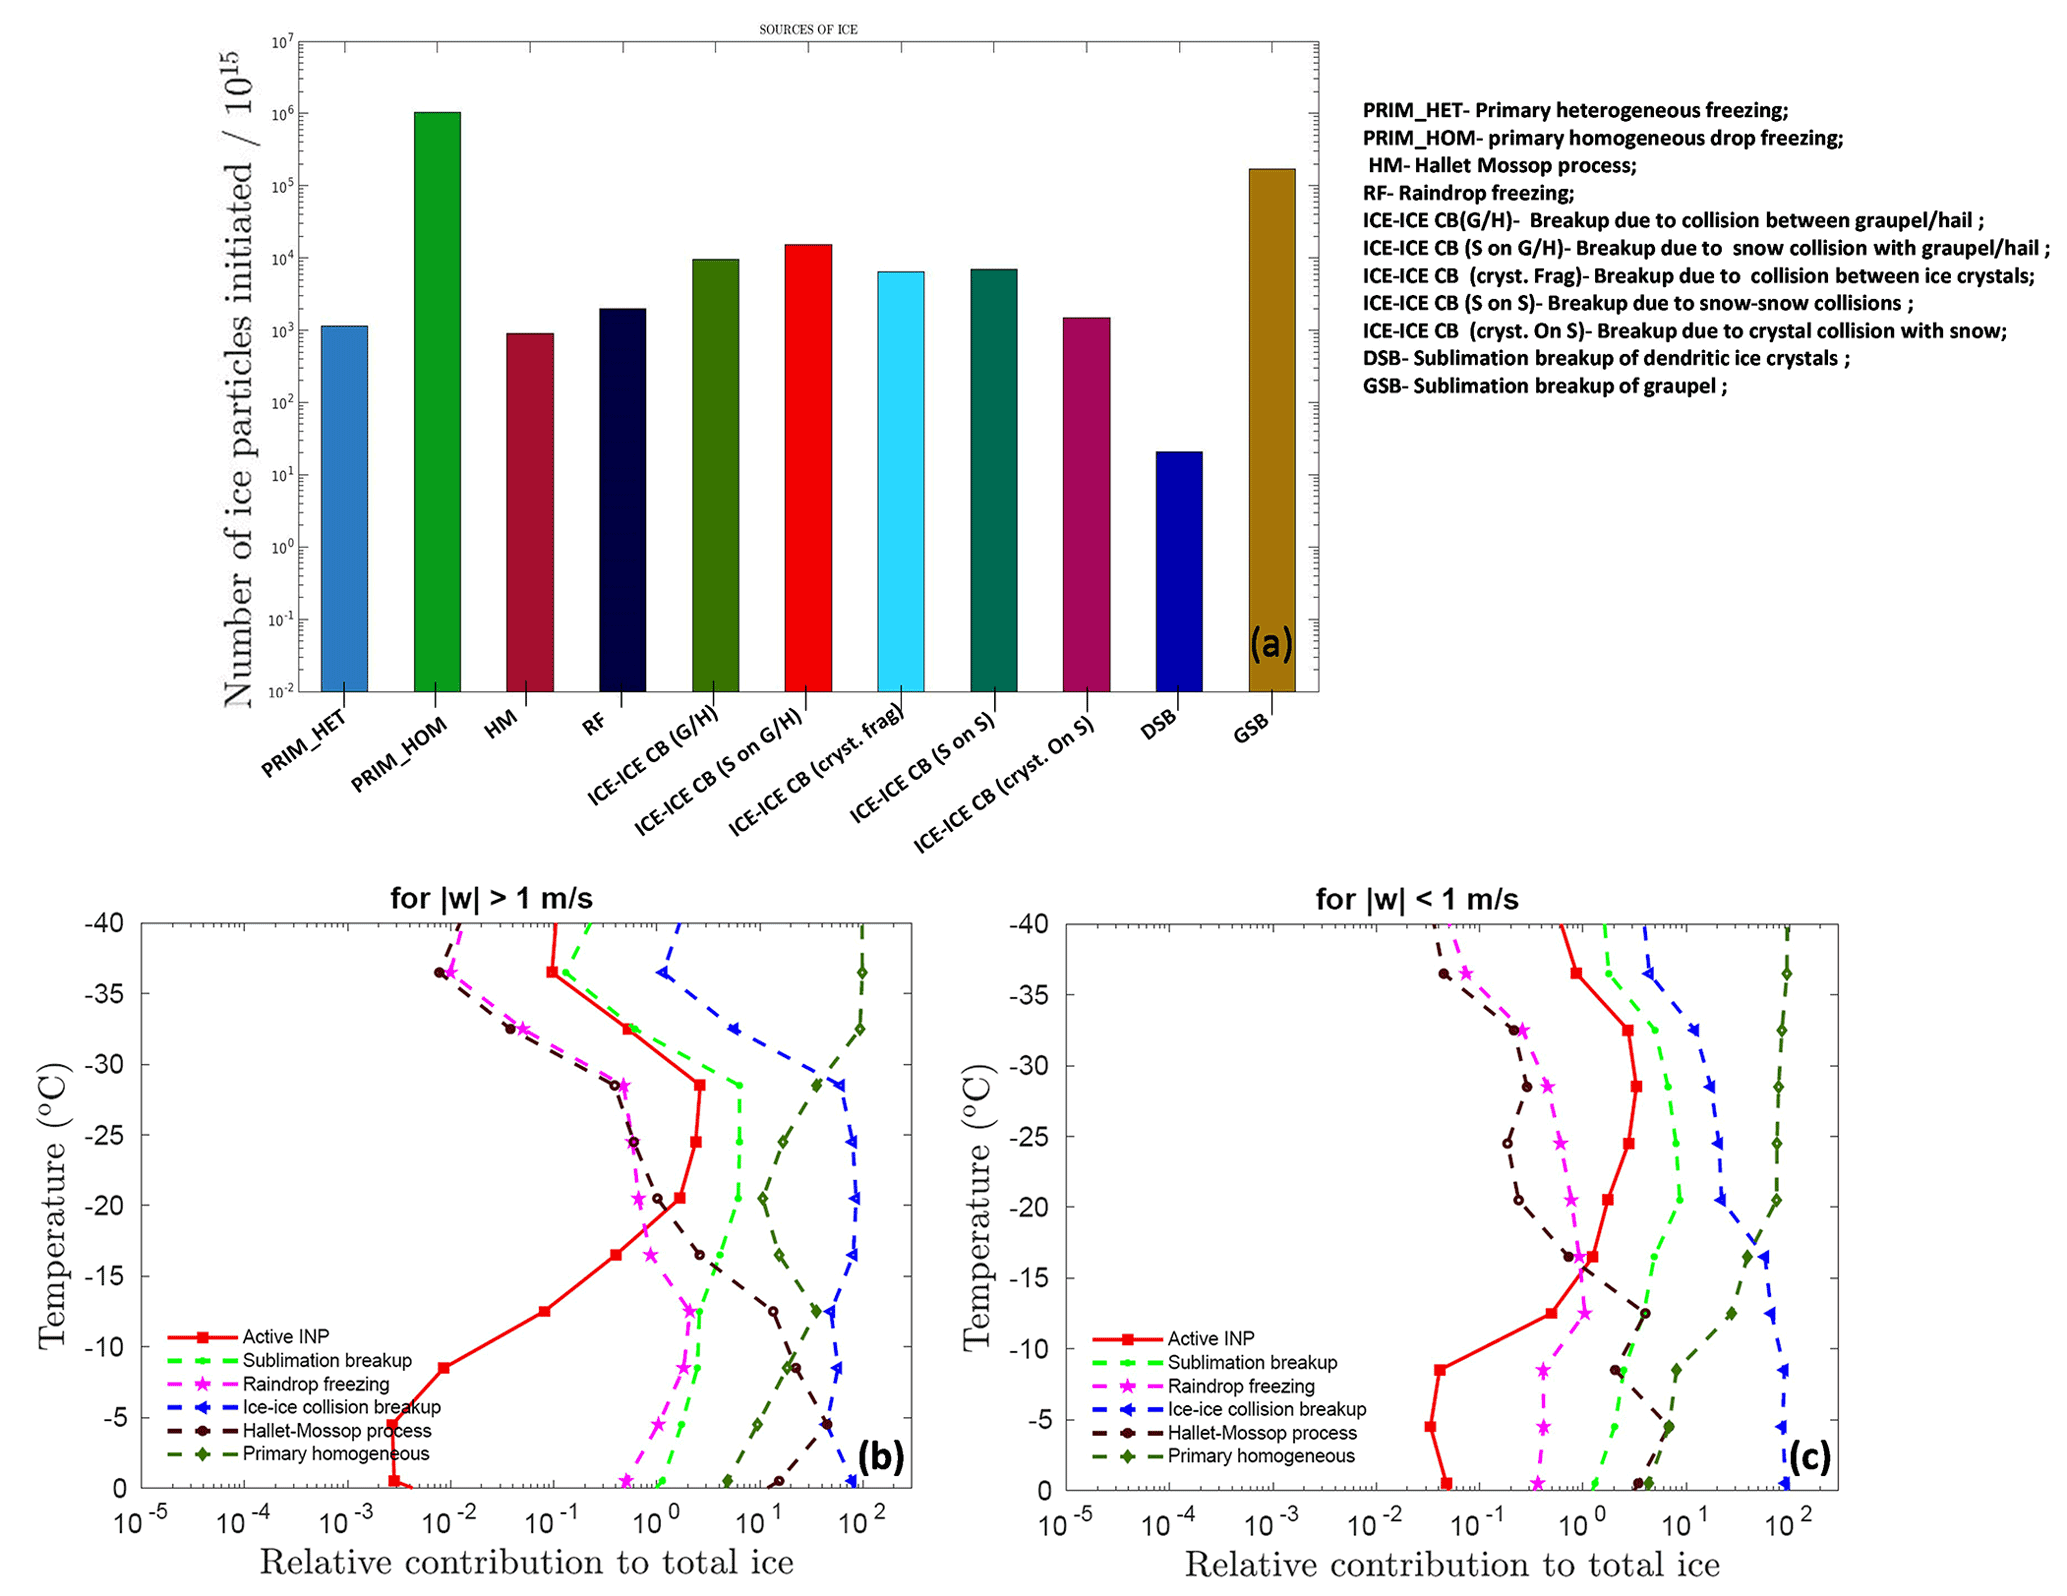
Figure 5(a) Ice crystal budget for simulated MC3E case. The number of ice crystals produced by various mechanisms (as shown in the legend) per 1015 particles is shown. Also shown is the relative contribution of various SIP mechanisms such as sublimation breakup, raindrop freezing, ice–ice collision breakup, and the Hallett–Mossop process to the total ice number concentration as a function of temperature, averaged conditionally over only (b) convective and (c) stratiform regions. The relative contribution was calculated based on advective tagging tracers for the given process. The convective and stratiform regions were identified based on criteria and , respectively.
The formation of ice in a cloud is a result of several primary and secondary processes. It is important to understand the relative importance of these processes in precipitation formation. To that end, Fig. 5a shows the ice particles initiated from various sources throughout the 3-D domain of the entire simulation. The primary homogeneous (PRIM_HOM) dominates the total ice budget. Among all SIP mechanisms, breakup caused by collisions between various ice particles is the most important in determining the total ice number concentration. The ice production by the sublimation breakup of graupel is slightly lower than PRIM_HOM. However, the contribution of ice production via the sublimation breakup of dendritic ice crystals is negligible.
Figure 5b and c depict the relative importance of ice concentration from various SIP mechanisms and active INPs in determining the total ice number as a function of temperature for convective and stratiform regions. Each source of ice displayed is tracked with advective tagging tracers throughout the simulation. Overall, at temperatures warmer than C, the contribution to the total ice number concentration from various SIP is 2–3 orders of magnitude higher than the concentration of active INPs, highlighting the importance of SIP mechanisms in ice formation. At C, breakup in ice–ice collisions contributes around 75 % and 20 % of the total ice concentration in the convective and stratiform regions, respectively. At the same temperature, in both the convective and stratiform regions, sublimation breakup and raindrop freezing contribute about 8 % and 0.8 %, respectively. It can be observed that, in the convective regions at temperatures warmer than C, SIP mechanisms are important in determining the total ice concentrations, whereas at colder temperatures, homogeneous nucleation is dominant. In the stratiform region, this crossover occurs at a much warmer temperature around C. At temperatures colder than this, homogeneous nucleation is a major contributor to the total ice, whereas at warmer temperatures, SIP mechanisms prevail. Overall, the contribution of active INP to the total ice is lower than 3 %.
Secondary ice formation via the HM process of rime splintering contributes significantly to ice production at temperatures warmer than about C (Fig. 5b and c), enhancing the ice concentration beyond the primary ice. In the convective region, the contribution of the HM process in total ice can reach as high as 40 % at around C. The simulated cloud droplet diameter is mostly smaller than 15 µm. It is smaller than the cloud droplet size required for the HM process to occur. In AC, the rate of the rime splintering mechanism depends on the concentration of droplets >24 µm. It should be noted that, in the AC model, the HM process is treated with a factor multiplying the fragment emission which depends on the cloud droplet size. This factor is zero for cloud diameter below 16 µm and unity above 24 µm, with linear interpolations in between.
To quantify the effect of multiple types of PBAPs on cloud properties, sensitivity tests were performed by modifying the control simulation and comparing the perturbed simulations with it. A description of various sensitivity tests carried out in the current study are listed in Table S3. The corresponding figures for each simulation are also mentioned.
Simulations were performed by eliminating all PBAPs from the control (no PBAP case) and by multiplying their initial loadings at all levels by factors of 10 and 100 (high PBAP and very high PBAP cases), respectively. A comparison with the control simulation reveals the overall effect from both the CCN and IN activities of all bioaerosols combined. These factors are justified by considering the variations in PBAP concentrations in the range of about 0.1 to 30 L−1 over North American forests (Huffman et al., 2013). An additional simulation was conducted with a 1000-fold increase in initial PBAP loading (ultra-high PBAP) to investigate if these unrealistically high concentrations of PBAPs could affect the ice phase in a purely hypothetical scenario. A total of five ensemble runs were carried out for all major simulations involving perturbations in PBAP loading. The ensemble runs were carried out by varying the perturbation in initial conditions (water vapor mixing ratio).
Additional simulations were performed by removing the treatment of biological IN activity in the EP (no PBAP INP case) relative to the control run. A comparison of both additional simulations against the corresponding simulations with the full change in the PBAP loadings (no PBAP and high PBAP cases) reveals the separate roles of the INP and CCN activities for the changes in biological material. Apart from these changes in PBAPs, the perturbed simulations are identical to the control run.
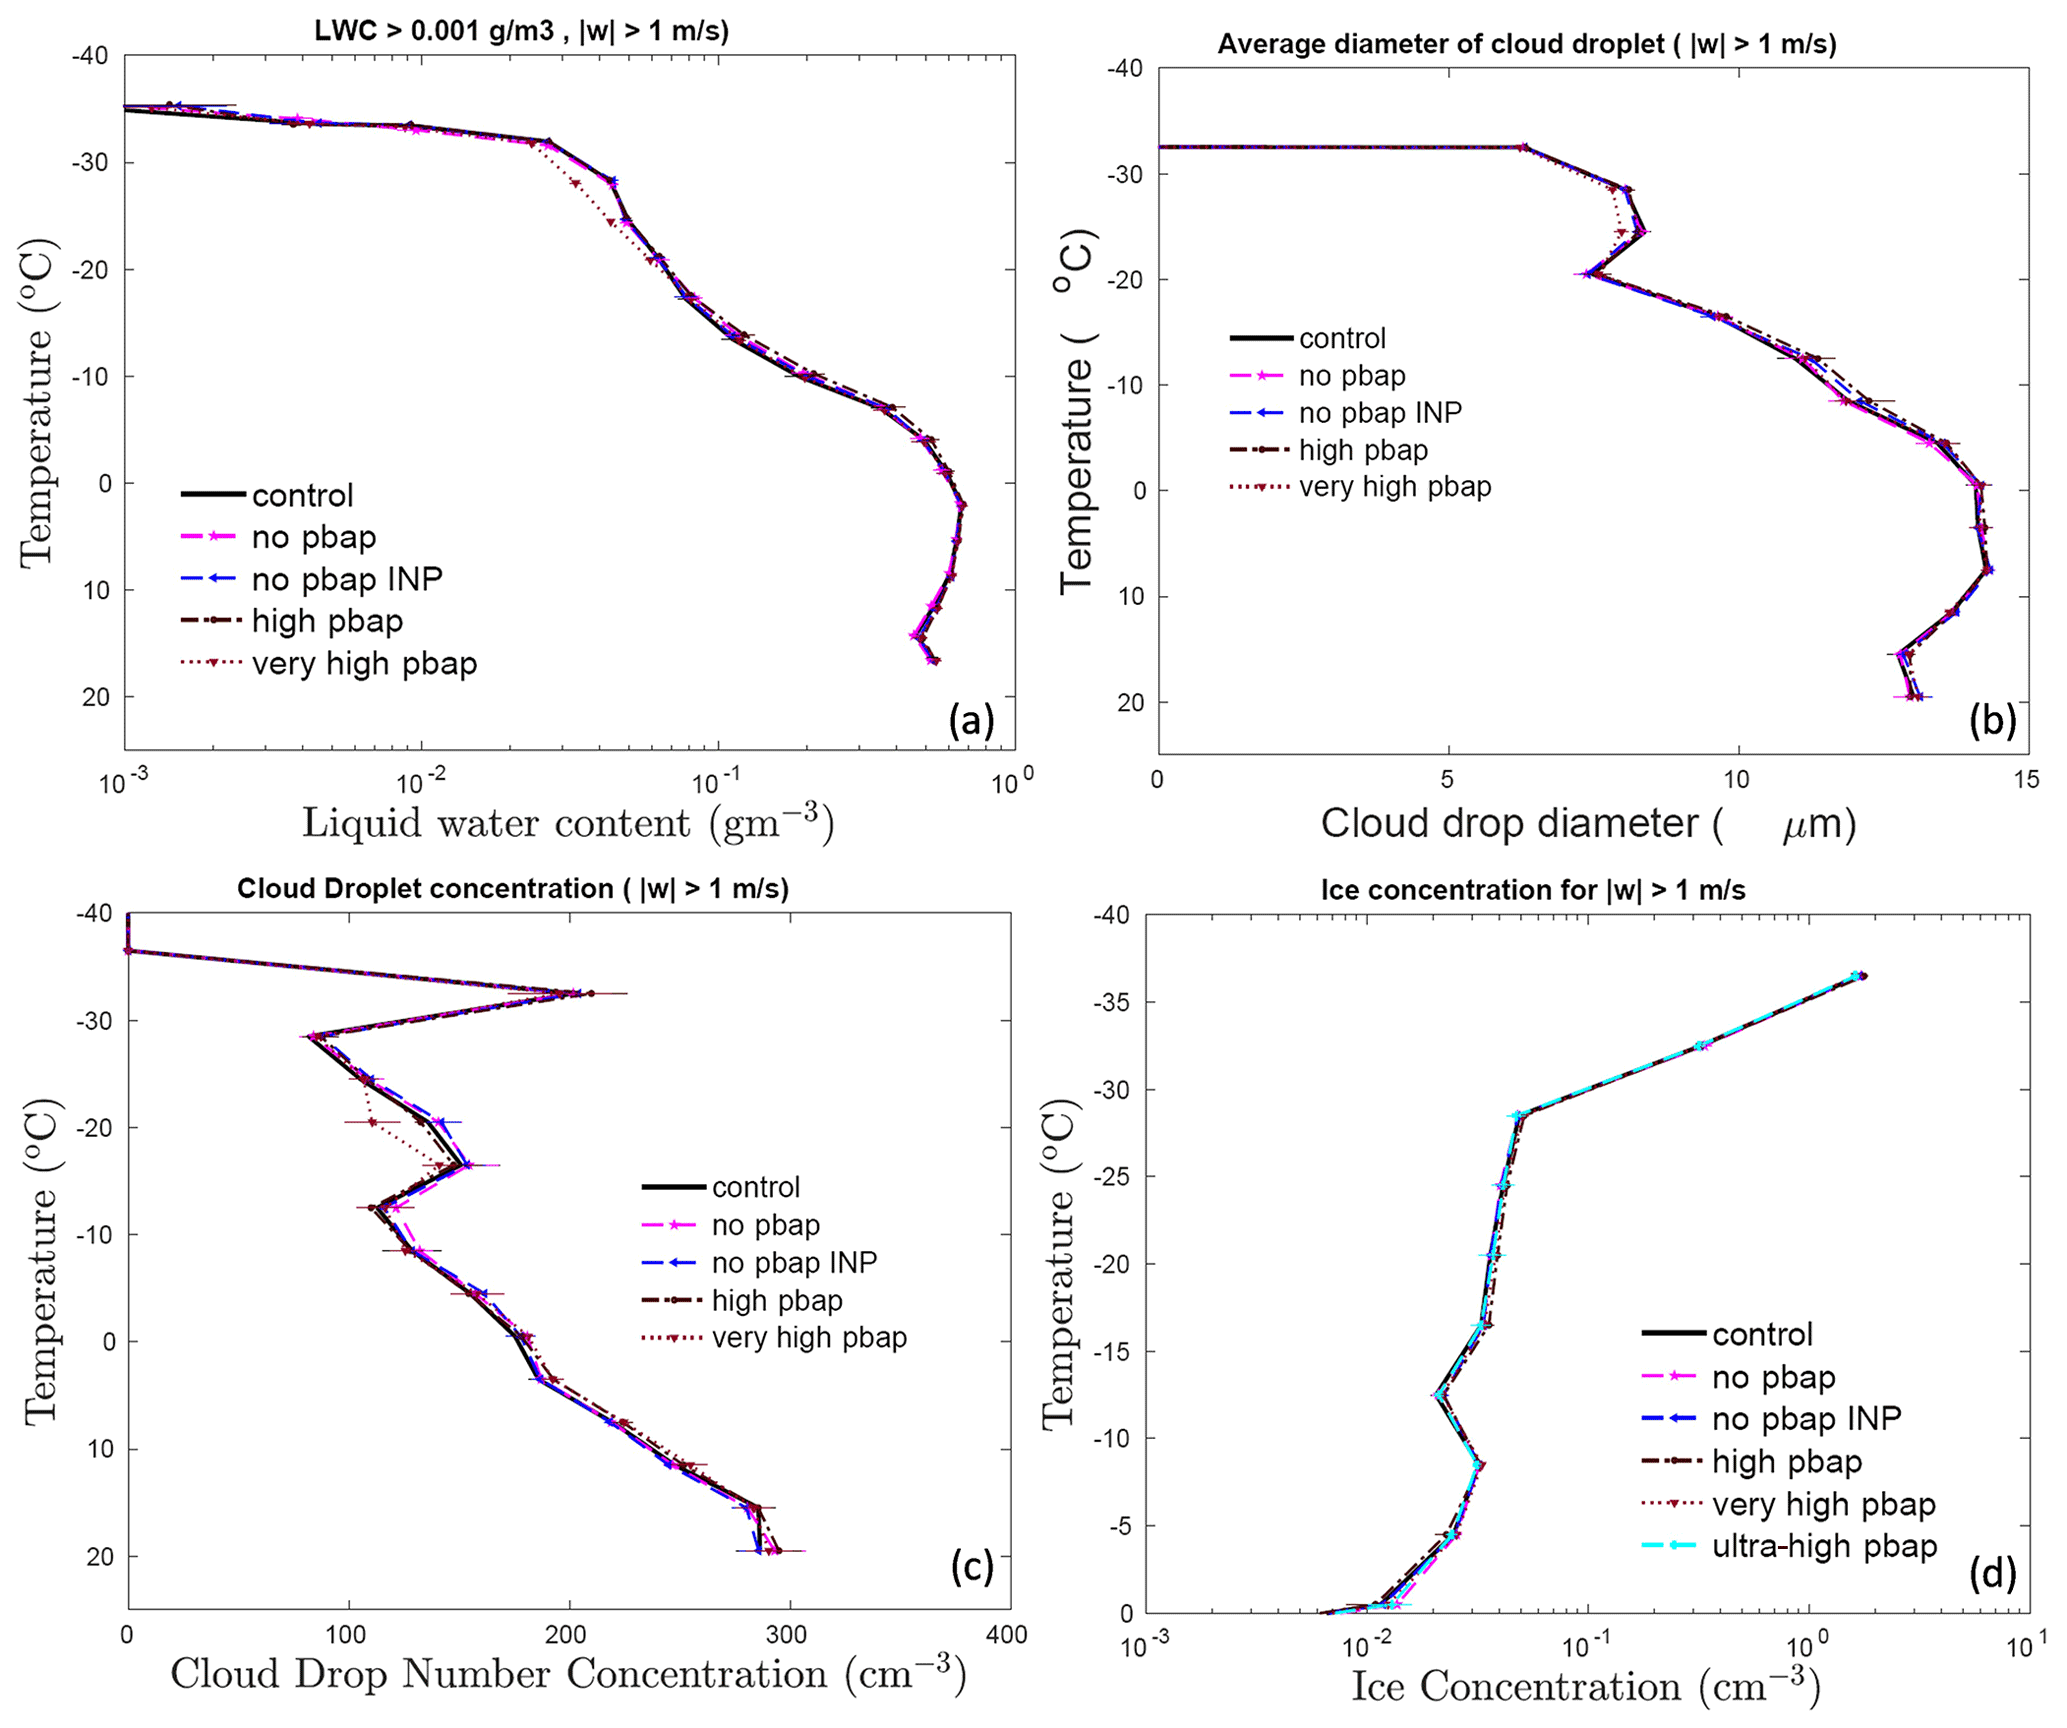
Figure 6The temperature dependence of the (a) liquid water content, the (b) cloud droplet number, (c) the cloud droplet diameter, and the (d) total ice number concentration for control simulation and various sensitivity runs involving a change in total PBAP number concentrations for the convective region. The averaging conditions are mentioned at the top of each figure. The ice number concentration from the ultra-high PBAP is also shown in panel (d). All the vertical profiles shown here are averaged for the whole domain.
Figure 6 reveals the effects of all bioaerosols on cloud properties in the convective region ( m s−1). Overall, changes in cloud microphysical properties, including liquid water content, cloud droplet size, cloud drop number concentration, and ice number concentration, are less sensitive to the changes in PBAPs for the convective part of the simulated clouds and are not statistically significant. The LWC, cloud droplet number, and cloud drop diameter in the perturbed simulations do not differ much (<3 %) from the control run. For the whole storm, considerable changes in the spatial distribution of total ice number concentration are observed due to changes in PBAPs (see Fig. S7). However, vertical profiles showed very small changes in the ice number concentrations. In the convective region, changes in ice crystal number concentration due to changes in PBAPs are negligible (<6 %). This includes the extreme changes in bioaerosol loading (ultra-high PBAP case).
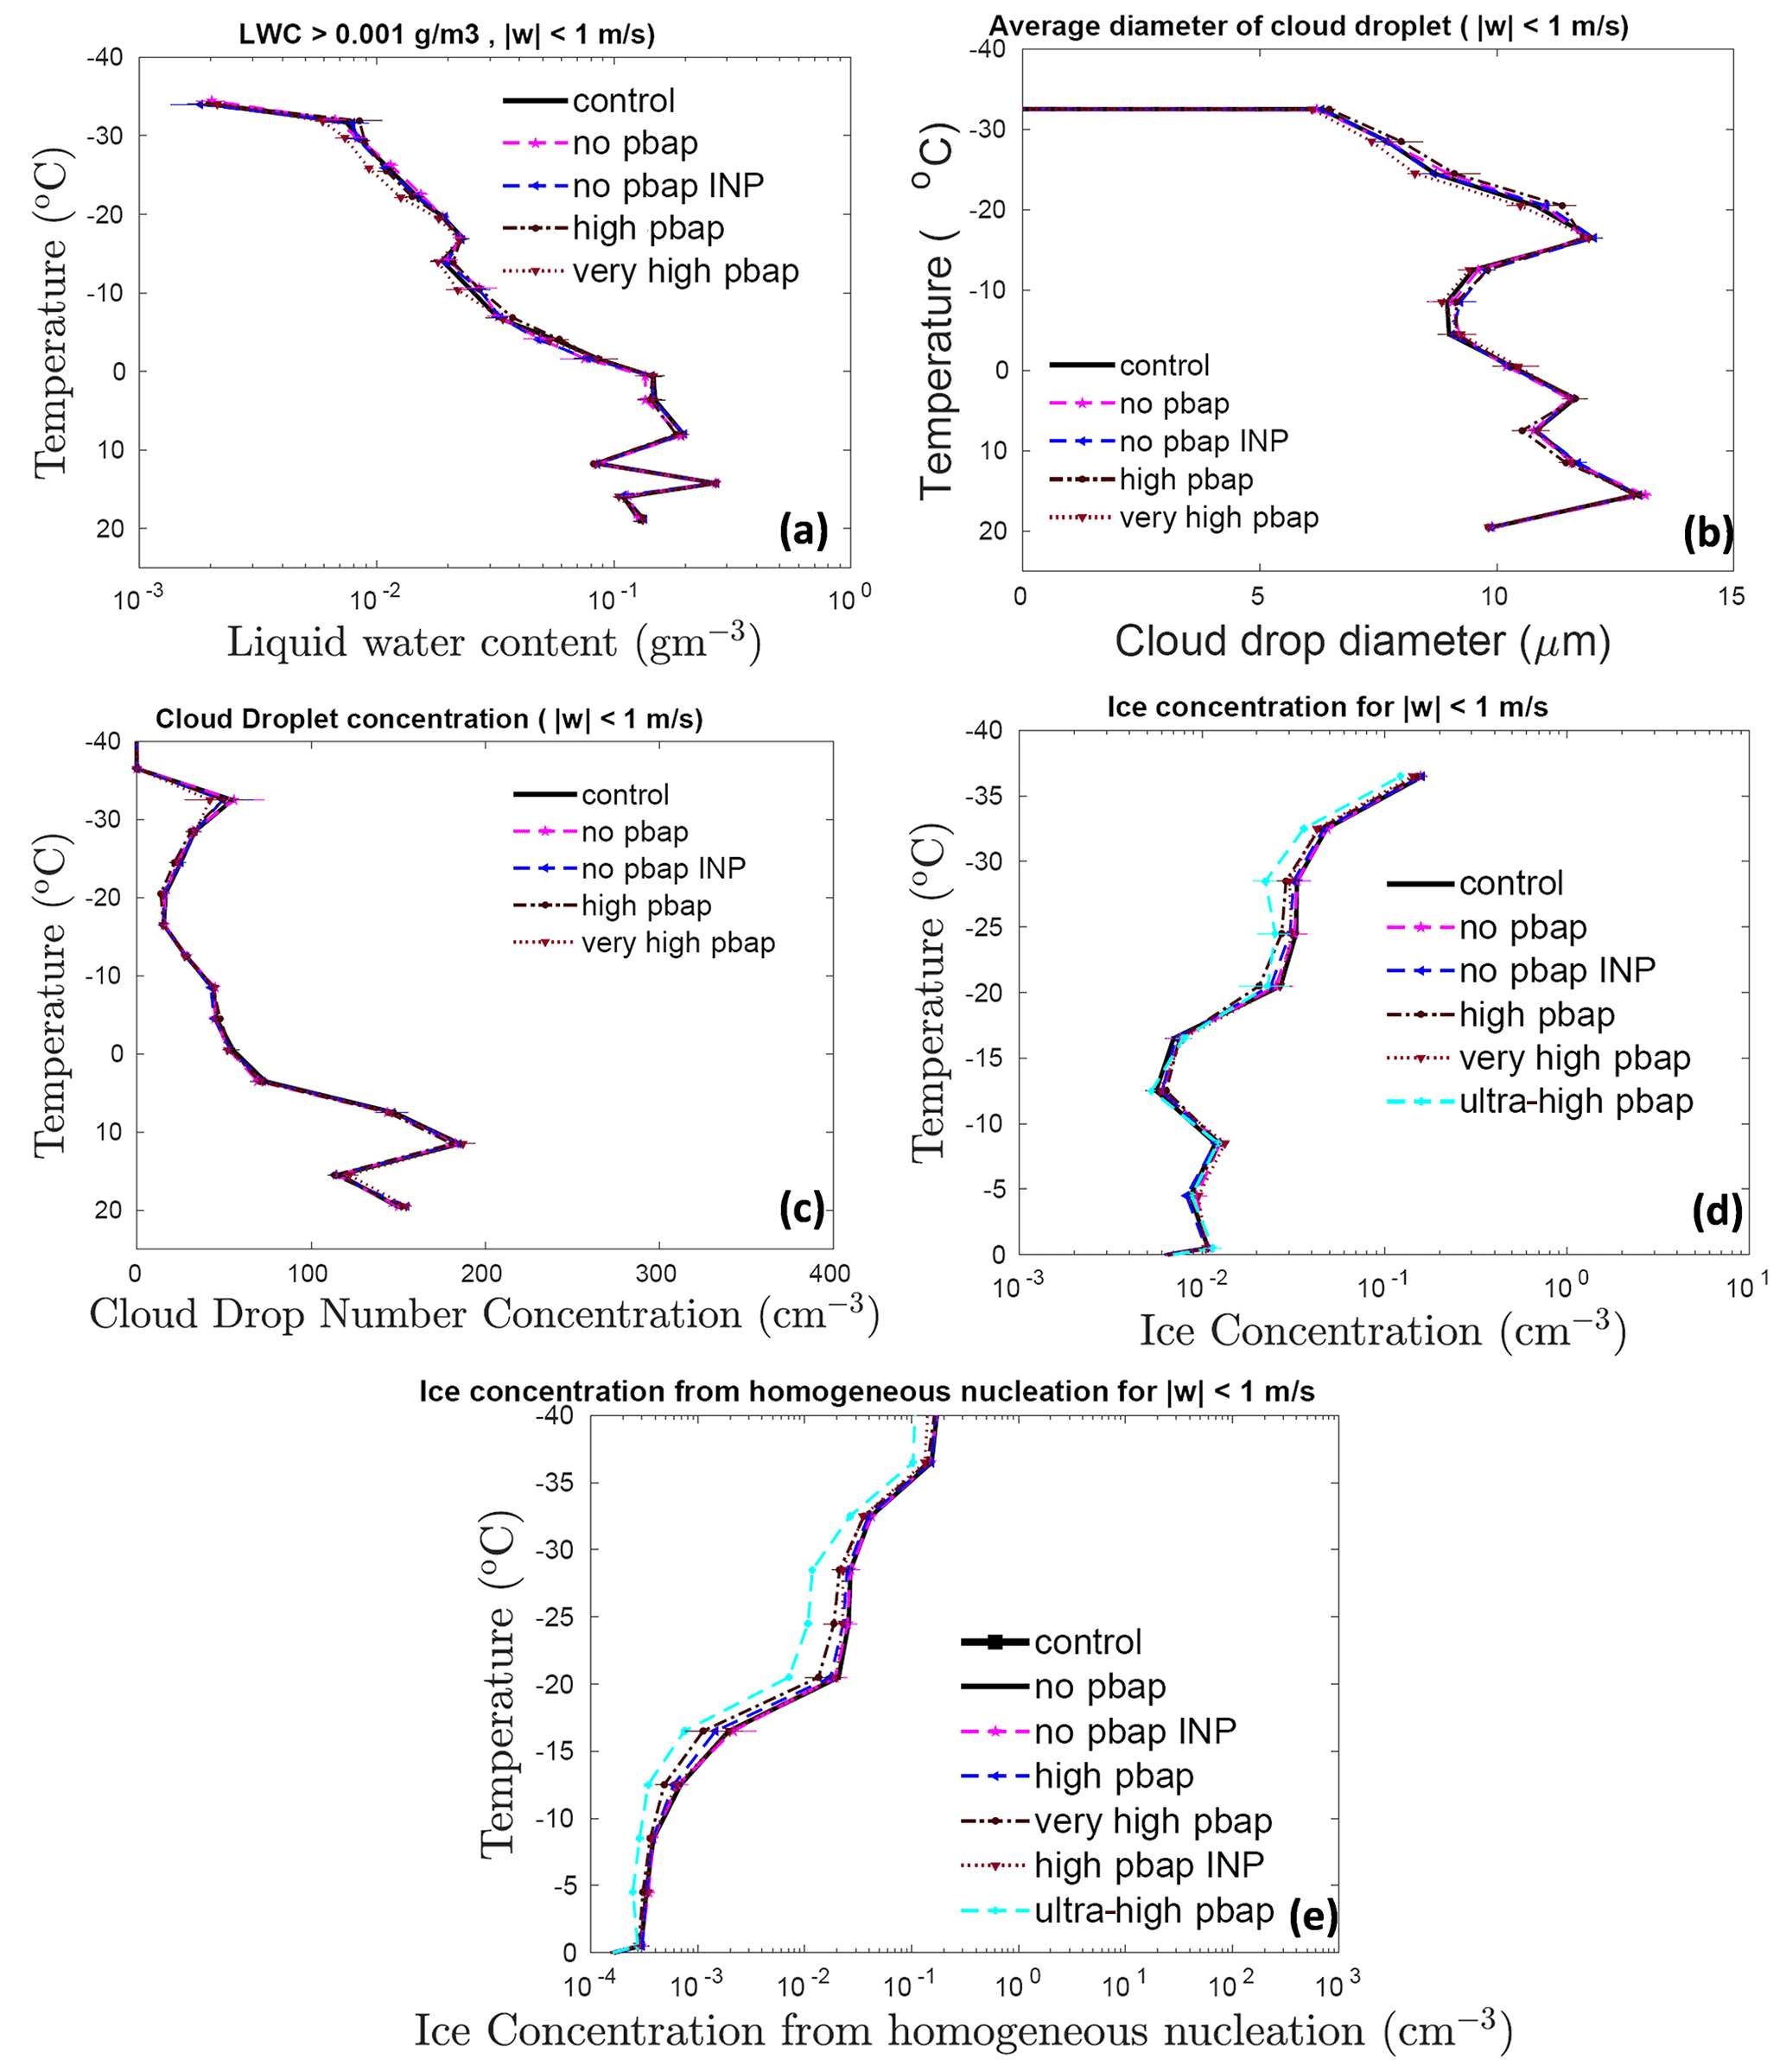
Figure 7The temperature dependence of (a) the liquid water content, (b) the cloud droplet number, (c) the cloud droplet diameter, and the (d) total ice number concentration for the control simulation and various sensitivity runs involving a change in total PBAP number concentrations for in the stratiform region. Also shown is the temperature dependence of (e) ice concentration on homogeneous freezing. The averaging conditions are mentioned at the top of each figure. The total ice number concentration and ice number from homogeneous freezing from ultra-high PBAP are also shown in panels (d) and (e). All the vertical profiles shown here are averaged for the whole domain. The error bars are based on ensemble runs.
Figure 7 shows the corresponding effects in the stratiform region ( m s−1) from all bioaerosols. The changes in warm microphysical properties because of changes in PBAP loadings are smaller than 10 %. In this part of the cloud, the ice microphysical parameters are comparatively more sensitive to the changes in PBAP than in the convective region. The ultra-high PBAP case predicted a ∼40 % lower ice number concentration than the control run. However, these changes in the ice number concentration are not significant as the error bars associated with ensemble members overlap. For the stratiform region, all other simulations considered here showed <10 % change in ice number concentrations compared to the control run. These changes in ice number concentration due to PBAPs are mostly controlled through their effect on homogeneous freezing above the C level, as shown in Fig. 7e, by the tagging tracer for homogeneous nucleation. These ice particles can then advect to lower levels, affecting ice number concentrations in the mixed-phase region.
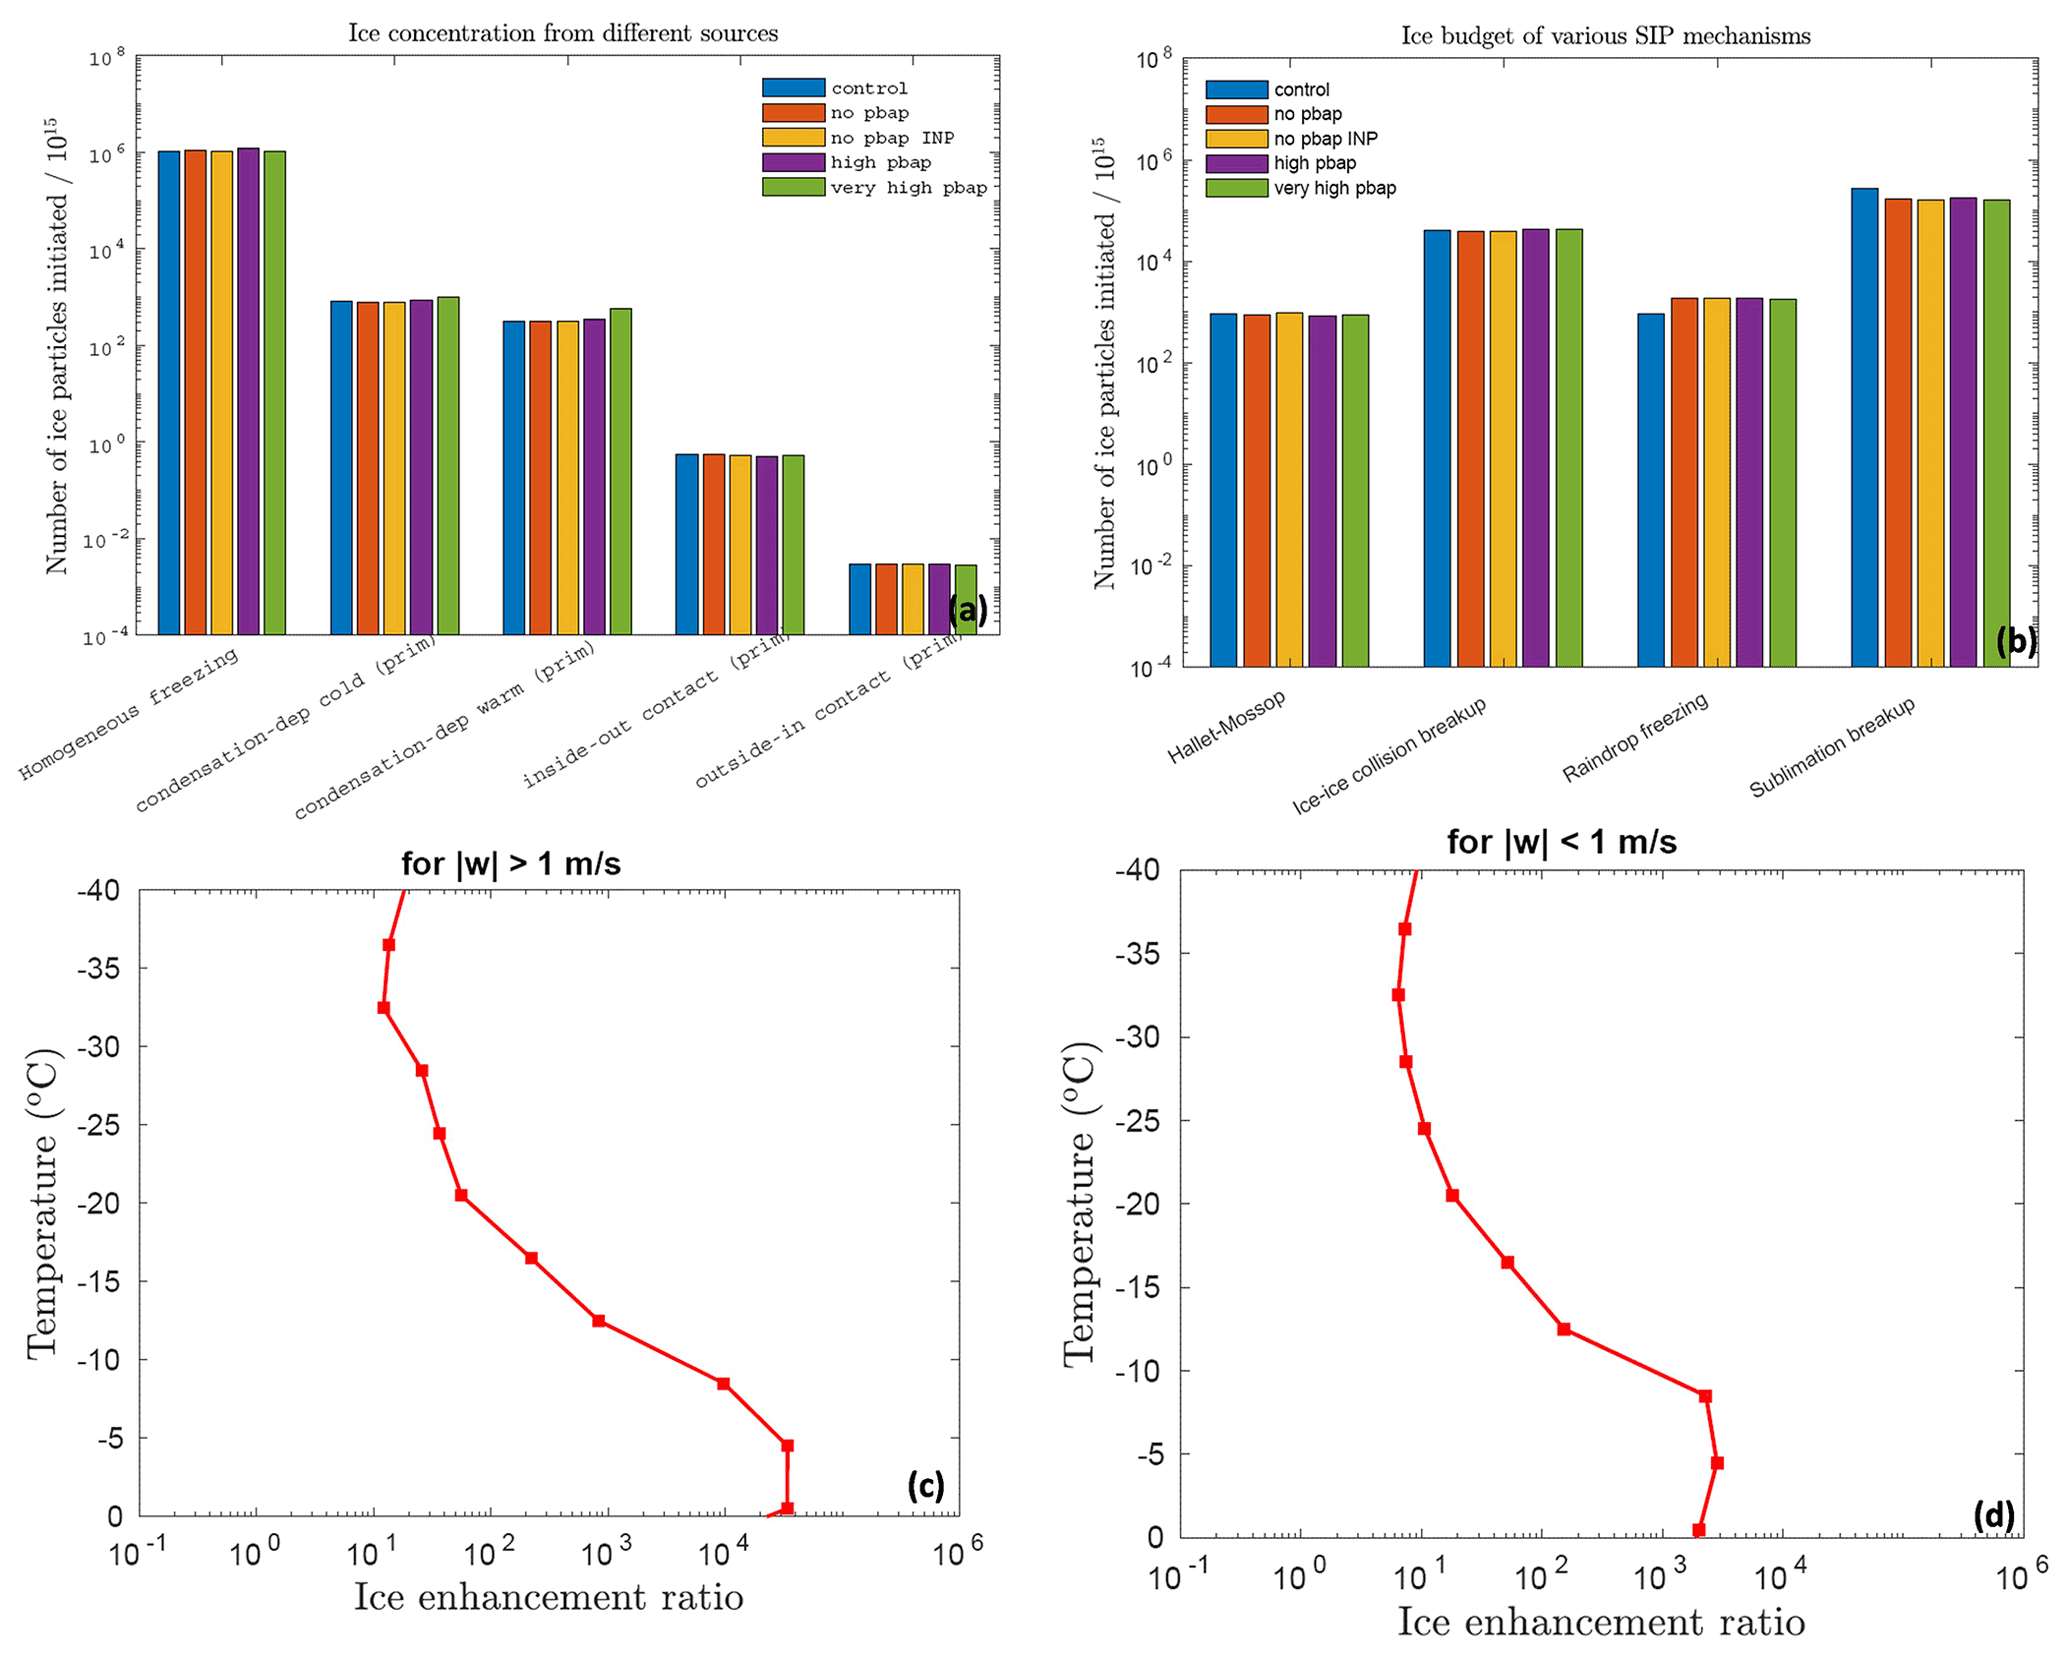
Figure 8The number of ice crystals produced during the whole storm by (a) primary ice nucleation mechanisms and homogeneous freezing, and (b) various SIP mechanisms (as shown in the legend) per 1015 particles are shown for various sensitivity runs. The ice enhancement ratio for the convective and stratiform regions is shown in panels (c) and (d).
Figure 8 shows the number of ice particles generated by homogeneous nucleation, various mechanisms of primary nucleation (Fig. 8a), and secondary ice production (Fig. 8b) per 1015 ice particles for the entire storm. Homogeneous freezing dominates the ice production among the three broad types of ice formation mechanisms (heterogeneous and homogeneous ice nucleation and SIP). The maximum changes in ice nucleated through the primary ice mechanism are noticed for the very high PBAP case and can be attributed to the 100-fold increase in all PBAP loading. The very high PBAP simulation predicted a 15 % lower number of homogeneously nucleated ice than the control run. The very high PBAP cases predicted about 80 % more primary ice crystals formed at temperatures warmer than C. At temperatures colder than C, this case predicted 20 % more primary ice crystals than the control run. The very high PBAP case showed an increase in primary heterogeneous ice and a decrease in primary homogenous ice. Since the contribution of primary homogenous ice nucleation is much higher in determining the total ice number concentration when compared with primary homogeneous nucleation, the overall effect of the very high PBAP case is a decrease in total ice number concentration as shown in Fig. 7 and Table S4. However, at temperatures warmer than C, the ice number concentration in the very high PBAP case was comparable with the control run (Table S5).
Figure 8b shows that, among SIP mechanisms, the contributions of ice–ice collision breakup and sublimation breakup are higher by an order of magnitude than the HM process and raindrop fragmentation. However, the budget analysis (not shown in the plot) showed that about 75 % of the fragments associated with sublimation breakup are prone to evaporation, making the ice–ice collision breakup a major SIP mechanism. The estimated ice enhancement ratio, which is a ratio between the number concentrations of total ice (excluding homogeneous nucleation) and primary ice, is shown in Fig. 8c and d for convective and stratiform regions, respectively. Overall, the ice enhancement ratio varied between 10 to 104, which indicates the importance of SIP mechanisms. The budget analysis shows that, overall, the perturbations in bioaerosols resulted in very small changes (with a maximum change of <40 %) in ice generated by SIP mechanisms.
The role of PBAPs in altering radar reflectivity and surface precipitation was limited and described briefly in the Supplement (Fig. S8). The overall effect of PBAPs on accumulated surface precipitation was minimal (<4 %; Fig. S8 and Table S4). In addition, the changes in PBAPs do not show a significant impact on shortwave and longwave radiation fluxes and cloud fractions, as discussed in the Supplement (Fig. S9).
Various sensitivity experiments were conducted to evaluate the role of SIP mechanisms in determining micro- and macrophysical parameters of the clouds (see Table S3). SIP through sublimation breakup and breakup in ice–ice collisions were switched off in the no sublimation breakup and no collisional ice–ice breakup simulations, respectively. In the no secondary case, no SIP mechanisms were active.
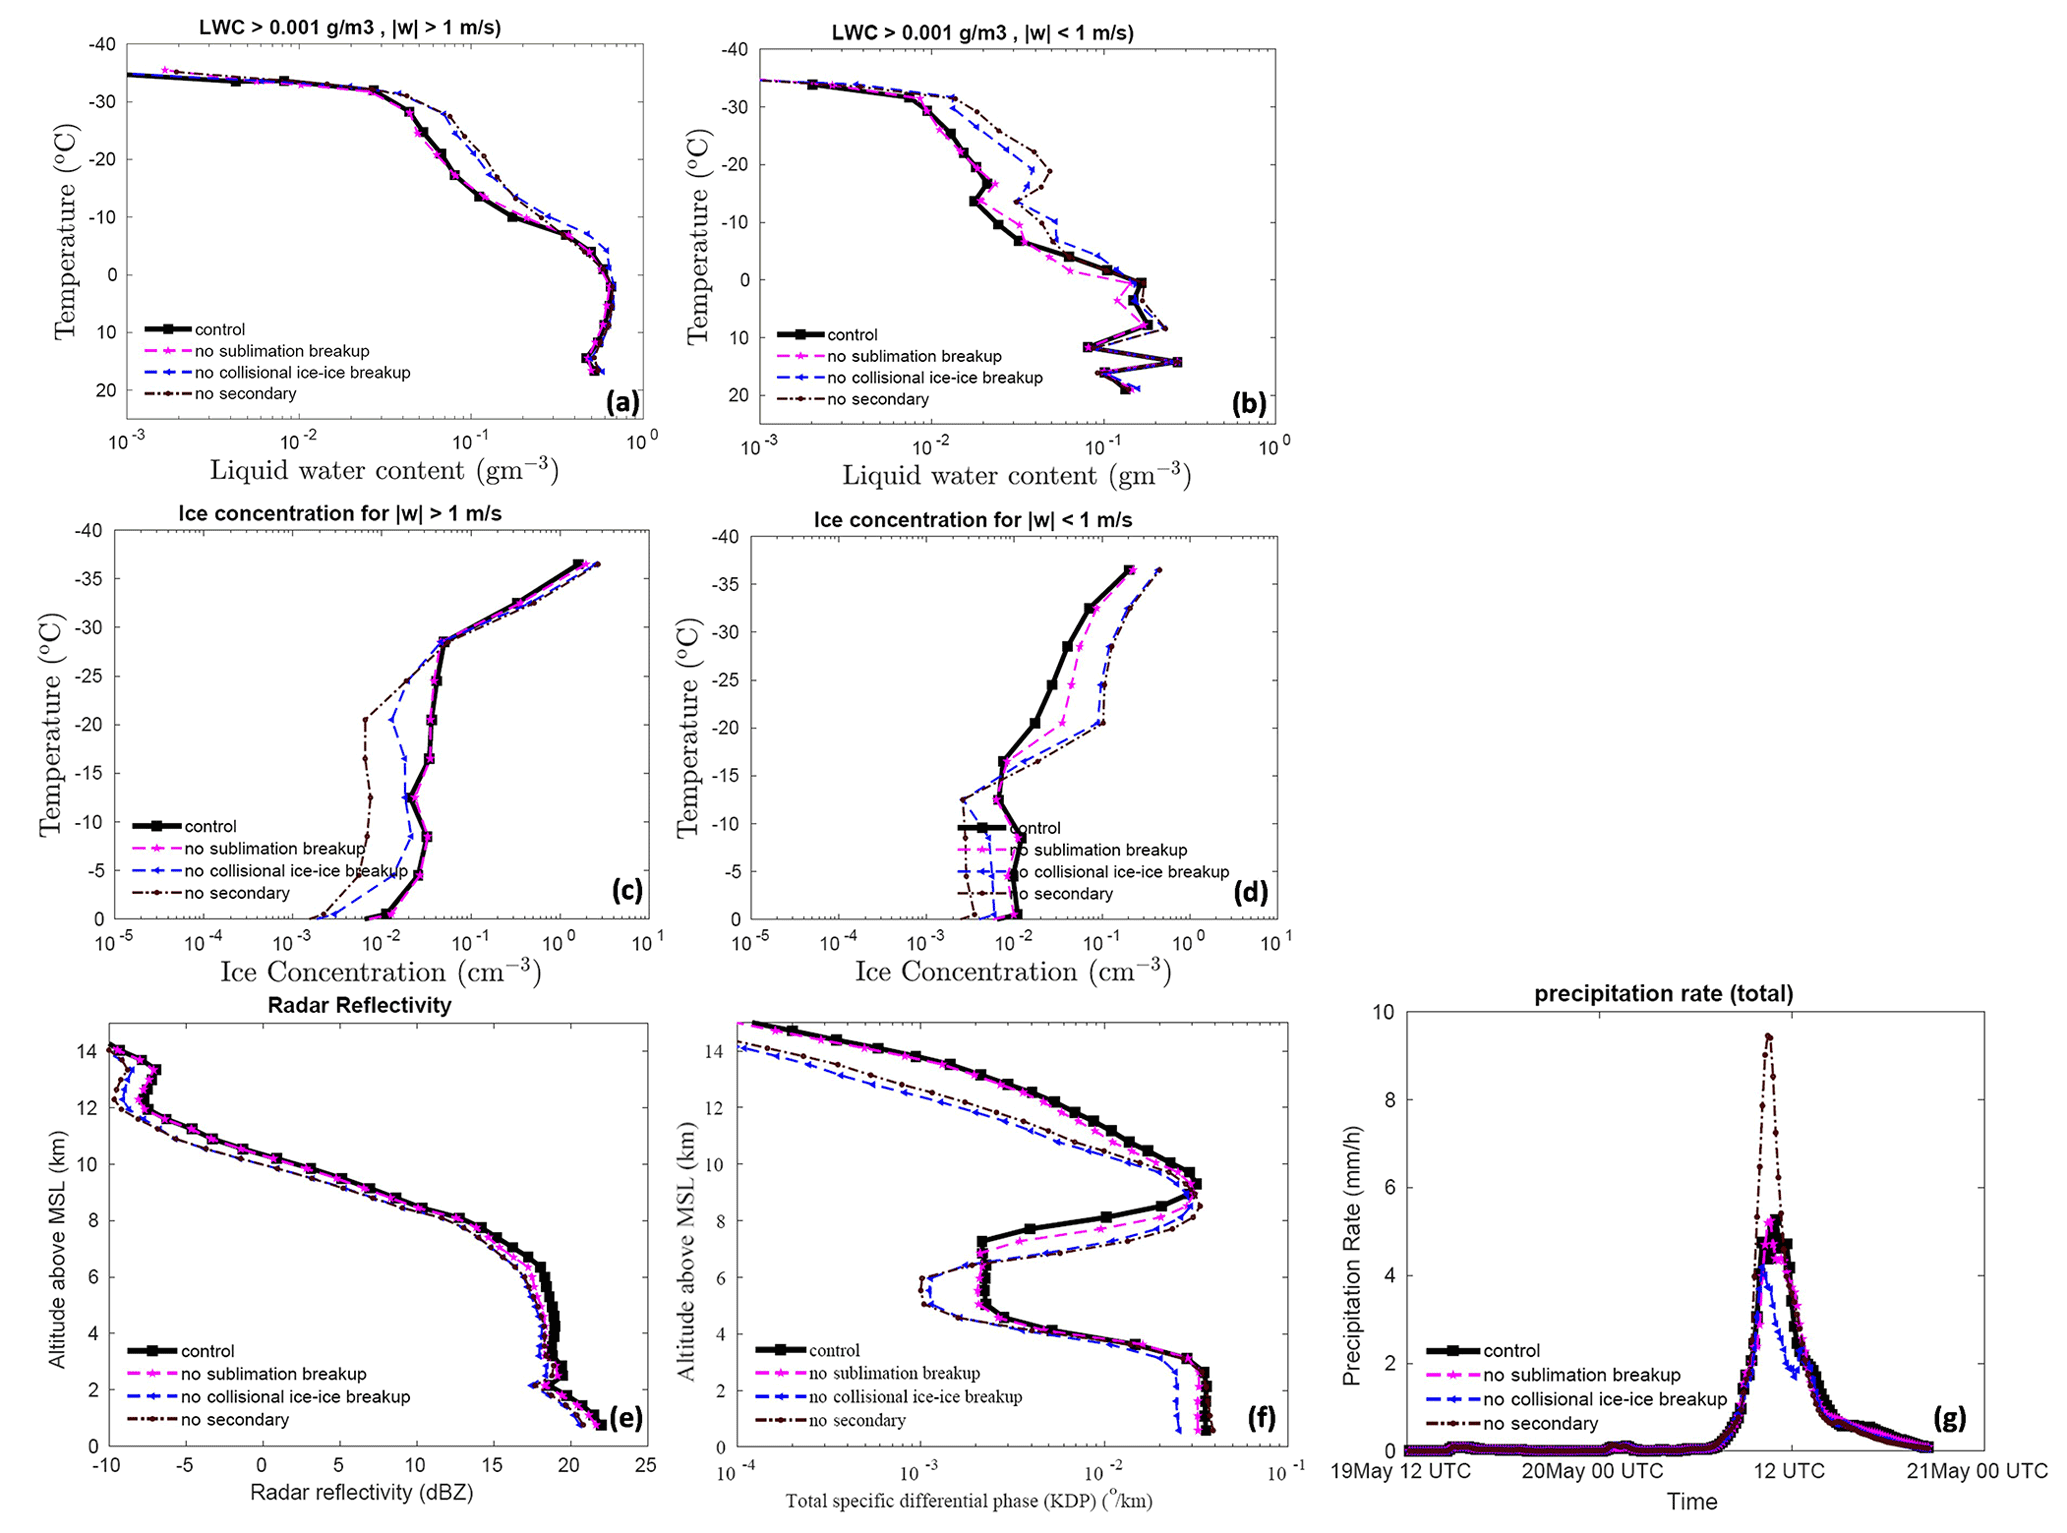
Figure 9Temperature dependence of the liquid water content in (a) the convective and (b) the stratiform region for the control simulation and various sensitivity runs involving SIPs. The ice number concentration is also shown for the (c) convective and (d) stratiform regions. The averaging conditions are mentioned at the top of each figure. The vertical profiles of (e) radar reflectivity and (f) total specific differential phase are also shown for the same simulations. (g) The temporal evolution of the total surface precipitation rate averaged over the domain is also shown. All the vertical profiles shown here are averaged for the whole domain.
The results from these sensitivity experiments are shown in Fig. 9 for the convective and the stratiform region of the simulated cloud. Overall, in the convective region, the no secondary and no collisional ice–ice breakup cases predicted 5 % and 12 % higher LWC, respectively, than the control run (see Table S4). In the stratiform region, these cases predicted ∼25 % higher LWC than the control run. Lower ice number concentrations due to the absence of SIP mechanisms may reduce the rate of conversion of liquid to ice via mixed-phase processes, resulting in a higher LWC.
In the convective part, the absence of any SIP increased the ice number concentration by half an order of magnitude at temperatures warmer than C. Comparing the no SIP and control cases, the effect of the inclusion of SIP mechanisms is to increase the average ice concentration by up to half an order of magnitude at temperatures warmer than C in the stratiform region. For the stratiform region, at temperatures colder than this, the absence of SIP mechanisms resulted in higher ice number concentrations by a similar magnitude. These changes at the colder levels are associated with homogeneous droplet freezing. The changes in ice number concentration in the no collisional ice–ice breakup case are comparable with the no secondary case. Compared to break up in ice–ice collisions, the sublimation breakup has a lower impact (<40 %) on the total ice number concentration in both the convective and stratiform regions.
The changes in simulated radar reflectivity, total specific differential phase, and surface precipitation rate with SIP mechanisms are shown in Fig. 9e, f, and g, respectively, for the whole storm. Overall, the simulated radar reflectivity was 1 dBZ lower in the no SIP and no collisional ice–ice breakup case than in the control run and can be attributed to the overall increase in ice number concentration in the control run.
The no sublimation case predicted slightly higher reflectivity than the control run. The absence of all SIPs resulted in about a 100 % decrease in the KDP at a temperature colder than C. Between −10 and C, the absence of no collisional breakup and no secondary resulted in higher KDP (half an order of magnitude) values than the control run. The absence of all SIP mechanisms results in a higher surface precipitation rate (75 %) during the peak rainfall hour, which occurs around 11:30 UTC compared to the control run. In a previous study, Phillips et al. (2017b) have shown that SIP through ice–ice collision breakup can reduce accumulated surface precipitation in the simulated storm by 20 %–40 %. They attributed it to the increase in snow particles competing for available liquid and the reduction in their growth by riming. It resulted in smaller ice particles and a reduction in surface precipitation.
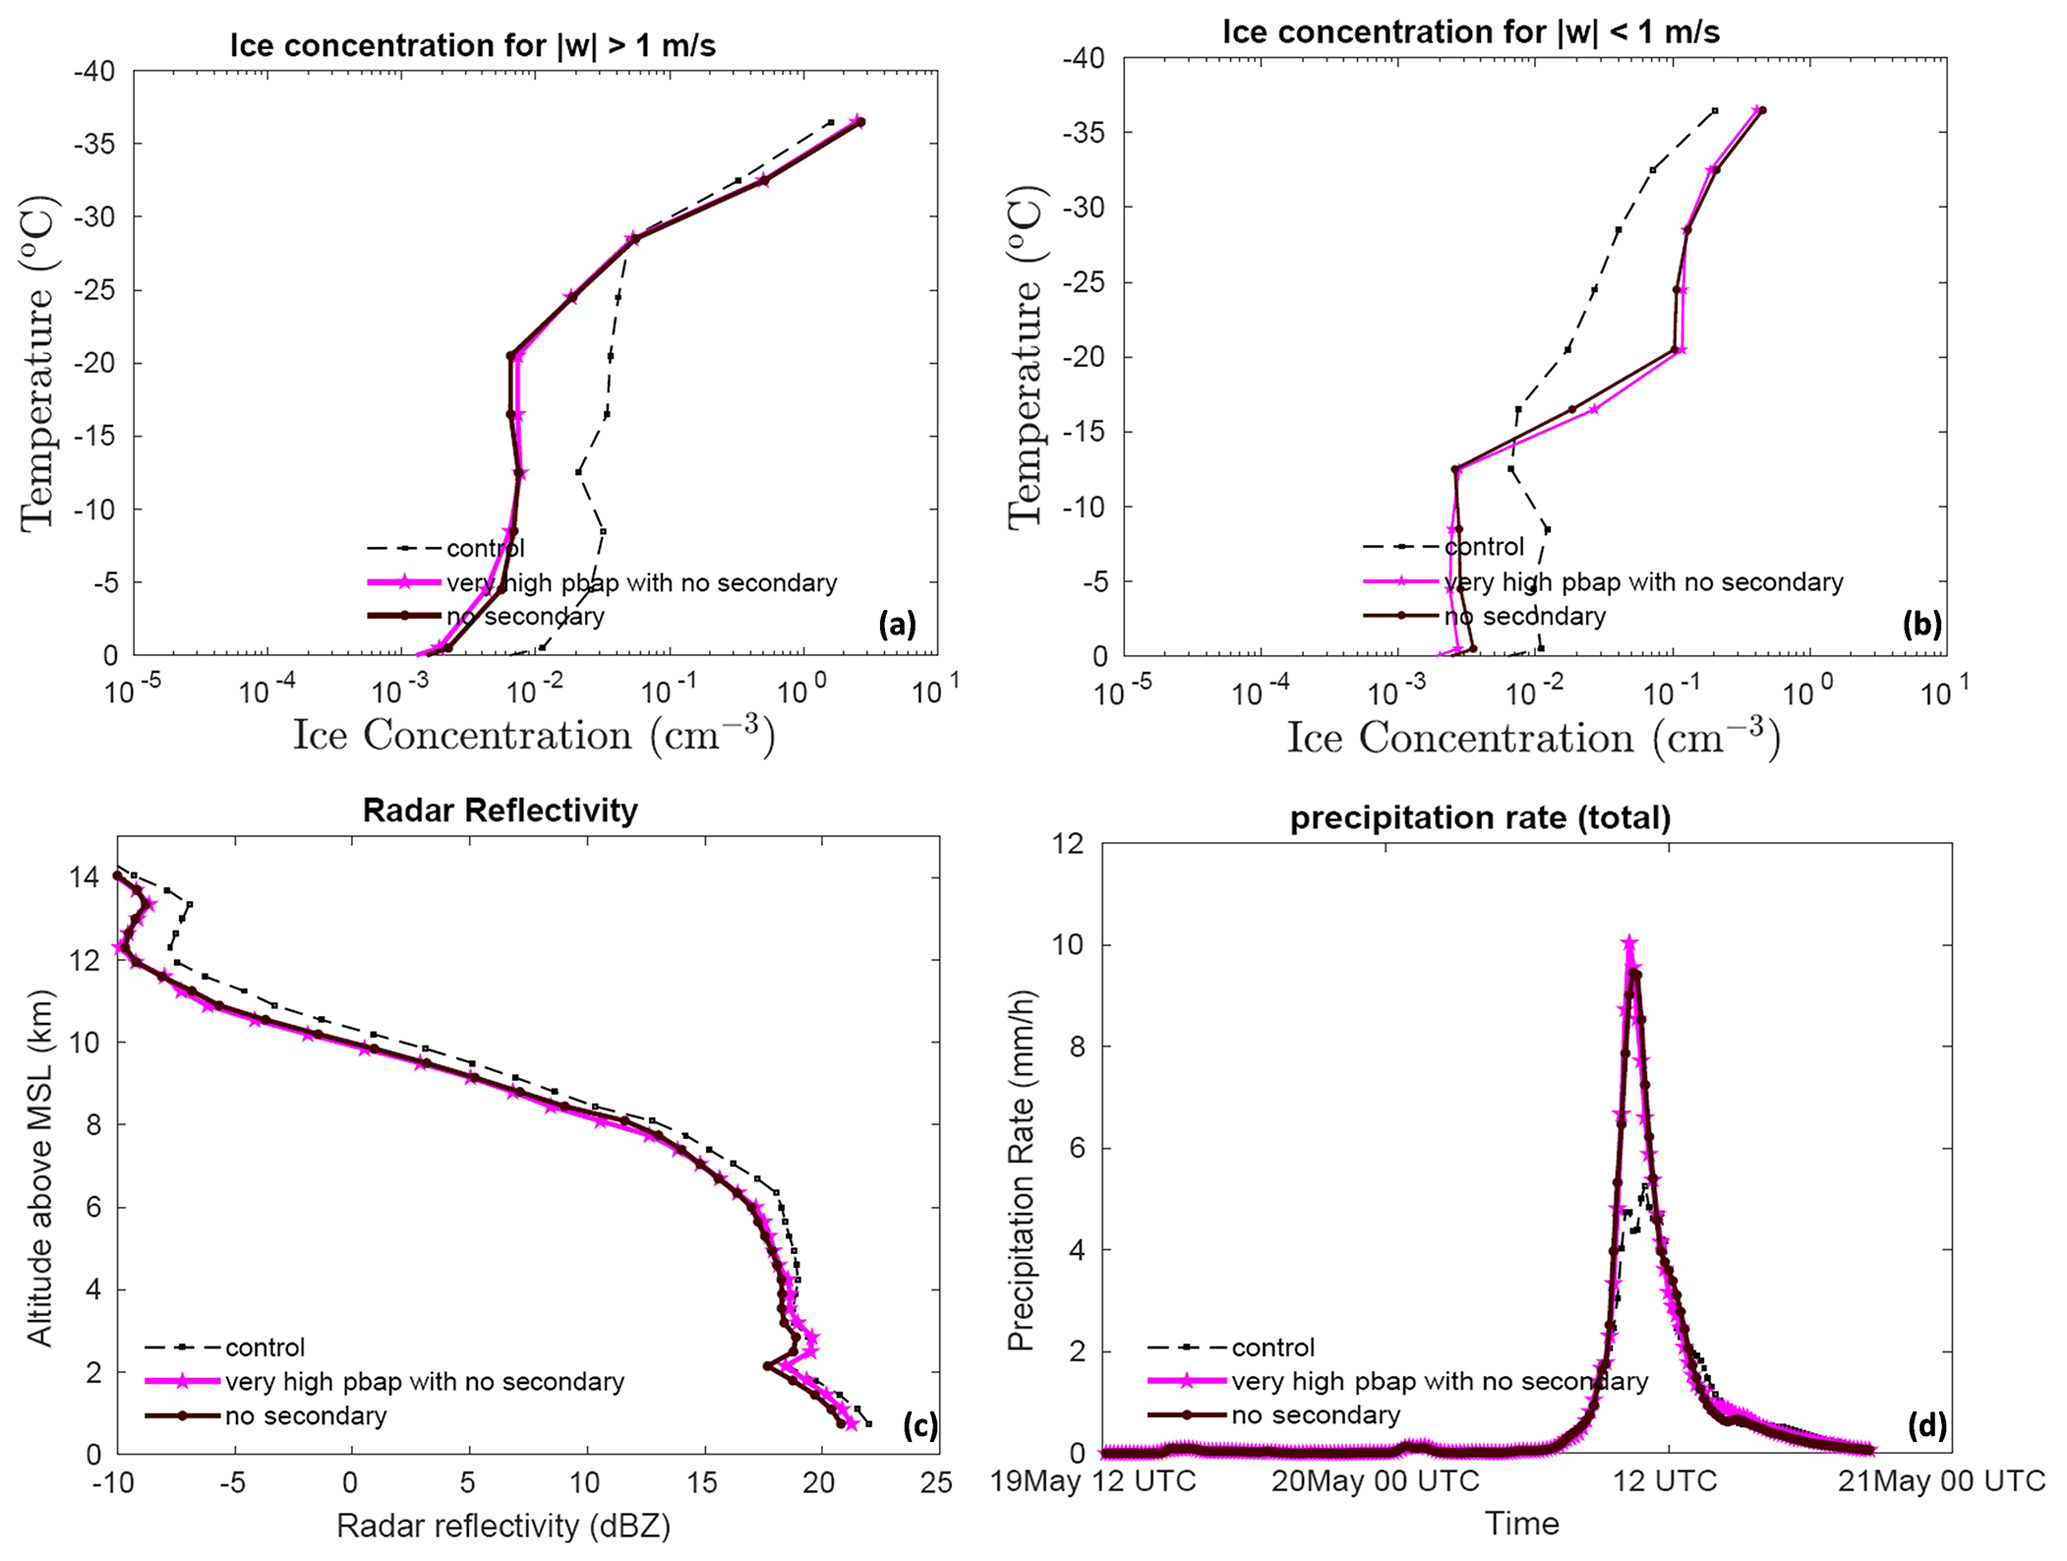
Figure 10The temperature dependence of the ice number concentration for the control, very high PBAP with no SIP, and no SIP simulations averaged for (a) convective and (b) stratiform regions. The (c) vertical profile of the radar reflectivity and the temporal evolution of the (d) surface precipitation rate are shown for the entire simulation. All the vertical profiles shown here are averaged for the whole domain.
To investigate the role of PBAPs in altering cloud microphysical properties through SIP mechanisms, an additional simulation was performed by eliminating all secondary ice processes from the control run and multiplying the initial loading of all PBAP groups by a factor of 100 (the very high PBAP with no SIP case). The results of this simulation are then compared to the no SIP case, as shown in Fig. 10.
In the absence of any SIP mechanisms, the 100-fold increase in bioaerosols resulted in minimal effect on ice number concentration. Overall, without SIP, the increase in bioaerosol loading by 100-fold resulted in a less than 5 % change in the ice number concentration. This indicates that the ice produced by various SIP mechanisms does not alter the effect of bioaerosols on the ice number concentration in the simulated clouds. The changes in simulated radar reflectivity due to a 100-fold increase in bioaerosols are negligible (<0.5 %; Fig. 10c). The difference in the predicted surface precipitation rate and accumulated precipitation between very high PBAP with no secondary and no secondary cases was lower than 3 %.
In total, rive PBAP groups have been implemented in the mesoscale AC model to predict their ice nucleation activity based on the empirical formulation by PT21. The simulated concentrations of major PBAPs, including fungi and bacteria, are of the same order of magnitude as results from previous modeling studies (Després et al., 2012; Hoose et al., 2010b). Still, the relative abundance of PBAP groups over the simulated region is unknown due to the lack of measurements. The AC model was run with a higher resolution (2×2 km), compared to previous studies on a global scale (Hoose et al., 2010b), to investigate the potential impact of variations in PBAP concentration on the properties of the simulated squall line events more clearly.
Yet the control simulation is not perfectly accurate in all respects. In the stratiform region between −10 and C, the predicted ice number concentration was lower than that observed by aircraft by half an order of magnitude and in fair agreement at temperatures warmer than C. This uncertainty factor is similar to the uncertainty in the measurements due to various biases (e.g., Field et al., 2006). Nevertheless, all other simulated cloud microphysical parameters, radar reflectivity, and the surface precipitation rate were in acceptable agreement with aircraft and ground-based observations.
In the control simulation, the average ice concentration above −30 and C levels is dominated by the downwelling of homogeneously nucleated ice from above the mixed-phase region in convective and stratiform clouds, respectively. Below both levels, SIP prevails. Both processes of ice initiation (homogeneous freezing and SIP) have only weak sensitivity to PBAPs and, hence, the weakness of the impact on simulated cloud glaciation.
Based on the sensitivity experiments, it can be concluded that PBAP INPs have only a limited effect on the average state of the ice phase of the simulated clouds of this mesoscale convective system. Most of the changes in ice number concentration associated with changes in PBAPs are controlled by their effects on homogeneous nucleation and SIPs. The lower dependence of simulated ice number concentration on changes in PBAPs is consistent with the findings of Hummel et al. (2018). Based on ensemble simulations of the regional atmospheric model for Europe, they showed that the changes in the average ice crystal concentration by biological INPs are very small and are not statistically significant, implying that PBAPs play only a minor role in altering the cloud ice phase. The limited effect of PBAPs on cloud properties on a global scale has been highlighted in previous studies (Hoose et al., 2010b; Sesartic et al., 2012, 2013; Spracklen and Heald, 2014).
The weakness of the simulated impact from realistic PBAP fluctuations is explicable mostly in terms of the low contribution from biological ice nucleation compared to non-biological INPs to the overall ice initiation. In terms of ice nucleation efficiency and onset temperatures, each PBAP group has different ice nucleation properties. Based on vertical profiles of active INPs (Fig. 4), the overall contribution of activated INPs from all PBAP groups to the total active INPs was ∼1 %. At C, temperature, the active INPs from dust and black carbon was 1 order of magnitude higher than PBAP INPs. At C, the predicted INPs from dust and black carbon were higher by 1 and 2 orders of magnitude, respectively, than PBAP INPs. The dust and black carbon INPs activated at these temperatures can be advected down to the levels where PBAP INPs are most important. Overall, this resulted in low sensitivity of the average ice phase to the changes in bioaerosol loading.
The ice production in the simulated cloud system at levels in the mixed-phase region (0 to C) is largely controlled by various SIP mechanisms, of which the most important is the breakup in ice–ice collisions. Some of these processes are active at temperatures warmer than C (e.g., the HM process), where PBAP INP are important and expected to enhance the biological ice nucleation. However, our results showed that the ice production associated with SIP mechanisms is less sensitive to the initial PBAP loading because SIP causes a positive feedback of ice multiplication with ice fragments growing to become precipitation-sized particles that then fragment again.
In our study, a 100-fold increase in PBAPs leads to a <4 % change in surface precipitation. Using mesoscale model simulations, Phillips et al. (2009) reported a 10 % increase in accumulated surface precipitation associated with deep convective clouds due to a 100-fold increase in biological particles. Phillips et al. (2009) also noted an effect (up to 4 %) on surface shortwave and top-of-atmosphere (TOA) longwave radiation flux because of changes in PBAP number concentration. In our study, the changes in PBAP loading caused smaller changes in simulated shortwave and longwave fluxes (<3 %). Sesartic et al. (2012, 2013) showed that including fungi and bacteria in the global climate model leads to minor changes (<0.5 %) in the ice water path, total cloud cover, and total precipitation.
It should be noted that the sensitivity experiments carried out in the current study are limited to the small domain (80×80 km domain) representing a limited area of the global ecosystem. Also, the model top was located at 16 km, and it may not represent the whole atmosphere. The results presented here are based on a mesoscale model and may not represent the global impact of PBAPs on clouds.
A framework describing the ice nucleation activity of five major groups of PBAPs, including fungal spores, bacteria, pollen, viral particles, plant/animal detritus, algae, and their respective fragments, was provided by PT21. The ice nucleation activity of these major PBAP groups in the EP was based on samples from the real atmosphere. The present study implements this EP in AC and investigates the role of these five PBAP groups as INPs in deep convective clouds. The high-resolution (2 km horizontally) simulations over a mesoscale 3-D domain (80 km wide) using AC elucidate the impact of these PBAP groups on the cloud properties. A series of sensitivity experiments were conducted to test the impact of PBAP groups on cloud properties.
A midlatitude squall line that occurred on 20 May 2011 during MC3E over the USA Southern Great Plains is simulated with the model. The simulated number concentration of ice particles showed good agreement (to within about 50 %) with aircraft observations for the convective clouds within the mesoscale system. In the stratiform region between −10 and C, the model-predicted ice number concentration was lower than the aircraft observation by half an order of magnitude and in fair agreement at temperatures warmer than C. Various sensitivity experiments were carried out by perturbing the initial PBAP loading and by altering various SIP mechanisms.
Each PBAP group has diverse properties, including its shape, size, and abundance in the atmosphere. A small fraction of PBAPs is found to be ice nucleation active and can therefore act as PBAP INPs. The relative contribution of each PBAP within the total PBAPs may vary from one ecosystem to another. In the current study, their relative contribution is based on previous observations from Amazonia and can be considered as the main limitations of this study. However, the simulated number concentrations of major PBAPs, including fungi and bacteria, look reasonable and are close to their typical abundance in the atmosphere.
Any perturbation in the PBAP concentration by factors up to 1000 assumed in the current study resulted in maximum changes in the ice number concentration by <6 % in the convective region and by <40 % in the stratiform region with respect to the control run. The simulations showed that the simulated ice particle number concentration is much higher than the number concentrations of PBAP INPs. Even at temperatures warmer than C, where PBAP INPs are thought to be the most important INP, ice crystals originating from the primary heterogeneous nucleation of dust and black carbon from higher levels of the cloud frequently perturb the lower levels due to sedimentation. The major ice formation comes from SIP mechanisms and homogeneous nucleation and both are less sensitive to the changes in PBAPs. Therefore, PBAP INPs do not show a significant impact on the average ice phase of the simulated storm.
PBAPs have a minimal effect on the warm microphysical properties of simulated clouds. The effect on liquid water content and cloud droplet number concentration was lower than 10 % in both convective and stratiform regions. Since both ice and warm microphysical processes are less sensitive to PBAPs, surface precipitation is not significantly affected by changes in PBAPs. A 100-fold increase in all PBAPs resulted in less than a 5 % change in surface precipitation.
Data and the code for the empirical formulation of PBAPs are available on request by contacting the corresponding author.
The supplement related to this article is available online at: https://doi.org/10.5194/acp-22-12055-2022-supplement.
VTJP designed and monitored this study. SP conducted model simulation, did most of the data analysis, and wrote the initial draft. All authors contributed to the scientific discussion and model development.
The contact author has declared that none of the authors has any competing interests.
Publisher’s note: Copernicus Publications remains neutral with regard to jurisdictional claims in published maps and institutional affiliations.
We would like to thank the three anonymous reviewers and the editor for their insightful comments and suggestions.
This work has been completed as part of a sub-award (grant no. 2019-26-03) to Vaughan T. J. Phillips from a U.S. Department of Energy (DoE) direct grant to Alexander Ryzhkov at the University of Oklahoma (grant no. DE-SC0018967). Sachin Patade has also been supported by a past award from the Swedish Research Council (VR), which concerns modeling bio-aerosol effects on glaciated clouds (grant no. 2015-05104), and Sweden's Innovation Agency (Vinnova; grant no. 2020-03406). Other co-authors have been supported by a current award from the Swedish Research Council for Sustainable Development (FORMAS; grant no. 2018-01795) and the U.S. Department of Energy Atmospheric Sciences Research Program (grant no. DE-SC0018932).
This paper was edited by Hinrich Grothe and reviewed by three anonymous referees.
Bauer, H., Kasper-Giebl, A., Loflund, M., Giebl, H., Hitzenberger, R., Zibuschka, F., and Puxbaum, H.: The contribution of bacteria and fungal spores to the organic carbon content of cloud water, precipitation and aerosols, Atmos. Res., 64, 109–119, 2002.
Baumgardner, D., Abel, S. J., Axisa, D., Cotton, R., Crosier, J., Field, P., Gurganus, C., Heymsfield, A., Korolev, A., Krämer, M., Lawson, P., McFarquhar, G., Ulanowski, Z., and Um, J.: Cloud Ice Properties: In Situ Measurement Challenges, Meteor. Mon., 58, 9.1–9.23, 2017.
Blyth, A. M. and Latham, J.: Development of ice and precipitation in New Mexican summertime cumulus clouds, Q. J. R. Meteorol. Soc. 119, 91–120, 1993.
Bowers, R. M., Lauber, C. L., Wiedinmyer, C., Hamady, M., Hallar, A. G., Fall, R., Knight, R., and Fierer, N.: Characterization of airborne microbial communities at a high-elevation site and their potential to act as atmospheric ice nuclei, Appl. Environ. Microbiol., 75, 5121–30, https://doi.org/10.1128/AEM.00447-09, 2009.
Burrows, S. M., Elbert, W., Lawrence, M. G., and Pöschl, U.: Bacteria in the global atmosphere – Part 1: Review and synthesis of literature data for different ecosystems, Atmos. Chem. Phys., 9, 9263–9280, https://doi.org/10.5194/acp-9-9263-2009, 2009.
Carlin, J. T., Reeves, H. D., and Ryzhkov, A. V.: Polarimetric Observations and Simulations of Sublimating Snow: Implications for Nowcasting, J. Appl. Meteorol. Climatol., 60, 1035–1054, 2021.
Chen, Q., Yin, Y., Jiang, H., Chu, Z., Xue, L., Shi, R., Zhang, X., and Chen, J.: The roles of mineral dust as cloud condensation nuclei and icenuclei during the evolution of a hail storm, J. Geophys. Res.-Atmos., 124, 14262–14284, 2019.
Chin, M., Rood, R. B., Lin, S. J., Müller, J. F., and Thompson, A. M.: Atmospheric sulfur cycle simulated in the global model GOCART: Model description and global properties, J. Geophys. Res.-Atmos., 105, 24671–24687, https://doi.org/10.1029/2000JD900384, 2000.
Crawford, I., Bower, K. N., Choularton, T. W., Dearden, C., Crosier, J., Westbrook, C., Capes, G., Coe, H., Connolly, P. J., Dorsey, J. R., Gallagher, M. W., Williams, P., Trembath, J., Cui, Z., and Blyth, A.: Ice formation and development in aged, wintertime cumulus over the UK: observations and modelling, Atmos. Chem. Phys., 12, 4963–4985, https://doi.org/10.5194/acp-12-4963-2012, 2012.
Cui, Z. and Carslaw, K. S.: Enhanced vertical transport efficiency of aerosol in convective clouds due to increases in tropospheric aerosol abundance, J. Geophys. Res., 111, D15212, https://doi.org/10.1029/2005JD006781, 2006.
DeMott, P. J. and Prenni, A. J.: New Directions: Need for defining the numbers and sources of biological aerosols acting as ice nuclei, Atmos. Environ., 44, 1944–1945, 2010.
DeMott P. J., Prenni A. J., Liu, X., Kreidenweis, S. M., Petters, M. D., Twohy, C. H., Richardson, M. S., Eidhammer, T., and Rogers, D. C.: Predicting global atmospheric ice nuclei distributions and their impacts on climate, P. Natl. Acad. Sci. USA, 107, 11217–11222, 2010.
Deshmukh, A., Phillips, V. J. T. P., Bansemer A., Patade, S., and Waman, D.: New Empirical Formulation for the Sublimational Breakup of Graupel and Dendritic Snow, J. Atmos. Sci., 79, 317–336, https://doi.org/10.1175/JAS-D-20-0275.1, 2021.
Després, V. R., Huffman, J. A., Burrows, S. M., Hoose, C., Safatov, A. S., Buryak, G., Fröhlich-Nowoisky, J., Elbert, W., Andreae, M. O., and Pöschl, U.: Primary biological aerosol particles in the atmosphere: a review, Tellus B, 64, 15598, https://doi.org/10.3402/tellusb.v64i0.15598, 2012.
Dong, X. and Mace, G. G.: Arctic stratus cloud properties and radiative forcing derived from ground-based data collected at Barrow, Alaska, J. Climate, 16, 445–461, https://doi.org/10.1175/1520-0442(2003)016<0445:ASCPAR>2.0.CO;2, 2003.
Fan, J., Comstock, J. M., and Ovchinnikov, M.: The cloud condensation nuclei and ice nuclei effects on tropical anvil characteristics and water vapor of the tropical tropopause layer, Environ. Res. Lett., 5, 044005, https://doi.org/10.1088/1748-9326/5/4/044005, 2010.
Fan, J., Liu, Y-C, Xu, K. M., North, K., Collis, S., Dong, X., Zhang, G. J., Chen, Q., Kollias, P., and Ghan, S. J.: Improving representation of convective transport for scale-aware parameterization: 1. Convection and cloud properties simulated with spectral bin and bulk microphysics, J. Geophys. Res. Atmos., 120, 3485–3509. https://doi.org/10.1002/2014JD022142, 2015.
Fan, J., Han, B., Varble, A., Morrison, H., North, K., Kollias, P., Chen, B., Dong, X., Giangrande, S., Khain, A., Lin, Y., Mansell, E., Milbrandt, J. A., Stenz, R., Thompson, G., and Wang, Y: Cloud-resolving model intercomparison of an MC3E squall line case: Part I – Convective updrafts, J. Geophys. Res. Atmos., 122, 9351–9378, 2017.
Field, P. R. and Heymsfeld, A. J: Importance of snow to global precipitation, Geophys. Res. Lett., 42, 9512–9520, https://doi.org/10.1002/2015GL065497, 2015.
Field, P. R., Heymsfield, A. J., and Bansemer, A.: Shattering and Particle Interarrival Times Measured by Optical Array Probes in Ice Clouds, J. Atmos. Ocean. Technol., 23, 1357–1371, 2006.
Fridlind, A. M., Li, X., Wu, D., van Lier-Walqui, M., Ackerman, A. S., Tao, W.-K., McFarquhar, G. M., Wu, W., Dong, X., Wang, J., Ryzhkov, A., Zhang, P., Poellot, M. R., Neumann, A., and Tomlinson, J. M.: Derivation of aerosol profiles for MC3E convection studies and use in simulations of the 20 May squall line case, Atmos. Chem. Phys., 17, 5947–5972, https://doi.org/10.5194/acp-17-5947-2017, 2017.
Fröhlich-Nowoisky, J., Kampf, C. J., Weber, B., Huffman, J. A., Pöhlker, C., Andreae, M. O., Lang-Yona, N., Burrows, S. M., Gunthe, S. S., Elbert, W., Su, H., Hoor, P., Thines, E., Hoffmann, T., Desprìes, V. R., and Pöoschl, U.: Bioaerosols in the Earth system: climate, health, and ecosystem interactions, Atmos. Res. 182, 346–376, 2016.
Garcia, E., Hill, T. C. J., Prenni, A. J., DeMott, P. J., Franc, G. D., and Kreidenweis, S. M.: Biogenic ice nuclei in boundary layer air over two US high plains agricultural regions, J. Geophys. Res.-Atmos., 117, 1–12, https://doi.org/10.1029/2012JD018343, 2012.
Giangrande, S. E., Collis, S., Theisen, A. K., and Tokay, A.: Precipitation estimation from the ARM distributed radar network during the MC3E campaign, J. Appl. Meteorol. Climatol., 53, 2130–2147, https://doi.org/10.1175/JAMC-D-13-0321.1, 2014.
Grützun, V., Knoth, O., and Simmel, M.: Simulation of the influence of aerosol particle characteristics on clouds and precipitation with LM-SPECS: Model description and first results, Atmos. Res., 90, 233–242, https://doi.org/10.1016/j.atmosres.2008.03.002, 2008.
Hallett, J., and Mossop S. C.: Production of secondary ice particles during the riming process, Nature, 249, 26–28, https://doi.org/10.1038/249026a0, 1974.
Han, B., Fan, J., Varble, A., Morrison, H., Williams, C. R., Chen, B., Dong, X., Giangrande, S. E., Khain, A., Mansell, E., Milbrandt, J. A., Shpund, J., and Thompson, G.: Cloud-resolving model intercomparison of an MC3E squall line case: Part II. Stratiform precipitation properties, J. Geophys. Res.-Atmos., 124, 1090–1117, 2019.
Heymsfield, A. J., Schmitt, C., Chen, C., Bansemer, A., Gettelman, A., Field, P. R., and Liu, C.: Contributions of the Liquid and Ice Phases to Global Surface Precipitation: Observations and Global Climate Modeling, J. Atmos. Sci., 77, 2629–2648, 2020.
Hoose, C. and Möhler, O.: Heterogeneous ice nucleation on atmospheric aerosols: a review of results from laboratory experiments, Atmos. Chem. Phys., 12, 9817–9854, https://doi.org/10.5194/acp-12-9817-2012, 2012.
Hoose, C., Kristjánsson, J. E., and Burrows, S. M.: How important is biological ice nucleation in clouds on a global scale?, Environ. Res. Lett., 5, 024009, https://doi.org/10.1088/1748-9326/5/2/024009, 2010a.
Hoose, C., Kristjánsson, J. E., Chen, J. P., and Hazra, A.: A Classical-Theory-Based Parameterization of Heterogeneous Ice Nucleation by Mineral Dust, Soot, and Biological Particles in a Global Climate Model, J. Atmos. Sci., 67, 2483–2503, https://doi.org/10.1175/2010jas3425.1, 2010b.
Huang, S., Wei, H., Chen, J., Wu, Z., Zhang, D., and Fu, P.: Overview of biological ice nucleating particles in the atmosphere, Environ. Internat., 146, 106197, https://doi.org/10.1016/j.envint.2020.106197, 2021.
Huffman, J. A., Prenni, A. J., DeMott, P. J., Pöhlker, C., Mason, R. H., Robinson, N. H., Fröhlich-Nowoisky, J., Tobo, Y., Després, V. R., Garcia, E., Gochis, D. J., Harris, E., Müller-Germann, I., Ruzene, C., Schmer, B., Sinha, B., Day, D. A., Andreae, M. O., Jimenez, J. L., Gallagher, M., Kreidenweis, S. M., Bertram, A. K., and Pöschl, U.: High concentrations of biological aerosol particles and ice nuclei during and after rain, Atmos. Chem. Phys., 13, 6151–6164, https://doi.org/10.5194/acp-13-6151-2013, 2013.
Hummel, M., Hoose, C., Pummer, B., Schaupp, C., Fröhlich-Nowoisky, J., and Möhler, O.: Simulating the influence of primary biological aerosol particles on clouds by heterogeneous ice nucleation, Atmos. Chem. Phys., 18, 15437–15450, https://doi.org/10.5194/acp-18-15437-2018, 2018.
Jaenicke, R.: Abundance of cellular material and proteins in the atmospheric, Science, 308, p. 73, https://doi.org/10.1126/science.1106335, 2005.
Jensen, M. P., Petersen, W. A., Bansemer, A., Bharadwaj, N., Carey, L. D., Cecil, D. J., Collis, S. M., Del Genio, A. D., Dolan, B., Gerlach, J., Giangrande, S. E., Heymsfield, A., Heymsfield, G., Kollias, P., Lang, T. J., Nesbitt, S. W., Neumann, A., Poellot, M., Rutledge, S. A., Schwaller, M., Tokay, A., Williams, C. R., Wolff, D. B., Xie, S., and Zipser, E. J.: The midlatitude continental convective clouds experiment (MC3E), B. Am. Meteorol. Soc., 97, 1667–1686, https://doi.org/10.1175/BAMS-D-14-00228.1, 2016.
Kanji, Z. A., Ladino, L. A., Wex, H., Boose, Y., Burkert-Kohn, M., Cziczo, D. J., and Krämer, M.: Overview of Ice Nucleating Particles, Meteor. Mon., 58, 1.1–1.33, 2017.
Knopf, D. A., Alpert, P. A., Wang, B., and Aller, J. Y.: Stimulation of ice nucleation by marine diatoms, Nat. Geosci. 4, 88–90, https://doi.org/10.1038/ngeo1037, 2011.
Korolev, A. and Leisner, T.: Review of experimental studies of secondary ice production, Atmos. Chem. Phys., 20, 11767–11797, https://doi.org/10.5194/acp-20-11767-2020, 2020.
Korolev, A. V., Kuznetsov, S. V., Makarov, Y. E., and Novikov, V. S: Evaluation of Measurements of Particle Size and Sample Area from Optical Array Probes, J. Atmos. Ocean. Technol., 8, 514–522, 1991.
Korolev, A., McFarquhar, G., Field, P. R., Franklin, C., Lawson, P., Wang, Z., Williams, E., Abel, S. J., Axisa, D., Borrmann, S., Crosier, J., Fugal, J., Krämer, M., Lohmann, U., Schlenczek, O., Schnaiter, M., and Wendisch, M.: Mixed-Phase Clouds: Progress and Challenges, Meteor. Mon., 58, 5.1–5.50, 2017.
Korolev, A., Heckman, I., Wolde, M., Ackerman, A. S., Fridlind, A. M., Ladino, L. A., Lawson, R. P., Milbrandt, J., and Williams, E.: A new look at the environmental conditions favorable to secondary ice production, Atmos. Chem. Phys., 20, 1391–1429, https://doi.org/10.5194/acp-20-1391-2020, 2020.
Kumjian, M. R. and Lombardo, K. A.: Insights into the evolving microphysical and kinematic structure of northeastern U.S. winter storms from dual-polarization Doppler radar, Mon. Wea. Rev., 145, 1033–1061, https://doi.org/10.1175/MWR-D-15-0451.1, 2017.
Lawson, R. P., Woods, S., and Morrison, H.: The microphysics of ice and precipitation 1195 development in tropical cumulus clouds, J. Atmos. Sci., 72, 2429–2445, https://doi.org/10.1175/JAS-D-14-0274.1, 2015.
Levin, Z., Yankofsky, S., Pardes, D., and Magal, N.: J. Clim. Appl. Meteorol., 26, 1188–97, 1987.
Malm, W. C., Sisler, J. F., Huffman, D., Eldred, R. A., and Cahill, T. A.: Spatial and seasonal trends in particle concentration and optical extinction in the United States, J. Geophys. Res., 99, 1347–1370, 1994.
Mattias-Maser, S. and Jaenicke, R.: The size distribution of primary biological aerosol particles with radii >0.2 mm in an urban/rural influenced region, Atmos. Res. 39, 279–286, 1995.
Mattias-Maser, S., Brinkmann, J., and Schneider, W.: The size distribution of marine atmospheric aerosol with regard to primary biological aerosol particles over the South Atlantic Ocean, Atmos. Environ., 33, 3569–3575, 1999.
Matthias-Maser, S., Bogs, B., and Jaenicke, R.: The size distribution of primary biological aerosol particles in cloud water on the mountain Kleiner Feldberg/Taunus (FRG), Atmos. Res., 54, 1–13, 2000.
Matus, A. V. and L'Ecuyer, T. S.: The role of cloud phase in Earth's radiation budget, J. Geophys. Res.-Atmos., 122, 2559–2578, https://doi.org/10.1002/2016JD025951, 2017.
Möhler, O., Georgakopoulos, D. G., Morris, C. E., Benz, S., Ebert, V., Hunsmann, S., Saathoff, H., Schnaiter, M., and Wagner, R.: Heterogeneous ice nucleation activity of bacteria: new laboratory experiments at simulated cloud conditions, Biogeosciences, 5, 1425–1435, https://doi.org/10.5194/bg-5-1425-2008, 2008.
Moisseev, D. N., Lautaportti, S., Tyynela, J., and Lim, S.: Dual-polarization radar signatures in snowstorms: Role of snowflake aggregation, J. Geophys. Res.-Atmos., 120, 12644–12655, https://doi.org/10.1002/2015JD023884.
Morris, C. E., Conen F., Huffman, A. J., Phillips, V. J. T. P., Pöschl, U., and Sands, D. C.: Bioprecipitation: A feedback cycle linking Earth history, ecosystem dynamics and land use through biological ice nucleators in the atmosphere, Global Change Biology, 20, 341–351, https://doi.org/10.1111/gcb.12447, 2014,
Mülmenstädt, J., Sourdeval, O., Delanoë, J., and Quaas, J.: Frequency of occurrence of rain from liquid-, mixed-, and ice-phase clouds derived from A-Train satellite retrievals, Geophys. Res. Lett., 42, 6502–6509, 2015.
Murray, B. J., O'Sullivan, D., Atkinson, J. D., and Webb, M. E.: Ice nucleation by particles immersed in supercooled cloud droplets, Chem. Soc. Rev., 41, 6519–6554, https://doi.org/10.1039/c2cs35200a, 2012.
Patade, S., Phillips, V. T. J., Amato, P., Bingemer, H. G., Burrows, S. M., DeMott, P. J., Goncalves, F. L. T., Knopf, D. A., Morris, C. E., Alwmark, C., Artaxo, P., Pöhlker, C., Schrod, J., and Weber, B.: Empirical Formulation for Multiple Groups of Primary Biological Ice Nucleating Particles from Field Observations over Amazonia, J. Atmos. Sci., 78, 2195–2220, 2021.
Phillips, V. T. J. and Patade, S.: Multiple Environmental Influences on the Lightning of Cold-based Continental Convection. Part II: Sensitivity Tests for its Charge Structure and Land-Ocean Contrast, J. Atmos. Sci., 79, 263–300, https://doi.org/10.1175/JAS-D-20-0234.1, 2021.
Phillips, V. T. J., Donner, L. J., and Garner, S.: Nucleation processes in deep convection simulated by a cloud-system resolving model with double-moment bulk microphysics, J. Atmos. Sci., 64, 738–761, 2007.
Phillips, V. T. J., DeMott, P. J., and Andronache, C.: An Empirical Parameterization of Heterogeneous Ice Nucleation for Multiple Chemical Species of Aerosol, J. Atmos. Sci., 65, 2757–2783, 2008.
Phillips, V. T. J., Andronache, C., Christner, B., Morris, C. E., Sands, D. C., Bansemer, A., Lauer, A., McNaughton, C., and Seman, C.: Potential impacts from biological aerosols on ensembles of continental clouds simulated numerically, Biogeosciences, 6, 987–1014, https://doi.org/10.5194/bg-6-987-2009, 2009.
Phillips, V. T. J., Demott, P. J., Andronache, C., Pratt, K. A., Prather, K. A., Subramanian, R., and Twohy, C.: Improvements to an empirical parameterization of heterogeneous ice nucleation and its comparison with observations, J. Atmos. Sci., 70, 378–409, https://doi.org/10.1175/JAS-D-12-080.1, 2013.
Phillips, V. T. J., Yano, J. I., and Khain, A.: Ice multiplication by breakup in ice-ice collisions. Part I: Theoretical formulation, J. Atmos. Sci., 74, 1705–1719, https://doi.org/10.1175/JAS-D-16-0224.1, 2017a.
Phillips, V. T. J., Yano, J., Formenton, M., Ilotoviz, E., Kanawade, V., Kudzotsa, I., Sun, J., Bansemer, A., Detwiler, A. G., Khain, A., and Tessendorf, S. A.: Ice Multiplication by Breakup in Ice–Ice Collisions, Part II: Numerical Simulations, J. Atmos. Sci., 74, 2789–2811, 2017b.
Phillips, V. T. J., Patade, S., Gutierrez, J., and Bansemer, A.: Secondary ice production by fragmentation of freezing drops: Formulation and theory, J. Atmos. Sci., 75, 3031–3070, https://doi.org/10.1175/JAS-D-17-0190.1, 2018.
Phillips, V. T. J., Formenton, M., Kanawade, V. P., Karlsson, L. R., Patade, S., Sun, J., Barthe, C., Pinty, J., Detwiler, A. G., Lyu, W., and Tessendorf, S. A.: Multiple Environmental Influences on the Lightning of Cold-Based Continental Cumulonimbus Clouds, Part I: Description and Validation of Model, J. Atmos. Sci., 77, 3999–4024, 2020.
Pörtner, H.-O., Roberts, D. C., Poloczanska, E. S., Mintenbeck, K., Tignor, M., Alegría, A., Craig, M., Langsdorf, S., Löschke, S., Möller, V., and Okem, A.: Summary for policymakers, in: Climate change 2022: Impact, adaptation, and vulnerability: Summary for policy makers: Working group II Contribution to the sixth assessment report of the Intergovernmental Panel on Climate Change, Cambridge University Press, in press, 2022.
Prenni, A. J., Tobo, Y., Garcia, E., DeMott, P. J., Huffman, J. A., McCluskey, C. S., Kreidenweis, S. M., Prenni, J. E., Pöhlker, C., and Pöschl, U.: The impact of rain on ice nuclei populations at a forested site in Colorado, Geophys. Res. Lett., 40, 227–231, https://doi.org/10.1029/2012GL053953, 2012.
Ryzhkov, A., Pinsky, M., Pokrovsky, A., and Khain, A.: Polarimetric Radar Observation Operator for a Cloud Model with Spectral Microphysics, J. Appl. Meteorol. Climatol., 50, 873–894, 2011.
Sahyoun, M., Wex, H., Gosewinkel, U., Šantl-Temkiv, T., Nielsen, N. W., Finster, K., Sørensen, J. H., Stratmann, F., and Korsholm, U. S.: On the usage of classical nucleation theory in quantification of the impact of bacterial INP on weather and climate, Atmos. Environ., 139, 230–240, https://doi.org/10.1016/j.atmosenv.2016.05.034, 2016.
Sesartic, A., Lohmann, U., and Storelvmo, T.: Bacteria in the ECHAM5-HAM global climate model, Atmos. Chem. Phys., 12, 8645–8661, https://doi.org/10.5194/acp-12-8645-2012, 2012.
Sesartic, A., Lohmann, U., and Storelvmo, T.: Modelling the impact of fungal spore ice nuclei on clouds and precipitation, Environ. Res. Lett., 8, 014029, https://doi.org/10.1088/1748-9326/8/1/014029, 2013.
Sinclair, V. A., Moisseev, D., and von Lerber, A.: How dual-polarization radar observations can be used to verify model representation of secondary ice, J. Geophys. Res.-Atmos., 121, 10954–10970, https://doi.org/10.1002/2016JD025381, 2016.
Sotiropoulou, G., Vignon, É., Young, G., Morrison, H., O'Shea, S. J., Lachlan-Cope, T., Berne, A., and Nenes, A.: Secondary ice production in summer clouds over the Antarctic coast: an underappreciated process in atmospheric models, Atmos. Chem. Phys., 21, 755–771, https://doi.org/10.5194/acp-21-755-2021, 2021a.
Sotiropoulou, G., Ickes, L., Nenes, A., and Ekman, A. M. L.: Ice multiplication from ice–ice collisions in the high Arctic: sensitivity to ice habit, rimed fraction, ice type and uncertainties in the numerical description of the process, Atmos. Chem. Phys., 21, 9741–9760, https://doi.org/10.5194/acp-21-9741-2021, 2021b.
Spracklen, D. V. and Heald, C. L.: The contribution of fungal spores and bacteria to regional and global aerosol number and ice nucleation immersion freezing rates, Atmos. Chem. Phys., 14, 9051–9059, https://doi.org/10.5194/acp-14-9051-2014, 2014.
Szyrmer, W. and Zawadzki, I.: Biogenic and anthropogenic sources of ice-forming nuclei: A review, B. Am. Meteorol. Soc., 78, 209–228, 1997.
Tsushima, Y., Emori S., Ogura T., Kimoto, M., Webb, M. J., Williams, K. D., Ringer, M. A., Soden, B. J., Li, B., and Andronova, N.: Importance of the mixed-phase cloud distribution in the control climate for assessing the response of clouds to carbon dioxide increase: a multi-model study, Clim. Dynam., 27, 113–126, 2006.
Xie, S., Zhang, Y., Giangrande, S. E., Jensen, M. P., McCoy, R., and Zhang, M.: Interactions between cumulus convection and its environment as revealed by the MC3E sounding array, J. Geophys. Res., 119, 11784–11808, https://doi.org/10.1002/2014JD022011, 2014.
Zhao, X. and Liu, X.: Global importance of secondary ice production, Geophys. Res. Lett., 48, e2021GL092581, https://doi.org/10.1029/2021GL092581, 2021.
Zuidema, P., Westwater, E. R., Fairall, C., and Hazen, D.: Ship-based liquid water path estimates in marine stratocumulus, J. Geophys. Res., 110, D20206, https://doi.org/10.1029/2005JD005833, 2005.
- Abstract
- Introduction
- Description of observations
- Methodology
- Results from control simulation and model validation
- Results from sensitivity tests about the influence of PBAP
- Results from sensitivity tests about secondary ice production
- Results about the influence of PBAPs in the absence of SIP mechanisms
- Discussion
- Conclusions
- Code and data availability
- Author contributions
- Competing interests
- Disclaimer
- Acknowledgements
- Financial support
- Review statement
- References
- Supplement