the Creative Commons Attribution 4.0 License.
the Creative Commons Attribution 4.0 License.
 | 16 Sep 2022
Simultaneous retrievals of biomass burning aerosols and trace gases from the ultraviolet to near-infrared over northern Thailand during the 2019 pre-monsoon season
Si-Chee Tsay
N. Christina Hsu
David M. Giles
John W. Cooper
Jaehwa Lee
Robert J. Swap
Brent N. Holben
James J. Butler
Sheng-Hsiang Wang
Somporn Chantara
Hyunkee Hong
Donghee Kim
Jhoon Kim
With the advent of spaceborne spectroradiometers in a geostationary constellation, measuring high spectral resolution ultraviolet–visible (UV-VIS) and selected near-/shortwave-infrared (NIR/SWIR) radiances can enable the probing of the life cycle of key atmospheric trace gases and aerosols at higher temporal resolutions over the globe. The UV-VIS measurements are important for retrieving several key trace gases (e.g., O3, SO2, NO2, and HCHO) and particularly for deriving aerosol characteristics (e.g., aerosol absorption and vertical profile). This study examines the merit of simultaneous retrievals of trace gases and aerosols using a ground-based spectroradiometer covering the UV-NIR to monitor their physicochemical processes and to obtain reliable aerosol information for various applications. During the 2019 pre-monsoon season over northern Thailand, we deployed a ground-based SMART–s (Spectral Measurements for Atmospheric Radiative Transfer–spectroradiometer) instrument, which is an extended-range Pandora with reliable radiometric calibration in the 330–820 nm range, to retrieve remotely sensed chemical and aerosol properties for the first time near biomass burning sources. The high spectral resolution (∼ 1.0 nm full width half maximum with ∼ 3.7 × oversampling) of sun and sky measurements from SMART–s provides several key trace gases (e.g., O3, NO2, and H2O) and aerosol properties covering the UV where significant light absorption occurs by the carbonaceous particles. During the measurement period, highly correlated total column amounts of NO2 and aerosol optical thickness (τaer) retrieved from SMART–s (correlation coefficient, R=0.74) indicated their common emissions from biomass burning events. The SMART–s retrievals of the spectral single scattering albedo (ω0) of smoke aerosols showed an abrupt decrease in the UV, which is an important parameter dictating photochemical processes in the atmosphere. The values of ω0 and column precipitable water vapor (H2O) gradually increase with the mixing of biomass burning smoke particles and higher water vapor concentrations when approaching the monsoon season. The retrieved ω0 and weighted mean radius of fine-mode aerosols from SMART–s showed positive correlations with the H2O (R=0.81 for ω0 at 330 nm and 0.56 for the volume-weighted mean radius), whereas the real part of the refractive index of fine-mode aerosol (nf) showed negative correlations ( at 330 nm), which suggest that aerosol aging processes including hygroscopic growth (e.g., humidification and cloud processing) can be a major factor affecting the temporal trends of aerosol optical properties. Retrieved nf and ω0 were closer to those of the water droplet (i.e., nf of about 1.33 and ω0 of about 1.0) under lower amounts of NO2 during the measurement period; considering that the NO2 amounts in the smoke may indicate the aging of the plume after emission due to its short lifetime, the tendency is also consistent with active hygroscopic processes of the aerosols over this area. Retrieved UV aerosol properties from SMART–s generally support the assumed smoke aerosol models (i.e., the spectral shape of aerosol absorption) used in NASA's current satellite algorithms, and their spectral ω0 retrievals from ground and satellites showed good agreements (R = 0.73–0.79). However, temporal and spectral variabilities in the aerosol absorption properties in the UV emphasize the importance of a realistic optical model of aerosols for further improvements in satellite retrievals.
- Article
(12229 KB) - Full-text XML
- BibTeX
- EndNote


Significant spatiotemporal variabilities in the aerosols in the atmosphere complicate understanding of their scattering and absorption of the solar irradiance, which results in one of the largest uncertainties in predicting future climate (IPCC, 2021; Gliß et al., 2021; Myhre et al., 2013, and references therein). The dominant fraction of the aerosols over the globe cools the atmosphere by reflecting solar irradiance, whereas some species (e.g., black carbon in the smoke plumes) heat the air by absorbing sunlight (i.e., direct radiative effects, DRE; Chylek and Coakley, 1974; Haywood and Boucher, 2000; Yu et al., 2006). Primary factors of aerosols affecting the DRE are their loading and their absorption properties (e.g., Takemura et al., 2002, and references therein), which are often defined as aerosol optical thickness (τaer; total extinction by aerosols) and single scattering albedo (ω0; a ratio of the scattering to total extinction by aerosols), respectively. The ω0 is calculated from complex refractive indices (n+ik; where n and k are a real and imaginary part, which depends on chemical composition) and particle size distribution (PSD), by assuming a spherical (Mie, 1908) or more sophisticated shape (e.g., Mishchenko et al., 2003; Yang et al., 2007). The ω0 of non-absorbing aerosols (e.g., sea salt, sulfate, and nitrate particles) is close to 1.0, with a relatively flat spectral shape, whereas it decreases down to about 0.7 for absorbing aerosols (e.g., smoke and dust particles) with significant spectral gradients (e.g., Dubovik et al., 2002; Eck et al., 2013; Müller et al., 2011; Sayer et al., 2014). Meteorological condition and aerosol hygroscopicity are also key parameters affecting ω0, since increased water content in the particles changes the n, k, and PSD, which enhances light scattering and results in higher ω0 than dry particles (e.g., Jefferson et al., 2017; Li et al., 2019; Tao et al., 2014).
Decades of efforts have led to remote sensing techniques from both ground and satellite providing reliable τaer retrievals over major parts of the globe (e.g., Giles et al., 2019; Hsu et al., 2019; Levy et al., 2013), whereas other aerosol properties retrieved from satellites are limited and relatively more uncertain due to the lower measurement sensitivity and surface contributions (e.g., Jeong et al., 2016; Moosmüller et al., 2009). However, recent studies using more measurement parameters (e.g., multi-angle polarimetric measurements) showed promising results to provide reliable aerosol properties and constituents from satellites (e.g., Dubovik et al., 2019; Li et al., 2019). Globally networked ground-based instruments have provided reliable optical and physical properties of aerosols (e.g., n, k, ω0, and PSD), which are less affected by surface reflectance and acquire sufficient information content from multiple observation geometries (e.g., Dubovik and King, 2000; Jeong et al., 2020; Nakajima et al., 2020; Sinyuk et al., 2020). Satellite-based retrievals have utilized the aerosol properties from ground-based instruments as key constraints to expand upon their limitations (e.g., Hsu et al., 2019; Levy et al., 2013; Sayer et al., 2014).
Wildfires and prescribed fires have burned about 3.5 % of Earth's ice-free land surface each year from 2001 to 2010 (Randerson et al., 2012) and emit a significant fraction of global aerosols and their precursors into the atmosphere. The biomass burning aerosols (or smoke) consist primarily of carbonaceous aerosols (black and organic carbon), inorganic particles (e.g., potassium, chloride, sulfate, inorganic salts, and trace minerals), and inorganic and organic vapors (Hodshire et al., 2019, and references therein). Particularly primary and secondary organic aerosols, which account for a substantial fraction of fine-mode smoke aerosols, comprise various compounds with enormously different volatility, oxidation, and hygroscopic properties (Xu et al., 2017, and references therein). Due to the reactivity and diversity of smoke particles, the ω0 evolves with its environment (i.e., location and season), age, mixing state, and emission source of the plume (e.g., Eck et al., 2013; Haywood et al., 2003; Konovalov et al., 2017). In addition, Petters et al. (2009) reported that a major fraction of the smoke aerosols is already cloud-condensation-nuclei (CCN) active and does not require chemical conversion to be more hygroscopic particles for cloud formation and wet deposition, which adds another complication in understanding the Earth's climate.
Numerous studies have utilized ground-, airborne-, and satellite-based remote sensing techniques to monitor the properties and aging processes of the smoke particles. For example, Haywood et al. (2003) compared aerosol properties (e.g., PSD, τaer, and ω0) from the collocated AERONET (AErosol RObotic NETwork; Holben et al., 1998) and airborne in situ measurements at Windhoek, Namibia, in September 2000, which showed excellent agreements. Eck et al. (2013) analyzed the seasonal trend of aerosol properties retrieved from the AERONET and OMI (Ozone Monitoring Instrument) over southern Africa for a 15-year period and reported that the ω0 increases significantly as the burning season progresses. Pistone et al. (2019) compared the spectral ω0 of smoke aerosols from six independent airborne- and ground-based remote sensing/in situ instruments in September 2016 at Walvis Bay, Namibia, which showed acceptable agreements within the known uncertainties of each instrument (relative differences of less than about 0.03 in the mid-visible (VIS) range and less than about 0.05 in the near-infrared, depending on the instruments). Over Southeast Asia, a series of field campaigns, including BASE-ASIA (Biomass-burning Aerosols in South-East Asia: Smoke Impact Assessment) in 2006 and 7-SEAS (Seven SouthEast Asian Studies) from 2008 to the present, aimed to characterize aerosol–meteorological interactions over the region, mostly focusing on the smoke plumes. Physicochemical and optical properties of smoke aerosols were analyzed by utilizing intensive ground- and satellite-based instruments during the campaigns (e.g., Lin et al., 2013; Pantina et al., 2016; Reid et al., 2013; Tsay et al., 2013, 2016).
One of the important characteristics of the carbonaceous aerosols is their significant spectral variabilities in the optical properties in the ultraviolet (UV) wavelengths, which are associated with photolysis processes in the atmosphere, thereby affecting tropospheric photochemistry, human health, and agricultural productivity (e.g., George et al., 2015, and references therein). A majority of previous studies utilized direct/diffuse irradiance instruments (e.g., UV MultiFilter Rotating Shadowband Radiometer, UV-MFRSR, and Brewer spectroradiometer) to retrieve ω0 in discrete channels in the UV. However, as these instruments measure only two observation parameters per channel, the algorithms adopted different sources of measurements/assumptions to complement the insufficient information (e.g., see Table 1 in Corr et al., 2009). For instance, in the absence of additional collocated instruments, they assumed fixed asymmetry parameter and surface albedo from previous studies or climatology (e.g., Bais et al., 2005; Petters et al., 2003; Wetzel et al., 2003). Collocated AERONET instruments have provided more realistic constraints of aerosol properties to the UV-MFRSR measurements (e.g., PSD and n from visible wavelengths; Corr et al., 2009; Krotkov et al., 2005a) for retrieving ω0 in the UV. Trace gas absorption (e.g., O3 and NO2) is another source of error for the ω0 retrieval using these instruments. To take into account the gas absorptions, Goering et al. (2005) simultaneously retrieved total column O3, in addition to the τaer and ω0, by using the spectral feature of irradiance. Later, Taylor et al. (2008) added a wavelength-independent asymmetry parameter to the state vector, where both algorithms are based on the optimal estimation method (OEM; Rodgers, 2000). Krotkov et al. (2005a) used the aerosol-phase function calculated from n at 440 nm, PSD from AERONET, and total column O3 from the Brewer spectroradiometer to retrieve ω0 in the UV channels. To account for the NO2 absorption, which is a significant error source of ω0 retrieval for low aerosol loading, they added retrieved NO2 from the Brewer spectroradiometer for their algorithm (Cede et al., 2006; Krotkov et al., 2005b). SKYNET (SKY radiometer NETwork) instruments are a similar type of sun–sky spectroradiometer to the AERONET, which provides ω0 at discrete channels in the UV (i.e., 340 and 380 nm). The SKYNET algorithm accounts for the O3 absorption by using its retrieved total column from its 315 nm channel (Nakajima et al., 2007, 2020). Accuracies of the ω0 retrievals from the SKYNET depend on errors in measurement and calibrations for sun and sky scans, surface albedo, cloud contamination, and the version of the processing software (i.e., SKYRAD.PACK), which showed relatively high biases compared to AERONET (up to 0.07 at longer wavelengths). Recently, Mok et al. (2018) combined AERONET (for n, PSD, and τaer) and Pandora (for total column O3 and NO2) products to the UV-MFRSR measurements to retrieve spectral ω0 in the UV, which showed excellent agreements with SKYNET in the UV (i.e., 340 and 380 nm) but lower correlations in the longer wavelengths (i.e., 673 and 870 nm).
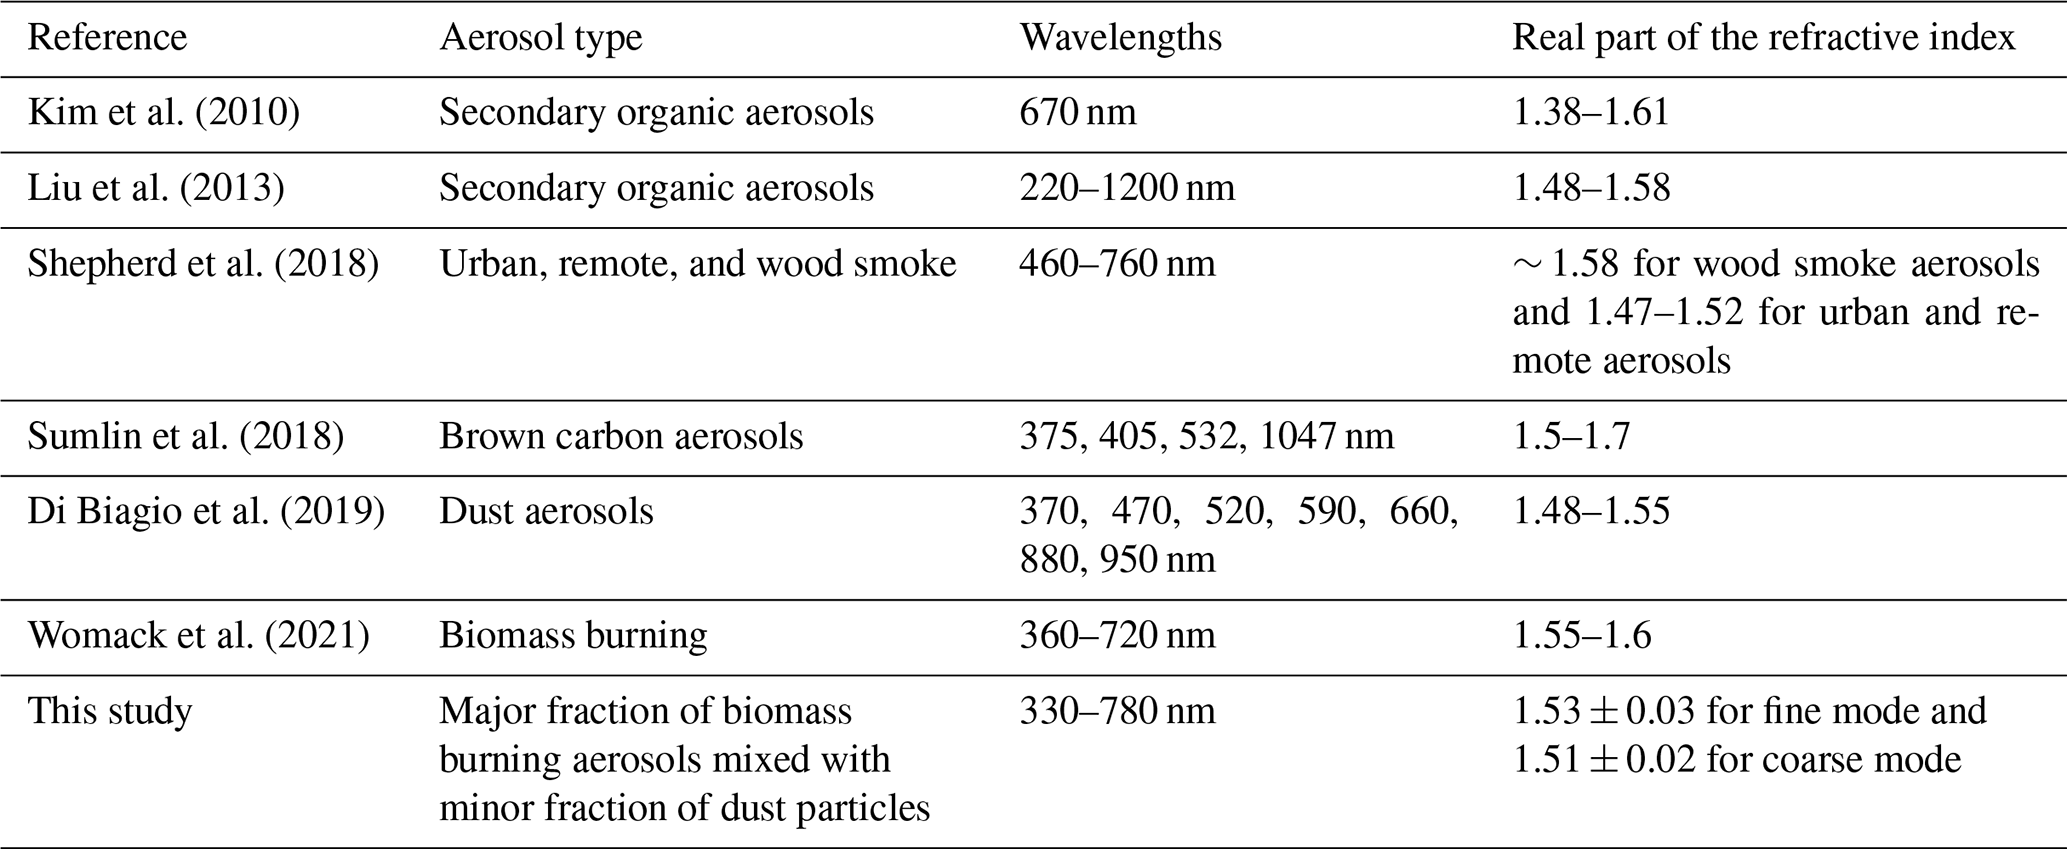
In addition, spectral n and k provide information not only on optical properties but also the chemical composition and physical status. k demonstrates the attenuation of light by particles, which is the key parameter for determining ω0, whereas n describes the phase of light scattering by the particles. Numerous studies have focused on measuring/retrieving n and k by utilizing various techniques to understand the effects of atmospheric particles on climate forcing and tropospheric photochemistry. Table 1 summarizes reported values of n from previous studies and the current study. Kim et al. (2010) retrieved n (at 670 nm) of secondary organic aerosols (SOAs) generated by oxidizing α-pinene, β-pinene, and toluene with O3, NOx, and sunlight. The retrieved n varied between 1.38 and 1.61, and they suggested that the n of SOAs depends on the aerosol mass concentration, oxidation chemistry, temperature, and aerosol aging. Liu et al. (2013) measured the n and k of SOAs for 220 to 1200 nm, using a variable angle spectroscopic ellipsometer, and reported a rapid increase in n and k in the UV. The n of the three selected SOAs ranged from 1.53–1.58 at 310 nm, 1.49–1.52 at 550 nm, and 1.48–1.50 at 1000 nm. Shepherd et al. (2018) estimated the spectral n of urban, remote, and wood smoke aerosols from 460 to 760 nm, based on the optical trapping method, and reported high values of n in the wood smoke aerosols (∼ 1.58) compared to the other types (1.47–1.52). They also summarized and compared their values of the spectral n to other studies well in their paper. Sumlin et al. (2018) retrieved the spectral n and k (at 375, 405, 532, and 1047 nm) of brown carbon aerosols emitted from controlled fire using burning sources at various geographic origins. They reported that n varies between 1.5 and 1.7 without meaningful dependencies on wavelength, moisture content, source depth, or geographic origin, whereas k increases from 0.003 to 0.014 as wavelengths vary from 532 to 375 nm. Di Biagio et al. (2019) estimated the n and k (at discrete channels in 370–950 nm) of 19 mineral dust aerosols from different sources based on Mie calculations combining optical and size measurements. They reported higher k (lower ω0) of dust particles in the shorter wavelengths, which also depends on the iron content of dust, but the source and wavelength-independent values of n ranged from 1.48 to 1.55. More recently, Womack et al. (2021) retrieved the n and k of biomass burning aerosols from 13 controlled fires over a 360–720 nm spectral range using a broadband cavity-enhanced spectrometer combined with PSD measurements. Their algorithm incorporates Mie and Rayleigh–Debye–Gans scattering theories to account for both spherical and non-spherical particles and retrieved n at about 1.55–1.60 and k to be significantly high (∼ 0.25) in the UV.
Table 1Examples of reported real part refractive index of biomass burning and dust aerosols from previous studies and the current study.
To be closely in line with and to continue such efforts, we deployed a set of instruments including SMART–s (Spectral Measurements for Atmospheric Radiative Transfer–spectroradiometer; Jeong et al., 2018, 2020) and AERONET during the pre-monsoon, yet active biomass burning, season at Fang, Thailand, in 2019. Specifically, we aim to suggest the benefit of simultaneous retrievals of aerosols and trace gases covering the UV, which may provide useful information on their physicochemical processes. In addition, aerosol properties in the UV are also important for various satellite algorithms for deriving higher-order aerosol parameters (e.g., absorption and vertical distribution) for which reliable measurements remain sparse. The benefits of employing SMART–s, a major instrument we utilized for this study, include the following:
-
sufficient spectral resolution and coverage for measuring both aerosols and key trace gases (e.g., O3, NO2, and H2O retrievals from direct-sun measurements), and in turn, the high temporal measurements of gaseous absorption help improve the accuracy of ω0 retrieval;
-
instantaneous measurements of the sun/sky spectrum, permitting aerosol spectral properties retrieved from an identical set of volumes;
-
reliable radiometric calibration from about 330 to 820 nm by utilizing a NIST-traceable (National Institute of Standards and Technology) uniform spectral radiance source (accuracy of about 1 % in the VIS-NIR (near-infrared) and about 2 % in the UV wavelengths at an approximate 95 % confidence level) to enable accurate retrievals of aerosol column properties (e.g., τaer, n, k, and ω0); and
-
stable performance, which is field deployable for a long period. The recent global expansion of the Pandora network operation is based on its reliability at various field conditions, and SMART–s is nearly identical to the Pandora instrument, except for the spectrometer (extended range from about 280 to 820 nm, with about 1 nm spectral resolution).
As this study is the first attempt to retrieve aerosol properties from the SMART–s near the source region of active and extensive biomass burning, we summarize the experimental design, instrument characteristics, and the radiometric calibration in Sect. 2. In Sect. 3.1, we compare the retrieved aerosol property retrievals (e.g., n, k, and ω0) from the SMART–s with those collocated from AERONET for a consistency check. Analyses of temporal variations in aerosols and total column trace gases (i.e., NO2, H2O, and O3) retrieved from the SMART–s are described in Sect. 3.2. We also demonstrated the relationship between aerosol properties and trace gas abundances in this section. Section 3.3 discusses possible applications of the retrieved aerosol parameters for satellite algorithms and preliminary validation/comparison results. The summary and conclusions are given in Sect. 4.
2.1 Experimental setup
The ground-based spectroradiometer observations have offered optimum inversion products of the atmosphere for validating/comparing those from collocated spaceborne sensors; these are less affected by the surface reflectance and can acquire more informative products from their higher resolution of temporal, spectral (including polarization), and angular measurements. In addition, strategically networked ground-based instruments (e.g., Distributed Regional Aerosol Gridded Observation Networks or DRAGON; Holben et al., 2018) can supplement their limited spatial representation. As part of the ongoing 7-SEAS campaign, intensive observations were conducted during the pre-monsoon season in April–May 2019 over northern Thailand, specifically the Chiang Mai, Fang, and Doi Ang Khang areas. The international collaborators deployed a sUAS (small Unmanned Aerial System) in a rotary/fixed-wing configuration for ∼ 130 flights to measure the boundary layer profiles of thermodynamics and aerosol size/absorption. A mini-lidar, the surface measurements of trace gases, and multiple chemistry samplers are also collocated with the three AERONET instruments and one SMART–s instrument during the campaign. As SMART–s is located in the middle of a large source areas of biomass burning during the season, it can provide useful information on carbonaceous aerosols and key trace gases despite its limited spatial coverage.
Figure 1 shows an example of spatial distributions of τaer at 550 nm (Hsu et al., 2019) from the Deep Blue (DB) aerosol algorithm applied to VIIRS (Visible Infrared Imaging Radiometer Suite) aboard the SNPP (Suomi National Polar-orbiting Partnership) satellite and the corresponding true-color image over Southeast Asia on 30 March 2019, when significant amounts of biomass burning aerosols prevailed (τaer at 550 nm higher than 3.0). The DB aerosol algorithm and its extended family have been applied to various spaceborne spectroradiometers such as AVHRR (Advanced Very High Resolution Radiometer), SeaWiFS (Sea-viewing Wide Field-of-view Sensor), MODIS (MODerate resolution Imaging Spectroradiometer), VIIRS (Hsu et al., 2019), and current advanced multispectral imagers aboard geostationary satellites, enabling the construction of long-term aerosol climate data records (CDRs). As previously stated, satellite retrievals provide reliable τaer, as indicated in Fig. 1b; the collocated SMART–s measurement is also presented in the colored circle (τaer=3.1), which shows an excellent agreement with the DB τaer retrievals nearby (mean τaer=2.93 within 10 km of SMART–s). In an attempt to derive more comprehensive aerosol properties from satellites, previous studies actively utilized UV measurements which are sensitive to the aerosol absorption and vertical profile and τaer (e.g., Torres et al., 2013; Lee et al., 2021). Accurate aerosol optical models play a central role in the endeavor. However, due to the lack of a reliable aerosol property database in the UV, they typically made simple assumptions on the spectral features of aerosols to extrapolate the properties from longer wavelengths or adopted laboratory measurements. One of the ultimate goals of this study is to contribute to satellite retrievals by providing realistic aerosol optical models over the study domain, particularly in the UV, which will be discussed in Sect. 3.3.
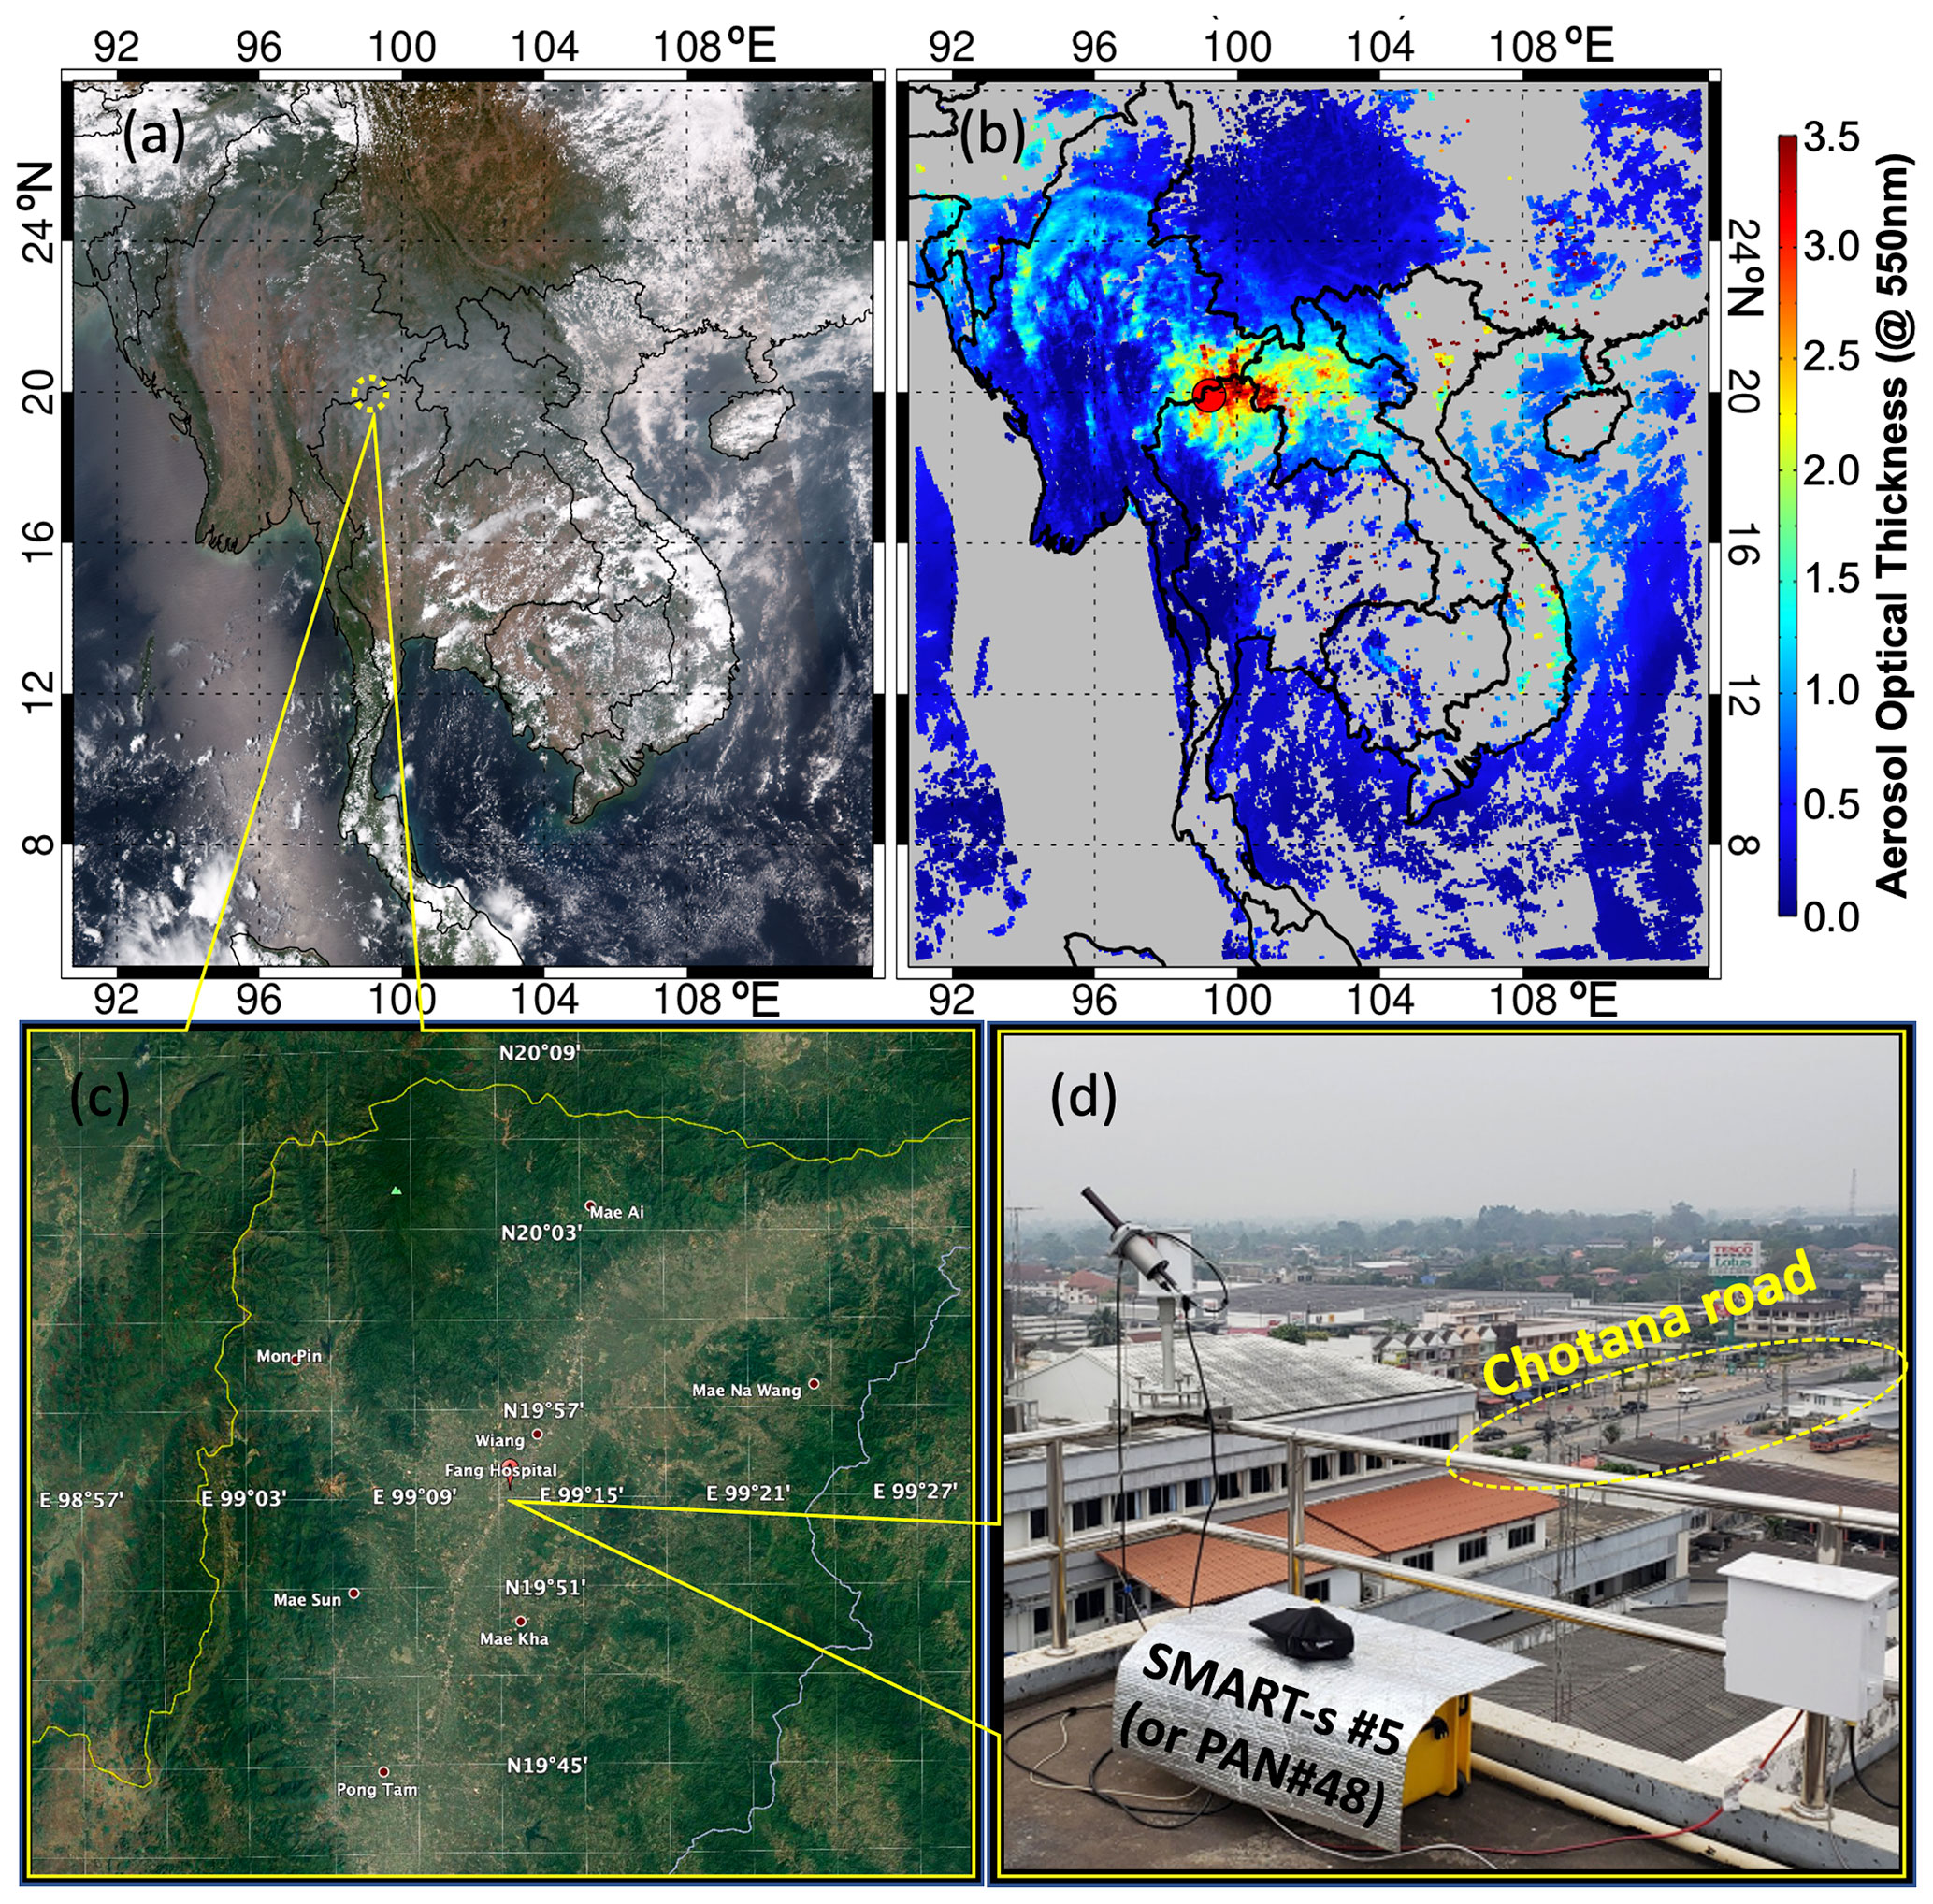
Figure 1(a) True-color image and (b) DB (Deep Blue) τaer product from VIIRS aboard SNPP on 30 March 2019. The yellow circle in panel (a) is the location of Fang, Thailand, and the colored circle in panel (b) shows the collocated τaer retrievals from SMART–s. Panel (c) indicates the location of the measurement site on the rooftop of Fang Hospital, Thailand (19.91∘ N latitude, 99.21∘ E longitude, and 480 m above sea level; the map is extracted from https://google.com/maps/, last access: 12 September 2022; © Google Maps 2021). Panel (d) is an image of deployed SMART–s (Pandora no. 48) taken on 8 March 2019. Chotana Road (marked in yellow) is one of the major streets in this area and is about 50 m away from the site.
The collocated SMART–s and AERONET instruments are deployed on the rooftop of Fang Hospital in Fang district, as shown in Fig. 1c and d, which is located in a basin in northern Thailand. The population of Fang city was slightly higher than 116 000 in 2010, with a low level of traffic throughout the year. One of the main roads of the city (Chotana Road) is near the building (∼ 50 m). However, we presume that the effects of local emissions from the road to the aerosol and NO2 amounts are weak, given the low level of local traffic, and that major fractions of the aerosols and trace gases (e.g., NO2) during this season are emitted from the biomass burning in this area (Jena et al., 2015; Itahashi et al., 2018; Khodmanee and Amnuaylojaroen, 2021). Figure 1d shows an image of the deployed SMART–s, and Chotana Road is shown behind. Direct-sun measurements of SMART–s started on 8 March 2019, and it has acquired additional solar almucantar scans since 19 March after about 10 d of stabilization (e.g., to check the stability under the field conditions and to fine-tune the alignment in tracking). The measurements finished on 2 May 2019. The AERONET instrument is installed on the same rooftop, about 5 m away from SMART–s. In 2019, the surface air temperature at Fang during the pre-monsoon season reached up to about 42 ∘C during the daytime, and the relative humidity gradually increased from March (∼ 30 %) to early May (∼ 50 %).
2.2 Measurements
The SMART–s instrument was originally developed by the Pandora network group at NASA (National Aeronautics and Space Administration)/GSFC (Goddard Space Flight Center), and the unit (no. 5) used in this study is registered as Pandora no. 48. Most of the components of SMART–s are similar or identical to the standard Pandora instrument, except for the spectrometer. The SMART–s spectrometer is made by the same manufacturer (AvaSpec-ULS2048x64, Avantes; see https://www.avantes.com/, last access: 8 June 2022) as the standard version but covers a wider spectral range (i.e., 280–820 nm) with a lower spectral resolution (∼ 1.0 nm full width at half maximum, FWHM, with ∼ 3.7 × oversampling). As the Pandonia Global Network (PGN; Herman et al., 2009, 2015; see https://www.pandonia-global-network.org, last access: 12 September 2022) is utilizing another type of extended-range spectrometer for their dual-detector system, we refer to this modified Pandora as SMART–s in this study. The spectrometer utilizes a 2048 × 64 pixels of back-thinned Hamamatsu charge-coupled device (CCD) with a symmetric Czerny–Turner system, and its spectrum covers O2, O3, NO2, SO2, HCHO, and H2O gas absorption bands (Herman et al., 2015; Jeong et al., 2018). The optical head consists of two rotating filter wheels; one includes neutral density (ND) filters, and the other contains bandpass filters (e.g., U340 and BP300) to block out-of-band (OOB) stray light from the near-UV and VIS wavelengths, ground-fused silica diffuser (diffuser hereafter; for NO2, H2O, and τaer retrieval), and an opaque filter for dark current measurements. By combining a variable exposure time (4–4000 ms) and ND filters, it can measure radiances with a dynamic range up to an order of 107, which enables the direct-sun and sky scans using a single detector throughout the day. Note that the field of view (FOV) for direct-sun observations using the diffuser of this unit is about 2.8∘, which is broadened to evenly distribute light passing through the optical head. Sky observations do not use the diffuser to allow more photons to reach the detector, of which the FOV is about 1.5∘. The optical head is mounted on a sun/sky scanner and is connected to the spectrometer through a fiber-optic cable of 400 µm in diameter. The spectrometer is thermoelectrically controlled to maintain a near-constant temperature but may vary slightly depending on the ambient temperature (typically less than 1 ∘C). The spectrometer temperature is recorded with each measurement to monitor data quality.
The SMART–s algorithm aims to obtain optimal information on aerosols and trace gases with minimum assumptions, which incorporates a series of retrievals from fundamental quantities (i.e., column amounts) to higher-order geophysical parameters (e.g., aerosol physicochemical properties and vertical profiles). Jeong et al. (2018) developed a τaer algorithm of the SMART–s based on the spectral Langley method and then compared the retrievals to collocated AERONET measurements at the NASA/GSFC, which showed excellent agreements at all overlapping wavelengths (i.e., 330, 380, 440, 500, and 675 nm). Comparisons of the τaer from the AERONET and SMART–s during this field deployment are shown in the Appendix (see Figs. A1 and A2). The trace gas algorithm of SMART–s is designed for a relatively lower spectral resolution (FWHM∼ 1.0 nm) and broader spectral coverage (280–820 nm) compared to the standard Pandora. For retrieving optically thick trace gases such as O3 and H2O, we utilize the spectral Langley method (see Appendix B; Jeong et al., 2018), whereas we adopt the spectral-fitting algorithm of Pandora for other optically thin species, including NO2 (Herman et al., 2009). Retrieved total columns of τaer, O3, and H2O in this study are compared with those from the collocated AERONET (for τaer and H2O) and satellite retrievals (O3 from the OMI and τaer from the VIIRS) during the measurement period in Sect. 3.2 and Appendix A. Jeong et al. (2020) developed an OEM-based algorithm using solar almucantar sky radiances and total column retrievals (e.g., τaer, O3, NO2, and H2O) for retrieving spectral n, k, ω0, and PSD of aerosols; details of the aerosol-column-property algorithm are in Jeong et al. (2020) and the key characteristics are included here in Appendix C.
For more than 2 decades, AERONET has been supported by NASA to operate a global network of automatic sun/sky scanning spectroradiometers for acquiring aerosol information (Holben et al., 1998). The instrument measures discrete channels (i.e., 340, 380, 440, 500, 675, 870, 940, 1020, and 1640 nm) of solar irradiance with a 1.2∘ FOV, which takes about 10 s to scan all spectral filter wheels. The FWHMs of the bandpass filters are 2 nm for 340 and 380 nm, 25 nm for 1640 nm, and 10 nm for all other channels, whereas that of SMART–s is about 1.0 nm for all wavelengths. The estimated uncertainty of τaer from the AERONET reference instrument is 0.002, and those from general network instruments are about 0.01 in the VIS-NIR and are higher (∼ 0.02) in the UV channels (Eck et al., 1999; Giles et al., 2019). Note that the uncertainty of τaer from SMART–s (∼ 0.02 in the VIS-NIR; ∼ 0.03 in the UV) is slightly higher than AERONET (∼ 0.01 in the VIS-NIR; ∼ 0.02 in the UV) due to the wider FOV (Jeong et al., 2018), which is more susceptible to forward scattering and the temperature sensitivity of the detector (Kinne et al., 1997). The current AERONET product provides n, k, and ω0 at 440, 675, 870, and 1020 nm. As the version 3 algorithm utilizes a vector radiative transfer model (Korkin et al., 2017), it can add a 380 nm channel for the UV-absorbing aerosols (Sinyuk et al., 2020). The recent version of instruments added hybrid sky scanning measurements to allow additional retrievals at the solar zenith angle (θS) below 50∘ (Sinyuk et al., 2020). To consider gas absorption, the version 3 algorithm adopts a monthly climatology (1978–2004) of O3 from the Total Ozone Mapping Spectrometer (TOMS) and a monthly climatology of NO2 (2004–2013) from the OMI and retrieved H2O using the 940 nm channel measurements (Sinyuk et al., 2020). Further information on AERONET products is summarized in Giles et al. (2019) and Sinyuk et al. (2020). We utilized the version 3 and level 2.0 products to compare retrievals from SMART–s.
2.3 A combinative radiometric calibration method for sun/sky spectroradiometer
The standard calibration procedure of SMART–s includes spectral characterization/registration, linearity and offset correction, radiometric calibration, temperature and flat field correction, and stray light correction (Herman et al., 2015; Jeong et al., 2018; Müller et al., 2020). The PGN also regularly reports updates and standard calibration/validation results on its web page (https://www.pandonia-global-network.org, last access: 12 September 2022; Herman et al., 2009, 2015). Utilization of the absolute sky radiances requires precise radiometric calibrations, which we suggest as a novel and combinative method for sun/sky spectroradiometers in this study. As this field campaign is the first attempt to deploy a radiometrically calibrated SMART–s using the method, we summarize detailed results of the calibration for the sky scans in this section.
For the initial step of the radiometric calibration, we utilized a uniform spectral radiance light source in the Radiometric Calibration Laboratory (RCL) at NASA/GSFC. The RCL is a class 10 000 clean room facility that maintains a number of NIST-traceable integrating sphere sources. The integrating sphere source used in this study is referred to as Grande. Grande is a Spectralon-lined, 101.6 cm diameter, integrating sphere source with a 25.4 cm diameter output aperture, which can generate nine levels of light output. More detailed information and annual calibration reports of Grande are available at https://cf.gsfc.nasa.gov/ (last access: 12 September 2022) or in Gatebe et al. (2007). Figure 2a is an image of SMART–s mounted in front of the Grande sphere source, and Fig. 2b shows Grande's nine levels of spectral output in radiance units. Figure 2c presents the reported total uncertainty of Grande sphere's spectral radiance at an approximate 95 % confidence level when calibrated using a NIST irradiance standard. Different colors in Fig. 2b and c indicate the different levels of Grande intensity. Due to relatively low intensity in the UV compared to the VIS-NIR (Fig. 2b) in both the NIST-calibrated irradiance standard and the Grande source itself, the calculated uncertainty of the Grande radiance calibration in the UV is higher, and a brighter light output provides a more accurate intensity, as shown in Fig. 2c. During the light source calibration, the sensor changed its filter (UV bandpass) to detect the lower intensity of Grande in the UV, which results in relatively higher uncertainties near 350 nm (see Fig. 2c). Note that the measurement error covariance matrix of the OEM also accounts for such spectral radiometric uncertainties (see Appendix C and Jeong et al., 2020). SMART–s repeated measurements of Grande 10 times for each filter combination (bandpass filters and neutral density filters). The deployment procedure of SMART–s (or Pandora) includes the organization of the fiber-optic cable and the connection of one end of the cable to the spectrometer (the other end of the cable is fixed to the optical head). This process can affect light transmittance through the cable. To check the stability of the fiber-optic cable during deployment, we oriented the cable differently (i.e., re-rolled the cable every time with different diameters or arbitrarily oriented it) and then reconnected the ports to the spectrometer at each time of the Grande measurements. Contamination of the front window of the optical head (e.g., raindrops, dew, dust, and insects) is also one of the largest error sources of radiometric measurements. During field deployments, we frequently check the front window and clean it when it is necessary. However, as cleaning the front window also can alter its optical transmittance, we artificially contaminated the front window (using a finger, dust, and water) and cleaned it in the same way as we do during field deployments every time there are Grande observations. In addition, other sources of short- and long-term temporal drift (e.g., spectrometer and filter transmittance) are monitored by pre- and post-mission calibration and the Langley fitting during deployments. Figure 3a shows the results of 10 repeat measurements of Grande at its nine-lamp illumination level. The agreement of these repeat measurements indicates good temporal stability in the SMART–s responsivity and the Grande output. Figure 3b shows the spectral calibration coefficient calculated from dividing the Grande intensity (Fig. 2b) by the average value of the measured voltage count (Fig. 3a), while the spectral precision of the Grande calibration (i.e., 1 standard deviation of 10 occurrences of the measurements) is presented in Fig. 3c. These results indicate that the precision of the radiometric calibration from the instrument is better than 0.5 % in the VIS-NIR channels and increases at shorter wavelengths to about 0.7 % at 330 nm (i.e., the lower limit of the spectral coverage in this study). Radiometric sensitivity of the spectrometer to its temperature (Tspec) is also tested by controlling the Tspec, which is less than 0.4 % at the entire spectral range for an extreme Tspec variability (i.e., ΔTspec ∼ 3 ∘C, which is less than 1 ∘C under typical field conditions). In general, the uncertainty of the laboratory radiance calibration including the light source and instrument stability is estimated to be better than 2.0 % in the VIS-NIR and 3.0 % in the UV at an approximate 95 % confidence level.
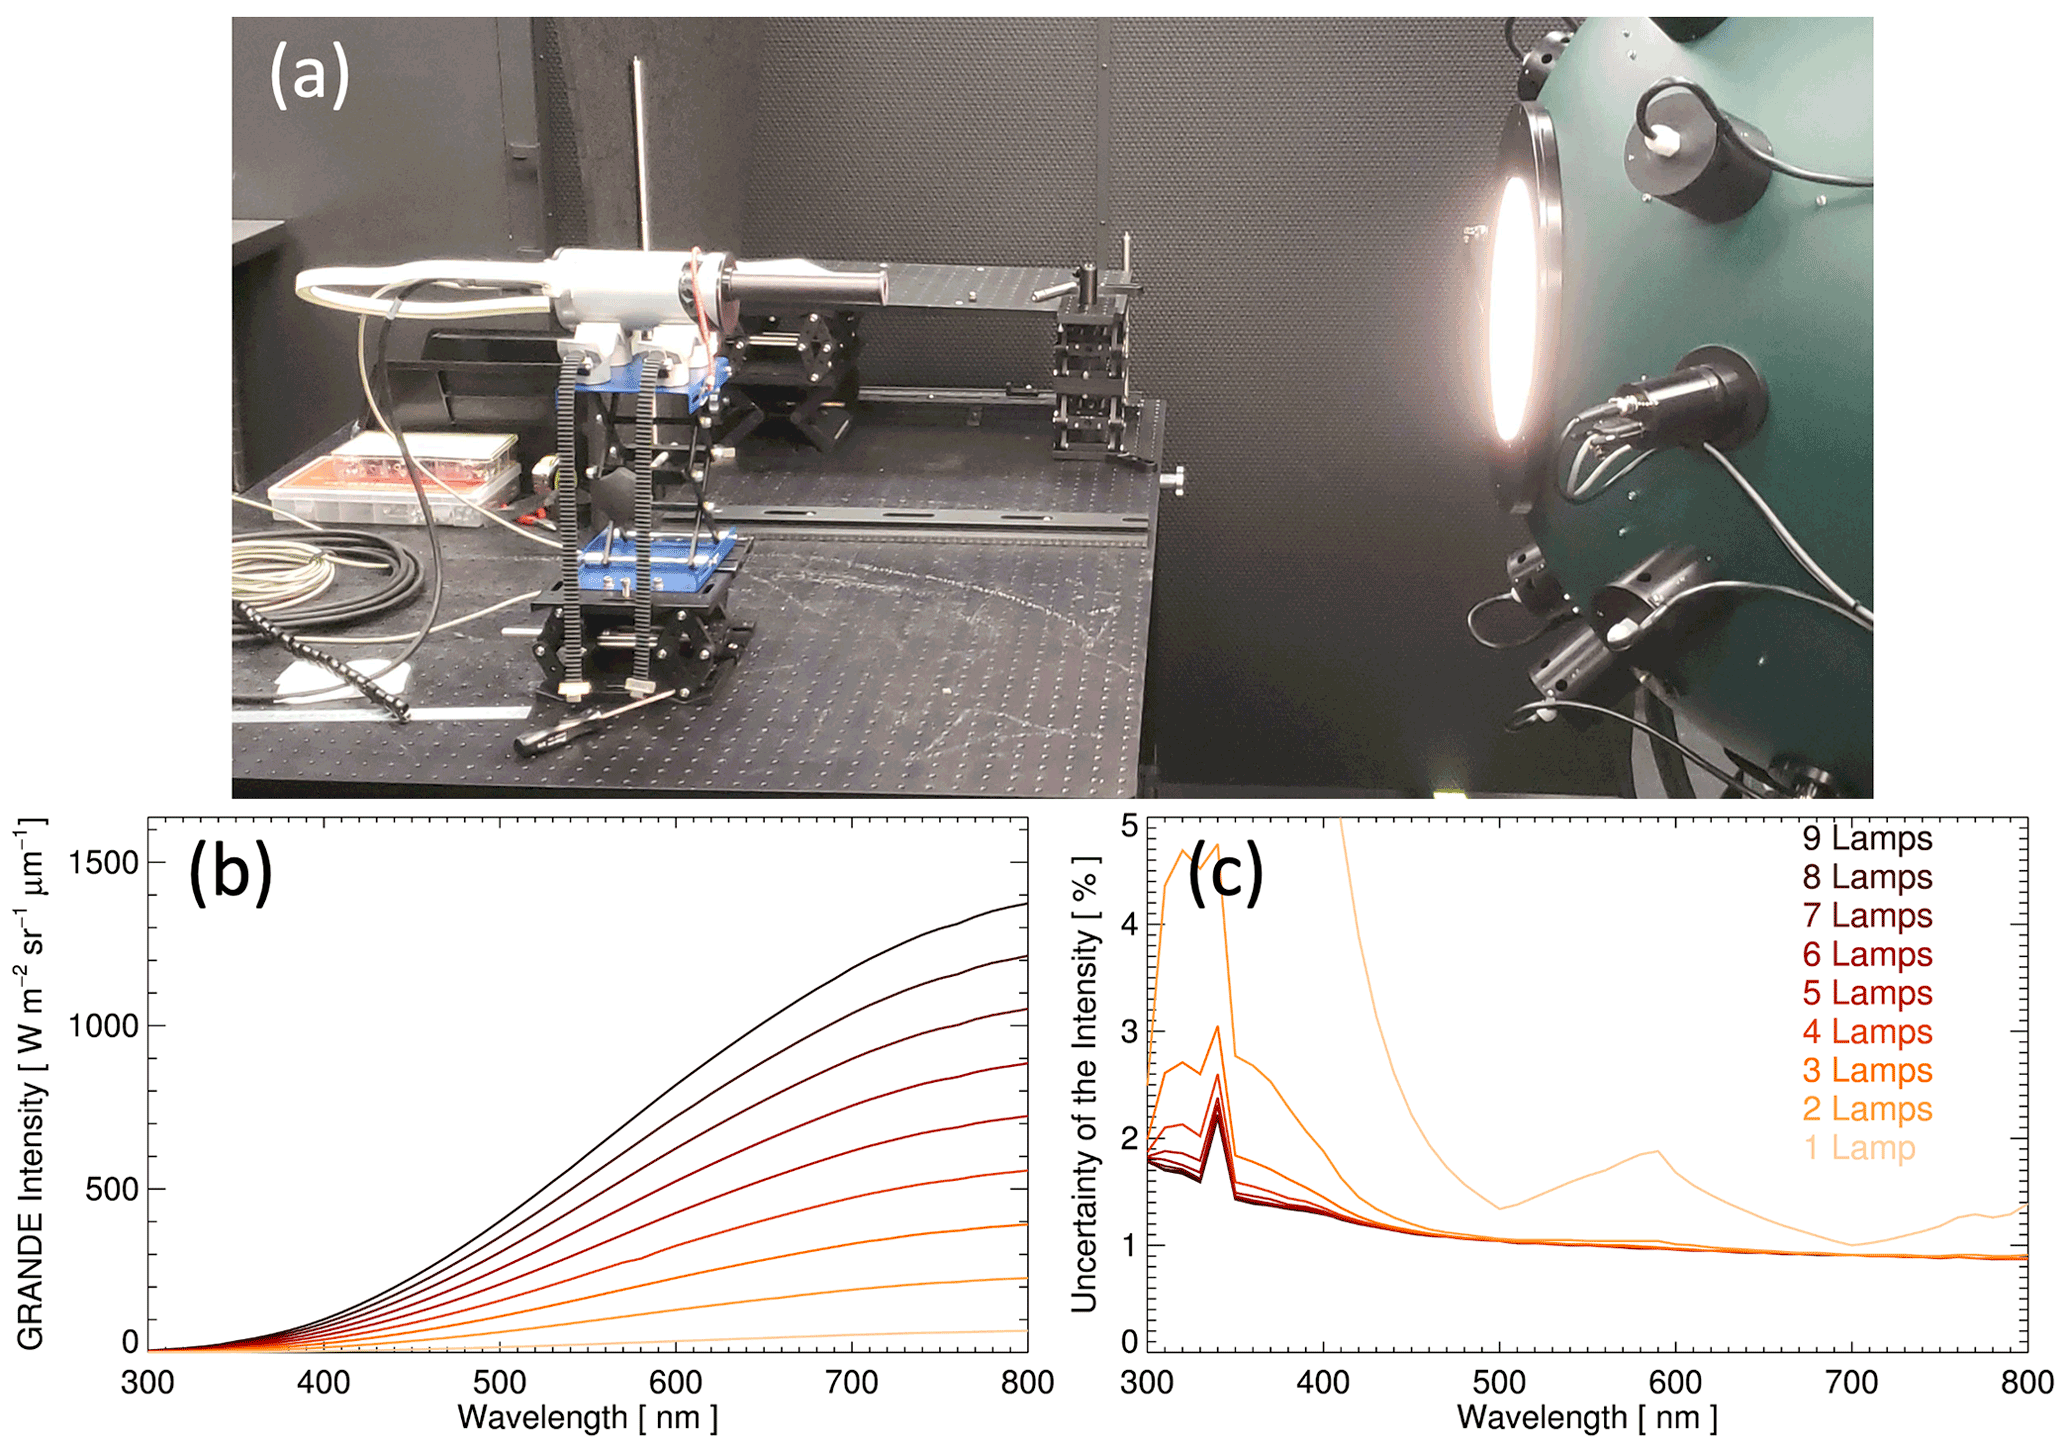
Figure 2(a) Image of SMART–s calibration using the NIST-traceable light source (Grande) at the Radiometric Calibration Laboratory, NASA Goddard Space Flight Center. Panel (b) shows the spectral radiance of Grande in 300–800 nm and (c) presents its reported uncertainty. Different colors in panels (b) and (c) indicate nine levels of the Grande radiance. The relatively higher values of uncertainty near 350 nm in panel (c) are due to the filter change of the sensor during the light source calibration.

Figure 3(a) An example of the nine-lamp Grande voltage count measurements from SMART–s (Pandora no. 48) without neutral density or bandpass filters. All 10 colors are plotted as in Fig. 2, indicating the average current measurements over 10 repetitions, which overlap almost completely. Panel (b) is the calibration coefficient, which is calculated from dividing the known Grande intensity by the average value of the measured voltage count. Panel (c) is the precision of the calibration coefficient, which is estimated by calculating 1 standard deviation of the repetitions done 10 times.
As typical radiative transfer models (e.g., Spurr, 2006; Stamnes et al., 1988) simulate normalized radiances (i.e., radiance divided by solar irradiance as a unit of inverse steradian), the reference solar spectrum is also a key parameter for converting raw voltage counts to sky radiances of the identical unit of forward model calculations. Satellite instruments can directly measure solar irradiance using the same detector with a similar optical path of the Earth reflectance measurements so that a major fraction of calibration uncertainties (e.g., slit function and radiometric coefficient) is canceled out. Although ground-based instruments also measure the solar light using an identical detector to the one used for sky radiances, they sample the solar irradiance after it has passed through the atmosphere. For that reason, their algorithms utilize other sources of the solar spectrum or estimate it from the measurements for the conversion of the sky radiances. The version 3.0 AERONET inversion algorithm utilizes solar irradiance from NOAA's (National Oceanic and Atmospheric Administration) Climate Data Record (Coddington et al., 2016; Sinyuk et al., 2020), and SKYNET derives a conversion factor of the sky radiances from direct-sun measurements based on the solid-view-angle estimation algorithm (Uchiyama et al., 2018a, b). For hyperspectral instruments such as SMART–s, a combination of the high-resolution solar spectrum and calibrated slit function is a key factor for retrieving the spectral aerosol properties, which is particularly important at wavelengths shorter than 500 nm, where spectral variability in the solar irradiance is significant (e.g., see Fig. 4a).
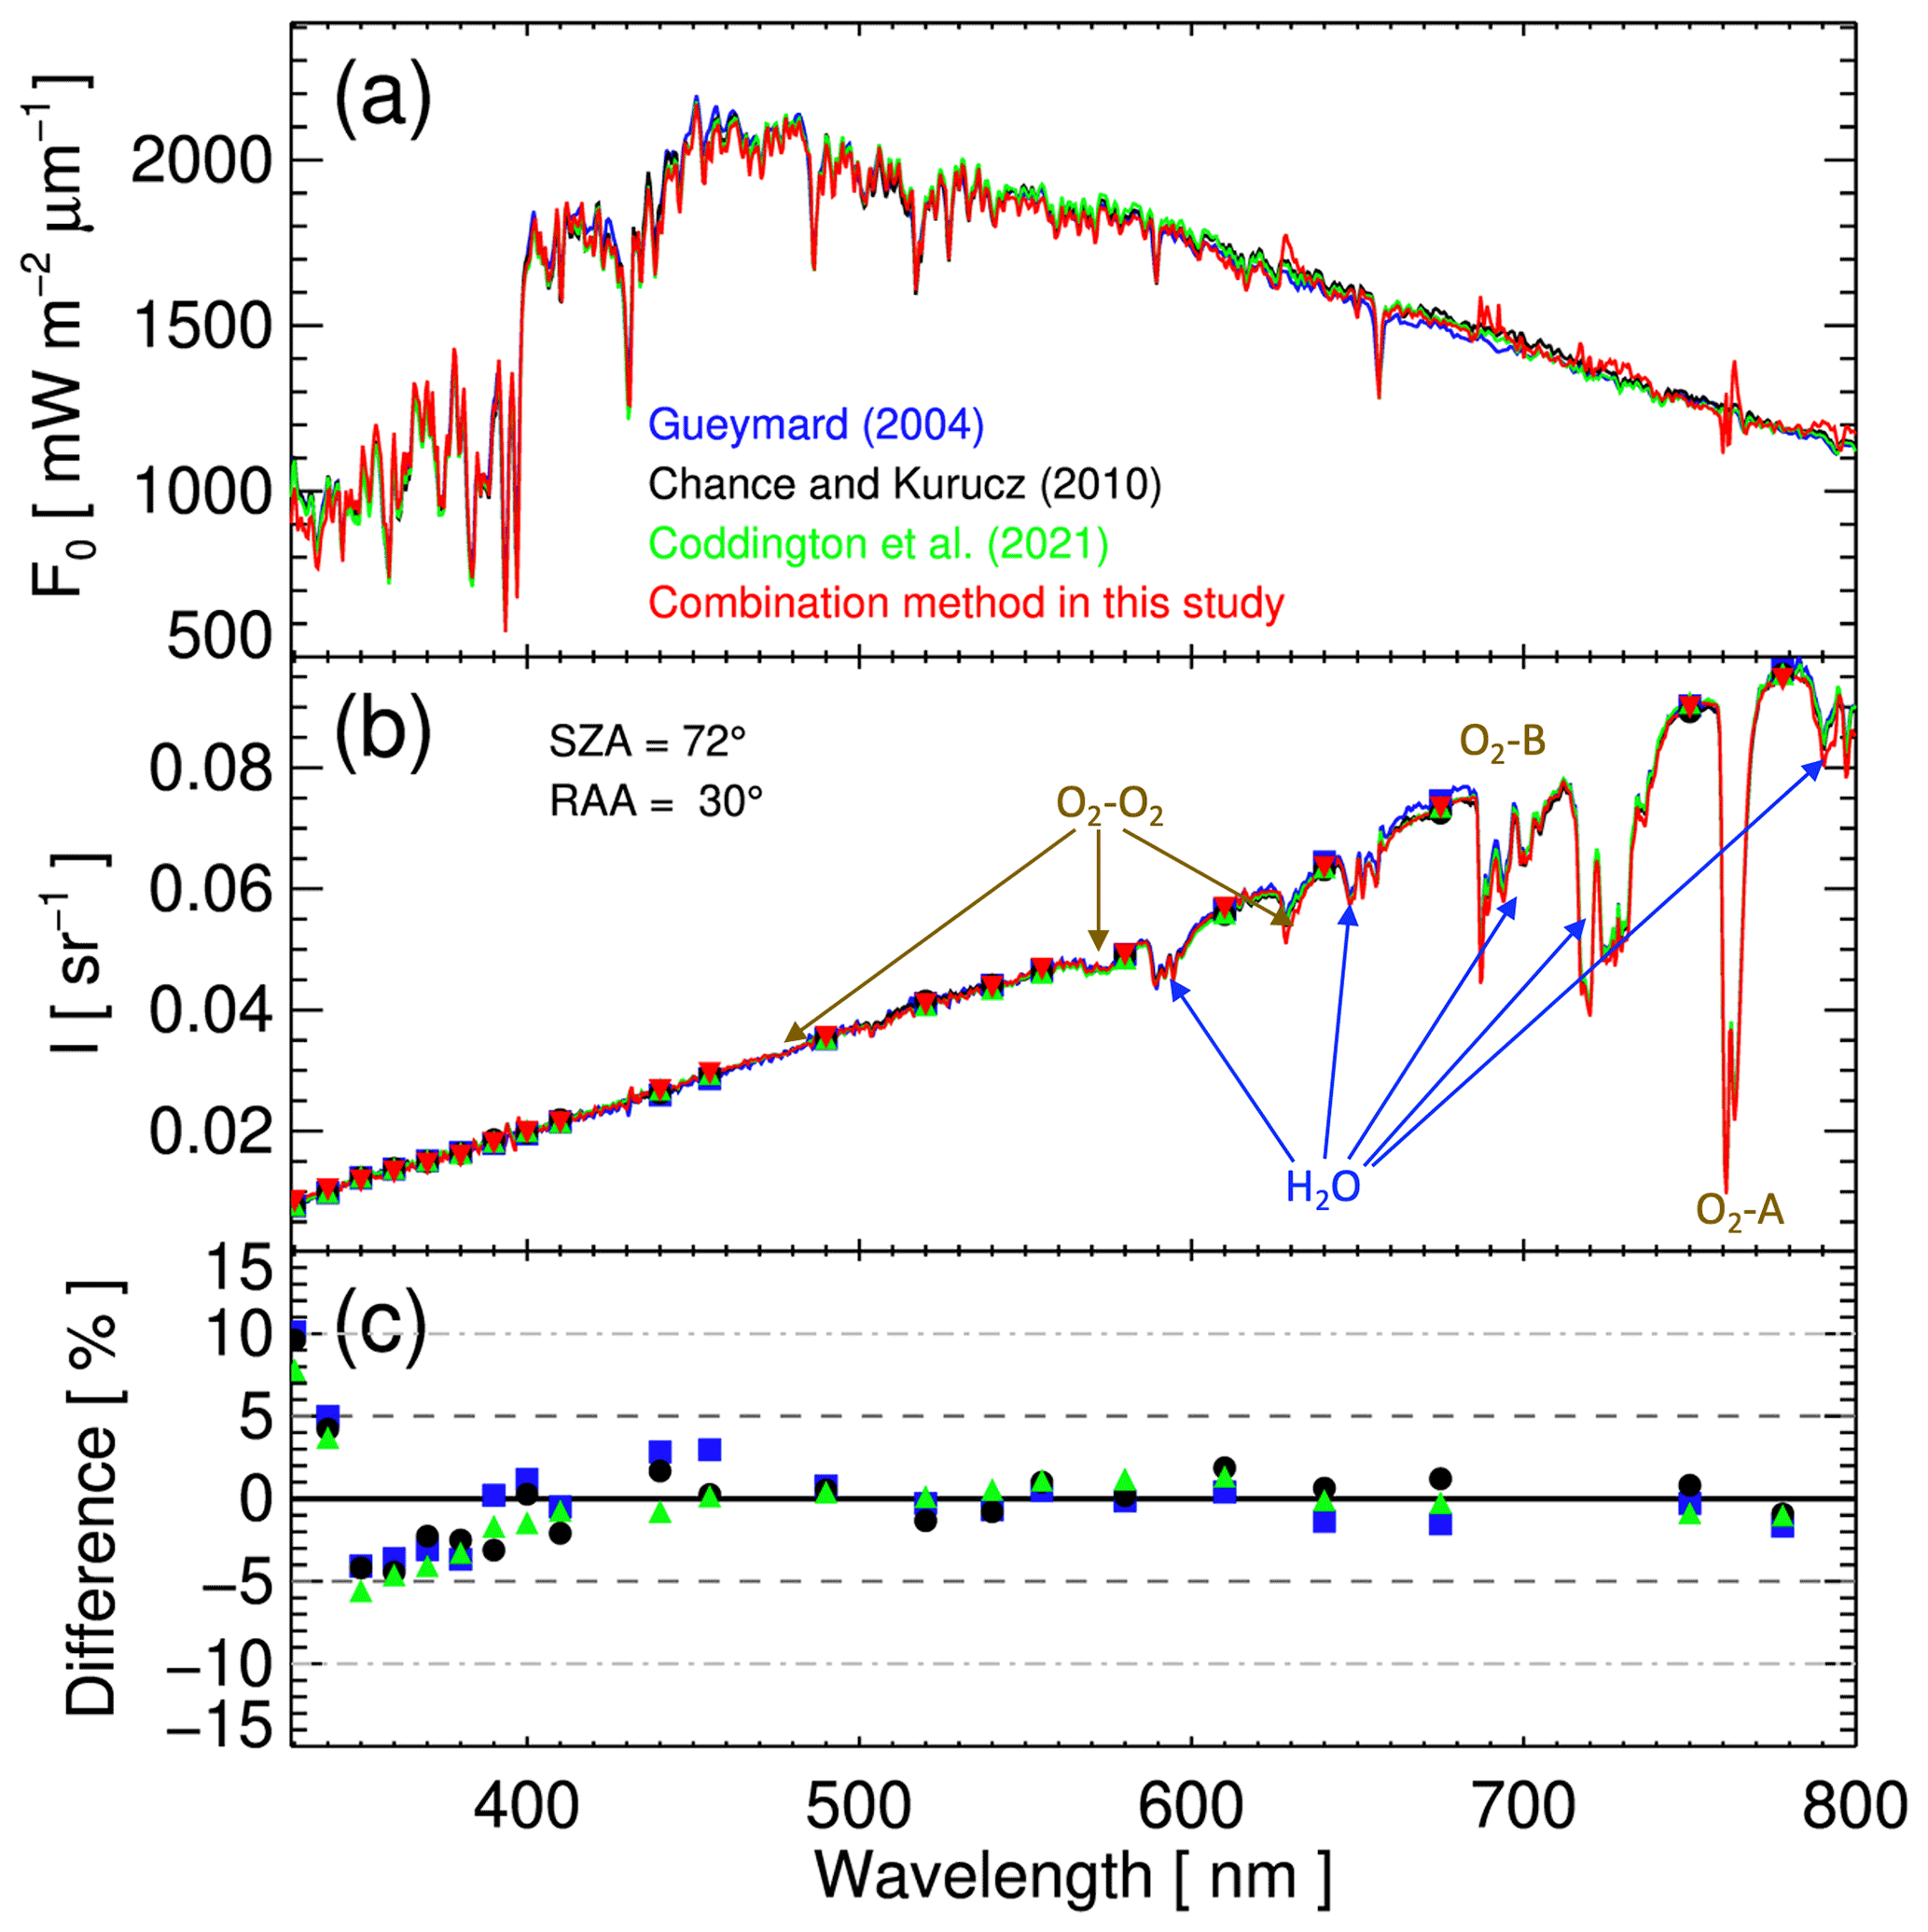
Figure 4(a) Spectral solar irradiances (F0) from Gueymard (2004; blue), Chance and Kurucz (2010; black), Coddington et al. (2021; green), and a combination method developed in this study (FComb in red). Panel (b) is an example of converted normalized radiance (radiance divided by solar irradiance; F0) measured at Fang, Thailand, on 19 March 2019. Colored lines indicate different sources of F0 for the conversion (same as panel a), and circles, triangles, and rectangles depict selected wavelengths of aerosol inversion in this study. Panel (c) presents relative biases of the FComb compared to those of Gueymard (2004; blue rectangle), Chance and Kurucz (2010; black circle), and Coddington et al. (2021; green triangle).
In the second step of the radiometric calibration, the SMART–s algorithm estimates the reference solar spectrum by combining direct-sun measurements, laboratory calibrations, and ancillary solar irradiance data. Raw voltage counts of the sky scan measurements without bandpass filters can be expressed as follows (e.g., Uchiyama et al., 2018b):
where V is the voltage count of a sky scan measurement, λ is the wavelength, C is the sensitivity of the detector to the radiance, ΩFO is the solid angle of the instrument's field of view (FOV) without bandpass filters, f is the response function of the radiometer's FOV, and I is the sky radiance. To avoid saturation, the direct-sun measurements utilize the diffuser with a spectral transmittance of Td(λ), which is measured using Grande. The measured voltage count of the solar scan can be described as follows:
where VS is the voltage count of direct-sun measurements, ΩS and ΩFD are the solid angle of the Sun and FOV of SMART–s with the diffuser, respectively. ID is a direct component of solar measurements. The first term on the right-hand side of Eq. (2) describes the contribution of direct solar irradiance, and the second term shows the scattered radiance within the FOV. Here we assume that ΩS and ΩFD are not wavelength-dependent within the SMART–s spectral range. We select the Langley calibration dates when τaer at 500 nm is less than 0.05 to minimize aerosol impacts and screen cloud-contaminated measurements. In addition, the SMART–s algorithm corrects the contribution of Rayleigh scattering of the direct-sun measurements, which is larger in the shorter wavelength (Jeong et al., 2018). Based on this process and these criteria, we assume that the second term on the right-hand side of Eq. (2) is negligible. However, unscreened thin cirrus clouds may generate diffuse light within the FOV more effectively than the aerosols due to their stronger forward scattering (e.g., Kinne et al., 1997). For plane-parallel solar irradiance measurements (f=1), VS can be approximated as follows:
where FBOA is the solar irradiance at the bottom of the atmosphere, which can be described as follows:
In Eq. (4), FV and τ denote, respectively, the extraterrestrial solar spectrum and optical thickness of the atmospheric constituents, which are derived from the Langley calibration by using the VS in Eq. (3). m is the optical air mass of each atmospheric species (e.g., aerosols, clouds, and gases). Then, the last step is normalizing the FV to known solar irradiance data for minimizing the remaining systematic calibration error by the following equation:
where is the spectral mean value of solar irradiance using the traditional method (i.e., a high-resolution reference solar spectrum convoluted by the instrument's slit function; FTrad), and is that of FV at wavelengths between 490–510 nm. FComb is the final solar irradiance for the SMART–s algorithm derived by combining the laboratory/Langley calibration and reference spectrum (i.e., Coddington et al., 2021 in this study). This spectral window (490–510 nm) is near the middle of the detector, and the solar intensity is high, with relatively fewer spectral variabilities. In addition, this spectral range avoids strong gas absorptions. By using the spectral shape of the FComb, we expect that uncertainties generated from the calibrated slit function are minimized. Despite sun/sky measurements undergoing empirical OOB stray light correction (Jeong et al., 2018), the remaining fraction may still be non-negligible in the shorter wavelengths of UV (particularly wavelengths shorter than about 330 nm; see Fig. 7c of Jeong et al., 2018). However, as FComb is supposed to be affected by OOB stray light with a comparable degree of the sky scan measurements due to their similar spectral shape, it can partially cancel out the remaining portion of stray light in the sky radiances. Figure 4a compares FComb to convoluted solar irradiance from Gueymard (2004), Chance and Kurucz (2010), and Coddington et al. (2021), which shows generally good consistency in the entire spectral range of SMART–s. Figure 4b shows an example of spectral radiances using the different solar spectrums in Fig. 4a. The colored symbols in Fig. 4b indicate the wavelength node of the aerosol retrieval, which is carefully selected to avoid strong absorption bands of atmospheric gases and major calibration errors discussed above. Figure 4c depicts relative biases of the sky radiances, which compares FComb to those using Gueymard (2004), Chance and Kurucz (2010), and Coddington et al. (2021) at the wavelength nodes convoluted from using the calibrated slit function. The biases are generally smaller than about 2 % at wavelengths longer than 500 nm and are higher in the shorter wavelength up to about 10 % at 330 nm. The relatively high discrepancies between FComb and the other solar irradiances in the UV are attributable to uncertainties in slit function, remaining OOB stray light, and FV. Note that uncertainties in the slit function affect FTrad, which may be significant in the UV. We estimate that the accuracy of FV, which does not require spectral convolution, is better than 4 % in the UV and 2 % in the VIS-NIR, based on the accuracy of the spectral τaer retrievals. Therefore, the total error of the sky radiance is estimated to be better than 5 % in the UV and 3 % in the VIS-NIR at an approximate 95 % confidence level. The impacts of the different sources of the solar spectrum on aerosol retrievals are discussed in Sect. 3.
We applied the aerosol retrieval algorithm to the measurements (both direct sun and solar almucantar scan) with sufficient amounts of photons within the target spectral range (i.e., from 330 to 800 nm), as very high aerosol loading over the area (e.g., Fig. 1b) may result in the low level of voltage counts below the detection limit (e.g., in terms of linearity and noise). Cloud-contaminated direct-sun spectra were screened by using their rapid temporal variability and spectral features (i.e., lower Ångström exponent of clouds), which are described in Jeong et al. (2018). Those for the solar almucantar measurements were removed by checking the horizontal symmetry of the scan (i.e., between clockwise and counter-clockwise half-circle scans) followed by the AERONET strategy (Jeong et al., 2020).
3.1 Comparison with the AERONET
Jeong et al. (2020) applied the SMART–s algorithm to year-long AERONET sun/sky measurements in 2016 at Kanpur, India, to assess the consistency of the methodology. The retrieved volume size distribution, V(r), from SMART–s showed excellent agreements in the fine mode but minor discrepancies in the coarse mode due to the different assumptions and constraints between the two algorithms; AERONET retrieves V(r) at 22 radius nodes over the optically effective range (i.e., from 0.05 to 15.0 µm), constrained by smoothness together with k, whereas SMART–s assumes a bimodal, lognormal distribution of the number size distribution N(r) (Dubovik and King, 2000; Jeong et al., 2020). Spectral ω0 showed excellent agreements for all wavelengths from 440 to 1020 nm, with R ranging from 0.87 to 0.95 and the RMSE (root mean squared error)/MBE (mean bias error) was less than 0.012 during that year-long period. In this section, we performed additional comparisons of aerosol property retrievals from SMART–s to those collocated from AERONET by utilizing their own measurements.
Figure 5 depicts coincident V(r) values from AERONET and SMART–s, where major fractions of the aerosols are fine-mode smoke particles and fewer but non-negligible portions are coarse particles (e.g., transported dust from the Sahara, Thar Desert, and dry areas of the Indo-Gangetic Plain). Retrieved V(r) values from both instruments show generally good agreement, which is consistent with a previous study (Jeong et al., 2020). Regarding the fact that SMART–s V(r) retrievals showed better agreement with AERONET when it is applied to the same measurements (Jeong et al., 2020), another major fraction of the discrepancies in Fig. 5 is likely attributable to the different types of measurements (e.g., spectral information and radiometric calibration). Note that the SMART–s measurement is not sensitive to aerosols with a radius greater than the optically effective range (∼ 10 µm; see Fig. 10 in Jeong et al., 2020), and the SMART–s V(r) over this range (see long tails of the blue dashed line) is mostly generated by assuming the lognormal shape of the coarse mode. Further studies to derive optimal information on aerosol size are underway (e.g., additional parameters for size distribution and/or additional modes). According to theoretical error estimates of the OEM-based algorithm in Jeong et al. (2020), a high spectral resolution of SMART–s is beneficial for the fine mode, whereas a broader spectral range of AERONET is advantageous for both modes under the same level of radiometric accuracy. More detailed comparisons and relevant discussions on the V(r) between the two algorithms are summarized in Jeong et al. (2020).

Figure 5Average volume size distribution of aerosols retrieved from SMART–s (blue dashed line) and AERONET (red solid line) from 19 March to 2 May 2019 at Fang, Thailand. The variability in the retrievals (standard deviations at each radius node) during the period are represented as vertical bars in this figure. The SMART–s spectral range is not sensitive to aerosols with a radius greater than about 10 µm, and the SMART–s retrievals over this range (see long tails of the blue dashed line) are mostly determined by the lognormal shape assumption, thus with small variability. Note that the vertical bars do not represent retrieval errors at each radius node.
To better understand and assess the two PSD retrievals at each size bin, a precise evaluation through reliable in situ measurements, such as aircraft profiles from DISCOVER-AQ (Deriving Information on Surface Conditions from Column and Vertically Resolved Observations Relevant to Air Quality), KORUS-AQ (KORea–U.S. Air Quality), and a sUAS, are essential. However, to the best of our knowledge, very limited studies compared AERONET V(r) to collocated in situ profile measurements of the PSD. Chauvigné et al. (2016) compared the PSD from AERONET (at 410 m a.s.l., above sea level) to in situ measurements at a higher-altitude site in central France (i.e., 1465 m a.s.l.) over a 1-year period, which showed a relative underestimation of AERONET (∼ 40 %). However, the in situ measurement site in Chauvigné et al. (2016) may not fully represent the total column values, which can be associated with the biases. Schafer et al. (2019) compared the AERONET V(r) to in situ aircraft profiles (altitude from about 150 to 5000 m and radius range from 0.03 to 0.5 µm) over Maryland, California, Texas, and Colorado in the United States. They showed that fine-mode PSD parameters derived from AERONET and in situ aircraft measurements generally showed good agreement (average difference of the radius of peak concentration is about 0.011 µm and that of the V(r) width is about 0.03 µm), whereas differences in the V(r) values depend on the particle radius and location (see Fig. 5 of Schafer et al., 2019). SMARTLabs (Surface-based Mobile Atmospheric Research & Testbed Laboratories; https://smartlabs.gsfc.nasa.gov, last access: 12 September 2022) is developing a sUAS-based aerosol profiling instrument for collocated measurements of spectral absorption and size distribution, which can provide valuable data for assessments of the PSD and ω0 from SMART–s. More precise validation/comparison studies are currently underway.
Figure 6 compares the retrieved ω0 from SMART–s and AERONET at overlapping wavelengths (i.e., 440 nm in the left panels and 675 nm in the right panels) during the measurement period. The ω0 retrievals from SMART–s in the upper panels of Fig. 6a and b used FTrad, whereas those in lower panels (Fig. 6c and d) utilized FComb. In general, all cases showed acceptable agreements, with absolute MBE and RMSE less than 0.02 and R ranging from 0.77 to 0.82. The ω0 of SMART–s was better correlated with that of AERONET in the shorter wavelength (i.e., 440 nm) due to the higher sensitivity of aerosols from the higher τaer. In addition, FComb generated more consistent ω0 retrievals of SMART–s with the AERONET than those using the FTrad, with a slightly lower RMSE/MBE and higher R. Figure 7a presents the mean values of the spectral τaer from SMART–s and AERONET during the measurement period, which showed excellent agreement over the SMART–s spectral coverage. Figure 7b shows those of the spectral ω0 from AERONET and SMART–s using different solar irradiances. While both versions of the ω0 values from SMART–s exhibit strong absorption in the UV, the one using FComb showed smoother spectral variability, particularly in the UV, which is selected for the SMART–s retrievals. Slight relative low biases of the ω0 from SMART–s compared to that from AERONET were also found when the SMART–s algorithm was applied to the same AERONET measurements at Kanpur, India, which are, however, still within the uncertainty range of the AERONET and SMART–s retrievals (Jeong et al., 2020). Note that AERONET also provides τaer and ω0 at longer wavelengths (e.g., 870 and 1020 nm), which are not presented in this figure.
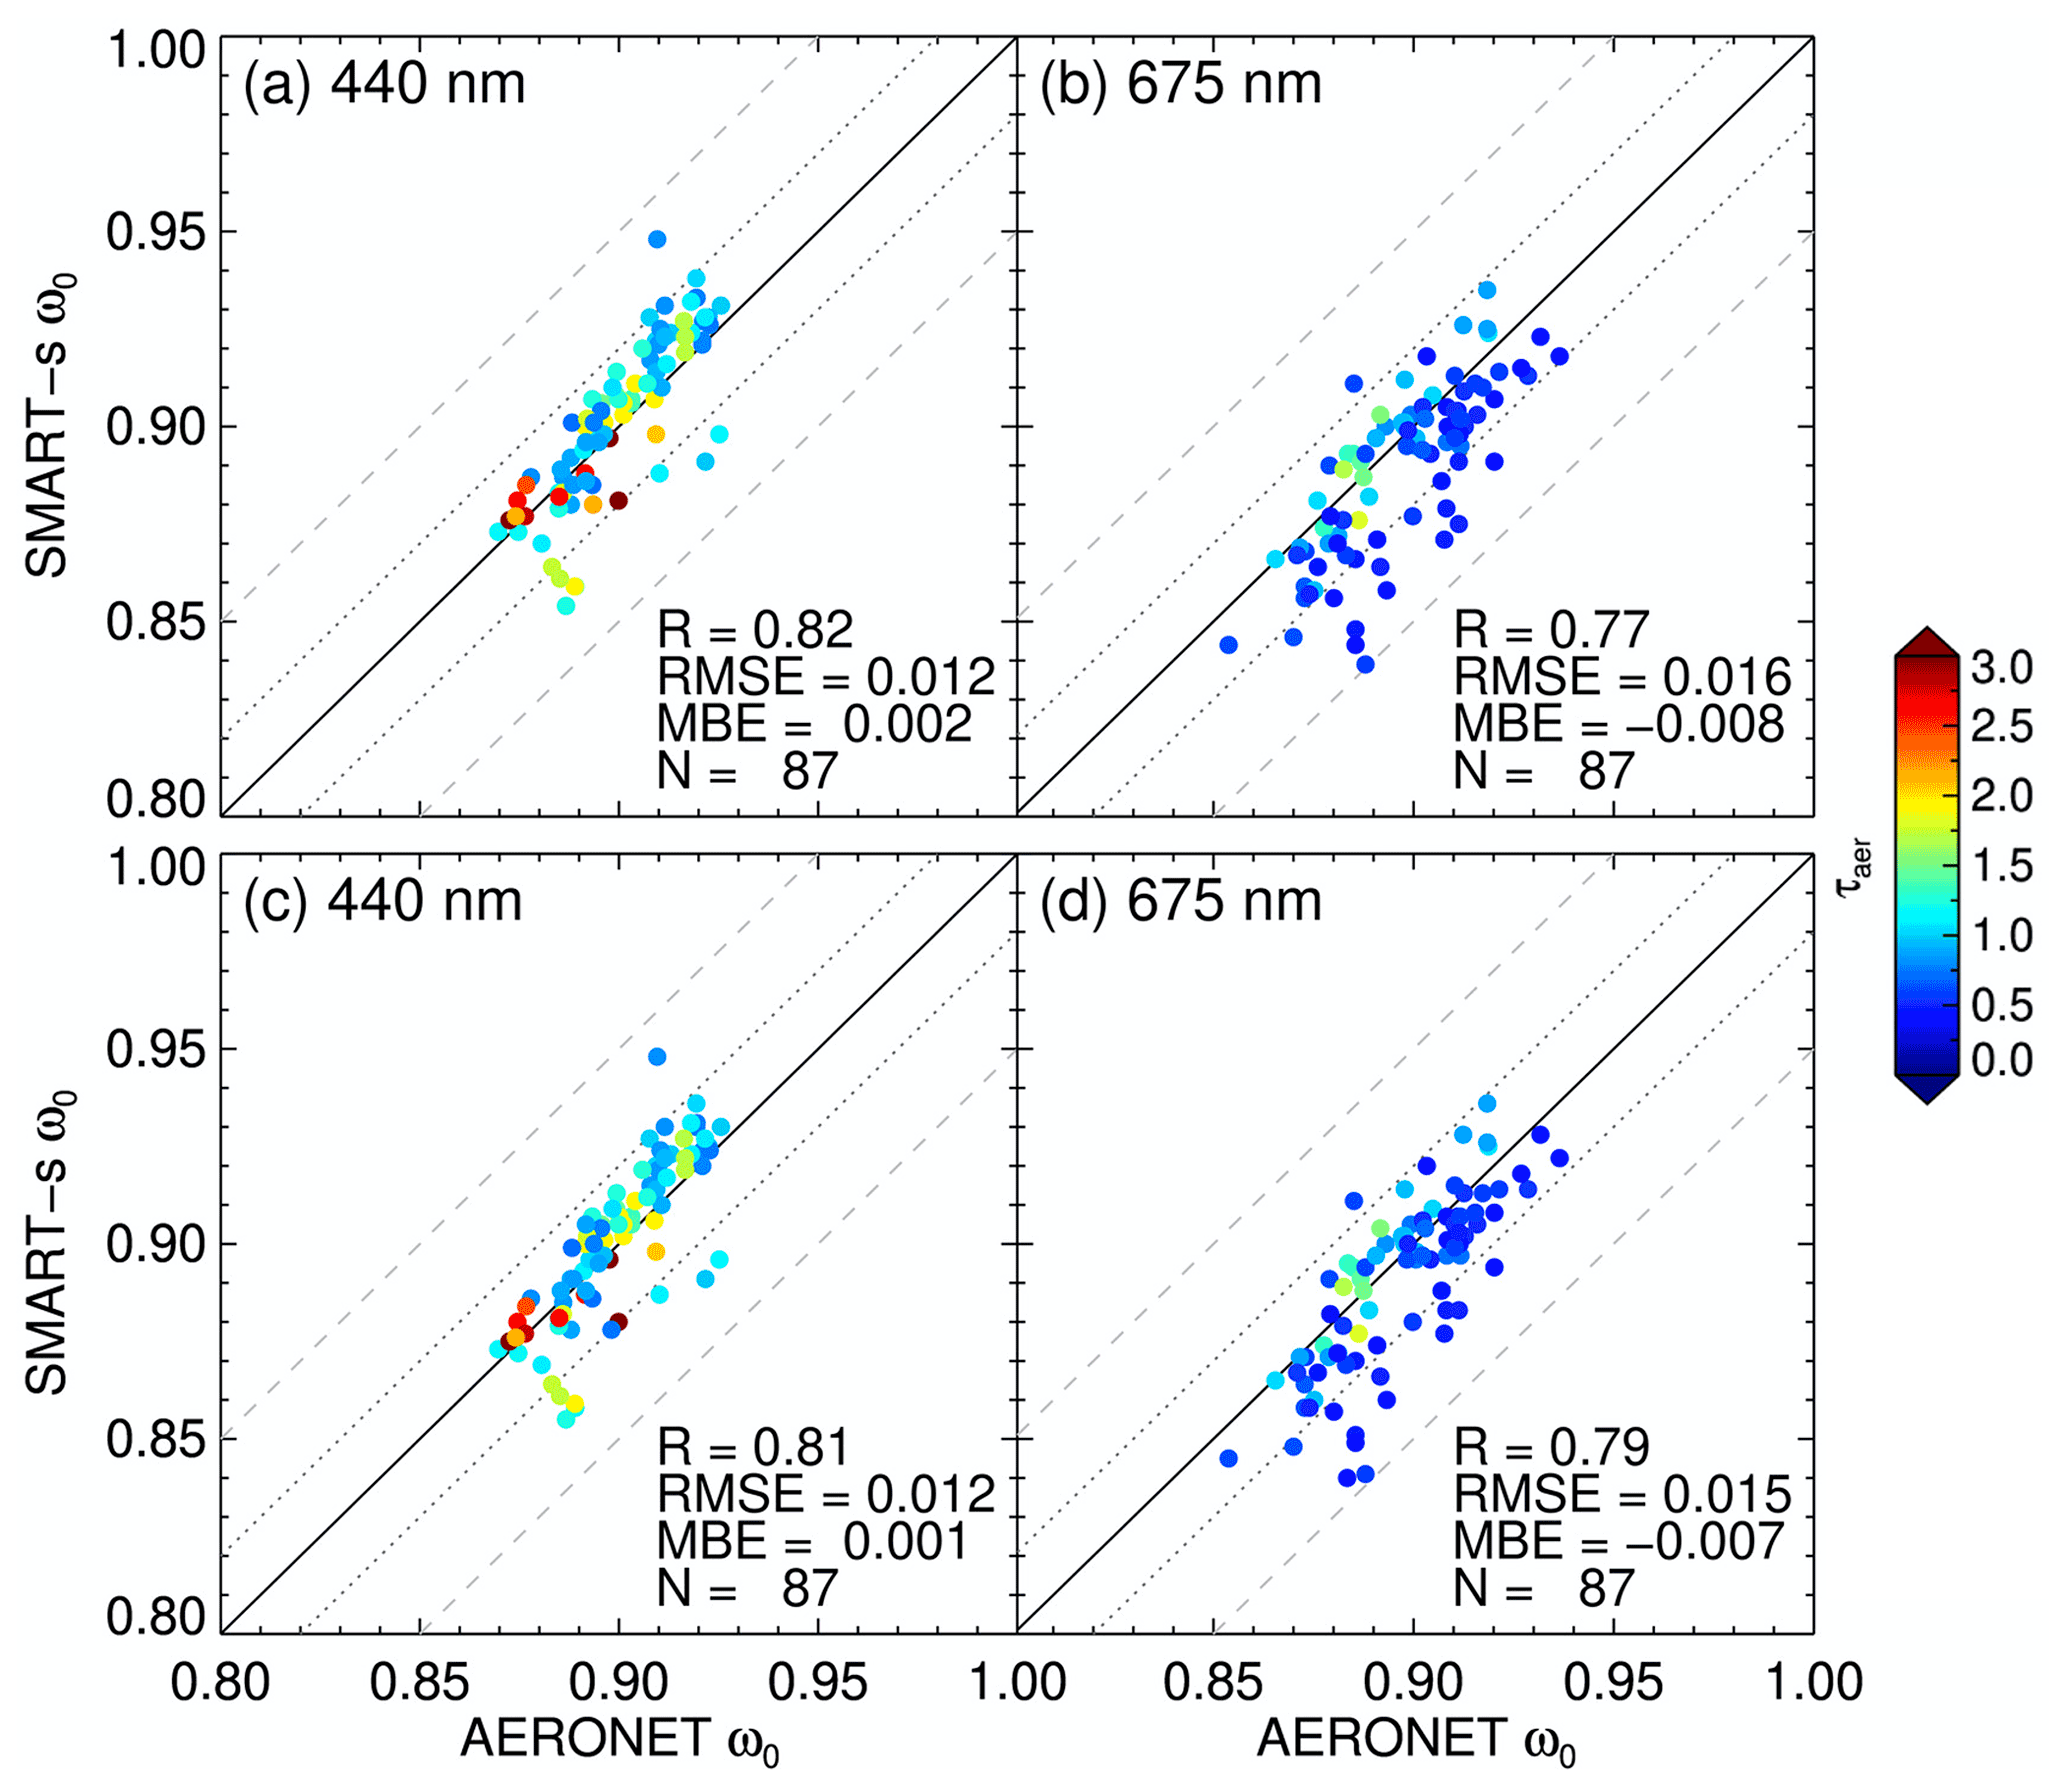
Figure 6Comparison of single scattering albedo (ω0) from SMART–s and AERONET (version 3, level 2.0) at (a) 440 nm and (b) 675 nm from 19 March to 2 May 2019. In these two panels, the SMART–s algorithm utilized solar irradiance from Coddington et al. (2021). Panels (c) and (d) are similar plots to panels (a) and (b) but for SMART–s retrievals using derived solar irradiance in this study. Colored circles represent values of aerosol optical thickness (τaer) from the color bar at each wavelength. R is the correlation coefficient, RMSE denotes the root mean square error, MBE is the mean bias error, and N is the number of samples for the comparison. The dotted and dashed lines represent, respectively, the relative biases of ±0.02 and ±0.05 from the AERONET product.
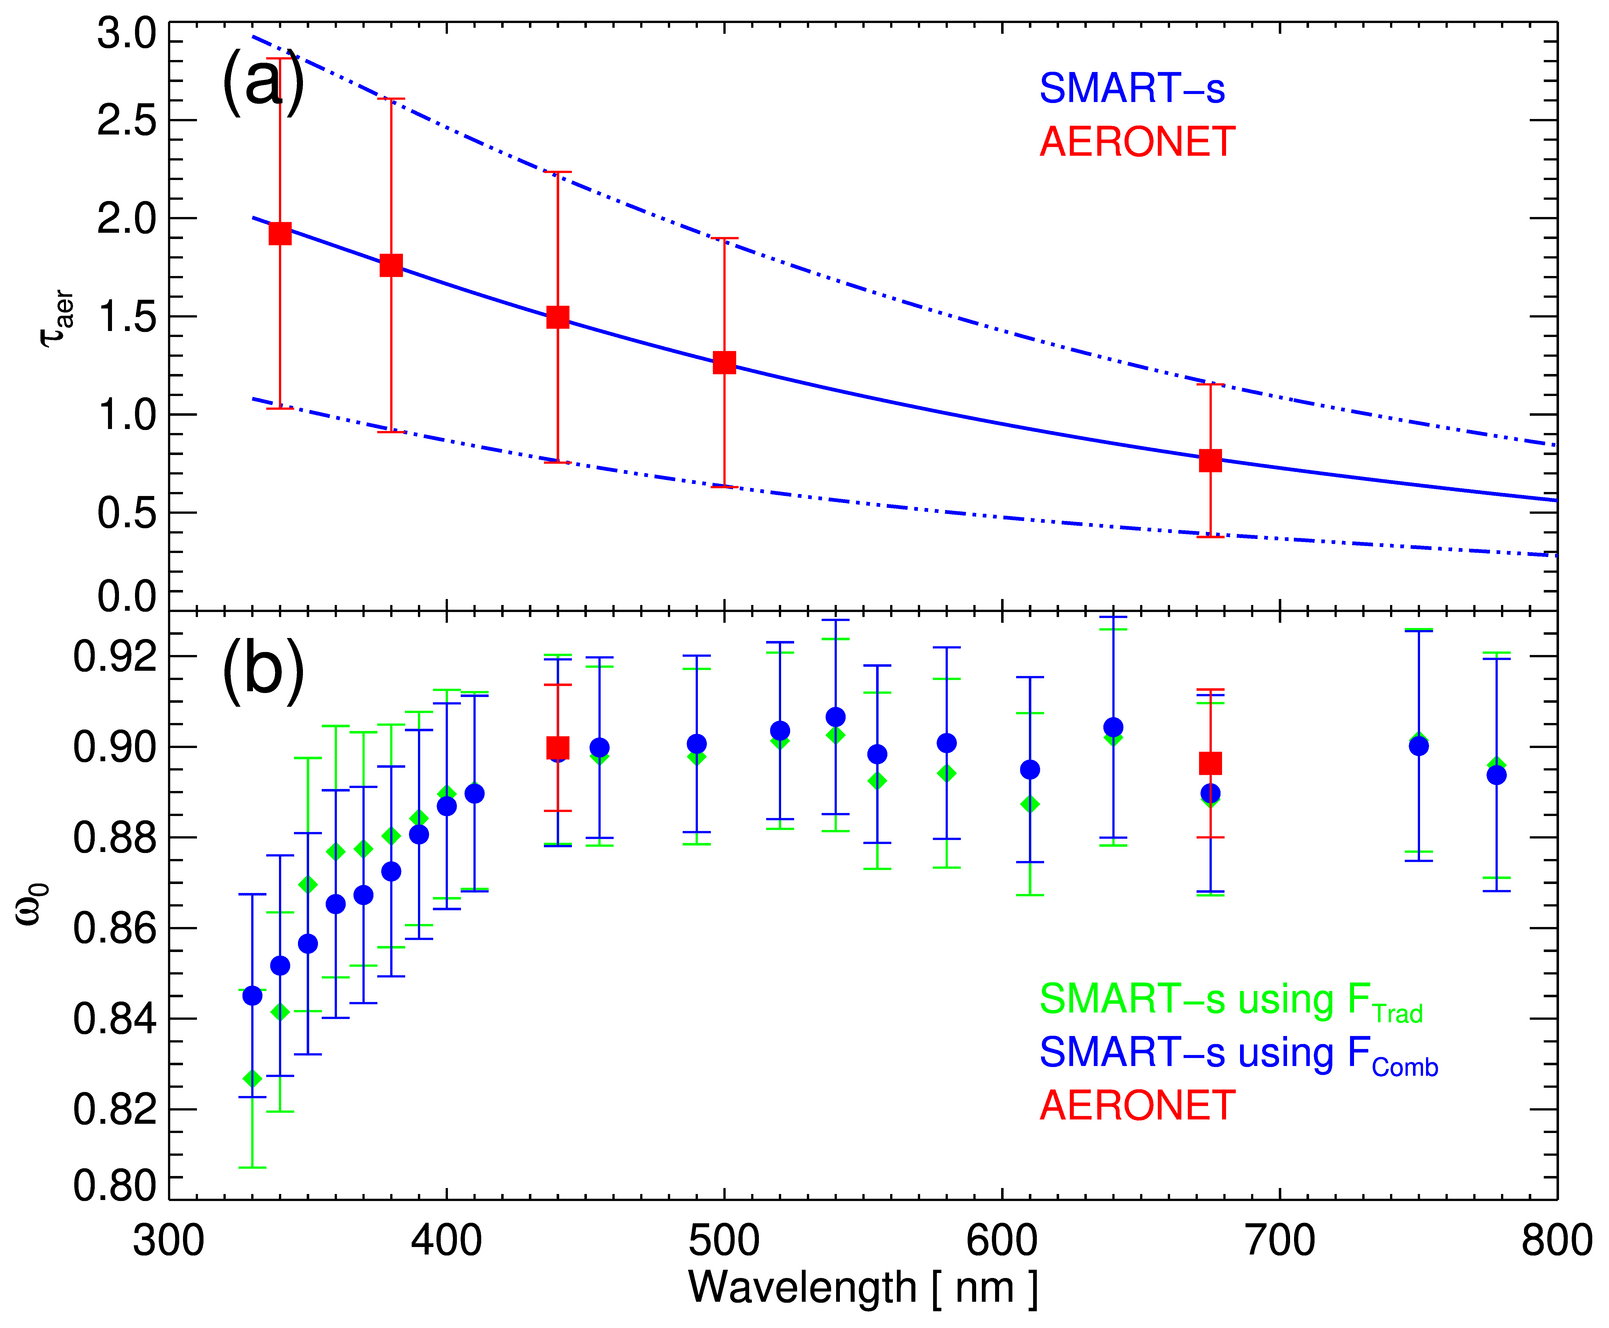
Figure 7Mean values of (a) aerosol optical thickness (τaer) from SMART–s (blue line) and AERONET (red square) within 330–800 nm spectral range measured from 19 March to 2 May 2019 at Fang, Thailand. Panel (b) shows the spectral single scattering albedo of aerosols (ω0) from AERONET (red rectangle) and SMART–s, using different solar irradiance; green diamonds used Coddington et al. (2021), and blue circles used the spectrum derived in this study. Variabilities (1 standard deviation) of each value during the deployment period are shown as dash-dotted lines in panel (a) and vertical bars in panels (a) and (b).
In Fig. 8a, the spectral n of the fine (nf) and coarse mode (nc) retrieved from SMART–s shows comparable values with the previous studies in Table 1, ranging from about 1.5 to 1.55 with smooth spectral dependencies in the UV; higher values of n of the coarse mode were found in the UV, whereas those of the fine mode were lower. These values were slightly higher than those from the collocated AERONET by about 0.01–0.04. Note that AERONET retrieves a value n for all particle sizes, whereas SMART–s retrieves each size mode (see Appendix C or Jeong et al., 2020), which may result in these differences under the assumption of the lognormal size distribution. Regarding the fine-mode-dominated smoke aerosols over the site (see Fig. 5), n from AERONET largely represents the contributions of the fine mode, and differences between nf from SMART–s and n from AERONET are within the known uncertainties of AERONET (Sinyuk et al., 2020) and SMART–s (Jeong et al., 2020). As reported in previous studies and as seen in the spectral ω0 retrievals in Fig. 7b, the spectral k from SMART–s increased significantly in the shorter wavelengths, particularly in the fine mode (see Fig. 8b). However, as the k retrievals of each mode have cross-correlated measurement sensitivity, separate analysis of each mode may have relatively larger uncertainties than the case of the n retrievals (see Appendix C, Fig. C1). More detailed temporal and spectral analyses of aerosol optical properties from SMART–s are given in the following sections, and scatterplots of the n, k, and PSD between the two instruments are shown in Appendix D.
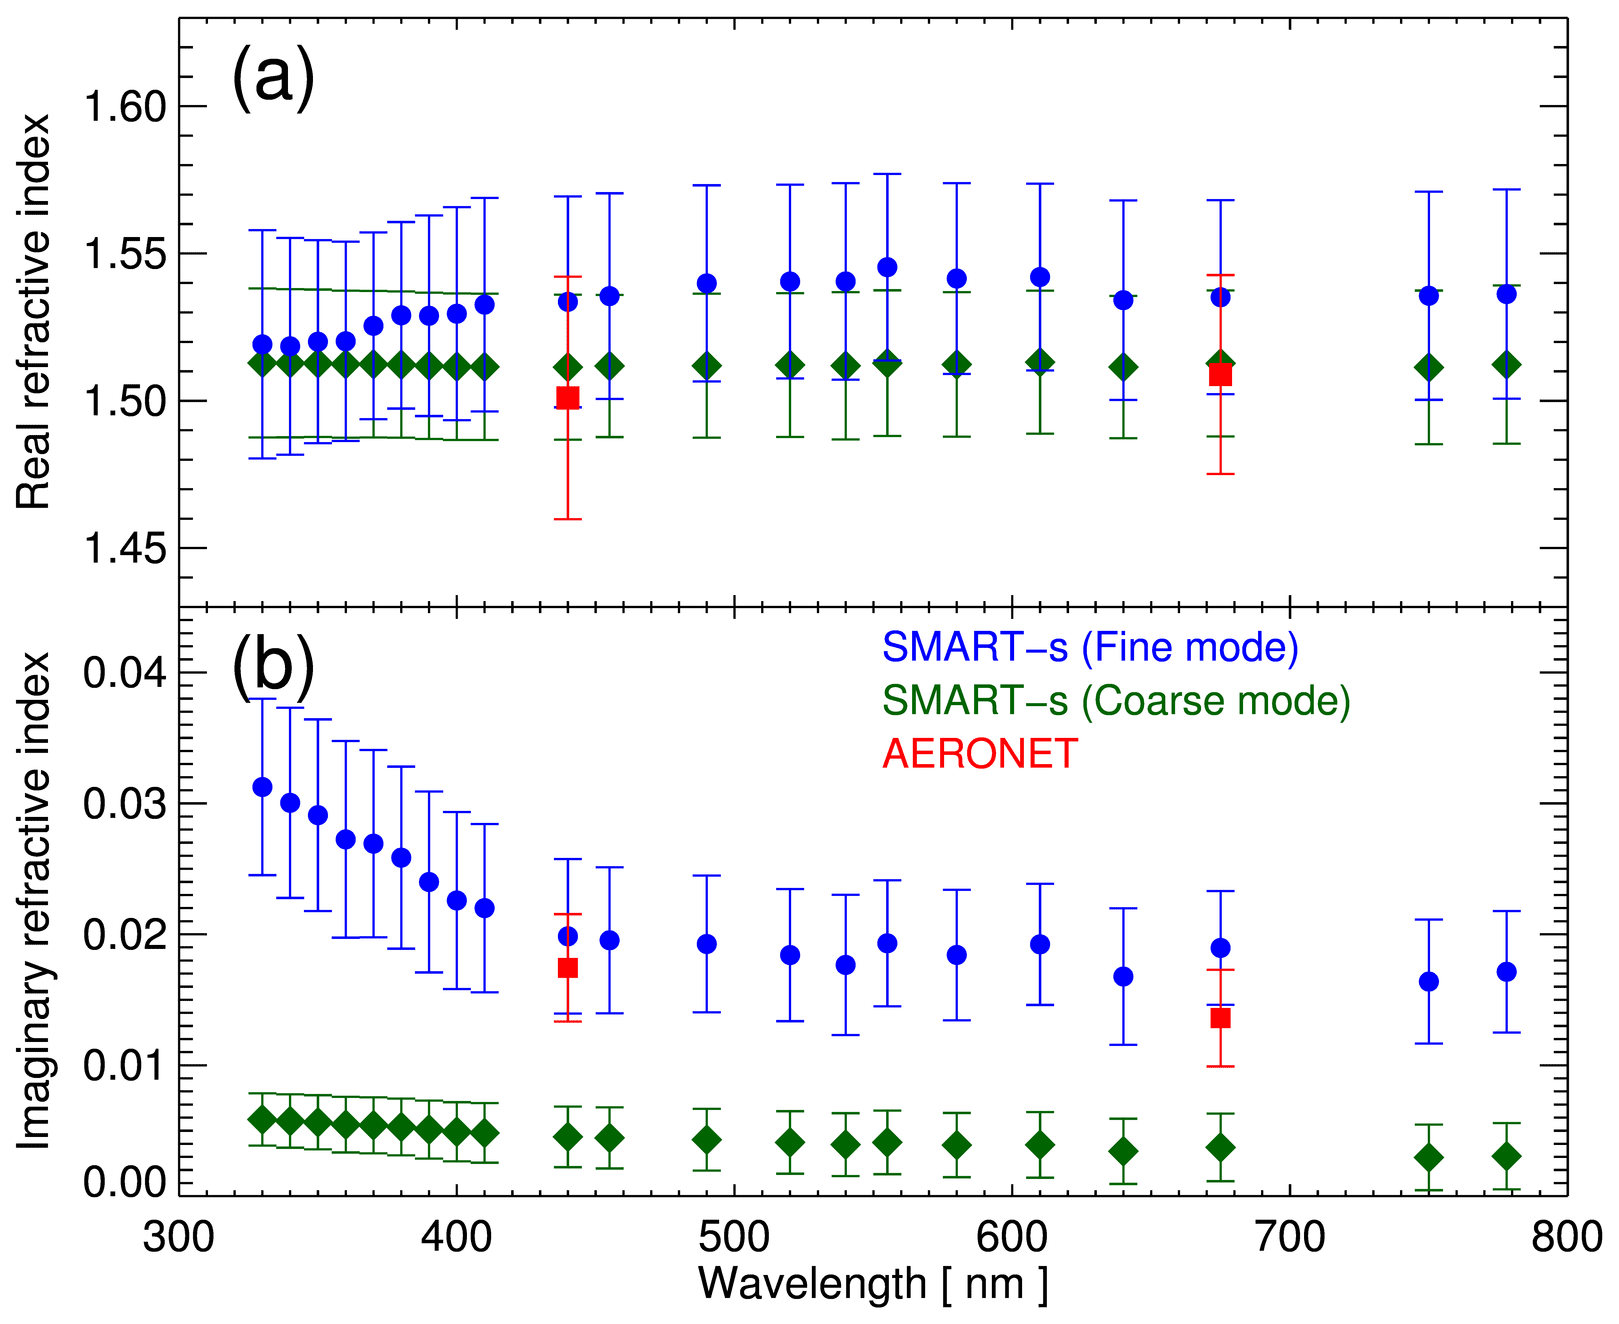
Figure 8Mean values of (a) the real part of spectral refractive index from AERONET (red square) and SMART–s (blue circle is fine mode; green diamond is coarse mode) within the SMART–s spectral range measured from 19 March to 2 May 2019 at Fang, Thailand. Panel (b) shows those of imaginary part. Variabilities (1 standard deviation) in each value during the deployment period are demonstrated as vertical bars in panels (a) and (b).
Validation or comparison of the UV aerosol properties from SMART–s remains challenging due to the limited coincident measurements. As discussed for Fig. 5, in situ profile measurements aboard the aircraft or sUAS platforms may provide reliable sets of data for validation. UV aerosol properties retrieved from other collocated instruments (e.g., Mok et al., 2018; Nakajima et al., 2020) can also offer useful data for checking the consistency and redundancy. The spectral ω0 retrievals from SMART–s are mainly determined by the ratio of the sky radiances to the τaer; highly absorbing aerosols result in the lower level of the sky radiances at a given τaer. Reliable spectral τaer from SMART–s from 330 to 800 nm supports its consistent radiometric performance (e.g., linearity and OOB stray light) over the wavelength range (Jeong et al., 2018). As SMART–s measures sky radiances using the identical detector, but without a diffuser, we expect comparable radiometric accuracy of the spectral sky measurements with relatively higher uncertainties in the UV, as discussed in Sect. 2.3. Note that our best estimate of the accuracy of the spectral radiance is demonstrated in the measurement error covariance matrix, which is considered in the estimated retrieval error (see Appendix C and Jeong et al., 2020).
3.2 Temporal variations and relationship between aerosol properties and trace gases
Total column amounts of trace gases and aerosols are basic and essential quantities not only for understanding their amounts and significance with variations over time but also for providing key constraints for higher-order retrievals (e.g., Jeong et al., 2018, 2020). Direct-sun measurements of SMART–s, AERONET, and Pandora provide very accurate retrievals of these parameters, which thereby have been used to validate/compare various satellite products over the globe. This section presents general characteristics and temporal trends of the basic quantities retrieved from SMART–s (i.e., τaer and total column amounts of O3, NO2, and H2O) and then analyzes higher-order retrievals of aerosol properties by comparing them with these quantities.
Figure 9 shows temporal variations in the τaer at 500 nm and total column amounts of NO2, H2O, and O3 during the entire deployment period from SMART–s and AERONET. The red circles in Fig. 9a demonstrate aerosol optical thickness at 550 nm from the VIIRS DB product, and those in Fig. 9d depict OMI retrievals based on the TOMS version 8.5 algorithm (Bhartia and Wellemeyer, 2002). In general, the τaer, H2O, and O3 retrievals from SMART–s showed excellent agreement with those from the AERONET, VIIRS, and OMI during the measurement period (see the statistical values in Fig. 9a, c, and d). Scatterplots of these parameters are shown in the Appendix (Fig. A2).
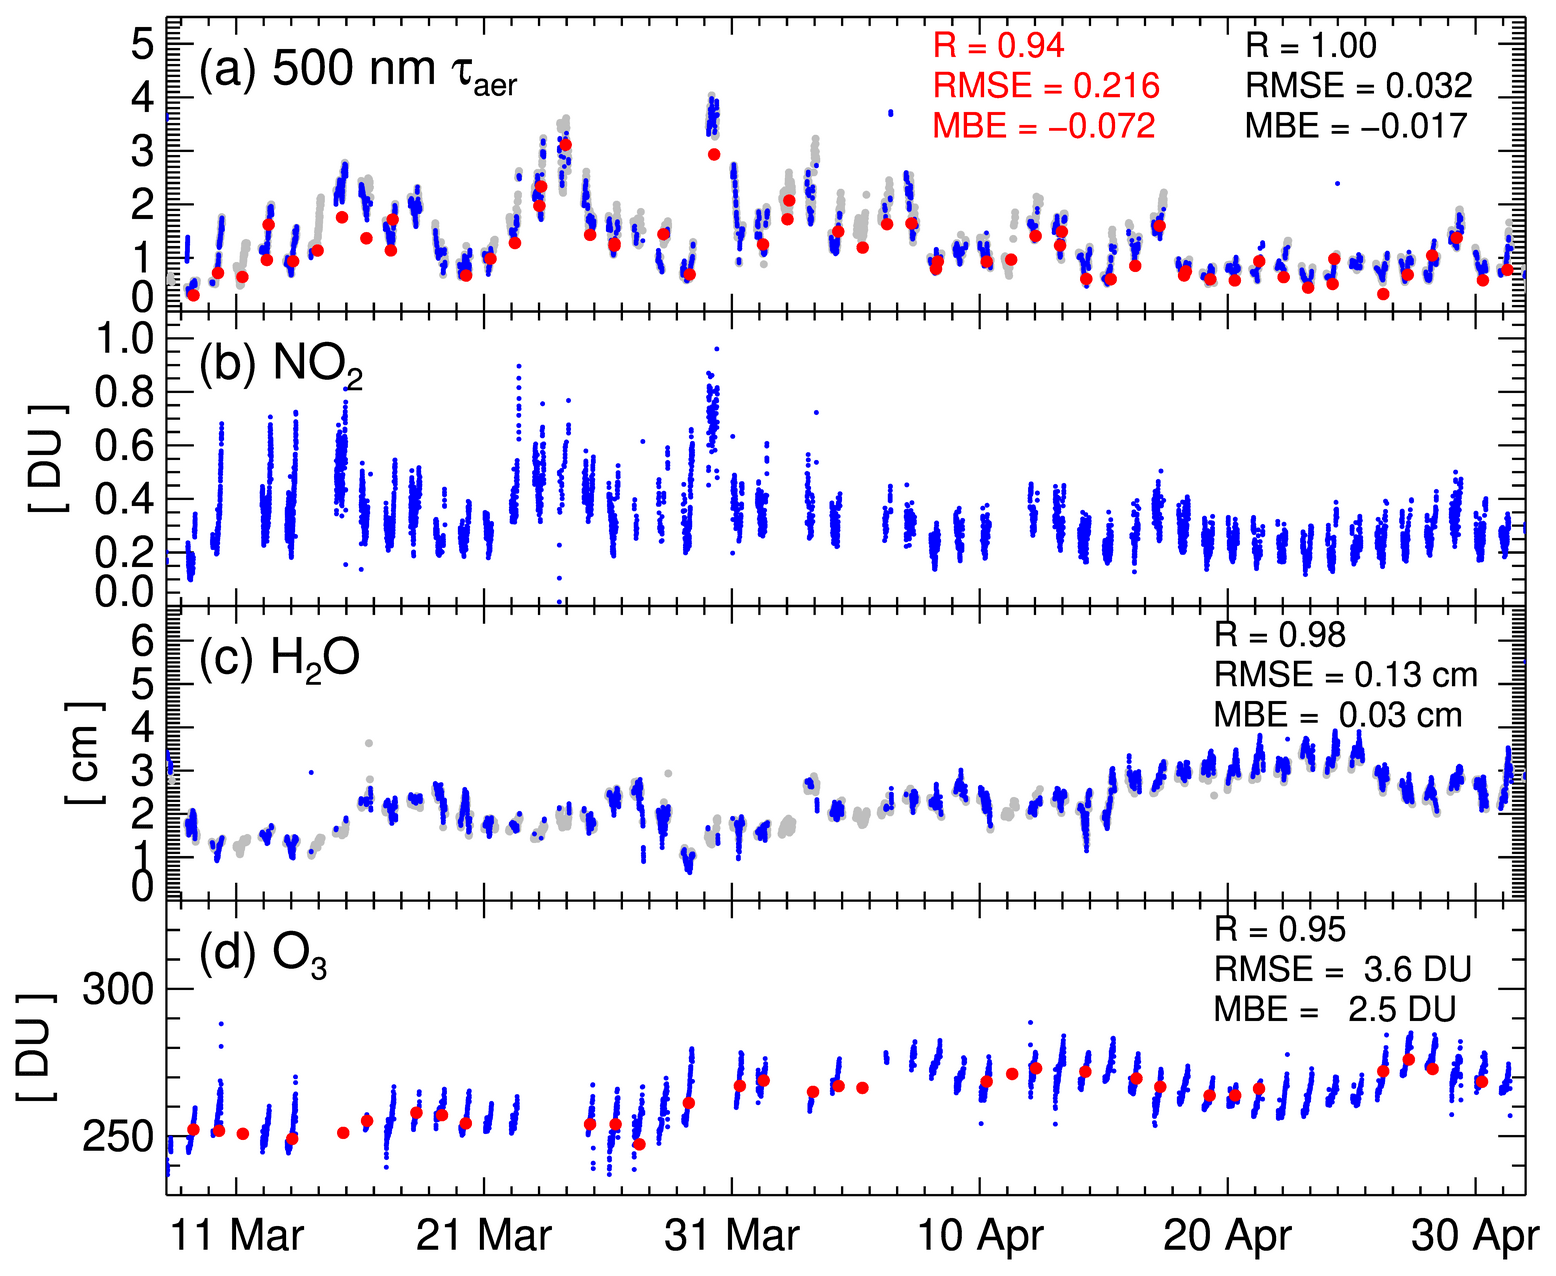
Figure 9Temporal variations in total columns of (a) aerosol extinction at 500 nm, (b) nitrogen dioxide, (c) precipitable water vapor, and (d) ozone at Fang, Thailand, in 2019. The blue circles are from SMART–s retrievals, and the gray circles in panels (a) and (c) show those from AERONET. In panel (a), the red circles indicate aerosol optical thickness at 550 nm from VIIRS Deep Blue (DB), while those in panel (d) depict total column ozone retrievals from OMI (TOMS version 8.5). The correlation coefficient (R), root mean squared error (RMSE), and mean bias error (MBE) in panels (a), (c), and (d) are between collocated SMART–s and AERONET/OMI data in black, and those in red in panel (a) are between SMART–s and VIIRS DB retrievals.
Itahashi et al. (2018) analyzed high values of NO2 from winter to pre-monsoon seasons over Southeast Asia based on satellite retrievals (i.e., SCanning Imaging Absorption spectroMeter for Atmospheric CHartographY, or SCIAMACHY; Bovensmann et al., 1999) and model calculations (i.e., Community Multi-scale Air Quality, or US EPA Office of Research and Development, 2021), and reported that emissions from biomass burning are attributable to the seasonal variation. They also estimated the contributions of biomass burning emissions to the total column NO2 to be about 28 % during 2003–2008, which was up to 58 % in March 2004. Khodmanee and Amnuaylojaroen (2021) estimated the contribution of biomass burning to the NO2 concentration over northern Thailand in March 2014 to be higher than 90 %, based on the WRF-Chem (Weather Research and Forecasting model with Chemistry) calculations. Another WRF-Chem study suggested that increase in NO2 due to the biomass burning emission is up to about 60 % over Southeast Asia from March to May 2005 (Jena et al., 2015). During the measurement period, a large amount of NO2 from SMART–s is also accompanied by high τaer at 500 nm, with a correlation coefficient (R) of about 0.74, which indicates the common emission sources (i.e., biomass burning) of aerosols and NO2 during the events, as shown in Fig. 9a and b.
Interaction between atmospheric H2O and aerosols is one of the primary factors in determining aerosol scattering and absorption properties (e.g., Burgos et al., 2019). Particularly for organic aerosols, molar mass and water content are dominant parameters for characterizing their phase state (e.g., Koop et al., 2011). The moisture-induced phase transition of organic particles from a glassy to a semisolid state also accelerates the uptake of reactive gases in the atmosphere by decreasing viscosity and increasing diffusivity (Shiraiwa et al., 2011). In addition, the condensed water provides a medium for multiphase reactions, thus activating the gas-to-particle conversion of inorganic and organic molecules (Herrmann et al., 2015). The formation of the secondary species through heterogeneous reactions generates further feedback to the aerosol–atmosphere system by enhancing the water vapor absorption and hygroscopicity of aerosol particles (e.g., Tang et al., 2016; Wu et al., 2018). Serving as cloud condensation nuclei (CCN), the physicochemical states of aerosols strongly influence cloud microstructure, thereby affecting the radiative properties of clouds, circulation, and thermodynamics of the atmosphere (e.g., DeMott et al., 2010). During the intermediate period from the dry to monsoon season in 2019, column-precipitable H2O gradually increased from about 1 cm in March to over 3 cm in May, as shown in Fig. 9c. Note that these mutually interacting species (i.e., τaer, NO2, and H2O) are retrieved simultaneously from the same solar measurements using a ground-fused silica diffuser, which can provide valuable information for further studies. Temporal variation in ozone in Fig. 9d is mostly associated with fractions in the stratosphere, which also gradually increased from March (∼ 250 Dobson units, DU) to May (∼ 275 DU). Although the total column O3 is not necessarily relevant to the major topic of this study, it is one of the key constraints of the future algorithm for estimating its tropospheric amounts (Jeong et al., 2020). It should also be noted that SMART–s covers the O3 Chappuis band in the VIS, which can complement its lower spectral resolution than that of the standard Pandora for profile retrieval (e.g., Natraj et al., 2011).
Figure 10 presents the temporal variations in ω0 and H2O in panel (a) and those of nf and nc in panels (b) and (c), respectively. The red circles and black squares show the retrievals at 330 and 550 nm, respectively, and their error bars indicate the estimated retrieval error (εret) based on the optimal estimation method (OEM; e.g., Jeong et al., 2016, 2020; also see Appendix C). Note that εret is calculated for each retrieval, which is an important merit of the OEM for relevant studies. As shown in Fig. 10a, ω0 and H2O gradually increased as biomass burning activities decreased approaching the monsoon season (R=0.65 between ω0 and time and 0.70 between H2O and time). Interestingly, the correlation between the ω0 and H2O was even higher (R=0.81 for ω0 at 330 nm) than their temporal trends, as shown in this figure. Eck et al. (2013) reported a similar increasing trend of the ω0 from long-term AERONET and OMI measurements over southern Africa. They suggested that a trend of decreasing black carbon content (e.g., due to more smoldering rather than flaming combustion) in the aerosol composition during the progress of burning can be a major reason for aerosol growth through aging, coagulation, or hygroscopic swelling, since size-related aerosol parameters such as the Ångström exponent (AE) and volume median radius did not show a meaningful seasonal trend. However, in this study, the retrieved nf time series in Fig. 10b exhibited a slightly decreasing trend over time with a reliable retrieval accuracy (); this is consistent with the effects of the hygroscopic growth of aerosols, for which nf values decrease (or come closer to the n of water) as a particle grows by water vapor uptake (e.g., Michel Flores et al., 2012; Valenzuela et al., 2018). Meanwhile, nc retrievals are estimated to be highly uncertain () due to the very limited information on coarse-mode aerosols, as shown by large standard deviations in Fig. 10c; the high values of εret are attributable to the SMART–s spectral range, which is narrower than that of the AERONET, and fine-mode-dominated smoke aerosols over this area (see Fig. 5).
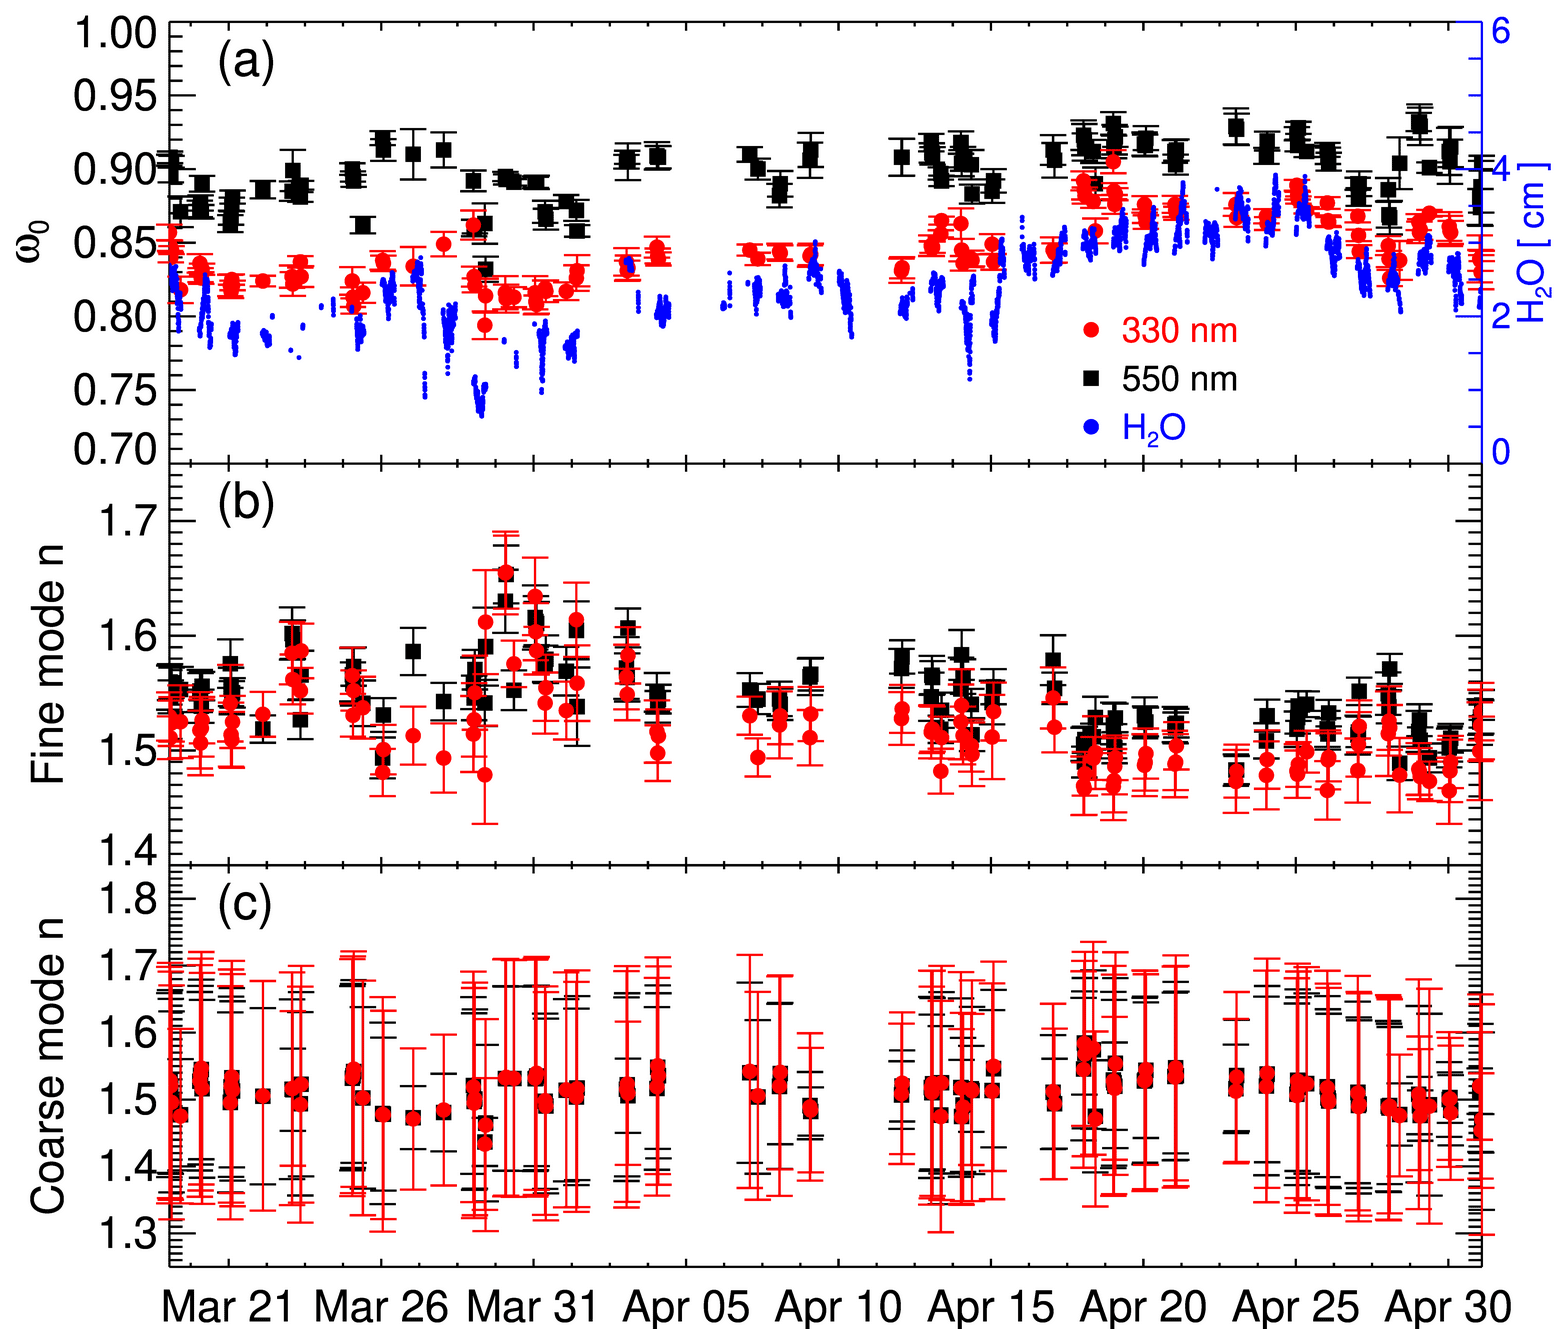
Figure 10Temporal variations in (a) total aerosol single scattering albedo (ω0), the real part of the aerosol refractive index (n) of the (b) fine mode and (c) coarse mode retrieved at Fang, Thailand, in 2019. The red circles and black squares indicate retrievals at 330 and 550 nm, respectively. The vertical bars indicate estimated errors of each retrieval, based on the optimal estimation method. The small blue circles in panel (a) represent total column H2O retrievals from SMART–s.
To further investigate the effects of H2O on biomass burning aerosol properties over the experiment regions, we have also examined the relationships of variations in nf, ω0, and the weighted mean radius of the fine mode and AE with changes in H2O amounts. Figure 11a and b compare the retrieved nf and ω0 to the total column amount of H2O during the period. As previously discussed, nf is negatively correlated with the H2O (R ranging from −0.57 to −0.61), whereas ω0 showed a high positive correlation for both the UV and longer wavelengths (R = 0.74–0.81). Figure 11c and d show the relationship between the weighted mean radius of the fine mode and AE (y axis) to the column-precipitable H2O (x axis) from SMART–s. Figure 11c shows two types of weighted mean radius, namely the area-weighted mean radius (ra; often called the effective radius) and the volume-weighted mean radius (rv). ra has a proportional relationship with light extinction by particles, which is utilized by aerosol retrievals, including the SMART–s algorithm, whereas rv has a linear relationship with the volume growth of aerosols. ra and rv of the fine mode are calculated by the following equations, where the radius of 0.01 and 0.7 µm are the lower and upper size limit of the fine-mode particles, respectively.
As shown in Fig. 11c, both ra and rv showed a positive correlation with H2O (R=0.42 and 0.56, respectively), which is higher for rv. The short wavelength range AE is another good indicator of the fine-mode particle size (Reid et al., 1999; Eck et al., 2001), which is known to have a negative correlation with the size. The AE and absorbing AE (AAE) are calculated as follows:
where τabs is the absorbing aerosol optical thickness (Eq. 10), as follows:
The AE calculated using both pairs of wavelengths showed a negative correlation with H2O (R ranging from −0.46 to −0.38).

Figure 11Relationship between aerosol properties and column-precipitable H2O retrieved from SMART–s over Fang, Thailand, from 19 March to 2 May 2019. Panels (a) and (b) compare the real part of the refractive index of the fine mode (nf) and aerosol single scattering albedo (ω0) to H2O, respectively. For the upper panels, blue and red represent nf and ω0 at 330 and 550 nm, respectively. Panels (c) and (d) compare the weighted mean radius (rw) and Ångström exponent (AE) to the column precipitable H2O, respectively. The blue and red symbols in panel (c) represent the area- and volume-weighted mean radius, and those in panel (d) indicate different wavelength pairs for the AE calculations (blue at 440 and 555 nm and red at 410 and 750 nm).
NO2 in the smoke plume may contain information about the degree of aging after emission. The lifetime of NO2 is short (typically less than a few hours), and the brown carbon uptakes NO2 by photochemical processes; thus, the NO2 concentration likely decreases through the aging processes of the smoke plumes (e.g., Laskin et al., 2015). Therefore, lower values of nf (Fig. 12a) and higher values of ω0 (Fig. 12b) at lower amounts of NO2 (likely related to the aged plume) support the fact that their temporal variations may also be associated with the accelerated aging processes of smoke aerosols by increased H2O. Even with the lower correlations, the size-related parameters in Fig. 12c and d also indicate that smoke aerosols are likely growing under lower amounts of NO2 during the pre-monsoon period; NO2 showed a negative correlation with rv and positive correlation with AE. However, note that the correlations of nf, ω0, rv, and AE with NO2 also can be attributed to independent trends of emission and photochemical reactions of NO2, which are not necessarily associated with the aerosol aging processes. More sophisticated studies combining model simulations and intensive measurements may be able to clarify relationships between NO2 and aerosol properties. In general, the results in Figs. 10–12 suggest that aerosol aging processes including hygroscopic growth also can be a critical parameter impacting temporal trends of aerosol optical properties over this area, in addition to previously suggested factors over southern Africa (e.g., change in burning sources and conditions in Eck et al., 2013). Overall, such comparisons suggest the potential benefit of simultaneous measures of trace gases and aerosols for understanding atmospheric physicochemical processes.
3.3 UV-VIS-NIR aerosol absorption properties for satellite algorithms
The continuous UV-NIR aerosol property information retrieved from SMART–s can be useful not only for validating the satellite aerosol products but also for fine-tuning appropriate aerosol models used in the satellite aerosol retrieval algorithm. The operational aerosol algorithm of OMI (OMAERUV; Torres et al., 2013) utilizes radiances at 354 and 388 nm for retrieving the τaer and ω0. They assumed a ratio of k at 354 to 388 nm to be 1.2 for smoke aerosols to account for the spectral absorption effects of organic carbon (Jethva and Torres, 2011; Jeong et al., 2016). They derived a monthly climatology of the aerosol layer height (ALH) from observations by CALIOP (Cloud-Aerosol Lidar with Orthogonal Polarization) as the ancillary data for the OMAERUV algorithm (Torres et al., 2013). Also, recently, the improved ASHE (Aerosol Single-scattering albedo and Height Estimation; Lee et al., 2021) algorithm combines UV measurements from the OMPS-NM (Ozone Mapping and Profiler Suite Nadir Mapper) aboard the SNPP with the VIIRS radiances to provide retrieved ω0 and ALH products as part of the VIIRS version 2 DB aerosol CDRs. For the spectral dependencies of ω0 in the UV, they assumed AAE to be 2.0 between 340 and 412 nm. Figure 13 shows an example of ω0 retrievals at 340 nm (Fig. 13a), 378 nm (Fig. 13b) and 550 nm (Fig. 13c) from the ASHE algorithm on the same day as Fig. 1 (30 March 2019). Since the ASHE algorithm only performs retrievals when τaer>0.5 and UVAI (UV aerosol index) >0.7, the spatial coverage of ω0 in Fig. 13 is reduced compared to that of τaer shown in Fig. 1. The colored circles in this figure depict the collocated ω0 retrievals from SMART–s. In general, the values of ω0 retrieved from ASHE nearby the measurement site were comparable to those from SMART–s, with its broader spatial coverage throughout the smoke aerosols of high τaer (see Fig. 1b).
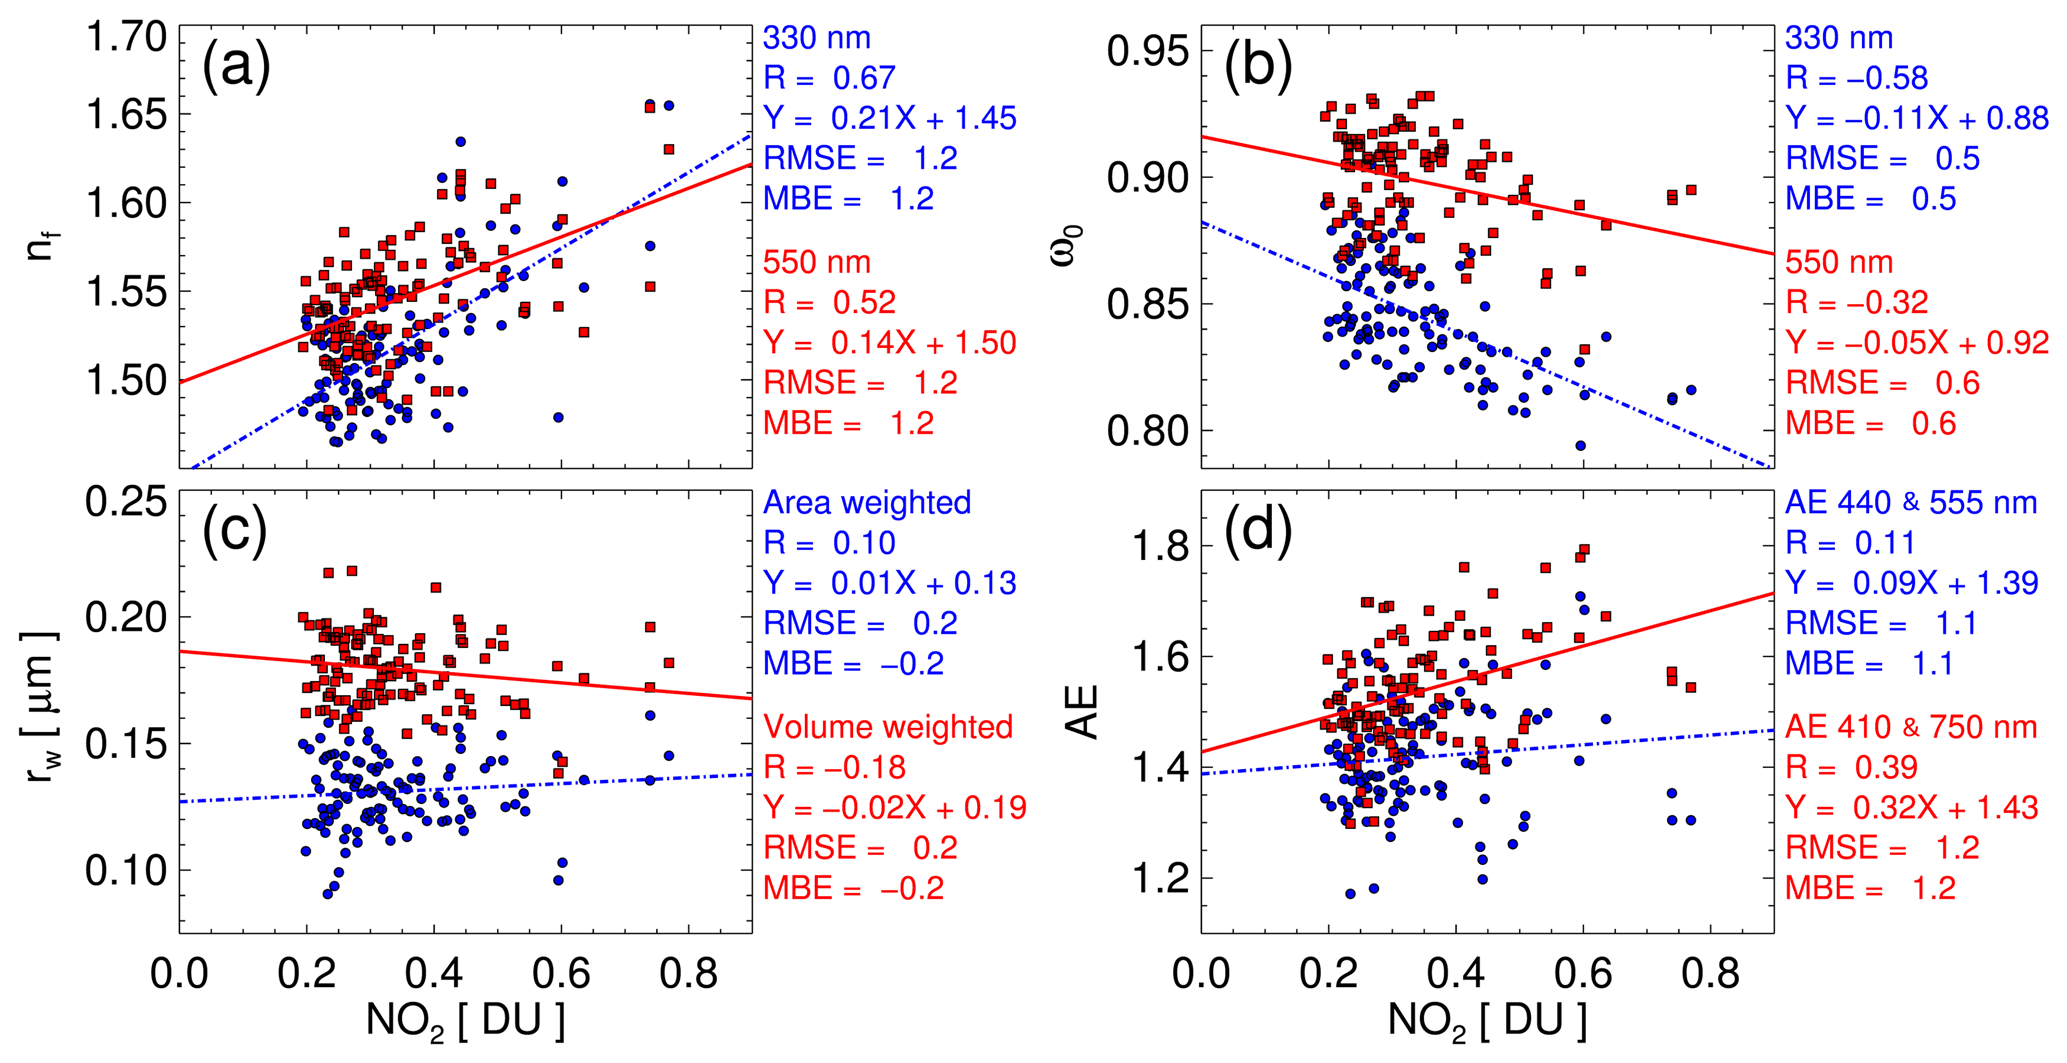
Figure 12Comparison of the total column amount of NO2 to the (a) real part of the refractive index of the fine mode (nf) and (b) aerosol single scattering albedo (ω0). The blue and red colors symbolize those retrieved at 330 and 550 nm, respectively. Panels (c) and (d) compare the weighted mean radius (rw) and Ångström exponent (AE) to the total column NO2, respectively. The blue and red symbols in panel (c) represent the area- and volume-weighted mean radius, and those in panel (d) indicate different wavelength pairs for the AE calculations (blue at 440 and 555 nm and red at 410 and 750 nm).
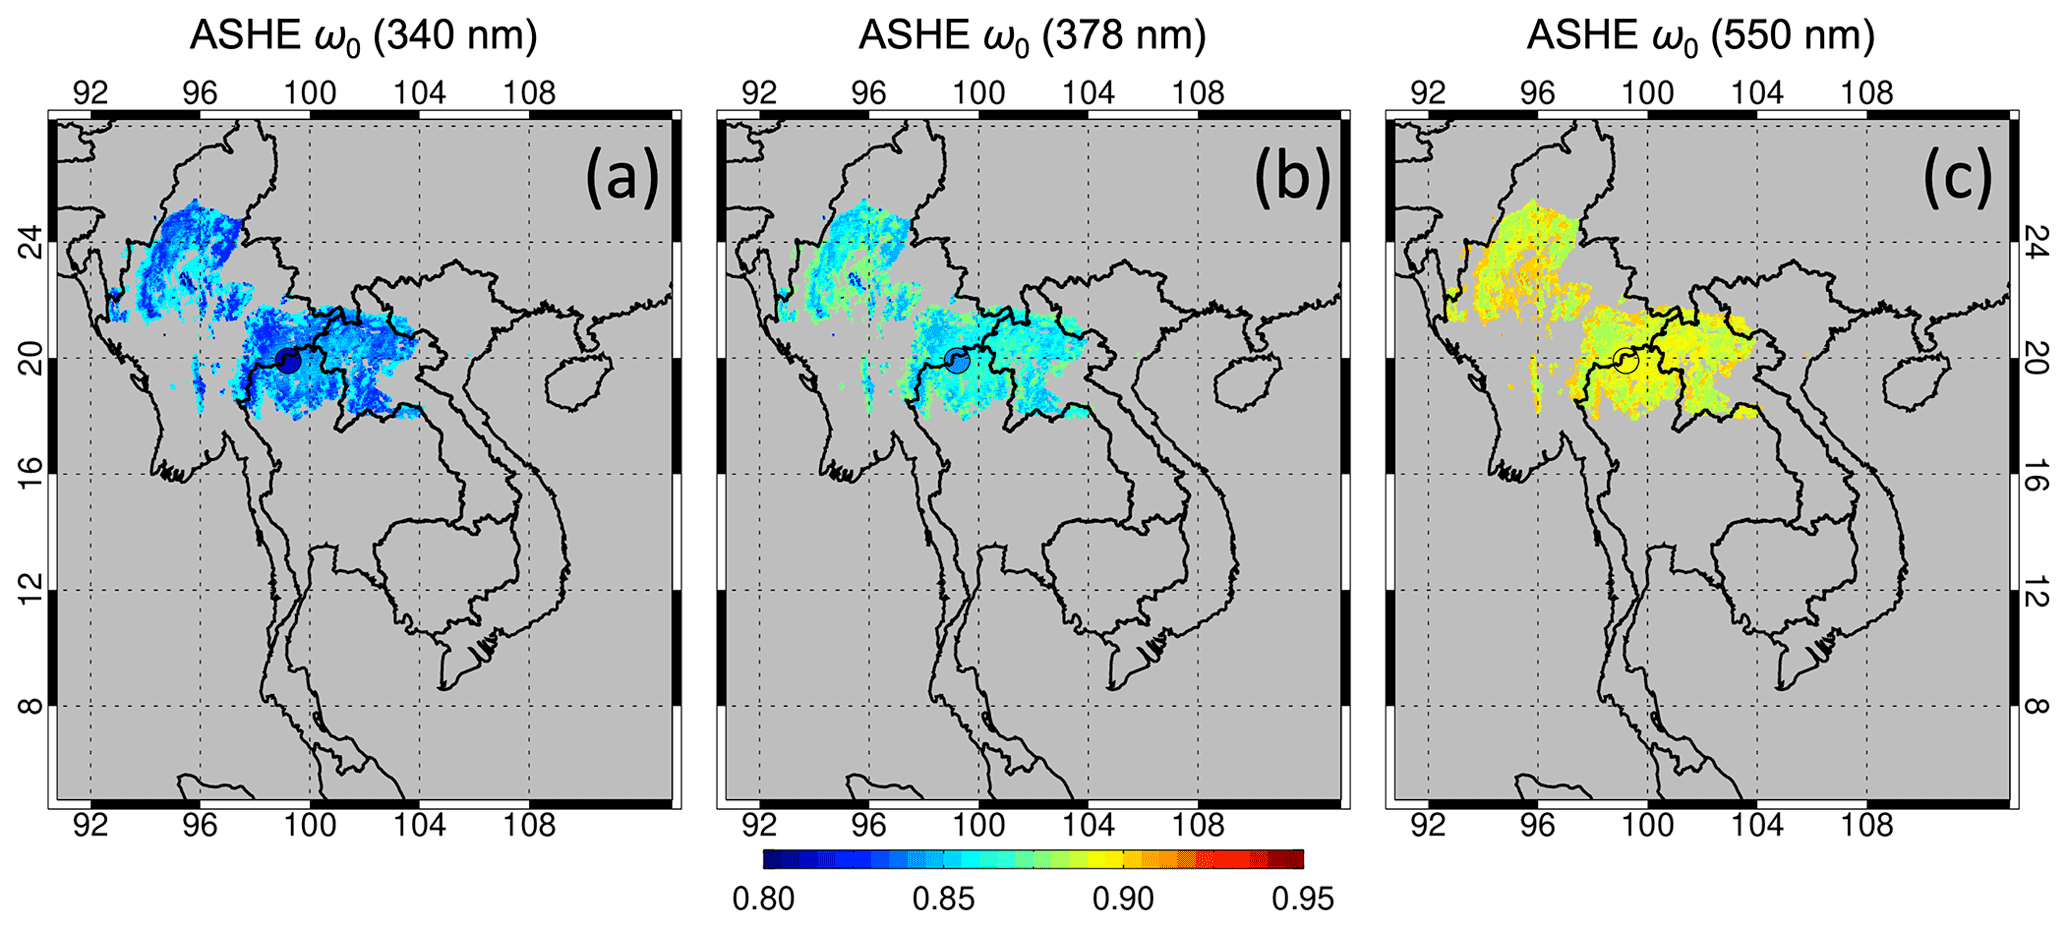
Figure 13Aerosol single scattering albedo (ω0) retrieved at (a) 340 nm, (b) 378 nm, and (c) 550 nm from ASHE (Aerosol Single-scattering albedo and Height Estimation; Lee et al., 2021) algorithm on 30 March 2019. Colored circles present values of collocated SMART–s retrievals which are indicated by the color bar at each wavelength.
Temporal variations in ω0 from ASHE and SMART–s over the measurement site at overlapping wavelengths demonstrate their reasonable consistency, where both the retrievals indicate increasing trends during the measurement period, with a higher temporal resolution of SMART–s (see Fig. 14a). The ASHE retrievals are available until 18 April 2019, since UVAI over the site decreased lower than the ASHE criteria, likely due to the increased ω0 over the period. Figure 14b compares the collocated ω0 from ASHE and SMART–s during the measurement period, which showed good agreement between these two at ASHE's retrieval wavelengths. Higher correlations between the ASHE and SMART–s were found in the shorter wavelengths (R=0.79 at 340 nm) due to the higher sensitivity of UV radiances to aerosol absorptions. The MBE and RMSE were lower than 0.02 for all wavelengths. Note that the θS at Fang near the overpass time of VIIRS is small, whereas SMART–s measures almucantar radiances θS from 40 to 75∘. The average time difference between the ASHE overpass time and the closest SMART–s retrieval during the period was about 3 h, and only samples with a time difference of fewer than 3 h are shown in this figure. However, the difference in time between ASHE and SMART–s still may affect the comparison in Fig. 14, which can be improved by refining the scan strategy (e.g., hybrid scan of AERONET version 3.0) for extending retrieval criteria of the θS.

Figure 14(a) Temporal variations in aerosol spectral single scattering albedo (ω0; 340 nm in blue, 378 nm in green, and 550 nm in red) retrieved from ASHE (dark colors; Lee et al., 2021) and SMART–s (faint colors) over Fang, Thailand, in 2019. ASHE retrievals are not available after 18 April 2019, since UVAI over the site decreased lower than the ASHE criteria, likely due to the increased ω0 over the period. Panel (b) compares retrieved ω0 from ASHE and SMART–s at each wavelength during the period. The dotted and dashed lines represent, respectively, relative biases of ±0.02 and ±0.05 from the SMART–s product. The collocated samples are limited to have a time difference of less than 3 h. The vertical and horizontal bars in panels (a) and (b), respectively, indicate estimated errors of each retrieval based on the optimal estimation method.
AERONET sites in regions affected by biomass burning smoke typically had AAE (440–870 nm) ranging from 1.0 to 2.0, with values closer to 1.0 indicating a greater contribution of black carbon and AAE near 2.0 indicating increased organic-to-black carbon ratios (Giles et al., 2012). Figure 15a presents the temporal variations in the AAE using different wavelength pairs calculated from SMART–s τaer and ω0. The AAEs calculated from the UV wavelength and 550 nm pairs were comparable to the assumed value of the ASHE algorithm (2.04 ± 0.27 for the 340–550 nm pair and 1.94 ± 0.33 for the 378 and 550 nm pairs), with non-negligible temporal variabilities ranging from about 1.3 to about 2.6. The AAE calculated using the 340–412 nm wavelengths pair, which is the actual pair for the ASHE inversion, showed much higher values (2.69 ± 0.35). Such discrepancies between the SMART–s retrievals and assumptions of aerosol properties in the ASHE algorithm may propagate to the differences in Figs. 13 and 14. However, the retrieval errors are contextual, meaning that other error sources (uncertainties in the retrieved τaer, assumed size distribution in the aerosol optical models, etc.) can also contribute to the discrepancies, which makes it difficult to quantify the contribution of the AAE uncertainties to the retrieval errors. A longer-term data record in the UV is therefore highly desired. Figure 15b shows temporal variation in the ratio of kf at 354 to 388 nm (1.17 ± 0.05), which is in good agreement with the assumed value of the OMAERUV algorithm (i.e., 1.2 for smoke aerosols) but with significant temporal variabilities. Both panels in Fig. 15 suggest that current assumptions of the UV aerosol properties in OMAERUV and ASHE algorithms are generally good approximations. However, temporal and spectral variabilities of the aerosol optical properties, which are presented throughout this section, also emphasize the importance of realistic aerosol models in the UV for further improvements of satellite algorithms. High spectral resolution of the aerosol optical properties covering the UV can also benefit recently launched or upcoming hyperspectral satellite sensors targeting atmospheric composition (e.g., Chance et al., 2019; Ingmann et al., 2012; Kim et al., 2020). The National Institute of Environmental Research of South Korea recently started to deploy standard Pandora devices and a few SMART–s units over Asia to validate GEMS (Geostationary Environment Monitoring Spectrometer; Kim et al., 2020) aerosol and trace gas products and to improve the satellite algorithms. Thus, deployments of networked SMART–s can contribute to comparing/validating spatiotemporal variations in aerosol ω0, which is a key parameter for understanding their aging processes and interaction with other environmental conditions (e.g., terrain and meteorology; see Fig. 13 for an example of the spatial variability). These ground-based measurements will provide important long-term records of UV aerosol properties at multiple strategic sites over Asia.
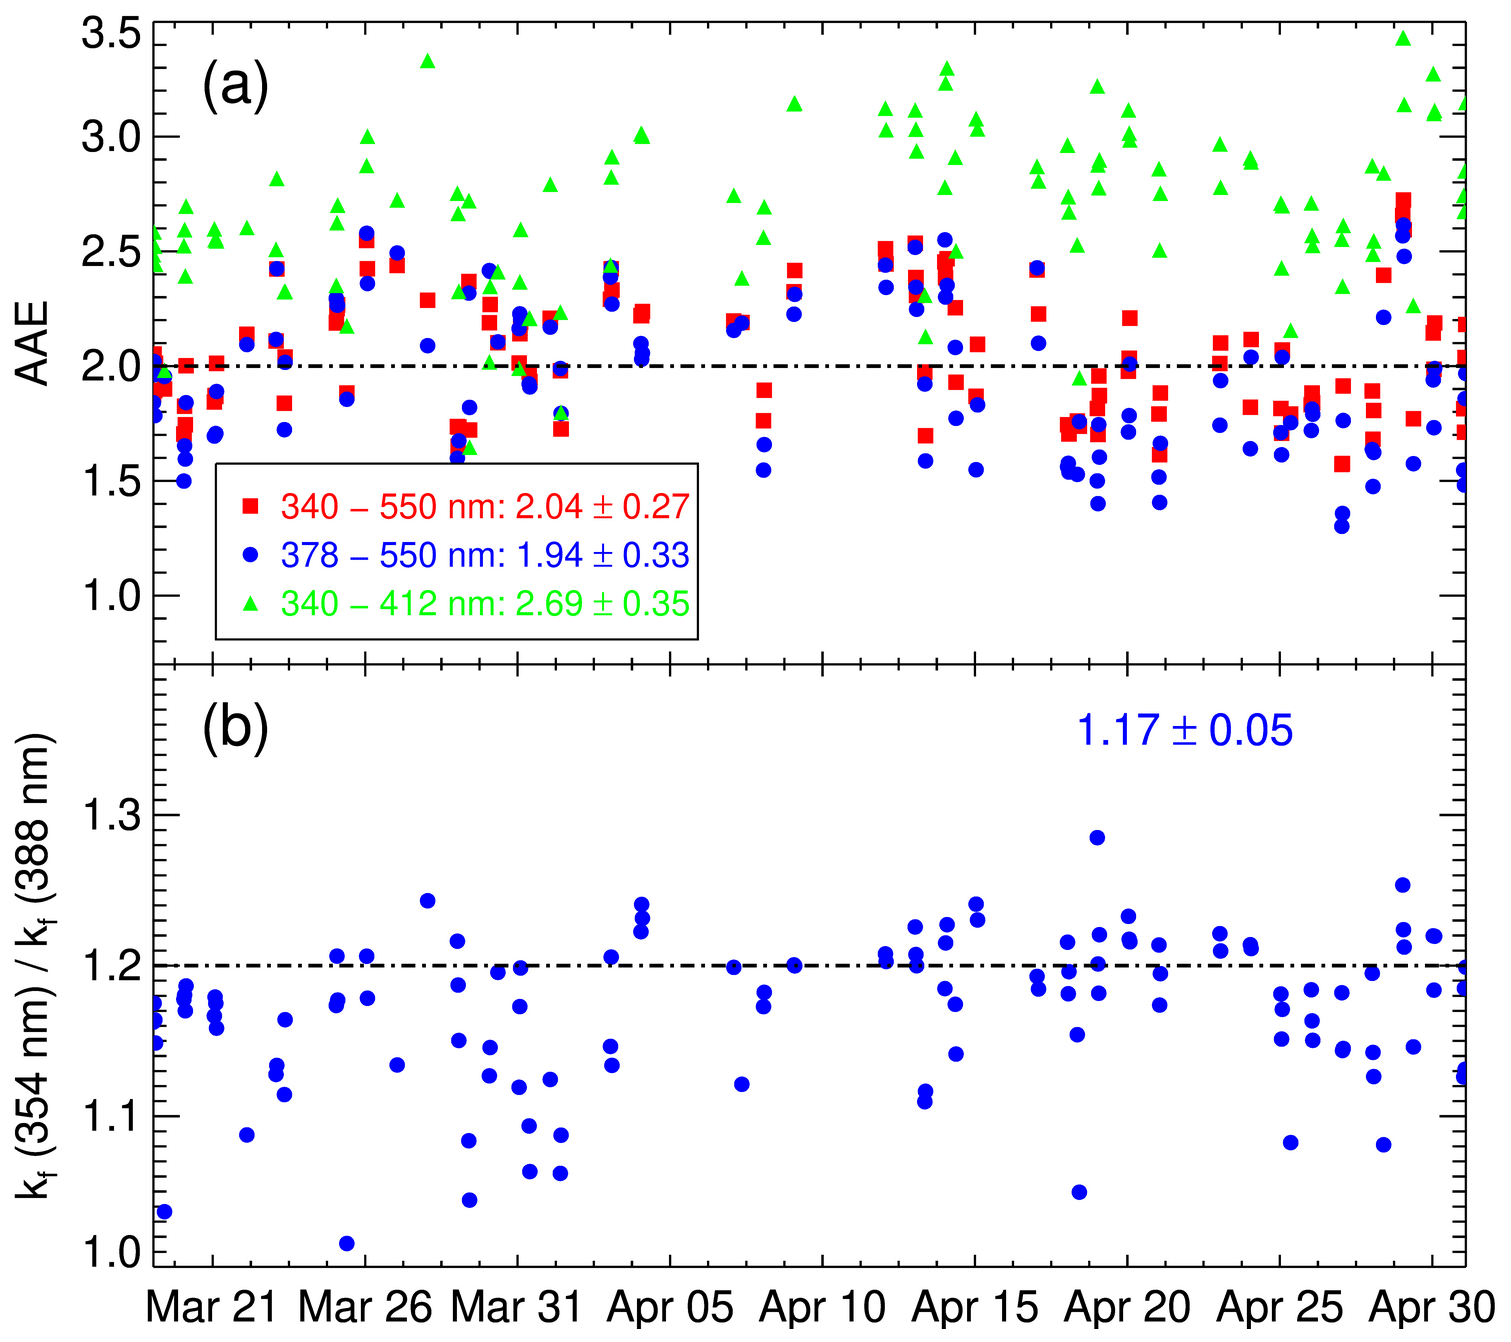
Figure 15Temporal variations in the (a) AAE of aerosols and (b) ratio of fine-mode imaginary refractive indices (kf) of aerosols at 354 and 388 nm retrieved at Fang, Thailand, in 2019. The color-coded symbols in panel (a) represent different wavelength pairs, with red for 340–550 nm, blue for 378–550 nm, and green for 340–412 nm. The dash-dotted lines in panels (a) and (b) are the assumed values of the ASHE and OMAERUV algorithms for smoke aerosols, respectively.
SMART–s was deployed during the pre-monsoon season in northern Thailand in 2019 to perform direct sun and sky radiance measurements near biomass burning sources. In this study, we summarized the detailed radiometric calibration procedures and results. To optimize solar irradiance for the radiometric conversion, we combined the Langley and NIST-traceable integrating sphere calibration data with the high-resolution reference spectrum from Coddington et al. (2021). We estimate that the total uncertainties in the sky radiance measurements are about 5 % in the UV and better than 3 % in the VIS-NIR wavelengths. The total column amount of τaer and H2O from SMART–s showed excellent agreements with those from collocated AERONET measurements (R=1.0 and 0.98, respectively). Total column O3 retrievals from the OMI showed good consistency with those from SMART–s (R=0.95; RMSE and MBE of less than 3.6 DU). During the measurement period from mid-March to early May in 2019, τaer was mostly large (frequently exceeding 2.0 at 500 nm) and strongly correlated with total column NO2 (R=0.74), likely due to the high emissions of biomass burning smoke. ω0 from SMART–s and AERONET at overlapping wavelengths (i.e., 440 and 675 nm) showed acceptable agreements within uncertainties of these instruments (R = 0.79–0.81, with RMSE and MBE of less than 0.015). SMART–s retrievals showed good agreement of fine-mode V(r) with those from the AERONET, which is dominated by the smoke aerosols during this period. The spectral ω0 of smoke aerosols showed an abrupt decrease in the UV, consistent with the understanding of absorption by carbonaceous aerosols.
One of the major merits of the simultaneous retrieval of trace gases and aerosols from SMART–s is that it allows an informative analysis of physicochemical interactions in the atmosphere. Our analyses comparing the trace gases (i.e., H2O and NO2) and aerosol properties (e.g., ω0, n, ra, and rv) suggest that aerosol aging processes, including hygroscopic growth, can be a critical factor affecting temporal trends of aerosol optical properties during the pre-monsoon period over northern Thailand. First, the ω0 and column precipitable H2O gradually increased together as it approached the monsoon season, and the correlation between ω0 and H2O was generally higher (R = 0.74–0.81) than their temporal trends (R=0.65 for ω0 and 0.70 for H2O). Second, the area-/volume-weighted radius of the fine mode also showed a positive correlation with the H2O (R=0.42 and 0.56, respectively). The third result supporting the conclusion is that nf from SMART–s showed a negative correlation with the total column H2O ( for 330 nm and −0.57 for 550 nm), which is supposed to decrease (or come close to the n of water about 1.33) as the particle uptake water vapor. However, in this study, measurements are performed at only one location during a limited period, while characteristics of smoke aerosols can vary significantly by region and time due to different fuel types, combustion efficiency, and aging processes. A longer period of measurements from multiple sites may help to clarify/provide understanding of such relationships.
The UV radiances are useful for satellite algorithms to retrieve higher-order aerosol parameters (e.g., single scattering albedo and aerosol layer height), as these are sensitive to aerosol absorption and the vertical profile. However, due to the lack of information and reliable aerosol models covering the UV, the algorithms typically assumed the spectral optical properties of aerosols or adopted them from laboratory databases (e.g., Jethva and Torres, 2011; Lee et al., 2021). The retrieved UV aerosol properties from SMART–s showed generally good agreements with the current assumptions of the ASHE and OMAERUV algorithms; thereby, there is a reasonable consistency in the ω0 from SMART–s and ASHE retrievals (R = 0.73–0.79 and MBE and RMSE of less than 0.02). However, temporal and spectral variabilities of aerosol absorption properties (e.g., ω0 and k) in the UV emphasize the importance of a realistic aerosol model for further improvements of satellite retrievals. Recently launched (e.g., GEMS) and upcoming hyperspectral sensors on the geostationary orbit (e.g., Tropospheric Emissions: Monitoring of Pollution; Chance et al., 2019; Sentinel-4; Ingmann et al., 2012) aim to derive diurnal variations in trace gases and aerosols. SMART–s can provide key parameters of trace gases and aerosols for constraining and validating satellite algorithms from its higher temporal resolution retrievals. Further improvements of algorithms and instruments for acquiring better information content and more reliable products (e.g., adding spectral polarization measurements and refinement of scanning strategy, such as adding a hybrid scan of the AERONET) are currently underway.
Direct-sun retrievals from SMART–s are analyzed and compared with other sources of retrievals in Sect. 3. However, this section additionally shows scatterplots of τaer and total column H2O and O3 from the SMART–s with those from AERONET and satellite measurements during the campaign period for validation and checking consistency. As reported by Jeong et al. (2018), spectral τaer from SMART–s showed excellent agreements with AERONET at all overlapping wavelengths, as shown in Figs. A1 and A2a, which is also in good agreement with the VIIRS DB product (Fig. A2b). The total precipitable water vapor (H2O) and total column ozone from SMART–s also showed excellent agreement with AERONET and OMI, as shown in Fig. A2c and d.
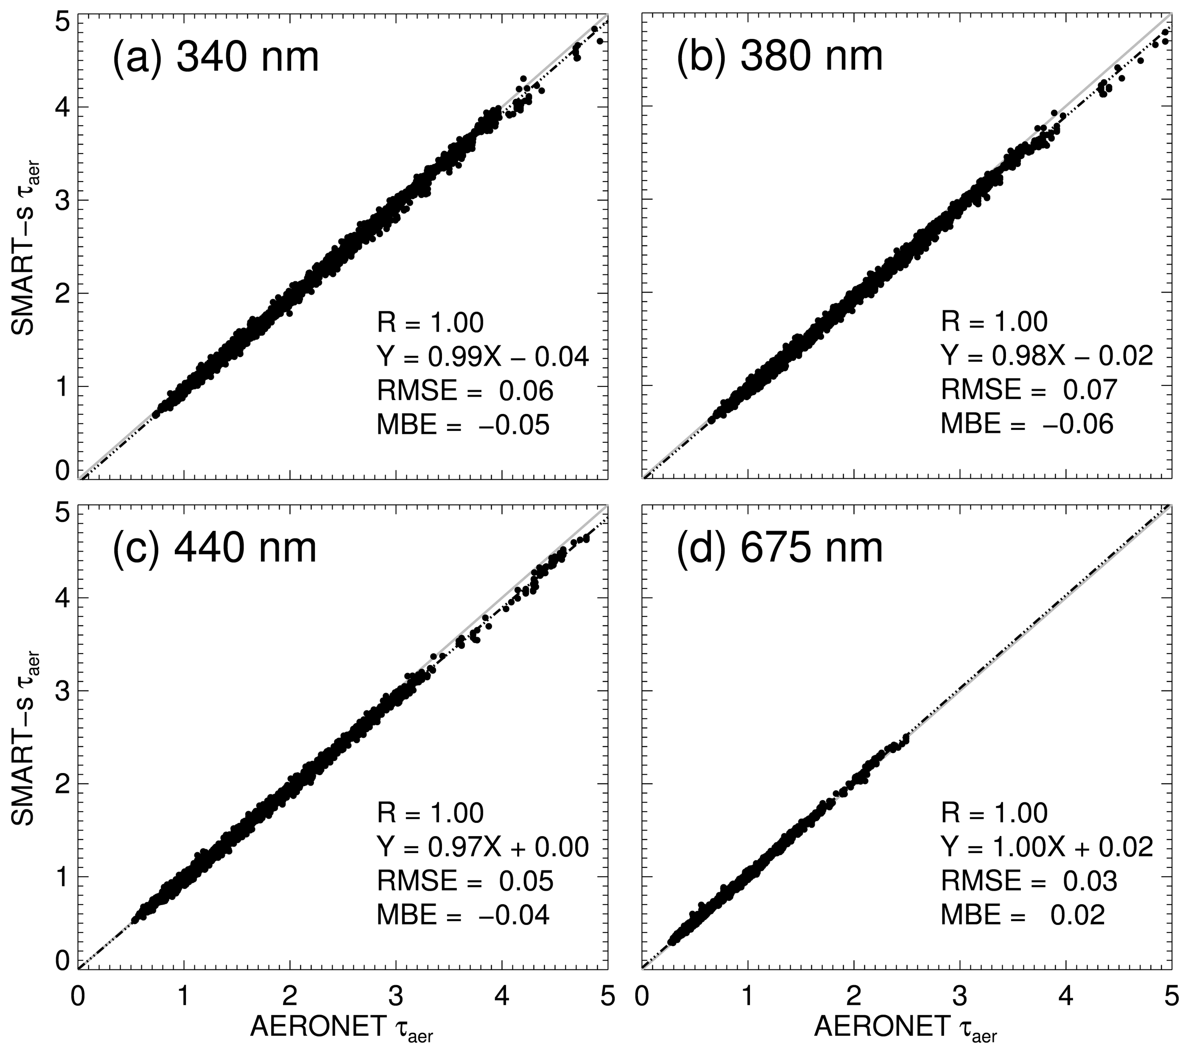
Figure A1Comparison of aerosol optical thickness (τaer) from SMART–s and AERONET (version 3, level 2.0) at (a) 340 nm, (b) 380 nm, (c) 440 nm, and (d) 675 nm measured at Fang, Thailand, from 8 March to 2 May 2019. R is the correlation coefficient, RMSE denotes the root mean square error, and MBE is the mean bias error. The black dot-dashed line and the gray solid line represent regression and one-to-one lines, respectively.

Figure A2Panel (a) compares aerosol optical thickness (τaer) at 500 nm from SMART–s and AERONET (version 3, level 2.0), and panel (b) compares that at 550 nm from VIIRS DB and SMART–s. Total precipitable water vapor (H2O) products from SMART–s and AERONET are compared in panel (c), and total column ozone retrievals from OMI and SMART–s are compared in panel (d). The retrievals are obtained at Fang, Thailand, from 8 March to 2 May 2019. R is the correlation coefficient, RMSE denotes root mean square error, and MBE is the mean bias error. The black dot-dashed line and the gray solid line represent regression and one-to-one line, respectively.
The spectral Langley method (Jeong et al., 2018) retrieves spectral τaer by subtracting gas optical thickness (τgas) from the total optical thickness (τtot); the SMART–s observation is beneficial for this procedure as it measures spectral features of the τgas. SMART–s retrieves optically thick trace gases (i.e., O3 and H2O) by using a similar method but with narrower fitting windows of the trace absorption bands (i.e., 315–335 nm for O3 and 550–680 nm for H2O). Examples of the fitting results for the O3 and H2O are shown in Figs. B1 and B2, respectively, and intercomparison results during the campaign, together with other data, are shown in Appendix A. The fitting model for O3 retrieval includes linear polynomials, O3 and SO2 cross-sections, and the Raman spectrum, whereas that for the H2O utilizes linear polynomials and H2O, O3, and O2 cross sections. More detailed design and calibration procedures for the spectral Langley method are demonstrated in Jeong et al. (2018). Measurements for long-term validation/comparison results are currently underway and will be reported in a follow-up paper (Jeong et al., 2022).
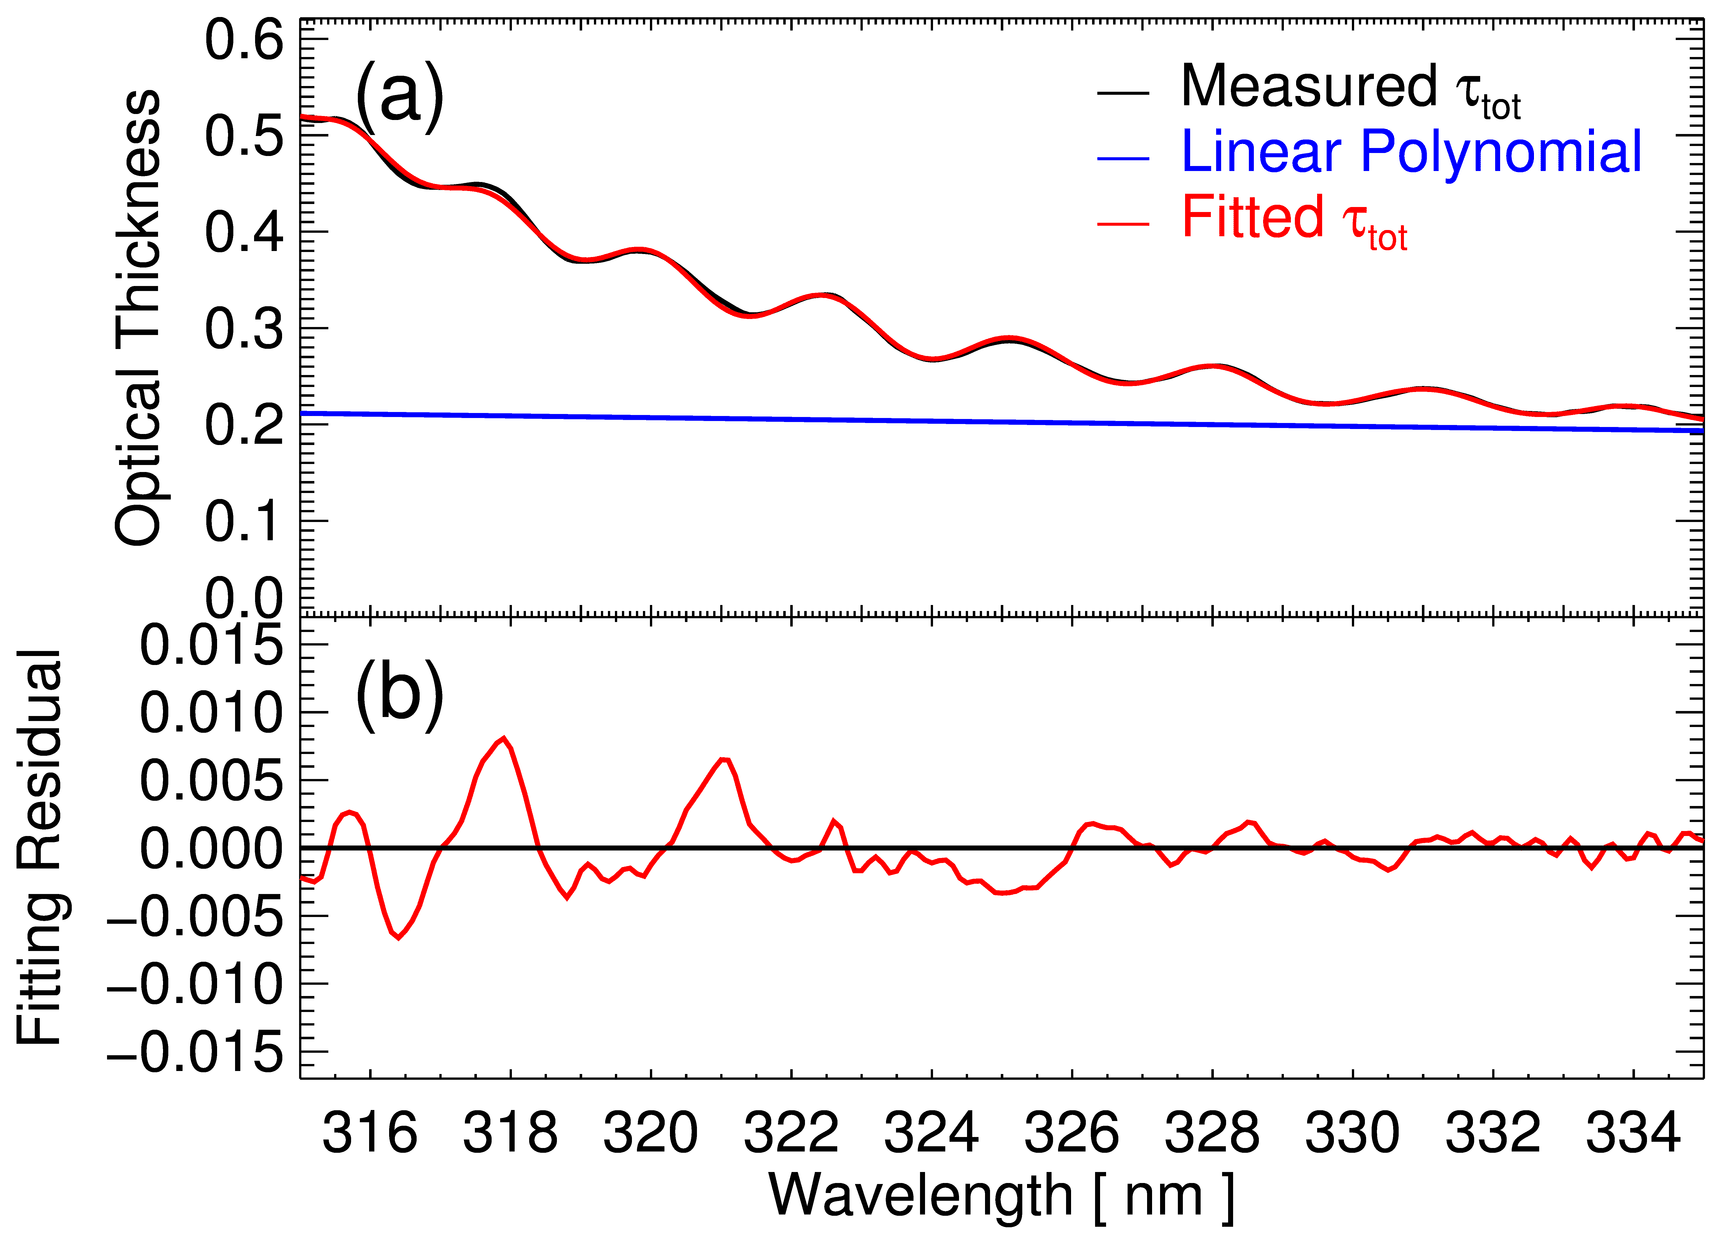
Figure B1(a) Spectral fitting result of the SMART–s O3 algorithm at 16:50 UTC on 14 October 2019 measured on the rooftop of the NASA Goddard Space Flight Center Building 33 (38.99∘ N latitude, 76.84∘ W longitude). Panel (b) presents the fitting residual (measured optical thickness subtracted by model optical thickness).
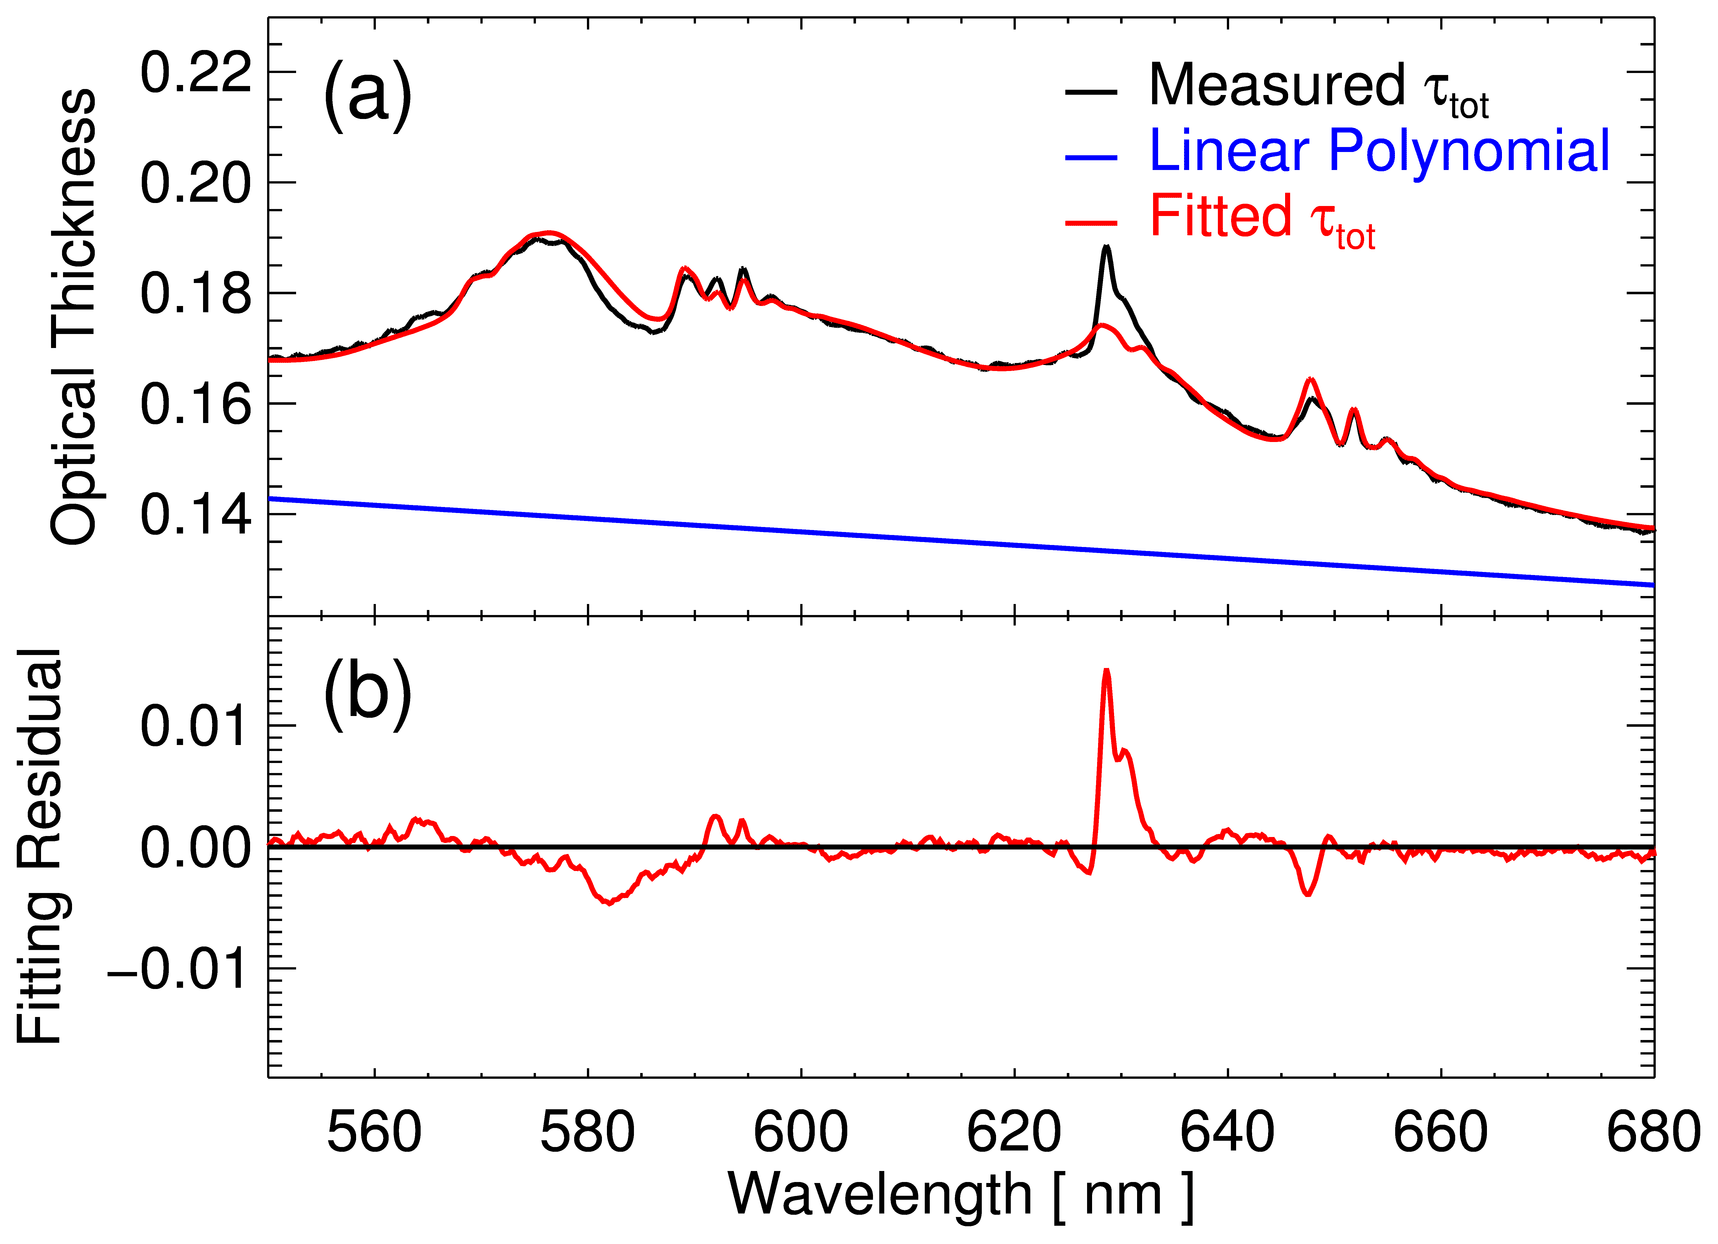
Figure B2Similar to Fig. B1 but for H2O. (a) Spectral fitting result of the SMART–s H2O algorithm at 16:55 UTC on 14 October 2019 measured at the same location as in Fig. B1. Panel (b) presents the fitting residual (measured optical thickness subtracted by model optical thickness).
Table C1Relative azimuth angles, wavelength node, sources of measurement error covariance matrix, and parameters of state vector of SMART–s algorithm.
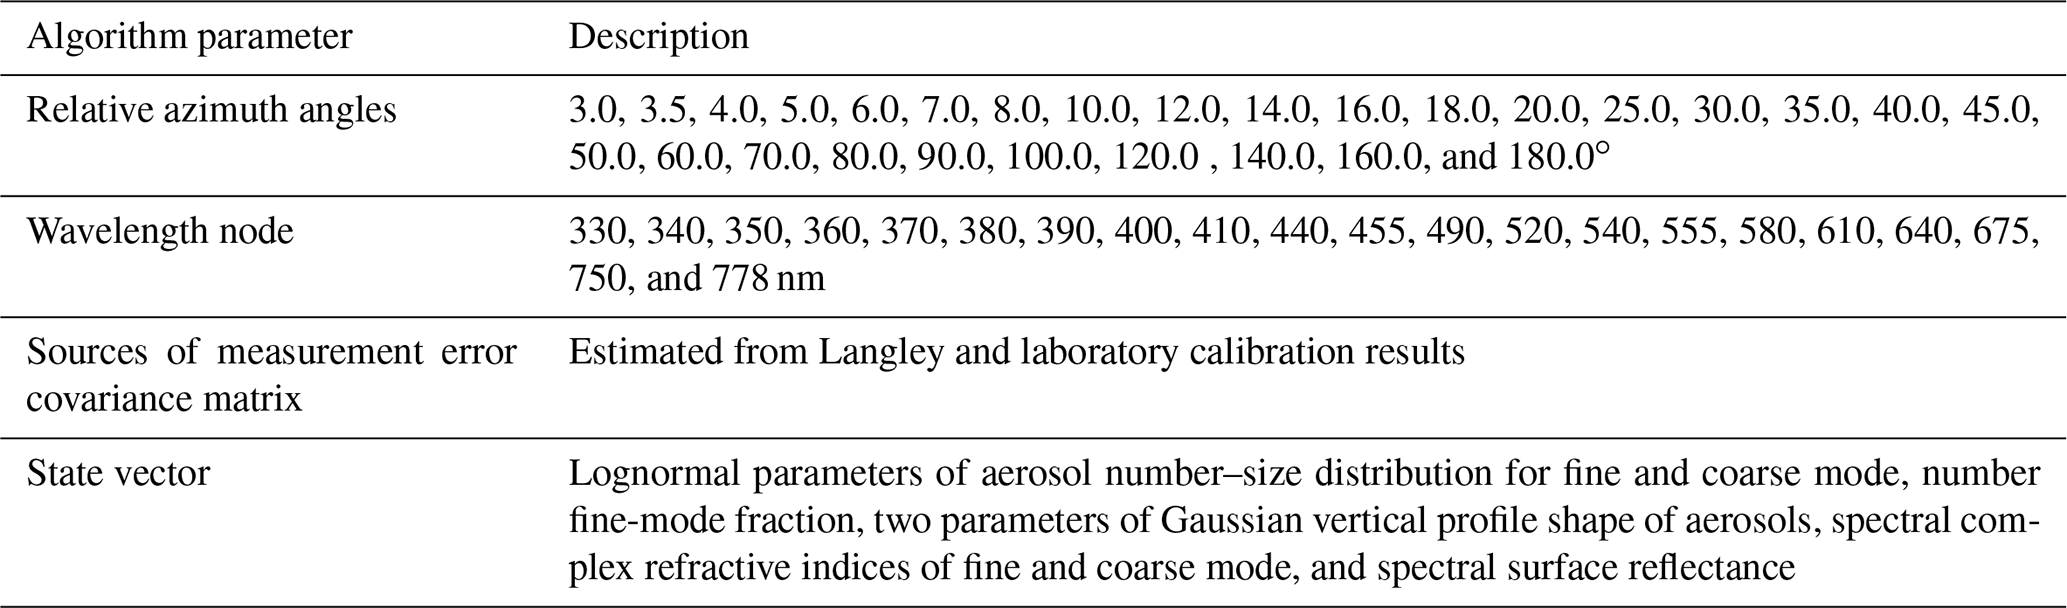
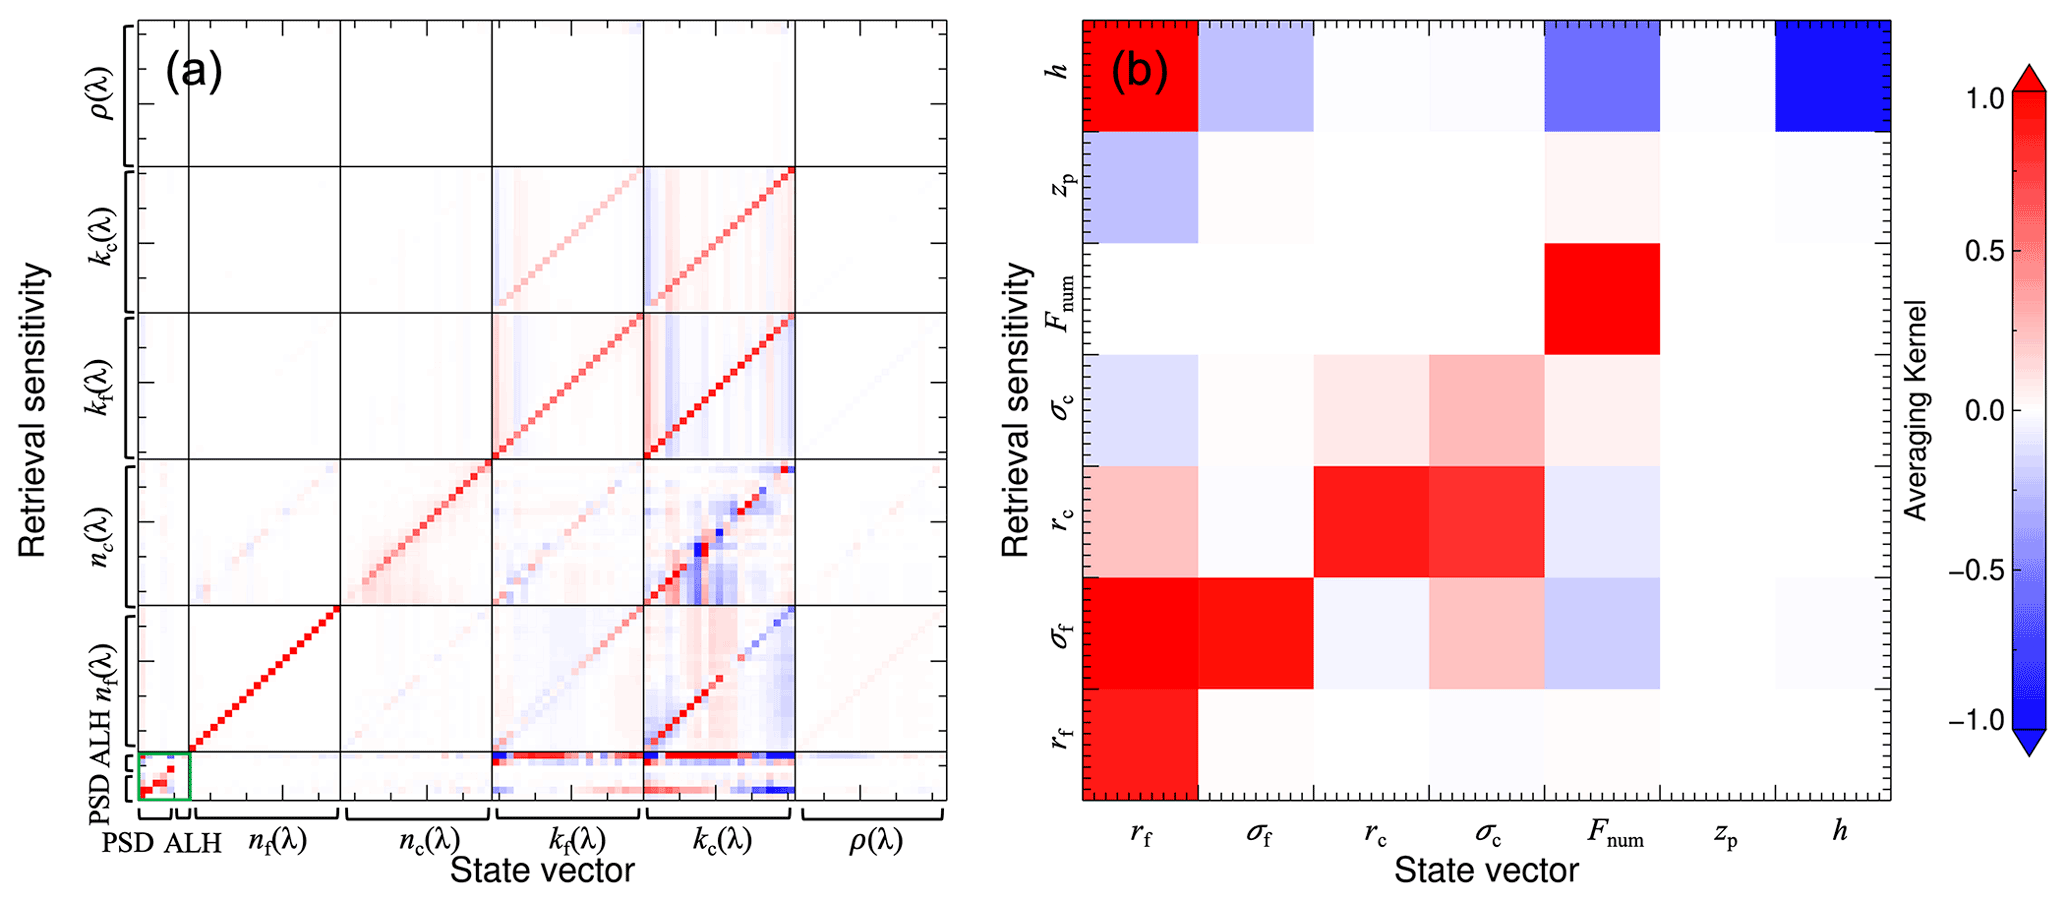
Figure C1Averaging kernel matrix (A) of SMART–s retrievals at 08:31 UTC on 10 April 2019 at Fang, Thailand, when fine-/coarse-mode volume fractions were comparable and aerosol single scattering albedo was about 0.87, with the aerosol optical thickness of about 1.06 at 440 nm. Indices from 1 to 5 correspond to fine-mode mean radius (rf) and geometric standard deviation (σf), and those pair for the coarse mode (rf and σf) and number fine-mode fraction (Fnum). Indices 6 and 7 are the peak height (zp) and dispersion parameter (h) of the assumed aerosol extinction profile. Each element of the real (n) and imaginary (k) part of the refractive index for fine (subscript f) and coarse mode (subscript c) indicates its retrieval sensitivity at each wavelength. Panel (a) shows the whole of A, and panel (b) magnifies to the particle size distribution (PSD) and aerosol layer height (ALH) parameters (indices from 1 to 7), as indicated by a green square at the bottom left of panel (a).
Spectral bands for the aerosol property retrieval are carefully selected to avoid strong absorption by the gases and to efficiently obtain maximum information on aerosols. For example, we avoided major O2-A, O2-B, O2-O2, and H2O bands where each corresponding FComb is highly uncertain (see Fig. 4a and b). Nodes of the relative azimuth angle (ϕr) for the solar almucantar scan and those of wavelengths for the retrieval are summarized in Table C1 with other parameters. The VLIDORT (linearized pseudo-spherical vector discrete ordinate radiative transfer) code generates the full Stokes' parameters and analytic weighting function of atmospheric and surface variables, including the aerosol properties (Spurr, 2006; Spurr et al., 2012, Spurr and Christi, 2014). The state vector (x, which is a vector with elements of retrieval parameters and control variables to fit the measurements using a forward model) consists of fine- and coarse-mode n and k, five parameters of the PSD, two aerosol layer height parameters, and spectral surface albedo. The algorithm assumes the aerosol number PSD as a bimodal lognormal shape, as follows:
where N(r) is the number size distribution, and the rf and rc are fine- and coarse-mode mean radius. σf and σc are the geometric standard deviation of each mode. Fnum is number fraction of the fine mode. However, the assumed bimodal lognormal shape may not adequately represent the true fine- or coarse-mode distribution in some cases, such as volcanic eruptions, aerosol aging, and cloud processing (Eck et al., 2010, 2013, 2018). The aerosol extinction profile is assumed to be a Gaussian shape, as follows:
where ALH(z) stands for the aerosol layer height (i.e., vertical profile of aerosol extinction), and the W is the normalization factor. zp is the peak height, and h is the vertical dispersion parameter of the Gaussian profile shape. A priori information of zp and h are extracted from the climatology of reanalysis data (e.g., Modern-Era Retrospective analysis for Research and Applications, Version 2; Gelaro et al., 2017), which is, however, not sensitive to the solar almucantar measurements. In this study, we assumed that the surface reflectance (ρ) is Lambertian, of which a priori data are obtained from merged satellite measurements. More details of the parameters and design of the algorithm can be found at Jeong et al. (2020).
The averaging kernel (A) of the OEM is a useful matrix for understanding the information content of a set of measurements and the inversion method, of which elements show the sensitivity of retrievals to the true state (e.g., Rodgers, 2000; Jeong et al., 2020). A is defined as follows:
where G is the gain matrix for representing the sensitivity of retrievals to the measurements, and K is the weighting function matrix of which the elements are partial derivatives of each measurement with respect to the state vector. In Eq. (C3), each element of A characterizes how the retrieval () responses to the true state (x). Diagonal elements of A (DA) indicate the sensitivity of each retrieval parameter, using a set of measurements and an inversion method, whereas the off-diagonal elements of an ith row (RA) demonstrate retrieval errors of xi by cross-correlation with other parameters or by insufficient information contained in the measurements. Therefore, for an ideal inversion with an observing system, its A is close to an identity matrix (Rodgers, 1990). More discussion about A for SMART–s is summarized in Jeong et al. (2020). Figure C1 shows an example of A from the SMART–s retrieval at Fang on 10 April 2019, when fine- and coarse-mode volume fractions were comparable, and ω0 was about 0.87, with τaer about 1.06 at 440 nm. Figure C1a presents the whole A, and Fig. C1b magnifies to the PSD (indices from 1 to 5) and ALH parameters (indices of 6 and 7), as indicated with a green square in Fig. C1a. The DA of PSD parameters (diagonal elements of 1–5; order of rf, σf, rc, σc, and Fnum) are close to one, which shows their sufficient retrieval sensitivity from the measurement. Particularly, RA of rf and Fnum (see the off-diagonal elements of the first and fifth rows in Fig. C1b) have small absolute values, whereas those of σf, rc and σc (rows from 2 to 4) are relatively high. As solar almucantar measurements are not sensitive to the vertical profile of aerosols, DA of the ALH parameters (zp and h of indices 6 and 7) are low, with their relatively higher values of the RA for kf and kc. DA of the nf and nc show their sufficient retrieval sensitivity at all wavelengths. In addition, the RA of nf for nc and that of nc for nf were negligible, which suggests that their retrieval sensitivity for each mode is independent and can be retrieved separately. However, the RAs of nf and nc demonstrate that they are also affected by kf and kc. On the contrary, RA of kf and kc are low at most of the other parameters (i.e., n, PSD, ALH, and ρ), whereas the RA of kf at state vector kc (or vice versa) shows high values of diagonal elements, indicating retrieval sensitivity across the fine and coarse mode; therefore, we analyzed ω0 for both modes in this study. It is well recognized that the retrieval sensitivity of ρ is negligible, which results in low values of the whole rows of ρ in Fig. C1. We also limit the retrieval range of the solar zenith angle (θS) up to 75∘ to minimize the effects of surface reflectance at a high θS and zenith viewing angle (θv). Note that A varies significantly, depending on the case, and retrieval errors due to the interferences between different parameters and/or the lack of information are considered by the error estimation method of the OEM (Rodgers, 2000; Jeong et al., 2020).
One of the important merits of the OEM is its theoretical formulations of retrieval errors, which are classified into four categories (Rodgers, 1990, 2000; Jeong et al., 2016, 2020), i.e., the smoothing error (εs), retrieval noise (εm), forward model error (εr), and model parameter error (εf). As x contains the most dominant parameters of aerosols and quantifying uncertainties in the radiative transfer model is challenging, we neglect (εr) and (εf). We defined the retrieval error (εret) as the square root of the sum of squared εs and εm, which represents the minimum uncertainty of the SMART–s aerosol inversions. Detailed descriptions and discussions of the εret are summarized by Jeong et al. (2020).
Coincident retrievals of ω0, n, k, and V(r) are compared and discussed in Figs. 5 to 10. The remaining scatterplots of these inversion parameters of SMART–s and AERONET are shown in this section. Figure D1 compares the aerosol inversion products from SMART–s and AERONET (version 3, level 2.0). The upper panels compare the real part of the refractive index at (Fig. D1a) 440 nm and (Fig. D1b) 675 nm, and the middle panels are for the imaginary part. The lower panels compare (Fig. D1e) area- and (Fig. D1f) volume-weighted mean radii. Larger discrepancies between SMART–s and AERONET were found for n due to the lack of information content and different assumptions of the algorithms, whereas a higher consistency appeared for k, as discussed for ω0. High agreements of rs and rv were found between the two instruments, as shown in Fig. D1e and f (R=0.86, with MBE and RMSE of less than 0.016 µm).
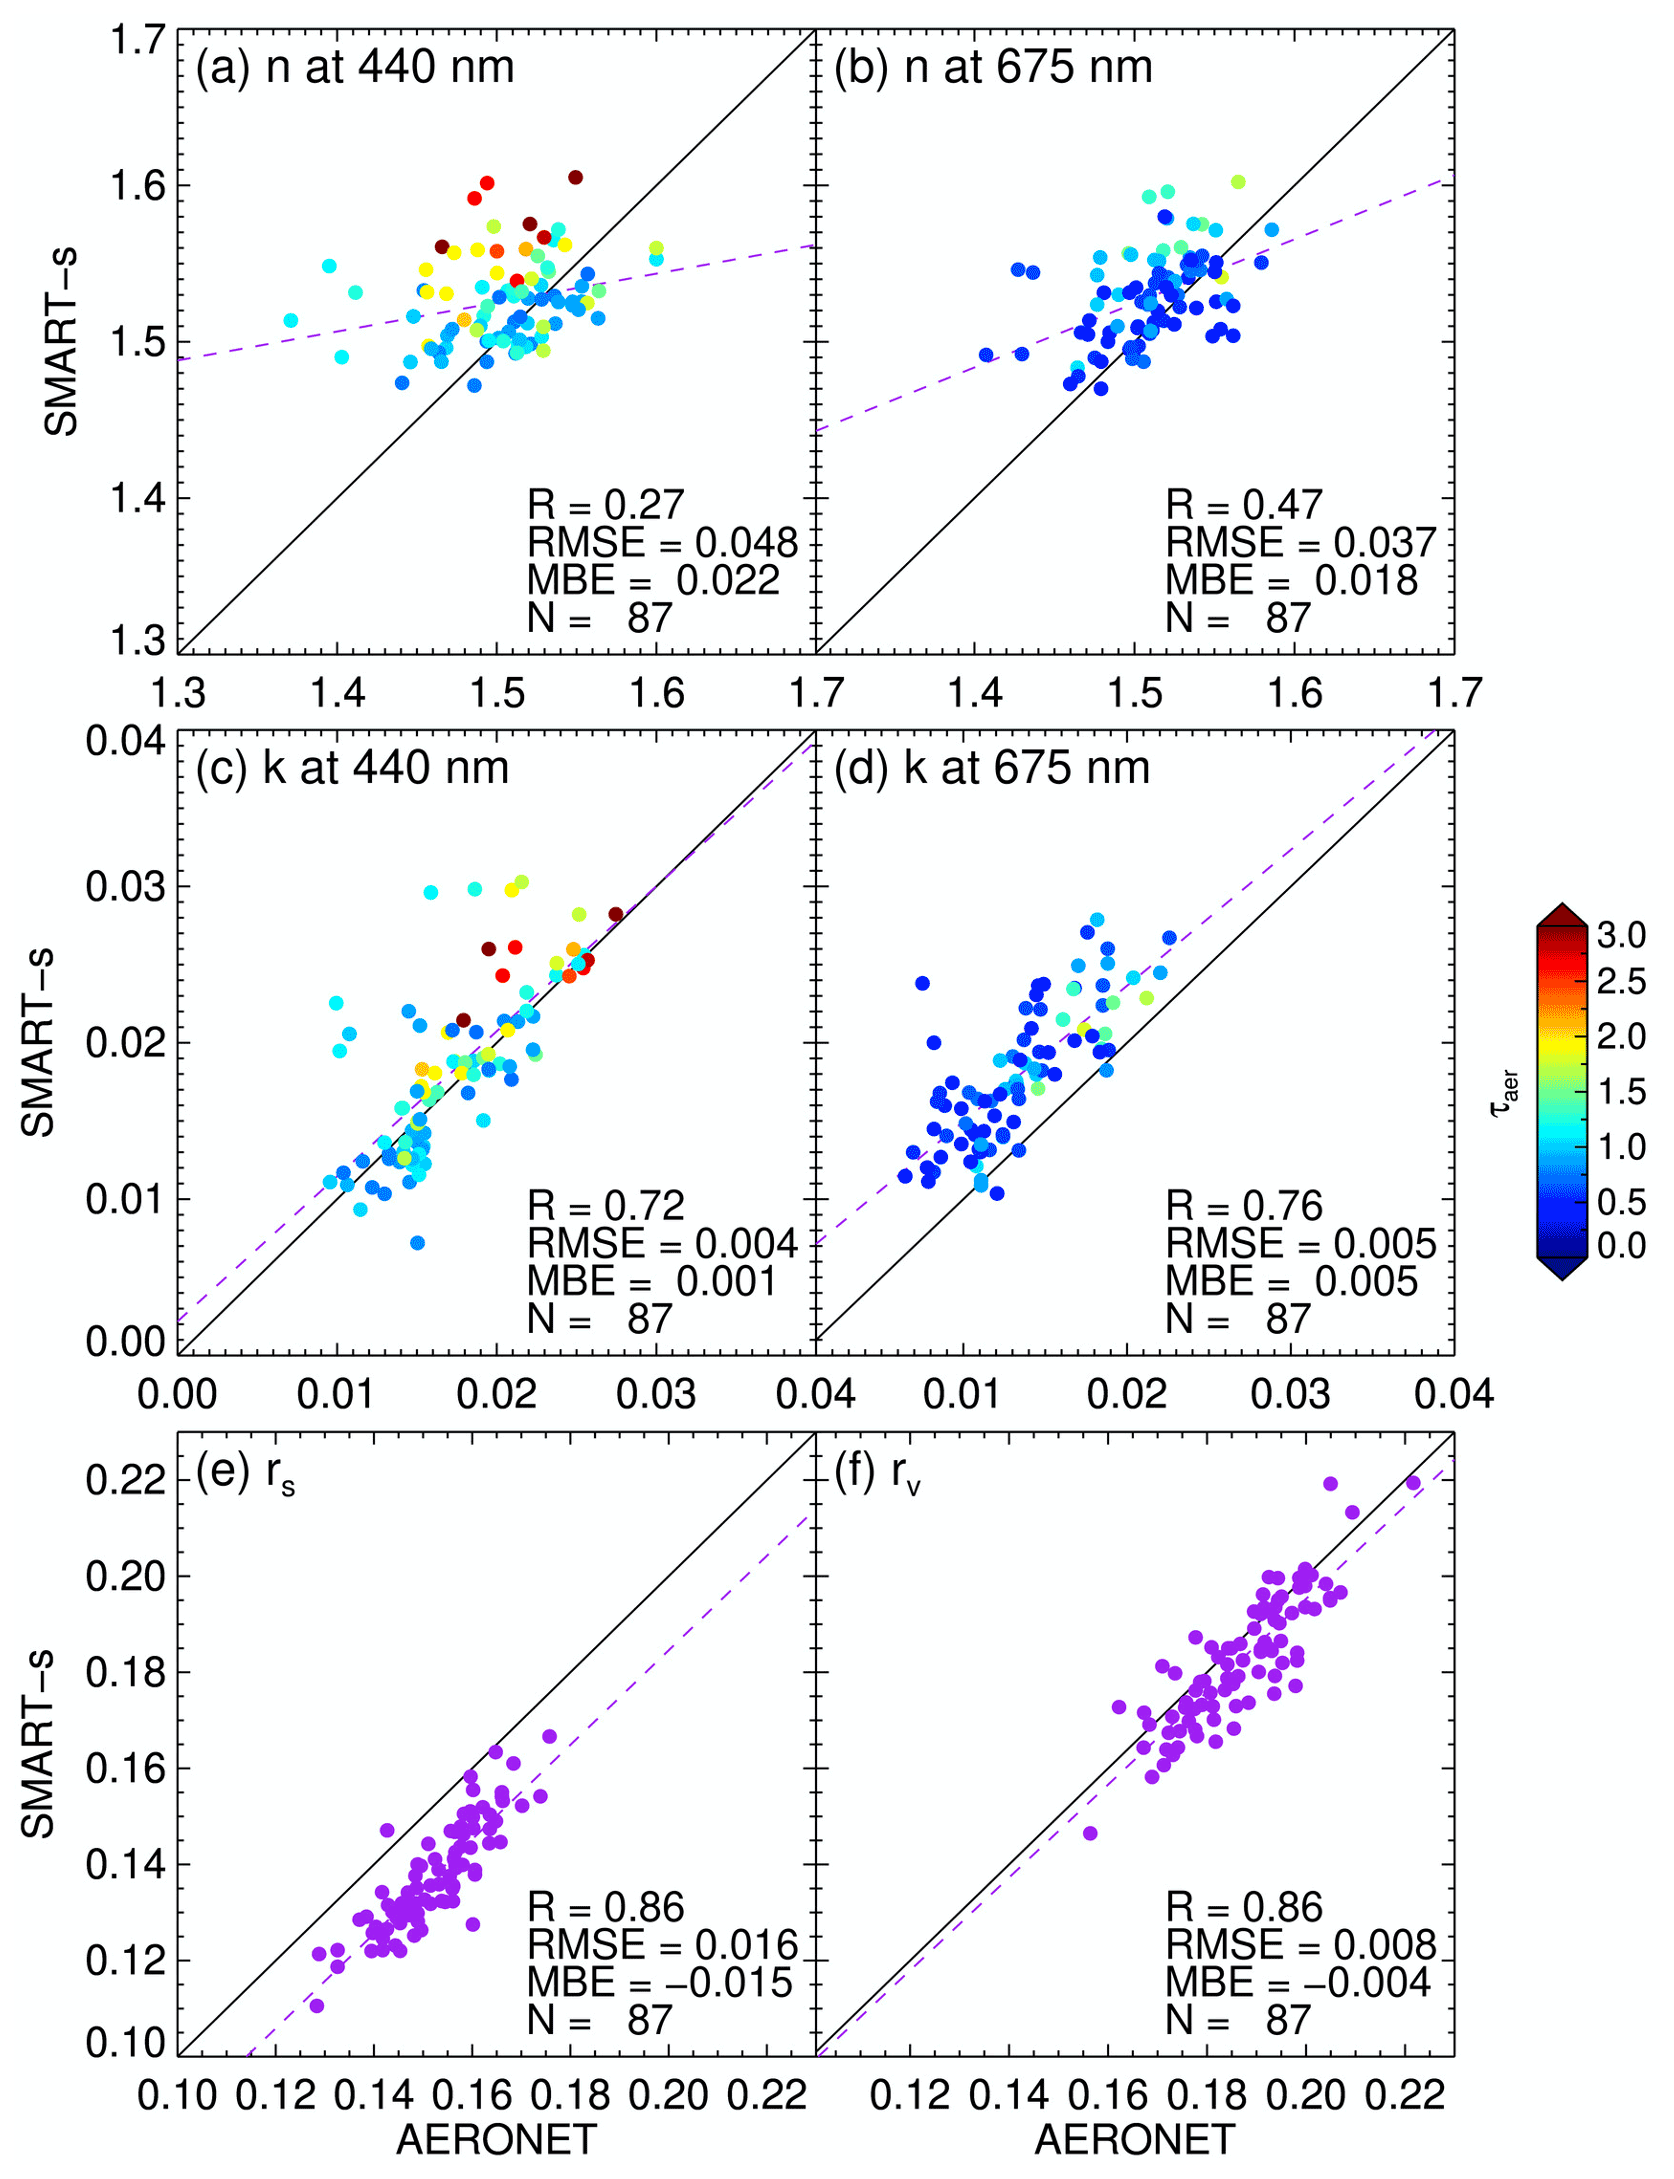
Figure D1Comparison of aerosol inversion products from SMART–s and AERONET (version 3, level 2.0) from 19 March to 2 May 2019. Upper panels compare the real part of the refractive index at (a) 440 nm and (b) 675 nm, and middle panels compare the imaginary part at these wavelengths. Colored circles in panels (a)–(d) represent the values of aerosol optical thickness (τaer) from the color bar at each wavelength. Lower panels compare (e) area- and (f) volume-weighted mean radii (rs and rv, respectively). R is the correlation coefficient, RMSE denotes the root mean square error, MBE is the mean bias error, and N is the number of samples for the comparison. The black solid line and purple dashed line depict one-to-one and regressions, respectively.
SMART–s data are also described at https://earth.gsfc.nasa.gov/climate/instruments/smartlabs (last access: 12 September 2022) and are available on request from the authors (Ukkyo Jeong and Si-Chee Tsay). AERONET data are available at https://aeronet.gsfc.nasa.gov (Giles et al., 2019; Sinyuk et al., 2020).
The first and corresponding author (UJ) led the overall algorithm development and instrument calibration and wrote the paper. SCT supervised the overall activities for this study and was also in charge of the campaign for this study. NCH and JL provided the satellite retrievals to compare the aerosol optical properties analyzed in this study. DMG and BNH provided critical revision for the aerosol retrievals and the overall paper. JWC and JJB provided the NIST-traceable light source for the radiometric calibration and also reviewed the instrument calibrations. RJS was in charge of the Pandora network operation for the campaign and also supported instrument maintenance. SHW and SC supported the local operation of the instruments throughout the campaign periods and also reviewed the final paper. HH, DK, and JK are in charge of the Asian Network of the Pandora and the Geostationary Environment Monitoring Spectrometer, which provided critical insight for this study. They also provided critical revisions for the paper.
The contact author has declared that none of the authors has any competing interests.
Publisher's note: Copernicus Publications remains neutral with regard to jurisdictional claims in published maps and institutional affiliations.
This research was conducted as part of the international Seven SouthEast Asian Studies (7-SEAS) project. Authors Ukkyo Jeong and Si-Chee Tsay gratefully acknowledge the continuous support of the NASA Radiation Sciences Program (RSP), managed by Hal B. Maring, on the research development of SMART–s, deployments of the SMARTLabs, and the execution of this study. NASA Earth Observing System and RSP (Radiation Sciences Program) provided facility support to AERONET and research funds to the Deep Blue teams. We also acknowledge Barry L. Lefer, program manager of the NASA Tropospheric Composition Program, and his support of the NASA Pandora Project (https://pandora.gsfc.nasa.gov, last access: 12 September 2022) located at the NASA Goddard Space Flight Center. In addition, Langley calibrations of SMART–s were performed at the NOAA Mauna Loa Observatory with help from Paul Fukumura and Darryl Kuniyuki. Sincere thanks are also given to all international collaborators, assistants, and graduate students involved in the identification of field sites, operation of collocated instruments, and logistic and technical support, for making the field campaigns successful. Last, the authors thank Michael D. King and an anonymous reviewer, for their valuable comments and suggestions.
This research has been supported by the National Aeronautics and Space Administration (Radiation Sciences Program) and the National Institute of Environmental Research of South Korea, for partially supporting this study (grant no. NIER-2021-04-02-038).
This paper was edited by Bernd Funke and reviewed by Michael D. King and one anonymous referee.
Bais, A. F., Kazantzidis, A., Kazadzis, S., Balis, D. S, Zerefos, C. S., and Meleti, C.: Deriving an effective aerosol single scattering albedo from spectral surface UV voltage measurements, Atmos. Environ., 39, 1093–1102, https://doi.org/10.1016/j.atmosenv.2004.09.080, 2005.
Bhartia, P. K. and Wellemeyer, C. W.: OMI TOMS-V8 Total O3 algorithm, in OMI Algorithm Theoretical Basis Document, Vol. 2, NASA Goddard Space Flight Cent., Greenbelt, Md., USA, 15–32, https://eospso.gsfc.nasa.gov/sites/default/files/atbd/ATBD-OMI-02.pdf (last access: 12 September 2022), 2002.
Bovensmann, H., Burrows, J. P., Buchwitz, M., Frerick, J., Noël, S., Rozanov, V. V., Chance, K. V., and Goede, A. P. H.: SCIAMACHY: mission objectives and measurement modes, J. Atmos. Sci., 56, 127–150, 1999.
Burgos, M. A., Andrews, E., Titos, G., Alados-Arboledas, L., Baltensperger, U., Day, D., Jefferson, A., Kalivitis, N., Mihalopoulos, N., Sherman, J., Sun, J., Weingartner, E., and Zieger, P.: A global view on the effect of water uptake on aerosol particle light scattering, Sci. Data, 6, 157, https://doi.org/10.1038/s41597-019-0158-7, 2019.
Cede, A., Herman, J. R., Richter, A., Krotkov, N., and Burrows, J.: Measurements of nitrogen dioxide total column amounts using a Brewer double spectrophotometer in direct Sun mode, J. Geophys. Res., 111, D05304, https://doi.org/10.1029/2005JD006585, 2006.
Chance, K. and Kurucz, R. L.: An improved high-resolution solar reference spectrum for Earth's atmosphere measurements in the ultraviolet, visible, and near infrared, J. Quant. Spectrosc. Ra., 111, 1289–1295, https://doi.org/10.1016/j.jqsrt.2010.01.036, 2010.
Chance, K., Liu, X., Chan Miller, C., González Abad, G., Huang, G., Nowlan, C., Souri, A., Suleiman, R., Sun, K., Wang, H., Zhu, L., Zoogman, P., Al-Saadi, J., Antuña-Marrero, J.-C., Carr, J., Chatfield, R., Chin, M., Cohen, R., Edwards, D., Fishman, J., Flittner, D., Geddes, J., Grutter, M., Herman, J. R., Jacob, D. J., Janz, S., Joiner, J., Kim, J., Krotkov, N. A., Lefer, B., Martin, R. V., Mayol-Bracero, O. L., Naeger, A., Newchurch, M., Pfister, G. G., Pickering, K., Pierce, R. B., Rivera Cárdenas, C., Saiz-Lopez, A., Simpson, W., Spinei, E., Spurr, R. J. D., Szykman, J. J., Torres, O., and Wang, J.: TEMPO green paper: Chemistry, physics, and meteorology experiments with the tropospheric emissions: Monitoring of pollution instrument, Proc. SPIE, 11151, 111510B, https://doi.org/10.1117/12.2534883, 2019.
Chauvigné, A., Sellegri, K., Hervo, M., Montoux, N., Freville, P., and Goloub, P.: Comparison of the aerosol optical properties and size distribution retrieved by sun photometer with in situ measurements at midlatitude, Atmos. Meas. Tech., 9, 4569–4585, https://doi.org/10.5194/amt-9-4569-2016, 2016.
Chylek, P. and Coakley, J.: Aerosols and Climate, Science, 183, 75–77, https://doi.org/10.1126/science.183.4120.75, 1974.
Coddington, O., Lean, J. L., Pilewskie, P., Snow, M., and Lindholm, D.: A solar irradiance climate data record, B. Am. Meteorol. Soc., 97, 1265–1282, https://doi.org/10.1175/BAMS-D-14-00265.1, 2016.
Coddington, O., Richard, E. C., Harber, D. H., Pilewskie, P., Woods, T. N., Chance, K., Liu, X., and Sun, K.: The TSIS-1 hybrid solar reference spectrum, Geophys. Res. Lett., 48, e2020GL091709, https://doi.org/10.1029/2020GL091709, 2021.
Corr, C. A., Krotkov, N., Madronich, S., Slusser, J. R., Holben, B., Gao, W., Flynn, J., Lefer, B., and Kreidenweis, S. M.: Retrieval of aerosol single scattering albedo at ultraviolet wavelengths at the T1 site during MILAGRO, Atmos. Chem. Phys., 9, 5813–5827, https://doi.org/10.5194/acp-9-5813-2009, 2009.
DeMott, P. J., Prenni, A. J., Liu, X., Kreidenweis, S. M., Petters, M. D., Twohy, C. H., Richardson, M. S., Eidhammer, T., and Rogers, D. C.: Predicting global atmospheric ice nuclei distributions and their impacts on climate, P. Natl. Acad. Sci. USA, 107, 11217–11222, https://doi.org/10.1073/pnas.0910818107, 2010.
Di Biagio, C., Formenti, P., Balkanski, Y., Caponi, L., Cazaunau, M., Pangui, E., Journet, E., Nowak, S., Andreae, M. O., Kandler, K., Saeed, T., Piketh, S., Seibert, D., Williams, E., and Doussin, J.-F.: Complex refractive indices and single-scattering albedo of global dust aerosols in the shortwave spectrum and relationship to size and iron content, Atmos. Chem. Phys., 19, 15503–15531, https://doi.org/10.5194/acp-19-15503-2019, 2019.
Dubovik, O. and King, M.: A flexible inversion algorithm for retrieval of aerosol optical properties from Sun and sky radiance measurements, J. Geophys. Res.-Atmos., 105, 20673–20696, https://doi.org/10.1029/2000JD900282, 2000.
Dubovik, O., Holben, B., Eck, T., Smirnov, A., Kaufman, Y., King, M., Tanre, D., and Slutsker, I.: Variability of absorption and optical properties of key aerosol types observed in worldwide locations, J. Atmos. Sci., 59, 590–608, https://doi.org/10.1175/1520-0469(2002)059<0590:VOAAOP>2.0.CO;2, 2002.
Dubovik, O., Li, Z., Mishchenko, M. I., Tanré, D., Karol, Y., Bojkov, B., Cairns, B., Diner, D. J., Espinosa, W. R., Goloub, P., Gu, X., Hasekamp, O., Hong, J., Hou, W., Knobelspiesse, K. D., Landgraf, J., Li, L., Litvinov, P., Liu, Y., Lopatin, A., Marbach, T., Maring, H., Martins, V., Meijer, Y., Milinevsky, G., Mukai, S., Parol, F., Qiao, Y., Remer, L., Rietjens, J., Sano, I., Stammes, P., Stamnes, S., Sun, X., Tabary, P., Travis, L. D., Waquet, F., Xu, F., Yan, C., and Yin, D.: Polarimetric remote sensing of atmospheric aerosols: Instruments, methodologies, results, and perspectives, J. Quant. Spectrosc. Ra., 224, 474–511, https://doi.org/10.1016/j.jqsrt.2018.11.024, 2019.
Eck, T. F., Holben, B. N., Reid, J. S., Dubovik, O., Smirnov, A., O'Neill, N. T., Slutsker, I., and Kinne, S.: Wavelength dependence of the optical depth of biomass burning, urban, and desert dust aerosols, J. Geophys. Res., 104, 31333–31349, https://doi.org/10.1029/1999JD900923, 1999.
Eck, T. F., Holben, B. N., Ward, D. E., Dubovik, O., Reid, J. S., Smirnov, A., Mukelabai, M. M., Hsu, N. C., O'Neill, N. T., and Slutsker, I.: Characterization of the optical properties of biomass burning aerosols in Zambia during the 1997 ZIBBEE field campaign, J. Geophys. Res., 106, 3425–3448, https://doi.org/10.1029/2000JD900555, 2001.
Eck, T. F., Holben, B. N., Sinyuk, A., Pinker, R. T., Goloub, P., Chen, H., Chatenet, B., Li, Z., Singh, R. P., Tripathi, S. N., Reid, J. S., Giles, D. M., Dubovik, O., O'Neill, N. T., Smirnov, A., Wang, P., and Xia, X.: Climatological aspects of the optical properties of fine/coarse mode aerosol mixtures, J. Geophys. Res., 115, D19205, https://doi.org/10.1029/2010JD014002, 2010.
Eck, T. F., Holben, B. N., Reid, J. S., Mukelabai, M. M., Piketh, S. J., Torres, O., Jethva, H. T., Hyer, E. J., Ward, D. E., Dubovik, O., Sinyuk, A., Schafer, J. S., Giles, D. M., Sorokin, M., Smirnov, A., and Slutsker, I.: A seasonal trend of single scattering albedo in southern African biomass-burning particles: Implications for satellite products and estimates of emissions for the world's largest biomass-burning source, J. Geophys. Res.-Atmos., 118, 6414–6432, https://doi.org/10.1002/jgrd.50500, 2013.
Eck, T. F., Holben, B. N., Reid, J. S., Xian, P. Giles, D. M., Sinyuk, A., Smirnov, A., Schafer, J. S., Slutsker, I., Kim, J., Koo, J.-H., Choi, M., Kim, K. C., Sano, I., Arola, A., Sayer, A. M., Levy, R. C., Munchak, L. A., O'Neill, N. T., Lyapustin, A., Hsu, N. C., Randles, C. A., Da Silva, A. M., Buchard, V., Govindaraju, R. C., Hyer, E., Crawford, J. H., Wang, P., and Xia, X.: Observations of the interaction and transport of fine mode aerosols with cloud and/or fog in northeast Asia from AErosol RObotic NETwork and satellite remote sensing, J. Geophys. Res., 123, 5560–5587, https://doi.org/10.1029/2018JD028313, 2018.
Gatebe, C. K., Butler, J. J., Cooper, J. W., Kowalewski, M., and King, M. D.: Characterization of errors in the use of integrating-sphere systems in the calibration of scanning radiometers, Appl. Optics, 46, 7640–7651, https://doi.org/10.1364/AO.46.007640, 2007.
Gelaro, R., W. McCarty, M. J. Suárez, R. Todling, A. Molod, Takacs, L., Randles, C. A., Darmenov, A., Bosilovich, M. G., Reichle, R., Wargan, K., Coy, L., Cullather, R., Draper, C., Akella, S., Buchard, V., Conaty, A., da Silva, A. M., Gu, W., Kim, G.-K., Koster, R., Lucchesi, R., Merkova, D., Nielsen, J. E., Partyka, G., Pawson, S., Putman, W., Rienecker, M., Schubert, S. D., Sienkiewicz, M., and Zhao, B.: The Modern-Era Retrospective Analysis for Research and Applications, Version 2 (MERRA-2), B. Am. Meteorol. Soc., 30, 5419–5454, https://doi.org/10.1175/JCLI-D-16-0758.1, 2017.
George, C., Ammann, M., D'Anna, B., Donaldson, D. J., and Nizkorodov, S. A.: Heterogeneous photochemistry in the atmosphere, Chem. Rev., 115, 4218–4258, https://doi.org/10.1021/cr500648z, 2015.
Goering, C. D., L'Ecuyer, T. S., Stephens, G. L., Slusser, J. R., Scott, G., Davis, J., Barnard, J. C., and Madronich, S.: Simultaneous retrievals of column ozone and aerosol optical properties from direct and diffuse solar voltage measurements, J. Geophys, Res., 110, D05204, https://doi.org/10.1029/2004JD005330, 2005.
Giles, D. M., Holben, B. N., Eck, T. F., Sinyuk, A., Smirnov, A., Slutsker, I., Dickerson, R. R., Thompson, A. M., and Schafer, J. S.: An analysis of AERONET aerosol absorption properties and classifications representative of aerosol source regions, J. Geophys. Res., 117, D17203, https://doi.org/10.1029/2012JD018127, 2012.
Giles, D. M., Sinyuk, A., Sorokin, M. G., Schafer, J. S., Smirnov, A., Slutsker, I., Eck, T. F., Holben, B. N., Lewis, J. R., Campbell, J. R., Welton, E. J., Korkin, S. V., and Lyapustin, A. I.: Advancements in the Aerosol Robotic Network (AERONET) Version 3 database – automated near-real-time quality control algorithm with improved cloud screening for Sun photometer aerosol optical depth (AOD) measurements, Atmos. Meas. Tech., 12, 169–209, https://doi.org/10.5194/amt-12-169-2019, 2019 (data available at: https://aeronet.gsfc.nasa.gov, last access: 12 September 2022).
Gliß, J., Mortier, A., Schulz, M., Andrews, E., Balkanski, Y., Bauer, S. E., Benedictow, A. M. K., Bian, H., Checa-Garcia, R., Chin, M., Ginoux, P., Griesfeller, J. J., Heckel, A., Kipling, Z., Kirkevåg, A., Kokkola, H., Laj, P., Le Sager, P., Lund, M. T., Lund Myhre, C., Matsui, H., Myhre, G., Neubauer, D., van Noije, T., North, P., Olivié, D. J. L., Rémy, S., Sogacheva, L., Takemura, T., Tsigaridis, K., and Tsyro, S. G.: AeroCom phase III multi-model evaluation of the aerosol life cycle and optical properties using ground- and space-based remote sensing as well as surface in situ observations, Atmos. Chem. Phys., 21, 87–128, https://doi.org/10.5194/acp-21-87-2021, 2021.
Gueymard, C. A.: The sun's total and spectral irradiance for solar energy applications and solar radiation models, Sol. Energy, 76, 423–453, https://doi.org/10.1016/j.solener.2003.08.039, 2004.
Haywood, J. and Boucher, O.: Estimates of the direct and indirect radiative forcing due to tropospheric aerosols: a review, Rev. Geophys., 38, 513–543, https://doi.org/10.1029/1999RG000078, 2000.
Haywood, J., Francis, P., Dubovik, O., Glew, M., and Holben, B.: Comparison of aerosol size distributions, radiative properties, and optical depths determined by aircraft observations and Sun photometers during SAFARI 2000, J. Geophys. Res.-Atmos., 108, 8471, https://doi.org/10.1029/2002JD002250, 2003.
Herman, J. R., Cede, A., Spinei, E., Mount, G., Tzortziou, M., and Abuhassan, N.: NO2 column amounts from ground-based Pandora and MFDOAS spectrometers using the direct-Sun DOAS technique: Intercomparisons and application to OMI validation. J. Geophys. Res., 114, D13307, https://doi.org/10.1029/2009JD011848, 2009.
Herman, J., Evans, R., Cede, A., Abuhassan, N., Petropavlovskikh, I., and McConville, G.: Comparison of ozone retrievals from the Pandora spectrometer system and Dobson spectrophotometer in Boulder, Colorado, Atmos. Meas. Tech., 8, 3407–3418, https://doi.org/10.5194/amt-8-3407-2015, 2015.
Herrmann, H., Schaefer, T., Tilgner, A., Styler, S. A., Weller, C., Teich, M., and Otto, T.: Tropospheric aqueous-phase chemistry: Kinetics, mechanisms, and its coupling to a changing gas phase, Chem. Rev., 115, 4259–4334, https://doi.org/10.1021/cr500447k, 2015.
Hodshire, A. L., Akherati, A., Alvarado, M. J., Brown-Steiner, B., Jathar, S. H., Jimenez, J. L., Kreidenweis, S. M., Lonsdale, C. R., Onasch, T. B., Ortega, A. M., and Pierce, J. R.: Aging Effects on Biomass Burning Aerosol Mass and Composition: A Critical Review of Field and Laboratory Studies, Environ. Sci. Technol., 53, 10007–10022, https://doi.org/10.1021/acs.est.9b02588, 2019.
Holben, B. N., Eck, T. F., Slutsker, I., Tanré, D., Buis, J. P., Setzer, A., Vermote, E., Reagan, J. A., Kaufman, Y. J., Nakajima, T., Lavenu, F., Jankowiak, I., and Smirnov, A.: AERONET – A federated instrument network and data archive for aerosol characterization, Remote Sens. Environ., 66, 1–17, https://doi.org/10.1016/S0034-4257(98)00031-5, 1998.
Holben, B. N., Kim, J., Sano, I., Mukai, S., Eck, T. F., Giles, D. M., Schafer, J. S., Sinyuk, A., Slutsker, I., Smirnov, A., Sorokin, M., Anderson, B. E., Che, H., Choi, M., Crawford, J. H., Ferrare, R. A., Garay, M. J., Jeong, U., Kim, M., Kim, W., Knox, N., Li, Z., Lim, H. S., Liu, Y., Maring, H., Nakata, M., Pickering, K. E., Piketh, S., Redemann, J., Reid, J. S., Salinas, S., Seo, S., Tan, F., Tripathi, S. N., Toon, O. B., and Xiao, Q.: An overview of mesoscale aerosol processes, comparisons, and validation studies from DRAGON networks, Atmos. Chem. Phys., 18, 655–671, https://doi.org/10.5194/acp-18-655-2018, 2018.
Hsu, N. C., Lee, J., Sayer, A. M., Kim, W., Bettenhausen, C., and Tsay, S.-C.: VIIRS deep blue aerosol products over land: extending the EOS long-term aerosol data records, J. Geophys. Res.-Atmos., 124, 4026–4053, https://doi.org/10.1029/2018JD029688, 2019.
Ingmann, P., Veihelmann, B., Langen, J., Lamarre, D., Stark, H., and Courreges-Lacoste, G. B.: Requirements for the GMES atmosphere service and ESA's implementation concept: Sentinels-4/5 and -5p, Remote Sens. Environ., 120, 58–69, https://doi.org/10.1016/j.rse.2012.01.023, 2012.
IPCC: Technical Summary, in: Climate Change 2021: The Physical Science Basis. Contribution of Working Group I to the Sixth Assessment Report of the Intergovernmental Panel on Climate Change, edited by: Masson-Delmotte, V., Zhai, P., Pirani, A., Connors, S. L., Péan, C., Berger, S., Caud, N., Chen, Y., Goldfarb, L., Gomis, M. I., Huang, M., Leitzell, K., Lonnoy, E., Matthews, J. B. R., Maycock, T. K., Waterfield, T., Yelekçi, O., Yu, R., and Zhou, B., Cambridge University Press, Cambridge, United Kingdom and New York, NY, USA, 33−-144, https://doi.org/10.1017/9781009157896.002, 2021.
Itahashi, S., Uno, I., Irie, H., Kurokawa, J. I., and Ohara, T.: Impacts of Biomass Burning Emissions on Tropospheric NO2 Vertical Column Density over Continental Southeast Asia, in: Land-Atmospheric Research Applications in South and Southeast Asia, edited by: Vadrevu, K., Ohara, T., and Justice, C., Springer Remote Sensing/Photogrammetry, Springer, Cham, https://doi.org/10.1007/978-3-319-67474-2_4, 2018.
Jefferson, A., Hageman, D., Morrow, H., Mei, F., and Watson, T.: Seven years of aerosol scattering hygroscopic growth measurements from SGP: Factors influencing water uptake, J. Geophys. Res.-Atmos., 122, 9451–9466, https://doi.org/10.1002/2017JD026804, 2017.
Jena, C., Ghude, S. D., Pfister, G. G., Chate, D. M., Kumar, R., Beig, G., Surendran, D. E., Fadnavis, S., and Lal, D. M.: Influence of springtime biomass burning in South Asia on regional ozone (O3): A model based case study, Atmos. Environ., 100, 37–47, https://doi.org/10.1016/j.atmosenv.2014.10.027, 2015.
Jeong, U., Kim, J., Ahn, C., Torres, O., Liu, X., Bhartia, P. K., Spurr, R. J. D., Haffner, D., Chance, K., and Holben, B. N.: An optimal-estimation-based aerosol retrieval algorithm using OMI near-UV observations, Atmos. Chem. Phys., 16, 177–193, https://doi.org/10.5194/acp-16-177-2016, 2016.
Jeong, U., Tsay, S.-C., Pantina, P., Butler, J. J., Loftus, A. M., Abuhassan, N., Herman, J. R., Dimov, A., Holben, B. N., and Swap, R. J.: Langley calibration analysis of solar spectroradiometric measurements: Spectral aerosol optical thickness retrievals, J. Geophys. Res.-Atmos., 123, 4221–4238, https://doi.org/10.1002/2017JD028262, 2018.
Jeong, U., Tsay, S.-C., Giles, D. M., Holben, B. N., Swap, R. J., Abuhassan, N., and Herman, J. R.: The SMART-s Trace Gas and Aerosol Inversions: I. Algorithm Theoretical Basis for Column Property Retrievals, J. Geophys. Res.-Atmos., 125, e2019JD32088, https://doi.org/10.1029/2019JD032088, 2020.
Jeong, U., Tsay, S.-C., Puppala, S. P., Bhujel, A., Welton, E. J., Panday, A. K., Holben, B. N., and Hsu, N. C.: Spatiotemporal variabilities of aerosols and trace gases over Southern slope of Himalayan mountains during the High Mountain Asia campaign, Aerosol Air Qual. Res., in preparation, 2022.
Jethva, H. and Torres, O.: Satellite-based evidence of wavelength-dependent aerosol absorption in biomass burning smoke inferred from Ozone Monitoring Instrument, Atmos. Chem. Phys., 11, 10541–10551, https://doi.org/10.5194/acp-11-10541-2011, 2011.
Khodmanee, S. and Amnuaylojaroen, T.: Impact of Biomass Burning on Ozone, Carbon Monoxide, and Nitrogen Dioxide in Northern Thailand, Front. Environ. Sci., 9, 641877, https://doi.org/10.3389/fenvs.2021.641877, 2021.
Kim, H., Barkey, B., and Paulson, S. E.: Real refractive indices of α- and β-pinene and toluene secondary organic aerosols generated from ozonolysis and photo-oxidation, J. Geophys. Res., 115, D24212, https://doi.org/10.1029/2010JD014549, 2010.
Kim, J., Jeong, U., Ahn, M., Kim, J. H., Park, R. J., Lee, H., Song, C. H., Choi, Y., Lee, K., Yoo, J., Jeong, M., Park, S. K., Lee, K., Song, C., Kim, S., Kim, Y. J., Kim, S., Kim, M., Go, S., Liu, X., Chance, K., Chan Miller, C., Al-Saadi, J., Veihelmann, B., Bhartia, P. K., Torres, O., Abad, G. G., Haffner, D. P., Ko, D. H., Lee, S. H., Woo, J., Chong, H., Park, S. S., Nicks, D., Choi, W. J., Moon, K., Cho, A., Yoon, J., Kim, S., Hong, H., Lee, K., Lee, H., Lee, S., Choi, M., Veefkind, P., Levelt, P. F., Edwards, D. P., Kang, M., Eo, M., Bak, J., Baek, K., Kwon, H., Yang, J., Park, J., Han, K. M., Kim, B., Shin, H., Choi, H., Lee, E., Chong, J., Cha, Y., Koo, J., Irie, H., Hayashida, S., Kasai, Y., Kanaya, Y., Liu, C., Lin, J., Crawford, J. H., Carmichael, G. R., Newchurch, M. J., Lefer, B. L., Herman, J. R., Swap, R. J., Lau, A. K. H., Kurosu, T. P., Jaross, G., Ahlers, B., Dobber, M., McElroy, C. T., and Choi, Y.: New Era of Air Quality Monitoring from Space: Geostationary Environment Monitoring Spectrometer (GEMS), B. Am. Meteorol. Soc. 101, E1–E22, https://doi.org/10.1175/bams-d-18-0013.1, 2020.
Kinne, S., Ackerman, T. P., Shiobara, M., Uchiyama, A., Heymsfield, A. J., Miloshevich, L., Wendell, J., Eloranta, E. W., Purgold, C., and Bergstrom, R. W.: Cirrus cloud radiative and microphysical properties from ground observations and in situ measurements during FIRE 1991 and their application to exhibit problems in cirrus solar radiative transfer modelling, J. Atmos. Sci., 54, 2320–2344, https://doi.org/10.1175/1520-0469(1997)054<2320:CCRAMP>2.0.CO;2, 1997.
Konovalov, I. B., Beekmann, M., Berezin, E. V., Formenti, P., and Andreae, M. O.: Probing into the aging dynamics of biomass burning aerosol by using satellite measurements of aerosol optical depth and carbon monoxide, Atmos. Chem. Phys., 17, 4513–4537, https://doi.org/10.5194/acp-17-4513-2017, 2017.
Koop, T., Bookhold, J., Shiraiwa, M., and Pöschl, U.: Glass transition and phase state of organic compounds: dependency on molecular properties and implications for secondary organic aerosols in the atmosphere, Phys. Chem. Chem. Phys., 13, 19238–19255, https://doi.org/10.1039/C1CP22617G, 2011.
Korkin, S., Lyapustin, A., Sinyuk, A., Holben, B. N., and Kokhanovsky, A.: Vector radiative transfer code SORD: Performance analysis and quick start guide, J. Quant. Spectrosc. Ra., 200, 295–310, https://doi.org/10.1016/j.jqsrt.2017.04.035, 2017.
Krotkov, N., Bhartia, P. K., Herman, J., Slusser, J., Scott, G., Labow, G., Vasilkov, A. P., Eck, T. F., Dubovik, O., and Holben, B. N.: Aerosol ultraviolet absorption experiment (2002 to 2004), part2: absorption optical thickness, refractive index, and single scattering albedo, Opt. Eng., 44, 041005, https://doi.org/10.1117/1.1886819, 2005a.
Krotkov, N., Herman, J. J., Cede, A., and Labow, G.: Partitioning between aerosol and NO2 absorption in the UVA, in: Ultraviolet Ground- and Space-based Measurements, Models, and Effects V, edited by: Bernhard, G., Slusser, J. R., Herman, J. R., and Gao, W., Proceedings of SPIE, 5886, Bellingham, WA, 588601, https://doi.org/10.1117/12.615285, 2005b.
Laskin, A., Laskin, J., and Nizkorodov, A.: Chemistry of atmospheric brown carbon, Chem. Rev., 115, 4335–4382, https://doi.org/10.1021/cr5006167, 2015.
Lee, J., Hsu, N. C., Sayer, A. M., Seftor, C. J., and Kim, W. V.: Aerosol layer height with enhanced spectral coverage achieved by synergy between VIIRS and OMPS-NM measurements, IEEE Geosci. Remote Sens. Lett., 18, 949–953, https://doi.org/10.1109/LGRS.2020.2992099, 2021.
Levy, R. C., Mattoo, S., Munchak, L. A., Remer, L. A., Sayer, A. M., Patadia, F., and Hsu, N. C.: The Collection 6 MODIS aerosol products over land and ocean, Atmos. Meas. Tech., 6, 2989–3034, https://doi.org/10.5194/amt-6-2989-2013, 2013.
Li, L., Dubovik, O., Derimian, Y., Schuster, G. L., Lapyonok, T., Litvinov, P., Ducos, F., Fuertes, D., Chen, C., Li, Z., Lopatin, A., Torres, B., and Che, H.: Retrieval of aerosol components directly from satellite and ground-based measurements, Atmos. Chem. Phys., 19, 13409–13443, https://doi.org/10.5194/acp-19-13409-2019, 2019.
Lin, N.-H., Tsay, S.-C., Maring, H. B., Yen, M.-C., Sheu, G.-R., Wang, S.-H., Chi, K. H., Chuang, M.-T., Ou-Yang, C.-F., Fu, J. S., Reid, J. S., Lee, C.-T., Wang, L.-C., Wang, J.-L., Hsu, C. N., Sayer, A. M., Holben, B. N., Chu, Y.-C., Nguyen, X. A., Sopajaree, K., Chen, S.-J., Cheng, M.-T., Tsuang, B.-J., Tsai, C.-J., Peng, C.-M., Schnell, R. C., Conway, T., Chang, C.-T., Lin, K.-S., Tsai, Y. I., Lee, W.-J., Chang, S.-C., Liu, J.-J., Chiang, W.-L., Huang, S.-J., Lin, T.-H., and Liu, G.-R.: An overview of regional experiments on biomass burning aerosols and related pollutants in Southeast Asia: From BASE-ASIA and the Dongsha Experiment to 7-SEAS, Atmos. Environ., 78, 1–19, https://doi.org/10.1016/j.atmosenv.2013.04.066, 2013.
Liu, P., Zhang, Y., and Martin, S. T.: Complex refractive indices of thin films of secondary organic materials by spectroscopic ellipsometry from 220 to 1200 nm, Environ. Sci. Technol., 47, 13594–13601, https://doi.org/10.1021/es403411e, 2013.
Michel Flores, J., Bar-Or, R. Z., Bluvshtein, N., Abo-Riziq, A., Kostinski, A., Borrmann, S., Koren, I., Koren, I., and Rudich, Y.: Absorbing aerosols at high relative humidity: linking hygroscopic growth to optical properties, Atmos. Chem. Phys., 12, 5511–5521, https://doi.org/10.5194/acp-12-5511-2012, 2012.
Mie, G.: Beiträge zur Optik trüber Medien, speziell kolloidaler Metallösungen, Ann. Phys., 330, 377–445, https://doi.org/10.1002/andp.19083300302, 1908.
Mishchenko, M. I., Geogdzhayev, I. V., Liu, L., Ogren, J. A., Lacis, A. A., Rossow, W. B., Hovenier, J. W., Volten, H., and Munoz, O.: Aerosol retrievals from AVHRR radiances: effects of particle nonsphericity and absorption and an updated long-term global climatology of aerosol properties, J. Quant. Spectrosc. Ra., 79, 953–972, https://doi.org/10.1016/S0022-4073(02)00331-X, 2003.
Mok, J., Krotkov, N. A., Torres, O., Jethva, H., Li, Z., Kim, J., Koo, J.-H., Go, S., Irie, H., Labow, G., Eck, T. F., Holben, B. N., Herman, J., Loughman, R. P., Spinei, E., Lee, S. S., Khatri, P., and Campanelli, M.: Comparisons of spectral aerosol single scattering albedo in Seoul, South Korea, Atmos. Meas. Tech., 11, 2295–2311, https://doi.org/10.5194/amt-11-2295-2018, 2018.
Moosmüller, H., Chakrabarty, R. K., and Arnott, W. P.: Aerosol light absorption and its measurement: A review, J. Quant. Spectrosc. Ra., 110, 844–878, https://doi.org/10.1016/j.jqsrt.2009.02.035, 2009.
Müller, M., Gebetsberger, M., Tiefengraber, M., and Cede, A.: Fiducial Reference Measurements for Air Quality: Calibration Procedures Document (LuftBlick_FRM4AQ_CPD_ RP_2019003_v4.0), https://www.pandonia-global-network.org (last access: 12 September 2022), 2020.
Müller, T., Schladitz, A., Kandler, K., and Wiedensohler, A.: Spherical particle absorption coefficients, single scattering albedos and imaginary parts of refractive indices from ground based in situ measurements at Cape Verde Island during SAMUM-2, Tellus B, 63, 573–588, https//doi.org/10.1111/j.1600-0889.2011.00572.x, 2011.
Myhre, G., Samset, B. H., Schulz, M., Balkanski, Y., Bauer, S., Berntsen, T. K., Bian, H., Bellouin, N., Chin, M., Diehl, T., Easter, R. C., Feichter, J., Ghan, S. J., Hauglustaine, D., Iversen, T., Kinne, S., Kirkevåg, A., Lamarque, J.-F., Lin, G., Liu, X., Lund, M. T., Luo, G., Ma, X., van Noije, T., Penner, J. E., Rasch, P. J., Ruiz, A., Seland, Ø., Skeie, R. B., Stier, P., Takemura, T., Tsigaridis, K., Wang, P., Wang, Z., Xu, L., Yu, H., Yu, F., Yoon, J.-H., Zhang, K., Zhang, H., and Zhou, C.: Radiative forcing of the direct aerosol effect from AeroCom Phase II simulations, Atmos. Chem. Phys., 13, 1853–1877, https://doi.org/10.5194/acp-13-1853-2013, 2013.
Nakajima, T., Yoon, S.-C., Ramanathan, V., Shi, G.-Y., Takemura, T., Higurashi, A. Takamura, T., Aoki, K., Sohn, B.-J., Kim, S.-W., Tsuruta, H., Sugimoto, N., Shimizu, A., Tanimoto, H., Sawa, Y., Lin, N.-H., Lee, C.-T., Goto, D., and Schutgens, N.: Overview of the atmospheric brown cloud East Asian regional experiment 2005 and a study of the aerosol direct radiative forcing in east Asia, J. Geophys. Res., 112, D24S91, https://doi.org/10.1029/2007JD009009, 2007.
Nakajima, T., Campanelli, M., Che, H., Estellés, V., Irie, H., Kim, S.-W., Kim, J., Liu, D., Nishizawa, T., Pandithurai, G., Soni, V. K., Thana, B., Tugjsurn, N.-U., Aoki, K., Go, S., Hashimoto, M., Higurashi, A., Kazadzis, S., Khatri, P., Kouremeti, N., Kudo, R., Marenco, F., Momoi, M., Ningombam, S. S., Ryder, C. L., Uchiyama, A., and Yamazaki, A.: An overview of and issues with sky radiometer technology and SKYNET, Atmos. Meas. Tech., 13, 4195–4218, https://doi.org/10.5194/amt-13-4195-2020, 2020.
Natraj, V., Liu, X., Kulawik, S. S., Chance, K., Chatfield, R., Edwards, D. P., Eldering, A., Francis, G., Kurosu, T., Pickering, K., Spurr, R., and Worden, H.: Multispectral sensitivity studies for the retrieval of tropospheric and lowermost tropospheric ozone from simulated clear sky GEO-CAPE measurements, Atmos. Environ., 45, 7151–7165, https://doi.org/10.1016/j.atmosenv.2011.09.014, 2011.
Pantina, P., Tsay, S.-C., Hsiao, T.-C., Loftus, A. M., Kuo, F., Ou-Yang, C.-F., Sayer, A. M., Wang, S.-H., Lin, N.-H., Hsu, N. C., Janjai, S., Chantara, S., and Nguyen, A. X.: COMMIT in 7-SEAS/BASELInE: Operation of and Observations from a Novel, Mobile Laboratory for Measuring In-Situ Properties of Aerosols and Gases, Aerosol Air Qual. Res., 26, 2728–2741, https://doi.org/10.4209/aaqr.2015.11.0630, 2016.
Petters, J. L., Saxena, V. K., Slusser, J. R., Wenny, B. N., and Madronich, S.: Aerosol single scattering albedo retrieved from measurements of surface UV irradiance and a radiative transfer model, J. Geophys. Res., 108, 4288, https://doi.org/10.1029/2002JD002360, 2003
Petters, M. D., Carrico, C. M., Kreidenweis, S. M., Prenni, A. J., DeMott, P. J., Collett Jr., J. L., and Moosmüller, H.: Cloud condensation nucleation activity of biomass burning aerosol, J. Geophys. Res., 114, D22205, https://doi.org/10.1029/2009JD012353, 2009
Pistone, K., Redemann, J., Doherty, S., Zuidema, P., Burton, S., Cairns, B., Cochrane, S., Ferrare, R., Flynn, C., Freitag, S., Howell, S. G., Kacenelenbogen, M., LeBlanc, S., Liu, X., Schmidt, K. S., Sedlacek III, A. J., Segal-Rozenhaimer, M., Shinozuka, Y., Stamnes, S., van Diedenhoven, B., Van Harten, G., and Xu, F.: Intercomparison of biomass burning aerosol optical properties from in situ and remote-sensing instruments in ORACLES-2016, Atmos. Chem. Phys., 19, 9181–9208, https://doi.org/10.5194/acp-19-9181-2019, 2019.
Reid, J. S., Eck, T. F., Christopher, S. A., Hobbs, P. V., and Holben, B. N.: Use of the Ångström exponent to estimate the variability of optical and physical properties of aging smoke particles in Brazil, J. Geophys. Res., 104, 27473–27489, https://doi.org/10.1029/1999JD900833, 1999.
Reid, J. S., Hyer, E. J., Johnson, R. S., Holben, B. N., Yokelson, R. J., Zhang, J., Campbell, J. R., Christopher, S. A., Di Girolamo, L., Giglio, L., Holz, R. E., Kearney, C., Miettinen, J., Reid, E. A., Turk, F. J., Wang, J., Xian, P., Zhao, G., Balasubramanian, R., Chew, B. N., Janjai, S., Lagrosas, N., Lestari, P., Lin, N.-H., Mahmud, M., Nguyen, A. X., Norris, B., Oanh, N. T. K., Oo, M., Salinas, S. V., Welton, E. J., and Liew, S. C.: Observing and understanding the Southeast Asian aerosol system by remote sensing: An initial review and analysis for the Seven Southeast Asian Studies (7SEAS) program, Atmos. Res., 122, 403–468, https://doi.org/10.1016/j.atmosres.2012.06.005, 2013.
Randerson, J. T., Chen, Y., van der Werf, G. R., Rogers, B. M., and Morton, D. C.: Global burned area and biomass burning emissions from small fires, J. Geophys. Res., 117, G04012, https://doi.org/10.1029/2012JG002128, 2012.
Rodgers, C. D.: Characterization and error analysis of profiles retrieved from remote sounding measurements, J. Geophys. Res., 95, 5587–5595, https://doi.org/10.1029/JD095id05p05587, 1990.
Rodgers, C. D.: Inverse method for atmospheric sounding: Theory and practice, edited by: Taylor, F. W., World Scientific Publishing co., Singapore, Pte. Ltd., https://doi.org/10.1142/3171, 2000.
Sayer, A. M., Hsu, N. C., Eck, T. F., Smirnov, A., and Holben, B. N.: AERONET-based models of smoke-dominated aerosol near source regions and transported over oceans, and implications for satellite retrievals of aerosol optical depth, Atmos. Chem. Phys., 14, 11493–11523, https://doi.org/10.5194/acp-14-11493-2014, 2014.
Schafer, J. S., Eck, T. F., Holben, B. N., Thornhill, K. L., Ziemba, L. D., Sawamura, P., Moore, R. H., Slutsker, I., Anderson, B. E., Sinyuk, A., Giles, D. M., Smirnov, A., Beyersdorf, A. J., and Winstead, E. L.: Intercomparison of aerosol volume size distributions derived from AERONET ground-based remote sensing and LARGE in situ aircraft profiles during the 2011–2014 DRAGON and DISCOVER-AQ experiments, Atmos. Meas. Tech., 12, 5289–5301, https://doi.org/10.5194/amt-12-5289-2019, 2019.
Shepherd, R. H., King, M. D., Marks, A. A., Brough, N., and Ward, A. D.: Determination of the refractive index of insoluble organic extracts from atmospheric aerosol over the visible wavelength range using optical tweezers, Atmos. Chem. Phys., 18, 5235–5252, https://doi.org/10.5194/acp-18-5235-2018, 2018.
Shiraiwa, M., Ammann, M., Koop, T., and Pöschl, U.: Gas uptake and chemical aging of semisolid organic aerosol particles, P. Natl. Acad. Sci. USA, 108, 11003–11008, https://doi.org/10.1073/pnas.1103045108, 2011.
Sinyuk, A., Holben, B. N., Eck, T. F., Giles, D. M., Slutsker, I., Korkin, S., Schafer, J. S., Smirnov, A., Sorokin, M., and Lyapustin, A.: The AERONET Version 3 aerosol retrieval algorithm, associated uncertainties and comparisons to Version 2, Atmos. Meas. Tech., 13, 3375–3411, https://doi.org/10.5194/amt-13-3375-2020, 2020 (data available at: https://aeronet.gsfc.nasa.gov, last access: 12 September 2022).
Spurr, R. J. D.: VLIDORT: A linearized pseudo-spherical vector discrete ordinate radiative transfer code for forward model and retrieval studies in multilayer multiple scattering media. J. Quant. Spectrosc. Ra., 102, 316–342, https://doi.org/10.1016/j.jqsrt.2006.05.005, 2006.
Spurr, R. J. D. and Christi, M.: On the generation of atmospheric property Jacobians from the (V)LIDORT linearized radiative transfer models, J. Quant. Spectrosc. Ra., 142, 109–115, https://doi.org/10.1016/j.jqsrt.2014.03.011, 2014.
Spurr, R. J. D., Wang, J., Zeng, J., and Mishchenko, M. I.: Linearized T-matrix and Mie scattering computations, J. Quant. Spectrosc. Ra., 113, 425–439, https://doi.org/10.1016/j.jqsrt.2011.11.014, 2012.
Stamnes, K., Tsay, S.-C., Wiscombe, W., and Jayaweera, K.: Numerically stable algorithm for discrete-ordinate-method radiative transfer in multiple scattering and emitting layered media, Appl. Optics, 27, 2502–2509, https://doi.org/10.1364/AO.27.002502, 1988.
Sumlin, B. J., Heinson, Y. W., Shetty, N., Pandey, A., Pattison, R. S., Baker, S., Hao, W. M., and Chakrabarty, R. K.: UV–Vis–IR spectral complex refractive indices and optical properties of brown carbon aerosol from biomass burning, J. Quant. Spectrosc. Ra., 206, 392–398, https://doi.org/10.1016/j.jqsrt.2017.12.009, 2018.
Tang, M., Cziczo, D. J., and Grassian, V. H.: Interactions of water with mineral dust aerosol: water adsorption, hygroscopicity, cloud condensation, and ice nucleation, Chem. Rev., 116, 4205–4259, https://doi.org/10.1021/acs.chemrev.5b00529, 2016.
Takemura, T., Nakajima, T., Dobovik, O., Holben, B. N., and Kinne, S.: Single-scattering albedo and radiative forcing of various aerosol species with a global three-dimensional model, J. Climate., 15, 333–352, https://doi.org/10.1175/1520-0442(2002)015<0333:SSAARF>2.0.CO;2, 2002.
Tao, J. C., Zhao, C. S., Ma, N., and Liu, P. F.: The impact of aerosol hygroscopic growth on the single-scattering albedo and its application on the NO2 photolysis rate coefficient, Atmos. Chem. Phys., 14, 12055–12067, https://doi.org/10.5194/acp-14-12055-2014, 2014.
Taylor, T. E., L'Ecuyer, T. S., Slusser, J. R., Stephens, G. L., and Goering, C. D.: An operational retrieval algorithm for determining aerosol optical properties in the ultraviolet, J. Geophys. Res., 113, D03201, https://doi.org/10.1029/2007JD008661, 2008.
Torres, O., Ahn, C., and Chen, Z.: Improvements to the OMI near-UV aerosol algorithm using A-train CALIOP and AIRS observations, Atmos. Meas. Tech., 6, 3257–3270, https://doi.org/10.5194/amt-6-3257-2013, 2013.
Tsay, S.-C., Hsu, N. C., Lau, W. K.-M., Li, C., Gabriel, P. M., Ji, Q., Holben, B. N., Welton, E. J., Nguyen, A. X., Janjai, S., Lin, N.-H., Reid, J. S., Boonjawat, J., Howell, S. G., Huebert, B. J., Fu, J. S., Hansell, R. A., Sayer, A. M., Gautam, R., Wang, S.-H., Goodloe, C. S., Miko, L. R., Shu, P. K., Loftus, A. M., Huang, J., Kim, J. Y., Jeong, M.-J., and Pantina, P.: From BASE-ASIA toward 7-SEAS: A satellite-surface perspective of boreal spring biomass-burning aerosols and clouds in Southeast Asia, Atmos. Environ., 78, 20–34, https://doi.org/10.1016/j.atmosenv.2012.12.013, 2013.
Tsay, S.-C., Maring, H. B., Lin, N.-H., Buntoung, S., Chantara, S., Chuang, H.-C., Gabriel, P. M., Goodlo, C. S., Holben, B. N., Hsiao, T.-C., Hsu, N. C., Janjai, S., Lau, W. K. M., Lee, C.-T., Lee, J., Loftus, A. M., Nguyen, A. X., Nguyen, C. M., Pani, S. K., Pantina, P., Sayer, A. M., Tao, W.-K., Wang, S.-H., Welton, E. J., Wiriya, W., and Yen, M.-C.: Satellite-Surface Perspectives of Air Quality and Aerosol-Cloud Effects on the Environment: An Overview of 7-SEAS/BASELInE, Aerosol Air Qual. Res., 16, 2581–2602, https://doi.org/10.4209/aaqr.2016.08.0350, 2016.
Uchiyama, A., Matsunaga, T., and Yamazaki, A.: The instrument constant of sky radiometers (POM-02) – Part 1: Calibration constant, Atmos. Meas. Tech., 11, 5363–5388, https://doi.org/10.5194/amt-11-5363-2018, 2018a.
Uchiyama, A., Matsunaga, T., and Yamazaki, A.: The instrument constant of sky radiometers (POM-02) – Part 2: Solid view angle, Atmos. Meas. Tech., 11, 5389–5402, https://doi.org/10.5194/amt-11-5389-2018, 2018b.
US EPA Office of Research and Development: CMAQ (5.3.3), Zenodo [code], https://doi.org/10.5281/zenodo.5213949, 2021.
Valenzuela, A., Reid, J. P., Bzdek, B. R., and Orr-Ewing, A. J.: Accuracy required in measurements of refractive index and hygroscopic response to reduce uncertainties in estimates of aerosol radiative forcing efficiency, J. Geophys. Res.-Atmos., 123, 6469–6486, https://doi.org/10.1029/2018JD028365, 2018.
Wetzel, M. A., Shaw, G. E., Slusser, J. R., Borys, R. D., and Cahill, C. F.: Physical, chemical, and ultraviolet radiative characteristics of aerosol in central Alaska, J. Geophys. Res., 108, 4418, https://doi.org/10.1029/2002JD003208, 2003.
Womack, C. C., Manfred, K. M., Wagner, N. L., Adler, G., Franchin, A., Lamb, K. D., Middlebrook, A. M., Schwarz, J. P., Brock, C. A., Brown, S. S., and Washenfelder, R. A.: Complex refractive indices in the ultraviolet and visible spectral region for highly absorbing non-spherical biomass burning aerosol, Atmos. Chem. Phys., 21, 7235–7252, https://doi.org/10.5194/acp-21-7235-2021, 2021.
Wu, Z., Chen, J., Wang, Y., Zhu, Y., Liu, Y., Yao, B., Zhang, Y., and Hu, M.: Interactions between water vapor and atmospheric aerosols have key roles in air quality and climate change, Natl. Sci. Rev., 5, 452–454, https://doi.org/10.1093/nsr/nwy063, 2018.
Xu, W., Han, T., Du, W., Wang, Q., Chen, C., Zhao, J., Zhang, Y., Li, J., Fu, P., Wang, Z., Worsnop, D. R., and Sun, Y.: Effects of Aqueous-Phase and Photochemical Processing on Secondary Organic Aerosol Formation and Evolution in Beijing, China, Environ. Sci. Technol., 51, 762–770, https://doi.org/10.1021/acs.est.6b04498, 2017.
Yang, P., Feng, Q., Hong, G., Kattawar, G. W., Wiscombe, W. J., Mishchenko, M. I., Dubovik, O., Laszlo, I., and Sokolik, I. N.: Modeling of the scattering and radiative properties of nonspherical dust-like aerosols, J. Aerosol Sci., 38, 995–1014, https://doi.org/10.1016/j.jaerosci.2007.07.001, 2007.
Yu, H., Kaufman, Y. J., Chin, M., Feingold, G., Remer, L. A., Anderson, T. L., Balkanski, Y., Bellouin, N., Boucher, O., Christopher, S., DeCola, P., Kahn, R., Koch, D., Loeb, N., Reddy, M. S., Schulz, M., Takemura, T., and Zhou, M.: A review of measurement-based assessments of the aerosol direct radiative effect and forcing, Atmos. Chem. Phys., 6, 613–666, https://doi.org/10.5194/acp-6-613-2006, 2006.
- Abstract
- Introduction
- Measurements and calibrations
- Results
- Summary and conclusions
- Appendix A: Scatterplots between SMART–s direct-sun retrievals and AERONET/satellite observations
- Appendix B: SMART–s ozone and water vapor retrieval algorithm
- Appendix C: SMART–s aerosol inversion algorithm
- Appendix D: Comparison of aerosol optical properties from the SMART–s and AERONET
- Data availability
- Author contributions
- Competing interests
- Disclaimer
- Acknowledgements
- Financial support
- Review statement
- References