the Creative Commons Attribution 4.0 License.
the Creative Commons Attribution 4.0 License.
 | 15 Sep 2022
Measurement report: Ambient volatile organic compound (VOC) pollution in urban Beijing: characteristics, sources, and implications for pollution control
Lulu Cui
Di Wu
Qingcheng Xu
Ruolan Hu
Jiming Hao
The increasing ozone (O3) pollution and high fraction of secondary organic aerosols (SOA) in fine particle mass has highlighted the importance of volatile organic compounds (VOCs) in air pollution control. In this work, four intensive field measurements of VOCs during winter of 2018 (from 1 December 2018 to 17 January 2019), spring (15 April to 27 May), summer (17 June to 13 July), and autumn (22 September to 27 November) of 2019 were conducted at an urban site in Beijing to characterize VOC sources and their contributions to air pollution. The total mixing ratio of the 95 quantified VOCs (TVOC) observed in this study ranged from 5.5–118.7 ppbv with the mean value of 34.9 ppbv. Alkanes, OVOCs, and halocarbons were the dominant chemical groups, accounting for 75 %–81 % of the TVOC across the sampling months. The molar ratios of VOCs to NOx indicated that O3 formation was limited by VOCs during the whole sampling period. Positive matrix factorization (PMF) analysis showed that diesel vehicle exhaust, gasoline vehicle exhaust, and industrial emissions were the main VOC sources during both the O3-polluted and PM2.5-polluted months. On the basis of O3 formation impact, VOCs from fuel evaporation and diesel exhaust, particularly toluene, xylenes, trans-2-butene, acrolein, methyl methacrylate, vinyl acetate, 1-butene, and 1-hexene, were the main contributors, illustrating the necessity of conducting emission controls on these pollution sources and species to alleviate O3 pollution. Instead, VOCs from diesel exhaust as well as coal and biomass combustion were found to be the dominant contributors to secondary organic aerosol formation potential (SOAFP), particularly the VOC species of toluene, 1-hexene, xylenes, ethylbenzene, and styrene, and top priority should be given to these for the alleviation of haze pollution. This study provides insights for the government to formulate effective VOC control measures for air pollution in Beijing.
- Article
(4612 KB) - Full-text XML
-
Supplement
(897 KB) - BibTeX
- EndNote


Ozone (O3) and fine particulate matter (PM2.5) pollution has restricted improvements in air quality in China. Observation data from the Chinese Ministry of Environment and Ecology (MEE) network witnessed an upward trend for O3 across the country over the period 2013–2019 (Fu et al., 2019; Li et al., 2017, 2020; Shen et al., 2019; Fan et al., 2020). Also, haze pollution occurring at urban sites in recent years has commonly been characterized by enhanced formation of secondary organic aerosol (SOA) in fine particles; e.g., the fraction of SOA in organic aerosols reached 58 % in Xi'an during winter 2018 and 53 % in urban Beijing during winter 2014 (Kuang et al., 2020; Y. J. Li et al., 2017; Sun et al., 2020; Q. Xu et al., 2019). Volatile organic compounds (VOCs) are key precursors for the formation of O3 via gas-phase reactions (Odum et al., 1997; Atkinson, 2000; Sato et al., 2010; Huang et al., 2014). In highly polluted urban regions, O3 formation is generally VOC-limited, and it is suggested that VOC emission control is necessary for effective alleviation of photochemical smog (Liu et al., 2020; Liu and Wang, 2020; Shao et al., 2009; Wang et al., 2020; Xing et al., 2011). In addition, VOCs, including aromatics and biogenic species, have a significant impact on SOA formation, which plays an important role in haze formation (Huang et al., 2014; Tong et al., 2021). VOC emission abatement is therefore imperative for improving air quality in China.
VOCs in ambient air can be emitted by a variety of sources including both anthropogenic and biogenic sources. While biogenic emissions are significantly greater than anthropogenic emissions globally (Doumbia et al., 2021; Sindelarova et al., 2022), anthropogenic emissions play the dominant role in urban and surrounding areas (Warneke et al., 2007; Ahmad et al., 2017; Wu and Xie, 2018). The VOC observations in China showed distinct differences in anthropogenic sources among different regions. For example, solvent use and vehicle exhaust are primary VOC sources in urban Shanghai and urban Guangzhou, while the primary sources of VOCs in Wuhan, Zhengzhou, and Beijing are combustion and vehicle exhaust (Han et al., 2020; Shen et al., 2020; Liu et al., 2020; B. Li et al., 2019). Apart from the diversity of emission sources, different VOC species exhibited different propensities to form O3 and SOA. Observation-based studies commonly apply the O3 formation potential (OFP) and SOA formation potential (SOAFP) scales to quantify the relative effects of specific VOCs and sources on O3 and SOA formation as well as to aid in the development of efficient control strategies (Carter and Atkinson, 1989; Chang and Rudy, 1990; Han et al., 2020; Zhang et al., 2017). Although there have been many studies on ambient VOCs in various locations (e.g., urban, rural, and industrial areas), most of these measurements were confined to short periods (a few days or a certain season), and the understanding of temporal variations in concentrations, sources, and the influence of photochemical reactions of VOCs on an annual scale is still limited. Most of the available reports on VOC analysis based on online analytical techniques include mainly non-methane hydrocarbon compounds, and thus the characteristics of VOCs as well as their relationships with PM2.5 and O3 cannot be fully revealed since OVOCs also actively participate in chemical reactions related to secondary formation (B. Li et al., 2019; Q. Zhao et al., 2020; Yang et al., 2018; Pallavi et al., 2019). Therefore, the long-term and comprehensive monitoring of VOCs is desired.
As the capital and one of the largest megacities in China, Beijing has been suffering from severe O3 pollution due to rapid economic development and increases in precursor emissions (Y. S. Wang et al., 2014; Wang et al., 2017; Li et al., 2019b; D. Zhao et al., 2020). According to the Report on the State of the Ecology and Environment in Beijing, the average 90th percentile O3 daily maximum 8 h concentration in Beijing has exceeded the national standards, reaching 193, 192, and 191 µg m−3 in 2017, 2018, and 2019, respectively. In addition, the number of motor vehicles in Beijing reached 6.365 million at of the end of 2019 (http://tjj.beijing.gov.cn/EnglishSite/, last access: 2 October 2021), making Beijing the top city in China in terms of the number of motor vehicles. The existing field measurements in Beijing were mostly conducted before 2016, and observations in most recent years are quite limited (Li et al., 2015, 2019a; Liu et al., 2020; Yang et al., 2018). In this work, ambient air samples were collected at an urban site in Beijing from December 2018 to mid-January 2019, mid-April to late May 2019, mid-June to mid-July 2019, and late September to late November 2019. Several O3 and PM2.5 pollution events were captured during the sampling period. The characteristics and the contribution of specific species and sources of VOCs to O3 and SOA formation, with a focus on photochemical and haze pollution periods, were analyzed in detail. The results and implications from this study can provide useful guidance for policy makers to alleviate ozone and haze pollution in Beijing.
2.1 Field measurement
The sampling site is on the roof of a three-floor building on the campus of Tsinghua University (40.00∘ N, 116.33∘ E), northwest of a Beijing urban area (Fig. S1 in the Supplement). The altitude of the sampling site is 57 m. This sampling site is surrounded by the school and there are no large emission sources nearby; therefore, it can represent the urban air quality in Beijing. Details of the site description are found in W. Xu et al. (2019).
The air samples were collected using 6 L summa canisters (Entech, USA) with a stable rate of 4.26 mL min−1. The samples were preprocessed to remove N2, O2, CO2, CO, and H2O in the samples and to further concentrate the samples in volume by the cryogenic pre-concentrator (model 7100, Entech Instruments Inc., USA). A pressure gauge was used to test if the canister has air leakage before sampling every time, and blanks were prepared using cleaned canisters to fill with high-purity nitrogen. The cryotraps of the precooling system were baked before analyses each day and between every sample. The VOCs in air samples were analyzed by a gas chromatography system that was equipped with a mass spectrometric detector (GC-MS) (Agilent Tech., 7890/5975, USA). The suitability of this system for VOC measurement is well verified, and it has been used in field campaigns (Li et al., 2014; Wu et al., 2016). The oven temperature was programmed at 40∘ for 3 min initially, then raised to 90 ∘C at 8∘ min−1, and later raised to 220 ∘C at 6∘ min−1, holding for 9 min. In this work, 95 target VOCs, including 25 alkanes, 8 alkenes, 16 aromatics, 34 halocarbons, and 12 OVOCs, were quantified. It should be noted that VOCs (C2–C3) with a low boiling point (i.e., ethane, ethene, acetylene, and propane) were not detected by the GC-MS system. The standard substance (SPECTRA GASES Inc., USA) mentioned for Photochemical Assessment Monitoring Stations (PAMS) and the US EPA TO-15 standard were used to construct the calibration curves for the target VOCs. Quality assurance and quality control, including the method detection limit (MDL) of each compound, laboratory and field blanks, retention time, accuracy, and duplicate measurements of samples, were performed according to the US EPA Compendium Method TO-15 (US Environmental Protection Agency, 1999). The correlated coefficients of the calibration curves for all the compounds were > 0.95. The relative standard deviation (RSD) for all of compounds of triplicates was 0.5 %–6.0 %. Previous field measurements have reported that the precision of a GC-MS system for hydrocarbons and aldehydes was below 6 % and 15 %, respectively (Li et al., 2014; Wu et al., 2016). In this work, one kind of aldehyde substance, i.e., acrolein, was detected, with R2 and RSD of 0.99 % and 4.5 %, respectively.
During the sampling periods, the measurements of PM2.5, gaseous pollutants (NOx and O3), and meteorological variables (such as temperature, relative humidity, wind speed, and wind direction) were conducted simultaneously. SO2, NOx, and O3 were analyzed using a pulsed fluorescence SO2 analyzer (Thermo Fisher Scientific USA, 43I), chemiluminescence NO–NO2–NOx analyzer (Thermo Fisher Scientific USA, 17I), and ultraviolet (UV) photometric O3 analyzer (Thermo Fisher Scientific USA, 49I), respectively. The mass concentration of PM2.5 was measured using an oscillating balance analyzer (TH-2000Z, China) (Y. S. Wang et al., 2014). The quality assurance of SO2, NO2, O3, and PM2.5 was conducted based on HJ 630-2011 specifications. Meteorological variables including wind speed (WS), wind direction (WD), relative humidity (RH), air pressure, temperature, and precipitation were measured by an automatic weather monitoring system. The planetary boundary height was obtained from the European Centre for Medium-Range Weather Forecasts (https://www.ecmwf.int/en/forecasts/datasets, last access: 5 November 2021).
2.2 Ozone formation potential (OFP) and secondary formation potential (SOAFP) calculation
The formation potential of O3 and SOA was used to characterize the relative importance of VOC species and sources in secondary formation, which were estimated using Eqs. (1) and (2):
where n represents the number of VOCs, [VOC]i represents the ith VOC species concentration, MIRi is the maximum incremental reactivity for the ith VOC species, and Yi is the SOA yield of VOCi (McDonald et al., 2018). The MIR for each VOC species was taken from the updated Carter research results (http://www.engr.ucr.edu/~carter/reactdat.htm, last access: 24 February 2021). For species lacking yield curves, the fractional aerosol coefficient (FAC) values proposed by Grosjean and Seinfeld (1989) were used.
2.3 Deweathered model
In this work, the influences of meteorological conditions on O3 and PM2.5 were removed using the random forest (RF) model. The meteorological predictors in the RF model include wind speed (WS), wind direction (WD), air temperature (T), relative humidity (RH), precipitation (Prec), air pressure (P), time predictors (year, day of year – DOY, hour), and planetary boundary layer height (BLH). These meteorological parameters have been reported to be strongly associated with PM2.5 and O3 concentrations in various regions in China (Chen et al., 2020; Feng et al., 2020) and contributed significantly in previous PM2.5 and O3 prediction models (She et al., 2020; Li et al., 2020). The modeling relates the hourly variability of O3 and PM2.5 to that of meteorological variables. The model performance was evaluated through the 10-fold cross-validation (CV) approach, which randomly selects 10 % of the dataset for model testing and trains the model with the remaining data. This process was repeated 10 times, and each record was selected once as testing data. In each round, the training dataset includes ∼ 90 % randomly selected data representing different seasons. After the building of the RF model, the deweathered technique was applied to predict the air pollutant level at a specific time point. The differences in original pollutant concentrations and deweathered pollutant concentrations were regarded as the concentrations contributed by meteorology. Statistical indicators including R2, root mean square error (RMSE), and mean absolute error (MAE) values were regarded as the major criteria to evaluate the modeling performance.
2.4 Positive matrix factorization (PMF)
In this study, the US EPA PMF 5.0 software was used for VOC source apportionment (Abeleira et al., 2017; B. Li et al., 2019; Xue et al., 2017). The detailed description of the PMF model is found elsewhere (Ling et al., 2011; Yuan et al., 2010). PMF uses both concentration and user-provided uncertainty associated with the data to weight individual points. Species with high percentages of missing values (> 40 %) and with signal-to-noise ratio below 2 were excluded. Based on this, 53 VOC species including source tracers (e.g., chloromethane, trichloroethylene, tetrachloroethylene, and MTBE – methyl tert butyl ether) and SO2 were chosen for the source apportionment analysis. Data values below the MDL were replaced by MDL/2, and the missing data were substituted with median concentrations. If the concentration is less than or equal to the MDL provided, the uncertainty is calculated using the equation Unc = ; if the concentration is greater than the MDL provided, the uncertainty is calculated as Unc = [(error faction × mixing ratio)2 + (MDL)2] .
During the PMF analysis, the bootstrap (BS) method, displacement (DISP) analysis, and the combination of the DISP and BS (BS–DISP) were used to evaluate the uncertainty of the base run solution. A total of 100 bootstrap runs were performed, and acceptable results were obtained for all factors (above 90 %). Based on the DISP analysis, the observed drop in the Q value was below 0.1 %, and no factor swap occurred, confirming that the solution was stable. The BS–DISP analysis showed that the observed drop in the Q value was less than 0.5 %, demonstrating that the solution was useful.
3.1 TVOC mixing ratios and chemical composition
The time series of meteorological parameters and concentrations of air pollutants during the measurement period are shown in Fig. 1. The ambient temperature ranged from −13.3 to 38.7∘, and the RH varied between 5 % and 99 % across the sampling months. Prevailing winds shifted between southwesterly and northeasterly with WS of 0–6.8 m s−1. The mixing ratio of total VOCs (TVOC) ranged from 5.5–118.7 ppbv during the sampling period with relatively higher values during September and November (49.9–51.6 ppbv), while there were relatively lower values (22.2–27.5 ppbv) across the other months. Major VOC compositions were generally consistent during the whole measurement period. Alkanes, OVOCs, and halocarbons were the dominant chemical groups, accounting for 75 %–81 % of the TVOC across the sampling months. In terms of individual species, acetone, dichloromethane, n-butane, toluene, methyl tert butyl ether (MTBE), iso-pentane, propylene, n-hexane, 1,1-dichloroethane, benzene, and 1-butene made up the largest contribution, accounting for 50.6 % of the TVOC on average during the whole measurement period.
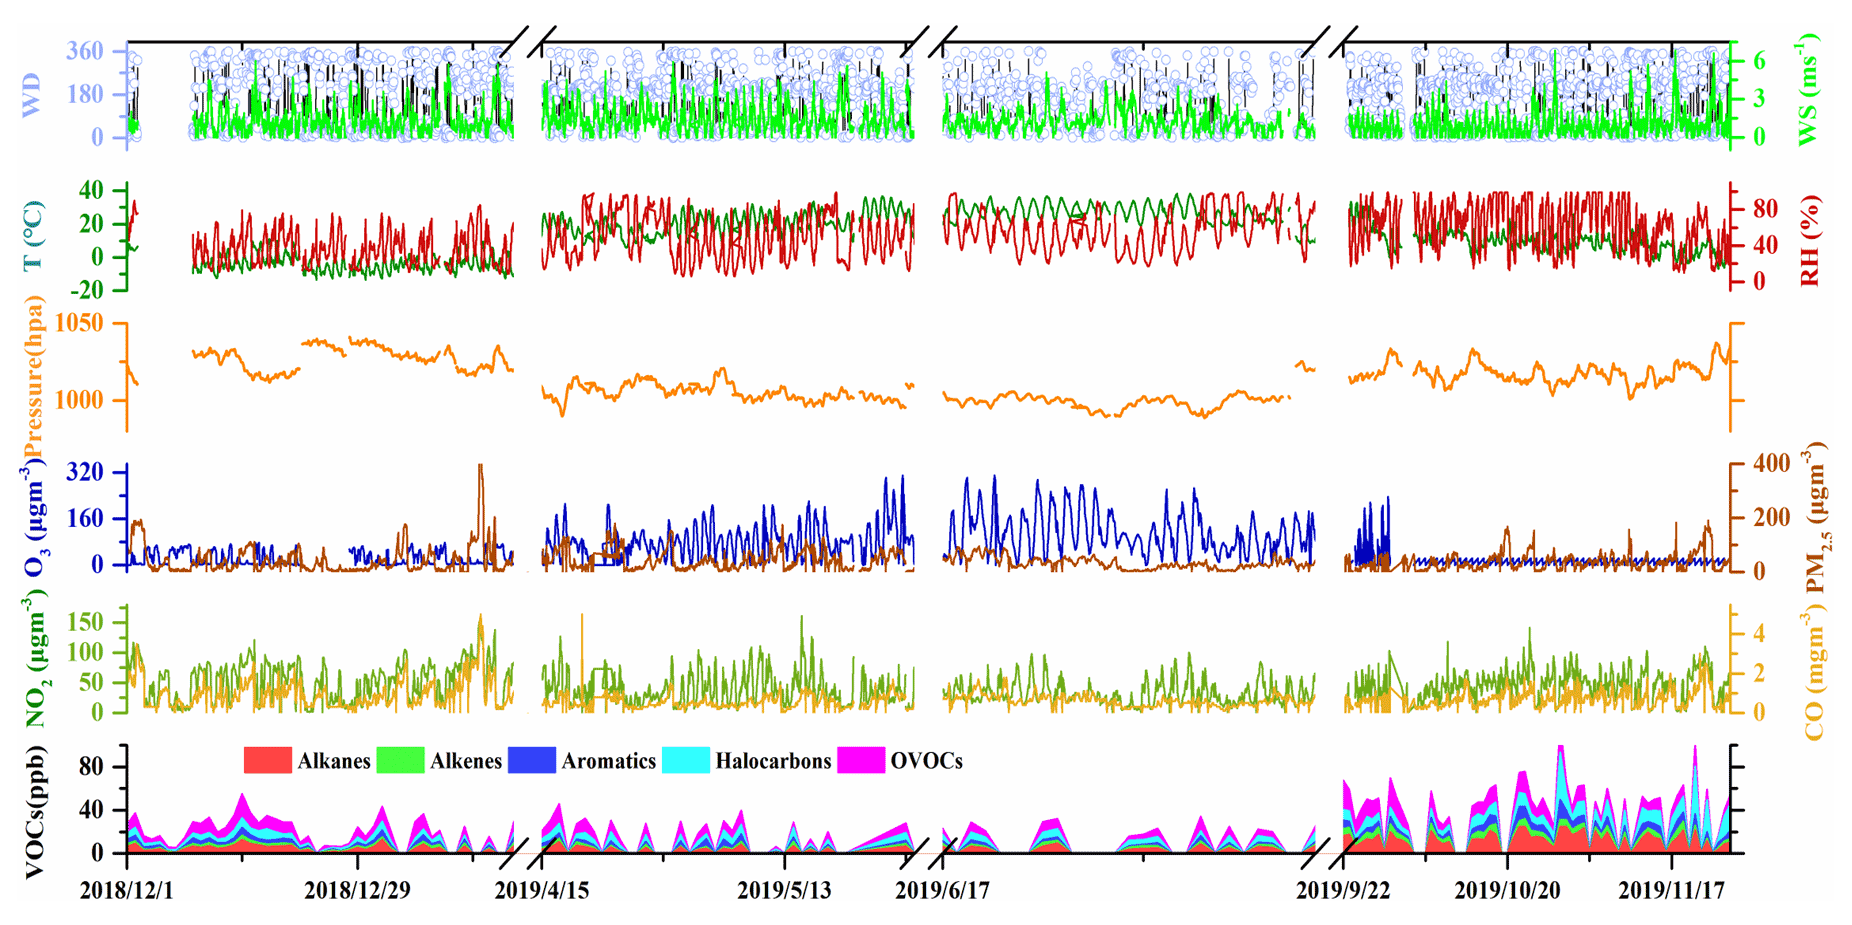
Figure 1Time series of meteorological parameters and levels of air pollutants during the sampling period.
As shown in Fig. 2, the concentrations of TVOC and major VOC groups including alkanes, alkenes, aromatics, halocarbons, and OVOCs observed in this study were apparently lower than those during the sampling months in 2014 and 2016 in urban Beijing (An et al., 2012; Liu et al., 2020; Li et al., 2015), indicating the effectiveness of control measures in most recent years in lowering VOC emission. The composition of major chemical groups also showed remarkable changes, with decreased proportions of alkanes but increased fractions of halocarbons, aromatics, and OVOCs, reflecting the changes in emission source types in most recent years.
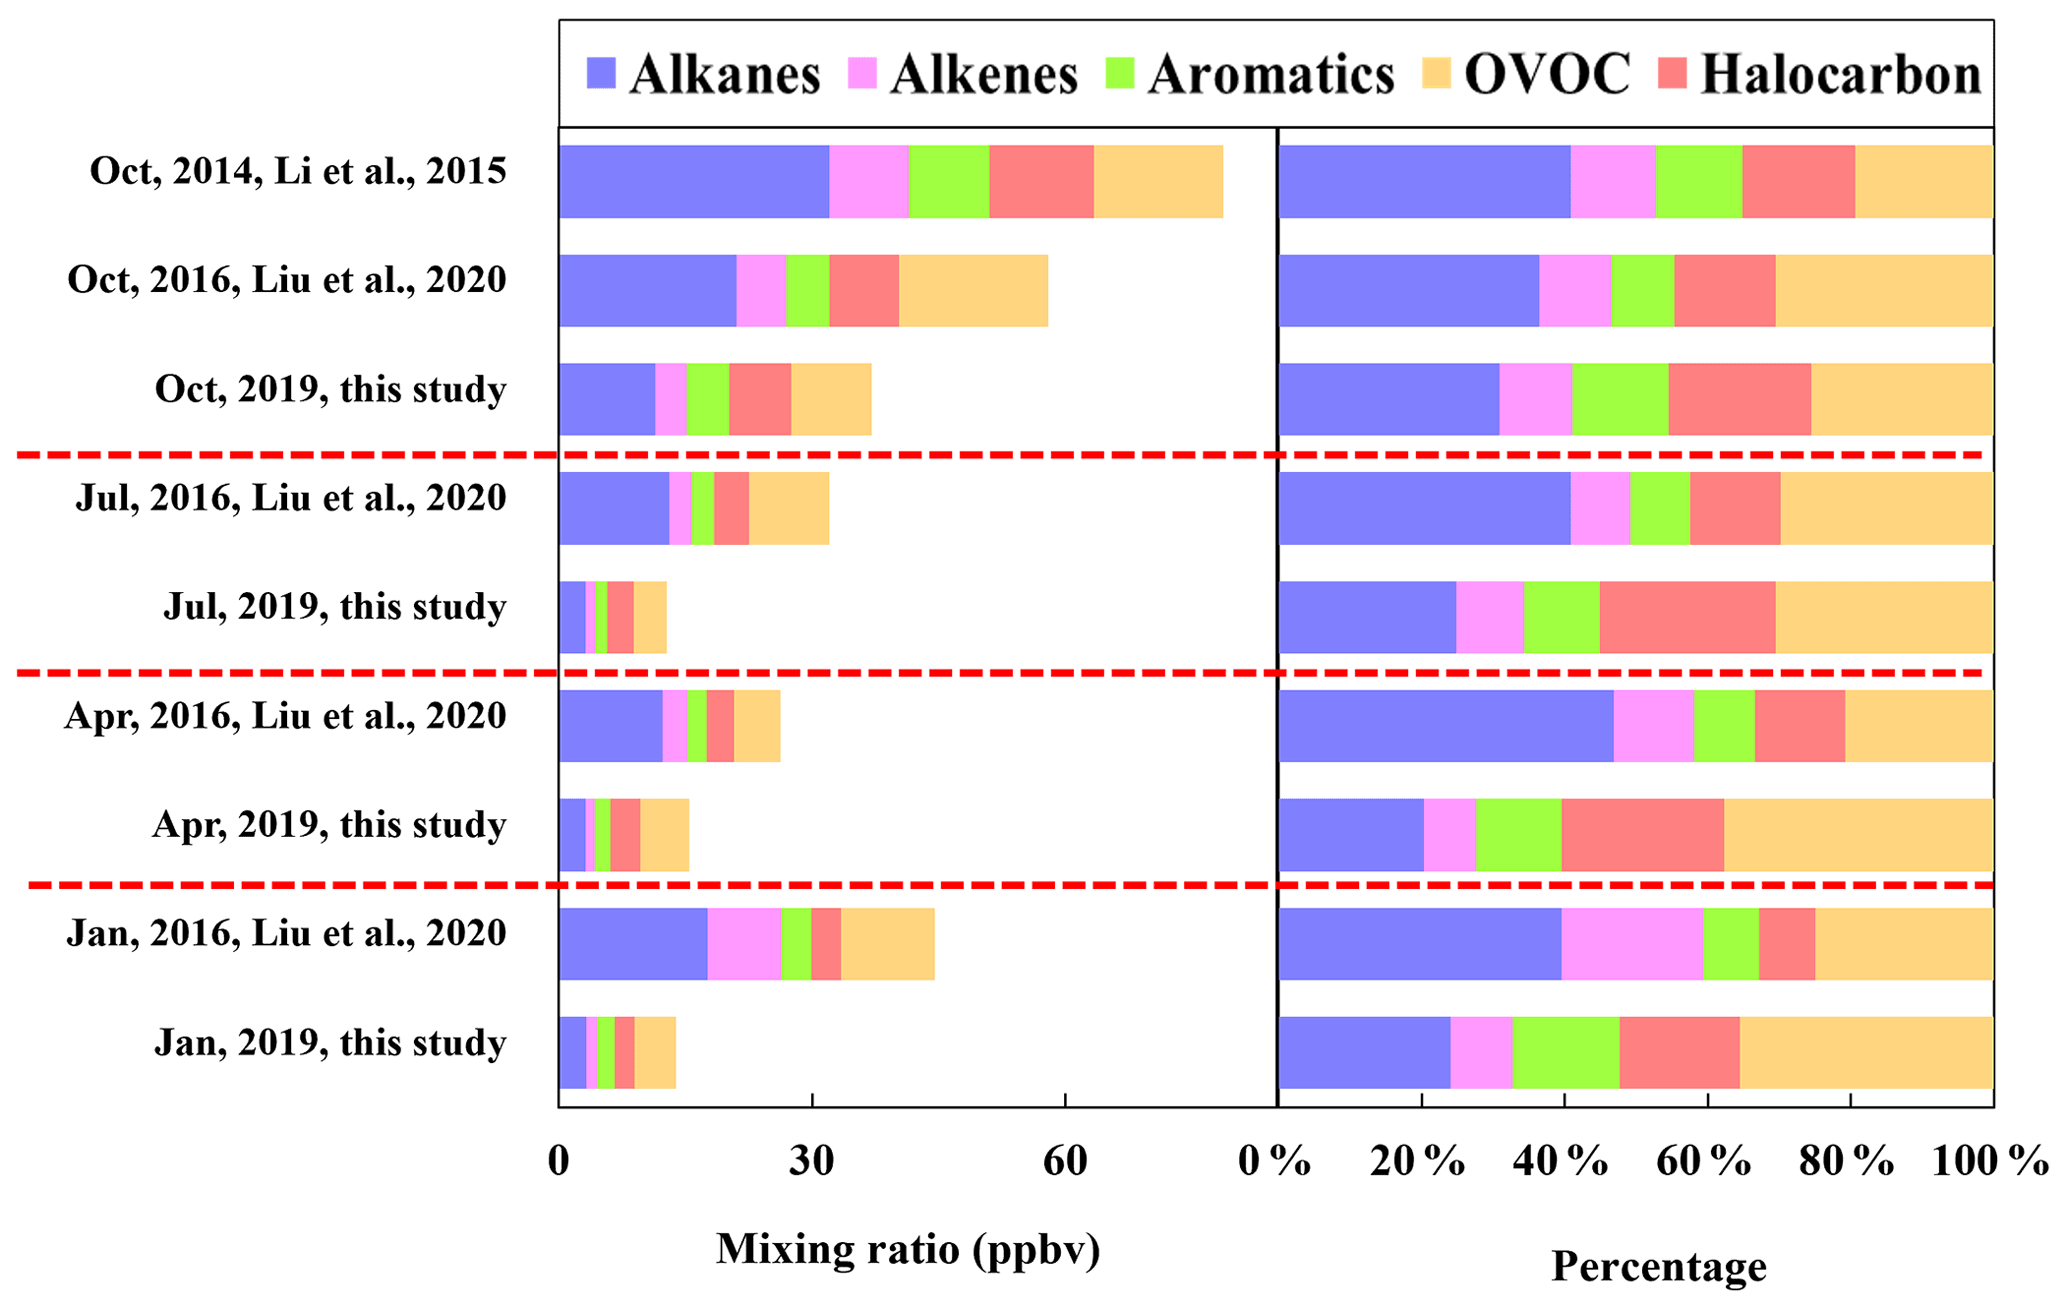
Figure 2Comparison of the concentration and composition of major chemical groups observed in 2019 (this study), 2016 (Liu et al., 2020), and 2014 (Li et al., 2015).
During the measurement period, 14 O3 pollution episodes (days with maximum 8 h average O3 exceeding 160 µg m−3) were observed on 17 April, 3–4 May, 16 May, 19–20 June, 24–25 June, 2 July, 5 July, 13 July, 25–26 September, and 28 September 2019. The comparison of meteorological parameters and air pollutants on O3 pollution and compliance days (days with maximum 8 h average O3 below 160 µg m−3) during the 5 O3-polluted months (i.e., April, May, June, July, and September of 2019) is discussed here. As shown in Fig. 3, the WS on O3 pollution days (1.31±0.90 m s−1) was slightly lower than that on O3 compliance days (1.47±1.10 m s−1), indicating that precursors were more conductive to being diluted on O3 compliance days. The variation trend of O3 and temperature displayed a negative correlation, and the linear correlations between O3 and temperature on O3 pollution days (R2=0.63) were stronger than that on O3 compliance days (R2=0.35). The mean TVOC concentration on O3 pollution days (32.3 ppbv) was higher than that on O3 compliance days (29.6 ppbv), which was mainly attributed to higher concentrations of MTBE, acrolein, and trans-2-butene on pollution days. MTBE is widely used as a fuel additive in motor gasoline (Liang et al., 2020), and trans-2-butene is the main component of oil and gas evaporation (B. Li et al., 2019). Such a result suggests enhanced contribution of traffic emissions on O3 pollution days. Also, the concentration of isoprene, which is primarily produced by vegetation through photosynthesis, increased significantly on O3 pollution days, probably due to stronger plant emissions at elevated temperatures (Guenther et al., 1993, 2012; Stavrakou et al., 2014). The ratio of -xylene to ethylbenzene () measured can be used as an indicator of the photochemical aging of air masses because of their similar sources in urban environments and differences in atmospheric lifetimes (Carter, 2010; Miller et al., 2012; H. L. Wang et al., 2013). The mean value on O3 compliance days (1.41) was higher than that on O3 pollution days (1.17), indicating enhanced secondary transformation of VOCs on O3 pollution days.
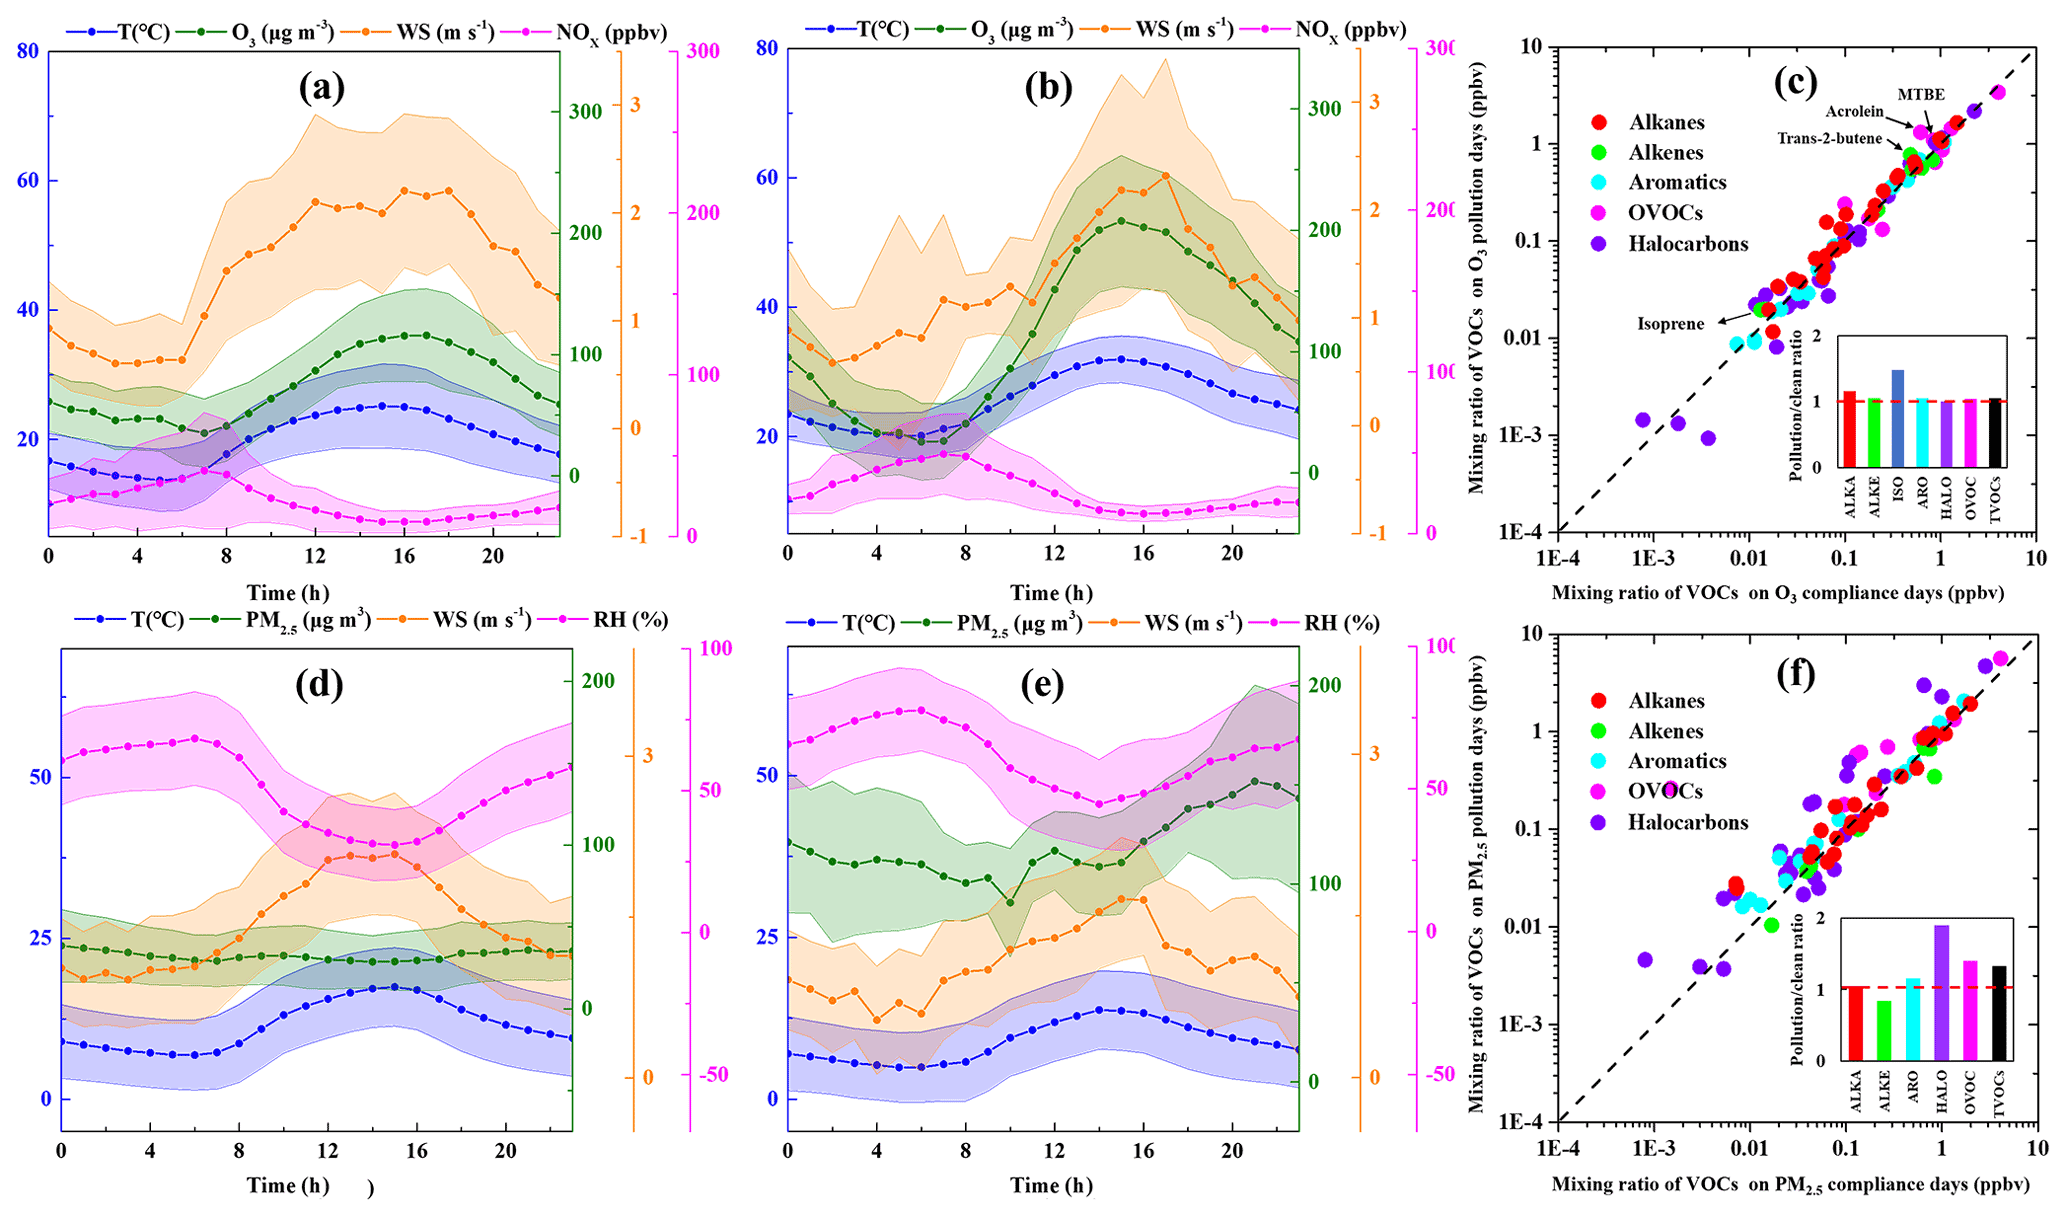
Figure 3The averaged levels of temperature (T), wind speed (WS), and O3 and NOx concentrations on (a) O3 compliance days during the O3-polluted months, (b) O3 pollution days during the O3-polluted months, and (c) differences in VOC mixing ratios between O3 compliance and pollution days. The averaged levels of temperature (T), wind speed (WS), relative humidity (RH), and PM2.5 concentrations on (d) PM2.5 compliance days during the PM2.5-polluted months, (e) PM2.5 pollution days during the PM2.5-polluted months, and (f) differences in VOC mixing ratios between PM2.5 compliance and pollution days.
The daily PM2.5 concentrations ranged from 9–260 µg m−3 with the mean value of 88.5 µg m−3 during the measurement period. 15 PM2.5 pollution days (daily average PM2.5 exceeding 75 µg m−3) were observed on 3 January, 12–13 January, 22–23 April, 29 April, 12 May, 15 May, 19 October, 21–23 November 2019, 1–2 December, and 5 December 2018. During the six PM2.5-polluted months (i.e., December 2018, January, April, May, October, and November 2019), the WS on PM2.5 pollution days (1.05 ± 1.06 m s−1) was lower than that on PM2.5 compliance days (1.43±1.06 m s−1), indicating the weaker ability of winds to dilute and diffuse precursors on PM2.5 pollution days. The mean value on PM2.5 compliance days (1.47) was slightly higher than that on PM2.5 pollution days (1.44), indicating enhanced secondary transformation of VOCs on PM2.5 pollution days.
3.2 The role of VOCs in secondary pollution
3.2.1 Estimating O3 and PM2.5 levels contributed by emissions
O3 and secondary aerosols are primarily formed via photochemical reactions in the atmosphere, concentrations of which could be largely influenced by meteorological conditions (Chen et al., 2020; Feng et al., 2020; Zhai et al., 2019). In this work, the respective contributions of meteorology and emissions to PM2.5 and O3 variations were determined using the RF model as described in Sect. 2.3. The coefficients of determination (R2) for the RF model in predicting PM2.5 and O3 are 0.85 and 0.91, respectively (shown in Fig. S2). The respective contributions of anthropogenic emissions and meteorology to O3 and PM2.5 during each period is shown in Fig. 4. During the O3-polluted months, the meteorologically driven O3 level on O3 pollution days (72.5 µg m−3) was significantly higher than that on O3 compliance days (35.3 µg m−3). After removing the meteorological contribution, the residual emission-driven O3 level on O3 pollution (45.3 µg m−3) and compliance days (44.9 µg m−3) of the O3-polluted months was almost identical and was significantly higher than that during the non-O3-polluted months (23.8 µg m−3). The emission-driven PM2.5 level was in the order of: PM2.5 pollution days of the PM2.5-polluted months (55 µg m−3) > PM2.5 compliance days of the PM2.5-polluted months (44 µg m−3) > non-PM2.5-polluted months (29 µg m−3). These results suggest that apart from meteorological factors, emissions also play a role in deteriorating PM2.5 and O3 pollution, and reducing anthropogenic emissions is essential for improving air quality.
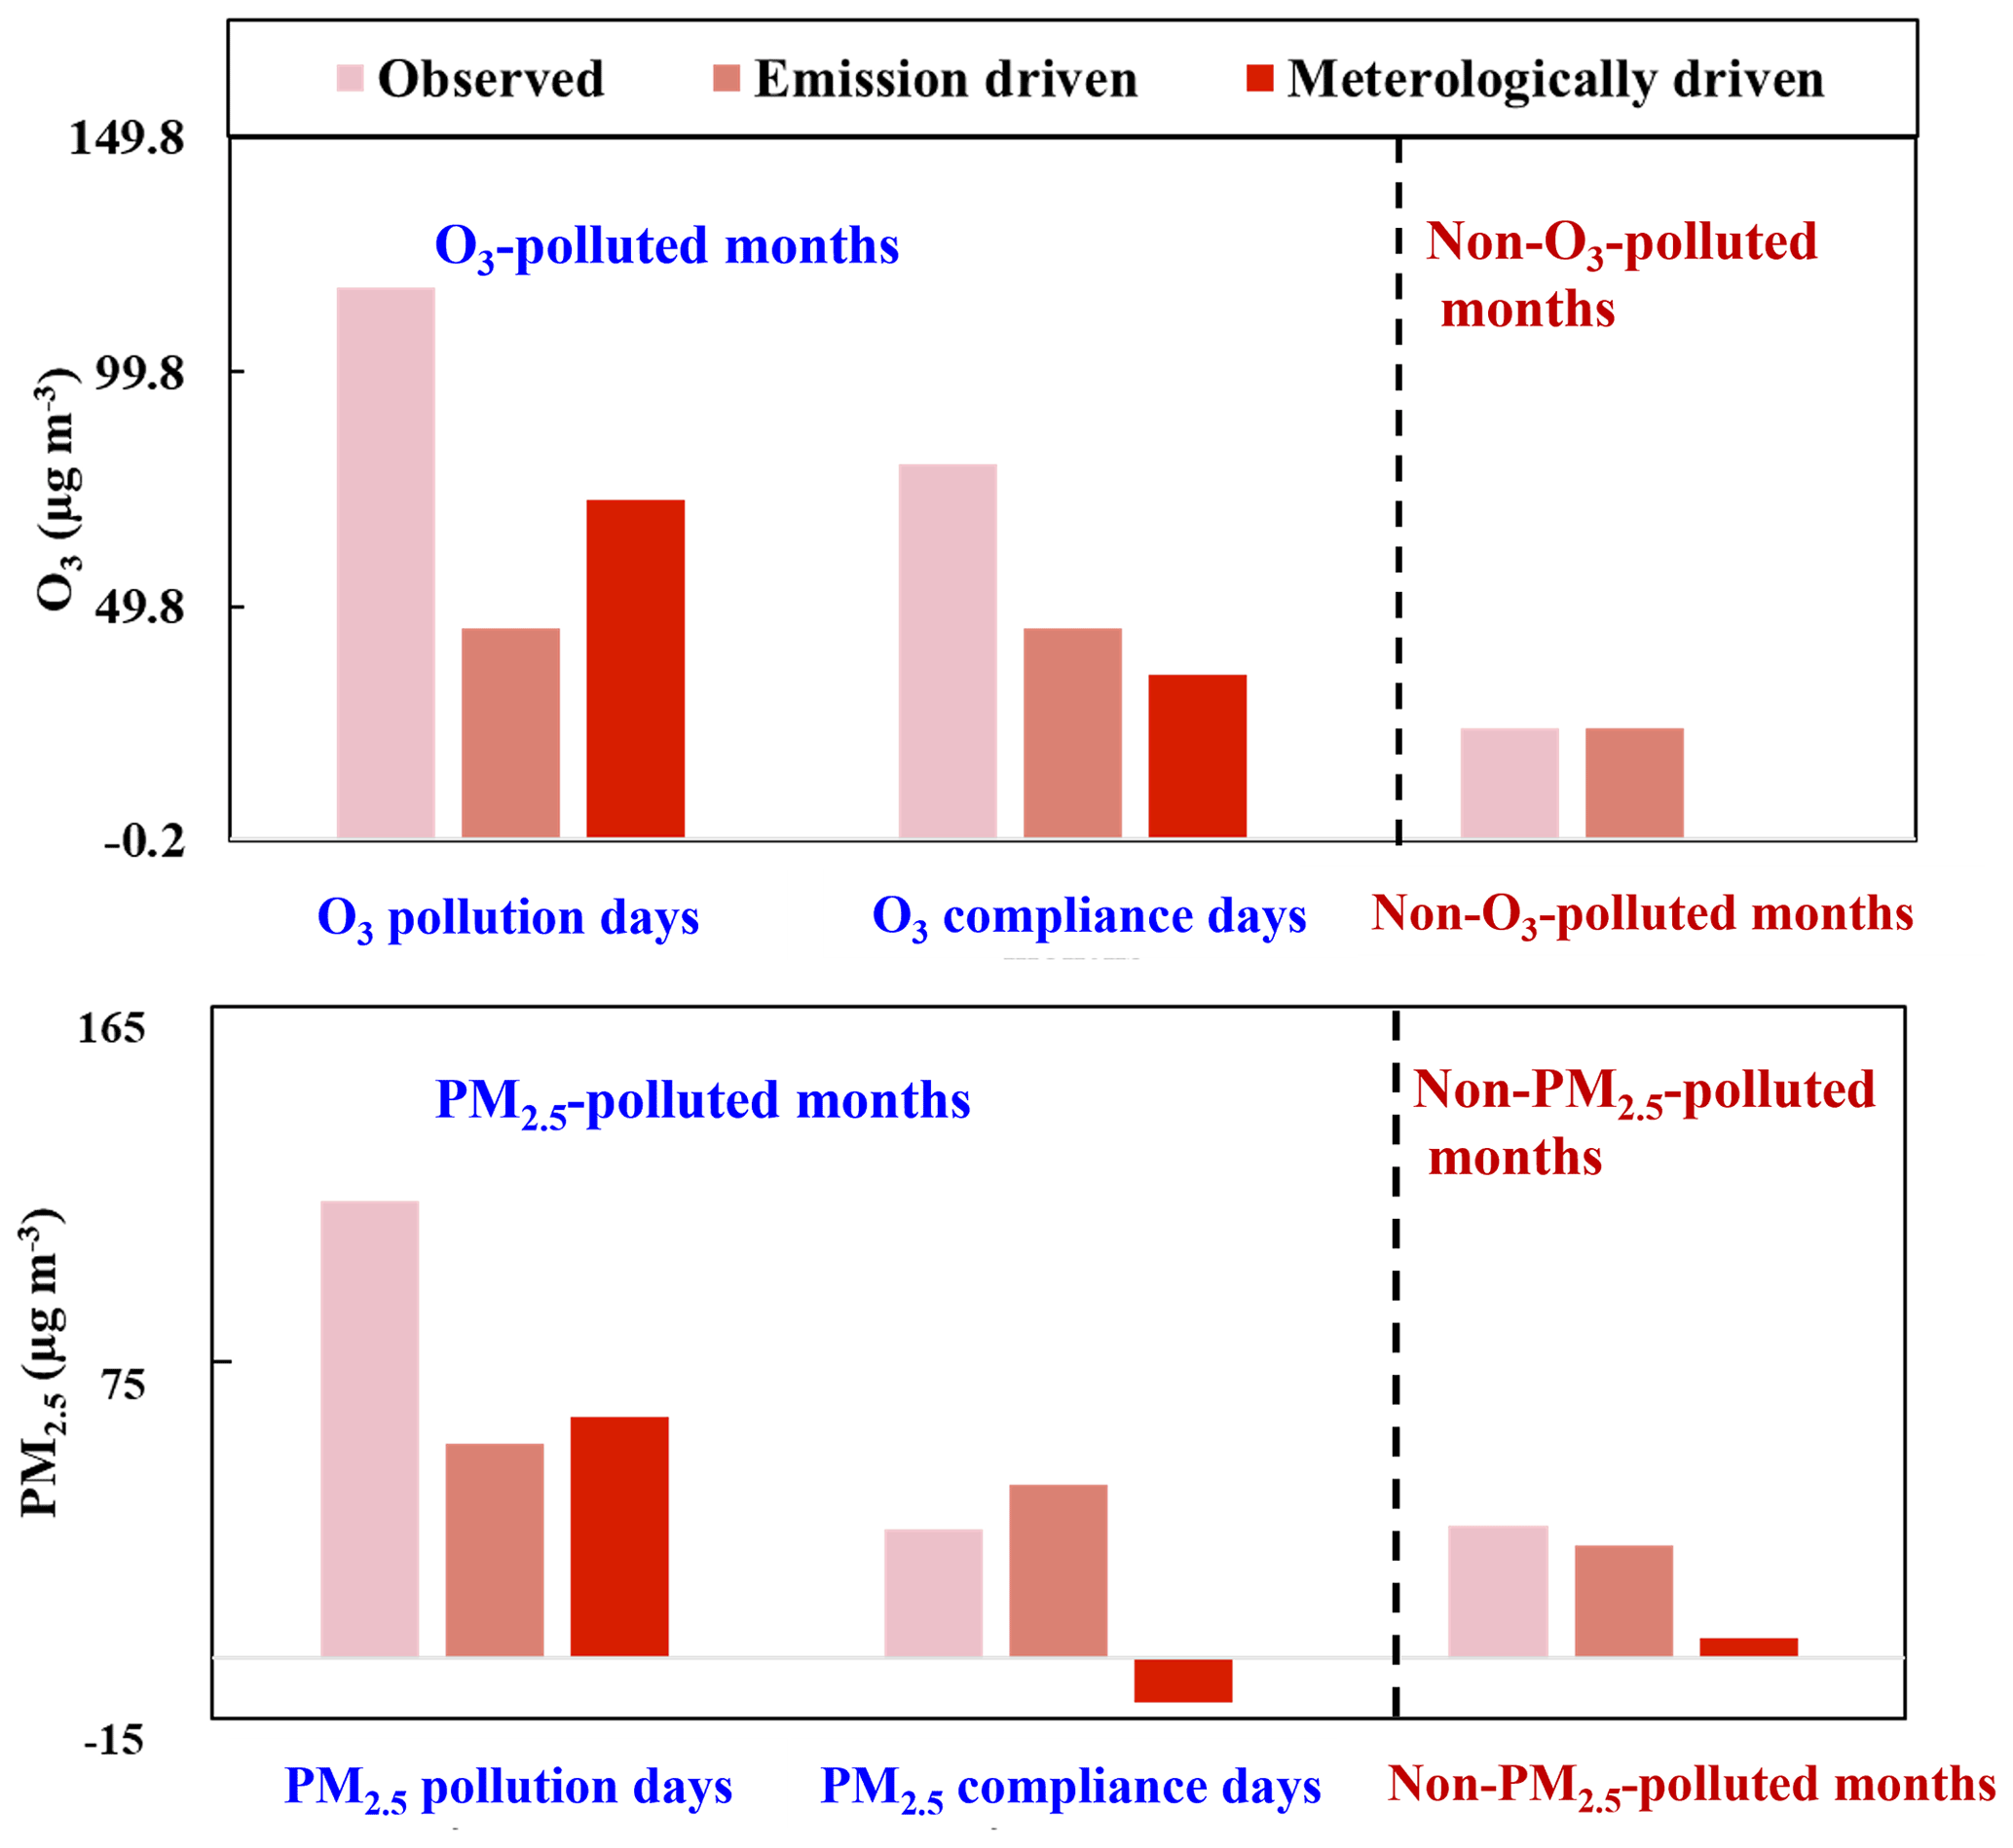
Figure 4Statistic decomposition of meteorological and emission contribution to O3 and PM2.5 levels during different periods.
The ratio has been widely used to distinguish whether O3 formation is VOC-limited or NOx-limited (B. Li et al., 2019). Generally, a VOC-sensitive regime occurs when ratios are below 10, while an NOx-sensitive regime occurs when ratios are higher than 20 (Hanna et al., 1996; Sillman, 1999). In this study, the values of (ppbv ppbv−1) were all below 3 during both the O3-polluted and non-O3-polluted months (Fig. S3), suggesting that O3 formation was sensitive to VOCs, and thus the reductions of the emissions of VOCs will be beneficial for O3 alleviation.
3.2.2 Contribution of VOCs to OFP and SOAFP
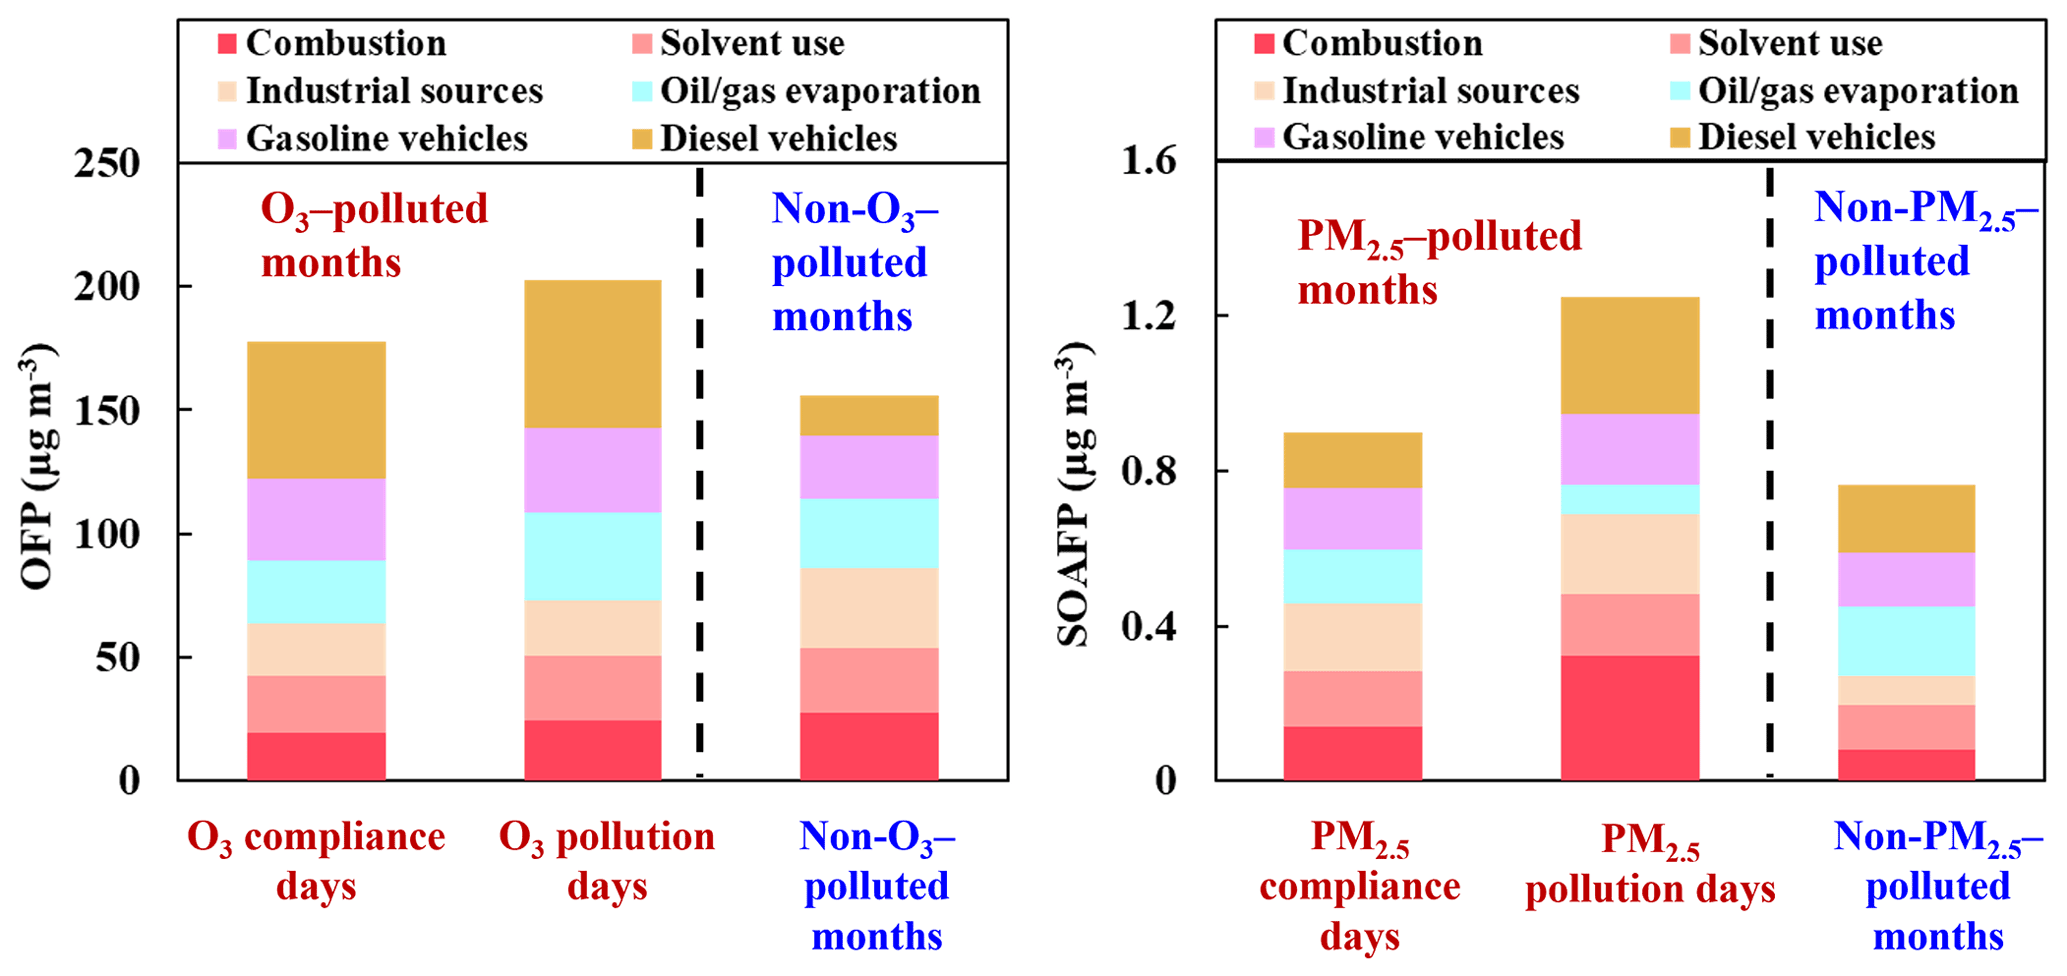
As discussed in Sect. 3.2.1, O3 formation was generally VOC-sensitive during the measurement period. Quantifying the contribution of speciated VOC species to O3 is helpful for developing effective VOC control measures and alleviating O3 pollution. The averaged OFPs on O3 pollution days of the O3-polluted months, O3 compliance days of the O3-polluted months, and during the non-O3-polluted months were 224.9, 201.4, and 187.5 µg m−3, respectively (Fig. 5). According to our observations, the higher OFP on O3 pollution days than on O3 compliance days during the O3-polluted months was mainly attributed to higher levels of trans-2-butene, o-xylene, and acrolein O3 on pollution days, in line with Fig. 3. Alkenes, aromatics, and OVOCs were the three biggest contributors to O3 formation, accounting for 85.1 %, 85.7 %, and 81.6 % of the total OFP on O3 pollution days of the O3-polluted months, O3 compliance days of the O3-polluted months, and during the non-O3-polluted months, respectively. In terms of the individual species, the top 10 highest contributors during the O3-polluted months were toluene (6.4 % and 7.5 % on O3 pollution and compliance days, respectively), trans-2-butene (9.6 % and 7.5 %), acrolein (10.8 % and 5.7 %), -xylene (6.1 % and 6.9 %), o-xylene (6.6 % and 5.8 %), 1-butene (5.2 % and 7.1 %), 1-hexene (4.4 % and 5.4 %), vinyl acetate (4.2 % and 5.7 %), methyl methacrylate (5.5 % and 4.8 %), and 1-pentene (4.5 % and 4.4 %). During the non-O3-polluted months, the overall OFP was mainly contributed by toluene (10.8 %), trans-2-butene (10.5 %), 1-butene (7.3 %), -xylene (6.5 %), 1-pentene (5.7 %), 1-hexene (5.0 %), methyl methacrylate (4.9 %), o-xylene (4.9 %), vinyl acetate (3.8 %), and isopentane (2.3 %).
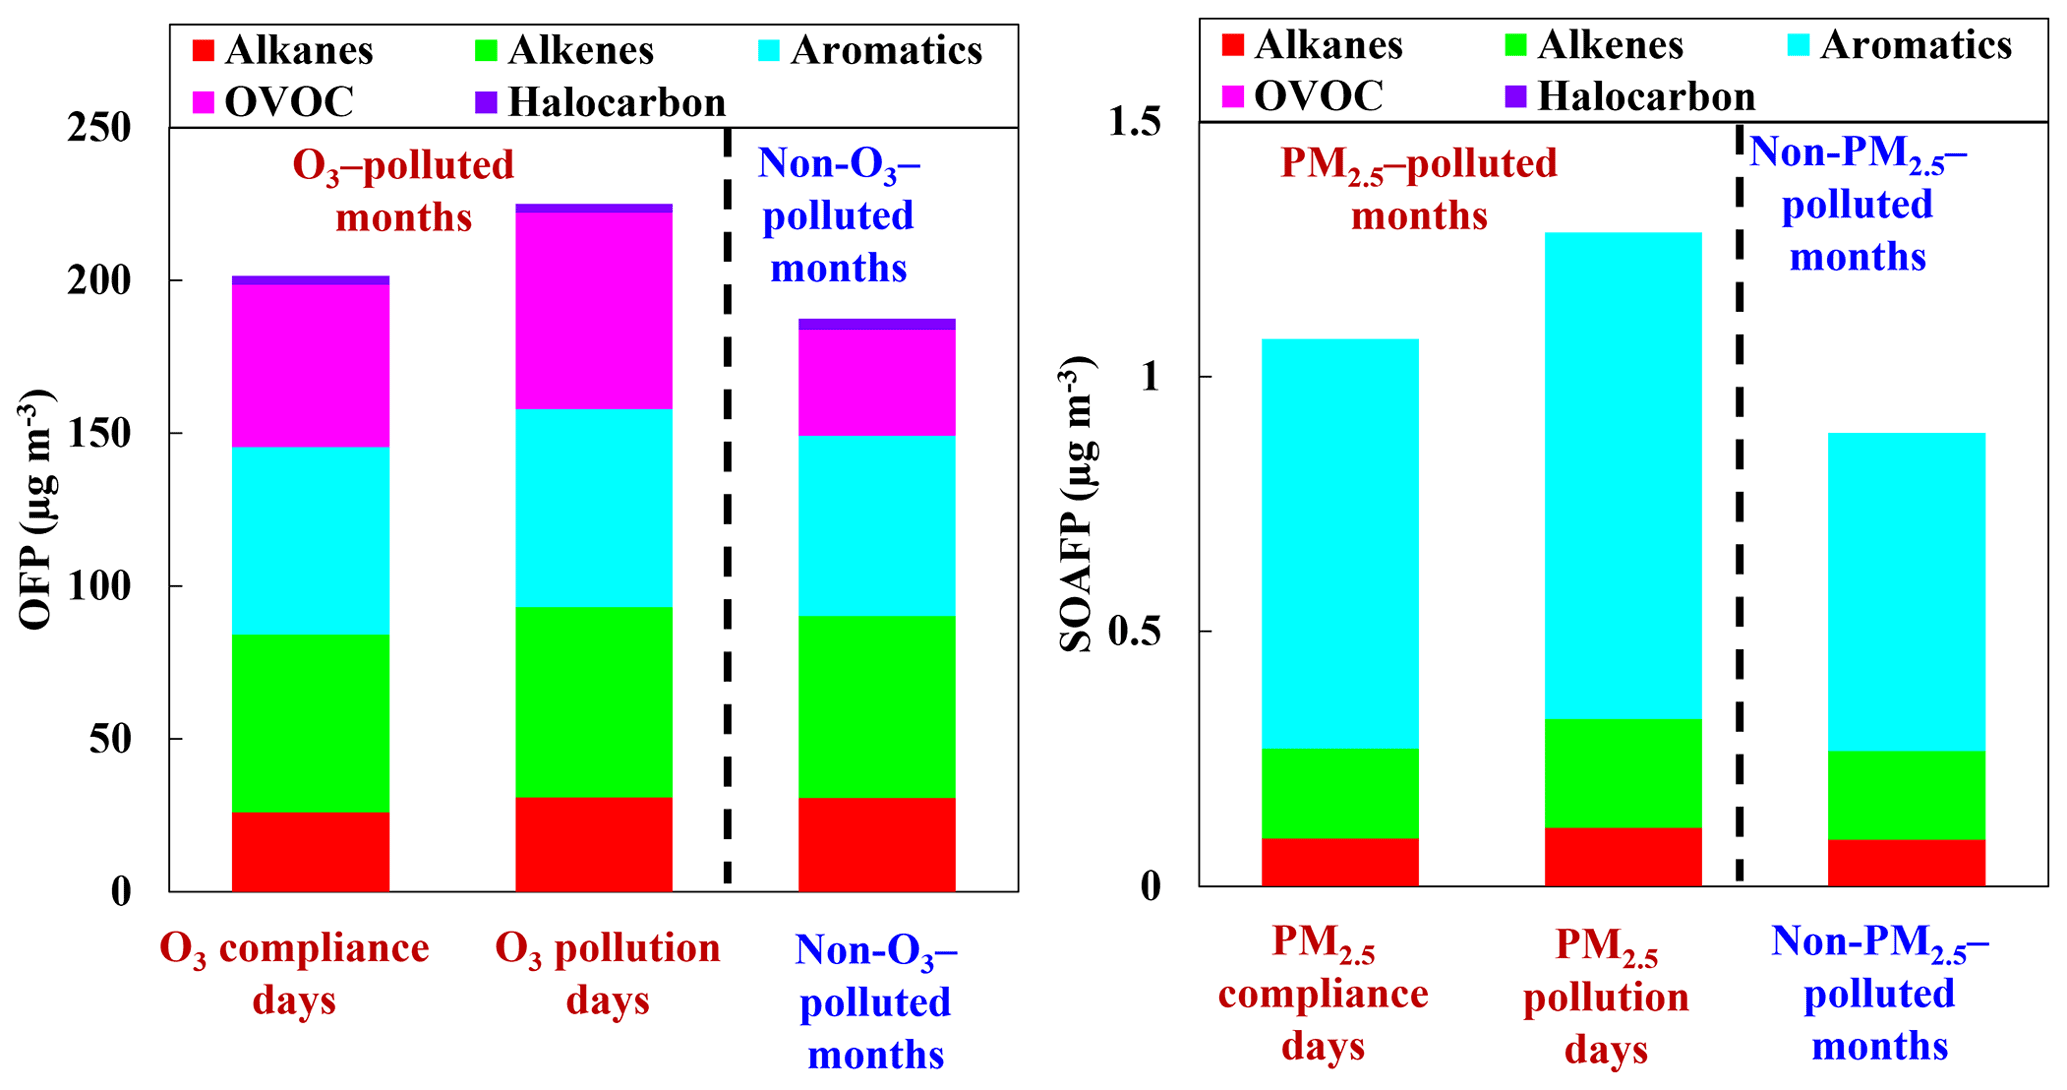
As shown in Fig. S3, the ratio of was generally below 3 during the sampling period, indicating high NOx conditions. Based on the estimated yields of the VOCs shown in Table S2, the SOAFPs were calculated and compared in Fig. 5. The mean SOAFPs on PM2.5 pollution days of the PM2.5-polluted months, PM2.5 compliance days of the PM2.5-polluted months, and during the non-PM2.5-polluted months were 1.28, 1.07, and 0.89 µg m−3. During the 6 PM2.5-polluted months, the higher SOAFP on PM2.5 pollution days than on PM2.5 compliance days was mainly attributed to higher levels of 1,2,4-trimethylbenzene, n-undecane, n-nonane, 1,4-diethylbenzene, and 1,3-diethylbenzene on PM2.5 pollution days. Aromatics have the largest SOAFP, accounting for 74 % and 75 % of the total SOAFP for PM2.5 pollution and compliance days of the PM2.5-polluted months and 70 % of the total SOAFP during the non-PM2.5-polluted months, respectively. The 10 species responsible for most of the SOAFP were toluene (41 % and 40 % on PM2.5 pollution and compliance days of the PM2.5-polluted months,= and 33 % during the non-PM2.5-polluted months), 1-hexene (13.0 %, 12.5 %, and 15.2 %), xylenes (11.6 %, 14.1 %, and 14.8 %), ethylbenzene (4.9 %, 5.3 %, and 6.0 %), styrene (4.5 %, 5.6 %, and 5.6 %), 1-pentene (3.3 %, 3.4 %, and 4.3 %), methyl cyclopentane (2.1 %, 2.7 %, and 3.6 %), 1,2,3-trimethylbenzene (2.8 %, 2.4 %, and 2.8 %), m-ethyl toluene (1.7 %, 1.4 %, and 1.7 %), and p-ethyl toluene (1.7 %, 1.4 %, and 1.7 %).
3.3 Source apportionment of VOCs
3.3.1 Indication from tracers
The great changes in the mixing ratios of different species are mainly affected by photochemical processing, emission inputs, and ratios of VOC species having similar atmospheric lifetimes can reflect the source features (B. Li et al., 2019; Raysoni et al., 2017; Song et al., 2021). The ratio of i-pentane to n-pentane is widely used to examine the impact of vehicle emissions, fuel evaporation, and combustion emissions within the -pentane ratios of ranging 2.2–3.8, 1.8–4.6, and 0.56–0.80, respectively (McGaughey et al., 2004; Jobson et al., 2004; Russo et al., 2010; M. Wang et al., 2013; Yan et al., 2017). As shown in Fig. 6, the -pentane ratios during the PM2.5-polluted months were mostly within the range of 0.3–2.0, suggesting the pentanes were from mixed sources of coal combustion and fuel evaporation. During the non-PM2.5-polluted months, the -pentane ratios were distributed in the range of 1.3–3.4, indicating strong impacts from vehicle exhaust and fuel evaporation. During the O3-polluted months, most of the -pentane ratios (1.5–2.5) were distributed within the reference range of vehicle exhaust and fuel evaporation, whereas most of the -pentane ratios during the non-O3-polluted months ranged 1.7–2.1, suggesting the significant impact of fuel evaporation.
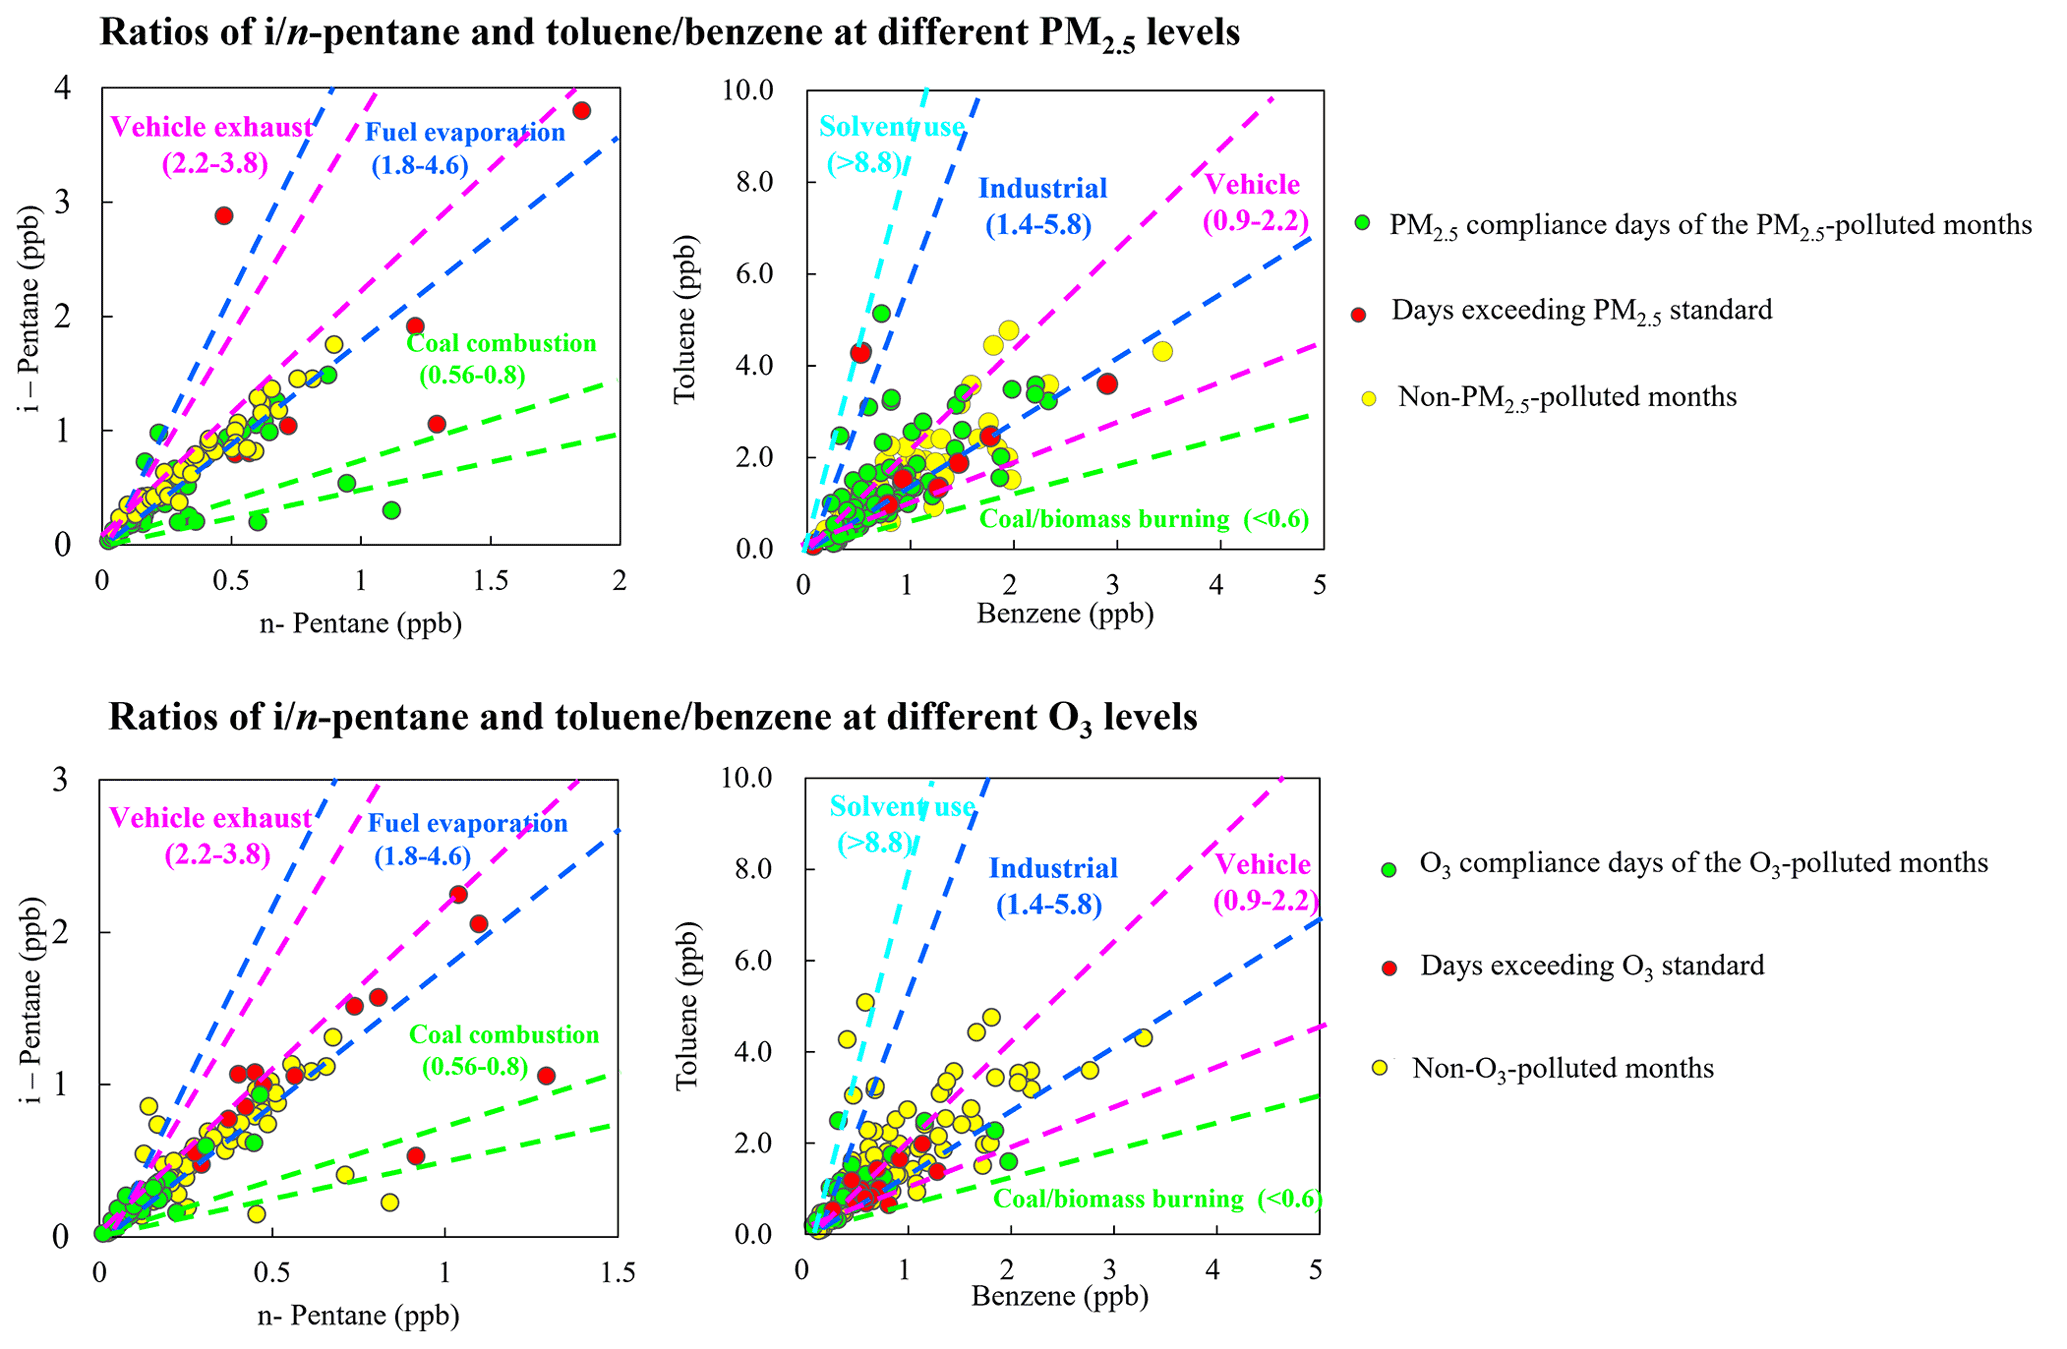
The toluene benzene () ratio is a widely used indicator for sources of aromatics. In areas heavily impacted by vehicle emissions, the ratio lies in the range of 0.9–2.2 (Qiao et al., 2012; Dai et al., 2013; J. Wang et al., 2013; Yao et al., 2013; Zhang et al., 2013; Yao et al., 2015; Mo et al., 2016; Deng et al., 2018). Higher ratios were reported for solvent use (greater than 8.8) (Yuan et al., 2010; H. Wang et al., 2014; Zheng et al., 2013) and industrial processes (1.4–5.8) (Mo et al., 2015; Shi et al., 2015). In burning source emission studies, the ratio was below 0.6 in different combustion process and raw materials (Tsai et al., 2003; Akagi et al., 2011; Mo et al., 2016). Most of the ratios during the PM2.5-polluted and non-PM2.5-polluted months were within the range of 1.1–1.8 and 0.8–2.2, whereas the ratios were mostly distributed within the range of 0.8–2.2 and 0.9–1.9 during the O3-polluted and non-O3-polluted months, respectively, suggesting the significant impact of vehicle and industrial emissions.
3.3.2 PMF
The factor profiles given by PMF and the contribution of each source to ambient VOCs during each period are presented in Figs. 7 and 8, respectively. Six emission sources were identified: coal and biomass burning, solvent use, industrial sources, oil gas evaporation, gasoline vehicle emission, and diesel vehicle emission based on the corresponding markers for each source category. In general, diesel vehicle exhaust, gasoline vehicle exhaust, and industrial emissions were the main VOC sources during both the O3-polluted and PM2.5-polluted months, with total contributions of 62 % and 62 % on O3 pollution and compliance days of the O3-polluted months, as well as 66 % and 59 % on PM2.5 pollution and compliance days of the PM2.5-polluted months, respectively. The O3-polluted months exhibited higher proportions of diesel (24 % on O3 compliance days and 27 % on O3 pollution days) and gasoline vehicle emission (17 % on O3 compliance days and 16 % on O3 pollution days) compared with the non-O3-polluted months (8 % and 13 %, respectively). During the O3-polluted months, the contributions of industrial emissions (22 %) and fuel evaporation (18 %) on O3 pollution days were much higher than those on O3 compliance days (18 % and 13 %, respectively). Figure 9 presents the relative contributions of individual VOC sources from PMF to OFP. On the basis of O3 formation impact, diesel and gasoline vehicle exhaust were major contributors. During the O3-polluted months, vehicle emissions and fuel evaporation showed higher OFP values on O3 pollution days (93.9 and 35.5 µg m−3) compared with those on O3 compliance days (88.0 and 25.8 µg m−3, respectively). Although industrial emissions act as an important source for VOC concentrations on O3 pollution days (shown in Fig. 8), the potential to form O3 is limited, accounting for 11 % of the total OFP. As illustrated in Fig. 7, the industrial source was distinguished by high compositions of alkanes but relatively lower compositions of alkenes and aromatics, resulting in low O3 formation potentials. Such results suggested that the fuel use and diesel vehicle exhaust should be preferentially controlled for O3 mitigation.
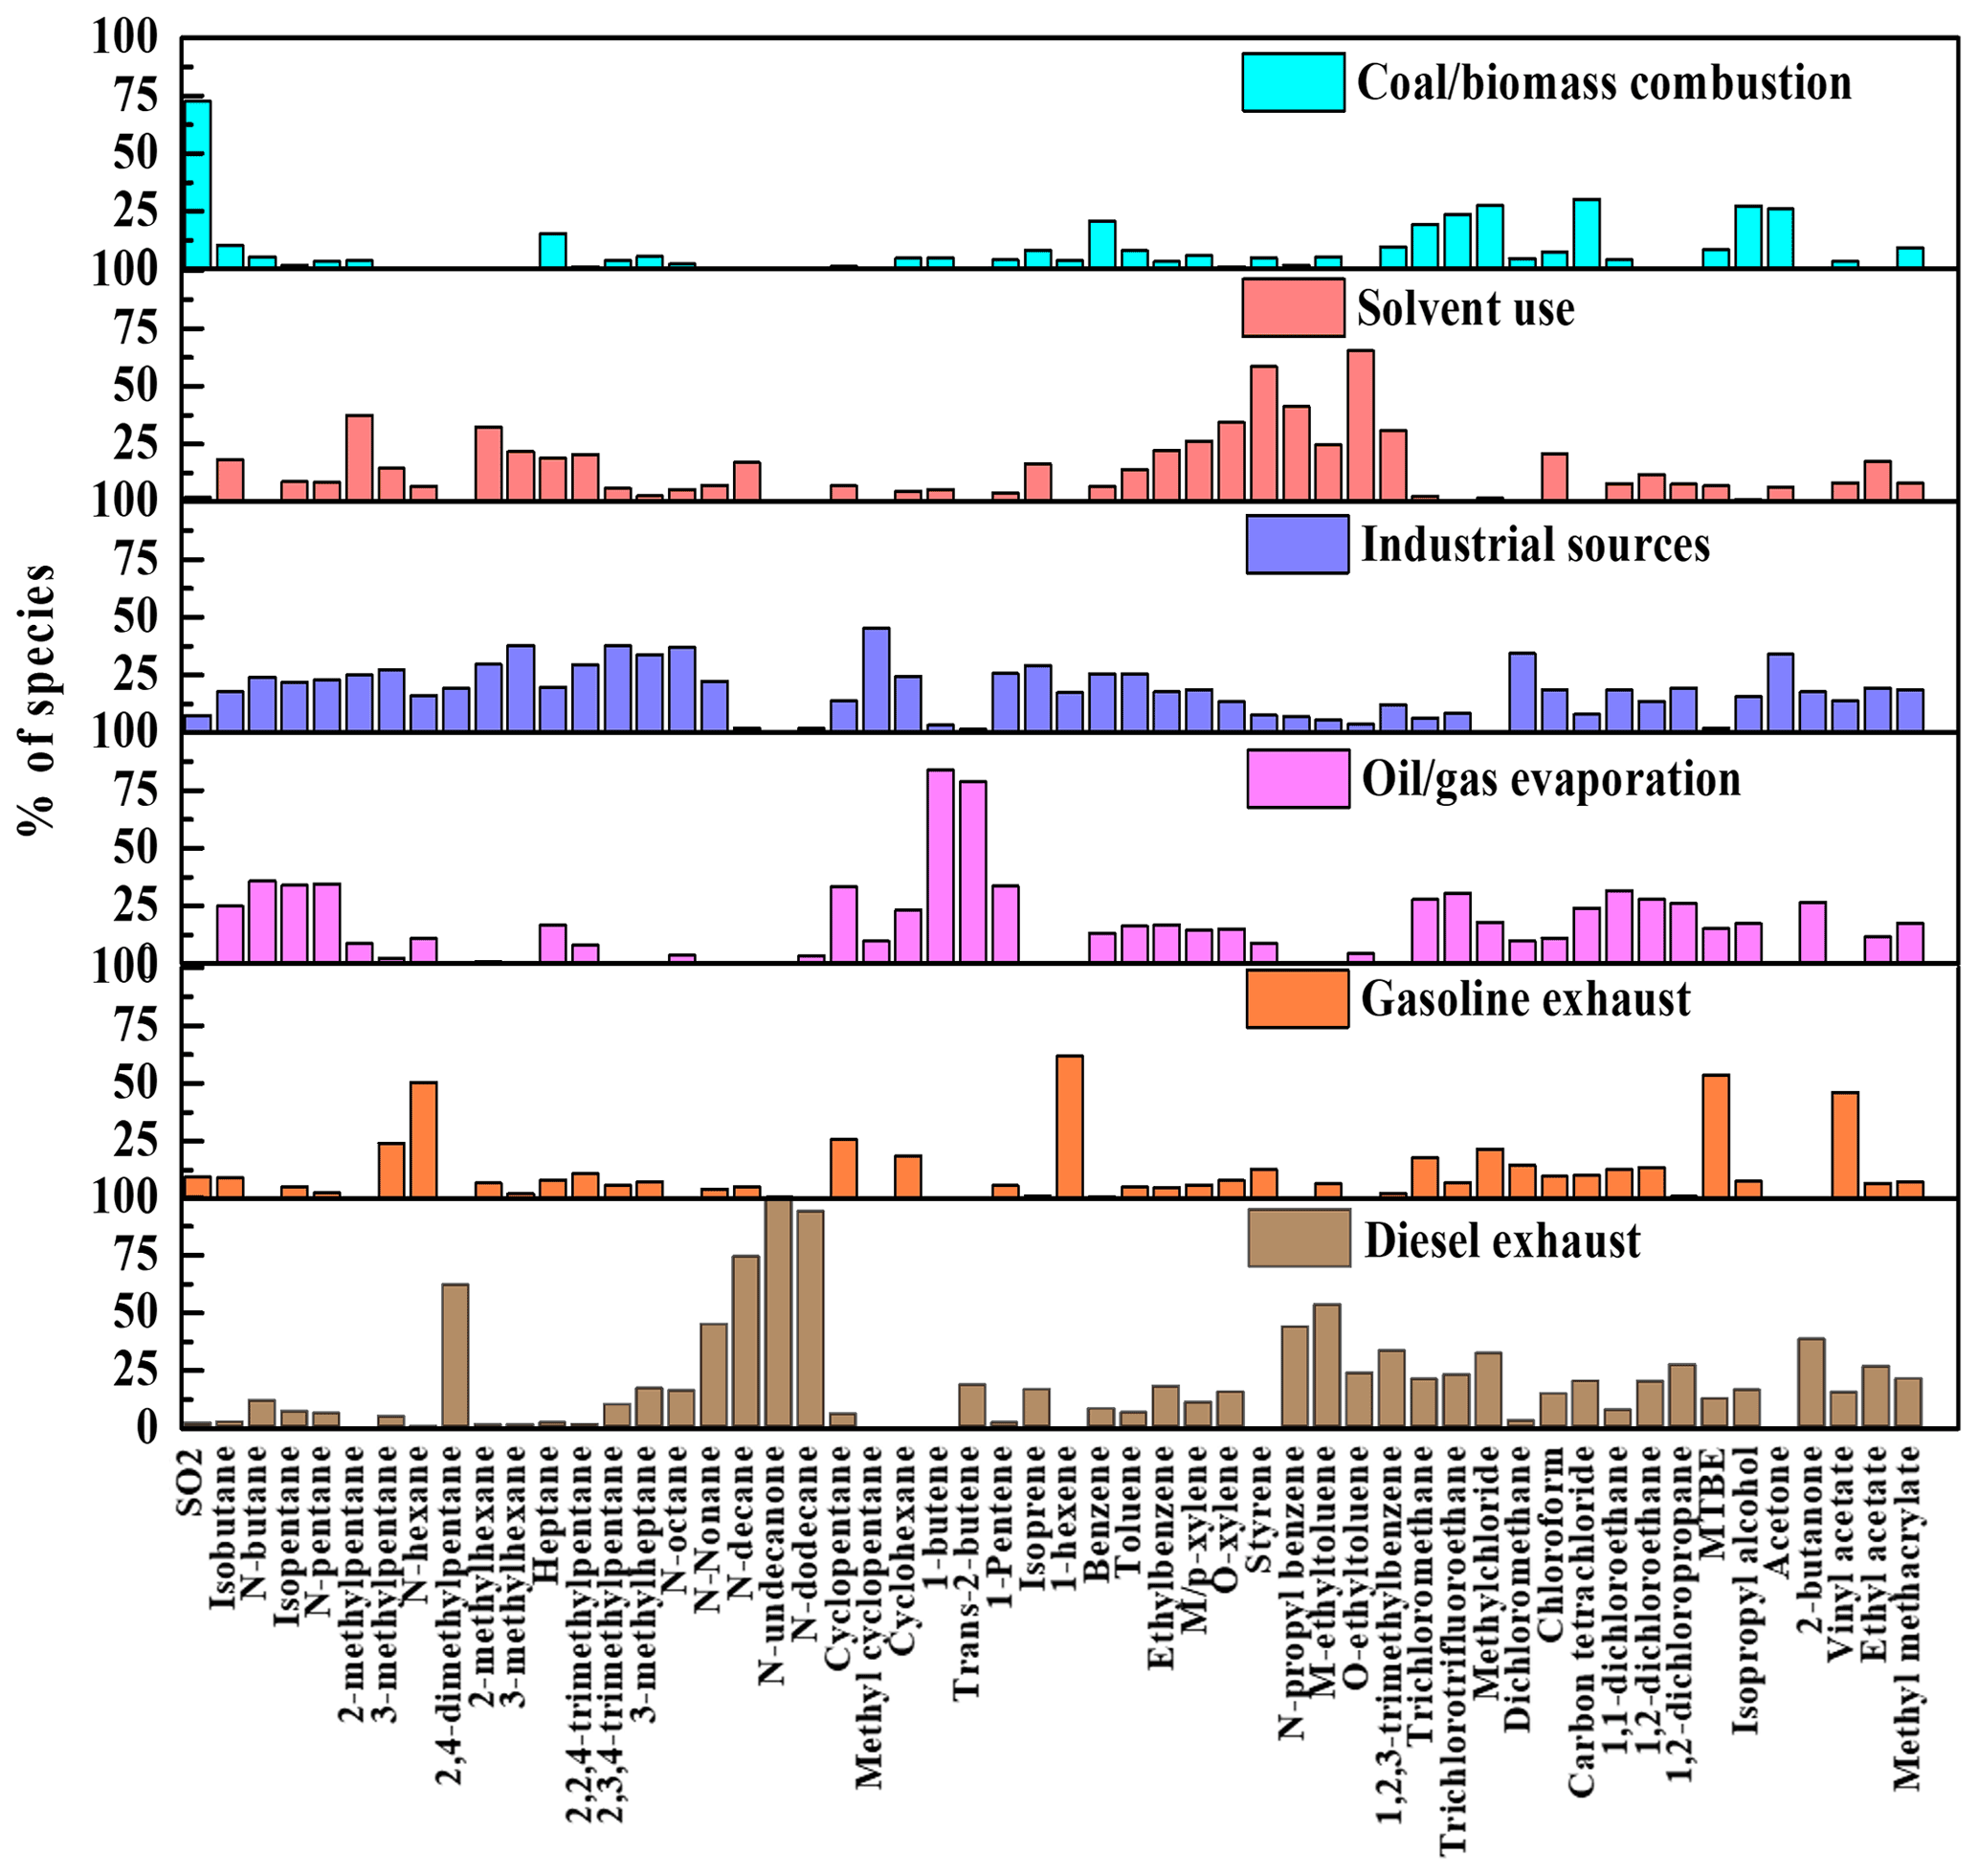
Figure 7Source profiles of VOCs identified using the PMF model and the relative contributions of the individual VOC species.
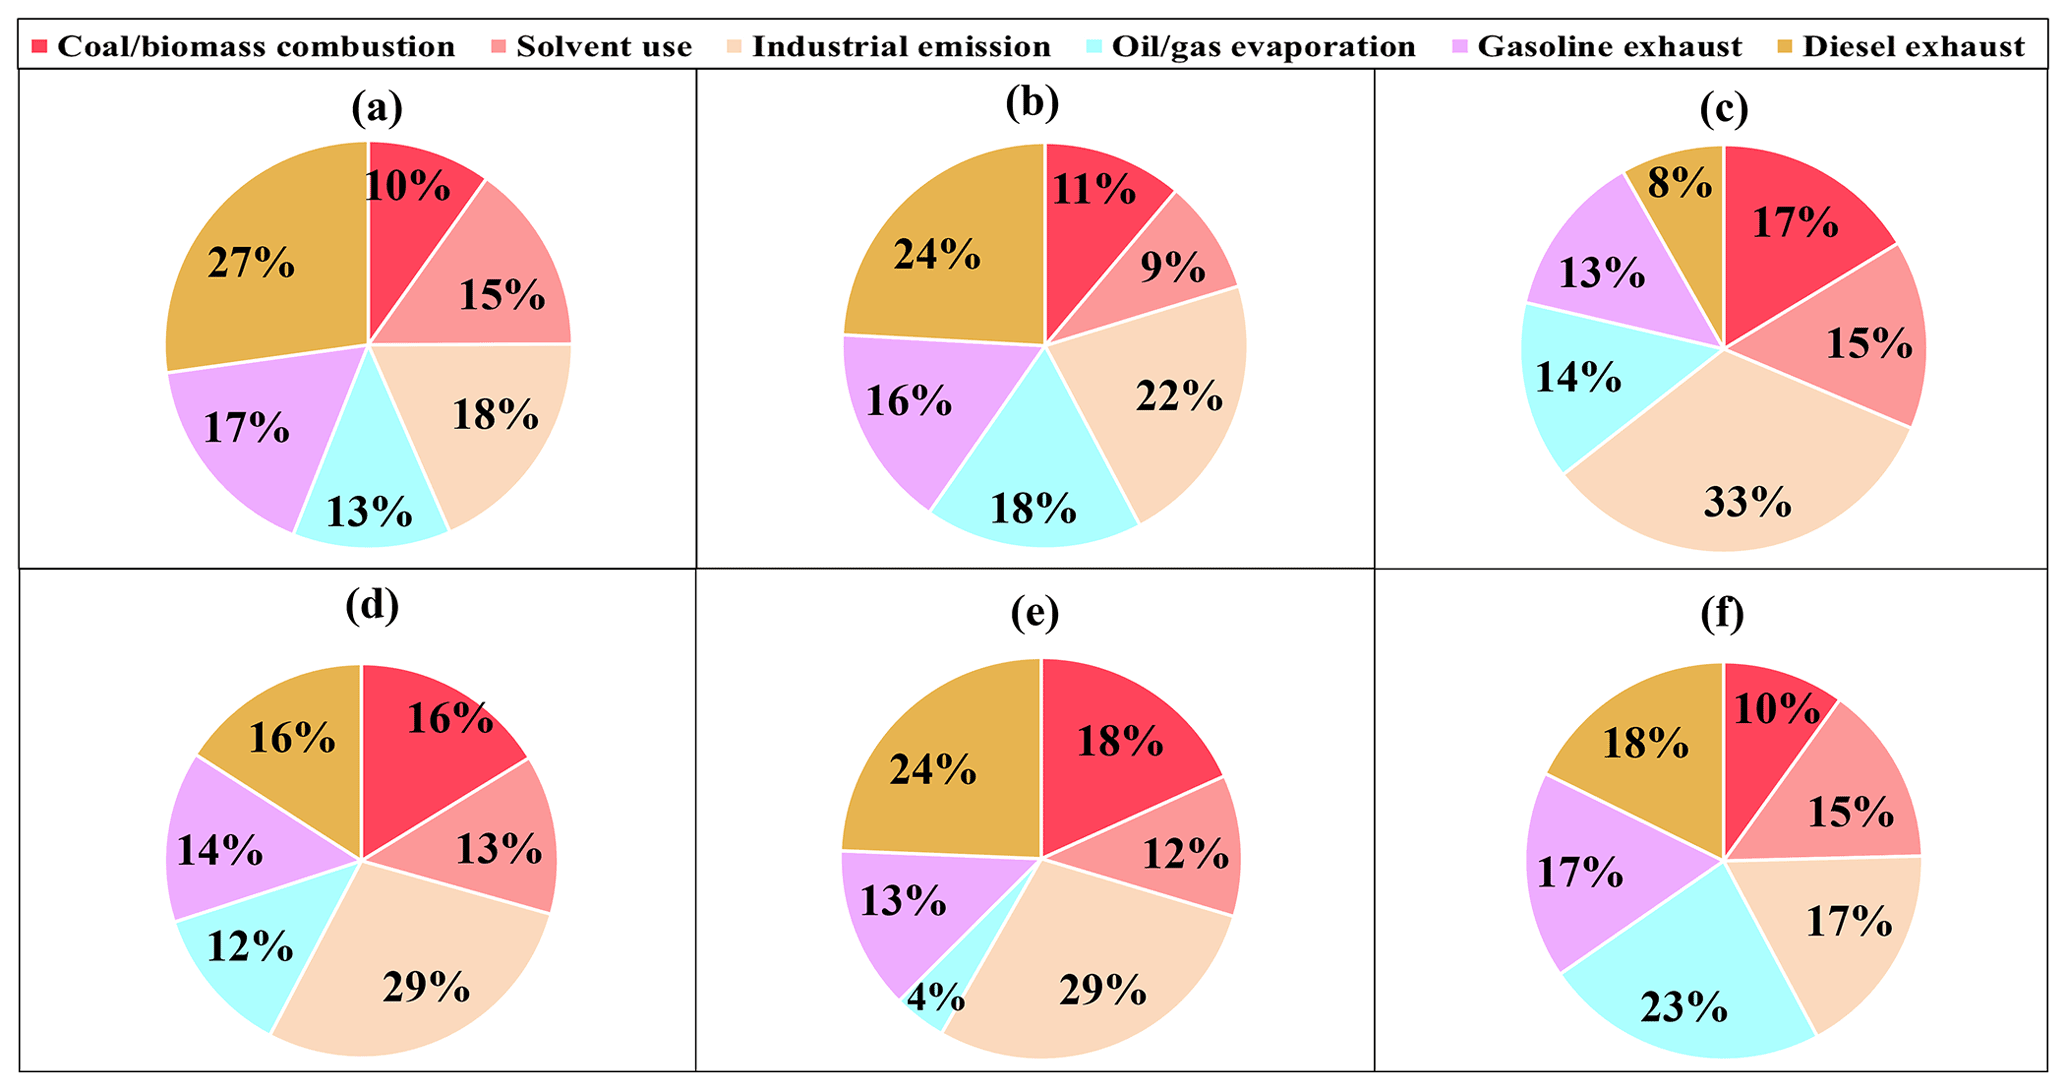
Figure 8Contributions of each source to VOCs on (a) O3 compliance days during the O3-polluted months, (b) O3 pollution days during the O3-polluted months, and during (c) the non-O3-polluted months. Contributions of each source to VOCs on (d) PM2.5 compliance days during the PM2.5-polluted months, (e) PM2.5 pollution days during the PM2.5-polluted months, and (f) during the non-PM2.5-polluted months.
The PM2.5-polluted months showed higher proportions of industrial (29 % on both PM2.5 compliance and PM2.5 pollution days) as well as coal and biomass combustion emissions (16 % on PM2.5 compliance days and 18 % on PM2.5 pollution days) compared with the non-PM2.5-polluted months (17 % and 10 %, respectively). The PM2.5 pollution days were dominated by industrial emission (29 %), diesel vehicle exhaust (24 %), and combustion sources (18 %). During the PM2.5-polluted months, the contribution of diesel vehicle exhaust on PM2.5 pollution days (24 %) was higher than that on PM2.5 compliance days (16 %). On the basis of PM2.5 formation impact, diesel vehicle exhaust and combustion were two major contributors on PM2.5 pollution days (shown in Fig. 9), and these two sources showed obvious higher SOAFP on PM2.5 pollution days (0.30 and 0.32 µg m−3, respectively) compared with those on PM2.5 compliance days of the PM2.5-polluted months (0.15 and 0.14 µg m−3, respectively). Although industrial emissions act as an important source for VOC concentrations on PM2.5pollution days, the potential to form PM2.5 is limited, accounting for 16 % of the total SOAFP. The above results suggested that diesel vehicle exhaust and combustion should be preferentially controlled to alleviate PM2.5 pollution.
Based on the mass concentrations of individual species in each source, the following were the dominant species contributing to photochemical O3 formation: -xylene, o-xylene, methyl methacrylate, vinyl acetate, 1-hexene, and acrolein in gasoline and diesel vehicular emissions; toluene, trans-2-butene, and 1-pentene in fuel evaporation and diesel vehicular emissions; and acrolein in solvent, gasoline vehicular, and diesel vehicular emissions (Fig. 10). The following were the dominant contributors to SOA formation during the PM2.5 pollution periods (Fig. 10): toluene, -xylene, o-xylene, styrene, ethylbenzene, 1-pentene, and 1,2,3-trimethylbenzene from combustion and diesel vehicular emissions; 1-hexene from diesel vehicular emissions; and methyl cyclopentane from combustion, industrial, and diesel vehicular emissions.
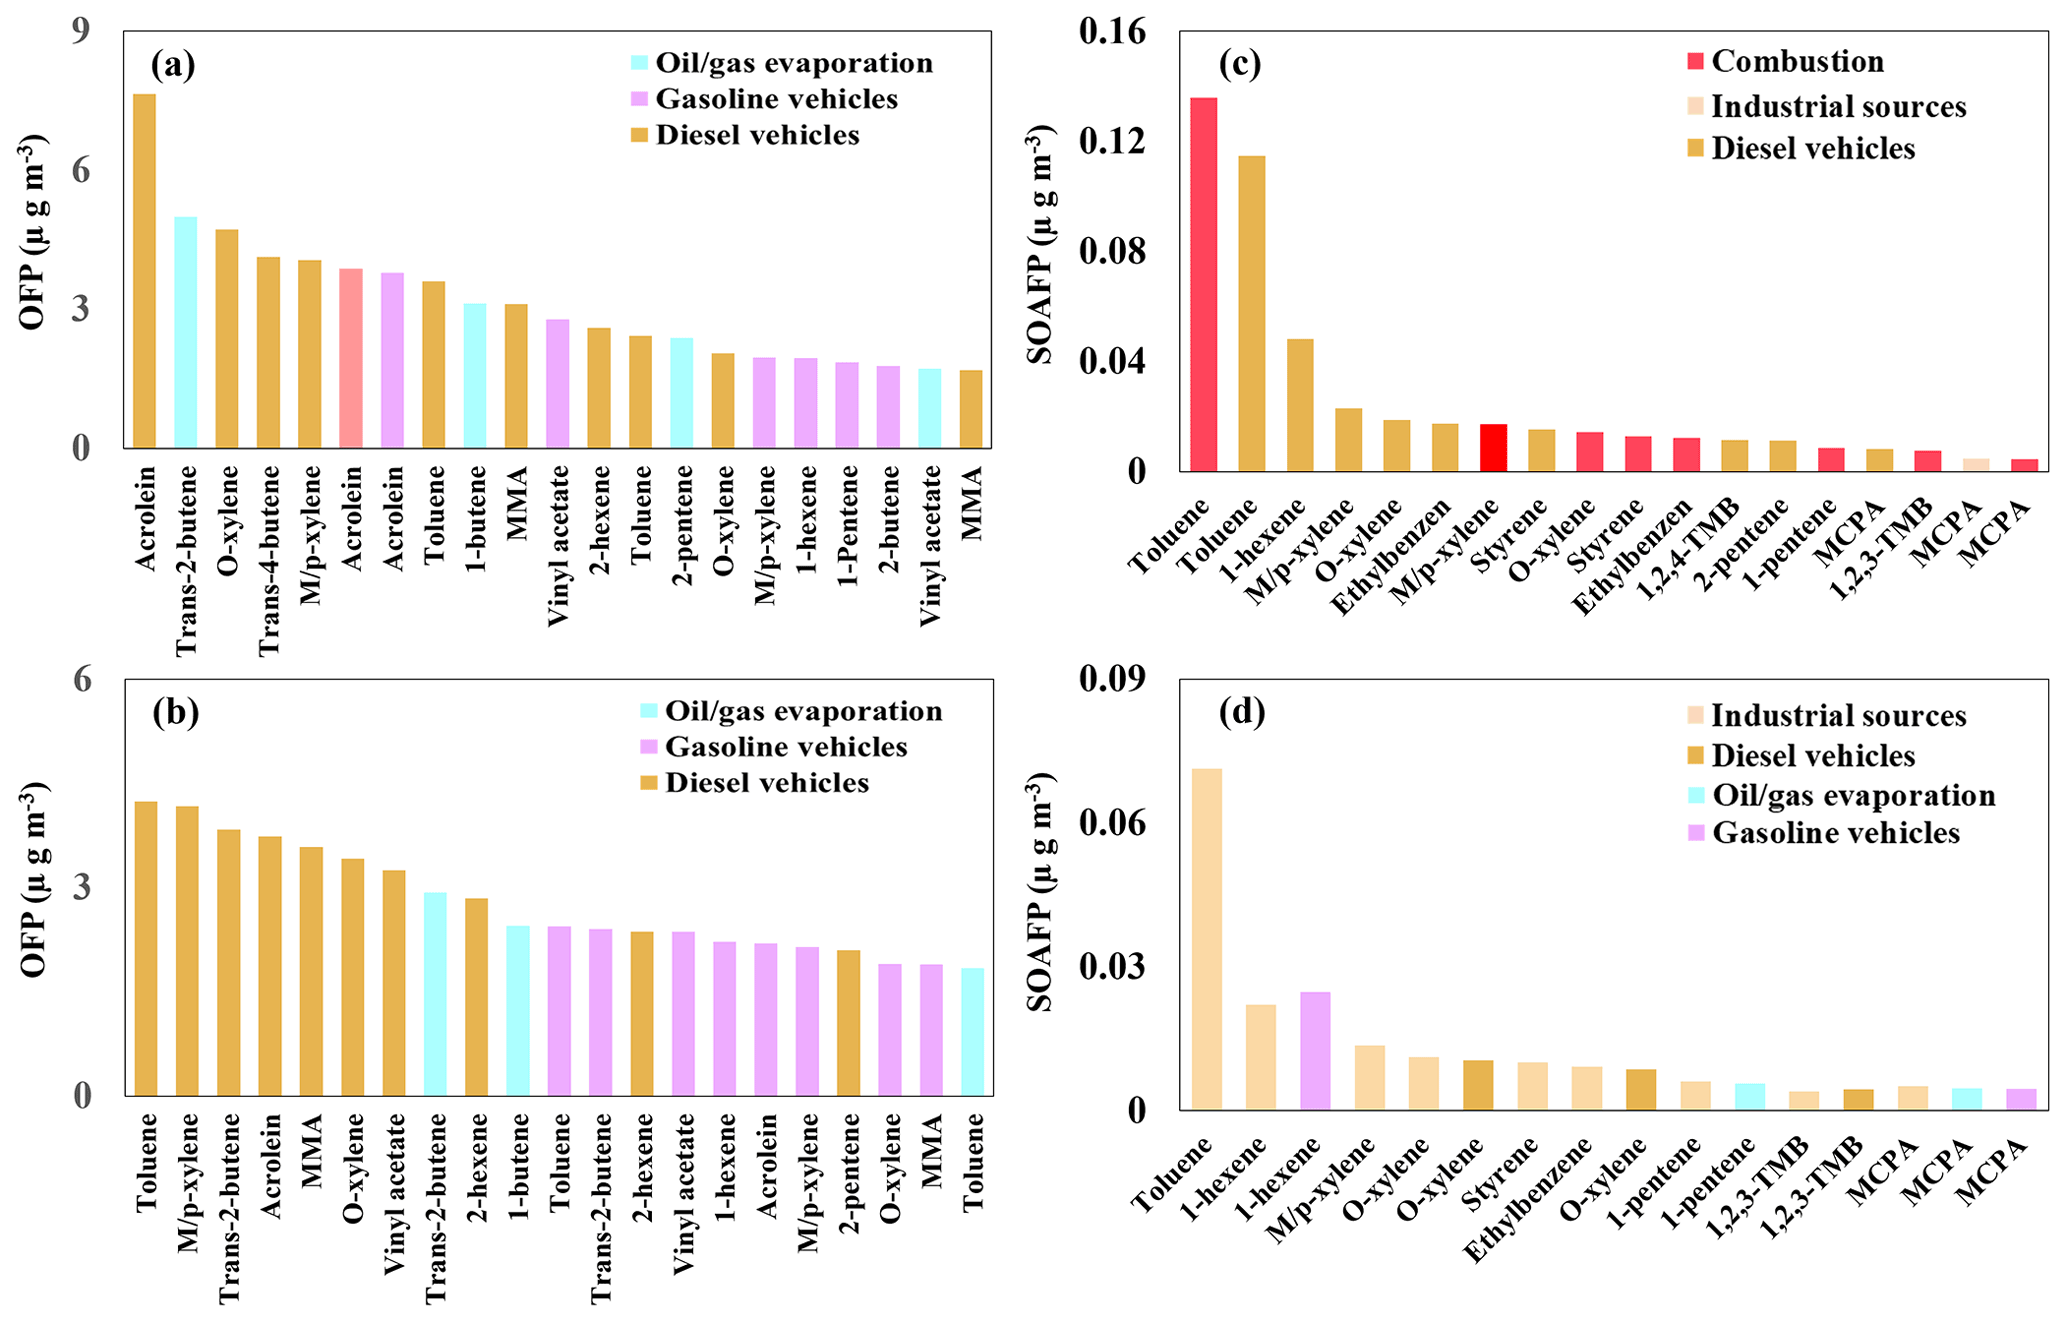
Figure 10OFP values of the dominant VOC species in the different source categories for the O3 pollution (a) and compliance (b) days of the O3-polluted months. SOAFP values for the PM2.5 pollution (c) and compliance (d) days of the PM2.5-polluted months.
3.4 Limitation
This study analyzed the VOC sources and their contributions to O3 and SOA formation across different seasons. It should be pointed out that the sampling campaign for VOC measurement was not conducted continuously during December 2018 and November 2019. For instance, the air samples were not collected in August and February–March 2019, during which pollution events of O3 and PM2.5 occurred, respectively. The variations, sources, and secondary transformation potentials of VOCs, particularly for O3 and PM2.5 pollution periods, cannot be fully depicted. Despite the uncertainties that remain, the results obtained in this study provide useful information for VOC emission control strategies and assist in overcoming air pollution issues in Beijing.
In this work, a field sampling campaign of VOCs was conducted in urban Beijing from December 2018 to November 2019. The VOC concentrations ranged from 5.5 to 118.7 ppbv with a mean value of 34.9 ppbv. Alkanes, OVOCs, and halocarbons were the dominant chemical groups, accounting for 75 %–81 % of the TVOC across the sampling months. By excluding the meteorological impact, the emission-driven O3 levels during the O3-polluted months were higher than during the non-O3-polluted months, and a similar pattern was found for PM2.5. The molar ratio of VOCs to NOx indicated that O3 formation was limited by VOCs during both the O3-polluted non-O3-polluted months, and thus reducing VOC emissions is essential for alleviation of O3 pollution. The contributions of coal and biomass combustion, solvent use, industrial sources, oil and gas evaporation, gasoline exhaust, and diesel exhaust were identified based on PMF analysis. Considering both the concentration and maximum incremental reactivity of individual VOC species for each source, fuel use and diesel exhaust sources were identified as the main contributors of O3 formation during the O3-polluted months, particularly the VOC species of toluene, xylenes, trans-2-butene, acrolein, methyl methacrylate, vinyl acetate, 1-butene, and 1-hexene, illustrating the necessity of conducting emission controls on these pollution sources and species to alleviate O3 pollution. VOCs from diesel vehicles and combustion were found to be the dominant contributors for SOAFP, particularly the VOC species of toluene, 1-hexene, xylenes, ethylbenzene, and styrene, and top priority should be given to these for the alleviation of haze pollution.
Meteorological data and concentrations of air pollutants including PM2.5, O3, and NOx are available from the authors upon request. The daily mixing ratio of individual VOC species can be accessed through https://doi.org/10.5281/zenodo.6888723 (Cui et al., 2022).
The supplement related to this article is available online at: https://doi.org/10.5194/acp-22-11931-2022-supplement.
DW designed the study and performed the VOC measurements. QX and RH assisted in air sampling and data collection. LC performed the data analysis and wrote the paper with contributions from all co-authors. SW and JH reviewed the paper and provided comments for improving the paper.
The contact author has declared that none of the authors has any competing interests.
Publisher's note: Copernicus Publications remains neutral with regard to jurisdictional claims in published maps and institutional affiliations.
This work was supported by the National Natural Science Foundation of China (grant no. 92044302) and the Beijing Municipal Science and Technology Project (grant nos. Z211100004321006 and Z191100009119001).
This paper was edited by Eleanor Browne and reviewed by two anonymous referees.
Abeleira, A., Pollack, I. B., Sive, B., Zhou, Y., Fischer, E. V., and Farmer, D. K.: Source characterization of volatile organic compounds in the Colorado Northern Front Range Metropolitan Area during spring and summer 2015, J. Geophys. Res.-Atmos., 122, 3595–3613, https://doi.org/10.1002/2016jd026227, 2017
Ahmad, W., Coeur, C., Tomas, A., Fagniez, T., Brubach, J. B., and Cuisset, A.: Infrared spectroscopy of secondary organic aerosol precursors and investigation of the hygroscopicity of SOA formed from the OH reaction with guaiacol and syringol, Appl. Optics, 56, E116, https://doi.org/10.1364/AO.56.00E116, 2017.
Akagi, S. K., Yokelson, R. J., Wiedinmyer, C., Alvarado, M. J., Reid, J. S., Karl, T., Crounse, J. D., and Wennberg, P. O.: Emission factors for open and domestic biomass burning for use in atmospheric models, Atmos. Chem. Phys., 11, 4039–4072, https://doi.org/10.5194/acp-11-4039-2011, 2011.
An, J. L., Wang, Y. S., Wu, F. K., and Zhu, B.: Characterizations of volatile organic compounds during high ozone episodes in Beijing, China, Environ. Monit. Assess., 184, 1879–1889, 2012.
Atkinson, R.: Atmospheric chemistry of VOCs and NOx, Atmos. Environ., 34, 2063–2101, 2000.
Carter, W. P. L.: Development of the SAPRC-07 chemical mechanism, Atmos. Environ., 44, 5324–5335, https://doi.org/10.1016/j.atmosenv.2010.01.026, 2010.
Carter, W. P. L. and Atkinson, R.: Computer modeling study of incremental hydrocarbon reactivity, Environ. Sci. Technol., 23, 864–880, https://doi.org/10.1021/es00065a017, 1989.
Chang, T. Y. and Rudy, S. J.: Ozone-forming potential of organic emissions from alternative-fueled vehicles, Atmos. Environ., 24, 2421–2430, https://doi.org/10.1016/0960-1686(90)90335-K, 1990.
Chen, L., Zhu, J., Liao, H., Yang, Y., and Yue, X.: Meteorological influences on PM2.5 and O3 trends and associated health burden since China's clean air actions, Sci. Total Environ., 744, 140837, https://doi.org/10.1016/j.scitotenv.2020.140837, 2020.
Cui, L., Wu, D., Wang, S., Xu, Q., Hu, R., and Hao, J.: Daily mixing ratio of individual VOCs species, Zenodo [data set], https://doi.org/10.5281/zenodo.6888723, 2022.
Dai, P., Ge, Y., Lin, Y., Su, S., and Liang, B.: Investigation on characteristics of exhaust and evaporative emissions from passenger cars fueled with gasoline/methanol blends, Fuel, 113, 10–16, 2013.
Deng, C. X., Jin, Y. J., Zhang, M., Liu, X. W., and Yu, Z. M.: Emission Characteristics of VOCs from On-Road Vehicles in an Urban Tunnel in Eastern China and Predictions for 2017–2026, Aerosol Air Qual. Res., 18, 3025–3034, 2018.
Doumbia, T., Granier, C., Elguindi, N., Bouarar, I., Darras, S., Brasseur, G., Gaubert, B., Liu, Y., Shi, X., Stavrakou, T., Tilmes, S., Lacey, F., Deroubaix, A., and Wang, T.: Changes in global air pollutant emissions during the COVID-19 pandemic: a dataset for atmospheric modeling, Earth Syst. Sci. Data, 13, 4191–4206, https://doi.org/10.5194/essd-13-4191-2021, 2021.
Fan, H., Zhao, C., and Yang, Y.: A Comprehensive Analysis of the Spatio-Temporal Variation of Urban Air Pollution in China During 2014–2018, Atmos. Environ., 220, 117066, https://doi.org/10.1016/j.atmosenv.2019.117066, 2020.
Feng, J., Liao, H., Li, Y., Zhang, Z., and Tang, Y.: Long-term trends and variations in haze-related weather conditions in north China during 1980–2018 based on emission-weighted stagnation intensity, Atmos. Environ., 240, 117830, https://doi.org/10.1016/j.atmosenv.2020.117830, 2020.
Fu, Y., Liao, H., and Yang, Y.: Interannual and Decadal Changes in Tropospheric Ozone in China and the Associated Chemistry Climate Interactions: A Review, Adv. Atmos. Sci., 36, 975–993, 2019.
Grosjean, D. and Seinfeld, J. H.: Parameterization of the formation potential of secondary organic aerosols, Atmos. Environ., 23, 1733–1747, https://doi.org/10.1016/0004-6981(89)90058-9, 1989.
Guenther, A. B., Zimmerman, P. R., Harley, P. C., Monson, R. K., and Fall, R.: Isoprene and monoterpene emission rate variability: Model evaluations and sensitivity analyses, J. Geophys. Res.-Atmos., 98, 12609–12617, https://doi.org/10.1029/93JD00527, 1993.
Guenther, A. B., Jiang, X., Heald, C. L., Sakulyanontvittaya, T., Duhl, T., Emmons, L. K., and Wang, X.: The Model of Emissions of Gases and Aerosols from Nature version 2.1 (MEGAN2.1): an extended and updated framework for modeling biogenic emissions, Geosci. Model Dev., 5, 1471–1492, https://doi.org/10.5194/gmd-5-1471-2012, 2012.
Han, S., Zhao, Q., Zhang, R., Liu, Y., Li, C., Zhang, Y., Li, Y., Yin, S., and Yan, Q.: Emission characteristic and environmental impact of process-based VOCs from prebaked anode manufacturing industry in Zhengzhou, China, Atmos. Pollut. Res., 627, 67–77, https://doi.org/10.1016/j.apr.2019.09.016, 2020.
Hanna, S. R., Moore, G. E., and Fernau, M.: Evaluation of photochemical grid models (UAM-IV, UAM-V, and the ROM/UAMIV couple) using data from the Lake Michigan Ozone Study (LMOS), Atmos. Environ., 30, 3265–3279, 1996.
Huang, R. J., Zhang, Y., Bozzetti, C., Ho, K. F., Cao, J. J., Han, Y., Daellenbach, K. R., Slowik, J. G., Platt, S. M., Canonaco, F., Zotter, P., Wolf, R., Pieber, S. M., Bruns, E. A., Crippa, M., Ciarelli, G., Piazzalunga, A., Schwikowski, M., Abbaszade, G., Schnelle-Kreis, J., Zimmermann, R., An, Z., Szidat, S., Baltensperger, U., El Haddad, I., and Prevot, A. S. H.: High secondary aerosol contribution to particulate pollution during haze events in China, Nature, 514, 218–222, https://doi.org/10.1038/nature13774, 2014.
Jobson, B. T., Berkowitz, C. M., Kuster, W. C., Goldan,P. D., Williams, E. J., Fesenfeld, F. C., Apel, E. C., Karl, T., Lonneman, W. A., and Riemer, D.: Hydrocarbon source signatures in Houston, Texas: Influence of the petrochemical industry, J. Geophys. Res.-Atmos., 109, D24305, https://doi.org/10.1029/2004jd004887, 2004.
Kuang, Y., He, Y., Xu, W. Y., Yuan, B., Zhang, G., Ma, Z. Q., Wu, C. H., Wang, C. M., Wang, S. H., Zhang, H. Y., Tao, J. C., Ma, N., Su, H., Cheng, Y. F., Shao, M., and Sun, Y. L.: Photochemical aqueous-phase reactions induce rapid daytime formation of oxygenated organic aerosol on the North China Plain, Environ. Sci. Technol., 54, 3849–3860, 2020.
Li, B., Ho, S. S. H., Gong, S., Ni, J., Li, H., Han, L., Yang, Y., Qi, Y., and Zhao, D.: Characterization of VOCs and their related atmospheric processes in a central Chinese city during severe ozone pollution periods, Atmos. Chem. Phys., 19, 617–638, https://doi.org/10.5194/acp-19-617-2019, 2019.
Li, J., Xie, S. D., Zeng, L. M., Li, L. Y., Li, Y. Q., and Wu, R. R.: Characterization of ambient volatile organic compounds and their sources in Beijing, before, during, and after Asia-Pacific Economic Cooperation China 2014, Atmos. Chem. Phys., 15, 7945–7959, https://doi.org/10.5194/acp-15-7945-2015, 2015.
Li, K., Jacob, D. J., Liao, H., Shen, L., Zhang, Q., and Bates, K. H.: Anthropogenic Drivers of 2013–2017 Trends in Summer Surface Ozone in China, P. Natl. Acad. Sci. USA, 116, 422–427, 2019a.
Li, K., Li, J., Tong, S., Wang, W., Huang, R.-J., and Ge, M.: Characteristics of wintertime VOCs in suburban and urban Beijing: concentrations, emission ratios, and festival effects, Atmos. Chem. Phys., 19, 8021–8036, https://doi.org/10.5194/acp-19-8021-2019, 2019b.
Li, K., Jacob, D. J., Shen, L., Lu, X., De Smedt, I., and Liao, H.: Increases in surface ozone pollution in China from 2013 to 2019: anthropogenic and meteorological influences, Atmos. Chem. Phys., 20, 11423–11433, https://doi.org/10.5194/acp-20-11423-2020, 2020.
Li, L., Chen, Y., Zeng, L., Shao, M., Xie, S., Chen, W., Lu, S., Wu, Y., and Cao, W.: Biomass burning contribution to ambient volatile organic compounds (VOCs) in the Chengdu–Chongqing Region (CCR), China, Atmos. Environ., 99, 403–410, 2014.
Li, Y. J., Sun, Y., Zhang, Q., Li, X., Li, M., Zhou, Z., and Chan, C. K.: Real-time chemical characterization of atmospheric particulate matter in China: A review, Atmos. Environ., 158, 270–304, 2017.
Liang, Y., Liu, X., Wu, F., Guo, Y., and Xiao, H.: The year-round variations of VOC mixing ratios and their sources in Kuytun City (northwestern China), near oilfields, Atmos. Pollut. Res., 11, 1513–1523, https://doi.org/10.1016/j.apr.2020.05.022, 2020.
Ling, Z. H., Guo, H., Cheng, H. R., and Yu, Y. F.: Sources of ambient volatile organic compounds and their contributions to photochemical ozone formation at a site in the Pearl River Delta, southern China, Environ. Pollut., 159, 2310–2319, 2011.
Liu, Y. and Wang, T.: Worsening urban ozone pollution in China from 2013 to 2017 – Part 2: The effects of emission changes and implications for multi-pollutant control, Atmos. Chem. Phys., 20, 6323–6337, https://doi.org/10.5194/acp-20-6323-2020, 2020.
Liu, Y. F., Song, M. D., Liu, X. G., Zhang, Y. P., Hui, L. R., Kong, L. W., Zhang, Y. Y., Zhang, C., Qu, Y., An, J. L., Ma, D. P., Tan, Q. W., and Feng, M.: Characterization and sources of volatile organic compounds (VOCs) and their related changes during ozone pollution days in 2016 in Beijing, China, Environ Pollut., 257, 113599, https://doi.org/10.1016/j.envpol.2019.113599, 2020.
McDonald, B. C., de Gouw, J. A., Gilman, J. B., Jathar, S. H., Akherati, A., Cappa, C. D., Jimenez, J. L., Lee-Taylor, J., Hayes, P. L., McKeen, S. A., Cui, Y. Y., Kim, S. W., Gentner, D. R., Isaacman-VanWertz, G., Goldstein, A. H., Harley, R. A., Frost, G. J., Roberts, J. M., Ryerson, T. B., and Trainer, M.: Volatile chemical products emerging as largest petrochemical source of urban organic emissions, Science, 359, 760–764, https://doi.org/10.1126/science.aaq0524, 2018.
McGaughey, G. R., Desai, N. R., Allen, D. T., Seila, R.L., Lonneman, W. A., Fraser, M. P., Harley, R. A., Pollack, A. K., Ivy, J. M., and Price, J. H.: Analysis of motor vehicle emissions in a Houston tunnel during the TexasAir Quality Study 2000, Atmos. Environ., 38, 3363–3372, 2004.
Miller, L., Xu, X., Grgicak-Mannion, A., Brook, J., and Wheeler, A.: Multi-season, multiyear concentrations and correlations amongst the BTEX group of VOCs in an urbanized industrial city, Atmos. Environ., 61, 305–315, 2012.
Mo, Z., Shao, M., Lu, S., Qu, H., Zhou, M., Sun, J., and Gou, B.: Process-specific emission characteristics of volatile organic compounds (VOCs) from petrochemical facilities in the Yangtze River Delta, China, Sci. Total Environ., 533, 422–431, 2015.
Mo, Z., Shao, M., and Lu, S.: Compilation of a source profile database for hydrocarbon and OVOC emissions in China, Atmos. Environ., 143, 209–217, 2016.
Odum, J. R., Jungkamp, T. P. W., Griffifin, R. J., Flagan, R. C., and Seinfeld, J. H.: The atmospheric aerosol-forming potential of whole gasoline vapor, Science, 276, 96–99, 1997.
Pallavi, Sinha, B., and Sinha, V.: Source apportionment of volatile organic compounds in the northwest Indo-Gangetic Plain using a positive matrix factorization model, Atmos. Chem. Phys., 19, 15467–15482, https://doi.org/10.5194/acp-19-15467-2019, 2019.
Qiao, Y. Z., Wang, H. L., Huang, C., Chen, C. H., Su, L. Y., Zhou, M., Xu, H., Zhang, G. F., Chen, Y. R., Li, L., Chen, M. H., and Huang, H. Y.: Source Profile and Chemical Reactivity of VolatileOrganic Compounds from Vehicle Exhaust, Huanjing Kexue, 33, 1071–1079, 2012.
Raysoni, A. U., Stock, T. H., Sarnat, J. A., Chavez, M. C., Sarnat, S. E., Montoya, T., Holguin, F., and Li, W. W.: Evaluation of VOC concentrations in indoor and outdoor microenvironments at near-road schools, Environ. Pollut., 231, 681–693, 2017.
Russo, R. S., Zhou, Y., White, M. L., Mao, H., Talbot, R., and Sive, B. C.: Multi-year (2004–2008) record of nonmethane hydrocarbons and halocarbons in New England: seasonal variations and regional sources, Atmos. Chem. Phys., 10, 4909–4929, https://doi.org/10.5194/acp-10-4909-2010, 2010.
Sato, K., Takami, A., Isozaki, T., Hikida, T., Shimono, A., and Imamura, T.: Mass spectrometric study of secondary organic aerosol formed from the photo-oxidation of aromatic hydrocarbons, Atmos. Environ., 44, 1080–1087, https://doi.org/10.1016/j.atmosenv.2009.12.013, 2010.
Shao, M., Zhang, Y., Zeng, L., Tang, X., Zhang, J., Zhong, L., and Wang, B.: Ground-level ozone in the Pearl River Delta and the roles of VOC and NOx in its production, J. Environ. Manage., 90, 512–518, 2009.
She, Q., Choi, M., Belle, J. H., Xiao, Q., Bi, J., Huang, K., Meng, X., Geng, G., Kim, J., He, K., Liu, M., and Liu, Y.: Satellite-based estimation of hourly PM2.5 levels during heavy winter pollution episodes in the Yangtze River Delta, China, Chemosphere, 239, 124678, https://doi.org/10.1016/j.chemosphere.2019.124678, 2020.
Shen, L., Jacob, D. J., Liu, X., Huang, G., Li, K., Liao, H., and Wang, T.: An evaluation of the ability of the Ozone Monitoring Instrument (OMI) to observe boundary layer ozone pollution across China: application to 2005–2017 ozone trends, Atmos. Chem. Phys., 19, 6551–6560, https://doi.org/10.5194/acp-19-6551-2019, 2019.
Shen, L., Wang, Z., Cheng, H., Liang, S., Xiang, P., Hu, K., Yin, T., and Yu, J.: A Spatial-Temporal Resolved Validation of Source Apportionment by Measurements of Ambient VOCs in Central China, Int. J. Env. Res. Pub. He., 17, 791, https://doi.org/10.3390/ijerph17030791, 2020.
Shi, J., Deng, H., Bai, Z., Kong, S., Wang, X., Hao, J., Han, X., and Ning, P.: Emission and profile characteristic of volatile organic compounds emitted from coke production, iron smelt, heating station and power plant in Liaoning Province, China Sci. Total Environ., 515, 101–108, 2015.
Sillman, S.: The relation between ozone, NOx and hydrocarbons in urban and polluted rural environments, Atmos. Environ., 33, 1821–1845, 1999.
Sindelarova, K., Markova, J., Simpson, D., Huszar, P., Karlicky, J., Darras, S., and Granier, C.: High-resolution biogenic global emission inventory for the time period 2000–2019 for air quality modelling, Earth Syst. Sci. Data, 14, 251–270, https://doi.org/10.5194/essd-14-251-2022, 2022.
Song, M., Li, X., Yang, S., Yu, X., Zhou, S., Yang, Y., Chen, S., Dong, H., Liao, K., Chen, Q., Lu, K., Zhang, N., Cao, J., Zeng, L., and Zhang, Y.: Spatiotemporal variation, sources, and secondary transformation potential of volatile organic compounds in Xi'an, China, Atmos. Chem. Phys., 21, 4939–4958, https://doi.org/10.5194/acp-21-4939-2021, 2021.
Stavrakou, T., Müller, J.-F., Bauwens, M., De Smedt, I., Van Roozendael, M., Guenther, A., Wild, M., and Xia, X.: Isoprene emissions over Asia 1979–2012: impact of climate and land-use changes, Atmos. Chem. Phys., 14, 4587–4605, https://doi.org/10.5194/acp-14-4587-2014, 2014.
Sun, Y. L., He, Y., Kuang, Y.. Xu, W. Y., Song, S. J., Ma, N., Tao, J. C., Cheng, P., Wu, C., Su, H., Cheng, Y. F., Xie, C. H., Chen, C., Lei, L., Qiu, Y. M., Fu, P. Q., Croteau, P., and Worsnop, D. R.: Chemical Differences Between PM1 and PM2.5 in Highly Polluted Environment and Implications in Air Pollution Studies, Geophys. Res. Lett., 47, e2019GL086288, https://doi.org/10.1029/2019GL086288, 2020.
Tsai, S. M., Zhang, J. J., Smith, K. R., Ma, Y., Rasmussen, R. A., and Khalil, M. A. K.: Characterization of Non-methane Hydrocarbons Emitted from Various Cookstoves Used in China, Environ. Sci. Technol., 37, 2869–2877, 2003.
Tong, Y., Pospisilova, V., Qi, L., Duan, J., Gu, Y., Kumar, V., Rai, P., Stefenelli, G., Wang, L., Wang, Y., Zhong, H., Baltensperger, U., Cao, J., Huang, R.-J., Prévôt, A. S. H., and Slowik, J. G.: Quantification of solid fuel combustion and aqueous chemistry contributions to secondary organic aerosol during wintertime haze events in Beijing, Atmos. Chem. Phys., 21, 9859–9886, https://doi.org/10.5194/acp-21-9859-2021, 2021.
US Environmental Protection Agency: Compendium of Method for the Determination of Toxic Organic Compounds in ambient air: Method TO-15, 2nd Edn., EPA 600/625R-96/010b, 1999.
Wang, H., Qiao, Y., Chen, C., Lu, J., Dai, H., Qiao, L., Lou, S., Huang, C., Li, L., Jing, S., and Wu, J.: Source Profiles and Chemical Reactivity of Volatile Organic Compounds from Solvent Use in Shanghai, China, Aerosol Air Qual. Res., 14, 301–310, 2014.
Wang, H. L., Chen, C. H., Wang, Q., Huang, C., Su, L. Y., Huang, H. Y., Lou, S. R., Zhou, M., Li, L., Qiao, L. P., and Wang, Y. H.: Chemical loss of volatile organic compounds and its impact on the source analysis through a two-year continuous measurement, Atmos. Environ., 80, 488–498, 2013.
Wang, J., Jin, L., Gao, J., Shi, J., Zhao, Y., Liu, S., Jin, T., Bai, Z., and Wu, C. Y.: Investigation of speciated VOC in gasoline vehicular exhaust under ECE and EUDC test cycles, Sci. Total Environ., 445, 110–116, 2013.
Wang, M., Shao, M., Lu, S. H., Yang, Y. D., and Chen, W. T.: Evidence of coal combustion contribution to ambient VOCs during winter in Beijing, Chinese Chem. Lett., 24, 829–832, 2013.
Wang, M. L., Li, S. Y., Zhu, R. C., Zhang, R. Q., Zu, L., Wang, Y. J., and Bao, X. F.: On-road tailpipe emission characteristics and ozone formation potentials of VOCs from gasoline, diesel and liquefied petroleum gas fueled vehicles, Atmos. Environ., 223, 117294, https://doi.org/10.1016/j.atmosenv.2020.117294, 2020.
Wang, T., Xue, L., Brimblecombe, P., Lam, Y. F., Li, L., and Zhang, L.: Ozone Pollution in China: A Review of Concentrations, Meteorological Influences, Chemical Precursors, and Effects, Sci. Total Environ., 575, 1582–1596, 2017.
Wang, Y. S., Yao, L., Wang, L. L., Liu, Z. R., Ji, D. S., Tang, G. Q., Zhang, J. K., Sun, Y., Hu, B., and Xin, J. Y.: Mechanism for the formation of the January 2013 heavy haze pollution episode over central and eastern China, Sci. China Earth Sci., 57, 14–25, https://doi.org/10.1007/s11430-013-4773-4, 2014.
Warneke, C., McKeen, S. A., de Gouw, J. A., Goldan, P. D., Kuster, W. C., Holloway, J. S., Williams, E. J., Lerner, B. M., Parrish, D. D., Trainer, M., Fehsenfeld, F. C., Kato, S., Atlas, E. L., Baker, A., and Blake, D. R.: Determination of urban volatile organic compound emission ratios and comparison with an emissions database, J. Geophys. Res., 112, D10S47, https://doi.org/10.1029/2006jd007930, 2007.
Wu, R. and Xie, S.: Spatial Distribution of Secondary Organic Aerosol Formation Potential in China Derived from Speciated Anthropogenic Volatile Organic Compound Emissions, Environ. Sci. Technol., 52, 8146–8156, https://doi.org/10.1021/acs.est.8b01269, 2018.
Wu, R. R., Li, J., Hao, Y. F., Li, Y. Q., Zeng, L. M., and Xie, S. D.: Evolution process and sources of ambient volatile organic compounds during a severe haze event in Beijing, China, Sci. Total. Environ., 560–561, 62–72, 2016.
Xing, J., Wang, S. X., Jang, C., Zhu, Y., and Hao, J. M.: Nonlinear response of ozone to precursor emission changes in China: a modeling study using response surface methodology, Atmos. Chem. Phys., 11, 5027–5044, https://doi.org/10.5194/acp-11-5027-2011, 2011.
Xu, Q., Wang, S., and Jiang, J.: Nitrate dominates the chemical composition of PM2.5 during haze event in Beijing, China, Sci. Total. Environ., 689, 1293–1303, 2019.
Xu, W., Sun, Y., Wang, Q., Zhao, J., Wang, J., Ge, X., Xie, C., Zhou, W., Du, W., Li, J., Fu, P., Wang, Z., Worsnop, D. R., and Coe, H.: Changes in Aerosol Chemistry From 2014 to 2016 in Winter in Beijing: Insights From High-Resolution Aerosol Mass Spectrometry, J. Geophys. Res.-Atmos., 124, 1132–1147, 2019.
Xue, Y., Ho, S. S. H., Huang, Y., Li, B., Wang, L., Dai, W., Cao, J., and Lee, S.: Source apportionment of VOCs and their impacts on surface ozone in an industry city of Baoji, Northwestern China, Sci. Rep.-UK, 7, 9979, https://doi.org/10.1038/s41598-017-10631-4, 2017.
Yan, Y., Peng, L., Li, R., Li, Y., Li, L., and Bai, H.: Concentration, ozone formation potential and source analysis of volatile organic compounds (VOCs) in a thermal power station centralized area: A study in Shuozhou, China, Environ. Pollut., 223, 295–304, 2017.
Yang, W., Zhang, Y., Wang, X., Li, S., Zhu, M., Yu, Q., Li, G., Huang, Z., Zhang, H., Wu, Z., Song, W., Tan, J., and Shao, M.: Volatile organic compounds at a rural site in Beijing: influence of temporary emission control and wintertime heating, Atmos. Chem. Phys., 18, 12663–12682, https://doi.org/10.5194/acp-18-12663-2018, 2018.
Yao, Y. C., Tsai, J. H., Wang, I. T.: Emissionsof gaseous pollutant from motorcycle powered byethanol-gasoline blend, Appl. Energy., 102, 93–100, 2013.
Yao, Z., Wu, B., Shen, X., Cao, X., Jiang, X., Ye, Y., and He, K.: On-road emission characteristics of VOCs from rural vehicles and their ozone formation potential in Beijing, China, Atmos. Environ., 105, 91–96, 2015.
Yuan, B., Shao, M., Lu, S., and Wang, B.: Source profiles of volatile organic compounds associated with solvent use in Beijing, China, Atmos. Environ., 44, 1919–1926, 2010.
Zhai, S., Jacob, D. J., Wang, X., Shen, L., Li, K., Zhang, Y., Gui, K., Zhao, T., and Liao, H.: Fine particulate matter (PM2.5) trends in China, 2013–2018: separating contributions from anthropogenic emissions and meteorology, Atmos. Chem. Phys., 19, 11031–11041, https://doi.org/10.5194/acp-19-11031-2019, 2019.
Zhang, Y., Wang, X., Zhang, Z., Lu, S., Shao, M., Lee, F. S. C., and Yu, J.: Species profiles and normalized re activity of volatile organic compounds from gasoline evaporation in China, Atmos. Environ., 79, 110–118, 2013.
Zhang, X., Xue, Z., Li, H., Yan, L., Yang, Y., Wang, Y., Duan, J., Li, L., Chai, F., Cheng, M., and Zhang, W.: Ambient volatile organic compounds pollution in China, J. Environ. Sci., 55, 69–75, https://doi.org/10.1016/j.jes.2016.05.036, 2017.
Zhao, D., Liu, G., Xin, J., Quan, J., Wang, Y., Wang, X., Dai, L., Gao, W., Tang, G., Hu, B., Ma, Y., Wu, X., Wang, L., Liu, Z., and Wu, F.: Haze pollution under a high atmospheric oxidization capacity in summer in Beijing: insights into formation mechanism of atmospheric physicochemical processes, Atmos. Chem. Phys., 20, 4575–4592, https://doi.org/10.5194/acp-20-4575-2020, 2020.
Zhao, Q., Bi, J., Liu, Q., Ling, Z., Shen, G., Chen, F., Qiao, Y., Li, C., and Ma, Z.: Sources of volatile organic compounds and policy implications for regional ozone pollution control in an urban location of Nanjing, East China, Atmos. Chem. Phys., 20, 3905–3919, https://doi.org/10.5194/acp-20-3905-2020, 2020.
Zheng, J., Yu, Y., Mo, Z., Zhang, Z., Wang, X., Yin, S., Peng, K., Yang, Y., Feng, X., and Cai, H.: Industrial sector-based volatile organic compound (VOC) source profiles measured in manufacturing facilities in the Pearl River Delta, China, Sci. Total Environ., 456, 127–136, 2013.