the Creative Commons Attribution 4.0 License.
the Creative Commons Attribution 4.0 License.
 | 24 Jan 2022
A vertical transport window of water vapor in the troposphere over the Tibetan Plateau with implications for global climate change
Xiangde Xu
Chan Sun
Deliang Chen
Tianliang Zhao
Jianjun Xu
Shengjun Zhang
Juan Li
Yang Zhao
Hongxiong Xu
Lili Dong
Xiaoyun Sun
Yan Zhu
By using the multi-source data of meteorology over recent decades, this study discovered a summertime “hollow wet pool” in the troposphere with a center of high water vapor over the Asian water tower (AWT) on the Tibetan Plateau (TP), which is indicated by a vertical transport “window” in the troposphere. The water vapor transport in the upper troposphere extends from the vertical transport window over the TP with significant connections among the Arctic, Antarctic and TP regions, highlighting the effect of the TP's vertical transport window of water vapor in the troposphere on global change in water vapor. The vertical transport window is built by the AWT's thermal forcing in association with the dynamic effect of the TP's “hollow heat island”. Our study improves the understanding of the vapor transport over the TP with important implication for global climate change.
- Article
(11399 KB) - Full-text XML
- BibTeX
- EndNote


The Tibetan Plateau (TP) is the largest extent of high terrain in the world, known as “the roof of the world”, with an average altitude of over 4000 m. Several rivers, such as the Yangtze, Yellow River, Lancang River and Ganges, originate from the TP, which is regarded as the “Asian water tower” (AWT) (Xu et al., 2008). The three-river-source (Yangtze, Yellow and Lancang rivers) region (TRSR) in the eastern TP is the core area of the AWT over the plateau (Xu et al., 2014). The observed “CISK (conditional instability of the second kind)-like mechanism” is an important mechanism sustaining the atmospheric “water tower” over the AWT (Xu et al., 2014). Connecting with the cloud and precipitation in the AWT, the plausible hydrological cycles could be realized with the transport of water vapor from tropical oceans up to the TP (Xu et al., 2014).
Water vapor plays an important role in global environment and climate changes (Tian et al., 2009; Solomon et al., 2010). The ratio of strong convective clouds to total clouds over the Tibetan Plateau (TP) is about 5 times the global ratio, and the frequent occurrences of strong convective clouds could be largely attributed to the TP's large-scale topography (Luo et al., 2011; Su et al., 2006). The water vapor in the upper troposphere mainly originates from the tropical lower troposphere through vertical transport and evaporation of convectively transported or in situ-produced cloud ices (Tian et al., 2004; James et al., 2008). Water vapor was first lifted by convection over the Bay of Bengal and the South China Sea and then transported upwards to the tropical tropopause layer via the monsoon anticyclonic circulations towards northwest India (Chen et al., 2012). The TP is a moisture sink in summer, having a net moisture convergence of 4 mm each day, and the convergences were enhanced from 1979 to 2018 (Feng and Zhou, 2012; Xu et al., 2020). In general, Asian monsoon circulation provides an effective pathway for regional water vapor transport to the TP (Wang et al., 2017). An important role of the anticyclone over the TP is verified in the exchange of water vapor between the troposphere and stratosphere (Garny et al., 2016; Fu et al., 2006). Many studies have been focused on the transport of water vapor into the upper troposphere and lower stratosphere from the tropical oceans to the high-altitude TP (Chen et al., 2012; Wang et al., 2017; Xie et al., 2018; Randel et al., 2013). However, inadequate attention has been paid to the vertical transport of water vapor in the troposphere over the TP, especially in respect to the underlying mechanism and the consequences for global climate.
The following questions are of great concern in the TP vertical transport of water vapor study with implications for global change, for example: what is the formation mechanism of the vertical transport window of water vapor in the troposphere on the TP? How is the vertical transport of water vapor in the troposphere constructed with the special column of an apparent heat source in the AWT over the TP? What is the global effect of the vertical transport window of water vapor in the troposphere on the TP? From the perspective of global atmospheric energy and water vapor exchanges, this study characterizes a window of water vapor vertical transport within the troposphere over the TP and implications for global change.
The daily meteorological data of cloud amount are provided by the meteorological observatories in the TP in the period of 1979 to 2018. The AIRS (atmospheric infrared sounder) remote sensing products of water vapor from 2003 to 2018 and the ECMWF ERA-Interim data of meteorology from 1979 to 2018 are used in this study.
In this study, the inverse algorithm is used to calculate the apparent heat source Q1, and the formula is as follows (Yanai et al., 1973):
where T is the air temperature, ω is the vertical velocity at the p coordinate, p0=1000 hPa, Cp denotes specific heat at constant pressure, k=0.286, V is the horizontal wind vector and θ is the potential temperature.
Vertical integration of Q1 is expressed as
where ps is the surface air pressure and pt is the top air pressure, here taken as 300 hPa.
In order to analyze the relationship between water vapor sources and vapor transport channels in the atmospheric water cycle, the correlation vector calculation was used to calculate the temporal and spatial variations in the water vapor transport channels. The expression is
where R(x,y) represents the correlation vector in which Ru(x,y) represents the correlation coefficients between water vapor and the component of latitudinal water vapor flux qu, and Rv(x,y) represents correlation coefficients between water vapor and longitudinal water vapor flux components qv.
3.1 The structures of vertical transport window of water vapor over the TP
With the use of satellite remote sensing products from 2003 to 2016, the global distribution of the total water vapor from 500 to 300 hPa in the troposphere is shown in Fig. 1a. The results indicate that there is a high-value center of water vapor in the mid-troposphere and upper troposphere over the TP, extending southwards to the Bay of Bengal, India and northern Southeast Asia. It is worth noting that the fraction of the total cloud that comprises strong convective clouds ranges from 4.0 % to 21.0 % in the TP, and during the summer season the thermal forcing of the TP is dominated by the latent heat released by cloud and precipitation (Fu et al., 2006; Dessler et al., 2006; Gao et al., 2014). The intense mesoscale convective activity, which is represented with the low cloud fraction based on the cloud characteristics observed in the TP, and the “massive chimney effect” of huge cumulonimbus cloud drive the transport of atmospheric heat and water vapor to the upper troposphere (Fu et al., 2006; Xie et al., 2018). Based on the Third Tibetan Plateau Atmospheric Scientific Experiment (TIPEX-III) (2014–2017), it is observed in the TP that the cloud-top height was on average around 11.5 km a.s.l. with its maximum value exceeding 19 km a.s.l. and the mean cloud-base height at 6.88 km a.s.l. during the observation period, reflecting the TP's deep convection in the troposphere and its impact on the upper troposphere.
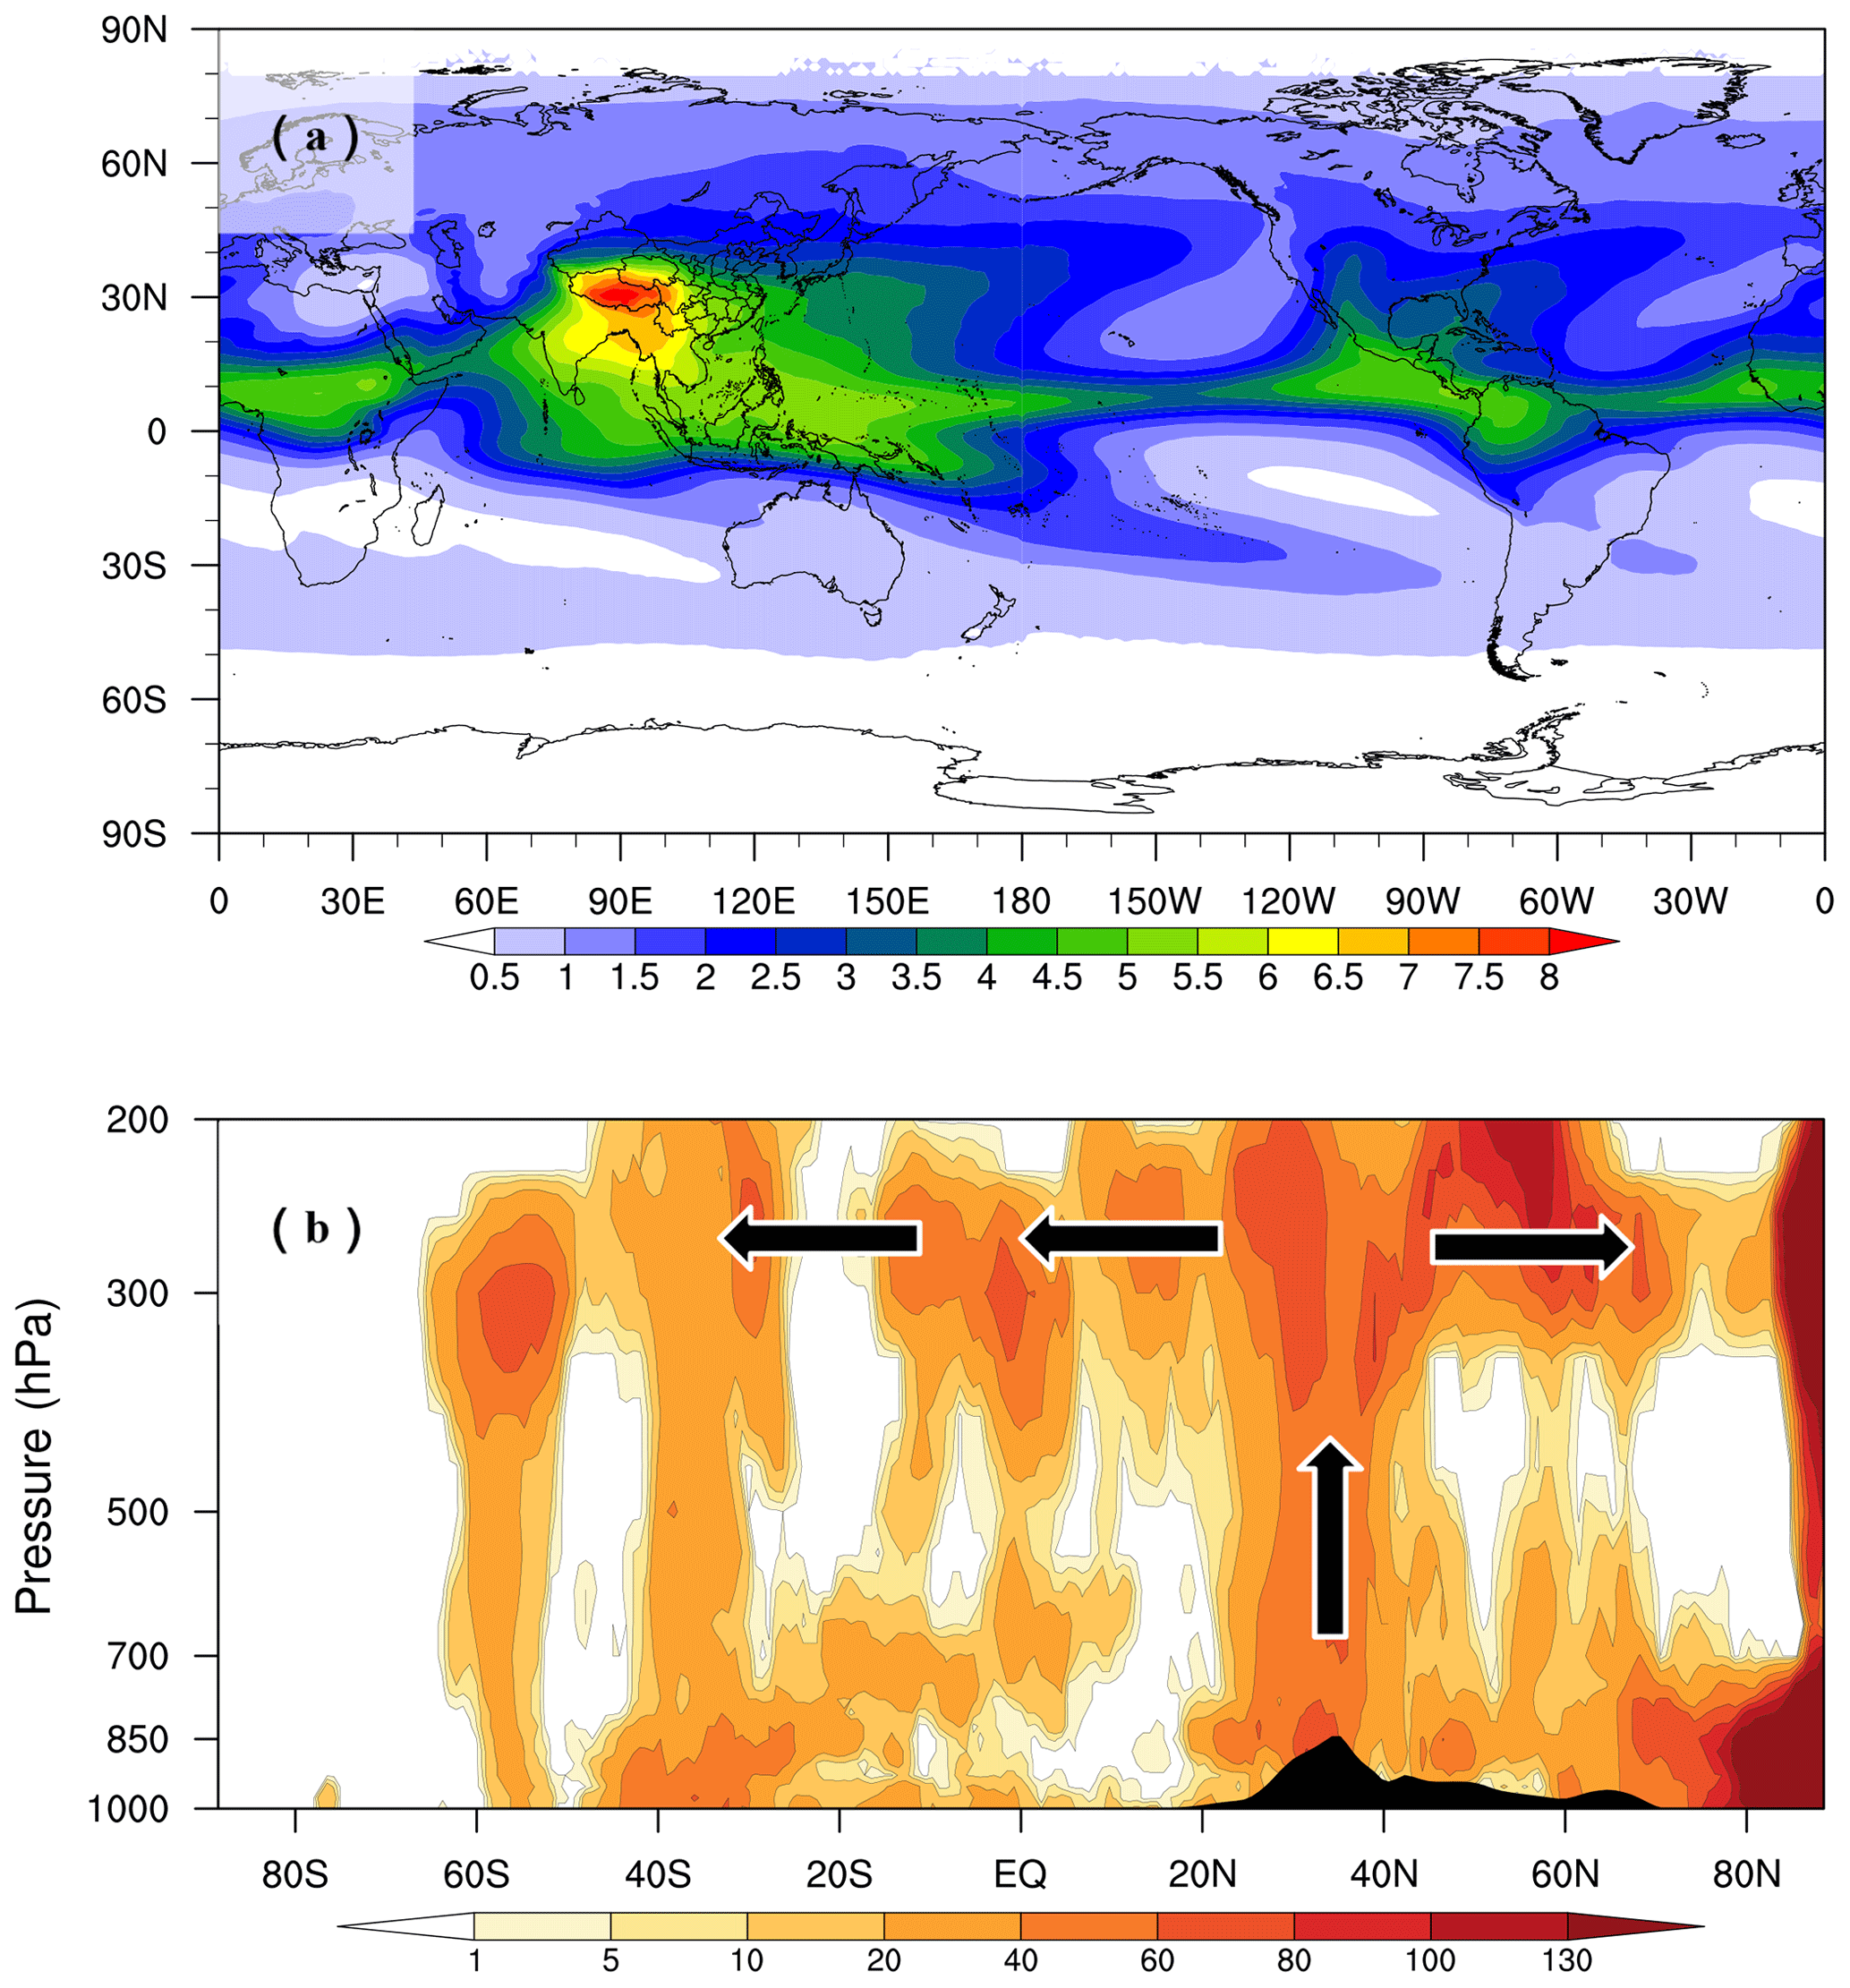
Figure 1(a) The global distribution of the total water vapor from 300 to 500 hPa based on the summertime AIRS data from 2003 to 2018; (b) the vertical section of the frequency (shaded) of the correlation coefficients passing the level of 90 % confidence between the summertime TP's low cloud cover and the water vapor at different vertical levels along the meridional direction averaged over 60–180∘ E for 1979–2016, with the black arrows indicating the connections of the TP's low clouds to global water vapor in the upper troposphere with high frequencies.
3.2 Global effect of the vertical transport window over the TP
The vertical section of the correlation coefficients along the south–north direction between the low cloud cover on the TP and the global water vapor is presented in Fig. 1b. The obviously upward movement of water vapor over the TP can be seen in Fig. 2a. It can be noticed that there exist structures similar to the massive chimney between the convective cloud and the water vapor on the TP (Figs. 1b and 2a). Figure 2b and c show significant correlation between convective clouds over the AWT and the changes in global water vapor from 1979 to 2018. Significant correlations extend from the TP southwards and northwards in the upper troposphere. It is remarkable that the high-correlation areas passing the 90 % confidence level expand towards the polar regions of both the Southern Hemisphere and the Northern Hemisphere (Figs. 1b, 2b and c), depicting the relation between the convective clouds and the global water vapor in the upper troposphere across the Northern Hemisphere and Southern Hemisphere with implications of the TP for global climate change.
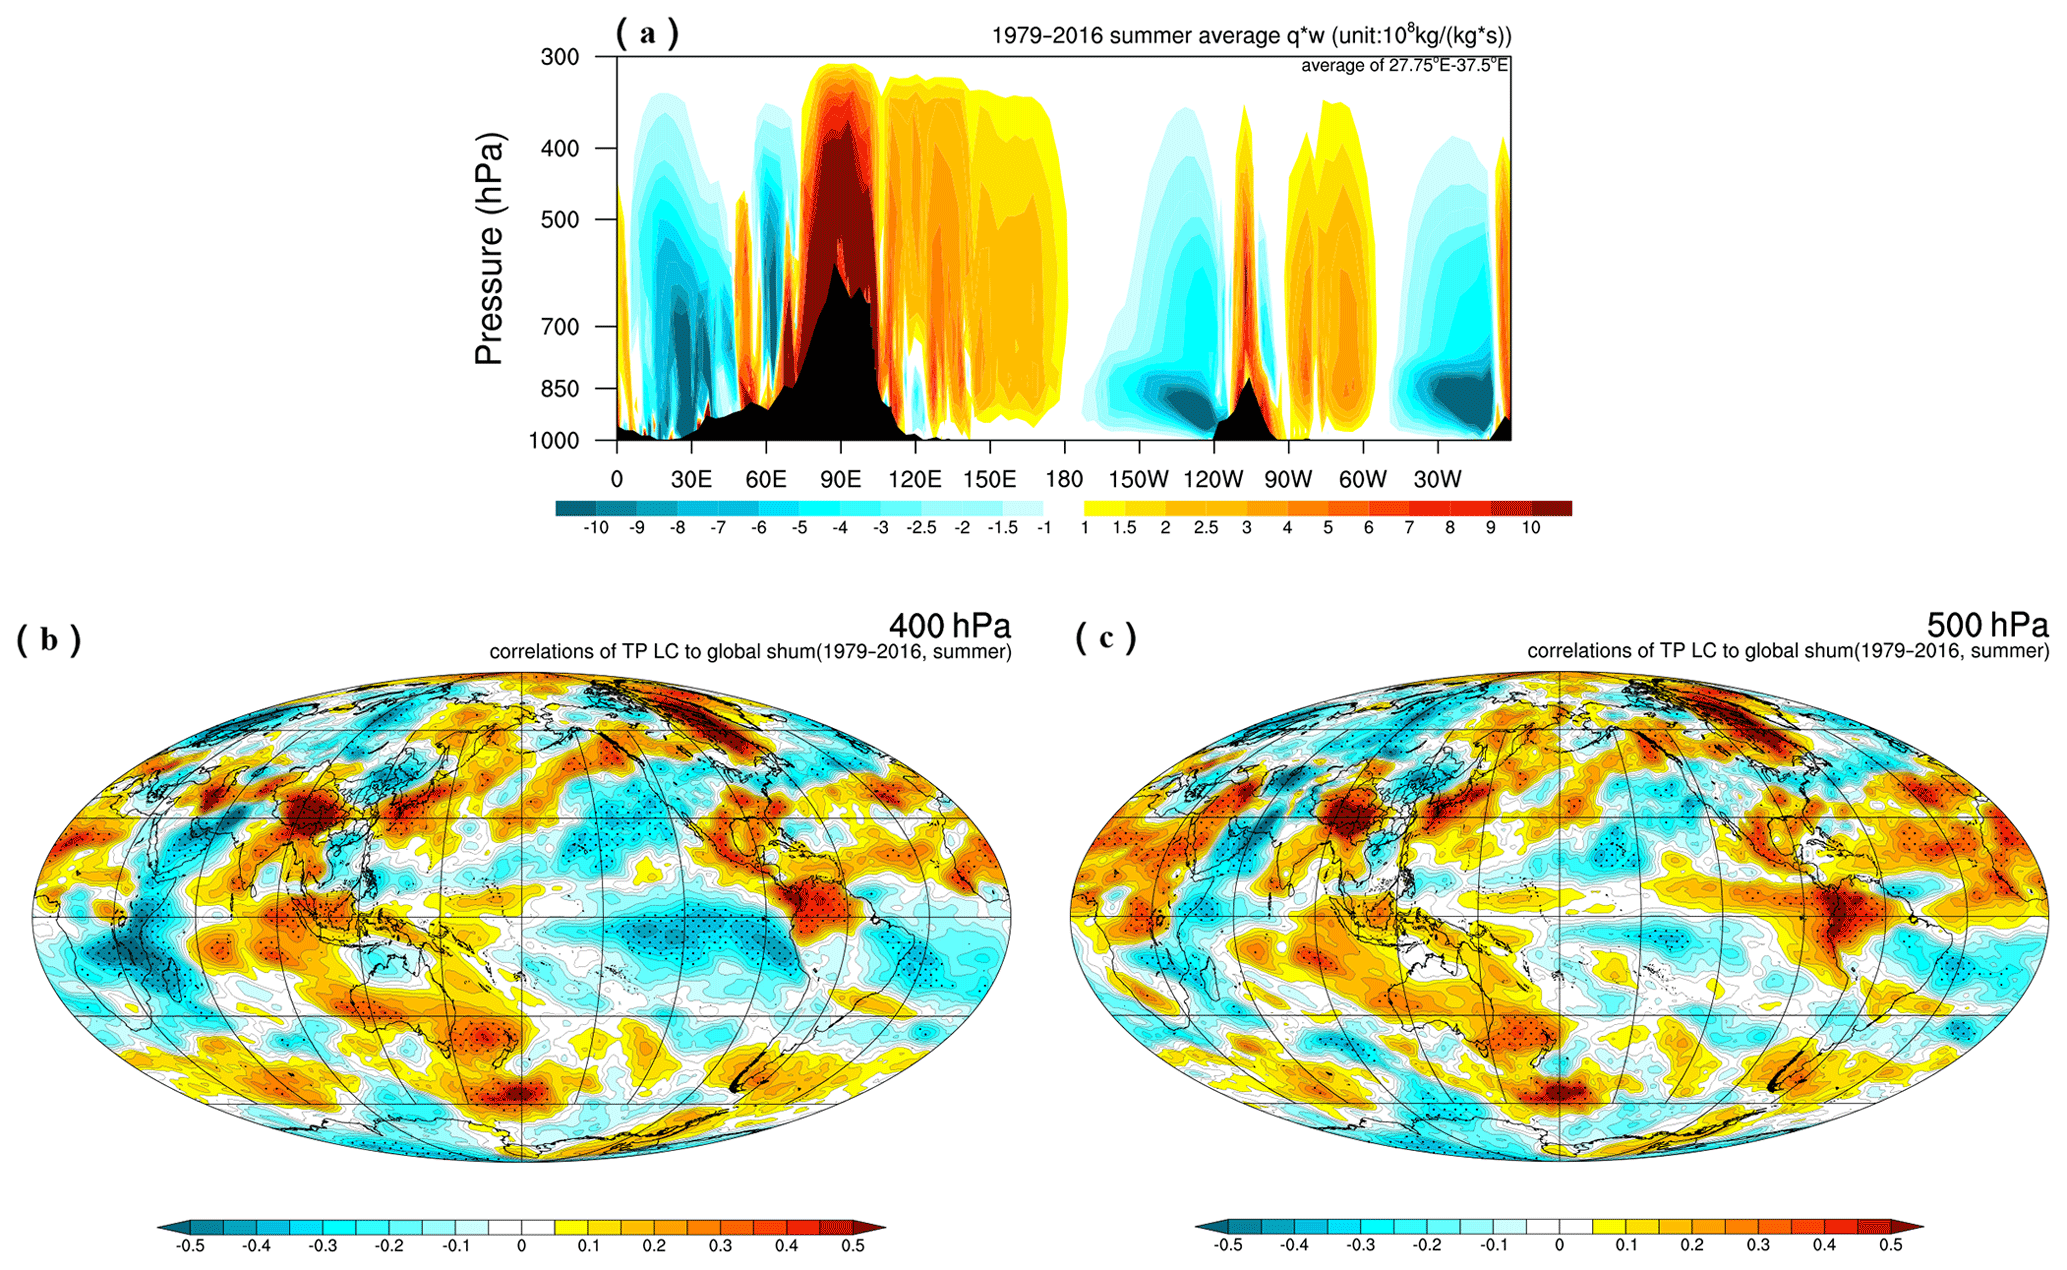
Figure 2(a) The vertical section of the vertical vapor transport flux averaged over 27.5–32.0∘ N in the summers of 1979–2016; the spatial distributions of correlation coefficients of low cloud cover over the TP with the global specific humidity (abbreviated as shum) of the ECMWF ERA-Interim data in summer (June, July and August) from 1979 to 2018 at (b) 400 and (c) 500 hPa.
The distributions of high positive correlation coefficients between low cloud cover over the TP and the global water vapor in the upper troposphere are calculated by ECMWF ERA-Interim reanalysis data (Fig. 3a). It can be found that there is a region with the highest values of correlation coefficients in the upper troposphere (500–300 hPa), covering a large banded area from the plateau across the lower-latitude tropical zone to the polar regions, indicating the significant correlations between convective cloud activities on the TP and the global water vapor in the upper troposphere, especially in the polar region of the Southern Hemisphere area (Fig. 3a), which could reflect the importance of the thermal forcing of the TP in global changes in water vapor.
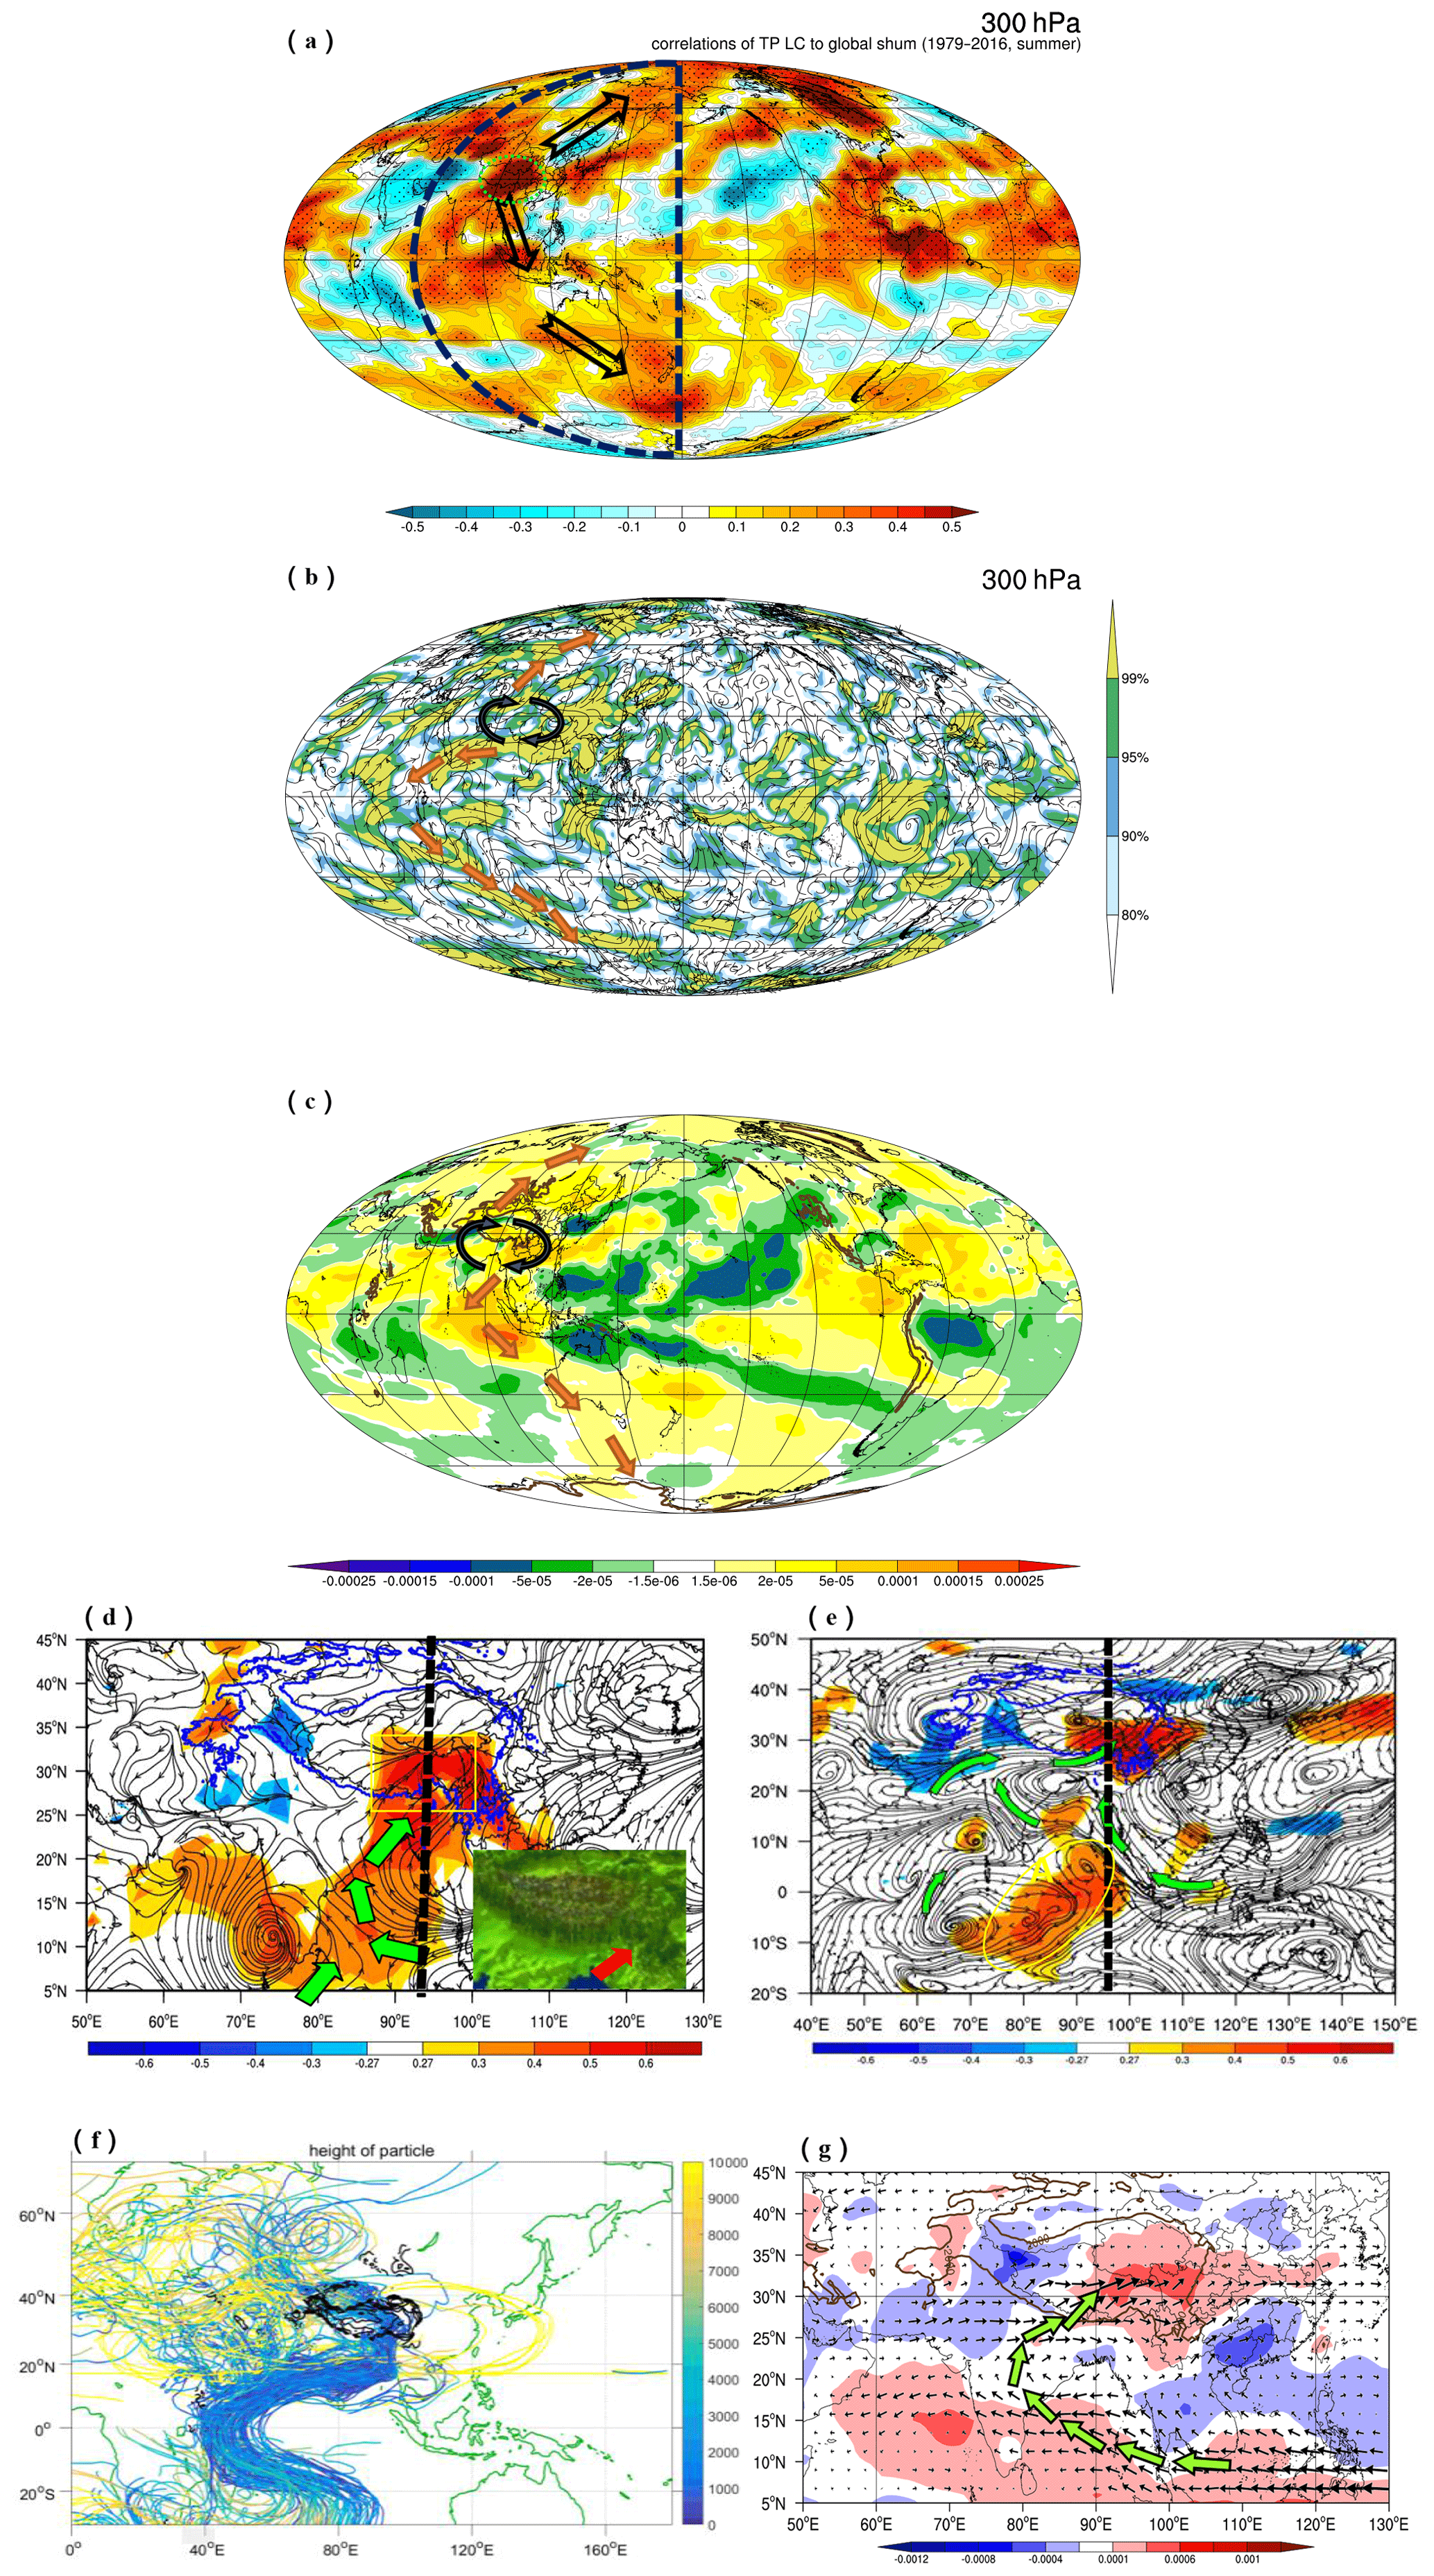
Figure 3(a) The spatial distributions of correlation coefficients of low cloud cover over the TP with the global specific humidity of the ECMWF ERA-Interim data at 300 hPa in the summers of 1979–2016 with the pathways of convective air to the troposphere. The dotted area indicates the correlation coefficient passing the the 90 % confidence level. (b) Correlation vectors of the column Q1 integrated vertically over the TP region (80–102∘ E, 30–37.5∘ N) with the 300 hPa vapor transport flux in July of 2014–2016. (c) The difference in specific humidity (shading, unit kg kg−1) at 300 hPa in summer in 1998 and 2007 with anomalously high Q1 and in 1997 and 2003 with anomalously low Q1 in the AWT. The black and orange arrows indicate the anticyclonic circulations in the TP and water vapor transport pathways from the TP to the Arctic and Antarctic regions, respectively. The correlation field between the total apparent heat source Q1 over the TP region (80–102∘ E, 30–37.5∘ N) with the water vapor (shaded) and water vapor flux (streamlines) in the surface layer (d) and middle layer (500 hPa) (e) in summer over 1979–2015. (f) The backward trajectories of water vapor transport simulated with the model FLEXPART in July 2009. (g) The difference in vapor transport flux at 500 hPa (vectors, unit g s−1 hPa−1 cm−1) and specific humidity (color contours, unit kg kg−1) between summers with anomalously high Q1 in 1998, 2005, 2007, 2008 and 2009 and with anomalously low Q1 in 1994, 1997, 2001, 2002 and 2003 over the TP.
The strong anticyclone in the upper troposphere over the southeastern TP plays a significant role in the upward transport of water vapor in the troposphere and stratosphere (Garny et al., 2016; Fu et al., 2006). In order to understand the effect of the vertical transport window of the troposphere over the TP on the global water vapor distribution from the perspective of the dynamic effect of the anticyclone over the plateau driven by the heat sources, we present the distributions of correlation coefficients between daily mean Q1 in the TP and global water vapor flux in July from 2014 to 2016 at 300 hPa (Fig. 3b). Driven by the heat source of the TP, the anticyclone is formed in the upper troposphere over the TP and surrounding regions and governs the water vapor transport from the TP not only to the surrounding area but also extending to the north and south poles along the long-range transport channels (Fig. 3b), which indicates the effect of the vertical transport window of the TP on global water vapor transport, especially over high-latitude regions such as the Arctic and Antarctic. To further verify the global transport pathways of water vapor from the TP, we used methods of composite analysis to characterize the global distribution of water vapor transport fluxes at 300 hPa in the years with anomalously high and low Q1 over the TP. The TP's anticyclone in the upper troposphere is often associated with deep convection in the troposphere (Garny et al., 2016). Figure 3c shows that in years with higher Q1, a stronger anticyclone formed at the upper troposphere (Fig. 3b), which maintains the upward transport of water vapor to the upper troposphere with strong transport of water vapor to the Arctic and Antarctic (Fig. 3c), confirming the impact of the vertical transport in the troposphere driven by heat released within the AWT in the TP on global water vapor transport especially to the polar regions.
The Indian continent heats up from spring to summer; hence the convection draws moisture northwards from the Bay of Bengal, Arabian Sea and Indian Ocean, leading to precipitation in the Himalayas and beyond (Wang et al., 2017). In Fig. 3d, it can be found that, driven by the strong apparent heat source, the water vapor flows from the low-latitude ocean can build a remarkable channel to the TP. The key entrance to the water vapor passage is just the intersection of the Himalayas on the southern slope of the TP (Xu et al., 2019). This region constitutes a special canyon pass in the plateau with deep valleys, making a perfect entrance zone for the oceanic warm wet water flows (see the terrain distribution inserted in the lower right corner of Fig. 3d).
The FLEXPART trajectory model (Stohl et al., 2005; Reale et al., 2001; James et al., 2004) was used to simulate the spatial and temporal changes in water vapor transport to the TRSR over the TP, driven with the ERA-Interim reanalysis data of meteorology with a horizontal resolution of in July 2009. In the FLEXPART particle diffusion model, the 80 000 particles were released at the TRSR (90–102∘ E and 30–35∘ N). In Fig. 3f, it can be found that the water vapor in the TRSR was traced to a water vapor source over the tropical Indian Ocean. The water vapor from the central Indian Ocean in the Southern Hemisphere can be transported along the Somali jet flow through the Arabian Sea to the TP. The water vapor from the South China Sea and the Bay of Bengal was transported to the TP, converging over the TRSR (Fig. 3f) and characterizing the water vapor transport channel from the southern hemispheric and low-latitude oceans to the TP.
According to the correlation analysis of water vapor transport, the water vapor source of the AWT can also be traced back to the ocean surface water vapor source region with a water vapor positive-correlation extreme-value region in the Chagos Archipelago of the central Indian Ocean near 10∘ S south of the Equator (Fig. 3e), revealing that the TP is the confluence area of the hemispherical water vapor from the southern Indian Ocean.
3.3 The transport window of water vapor driven by the AWT
Through the correlation analysis of the column apparent heat Q1 over the TP as well as the three-dimensional structure of vorticity and divergence, it can be found that the apparent heat source Q1 in the TP is an important forcing factor (Fig. 4). The results show that the air heat island in the AWT is located at 300–500 hPa in the upper troposphere, which is regarded as an area of high apparent heat Q1 that is significantly related to convective clouds and strong ascending movement (Fig. 4a and d). Figure 4b, c, e and f present the correlations of the column apparent heat Q1 in the AWT with the divergence and vorticity fields over the TP, which can describe the effective “suction effect” with divergence (negative vorticity) at upper levels and convergence (positive vorticity) at lower levels in the troposphere. Significantly, Q1 is released in the convective clouds and strong ascending movement, and there exists a strong anticyclonic circulation in the upper troposphere over the region of the AWT in the southeast of the plateau (Fig. 3b). In addition, the lower troposphere is a center of strong convergence and strong vorticity. Figure 3g shows the difference in vapor transport flux and specific humidity at 500 hPa in summer between anomalously high and anomalously low Q1. When the Q1 in the TRSR is anomalously high, a large amount of water vapor from the tropical oceans is transported across the Bay of Bengal and the Indian peninsula and enters the TP from the southern edge, revealing the TP's thermal effect could make a strong vapor transport channel connecting to the water vapor source in the low-latitude tropical oceans.
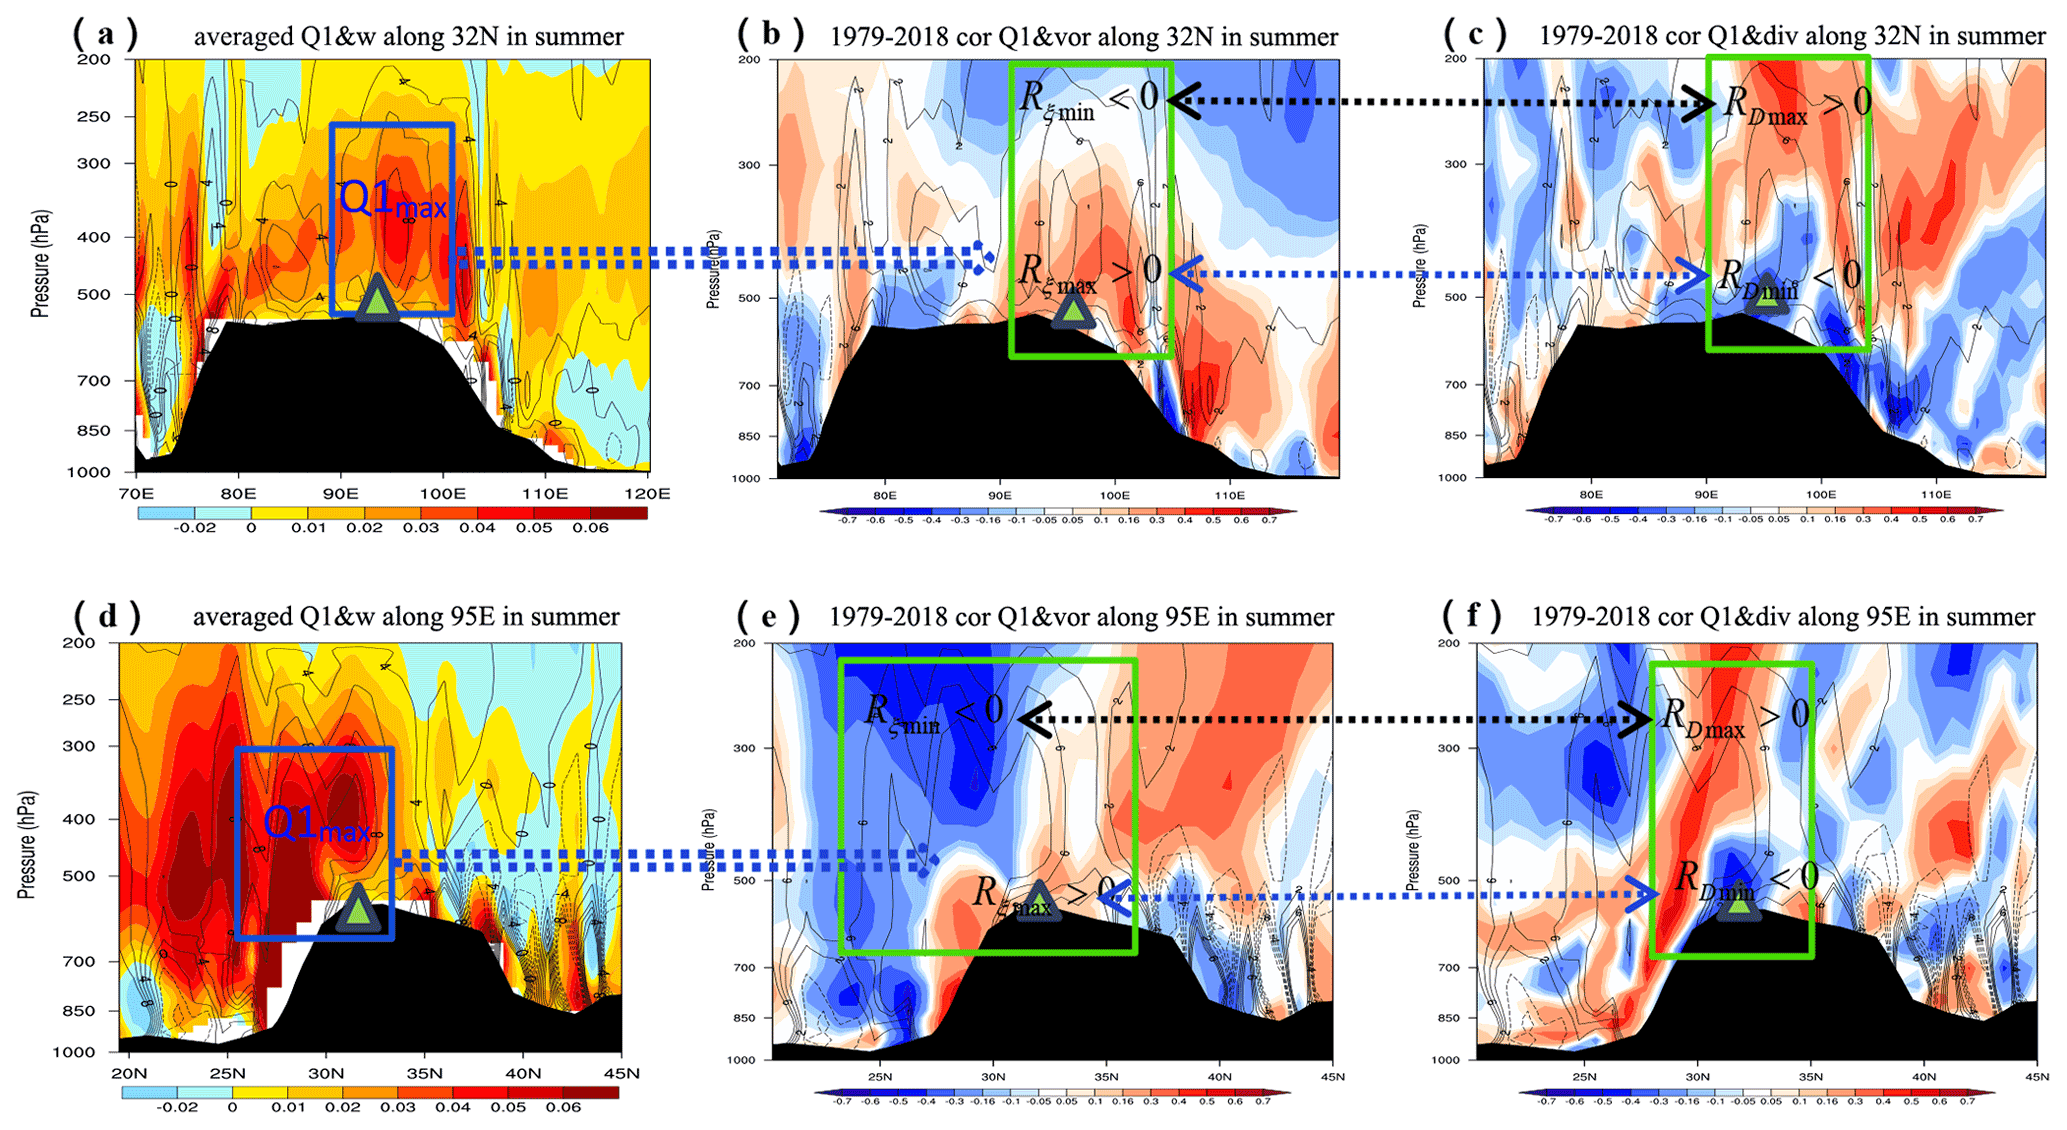
Figure 4The vertical sections of (a, d) vertical motion (contours, in units of 10−2 Pa s−1) and Q1 (color contours, in units of 10−3 w kg−1), (b, e) vertical motion (contours, in units of 10−2 Pa s−1) and correlation coefficients (color contours) between Q1 and the vorticity, and (c, f) vertical motion (contours, in units of 10−2 Pa s−1) and the correlation coefficients between Q1 and the divergence (contours) in the TP, with (a), (b) and (c) along 32∘ N and (d), (e) and (f) along 95∘ E. The green triangles indicate the AWT core region.
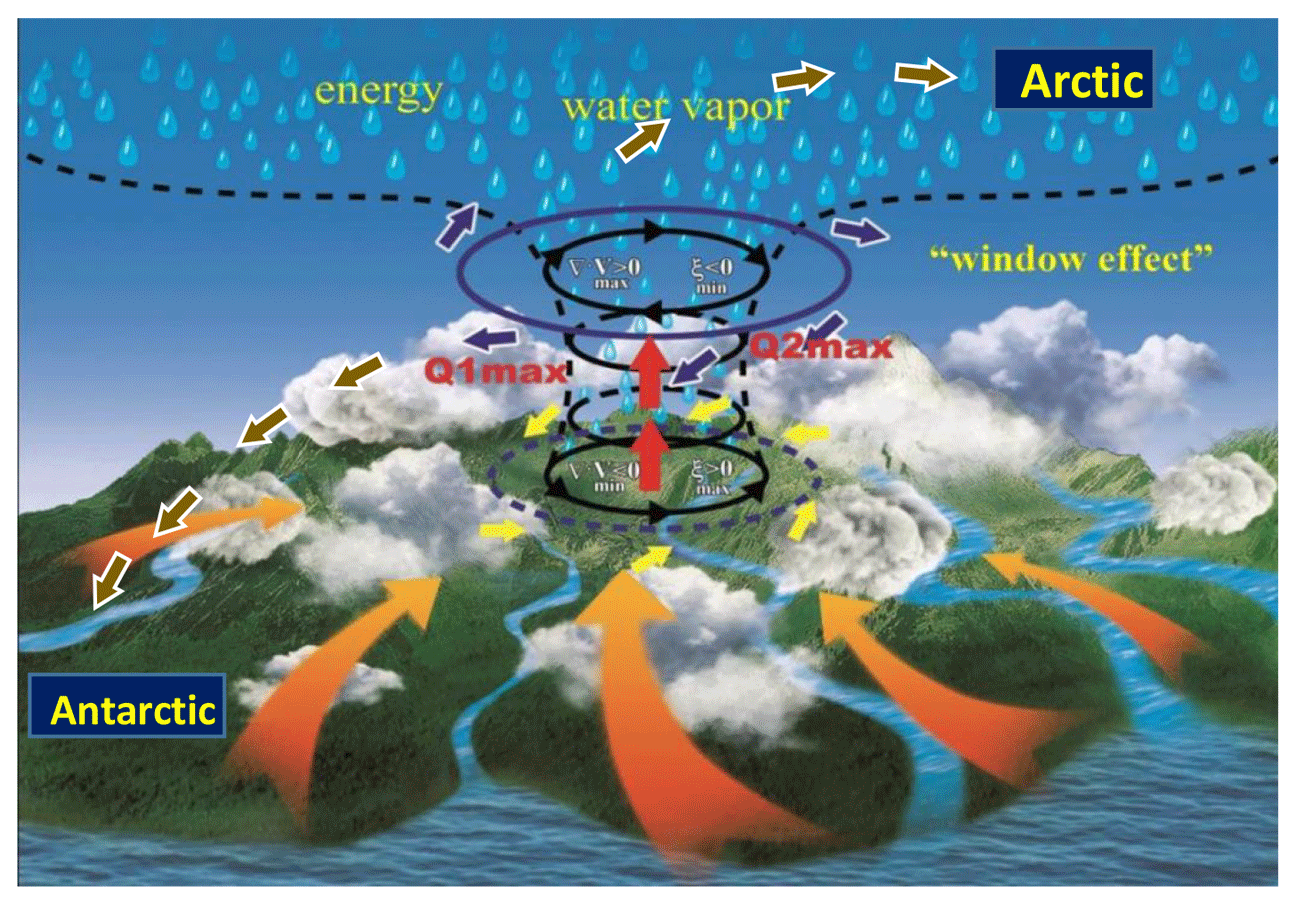
Figure 5A diagram of vertical water vapor transport in the troposphere driven by the thermal forcing of the AWT over the TP, where the vertical transport window of water vapor in the troposphere connects globally the water vapor transport from the tropical oceans and the southern Indian Ocean in the lower troposphere with transport to the Arctic and Antarctic regions in the upper troposphere.
All these results reveal the effective “pumping effect” of the vertical configuration with low-level cyclonic circulation and high-level divergence with anticyclonic circulation over the TP. The strong confluence effect building the vertical transport window of water vapor could be driven by the elevated heating on the TP in the troposphere with the water vapor flow, making a strong vapor transport connecting the water vapor source in the low-latitude oceans with the high-water-vapor center over the core area of the AWT over the TP. The water vapor transport connects from the vertical transport window over the TP to the Arctic and Antarctic regions in the upper troposphere, highlighting the effect of the TP “hollow wet pool” on global climate change.
By using the multi-source data of meteorology over recent decades, this study discovered a summertime hollow wet pool in the troposphere with a center of high water vapor over the AWT on the highly elevated TP, which is indicated by a vertical transport window with the transport flux of water vapor in the troposphere. Driven by the TP's strong heat source, water vapor flows connect the AWT over the TP with the low-latitude oceans. Significant correlations exist between convective activities on the TP and global water vapor in the upper troposphere. The water vapor transport from the TP's vertical window in the upper troposphere extends from the TP globally towards the Northern Hemisphere and Southern Hemisphere with significant connections among the three poles of the Arctic, Antarctic and TP regions, highlighting the effect of the TP's vertical transport window of water vapor on global climate change. The vertical transport window is built by the AWT's thermal forcing in association with the dynamic effect of the TP's “hollow heat island” as well as the effective pumping effect on vertical transport with low-level convergences with cyclonic circulation and upper-level divergences with anticyclonic circulation in the troposphere over the TP.
Based on this observational study, a conceptual model of the comprehensive relation of the TP region with the global energy and water cycles is put forward for the vertical transport window of vapor in the troposphere driven by the thermal forcing in the core region of the AWT over the TP (Fig. 5), where the water vapor source is traced back to tropical oceans and the Southern Hemisphere. The thermal effect of the TP could sustain the vertical upward transport of the energy and water vapor. The water cycle in the AWT clearly displays the linkages of the vertical transport window of water vapor in the troposphere over the TP with the vapor source in the tropical oceans and the southern Indian Ocean in the lower troposphere and with the Arctic and Antarctic regions in the upper troposphere (Fig. 5). Our study depicts a comprehensive understanding of the vertical water vapor transport in the atmosphere over the TP with important implications for global climate change.
ERA-Interim reanalysis daily and monthly data are part of the European Center for Medium-Range Weather Forecasts (https://apps.ecmwf.int/datasets/data/interim-full-daily/levtype=pl/, last access: 31 December 2019, ECMWF, 2019a, and https://apps.ecmwf.int/datasets/data/interim-full-moda/levtype=pl/, last access: 31 December 2019, ECMWF, 2019b). The global total water vapor is collected from Goddard Earth Sciences Data and Information Services Center (https://doi.org/10.5067/Aqua/AIRS/DATA303, last access: 29 June 2019, AIRS Science Team/Joao Teixeira, 2013). The low-cloud data used in this study are derived from the data sets of surface meteorological elements in China released by the National Meteorology Information Center, China Meteorological Administration and can be found at https://zenodo.org/record/5121157#.YPkRHqjitPY (Sun, 2021).
XX, CS and TZ conducted the study design. DC, JX and SZ analyzed the observational data. JL, BC, YZ, HX, LD, XS and YZ assisted with data processing. XX, CS and TLZ wrote and revised the manuscript. XX, CS, TZ and JX were involved in the scientific interpretation and discussion. All authors provided commentary on the paper.
The contact author has declared that neither they nor their co-authors have any competing interests.
Publisher's note: Copernicus Publications remains neutral with regard to jurisdictional claims in published maps and institutional affiliations.
The authors acknowledge support from the Second Tibetan Plateau Scientific Expedition and Research (STEP) program and the S&T Development Fund of CAMS. We would like to thank the editor and the two anonymous reviewers for their suggestions on restructuring the initial draft.
This study was supported by the Second Tibetan Plateau Scientific Expedition and Research (STEP) program (2019QZKK0105) and the S&T Development Fund of CAMS (2021KJ022 and 2021KJ013).
This paper was edited by Jianping Huang and reviewed by two anonymous referees.
AIRS Science Team/Joao Teixeira: AIRS/AquaL3 Daily Standard Physical Retrieval (AIRS-only) V006, Greenbelt, MD, USA, Goddard Earth Sciences Data and Information Services Center (GES DISC), https://doi.org/10.5067/Aqua/AIRS/DATA303, 2013.
Chen, B., Xu, X. D., Yang, S., and Zhao, T. L.: Climatological perspectives of air transport from atmospheric boundary layer to tropopause layer over Asian monsoon regions during boreal summer inferred from Lagrangian approach, Atmos. Chem. Phys., 12, 5827–5839, https://doi.org/10.5194/acp-12-5827-2012, 2012.
Dessler, A. and Sherwood, S.: Effect of convection on the summertime extratropical lower stratosphere, J. Geophys. Res., 109, D23301, https://doi.org/10.1029/2004JD005209, 2004.
ECMWF: ERA Interim, Daily, ECMWF [data set], available at: https://apps.ecmwf.int/datasets/data/interim-full-daily/levtype=pl/, last access: 31 May 2019a.
ECMWF: ERA Interim, Monthly Means of Daily Means, ECMWF [data set], available at: https://apps.ecmwf.int/datasets/data/interim-full-moda/levtype=pl/, last access: 31 May 2019b.
Feng, L. and Zhou, T.: Water vapor transport for summer precipitation over the Tibetan Plateau:Multidata set analysis, J. Geophys. Res., 117, D20114, https://doi.org/10.1029/2011JD017012, 2012.
Fu, R., Hu, Y., Wright, J., Jiang,J., H., Dickinson, R., E., Chen, M., X., Filipiak, M., Read, W., G., Waters, W., W., and Wu, D., L.: Short circuit of water vapor and polluted air to the global stratosphere by convective transport over the Tibetan Plateau, P. Natl. Acad. Sci. USA, 103, 5664–5669, https://doi.org/10.1073/pnas.0601584103, 2006.
Gao, Y., Cuo, L., and Zhang, Y.: Changes in Moisture Flux over the Tibetan Plateau during 1979–2011 and Possible Mechanisms, J. Clim., 27, 1876–1893, https://doi.org/10.1175/JCLI-D-13-00321.1, 2014.
Garny, H. and Randel, W. J.: Transport pathways from the Asian monsoon anticyclone to the stratosphere, Atmos. Chem. Phys., 16, 2703–2718, https://doi.org/10.5194/acp-16-2703-2016, 2016.
James, P., Stohl, A., Spichtinger, N., Eckhardt, S., and Forster, C.: Climatological aspects of the extreme European rainfall of August 2002 and a trajectory method for estimating the associated evaporative source regions, Nat. Hazards Earth Syst. Sci., 4, 733–746, https://doi.org/10.5194/nhess-4-733-2004, 2004.
James, R., Bonazzola, M., Legras, B., Surbled, K., and Fueglistaler, S.: Water vapor transport and dehydration above convective outflow during Asian monsoon, Geophys. Res. Lett., 35, L20810, https://doi.org/10.1029/2008GL035441, 2008.
Luo, Y., Zhang, R., Qian, W., Luo, Z., and Hu, X.: Intercomparison of deep convection over the tibetan plateau–asian monsoon region and subtropical north america in boreal summer using cloudsat/calipso data, J. Clim., 24, 2164–2177, 2011.
Randel, W. J. and Jensen, E. J.: Physical processes in the tropical tropopause layer and their roles in a changing climate, Nat. Geosci., 6, 169–176, https://doi.org/10.1038/ngeo1733, 2013.
Reale, O., Feudale, L., and Turato, B.: Evaporative moisture sources during a sequence of floods in the Mediter-ranean region, Geophys. Res. Lett., 28, 2085–2088, 2001.
Solomon, S., Rosenlof, K. H., Portmann, R. W., Daniel, J. S., Davis, S. M., Sanford, T. J., and Plattner, G. K.: Contributions of stratospheric water vapor to decadal changes in the rate of global warming, Science, 327, 1219–1223, https://doi.org/10.1126/science.1182488, 2010.
Su, H., Read, W., Jiang, J. H., Waters, J. W., and Fetzer, E. J.: Enhanced positive water vapor feedback associated with tropical deep convection: New evidence from Aura MLS, Geophys. Res. Lett., 33, L05709, https://doi.org/10.1029/2005GL025505, 2006.
Sun, C.: Low Cloud Amount, Zenodo [data set], https://doi.org/10.5281/zenodo.5121157, 2021.
Stohl, A., Forster, C., Frank, A., Seibert, P., and Wotawa, G.: Technical note: The Lagrangian particle dispersion model FLEXPART version 6.2, Atmos. Chem. Phys., 5, 2461–2474, https://doi.org/10.5194/acp-5-2461-2005, 2005.
Tian, B., Soden, B., and Wu, X.: Diurnal cycle of convection, clouds, and water vapor in the tropical upper troposphere: Satellites versus a general circulation model, J. Geophys. Res.-Atmos., 27, 2173–2176, https://doi.org/10.1029/2003JD004117, 2004.
Tian, W. S., Chipperfield, M., and Lü, D. R.: Impact of increasing stratospheric water vapor on ozone depletion and temperature change, Adv. Atmos. Sci., 26, 423–437, https://doi.org/10.1007/s00376-009-0423-3, 2009.
Wang, Y., Zhang, Y., Chiew, F., McVicar, T. R., Zhang, L., Li, H., and Qin, G.: Contrasting runoff trends between dry and wet parts of eastern Tibetan Plateau, Sci. Rep. UK, 7, 15458, https://doi.org/10.1038/s41598-017-15678-x, 2017.
Xie, F., Zhou, X., Li, J., Chen, Q., Zhang, J., Li, Y., Ding, R., Xue, J., and Ma, X.: Effect of the Indo-Pacific Warm Pool on lower stratospheric water vapor and comparison with the effect of the El Niño–Southern Oscillation, J. Clim., 31, 929–943, https://doi.org/10.1175/JCLI-D-17-0575.1, 2018.
Xu, K., Zhong, L., Ma, Y., Zou,M., and Huang, Z.: A study on the water vapor transport trend and water vapor source of the Tibetan Plateau, Theor. Appl. Climatol., 140, 1031–1042, https://doi.org/10.1007/s00704-020-03142-2, 2020.
Xu, X., Lu, C. Shi, X., and Gao, S.: World water tower: An atmospheric perspective, Geophys. Res. Lett., 35, L20815, https://doi.org/10.1029/2008GL035867, 2008.
Xu, X., Zhao, T., Lu, C., Guo, Y., Chen, B., Liu, R., Li, Y., and Shi, X.: An important mechanism sustaining the atmospheric “water tower” over the Tibetan Plateau, Atmos. Chem. Phys., 14, 11287–11295, https://doi.org/10.5194/acp-14-11287-2014, 2014.
Xu, X., Dong, L., Zhao, Y., and Wang, Y.: Effect of the Asian Water Tower over the Qinghai-Tibet Plateau and the characteristics of atmospheric water circulation, Chin. Sci. Bull., 64, 2830–2841, https://doi.org/10.1360/TB-2019-0203, 2019.
Yanai, M., Esbensen, S., and Chu, J. H.: Determination of bulk properties of tropical cloud clusters from large-scale heat and moisture budgets, J. Atmos. Sci., 30, 611–627, https://doi.org/10.1175/1520-0469(1973)030<0611:DOBPOT>2.0.CO;2, 1973.
windowof vapor in the troposphere. The effects of the TP's vertical transport window of vapor are of importance in global climate change.