the Creative Commons Attribution 4.0 License.
the Creative Commons Attribution 4.0 License.
 | 02 Sep 2022
Chemical evolution of secondary organic aerosol tracers during high-PM2.5 episodes at a suburban site in Hong Kong over 4 months of continuous measurement
Qiongqiong Wang
Shan Wang
Yuk Ying Cheng
Hanzhe Chen
Zijing Zhang
Jinjian Li
Secondary organic aerosol (SOA) makes a sizable contribution to fine-particulate-matter (PM2.5) pollution, especially during high-PM episodes. Past studies of SOA evolution at the episode scale mainly rely on measurements of bulk SOA mass, with few studies probing individual SOA molecular tracers. In this study, we continuously monitored (at a bi-hourly resolution) SOA tracers specific to a few common volatile organic compound (VOC) precursors at a suburban site in Hong Kong for a 4-month period from the end of August to December 2020. The SOA molecules include tracers for SOA derived from biomass burning (BB) emissions, monoaromatics, naphthalene/methylnaphthalenes, and three biogenic VOCs (isoprene, monoterpene, and sesquiterpene). Generally, the SOA tracers showed regional characteristics for both anthropogenic and biogenic SOA as well as for the BB-derived SOA. This work focused on the seasonal variation and evolution characteristics of SOA tracers during 11 city-wide PM2.5 episodes, which are defined as periods with PM2.5 concentrations exceeding 35 µg m−3 at 3 or more of the 15 general air quality monitoring stations cross the city. Mass increment ratios (MIR), calculated as the ratio of the mass concentration prior to an episode to that during an episode, were examined for individual species during each episode. During most episodes, the SOA tracer concentrations were enhanced (i.e. MIR >1), and the maximum MIR values were in the range of 5.5–11.0 for SOA tracers of different precursors. Episodes on summer and fall days showed notably larger MIR values than those falling on winter days, indicating the higher importance of SOA to the formation of summer/fall PM2.5 episodes. Simultaneous monitoring of six tracers for isoprene SOA revealed the dominance of the low-NOx pathway in forming isoprene SOA in our study region. The multiple monoterpene SOA products suggested fresher SOA in winter, evidenced by the increased presence of the early-generation products. Thus, the current study has shown by example the precursor-specific SOA chemical evolution characteristics during PM2.5 episodes in different seasons. This study also suggests the necessity to apply high-time-resolution organic marker measurement at multiple sites in order to fully capture the spatial heterogeneity of haze pollution at the city scale.
- Article
(5263 KB) - Full-text XML
-
Supplement
(3244 KB) - BibTeX
- EndNote


The past 2 decades have seen the air quality in China substantially improve following the implementation of a series of stringent emission controls. Long-term trend analysis suggests the clear reduction of fine particulate matter (PM2.5) in major city clusters in China, such as Beijing–Tianjin–Hebei (BTH), the Yangtze River Delta (YRD), and the Pearl River Delta (PRD) regions (e.g. Wang et al., 2016; Y. Wang et al., 2020). However, short-term episodic PM events have still been frequently observed in recent years, especially in fall and winter. Short-term exposure to high levels of PM2.5 during these episodes is associated with adverse health effects, especially for sensitive subgroups (Zanobetti et al., 2000). The causes of high-PM episodes differ from one geographical location to another due to location-specific emission sources and meteorological conditions. Thus, one needs to acquire knowledge about the chemical composition and formation mechanism of the PM during episodes in order to formulate location-specific effective PM control measures.
Hong Kong (HK), which has an area of about 1100 km2, is located at the tip of the PRD in southern China and is influenced by anthropogenic emissions generated locally as well as those transported from the other parts of the PRD and northern China under the influence of the subtropical monsoon. PM pollution has been observed to have a clear seasonal pattern, with lower concentrations in summer and higher concentrations in fall and winter (Huang et al., 2014). In summer, oceanic air masses from the south dominate, bringing cleaner air, and local sources play an important role; in fall and winter, in comparison, northerly winds prevail, transporting pollutants from the inland areas to HK. An increasing trend in the atmospheric oxidation capacity has been observed in this region, signified by the increasing trend of the surface ozone concentration from 2006 to 2019 (Li et al., 2022).
Previous continuous measurements in HK and elsewhere have mainly been based on high-time-resolution online mass spectrometry, such as aerosol mass spectrometer (AMS) or aerosol chemical species monitor (ACSM) measurements. In these prior studies, the bulk organic aerosol (OA) has been quantified and further separated into subgroups of OA according to the degree of oxidation and broad source origins, such as primary organic aerosol (POA) – including hydrocarbon-like organic aerosol (HOA), cooking organic aerosol (COA), and biomass burning organic aerosol (BBOA) – and oxygenated organic aerosol (OOA) – including semi-volatile oxygenated organic aerosol (SVOOA) and low-volatility oxygenated organic aerosol (LVOOA). For example, Lee et al. (2015) and Sun et al. (2016) examined the chemical characteristics of PM1 at a roadside station in HK in 2013 and pointed out the importance of COA and HOA contributions to the PM level in this urban roadside environment. Li et al. (2015) examined the seasonal characteristics of PM1 at a suburban site in HK from April 2011 to March 2012 and found that the annual chemical composition of PM1 in HK was dominated by organic matter (OM) and sulfate and that the background OM was mainly from secondary origins. Their study also emphasized the influence of air mass origins on the seasonal characteristics of the PM composition. Furthermore, Qin et al. (2016) examined the evolution of PM characteristics during episodes across the seasons using four 1-month campaigns in 2011 at the same site, and they identified three types of episodes: liquid-water-content episodes, high-solar-irradiance episodes, and long-range-transport episodes. Their study revealed that both regional transport and secondary formation contributed to high PM levels during the episodes at this site. However, specific molecular information was not available from those studies, which relied on AMS or ACSM data, making it difficult to extract precursor-specific information.
Different from AMS or ACSM, thermal desorption aerosol gas chromatograph–mass spectrometers (TAG) continuously monitor individual organic compounds in ambient aerosol, including secondary organic aerosol (SOA) products derived from specific volatile organic compound (VOC) precursors. The precursor-specific SOA tracers can provide valuable molecular-level insight into the SOA formation processes and source origins. Important VOC precursors include major biogenic VOCs (i.e. isoprene, monoterpene and sesquiterpene) and anthropogenic aromatics such as benzene and toluene. Recent studies have also suggested that phenol or substituted phenol, intensively emitted during biomass burning (BB), can produce 4-nitrocatechol via reactions with OH under moderate NOx conditions. Thus, 4-nitrocatechol can serve to indicate BB-derived SOA formation (Finewax et al., 2018). The formation mechanism of these VOC-specific SOA tracers has been well documented in smog chamber studies (e.g. Claeys et al., 2004; Jaoui et al., 2007). For example, isoprene, the most abundant biogenic VOC at the global scale, forms various products via different formation pathways, and the product distribution varies with the atmospheric conditions. Under low-NOx conditions, isoprene reacts with OH and HO2 radicals and produces isoprene epoxydiols, subsequently leading to the formation of 2-methyltetrols and C5-alkene triols in aerosol. Under high-NOx conditions, isoprene reacts with the OH radical and NOx, producing methacrylic acid epoxide, subsequently leading to the formation of the high-NOx product 2-methylglyceric acid in aerosol. Monoterpene oxidation products contain both the early-generation products (e.g. pinic acid) and the later-generation products (e.g. 3-methyl-1,2,3-butanetricarboxylic acid – 3-MBTCA) (e.g. Szmigielski et al., 2007). The ratio of pinic acid to 3-MBTCA can be used to indicate the ageing of monoterpene SOA (Ding et al., 2012).
To date, due to the limited availability of the TAG systems, quantification of SOA tracers under field conditions has been primarily carried out via off-line filter samples and subsequent laboratory gas chromatography–mass spectrometry (GC-MS) or liquid chromatography–mass spectrometry (LC-MS) measurements (e.g. Chow et al., 2016; Hu et al., 2008). Field studies relying on filter-based tracer measurements mainly focus on the variation characteristics of the SOA products, the influential factors of SOA formation on the seasonal temporal scale, and comparing spatial variations (Ding et al., 2012, 2016; Hu et al., 2008). The inherent low time resolution of the off-line filter measurements hinders the understanding of the chemistry and formation mechanism at an hourly temporal scale. In this study, we report a series of SOA tracers measured by TAG at a bi-hourly temporal resolution at a suburban site in HK from the end of August to December 2020. The objective of this work is to investigate the chemical evolution of SOA tracers originating from biomass burning and from anthropogenic and biogenic emissions during city-wide high-PM2.5 episodes across different seasons. The results of this study will help refine control strategies for future air quality improvement in HK and shed light on the precursor–SOA product dynamics for atmospheric environments experiencing mixed urban–regional pollution conditions, similar to our study location.
The Hong Kong University of Science and Technology (HKUST) supersite is located on the HKUST campus, which is situated on the hillside of Clear Water Bay on the east coast of Sai Kung, New Territories, HK (22.33∘ N, 114.27∘ E). The site is in a low-density residential neighbourhood. The nearby commercial and urban centres are 5–10 km away. There are few local emission sources around, except for a construction site and a small canteen in the vicinity. During the study period, due to the pandemic, cooking activities were reduced to a minimum. The construction activities did not emit organic-rich particles and, thus, did not influence the measurement of organic species. Therefore, the sampling site can be considered a background site in HK.
In this study, we focus on the comprehensive chemical speciation measurements conducted at the HKUST supersite during the period from 30 August to 31 December 2020. Bi-hourly organic molecular markers were measured every even hour by the Aerodyne TAG stand-alone system coupled to an Agilent gas chromatograph–mass spectrometer (GC-MS; GC 7890B-MS 5977B). A detailed description of the instrument can be found in our previous work (He et al., 2020; Q. Wang et al., 2020). The TAG is capable of measuring over 100 different semi-volatile organic species, including both non-polar (e.g. alkanes; polyaromatic hydrocarbons, PAHs; and hopanes) and polar species (e.g. saccharides, aromatic acids, and carboxylic acids), in the aerosol phase. Among these individual TAG-measured organics, we select to examine the abundant VOC-specific SOA tracers, including six isoprene SOA tracers, six monoterpene SOA tracers, one sesquiterpene SOA tracer, one monoaromatic SOA tracer, one naphthalene/methylnaphthalene SOA tracer, one BB-derived SOA tracer, and one BB-sourced POA tracer (i.e. levoglucosan). Levoglucosan, 4-nitrocatechol, phthalic acid, and pinonic acid, which have available authentic standards, were identified and quantified by directly comparison to their standards. The remaining SOA tracers, which do not have authentic standards, were identified by comparing their ambient mass spectra to previously reported data (Al-Naiema and Stone, 2017; Claeys et al., 2004; Jaoui et al., 2007; Szmigielski et al., 2007), and they were then quantified using surrogate compounds that have similar structures and functional groups. The retention time and quantification ions of each species are shown in Fig. S1 in the Supplement.
In addition to the TAG-measured individual organic compounds, other PM2.5-related measurements include hourly PM2.5 mass concentrations measured by a SHARP monitor (Model 5030i; Thermo Fisher Scientific), major inorganic ions (sulfate, nitrate, ammonium, and chloride) measured by a monitor for aerosols and gases in ambient air (MARGA 1S; Metrohm AG), carbonaceous components (organic carbon, OC, and elemental carbon, EC) measured by a semi-continuous OC/EC analyser (model RT-3179; Sunset Laboratory Inc.), and elemental species measured by an online X-Ray fluorescence spectrometer (Xact 625i ambient continuous multi-metals monitor; Cooper Environmental Services). The biogenic and aromatic VOC precursors, including isoprene, α-pinene, and BTEX (benzene, toluene, ethylbenzene, and xylene), were sampled using stainless canisters and analysed using a gas chromatograph coupled to a flame ionization detector (FID), electron capture detector (ECD), and mass selective detector (GC-FID/ECD/MSD), with sample collection occurring at 09:00, 12:00, and 15:00 LT (UTC+8) every day. Gas pollutants, including O3, SO2, and NOx, were measured by the gas analysers. Meteorological parameters, including solar radiance, relative humidity (RH), temperature, precipitation, mixing height, and wind data, were measured by the 10 m automatic weather station (AWS) tower at the sampling site.
The air quality monitoring network in HK is operated by the Hong Kong Environment Protection Department (HKEPD). The city-wide network consists of 15 general stations and 3 roadside stations. Among the 15 general stations, 10 are in New Territories (NH, ST, TP, YL, TM, TC, TW, KC, TK, and MB), 2 are in Kowloon (SP and KT), and 3 are on Hong Kong Island (CW, EN, and SN). One station (MB – Tap Mun) is a rural background site located on an isolated grass island in north-eastern HK, and the others are either new town or urban stations with different microenvironments. A detailed description of the individual site characteristics is shown in Text S1 in the Supplement. The hourly PM2.5 mass concentrations from the 15 stations were retrieved from the HKUST supersite database (http://envf.ust.hk/dataview/metplot/current/index.py, last access: 3 June 2021) and used for this work.
Hourly PM2.5 mass concentrations and RH data at the HKUST supersite were biased during the studied time period. Therefore, we applied a correction, and the details are shown in Text S2. PM2.5 and gas pollutant data at the HKUST supersite were only available after September 2020; hence, data from a similar rural station (MB – Tap Mun, 10 km from the HKUST supersite) were used as a surrogate for days before September 2020 (Fig. S6).
3.1 Classification of PM episodes and their spatial variability
Generally, a city-wide high-PM episode is of more public concern than pollution at a single station. To examine PM pollution throughout the city, we evaluated the hourly PM2.5 data across the 15 HKEPD general air quality monitoring stations. The HKUST observation period spans from 30 August to 31 December 2020; thus, we examined air quality data at the 15 HKEPD stations from 10 July to 31 December 2020. The upper-level wind direction as well as the sea level pressure and dew point date were used to determine the dates by which the seasons were divided (Yu, 2002); the details are given in the Supplement (Text S3). Specifically, the study period spanned three seasons: summer (10 July—7 October), fall (8 October–28 November), and winter (29 November–31 December). Generally, the PM2.5 concentration varied synchronously among different sites, regardless of whether they were urban or background sites, with Pearson correlation coefficients (Rp) ranging from 0.71 to 0.92 during the non-episode period, suggesting the regional characteristics of PM pollution in HK (Fig. S4).
In this work, we define the occurrence of a PM2.5 pollution episode as a PM2.5 concentration higher than 35 µg m−3 for at least 6 consecutive hours at three or more stations. This value (35 µg m−3) is the current annual PM2.5 air quality objective set by the Hong Kong government, which aligns with the World Health Organization (WHO) Interim Target 1 annual PM2.5 concentration value (WHO, 2021). Using this screening criterion, 11 PM episodes were identified in this study: one in summer (EP1), five in fall (EP2–EP6), and five in winter (EP7–EP11). Table 1 lists the statistical summary of the PM2.5 averages during episode and non-episode periods, the meteorological conditions, and the gas pollutants (O3 and NOx) during the examined period (10 July–31 December 2020). Among the identified episodes, five were short episodes, lasting less than 1 d (three of which primarily occurred at night-time – denoted as EP6N, EP7N, and EP11N), and the rest lasted for much longer, ranging from 1 d to 1 week. The highest PM2.5 pollution was observed during EP1 in summer, and the city-wide average concentration was 37.6 µg m−3 during this episode. The lowest PM2.5 pollution occurred during EP9 in winter (28.4 µg m−3). The PM level during episodes was more than 2 times higher than the non-episode average (12.5 µg m−3). Wind speeds were generally higher than 2 m s−1 during the PM episodes, except for during EP1 and EP6N. A high concentration of O3 was observed during EP1–EP6 and EP10, indicating a higher atmospheric oxidation capacity. EP11N showed high concentrations of NOx, which may be attributed to enhanced local vehicle emissions.
Figure 1 shows the spatial variation in the average PM2.5 concentration during individual episodes as well as during the remaining non-episode hours. The maximum-to-minimum (max-to-min) ratio in Table 1 shows the difference in the PM level across the 16 stations by normalizing the maximum average PM concentration against the minimum PM average among the 16 stations for each episode. A ratio close to 1 suggests the uniformity of PM pollution across the whole city, whereas a larger ratio indicates a spatial gradient in PM pollution. A ratio of 1.6 was observed for non-episode periods, with the following spatial pattern being observed: north-western stations (e.g. TM, YL, and TW) > central stations (e.g. KT, TP, and NH) > eastern/south-eastern stations (e.g. TK and SN) (Fig. 1). This pattern suggests the consistent influence of regional transport from the northern PRD region to HK. Episodes during summer to early fall (i.e. EP1–EP4) showed a slightly lower max-to-min ratio (∼1.4), suggesting city-wide pollution characteristics, whereas an enhanced ratio was observed for most winter episodes (1.9–4.3), signifying a larger concentration gradient in winter. The spatial variation during the winter episodes generally followed the trend seen in non-episode periods, with north-western stations showing higher PM levels than the eastern/south-eastern stations, with only a few exceptions being noted. For example, EP7N showed the highest PM level at three northern stations (TM, MB, and TP) and a concurrent high wind speed (6.13 m s−1), signalling regional input from northern inland regions. EP10 showed the largest spatial difference (i.e. a max-to-min ratio of 4.3). During EP10, an enhanced PM level was observed at the three north-western stations (TM, YL, and TC), while PM2.5 at other stations did not show an obvious increase. Such a spatial pattern suggests the influence of local pollution around this district. In contrast, during EP11N, higher concentrations were recorded at stations in the urban centre of HK (i.e. CW, EN, KC, SP, KT, and TK) than at the north-western stations, which may be attributed to enhanced local vehicular emissions during the end-of-year holidays (i.e. 29–30 December). The above results suggest that PM episodes showed more homogeneity during summer to early fall, whereas spatial heterogeneity of the episodes in winter was more notable. The latter implies that air quality monitoring at a single station cannot represent the pollution status of the entire city.
Table 1Statistical summary of PM2.5 at 15 HKEPD air quality monitoring stations and the HKUST supersite during the 11 episodes and the remaining non-episode hours for the period from 10 July to 31 December 2020. Meteorological parameters and gas pollutant data are from the HKUST supersite.
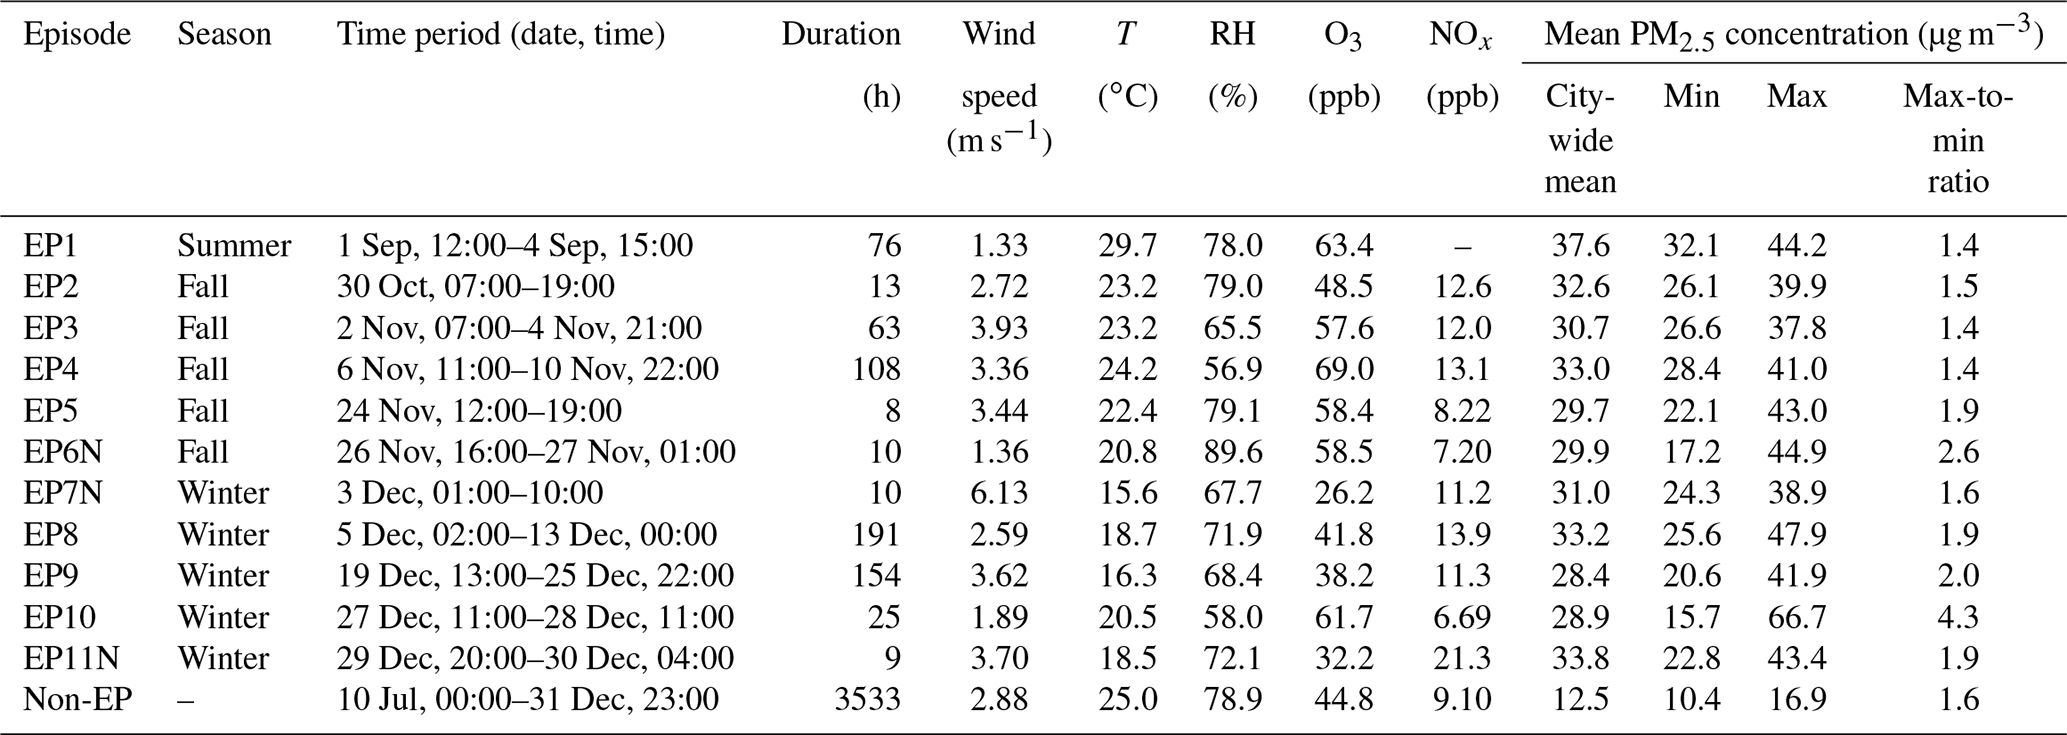
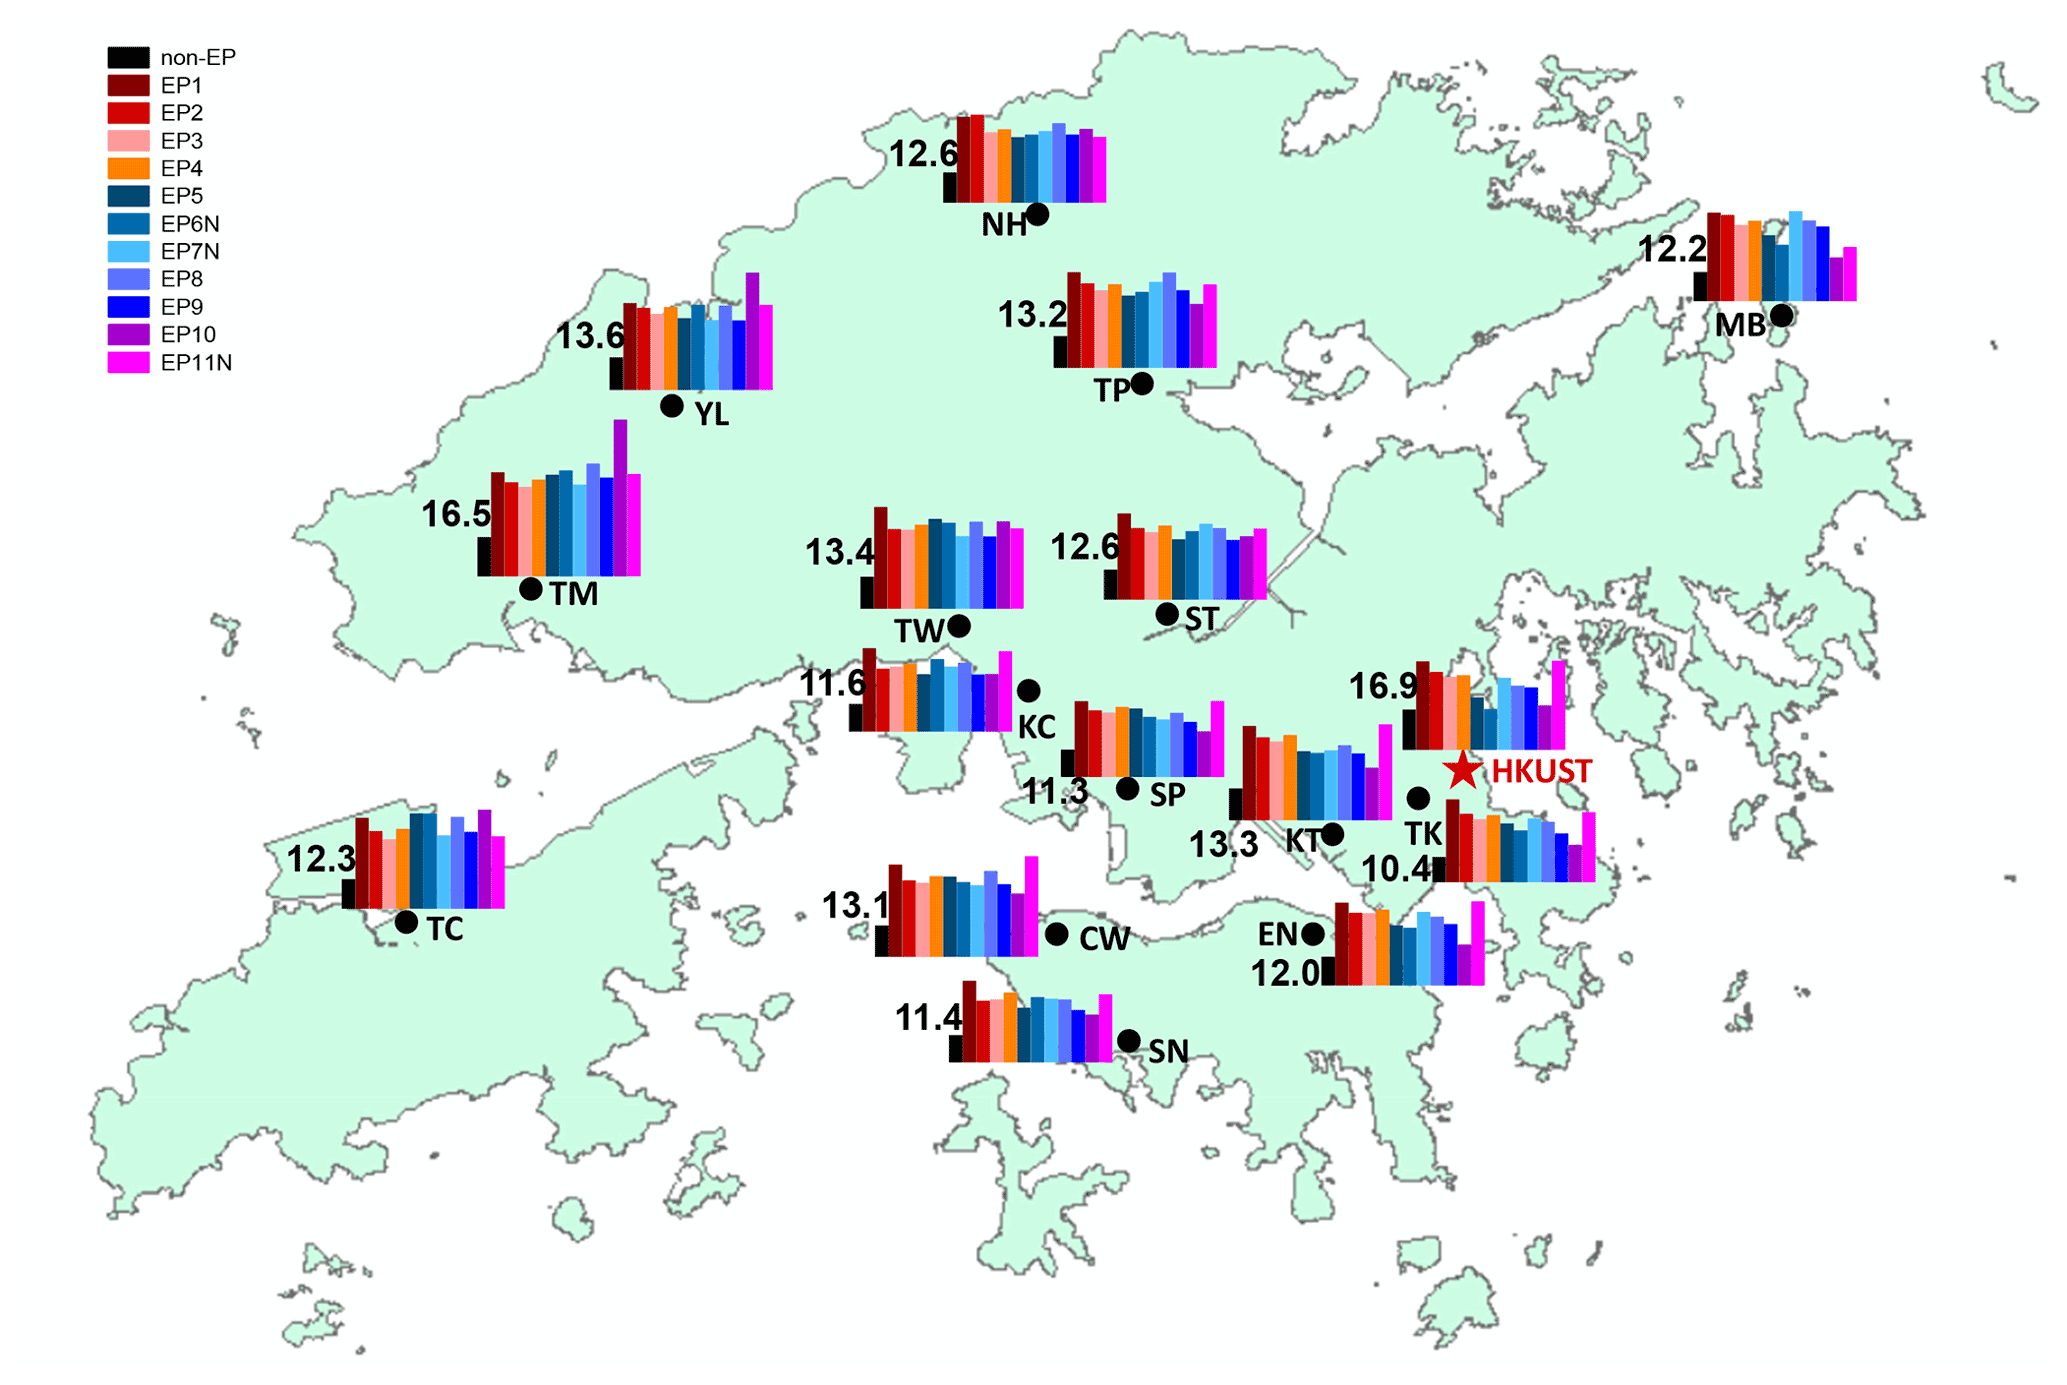
Figure 1Geographical locations of the 15 HKEPD general air quality monitoring stations (black dots) and the HKUST supersite (red star) in HK. Among the 15 HKEPD stations, MB is a rural site, whereas the others are general urban stations with different microenvironments. The histograms show the average PM2.5 concentrations (µg m−3) during the non-episode hours (in black; numbers indicate the concentration values) and the 11 PM episodes (in various colours; see the legend).
3.2 Overview of PM speciation measurement at the HKUST supersite
Compared with the total PM mass, the pollution characteristics of individual components, especially organics, may be quite different at different locations. The full PM composition data are only available at the HKUST supersite for the period from 30 August to 31 December 2020. Figure 2 shows the time series of PM2.5 and its major chemical components as well as select individual POA and SOA tracers and their VOC precursors. The source-specific organic markers include (1) BB-derived POA tracer (levoglucosan) and SOA tracer (4-nitrocatechol); (2) anthropogenic SOA tracers, including naphthalene/methylnaphthalene SOA tracer (phthalic acid) and monoaromatic SOA tracer; and (3) biogenic SOA tracers, including six isoprene SOA tracers, six α-pinene SOA tracers, and one β-caryophyllene SOA tracer. The SOA tracers generally showed higher concentrations during the daytime (Fig. S9), which is consistent with their secondary origins. A moderate to good correlation was observed among the SOA tracers and with sulfate, suggesting that this was a regional feature (Fig. S10).
To characterize chemical features in the formation of PM episodes, we examined the PM composition before and during each episode. The campaign-wide average is not representative of the normal condition specific to individual seasons, as the emission sources and meteorological conditions varied among seasons. The selection of the pre-episode period can minimize the interference from different meteorological conditions, such as temperature and boundary layer height, among seasons. This comparison (i.e. the pre-episode period vs. the episode period) can better examine the rapid formation of high-PM episodes. The selection of the pre-episode period for each episode is shown in Table S2 and Fig. S11. We select the pre-episode time windows primarily based on the principle that the pre-episode duration was comparable with that of the episode and that a given time interval (>12 h) exists between the pre-episode period and the episode immediately preceding it (in order to avoid residual influences from the previous episode). The air mass origins for each episode–pre-episode time window pair are shown in Fig. S12. Similar air mass origins, from northern continental regions, were observed during the pre-episode and episode periods for most episodes (except for EP1), excluding a sudden change in the air mass origins as a leading cause of the rapid increase in PM levels. The mass increment ratio (MIR), calculated as the mass concentration during the episode divided by that before the episode, was used to evaluate the change in the concentration of different chemical species during the episode. A MIR >1 suggests an increase in the concentration during the episode and vice versa.
Figure S13 shows the average PM composition for the pre-episode and episode periods. EP6N and EP10 are not obvious at this site, with an average PM <20 µg m−3, which is only slightly higher than the corresponding pre-episode period. The PM composition showed that sulfate and OM were the major components throughout the measurement period, while increased nitrate and ammonium concentrations were recorded in winter due to lower temperatures facilitating the partitioning of ammonium nitrate into the particle phase. Generally, the MIR values are higher for episodes occurring in summer and early fall (EP1–EP4), whereas less difference in the PM mass is observed before and during episodes for the winter episodes (except for EP9), due to the higher background PM level. For the major PM constituents, MIR >1 was generally observed during all episodes, except during EP6N and EP10. Nitrate showed the largest MIR values, especially during EP1 and EP11N.
Increased formation of secondary inorganic aerosol during PM2.5 episodes has been extensively reported in the literature (e.g. Liu et al., 2020; Yun et al., 2018); thus, it will not be our focus. In the later sections, we will examine the chemical evolution of the precursor-specific SOA tracers during the episodes in detail.

Figure 2Time series of PM2.5 and its major components as well as select POA and SOA tracers and their VOC precursors during the observation period (30 August–31 December 2020) at the HKUST supersite. The episode periods are shaded in grey, and the pre-episode periods are coloured in yellow. The full names of the SOA tracers are shown in Table 2.
Table 2Summary of the average PM2.5 concentration and major PM2.5 components as well as select POA and SOA tracers and their VOC precursors measured at the HKUST supersite during each episode and during different seasons for the period from 30 August to 31 December 2020.
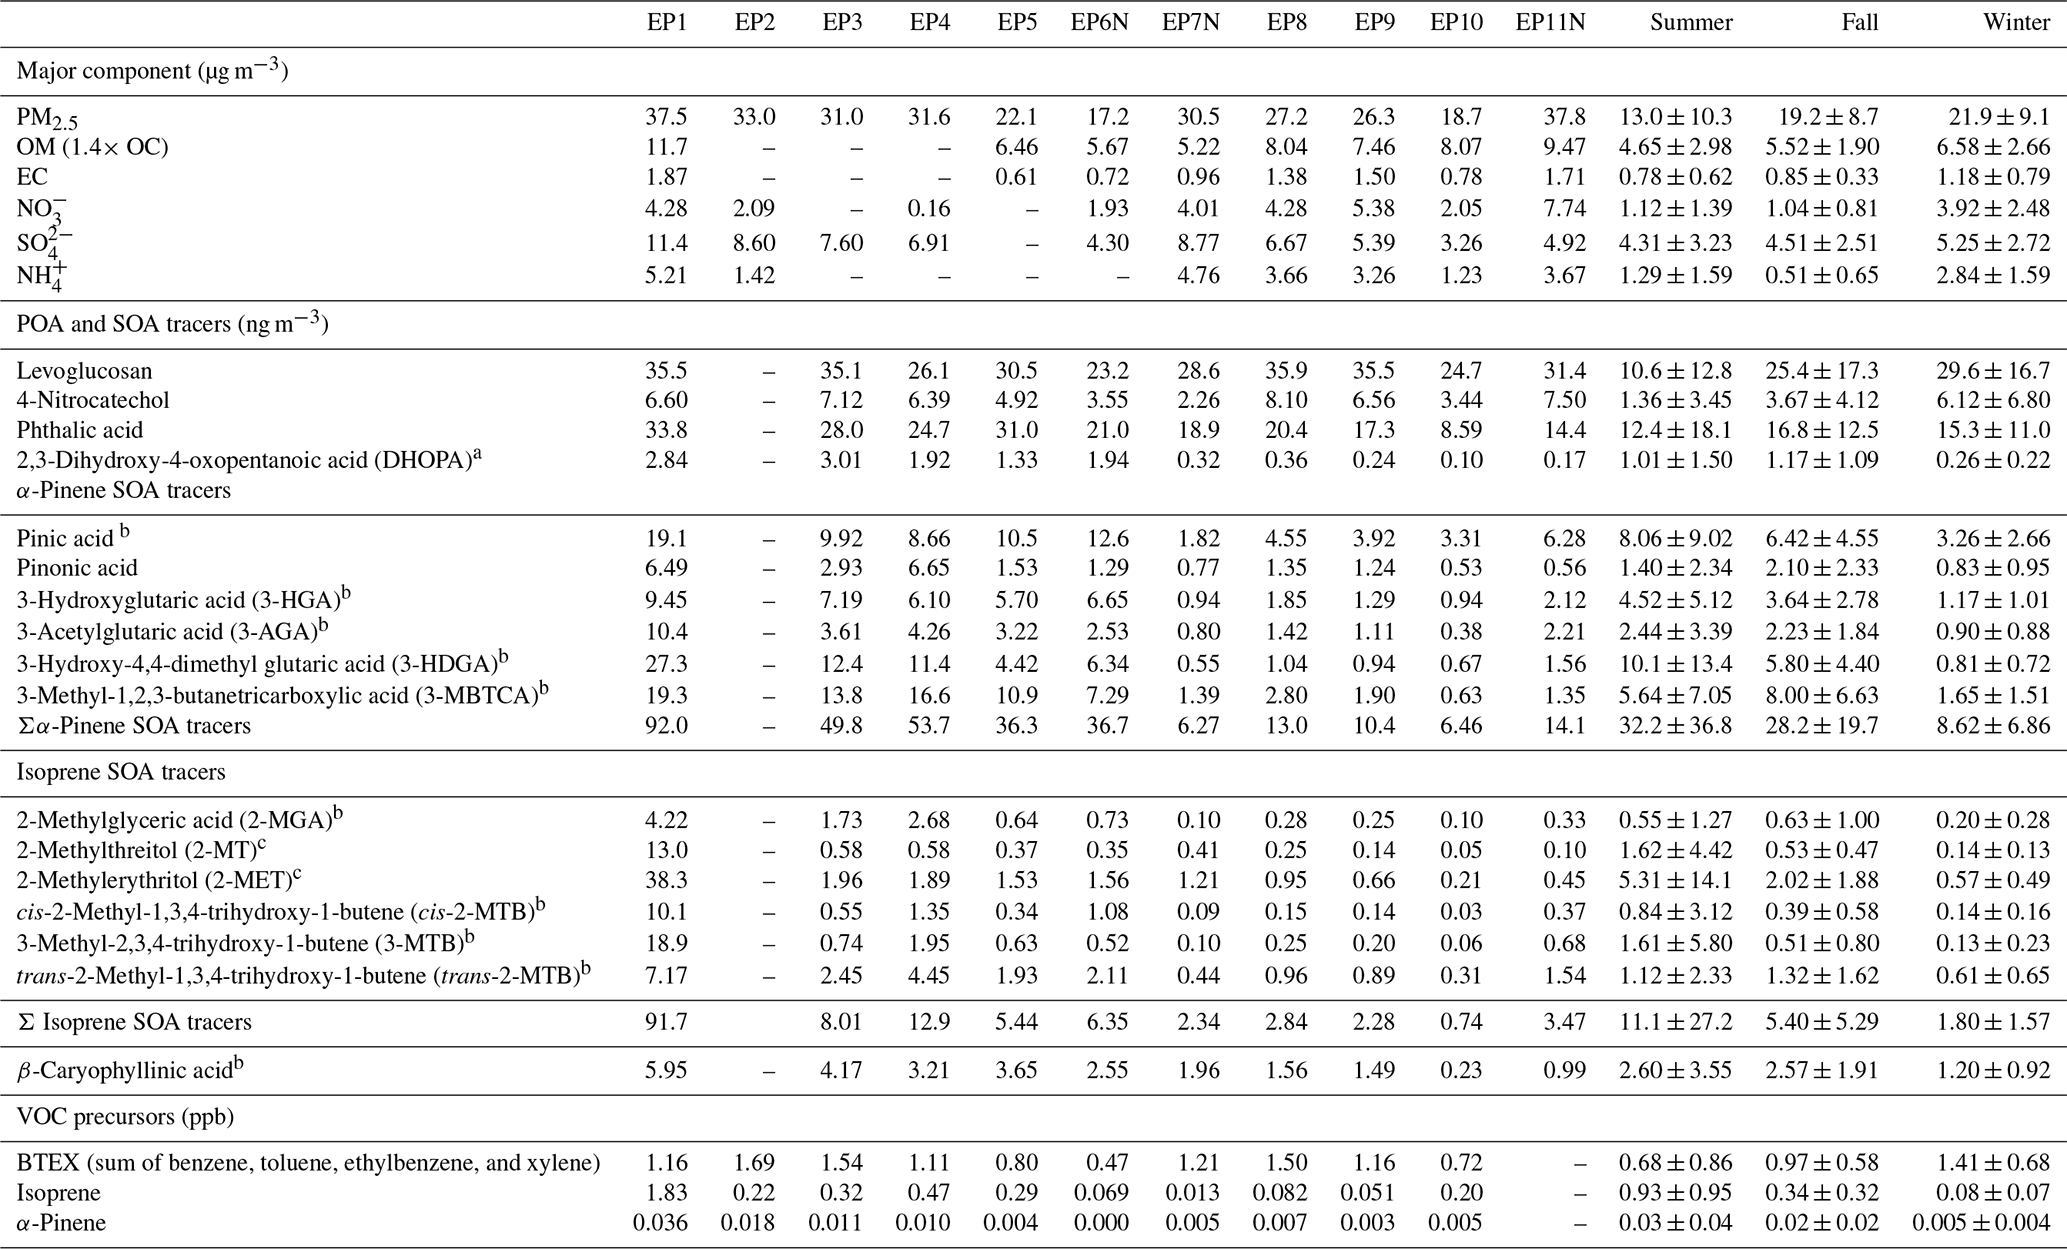
a Quantified using azelaic acid. b Quantified using pinonic acid. c Quantified using levoglucosan as a surrogate.
3.3 Biomass burning POA and SOA tracers
Levoglucosan, originating from the pyrolysis of cellulose and hemicellulose, has been widely used as a BB POA tracer (Simoneit et al., 1999). In our dataset, a moderate correlation between 4-nitrocatechol and levoglucosan was observed (Rp of 0.43), which is in line with their common material origin from BB. The moderate correlation between the two species was not affected by meteorological factors (Fig. S14). It is also noted that 4-nitrocatechol was moderately correlated with benzene (Rp of 0.52) and toluene (Rp of 0.50), also implicating these anthropogenic VOCs as notable contributing precursors to 4-nitrocatechol. Furthermore, 4-nitrocatechol and NOx were moderately correlated (Rp of 0.48), suggesting the importance of NOx oxidation of the aromatic VOC precursors.
Seasonal variation in 4-nitrocatechol showed the highest concentration in winter (6.12±6.80 ng m−3), followed by fall (3.67±4.12 ng m−3) and summer (1.36±3.45 ng m−3). Levoglucosan showed comparable high concentrations in winter and fall (29.6±16.7 and 25.4±17.3 ng m−3 respectively), which were more than 2 times higher than that in summer (10.6±12.8 ng m−3). It is noted that the levoglucosan concentration in this study was lower than previous off-line filter-based measurements from fall to winter in 2010–2012 in HK (mean of 96.8 ng m−3), whereas the concentration of 4-nitrocatechol was comparable (mean of 3.42 ng m−3 in Chow et al., 2016). This likely reflects that 4-nitrocatechol has precursor sources other than BB (Lu et al., 2019; Yuan et al., 2021); thus, joint measurements of potential precursors (e.g. catechol, phenol, and benzene) in the future would help to discern the relative importance of precursors from BB vs. anthropogenic sources.
Figure 3a compares the average concentration of levoglucosan and 4-nitrocatechol for each pre-episode–episode time window pair. The variation in 4-nitrocatechol was generally in sync with the variation in NOx between the pre-episode and episode periods, signifying the importance of the NOx influence. Levoglucosan and 4-nitrocatechol jointly showed higher concentrations during most episodes, except for EP5 and EP6N, indicating BB as a frequent important contributor to episodic increases in PM2.5. Figure 3b shows the MIR distribution of levoglucosan and 4-nitrocatechol during each episode. MIR >1 was observed for both levoglucosan and 4-nitrocatechol during summer and early-fall episodes (EP1–EP4), with the latter showing noticeably larger MIR values (3–7). The observations suggested enhanced contributions from both primary BB emissions and BB-derived SOA, especially secondary formation during EP1–EP4. For EP5 and EP6N, the concentration of levoglucosan was higher in the pre-episode period compared with the episode hours. During winter episodes (EP7–EP11), MIR values were lower (<3), indicating lower differences between the pre-episode and episode hours. In the early-winter episodes (EP7–EP9), the MIR values of levoglucosan were higher than 4-nitrocatechol, suggesting a more important contribution from primary BB emissions during these episodes. In EP11N, a higher MIR value was observed for 4-nitrocatechol than for levoglucosan, and the increase in 4-nitrocatechol was accompanied by an increase in NOx, suggesting enhanced night-time secondary formation during this episode.

Figure 3(a) Comparison of the average concentration of 4-nitrocatechol and levoglucosan during the pre-episode (solid colour) and episode (hatching) periods. (b) The mass increment ratios of 4-nitrocatechol and levoglucosan for each episode are also shown, with the light yellow shading marking the values of less than 1.
3.4 Anthropogenic SOA tracers
Two anthropogenic SOA tracers were measured in this study – phthalic acid and DHOPA. Phthalic acid is an SOA tracer from two-ringed naphthalene/methylnaphthalene (Kleindienst et al., 2012), whereas DHOPA is an SOA tracer from monoaromatics such as BTEX (benzene, toluene, ethylbenzene, and xylene) (Al-Naiema and Stone, 2017). Previous studies have shown that the main atmospheric loss of benzene and toluene is their photochemical reaction with OH radicals, with an atmospheric lifetime of 12.5 and 2.0 d respectively (Prinn et al., 1987). As there were few anthropogenic sources near the HKUST supersite, the measured BTEX is likely primarily due to transport from upwind mainland China, rather than local emissions, due to these species' long atmospheric lifetimes.
Phthalic acid showed a slightly higher concentration in fall and winter (16.8±12.5 and 15.3±11.0 ng m−3 respectively) and a lower concentration in summer (12.4±18.1 ng m−3). In comparison, DHOPA showed a more notable seasonal variation: the concentrations in fall and summer (1.17±1.09 and 1.01±1.50 ng m−3 respectively) were about 5 times the concentration in winter (0.26±0.22 ng m−3). VOC precursors of DHOPA (i.e. BTEX) showed the following pattern with respect to concentration: winter > fall > summer. Moreover, the seasonal average concentrations of these precursor species were 1.41±0.68, 0.97±0.58, and 0.68±0.86 ppb for the above-mentioned seasons respectively. Phthalic acid and DHOPA were positively correlated with O3 (Rp of 0.36 and 0.44), but DHOPA was not correlated with its aromatic VOC precursors (Rp of 0.03). The results suggest that the oxidant level is a significant factor promoting the formation of both phthalic acid and DHOPA, which is consistent with their secondary origin. Note that we use ozone as an indicator of the oxidant level in the ambient atmosphere, as no measurements of OH radical were available. The formation pathways for phthalic acid and DHOPA are mostly via OH radical oxidation, as reported in previous studies (He et al., 2018; Wang et al., 2007; Zhang et al., 2021).
Figure 4a shows the average concentration of phthalic acid and DHOPA quantified during the pre-episode and episode periods. Among the 11 episodes, higher concentration of the two SOA tracers were observed during summer and fall episodes (EP1–EP6), with episode-averaged values of 21.0–33.8 and 1.33–3.01 ng m−3 for phthalic acid and DHOPA respectively. During the winter episodes (EP7–EP11), the average concentrations of both SOA tracers were in a lower range, with DHOPA being significantly lower (0.10–0.36 ng m−3) and phthalic acid being slightly lower (8.59–20.4 ng m−3). As shown in Fig. 4b, BTEX had an enhanced presence during EP1–EP4, but no discernable elevation was detected during the remaining episodes in comparison with the pre-episode periods. DHOPA and phthalic acid also had higher MIR values during EP1–EP4 (MIR >2) than during the other episodes (MIR of 0.7–2), which is in line with the precursor–product relationship. The MIR values of DHOPA and phthalic acid exceeded unity during the remaining episodes, with EP7N being an exception for DHOPA and EP11N being an exception for phthalic acid. This seeming discrepancy in concentration variation between precursors and their product reflects that the key factors influencing formation of SOA tracers are not limited to their VOC precursors.
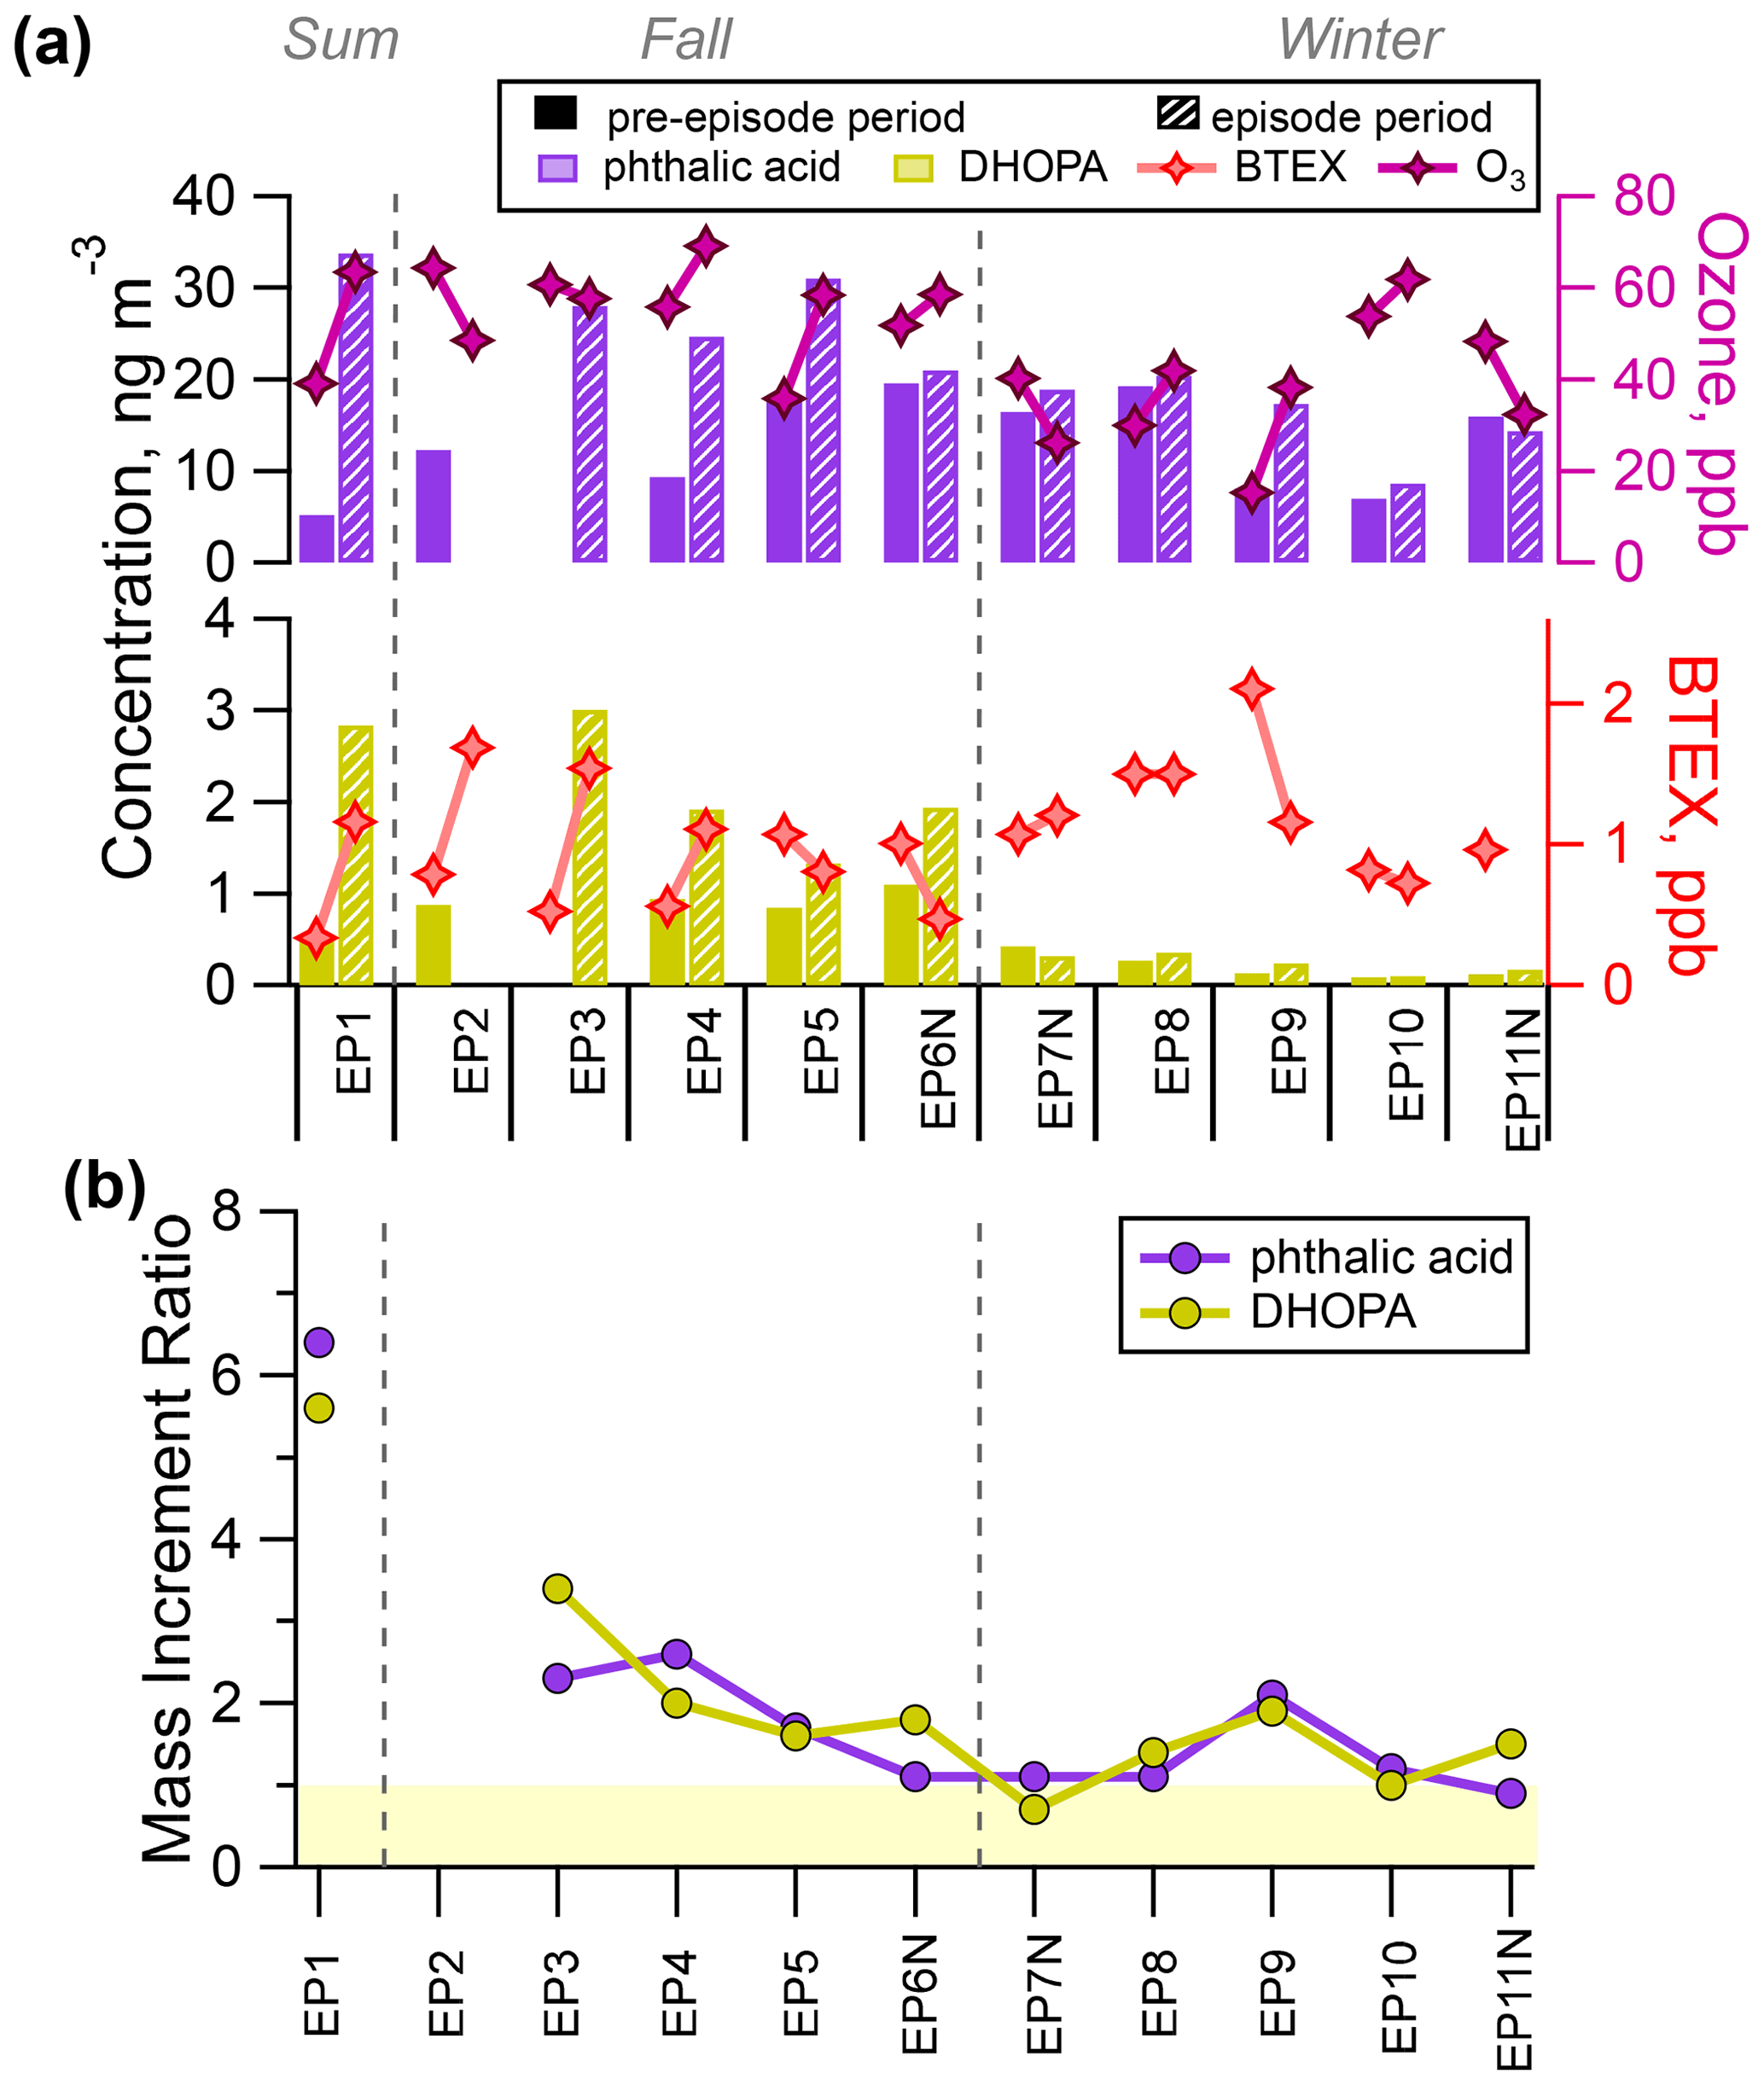
Figure 4(a) Comparison of the average concentration of phthalic acid, DHOPA, BTEX, and ozone during the pre-episode (solid colour) and episode (hatching) periods. (b) The mass increment ratios of phthalic acid and DHOPA for each episode are also shown, with the light yellow shading marking the ratio values of less than 1.
3.5 Biogenic SOA tracers
Three types of biogenic SOA tracers were quantified in this campaign, i.e. SOA tracers derived from isoprene, α-pinene, and β-caryophyllene. Previous studies have estimated that the respective atmospheric lifetimes of isoprene, α-pinene, and β-caryophyllene are 1.3 d, 4.6 h, and 2 min against ozone at a concentration of 7×1011 cm−3 (∼30 ppb) and 1.4 h, 2.6 h, and 42 min against OH at a concentration of 2×106 cm−3 (Atkinson and Arey, 2003). Thus, isoprene would preferentially react with OH, whereas β-caryophyllene would mainly react with O3. Compared with the precursors, the chemical lifetime of the SOA tracers is much longer, in the range of 2–10 d (Nozière et al., 2015). This implies that the SOA tracers observed at the site can be significantly contributed by regional/super-regional transport. The diurnal variation in the α-pinene and β-caryophyllene SOA tracers in this study showed clearly enhanced concentrations during the daytime from 10:00 to 16:00, whereas the isoprene SOA tracers did not show a discernable trend (Fig. S9).
3.5.1 Isoprene SOA tracers
The sum concentration of isoprene SOA tracers was the highest in summer (11.1±27.2 ng m−3), followed by fall (5.40±5.29 ng m−3), and the lowest in winter (1.80±1.57 ng m−3). This pattern was similar to the seasonality of the isoprene ambient concentration. At our site, isoprene was 0.93±0.95 ppb in summer, 0.34±0.32 ppb in fall, and 0.08±0.07 ppb in winter, which is in agreement with the temperature-dependent characteristic of isoprene emissions. Ambient isoprene is mainly controlled by local emissions, considering its short atmospheric lifetime. No correlation was observed between the isoprene SOA tracers and isoprene or temperature, suggesting that a significant part of the isoprene SOA tracers was likely brought to the site via regional/super-regional transport. The isoprene SOA tracers were consistently higher during episodes than during the pre-episode periods except for one night-time episode – EP6N (Fig. 5). With respect to the episodes, the highest concentration (91.7 ng m−3) occurred during the summer episode (EP1), far exceeding those during the fall episodes (mean of 8.18 ng m−3 and range of 5.44–12.9 ng m−3) and the winter episodes (mean of 2.33 ng m−3 and range of 0.74–3.47 ng m−3). This stark seasonal contrast was in line with the strong temperature-dependence of isoprene emissions and consequent ambient concentrations.
A total of six major isoprene SOA tracers were measured in this work, namely 2-MGA, two 2-methyltetrols (2-MT and 2-MET), and three C5-alkene triols (cis-2-MTB, 3-MTB, and trans-2-MTB). Previous laboratory studies have suggested that 2-MGA is produced via the NOx channel under high-NOx conditions (hundreds of parts per billion), whereas 2-methyltetrols and C5-alkene triols are formed via the HO2-channel under low-NOx (at the several parts per billion level) or NOx-free conditions (Claeys et al., 2004; Edney et al., 2005; Surratt et al., 2010). 2-Methyltetrols could also be produced by isoprene ozonolysis in the presence of acidic aerosol (Riva et al., 2016) and non-acidified sulfate aerosol (Kleindienst et al., 2007). During the whole sampling period, NOx was at a relatively low level (10.1±7.52 ppb). The composition of isoprene SOA tracers consistently showed the dominance of C5-alkene triols and 2-methyltetrols (Fig. 5a). This result suggested that the oxidation of isoprene with OH via the HO2 channel was dominant, which is consistent with the NOx monitoring data.
The MIR values of isoprene SOA tracers, shown in Fig. 5b, were generally the highest among all of the SOA tracers measured during all episodes except for EP7N, which occurred mainly at night-time. EP1–EP4 had much higher MIR values (4.1–11), clearly indicating more enhanced isoprene SOA formation during the summer and early-fall episodes. The winter episodes had lower MIR values for the isoprene SOA tracers, suggesting much lower isoprene SOA formation, likely as a result of the low availability of the precursor.

Figure 5(a) Comparison of the average concentration and molecular distributions of isoprene SOA tracers during the pre-episode (solid colour) and episode (hatching) periods. (b) The mass increment ratios of isoprene SOA tracers for each episode are also shown, with the light yellow shading marking the ratio values of less than 1.
3.5.2 Monoterpene SOA tracers
Among the three measured types of biogenic SOA tracers, α-pinene SOA tracers had the highest abundance. The sum concentration of α-pinene SOA tracers was the highest in summer (32.2±36.8 ng m−3), followed by fall (28.2±19.7 ng m−3) and winter (8.62±6.86 ng m−3). The temporal variation in α-pinene also showed higher abundance in summer (0.03±0.04 ppb) and fall (0.02±0.02 ppb), with a much lower concentration in winter (0.005±0.004 ppb). Similar to the isoprene SOA tracers, we did not observe any correlations between the α-pinene SOA tracers and α-pinene, suggesting that the α-pinene SOA tracers measured are not formed locally.
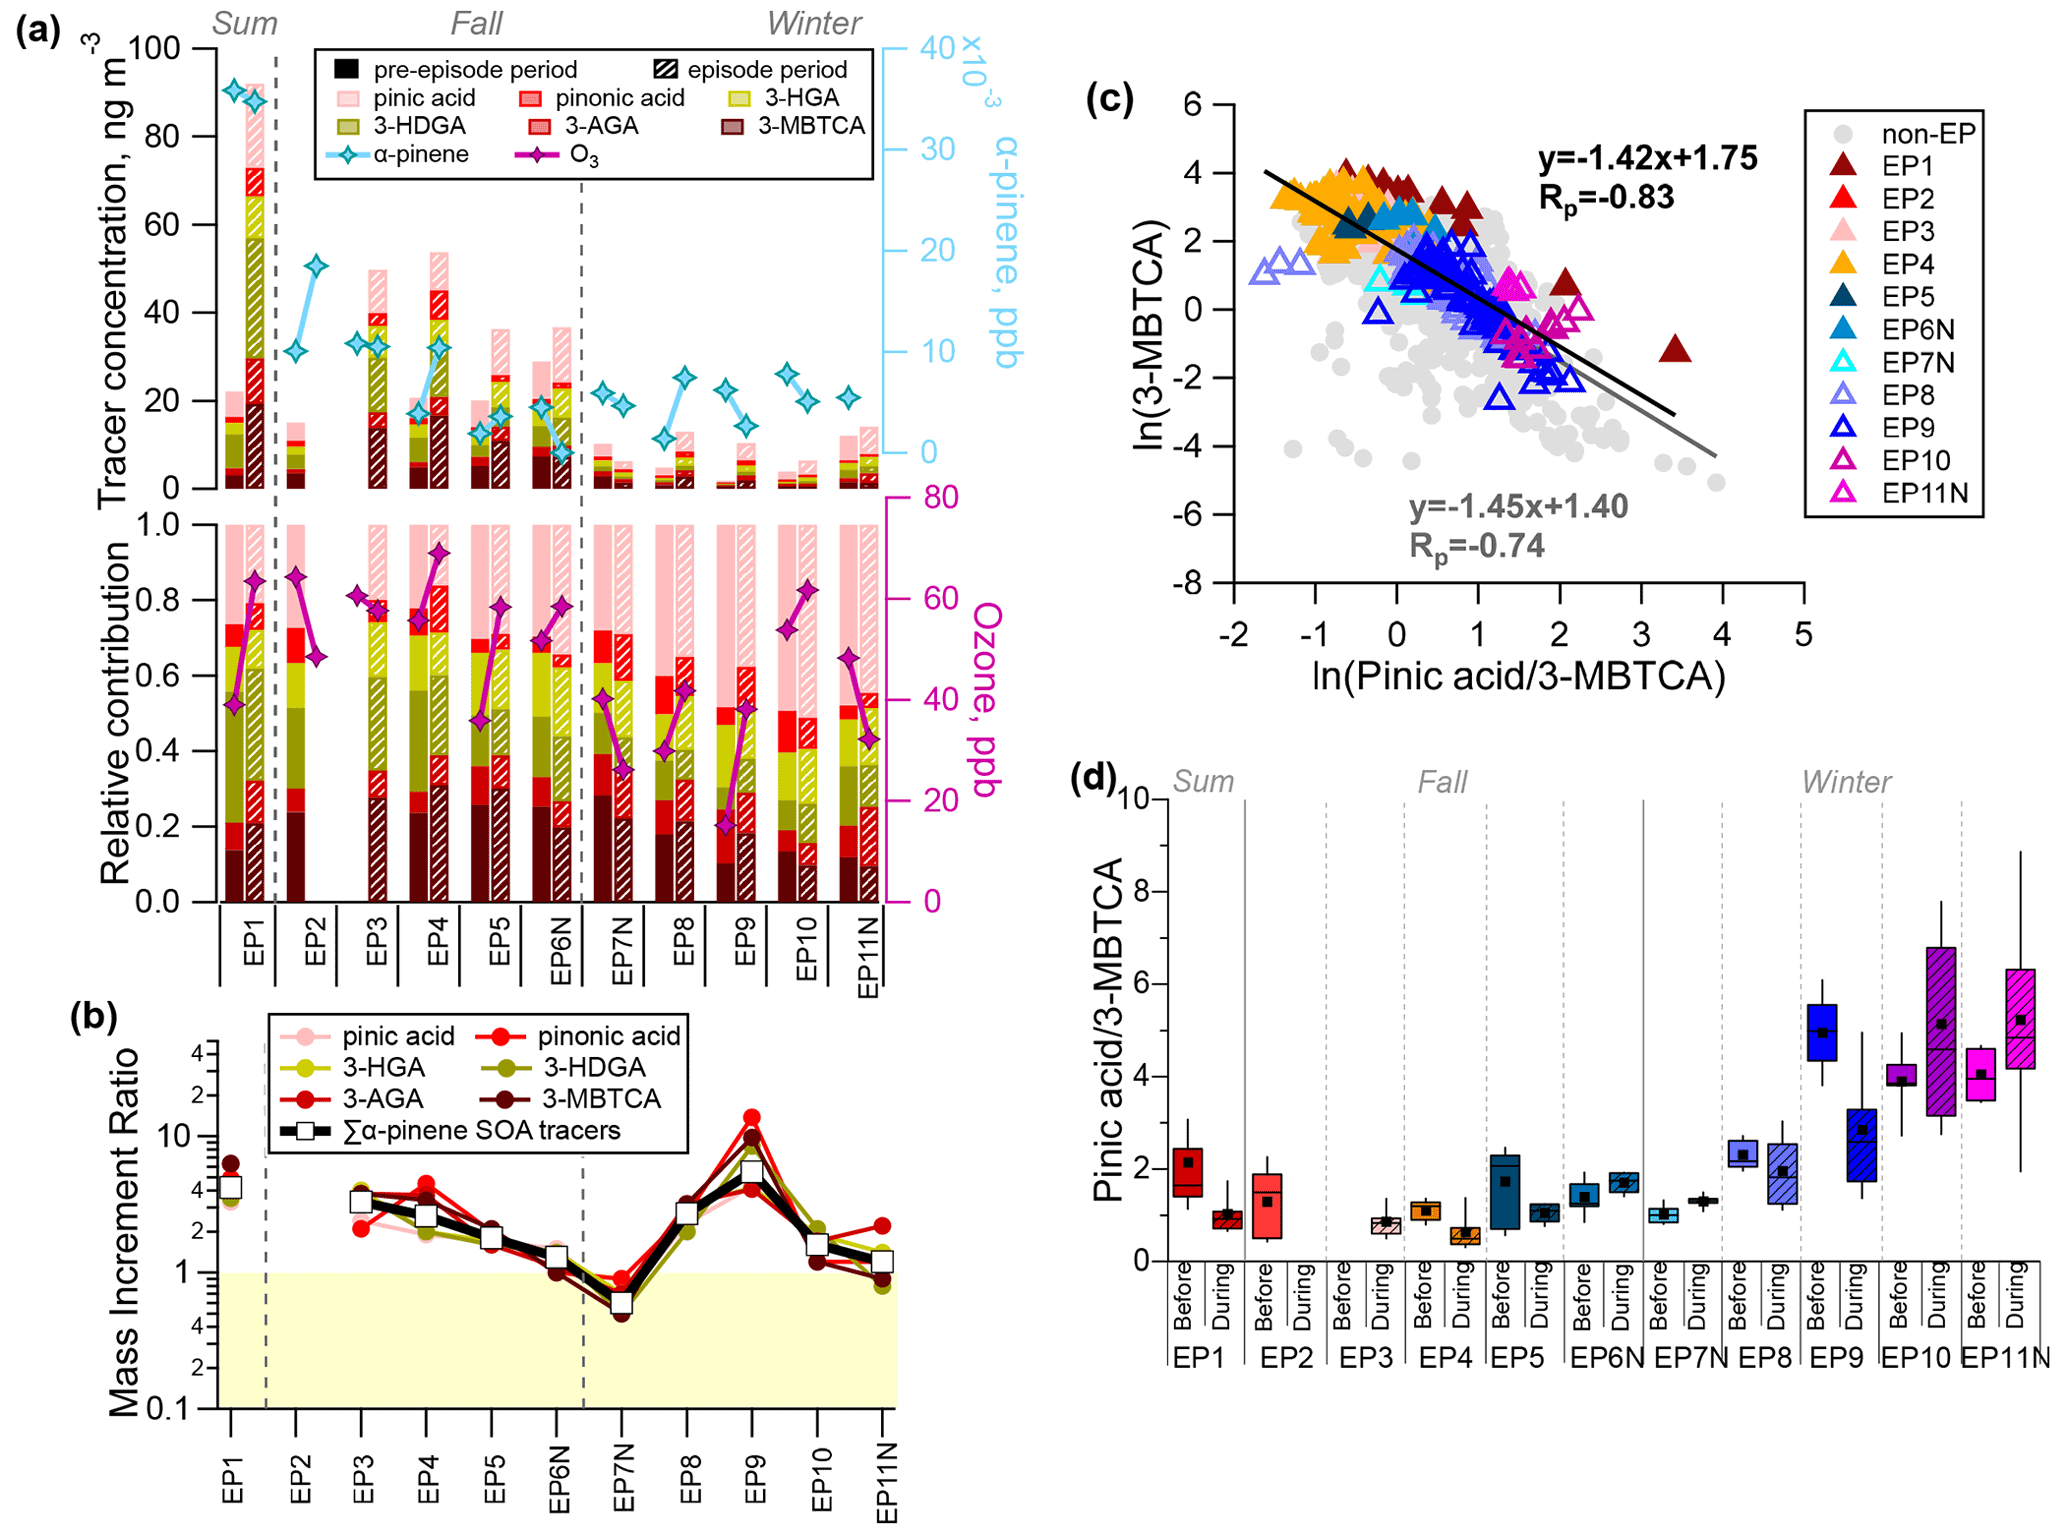
Figure 6(a) Comparison of the average concentration and molecular distribution of α-pinene SOA tracers during the pre-episode (solid colour) and episode (hatching) periods. (b) The mass increment ratios of α-pinene SOA tracers for each episode are also shown, with the light yellow shading marking the ratio values of less than 1. (c) Correlation between ln(pinic acid/3-MBTCA) and ln(3-MBTCA). (d) Distribution of the pinic acid/3-MBTCA ratio during the pre-episode (solid colour) and episode (hatching) periods. Squares and solid lines correspond to the respective mean and median values, the box indicates the 25th and 75th percentiles, and the whiskers are the 10th and 90th percentiles.
The concentrations of α-pinene SOA tracers were highest during the summer and fall episodes (EP1–EP6; mean of 53.7 ng m−3 and range of 36.3–92.0 ng m−3), with values that were more than 5 times higher than those during the winter episodes (EP7–EP11; mean of 10.1 ng m−3 and range of 6.27–14.1 ng m−3) (Fig. 6a). A total of six α-pinene SOA tracers were quantified, including pinic acid, pinonic acid, 3-HGA, 3-HDGA, 3-AGA, and 3-MBTCA. Chamber studies have shown that pinonic and pinic acid are the first-generation products of α-pinene oxidation, whereas the other four tracers are of later generations (Szmigielski et al., 2007). The molecular distribution of the α-pinene SOA tracers showed a clear seasonality: 3-HDGA and 3-MBTCA were more abundant in summer and fall, whereas pinic acid was the most abundant in winter. This agrees with the fact that the enhanced atmospheric oxidative capacity in summer and fall was conducive for more later generations of SOA products.
Similar to isoprene SOA tracers, α-pinene SOA tracers had MIR >1 during all episodes except for EP7N. EP1–EP4 and EP8–EP9 had much higher MIR values, suggesting enhanced α-pinene SOA formation during these episodes (Fig. 6b). In a previous off-line filter-based study in HK, Hu et al. (2008) proposed that the formation of SOA was sensitive to the level of O3 on the basis of observed positive correlations between secondary organic carbon and O3. In this study, we also observed the positive correlation between α-pinene SOA tracers and O3 (Rp of 0.26–0.45), supporting a significant role of the atmospheric oxidant in the formation of monoterpene SOA.
Pinic acid is an intermediate of α-pinene oxidation and can be further oxidized to 3-MBTCA (Claeys et al., 2007). The pinic acid / 3-MBTCA ratio (abbreviated as P M hereafter) could be used to evaluate the ageing processes of α-pinene SOA, with a lower P M signalling more aged α-pinene SOA. A negative correlation was observed between 3-MBTCA and the P M ratio, indicating that more high-generation products occur in more aged α-pinene SOA (Fig. 6c). Figure 6d shows the temporal variation in the P M ratio for the pre-episode and episode periods. The P M ratio seasonality of fall ≈ summer > winter indicated more aged α-pinene SOA in fall and summer than in winter. Compared with the respective pre-episode periods, EP1–EP5 and EP9 showed a higher degree of ageing of α-pinene SOA, as indicted by the noticeably lower P M ratios. In comparison with the P M ratio obtained in other studies, the ratio in winter in this work (2.64±1.91) is comparable to those measured in urban Shanghai (3.6±1.5; He et al., 2020) and rural Guangzhou (3.02; Yuan et al., 2018) in winter as well as that of fresh SOA in chamber studies (1.51–3.21; Offenberg et al., 2007). The results suggest that the wintertime monoterpene SOA is generally relatively fresh.
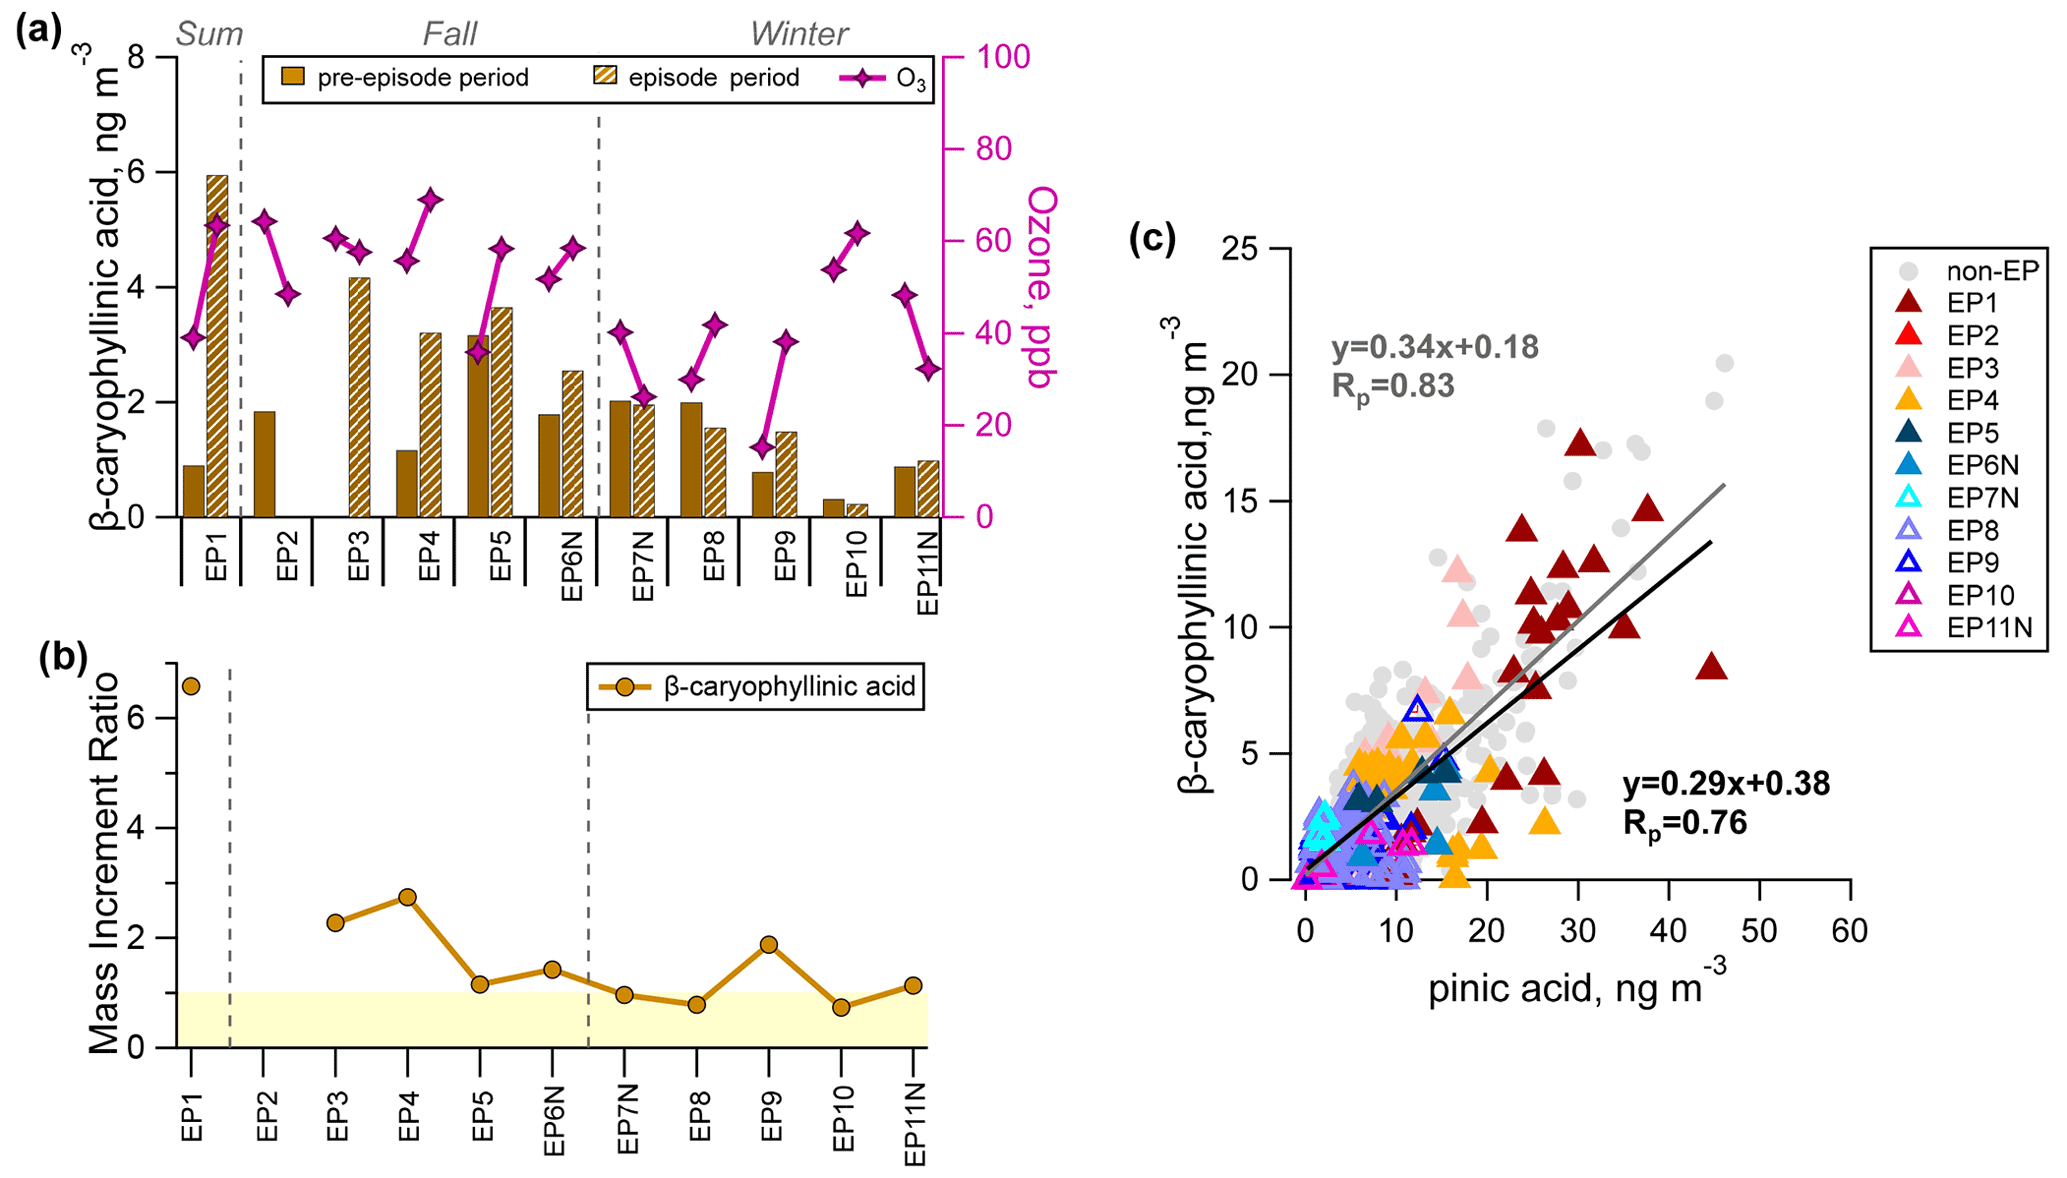
Figure 7(a) Comparison of the average concentration of β-caryophyllinic acid during the pre-episode (solid colour) and episode (hatching) periods. (b) The mass increment ratios of β-caryophyllinic acid for individual episodes are also shown, with the light yellow shading marking the ratio values of less than 1. (c) Correlation between β-caryophyllinic acid and pinic acid during the episode and the non-episode hours.
3.5.3 Sesquiterpene SOA tracers
Seasonal variation in β-caryophyllinic acid showed a higher concentration in summer (2.60±3.55 ng m−3) and fall (2.57±1.91 ng m−3), with concentrations that were ∼2 times that observed in winter (1.20±0.92 ng m−3). Due to its high reactivity towards ozone, the precursor β-caryophyllene is generally not detectable at typical ambient ozone concentrations (∼10–100 ppb). Its ambient concentration was also unavailable in this work. The concentration of β-caryophyllinic acid showed higher values during summer and fall episodes (EP1–EP6; 2.55–5.95 ng m−3) than during winter episodes (EP7–EP11; 0.23–1.96 ng m−3) (Fig. 7a). β-Caryophyllinic acid also showed higher MIR values for summer and fall episodes (1.2–6), whereas MIR <1 was observed for EP7–EP8 and 10 (Fig. 7b).
We observed that the concentration difference of β-caryophyllinic acid between the two sub-periods (i.e. EP1–EP6 vs. EP7–EP11) was much lower compared with those of the α-pinene and isoprene SOA tracers. Previous chamber studies of the β-caryophyllene ozonolysis reaction have suggested a number of first-generation products, such as aldehydes (e.g. β-caryophyllon aldehyde and β-hydroxycaryophyllon aldehyde) and acids (e.g. β-caryophyllonic acid and β-caryophyllinic acid) (e.g. Chan et al., 2011). The first-generation ozonolysis products, which still contain a C = C double bond, can be oxidized to the second-generation products (e.g. β-nocaryophyllon aldehyde and β-hydroxynocaryophyllon aldehyde). In most field studies, the identification of other β-caryophyllene SOA tracers has rarely been available due to the lack of authentic chemical standards and reference mass spectra. It is plausible that the lower decrease in the concentration of β-caryophyllinic acid during both non-episode and episode periods in winter compared with those in summer and fall could be a result of the lower atmospheric oxidative capacity in winter leading to less degradation of β-caryophyllinic acid. This speculation is supported by the good correlation between β-caryophyllinic acid and pinic acid (Rp of 0.81; Fig. 7c). Figure 7c also suggests that sesquiterpene SOA in HK is relatively fresh in winter. For a more definitive tracking of the ageing degree of β-caryophyllene SOA, we recommend future efforts directed at laboratory characterization of its later-generation products and joint field monitoring of multigenerational oxidation products.
Detailed online PM2.5 speciation measurements including major inorganic ions, OC, EC, elements, and organic molecular markers were conducted at a suburban site over a 4-month campaign from 30 August to 31 December 2020, spanning over three seasons (summer, fall, and winter). Taking advantages of the hourly/bi-hourly chemical composition data, especially precursor-specific SOA tracers, we examined the evolution of SOA tracers at this site during 11 city-wide PM2.5 episodes falling in our measurement period. The PM2.5 episodes were identified based on PM2.5 data from a network of 15 air quality monitoring stations across the whole city. The episodes were distributed in three seasons: one in summer, five in fall, and five in winter. PM2.5 in episodes in summer and early fall showed less spatial variation compared with the winter episodes. Among the SOA tracer groups, notably lower concentrations were observed in winter for two groups of biogenic SOA tracers (i.e. those derived from isoprene and monoterpene) and the monoaromatic SOA tracer. Biomass burning POA and SOA tracers (i.e. levoglucosan and 4-nitrocatechol respectively) and the naphthalene/methylnaphthalene SOA tracer (i.e. phthalic acid) showed higher concentrations in winter and fall. Mass increment ratios, calculated as the ratio between pre-episode and episode concentrations, mostly exceeded 1 for individual groups of SOA tracers, indicating enhanced SOA formation during episodes. The maximum MIR value encountered was 11 for the isoprene SOA tracers, and similar values were found for other groups of SOA tracers (4.2–7.0), demonstrating the significant potential for SOA to contribute to episodic PM2.5 pollution. The MIR values of SOA tracers were generally higher during the summer/early-fall episodes and lower during the winter episodes, implying that SOA formation is more sensitive to the oxidant level in summer and fall, whereas it is more sensitive to the VOC precursors in winter.
Multiple SOA tracers are available for isoprene and monoterpene SOA, providing an opportunity to gain insights into their formation mechanism. Among the six isoprene SOA tracers, C5-alkene triols and 2-methyltetrols consistently dominated over 2-methylglyceric acid. This observation showed the importance of low-NOx formation pathways in isoprene SOA. Among the monoterpene SOA tracers, the relative abundance of pinic acid and 3-MBTCA (the P M ratio) indicated the dominance of the early-generation products in winter and that SOA is generally less aged in winter. It is recommended that future efforts be directed at the laboratory identification of multiple products from a single SOA precursor, preferably representing products from different pathways or oxidation stages. Joint field monitoring will greatly facilitate the development of a quantitative understanding of SOA formation under real-world conditions.
The current study has shown that the SOA chemical evolution characteristics during PM2.5 episodes vary by precursor and by season. While we have demonstrated the value of online monitoring of specific molecular tracers in tracking episodic events and in examining episode-scale SOA formation characteristics, instrumentation at one site is insufficient to adequately capture the spatial heterogeneity of the haze pollution at the city scale. Thus, in order to formulate PM control measurements specific to a city or a region, multiple-site monitoring with advanced online instruments is highly recommended.
The bi-hourly organic markers and other hourly chemical speciation data presented in this study are available from the data repository maintained by HKUST: https://doi.org/10.14711/dataset/1KGKWN (Yu et al., 2022).
The supplement related to this article is available online at: https://doi.org/10.5194/acp-22-11239-2022-supplement.
QW and JZY formulated the overall design of the study. QW and SW carried out the measurement of organic markers and the data validation. YYC, HC, ZZ, DG, ZW, and JL carried out the measurement of other key major components and the data validation. QW analysed the data with contributions from JZY. QW and JZY prepared the manuscript with contributions from all co-authors.
The contact author has declared that none of the authors has any competing interests.
The content of this paper does not necessarily reflect the views and
policies of the HKSAR Government nor does the mention of trade names or
commercial products constitute an endorsement or recommendation of their
use.
Publisher's note: Copernicus Publications remains neutral with regard to jurisdictional claims in published maps and institutional affiliations.
This research has been supported by the Hong Kong Research Grants Council (grant nos. R6011-18 and 16305418) and the Hong Kong University of Science and Technology (grant no. VPRDO19IP01).
This paper was edited by Dara Salcedo and reviewed by Deepchandra Srivastava and one anonymous referee.
Al-Naiema, I. M. and Stone, E. A.: Evaluation of anthropogenic secondary organic aerosol tracers from aromatic hydrocarbons, Atmos. Chem. Phys., 17, 2053–2065, https://doi.org/10.5194/acp-17-2053-2017, 2017.
Atkinson, R. and Arey, J.: Gas-phase tropospheric chemistry of biogenic volatile organic compounds: A review, Atmos. Environ., 37, 197–219, https://doi.org/10.1016/S1352-2310(03)00391-1, 2003.
Chan, M. N., Surratt, J. D., Chan, A. W. H., Schilling, K., Offenberg, J. H., Lewandowski, M., Edney, E. O., Kleindienst, T. E., Jaoui, M., Edgerton, E. S., Tanner, R. L., Shaw, S. L., Zheng, M., Knipping, E. M., and Seinfeld, J. H.: Influence of aerosol acidity on the chemical composition of secondary organic aerosol from β-caryophyllene, Atmos. Chem. Phys., 11, 1735–1751, https://doi.org/10.5194/acp-11-1735-2011, 2011.
Chow, K. S., Huang, X. H. H., and Yu, J. Z.: Quantification of nitroaromatic compounds in atmospheric fine particulate matter in Hong Kong over 3 years: Field measurement evidence for secondary formation derived from biomass burning emissions, Environ. Chem., 13, 665–673, https://doi.org/10.1071/EN15174, 2016.
Claeys, M., Graham, B., Vas, G., Wang, W., Vermeylen, R., Pashynska, V., Cafmeyer, J., Guyon, P., Andreae, M. O., Artaxo, P., and Maenhaut, W.: Formation of Secondary Organic Aerosols Through Photooxidation of Isoprene, Science, 303, 1173–1176, https://doi.org/10.1126/science.1092805, 2004.
Claeys, M., Szmigielski, R., Kourtchev, I., Van Der Veken, P., Vermeylen, R., Maenhaut, W., Jaoui, M., Kleindienst, T. E., Lewandowski, M., Offenberg, J. H., and Edney, E. O.: Hydroxydicarboxylic acids: Markers for secondary organic aerosol from the photooxidation of α-pinene, Environ. Sci. Technol., 41, 1628–1634, https://doi.org/10.1021/es0620181, 2007.
Ding, X., Wang, X. M., Gao, B., Fu, X. X., He, Q. F., Zhao, X. Y., Yu, J. Z., and Zheng, M.: Tracer-based estimation of secondary organic carbon in the Pearl River Delta, south China, J. Geophys. Res.-Atmos., 117, 1–14, https://doi.org/10.1029/2011JD016596, 2012.
Ding, X., He, Q. F., Shen, R. Q., Yu, Q. Q., Zhang, Y. Q., Xin, J. Y., Wen, T. X., and Wang, X. M.: Spatial and seasonal variations of isoprene secondary organic aerosol in China: Significant impact of biomass burning during winter, Sci. Rep., 6, 1–10, https://doi.org/10.1038/srep20411, 2016.
Edney, E. O., Kleindienst, T. E., Jaoui, M., Lewandowski, M., Offenberg, J. H., Wang, W., and Claeys, M.: Formation of 2-methyl tetrols and 2-methylglyceric acid in secondary organic aerosol from laboratory irradiated isoprene/NOX/SO 2/air mixtures and their detection in ambient PM2.5 samples collected in the eastern United States, Atmos. Environ., 39, 5281–5289, https://doi.org/10.1016/j.atmosenv.2005.05.031, 2005.
Finewax, Z., De Gouw, J. A., and Ziemann, P. J.: Identification and Quantification of 4-Nitrocatechol Formed from OH and NO3 Radical-Initiated Reactions of Catechol in Air in the Presence of NOx: Implications for Secondary Organic Aerosol Formation from Biomass Burning, Environ. Sci. Technol., 52, 1981–1989, https://doi.org/10.1021/acs.est.7b05864, 2018.
He, X., Huang, X. H. H., Chow, K. S., Wang, Q., Zhang, T., Wu, D., and Yu, J. Z.: Abundance and Sources of Phthalic Acids, Benzene-Tricarboxylic Acids, and Phenolic Acids in PM2.5 at Urban and Suburban Sites in Southern China, ACS Earth Sp. Chem., 2, 147–158, https://doi.org/10.1021/acsearthspacechem.7b00131, 2018.
He, X., Wang, Q., Huang, X. H. H., Huang, D. D., Zhou, M., Qiao, L., Zhu, S., Ma, Y. ge, Wang, H. li, Li, L., Huang, C., Xu, W., Worsnop, D. R., Goldstein, A. H., and Yu, J. Z.: Hourly measurements of organic molecular markers in urban Shanghai, China: Observation of enhanced formation of secondary organic aerosol during particulate matter episodic periods, Atmos. Environ., 240, 117807, https://doi.org/10.1016/j.atmosenv.2020.117807, 2020.
Hu, D., Bian, Q., Li, T. W. Y., Lau, A. K. H., and Yu, J. Z.: Contributions of isoprene, monoterpenes, β-caryophyllene, and toluene to secondary organic aerosols in Hong Kong during the summer of 2006, J. Geophys. Res.-Atmos., 113, 1–14, https://doi.org/10.1029/2008JD010437, 2008.
Huang, X. H. H., Bian, Q., Ng, W. M., Louie, P. K. K., and Yu, J. Z.: Characterization of PM2.5 major components and source investigation in suburban Hong Kong: A one year monitoring study, Aerosol Air Qual. Res., 14, 237–250, https://doi.org/10.4209/aaqr.2013.01.0020, 2014.
Jaoui, M., Lewandowski, M., Kleindienst, T. E., Offenberg, J. H., and Edney, E. O.: β-caryophyllinic acid: An atmospheric tracer for β-caryophyllene secondary organic aerosol, Geophys. Res. Lett., 34, 1–4, https://doi.org/10.1029/2006GL028827, 2007.
Kleindienst, T. E., Lewandowski, M., Offenberg, J. H., Jaoui, M., and Edney, E. O.: Ozone-isoprene reaction: Re-examination of the formation of secondary organic aerosol, Geophys. Res. Lett., 34, 1–6, https://doi.org/10.1029/2006GL027485, 2007.
Kleindienst, T. E., Jaoui, M., Lewandowski, M., Offenberg, J. H., and Docherty, K. S.: The formation of SOA and chemical tracer compounds from the photooxidation of naphthalene and its methyl analogs in the presence and absence of nitrogen oxides, Atmos. Chem. Phys., 12, 8711–8726, https://doi.org/10.5194/acp-12-8711-2012, 2012.
Lee, B. P., Li, Y. J., Yu, J. Z., Louie, P. K. K., and Chan, C. K.: Characteristics of submicron particulate matter at the Urban roadside in downtown Hong Kong-Overview of 4 months of continuous high-Resolution aerosol mass spectrometer measurements, J. Geophys. Res., 120, 7040–7058, https://doi.org/10.1002/2015JD023311, 2015.
Li, X. B., Yuan, B., Parrish, D. D., Chen, D., Song, Y., Yang, S., Liu, Z., and Shao, M.: Long-term trend of ozone in southern China reveals future mitigation strategy for air pollution, Atmos. Environ., 269, 118869, https://doi.org/10.1016/j.atmosenv.2021.118869, 2022.
Li, Y. J., Lee, B. P., Su, L., Fung, J. C. H., and Chan, C. K.: Seasonal characteristics of fine particulate matter (PM) based on high-resolution time-of-flight aerosol mass spectrometric (HR-ToF-AMS) measurements at the HKUST Supersite in Hong Kong, Atmos. Chem. Phys., 15, 37–53, https://doi.org/10.5194/acp-15-37-2015, 2015.
Liu, P., Ye, C., Xue, C., Zhang, C., Mu, Y., and Sun, X.: Formation mechanisms of atmospheric nitrate and sulfate during the winter haze pollution periods in Beijing: gas-phase, heterogeneous and aqueous-phase chemistry, Atmos. Chem. Phys., 20, 4153–4165, https://doi.org/10.5194/acp-20-4153-2020, 2020.
Lu, C., Wang, X., Li, R., Gu, R., Zhang, Y., Li, W., Gao, R., Chen, B., Xue, L., and Wang, W.: Emissions of fine particulate nitrated phenols from residential coal combustion in China, Atmos. Environ., 203, 10–17, https://doi.org/10.1016/j.atmosenv.2019.01.047, 2019.
Nozière, B., Kalberer, M., Claeys, M., Allan, J., D'Anna, B., Decesari, S., Finessi, E., Glasius, M., Grgić, I., Hamilton, J. F., Hoffmann, T., Iinuma, Y., Jaoui, M., Kahnt, A., Kampf, C. J., Kourtchev, I., Maenhaut, W., Marsden, N., Saarikoski, S., Schnelle-Kreis, J., Surratt, J. D., Szidat, S., Szmigielski, R., and Wisthaler, A.: The Molecular Identification of Organic Compounds in the Atmosphere: State of the Art and Challenges, Chem. Rev., 115, 3919–3983, https://doi.org/10.1021/cr5003485, 2015.
Offenberg, J. H., Lewis, C. W., Lewandowski, M., Jaoui, M., Kleindienst, T. E., and Edney, E. O.: Contributions of toluene and α-pinene to SOA formed in an irradiated toluene/α-pinene/NOx/air mixture: comparison of results using 14C content and SOA organic tracer methods, Environ. Sci. Technol., 41, 3972–3976, https://doi.org/10.1021/es070089+, 2007.
Prinn, R., Cunnold, D., Rasmussen, R., Simmonds, P., Alyea, F., Crawford, A., Fraser, P., and Rosen, R.: Atmospheric trends in methylchloroform and the global average for the hydroxyl radical, Science, 238, 945–950, https://doi.org/10.1126/science.238.4829.945, 1987.
Qin, Y. M., Li, Y. J., Wang, H., Lee, B. P. Y. L., Huang, D. D., and Chan, C. K.: Particulate matter (PM) episodes at a suburban site in Hong Kong: evolution of PM characteristics and role of photochemistry in secondary aerosol formation, Atmos. Chem. Phys., 16, 14131–14145, https://doi.org/10.5194/acp-16-14131-2016, 2016.
Riva, M., Budisulistiorini, S. H., Zhang, Z., Gold, A., and Surratt, J. D.: Chemical characterization of secondary organic aerosol constituents from isoprene ozonolysis in the presence of acidic aerosol, Atmos. Environ., 130, 5–13, https://doi.org/10.1016/j.atmosenv.2015.06.027, 2016.
Simoneit, B. R. T., Schauer, J. J., Nolte, C. G., Oros, D. R., Elias, V. O., Fraser, M. P., Rogge, W. F., and Cass, G. R.: Levoglucosan, a tracer for cellulose in biomass burning and atmospheric particles, Atmos. Environ., 33, 1–10, 1999.
Sun, C., Lee, B. P., Huang, D., Jie Li, Y., Schurman, M. I., Louie, P. K. K., Luk, C., and Chan, C. K.: Continuous measurements at the urban roadside in an Asian megacity by Aerosol Chemical Speciation Monitor (ACSM): particulate matter characteristics during fall and winter seasons in Hong Kong, Atmos. Chem. Phys., 16, 1713–1728, https://doi.org/10.5194/acp-16-1713-2016, 2016.
Surratt, J. D., Chan, A. W. H., Eddingsaas, N. C., Chan, M. N., Loza, C. L., Kwan, A. J., Hersey, S. P., Flagan, R. C., Wennberg, P. O., and Seinfeld, J. H.: Reactive intermediates revealed in secondary organic aerosol formation from isoprene, P. Natl. Acad. Sci. USA, 107, 6640–6645, https://doi.org/10.1073/pnas.0911114107, 2010.
Szmigielski, R., Surratt, J. D., Gómez-González, Y., van der Veken, P., Kourtchev, I., Vermeylen, R., Blockhuys, F., Jaoui, M., Kleindienst, T. E., Lewandowski, M., Offenberg, J. H., Edney, E. O., Seinfeld, J. H., Maenhaut, W., and Claeys, M.: 3-methyl-1,2,3-butanetricarboxylic acid: An atmospheric tracer for terpene secondary organic aerosol, Geophys. Res. Lett., 34, 2–7, https://doi.org/10.1029/2007GL031338, 2007.
Wang, L., Atkinson, R., and Arey, J.: Dicarbonyl products of the OH radical-initiated reactions of naphthalene and the C1- and C2-alkylnaphthalenes, Environ. Sci. Technol., 41, 2803–2810, https://doi.org/10.1021/es0628102, 2007.
Wang, Q., He, X., Zhou, M., Huang, D. D., Qiao, L., Zhu, S., Ma, Y. G., Wang, H. L., Li, L., Huang, C., Huang, X. H. H., Xu, W., Worsnop, D., Goldstein, A. H., Guo, H., Yu, J. Z., Huang, C., and Yu, J. Z.: Hourly Measurements of Organic Molecular Markers in Urban Shanghai, China: Primary Organic Aerosol Source Identification and Observation of Cooking Aerosol Aging, ACS Earth Sp. Chem., 4, 1670–1685, https://doi.org/10.1021/acsearthspacechem.0c00205, 2020.
Wang, X., Chen, W., Chen, D., Wu, Z., and Fan, Q.: Long-term trends of fine particulate matter and chemical composition in the Pearl River Delta Economic Zone (PRDEZ), China, Front. Environ. Sci. Eng., 10, 53–62, https://doi.org/10.1007/s11783-014-0728-z, 2016.
Wang, Y., Gao, W., Wang, S., Song, T., Gong, Z., Ji, D., Wang, L., Liu, Z., Tang, G., Huo, Y., Tian, S., Li, J., Li, M., Yang, Y., Chu, B., Petäjä, T., Kerminen, V. M., He, H., Hao, J., Kulmala, M., Wang, Y., and Zhang, Y.: Contrasting trends of PM2.5and surface-ozone concentrations in China from 2013 to 2017, Natl. Sci. Rev., 7, 1331–1339, https://doi.org/10.1093/nsr/nwaa032, 2020.
WHO: WHO global air quality guidelines: particulate matter (PM2.5 and PM10), ozone, nitrogen dioxide, sulfur dioxide and carbon monoxide, World Health Organization, https://apps.who.int/iris/handle/10665/345329 (last access: 9 August 2022), 1–360, 2021.
Yu, J. Z.: Chemical Characterization of Water Soluble Organic Compounds in Particulate Matters in Hong Kong, Environ. Prot. Dep., https://citeseerx.ist.psu.edu/viewdoc/download?doi=10.1.1.562.1645&rep=rep1&type=pdf (last access: 23 April 2022), 2002.
Yu, J. Z., Wang, Q. Q., and Wang, S.: PM2.5 major components and select tracers during eleven pollution episodes (30 Aug.–31 Dec. 2020) at the HKUST Air Quality Research Supersite, Hong Kong, DataSpace@HKUST [data set], https://doi.org/10.14711/dataset/1KGKWN, 2022.
Yuan, Q., Lai, S., Song, J., Ding, X., Zheng, L., Wang, X., Zhao, Y., Zheng, J., Yue, D., Zhong, L., Niu, X., and Zhang, Y.: Seasonal cycles of secondary organic aerosol tracers in rural Guangzhou, Southern China: The importance of atmospheric oxidants, Environ. Pollut., 240, 884–893, https://doi.org/10.1016/j.envpol.2018.05.009, 2018.
Yuan, W., Huang, R.-J., Yang, L., Wang, T., Duan, J., Guo, J., Ni, H., Chen, Y., Chen, Q., Li, Y., Dusek, U., O'Dowd, C., and Hoffmann, T.: Measurement report: PM2.5-bound nitrated aromatic compounds in Xi'an, Northwest China – seasonal variations and contributions to optical properties of brown carbon, Atmos. Chem. Phys., 21, 3685–3697, https://doi.org/10.5194/acp-21-3685-2021, 2021.
Yun, H., Wang, W., Wang, T., Xia, M., Yu, C., Wang, Z., Poon, S. C. N., Yue, D., and Zhou, Y.: Nitrate formation from heterogeneous uptake of dinitrogen pentoxide during a severe winter haze in southern China, Atmos. Chem. Phys., 18, 17515–17527, https://doi.org/10.5194/acp-18-17515-2018, 2018.
Zanobetti, A., Schwartz, J., and Gold, D.: Are there sensitive subgroups for the effects of airborne particles?, Environ. Health Persp., 108, 841–845, https://doi.org/10.1289/ehp.00108841, 2000.
Zhang, J., He, X., Gao, Y., Zhu, S., Jing, S., Wang, H., Yu, J. Z., and Ying, Q.: Estimation of Aromatic Secondary Organic Aerosol Using a Molecular Tracer–A Chemical Transport Model Assessment, Environ. Sci. Technol., 55, 12882–12892, https://doi.org/10.1021/acs.est.1c03670, 2021.