the Creative Commons Attribution 4.0 License.
the Creative Commons Attribution 4.0 License.
 | 02 Sep 2022
Measurement report: Atmospheric mercury in a coastal city of Southeast China – inter-annual variations and influencing factors
Jiayan Shi
Yuping Chen
Lingling Xu
Youwei Hong
Mengren Li
Xiaolong Fan
Liqian Yin
Yanting Chen
Chen Yang
Gaojie Chen
Taotao Liu
Xiaoting Ji
The long-term monitoring of atmospheric mercury is an important part of the effective evaluation of the Minamata Convention on Mercury. Gaseous elemental mercury (GEM), along with conventional air pollutants and meteorological parameters, was simultaneously observed in Xiamen, Southeast China, in January and July over the period 2012–2020. GEM concentrations in January were highest in 2015 (4.47 ng m−3) and decreased by 2020 (3.93 ng m−3), while GEM concentrations in July were highest in 2017 (2.65 ng m−3) and lowest in 2020 (1.56 ng m−3). The temporal variation of GEM was typically characterized by higher concentrations in winter than in summer and in nighttime than in daytime. Bivariate polar plots and the concentration-weighted trajectory (CWT) model were used to identify the source regions of GEM on a local and regional scale. The results indicate that the high GEM concentrations in January 2015 were likely due to a combination of high-level Hg emissions and adverse meteorological conditions. Generalized additive models (GAMs), which use a regression analysis method, were established and applied to investigate the influencing factors on the inter-annual variation of GEM. The factors anthropogenic emissions, meteorological conditions, and transportation explained 37.8 %±11.9 %, 31.4 %±9.0 %, and 30.8 %±9.9 % on average of the variation of GEM concentrations, respectively. There was a positive relationship of daily GEM concentrations with T and RH, mostly linking to natural surface emissions and Hg chemical transformations. The interpretation rate of anthropogenic emissions has significantly decreased since 2012, indicating the effectiveness of emission mitigation measures in reducing GEM concentrations in the study region.
- Article
(4996 KB) - Full-text XML
-
Supplement
(1284 KB) - BibTeX
- EndNote


Atmospheric mercury, because of its neurotoxicity, long persistence, and high bioaccumulation, is defined as a global pollutant that poses a threat to the health of the global population. Especially the organic form of mercury, like methylmercury (MeHg), is associated with neurocognitive deficits in human fetuses and cardiovascular effects in adults (Axelrad et al., 2007; Roman et al., 2011). In order to protect human health and the environment from adverse effects of mercury, a legally binding international treaty, the Minamata Convention on Mercury, was adopted in October 2013 and entered into force in August 2017 (UN Environment, 2017). The Minamata Convention requires parties to reduce mercury emissions and to assess the effectiveness of mitigation measures. China is one of the world's largest mercury emitters as well as the signatory to the Minamata Convention. The annual atmospheric mercury emissions in China were about 565 t in 2015, accounting for about a quarter of global anthropogenic mercury emissions (AMAP/UNEP, 2018). The predominant anthropogenic Hg emission sources in China were industrial coal combustion, coal-fired power plants, nonferrous metal smelting, and cement production (Zhang et al., 2015). The characteristics of Hg emissions such as large emission amount and industrial production-dominated emissions mean that China has great potential to reduce mercury emissions through the implementation of the Minamata Convention on Mercury. A mercury emissions inventory of China for 1978–2014 has reported that anthropogenic mercury emissions peaked in 2011 and then showed a downward trend (Wu et al., 2016). In addition, China reduced anthropogenic mercury emissions by 127 t from 2013 to 2017 (K. Liu et al., 2019). Among them, mercury emissions from the coal-fired power plants fell from 105 t in 2007 to 73 t in 2015 (Zhang et al., 2015; Liu et al., 2018). China has introduced a series of air cleaning measures including upgrading precipitator devices, newly built desulfurization and denitrification devices, and ultra-low-emission renovations since 2013, which has led to the synergistic removal of mercury (K. Liu et al., 2019). Strict restrictions of mercury on the mining, production, utilization, import, and export have also been imposed in China since 2017 (https://www.mee.gov.cn/, last access: 17 May 2022).
Atmospheric mercury is usually classified into three categories according to the determination technique: gaseous elemental mercury (GEM), gaseous oxidized mercury (GOM), and particulate bound mercury (PBM). Because of its stability and volatility, GEM is the dominant form of atmospheric mercury, accounting for up to 95 %. GEM has an atmospheric residence time of 0.5–2 years and can spread globally before being deposited to earth's surfaces (Schroeder and Munthe, 1998; Zhang et al., 2013; Yuan et al., 2021). On the other hand, GOM and PBM have relatively high reactivity and dry/wet deposition rates and are therefore more easily removed from the atmosphere. Field observations are vital to understand the long-term variation of Hg levels in the atmosphere. There are some global and regional mercury monitoring networks around the world which provided a long-term monitoring result. For example, a steep decline trend of GEM concentrations (0.05 ng m−3 yr−1) was observed at Mace Head, Ireland, from 2013 to 2018 (Custodio et al., 2020), while GEM data from Cape Point, South Africa, showed a slight increase from 2007 to 2017 (Slemr et al., 2020). China has also carried out a series of observational studies in the past 2 decades. These observation studies on GEM concentrations mostly focused on 1–2 years, and few continuous GEM observation records over multiple years in China were published (Fu et al., 2015). A 3-year measurement at Chongming Island, East China, showed that the annual GEM concentrations significantly decreased from 2.68 ng m−3 in 2014 to 1.60 ng m−3 in 2016, at a rate of ng m−3 yr−1 (Tang et al., 2018), whereas a multi-year observation of GEM in Guiyang, Southwest China, showed an increasing trend from 8.40 ng m−3 in 2002 to 10.2 ng m−3 in 2010, and the increase mainly occurred during the cold season (Fu et al., 2015).
The variation of GEM concentrations is influenced by a variety of factors such as anthropogenic emissions, meteorological conditions, and intra- and inter-regional transport (Tang et al., 2018; C. Liu et al., 2019; Zhang et al., 2021). In previous studies, the impact of anthropogenic emissions changes was often quantified by compiling emission inventories (Zhang et al., 2015; Wu et al., 2016; K. Liu et al., 2019; Cai et al., 2020). The trajectory-based analysis method was frequently applied to analyze the impact of regional transport (Tang et al., 2018; Wang et al., 2021). However, results like the impacts of anthropogenic emissions and regional transport derived from the different method systems mentioned above were not comparable. Generalized additive models (GAMs), which use a regression analysis method, are data-driven and able to incorporate nonlinear relationships of air pollution with numerical and categorical variables, which have been introduced into influencing factor identification in recent years (Wood and Augustin, 2002). The impact of local anthropogenic emissions, regional transport, and meteorological factors on GEM concentrations in Nanjing, East China, was quantified using GAMs (Zhang et al., 2021). GAMs were also used to explain the decline of GEM concentrations in Beijing, and results showed that reduction of anthropogenic mercury emissions, variation in meteorological conditions, and change in globe background level explained 51.5 %, 47.1 %, and 1.4 % of the decrease in GEM concentrations, respectively (Wu et al., 2020). It can be seen that GAMs are a promising tool to explore the effect of factors like anthropogenic emissions and natural perturbations on GEM concentrations.
China has adopted aggressive atmospheric control measures in the last decade. Long-term GEM observation was very necessary to investigate the variation of GEM levels and its influencing factors. In this study, GEM, conventional pollutants, and meteorological parameters were simultaneously observed in Xiamen, a coastal city in Southeast China, in January (represents winter) and July (represents summer) over the period 2012–2020. The main objectives of this study are (1) to characterize the inter-annual, seasonal, and diurnal variations of GEM in Xiamen, a coastal city of Southeast China; (2) to identify the source regions of GEM on a local and regional scale and their influence on annual concentrations of GEM; and (3) to investigate the influencing factors including anthropogenic emissions, regional transport, and meteorology on the inter-annual variation of GEM concentrations in the study region.
2.1 Site description
The study site (Xiamen; 118∘ E, 24∘ N) is located in the Institute of Urban Environment, Chinese Academy of Sciences in Jimei District of Xiamen, Fujian Province, China (Fig. 1a). The site was characterized by a typical subtropical monsoon climate, with the prevailing ocean monsoon in summer and northerly or northeasterly air masses from the inland of China in winter. Industrial point sources were mainly distributed to the northeast and the southwest of the study site (Fig. 1b). The instruments were placed on the roof of a building (∼80 m above the ground). The outdoor air inlet of the sampling unit was located 2 m above the rooftop of the building.
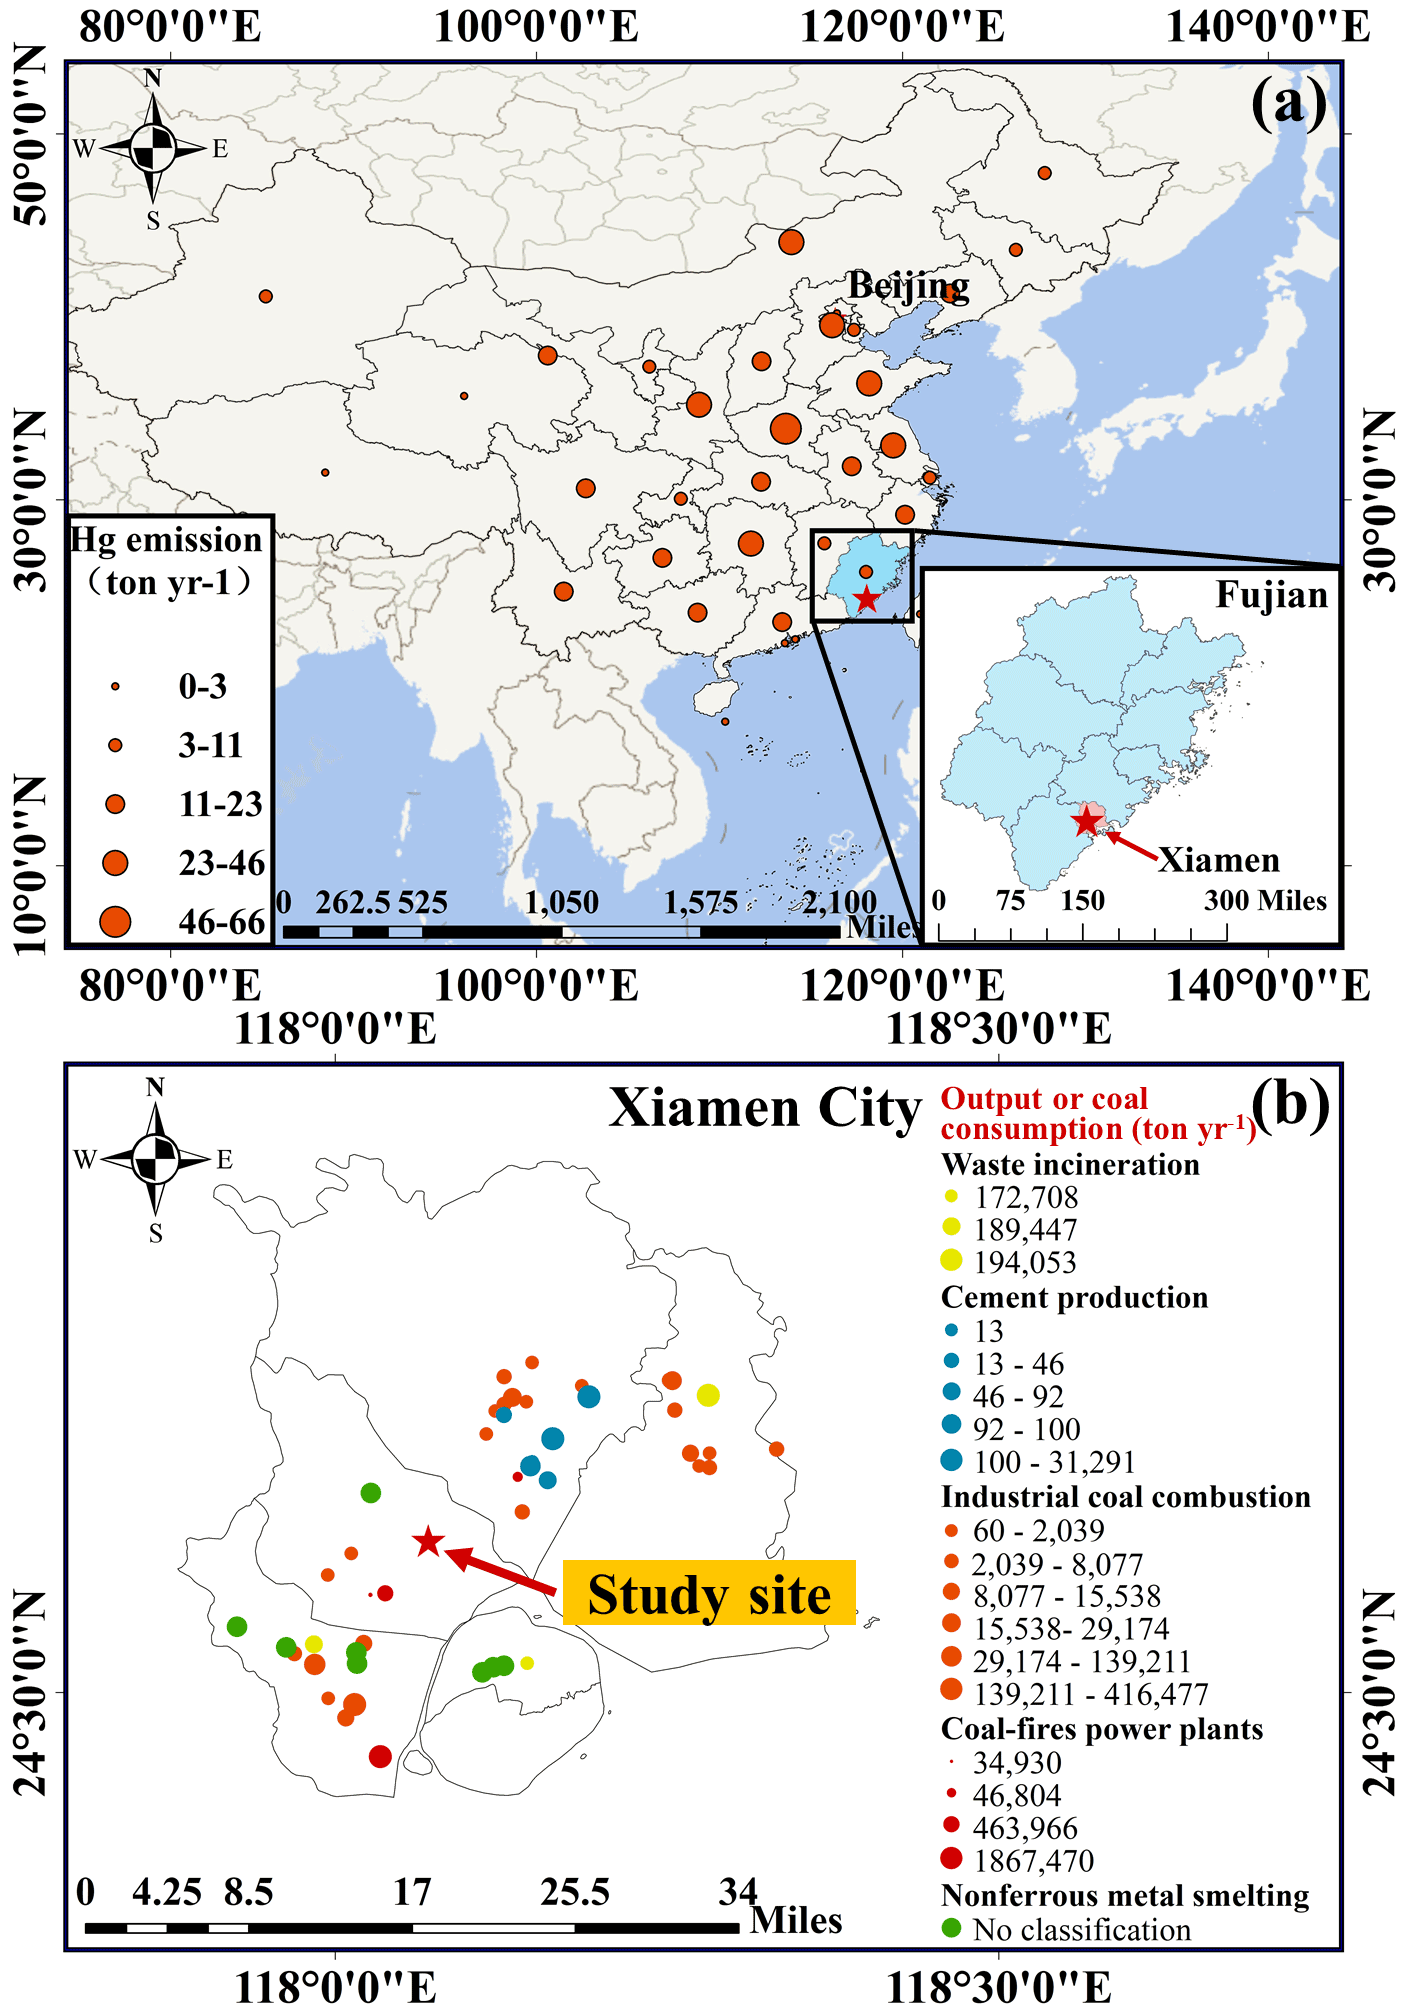
Figure 1(a) The location of study site in Xiamen, Fujian Province, China, and the regional distribution map of anthropogenic Hg emissions in China in 2014 (Wu et al., 2016). Note that the red dots represent the amount of mercury emitted by each province. (b) The distribution of local industrial point sources in Xiamen. Note that the colors of the dots represent different industrial categories, and the size represents a company's output or coal consumption (t yr−1).
2.2 Atmospheric mercury measurements
Instrument operation. Atmospheric mercury was measured by the Tekran 2537B/1130/1135 system (Tekran Inc., Toronto, Canada). During the 1 h sampling period, the GOM and PBM were first collected onto the KCl-coated quartz annular denuder and the quartz filter respectively, and GEM concentrations were measured by a Tekran 2537B Hg vapor analyzer every 5 min at a sampling flow rate of 1 L min−1. The detection limit of GEM measurement was 0.06 ng m−3. In the following 1 h desorbing phase, the PBM and GOM were sequentially desorbed and then quantified by the Tekran 2537B. The principle and the routine maintenance of the equipment in detail have been described in a previous study (Xu et al., 2015). The Tekran 2537B analyzer was calibrated automatically every 25 h using the internal Hg permeation source inside the instrument, and the accuracy of this permeation source was calibrated every 12 months with manual injection of Hg by a syringe from an external Hg source (Module 2505).
Hg species selection. GEM has a low chemical reactivity compared to GOM and PBM in the atmosphere. GEM concentrations are largely affected by factors like anthropogenic emissions and atmospheric physical processes, which could be well represented by conventional pollutants like CO and meteorological parameters like boundary layer height (BLH), whereas GOM and PBM concentrations were strongly affected by chemical transformation processes, which has no known suitable indicators. In addition, involving chemical transformation effects as a main factor in the GAM models would make them more complicated. Thus, we used statistical methods to explore the influencing factors on the more stable Hg species, GEM, in this study.
Observation period selection. This study was based on the GEM observation data of January and July (representative of winter and summer, respectively) in 2012, 2013, 2015, 2017, and 2020. There was a different time period of instrument malfunction among the years. To ensure the study time periods were consistent and the data could be comparable among the years, we chose the representative months of GEM data in this study. Xiamen is located in the coastal region of Southeast China under the control of the subtropical oceanic monsoon, which means there is a significant distinction in meteorology between summer and winter. According to the climate features in the study region, January and July reflect the characteristic of the winter and summer seasons well, respectively. In addition, a whole-year GEM concentration observation in Xiamen supported that the GEM data in January can represent the GEM characteristics of winter and in July can represent summer (Xu et al., 2015). In order to match other parameters, the time resolution of GEM concentrations was converted from the original 5 min to 2 h. For most of the data (70 %) during the study period, the proportion of GOM and PBM in total gaseous mercury (TGM) was less than 5 %. Thus, GEM concentrations in this study were directly compared to TGM in the below analysis.
2.3 Meteorological parameters and criteria air pollutants
In this study, the conventional pollutants (including SO2, NO2, O3, CO, PM10, PM2.5) and meteorological parameters (including wind speed (WS), wind direction (WD), relative humidity (RH), air temperature (T), and surface air pressure (SP)) were obtained from Xiamen air quality monitoring station. Note that the above pollutant concentrations and meteorological data were averaged into 2 h time intervals. Other meteorological parameters, boundary layer height (BLH), downward UV radiation at the surface (UVB), and low cloud cover (LCC), were obtained from the European Centre for Medium-Range Weather Forecasts (ECMWF) reanalysis (https://www.ecmwf.int, last access: 23 March 2022).
2.4 Concentration-weighted trajectory (CWT)
Hybrid Single-Particle Lagrangian Integrated Trajectory (HYSPLIT) model and Global Data Assimilation System data (https://www.arl.noaa.gov/, last access: 5 May 2022) were applied to calculate the 72 h backward air mass trajectories. The interval of backward trajectories was 2 h, and the arrival height was set as 500 m above the ground level.
Concentration-weighted trajectory (CWT) analysis is useful to identify pollution sources spatially for long-term environment measurement (Cheng et al., 2013). The principle of the CWT method is that each grid cell is assigned a weighted concentration by averaging the sample concentrations associated with trajectories that cross that grid cell as follows:
where Cij is the average weighted concentration in the ijth cell, l is the index of the trajectory, M is the total number of trajectories, Cl is GEM concentration observed on arrival of trajectory l, and τijl is the time spent in the ijth cell by the trajectory.
Based on the maximum distance traveled by the 72 h back trajectories over the study period, a geographical domain from 17 to 60∘ N and from 45 to 135∘ E (from 4 to 37∘ N and from 100 to 153∘ E) was found to be suitable in January (July). This domain encompassed the locations of nearly all the trajectory segment endpoints from all the back trajectories. The resolution for CWT was 1∘ × 1∘ in this study.
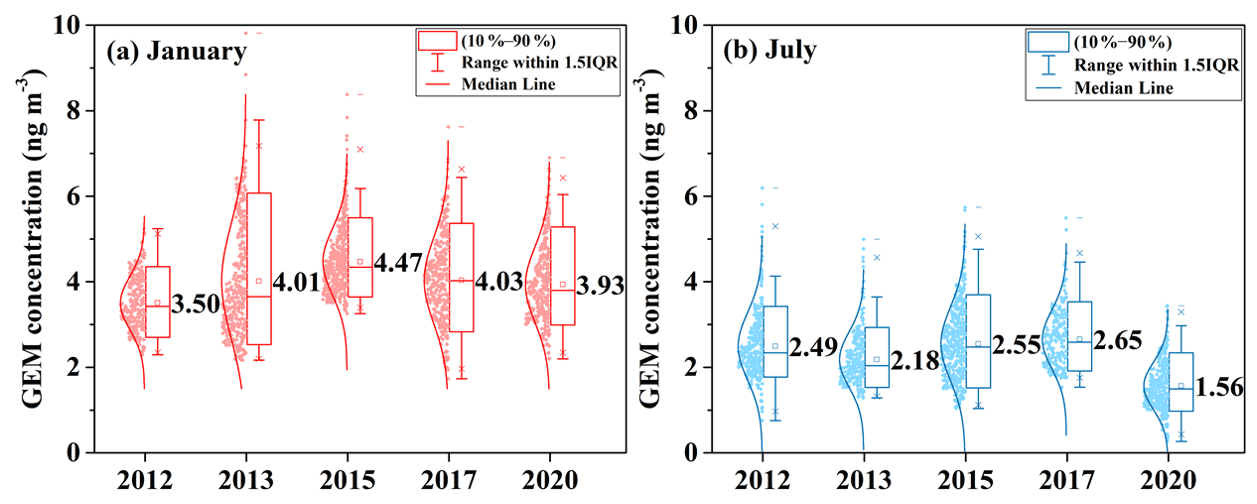
Figure 2Statistical summaries of gaseous elemental mercury (GEM) concentrations in Xiamen in (a) January and (b) July of the study years.
2.5 Model development
Generalized additive models, which use a regression analysis method, have been used to establish the relationship between GEM and various variables and to investigate the influencing factors on the inter-annual trend of GEM concentrations (Gong et al., 2017). The models were run by the following steps: parameter selection, model establishment, and model quality control.
Parameter selection. A total of 16 variables we obtained from site observation and web downloads generally fell into four categories: anthropogenic emissions (SO2, NO2, O3, CO, PM2.5, and PM10), surface meteorology (T, RH, WS, WD, and SP), high-altitude meteorology (BLH, UVB, and LCC), and air transportation (24 h latitude and 24 h longitude) (Table S1 in the Supplement). All the variables were standardized by the minimum–maximum method. The normalized data eliminate the effects of differences in dimension and ranges of values between indicators. The standardized variables were then screened using two methods: statistical judgment and the meaning of the variables. Firstly, the collinearity diagnosis method was adopted to make judgment according to the variance inflation factor (VIF). PM10, SO2, NO2, SP, and UVB were rejected from the model due to their high collinearity (VIF >5). Secondly, we considered the meaning of the remaining parameters. Parameters O3 and PM2.5 were easily rejected from the model. CO is mainly sourced from anthropogenic emissions and has a long atmospheric residence time (compared to SO2 and NO2). In addition, Hg emissions in Fujian Province were dominated by combustion sources (K. Liu et al., 2019). Hence, we used CO to represent anthropogenic Hg emissions. After determining the first parameter CO, we put the remaining parameters (WS, WD, T, RH, BLH, LCC, 24 h latitude, and 24 h longitude) into the model one by one. The performance of GAMs was judged according to Akaike information criterion (AIC) and R2 values. Specifically, as the parameters were successively added into the model, the AIC decreased, and R2 increased. In this step, WS, WD, and LCC were rejected. Based on this method, six variables including CO, RH, T, BLH, 24 h latitude, and 24 h longitude were eventually selected for the model (Table S2).
Considering that parameters of the same category might interact, we used interaction functions of tensors. RH, T, and BLH interaction was used to represent the meteorological factor. The 24 h latitude and 24 h longitude interaction, which indicates the backward trajectory endpoint location during the last 24 h, was used to represent the transportation factor. Given that the six selected variables passed the collinearity test, the three factors – anthropogenic Hg emissions represented by CO, meteorological factor represented by RH, T, and BLH interaction, and transportation represented by 24 h latitude and 24 h longitude interaction – were considered to be independent of each other. Those selected variables were used in the following model establishment.
Model establishment. GAMs were performed using R version 4.1.2 with the “mgcv” package. The equation can be described as follows:
where xj (j = 1, 2, 3, ..., k) are different meteorological predictors, and fj is a smooth function of the predictors; ε is the residual; μ is the expected value of the response variable; and g is the link function specifies the relationship between the nonlinear formulation and the expected value. We used the “identity link” function with a Gaussian distribution because the relationship between GEM and the three factors conformed to a Gaussian distribution and the estimation of GAMs was considered unbiased. In order to ensure the balance between under-fitting and overfitting of observation data, we used a penalized cubic regression as a smooth function. In the running process of the model, the concentration contribution of the smoothed independent variable (anthropogenic emissions, meteorological effects, and transportation) to the dependent variable (GEM) was output and converted into a contribution ratio, which is helpful to determine the degree of each variable driving the prediction. To eliminate the effect of seasonality on variance clustering, we used “seasons” as an input variable when building the model with the whole dataset and then ran the model separately in summer and winter.
Model quality control. The accuracy of GAMs simulation was assessed using a 10-fold cross-validation test. The principle of the test is dividing the whole dataset into 10 subsets randomly, and in each round of cross-validation, nine subsets are used to fit the model, and the remaining one is predicted. This process was repeated 10 times to ensure that every subset was tested. The 10-fold cross-validation results showed a good coincidence between the GAMs and cross-validated results (R2=0.89; Fig. S1), demonstrating the reliability of the established model. In order to test the underlying assumptions of homogeneity, normality, and independence of GAMs to ensure the validity and accuracy of the model, we used the following methods (Fig. S2): (1) quantile–quantile (QQ) plots (sample quantiles against theoretical quantiles), (2) scatterplots (residuals against linear predictors), (3) histograms of the residuals, and (4) scatter plots (response against fitted values). The QQ plot showed that the GAMs produced good results around the average concentrations, and the residuals showed a normal distribution.
3.1 Temporal variations of GEM concentrations
3.1.1 Inter-annual variation
Monthly concentrations of GEM ranged from 3.50 to 4.47 ng m−3 in January and 1.56 to 2.65 ng m−3 in July during the whole study period, with mean values of 4.04±1.01 ng m−3 and 2.29±0.83 ng m−3, respectively. The GEM concentrations in Xiamen were several times higher than the hemispheric background concentrations (∼1.5 ng m−3) (Sprovieri et al., 2016; Diéguez et al., 2019). Comparisons of TGM/GEM concentrations in Xiamen with other urban and rural areas in East Asia over the last decade are shown in Table 1. The mean concentrations of GEM mostly fell in a range of 2–5 ng m−3 in East Asia (except for some background sites). The winter GEM concentrations in Xiamen were slightly higher than those measured at rural and background monitoring sites such as Changdao Island, the Tibetan Plateau region, and Mt. Ailaoshan (H. Zhang et al., 2016; Yin et al., 2018; Wang et al., 2020), while they were lower than those reported from inland urban sites like Lanzhou, Nanjing, and Shanghai (Zhu et al., 2012; Duan et al., 2017; Yin et al., 2020). The summer GEM concentrations in Xiamen were relatively low, comparable to those of Changdao Island, Yongheung Island, and Fukuoka (Marumoto et al., 2015; Lee et al., 2016; Wang et al., 2020).
Table 1Comparisons of TGM/GEM concentrations in Xiamen with other urban and rural areas in East Asia over the period 2010–2020.

The inter-annual variability of GEM concentrations in January and July is shown in Fig. 2. The GEM concentrations in Xiamen showed a minor variation between years. Specifically, GEM concentrations in January were lowest in 2012 (3.50 ng m−3), highest in 2015 (4.47 ng m−3), and comparable in the years of 2013, 2017, and 2020, whereas GEM concentrations in July were highest in 2017 (2.65 ng m−3) and significantly lowest in 2020 (1.56 ng m−3). According to the published data, Wu et al. (2016) estimated atmospheric Hg emissions in China to have decreased from 547 t in 2010 to 530 t in 2014. The report from AMAP/UNEP showed that the anthropogenic Hg emissions in China were 565.2 t in 2015 relative to 575.2 t in 2010 (AMAP/UNEP, 2018). An inventory over the period 1978–2017 revealed that China's anthropogenic Hg emission was highest in 2013, and then it decreased until 2017 (K. Liu et al., 2019). It could be expected that the anthropogenic Hg emissions in China had a downward trend over the period 2012–2020 and that the peak emission was most likely to occur in 2012 to 2014 (Figs. S3, 4). Recent studies have indicated either a stable or a slight decreasing trend for GEM or TGM concentrations in Chinese cities after 2013 due to China having applied vigorous measures to control air pollution (Qin et al., 2020; Wu et al., 2020; Yin et al., 2020). For instance, it was reported that GEM concentrations at Chongming Island in East China significantly decreased from 2014 to 2016, and the inflection point occurred before 2014 (Tang et al., 2018). Note that these measurements mostly lasted for 2–4 years. So far, observations of GEM concentrations over a long time period have been scarce. Our result suggests that the influencing factors on the variation of GEM in East China were complex over the last decade.

Figure 3The diurnal trend of GEM concentrations in (a) January and (b) July over the study years. Note that the value of error bars has been reduced 10-fold.
Coal combustion is one of the leading mercury sources in China (Wu et al., 2006). Table S3 summarizes the consumption of coal and the statistics of annual SO2 and NOx emissions in Fujian Province over the period 2012–2020. The coal consumption in Fujian and China exhibited a similar variation, firstly decreasing to a valley in 2016 and then showing an upward trend from 2016 to 2020 (Fig. S5), whereas there was a decreasing trend for SO2 and NOx emissions during the whole study period, with a most remarkable reduction of emissions in 2016. In 2013, the Chinese State Council issued the Air Pollution Prevention and Control Action Plan. Since then, plenty of emissions control measures, like the acceleration of the elimination of backward production capacity, acceleration of the promotion of central heating, and the upgrade and building of air pollution control devices, have been widely implemented in China. Previous studies have found that mercury can be synergistically removed in the process of desulfurization and de-nitration (Y. Zhang et al., 2016; K. Liu et al., 2019). The installation of selective catalytic reduction to control nitrogen oxide emissions is often accompanied by the oxidation of GEM to GOM, and the combined application of selective catalytic reduction and flue gas desulfurization could further reduce TGM emissions to the atmosphere (Rallo et al., 2012). Nonetheless, the inconsistent inter-annual variation in GEM concentrations and SO2/NOx emissions indicates that additional factors, like GEM emission sources other than coal combustion and/or meteorological changes, strongly affected the inter-annual variation trend of GEM in the study region.
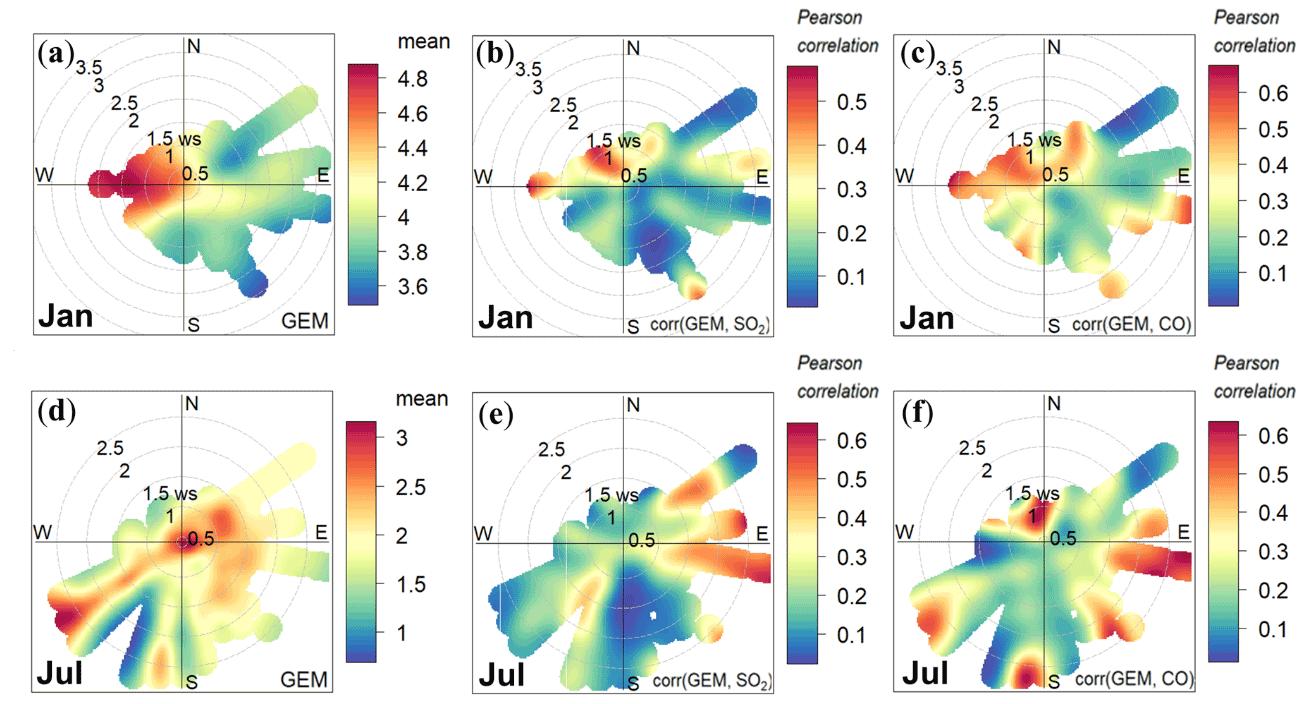
Figure 4Bivariate polar plots of GEM concentrations (a, d), the correlation coefficients of GEM with SO2 (b, e), and CO (c, f) as a function of WS and WD in January and July during the whole study period. Note that GEM is measured in nanograms per cubic meter (ng m−3), wind speed in meters per second (m s−1), and wind direction in degrees (∘).
3.1.2 Seasonal and diurnal patterns
The GEM concentrations in Xiamen were approximately 1.41–2.52 times higher in winter than in summer (P<0.001, one-way analysis of variance (ANOVA)) over the study years. A similar seasonal variation was widely observed in cities including Shanghai, Ningbo, Lanzhou, and Yongheung, as well as Gyodong Island, and Changdao Island (Yu et al., 2015; Y. Hong et al., 2016; Lee et al., 2016, 2019; Duan et al., 2017; Wang et al., 2020; Yi et al., 2020; Yin et al., 2020). However, a reverse seasonal variation with higher GEM in summer than in winter was observed in Nanjing, Chongming Island, Mt. Ailaoshan, and the Tibetan Plateau region (Zhu et al., 2012; H. Zhang et al., 2016; Tang et al., 2018; Yin et al., 2018). There were many factors responsible for the seasonal variation of GEM in Xiamen. In terms of Hg emission sources, local industrial emissions were relatively stable over the course of a year. The key factor with seasonal changes was the increased usage of coal for heating, which mainly occurred in northern China in cold seasons. Although there was no coal consumption for heating in southern China, GEM is well mixed due to its prolonged lifetime (0.5–2 years) (Schroeder and Munthe, 1998; Zhang et al., 2013). Monsoons change the source–receptor relationships at observation sites and thus affect the seasonal variation of GEM concentrations (Fu et al., 2015; C. Liu et al., 2019). For Xiamen, air masses in winter mainly originated from north directions, which passed through numerous intensive anthropogenic GEM emissions areas (Fig. 1a), while air mass in summer mainly originated from ocean with fewer GEM point sources. Another important factor is that the mixing heights were reduced due to a stable inversion layer in winter. As a result, GEM diffused slowly and accumulated easily in the surface layer. In addition, for the sites in the Northern Hemisphere, the greater removal of GEM by wet and dry deposition could also lead to lower GEM concentrations in warmer seasons (Fu et al., 2008; Tang et al., 2018).
The diurnal variations of bi-hourly GEM concentrations were consistent among the years (Fig. 3). In general, the GEM concentration peaked in the early morning, decreased to a valley in the afternoon, and then rose during the night. The diurnal pattern of GEM concentrations in January 2015 was more gentle than the same period in other years, which might be related to the enhanced effect of air mass transport (Fu et al., 2012; Nguyen et al., 2022). The diurnal pattern of GEM concentrations in Xiamen is consistent with other urban sites like Guiyang, Hefei, and Guangzhou (Feng et al., 2004; Chen et al., 2013; Fu et al., 2015). Previous studies often attributed diurnal variations of GEM to the effect of various anthropogenic emissions, photochemical oxidation, and the diurnal variation of BLH (Y. Hong et al., 2016; Duan et al., 2017). The diurnal pattern of GEM in Xiamen was similar to that of SO2, NO2, and CO (Fig. S6a–c), reflecting the combined effects of common anthropogenic emissions and the diel fluctuation in meteorology. The decreasing trend of GEM from early morning to afternoon was likely related to the intensified turbulent mixing in the boundary after sunrise, while the conditions were opposite at nighttime (Fig. S6d). The photo-oxidation of GEM might contribute a small part to the diurnal variation of GEM, but it was not the dominant factor for the daytime GEM reduction due to its low reaction rate in the study region.

Figure 5Concentration-weighted trajectory (CWT) in January (a, c, e, g, i) and July (b, d, f, h, j) during the study years. The legend represents the weighted GEM concentrations (ng m−3).
3.2 Potential source regions of GEM
3.2.1 Local emissions
According to the industrial Hg emissions inventory in China, the main Hg emissions industries included industrial coal combustion, coal-fired power plants, non-ferrous metal smelting, cement production, and waste incineration (Zhang et al., 2015; Wu et al., 2016). The relationships between the spatial distribution of industrial sources and bivariate polar plots of GEM concentrations would shed light on the influence of local anthropogenic point sources (within Xiamen) on GEM concentrations. As shown in Fig. 4a and d, the elevated GEM concentrations in the bivariate polar plots of individual seasons were highly concentrated, suggesting that the spatial distribution of main Hg point sources was similar among the years. However, the polar plot results of GEM concentrations were distinctly different between seasons, likely due to the shift in the dominant wind. In January, the elevated GEM concentrations were associated with a west wind, with a low WS of 0.5–2.0 m s−1 (Fig. 4a), which indicates nearby emission sources. These were likely industrial coal combustion and non-ferrous metal smelting upwind of the west of the monitoring site (Fig. 1b). Conventional pollutants are good indicators of primarily anthropogenic sources. In Xiamen, the coal-fired power plants contributed 57.8 % of local industrial SO2 emissions and 62.4 % of CO industrial emissions (Air pollution emissions inventory of Xiamen city in 2016, unpublished report). A close correlation of GEM with SO2 and CO in westerly WD with low speeds (Fig. 4b, c) further supported the above conclusion about the contribution of local industrial sources to GEM.
In July, the elevated GEM concentrations occurred when winds came from the southwest, with a WS of about 2.5–3 m s−1 (Fig. 4d). As shown in Fig. 1b, there are many industrial clusters in the southwest direction of the observation site including coal-fired power plants, industrial coal combustion, and nonferrous metal smelting. Accordingly, we suspected that the local industrial clusters upwind of the southwest of the study site caused an evident increase in GEM concentrations. A high WS of the southwest wind likely weakened the correlation between GEM and SO2 (Fig. 4e), while GEM and CO maintained a good correlation in the southwest wind due to their stable chemical properties (Fig. 4f). Another elevated GEM concentration condition occurred when wind came from the east, with a lower WS of 0–2 m s−1 (Fig. 4d). Such a low WS suggests a stagnant meteorological condition, which was unfavorable for GEM dispersion. In addition, GEM and SO2 showed a good correlation in the case of the east wind, with a WS of 1–2 m s−1. Hence, we could speculate that the upwind point sources, like industrial coal combustion and nonferrous metal smelting, as well as the adverse atmospheric diffusion conditions contributed to the increasing GEM concentrations. As shown in Table S4, GEM in Xiamen was overall positively correlated with SO2, NO2, CO, and PM2.5, but the correlation coefficient fluctuated remarkably among the years. In addition, the inter-annual variation of GEM concentrations did not coincide with that of SO2 or NOx emissions as mentioned above. Thus, the contribution of local Hg point sources to atmospheric GEM varied among the years, and this could not fully explain the inter-annual variation of GEM concentrations in the study region.
3.2.2 Long-distance migration
The results of CWT analysis based on HYSPLIT backward air mass trajectories are shown in Fig. 5. On the whole, the GEM concentrations in Xiamen were under the influence of continental air masses in January and the mixed influence of continental and marine air masses in July. To describe this better, the potential source regions of GEM were marked as Fujian Province, East China (EC), Southwest China (SWC), North China (NC), Central China (CC), South China Sea (SCS), Philippines Sea and Taiwan Strait (PhiS+TW), and Philippines Sea and East China Sea (PhiS+ECS). (Details of region definition are presented in the Supplement.)
It can be seen that the higher weights of CWT mostly dominated in Fujian Province and EC in January. The results could reasonably be expected because anthropogenic Hg emissions in East China were extremely large due to dense industry (Zhang et al., 2015). The potential source regions for GEM in Xiamen also included ECS in January 2012, CC in January 2017, and PhiS+TW in January 2020. The North China Plain region was one of the heaviest mercury-polluted areas in China (Zhang et al., 2015), but to our surprise, it did not become an important source region for Xiamen GEM. This is most likely due to the effect of transmission distances, while GEM concentrations decreased with long transport distances. In contrast, short air mass trajectories, like from the Fujian Province, indicated relatively stagnant air conditions, which are not conducive to the diffusion of GEM (Zhang et al., 2021). The weights of CWT in January 2015 were higher than those of other study years, and the region of high CWT values spread over Fujian Province and EC. Previous studies have also reported high levels of GEM in 2015 among urban Beijing, Changdao Island, rural Shanghai, and Chongming Island (Tang et al., 2018; Qin et al., 2020; Wang et al., 2020; Wu et al., 2020), which suggests a heavy GEM pollution on a large regional scale during 2015. The high GEM concentrations in January 2015 were likely due to a combination of high-level Hg emissions and adverse meteorological conditions. The annual atmospheric mercury emissions in China were about 565 t in 2015, which is roughly 20 % higher than in 2010 (AMAP/UNEP, 2018). According to an anthropogenic mercury emissions inventory in China for 1978–2017, mercury emissions might have peaked around 2013 and remained high in 2015 (Fig. S2). In addition, an adverse effect of meteorological conditions due to an extreme 2015–2016 El Niño event might also have resulted in an increase of GEM concentrations in 2015 (Nguyen et al., 2022).
The dominant clean marine air masses helped explain the lower concentration of GEM in July than in January. As shown in Fig. 5, the dominant source regions for GEM in Xiamen in July mostly were SCS and PhiS+TW. The evasion of GEM from the ocean to the atmosphere was reported to be an important natural source (accounting for 50 %) (Mason, 2008). When under the control of marine air masses, the ocean emissions would become a significant source for GEM in the study region. The CWT values were extremely high in SCS in July 2012 and in PhiS+TW in July 2017, while the CWT values were elevated in SCS and ECS in July 2015. The relatively high GEM concentrations for Xiamen in July 2017 were likely associated with the contribution of extremely high GEM from PhiS+TW. The elevated GEM concentrations for Xiamen in July 2015 passed more closely through Southeast Asia, where intense biomass burning often occurred (Friedli et al., 2009; Sheu et al., 2013; Liu et al., 2016). A previous study on Hainan Island also pointed to the possibility of long-range transport of GEM from Southeast Asia to South China (Liu et al., 2016).
3.3 Factors affecting GEM concentrations
3.3.1 Model evaluation
GAMs were applied to investigate the influencing factors on the inter-annual variation of GEM in this study. The fitted (observed) GEM concentrations derived from the GAMs were approximately 3.98±0.47 ng m−3 (4.00±0.84 ng m−3) in January and 2.25±0.41 ng m−3 (2.23±0.61 ng m−3) in July, reflecting that the model approximates the concentration of GEM to the mean. The observed and fitted GEM concentrations showed a good consistency in time series (Fig. 6a), and the residuals were normally distributed (Fig. 6b). The R2 of the observed and fitted GEM concentrations was 0.75 (Fig. S7), and the variance interpretation rate was 75.8 %. In previous studies using GAMs to quantify impact factors on air pollutants, the R2 was generally between 0.35 and 0.86 (Gong et al., 2018; Li et al., 2019; Wu et al., 2020, 2021; Zhang et al., 2021). The fitted result of the GAMs in our study falls in this range.

Figure 6Time series of (a) observed and fitted GEM concentrations in January and July and (b) residual distribution during the whole study period.
3.3.2 Inter-annual variations of factor contributions
The six screened variables represented the factors of anthropogenic emissions (CO), meteorology (T, RH, and BLH interaction), and transportation (24 h latitude and 24 h longitude interaction). The contributions of the three factors to the variation of GEM concentrations in January and July of the study years are shown in Fig. 7. The inter-annual interpretation rate of anthropogenic emissions varied from 27.8 % to 50.8 % in January and from 26.9 % to 59.5 % in July, with a mean value of 37.8±11.9 % during the whole study period. The interpretation rate of the emission factor to the variation of GEM concentrations was pronouncedly high in 2012 and decreased overall to 2020. China adopted a series of desulfurization and denitrification measures for air pollution control during the period 2010–2015. The capacity of desulfurization and denitrification units in China had reached 99 % and 92 % of the total installed capacity of coal power plants, and 1.6×10⁸ kW was upgraded to achieve ultra-low emissions by 2015. In addition, strict restrictions of mercury on mining, production, use, import, and export have also been imposed in China since 2017 (http://www.mee.gov.cn, last access: 17 May 2022). We observed a positive relationship between GEM and the representative variable CO in most of the CO-observed range (Fig. 8a, b). That is, GEM concentrations basically decreased with the reduction of CO which stands for anthropogenic emissions. The most significant reduction in GEM concentrations explained by anthropogenic emissions was 0.55 ng m−3 from July 2012 to July 2013 and 0.74 ng m−3 from January 2013 to January 2015. The results reveal that the vigorous air pollution control measures in China were very effective in reducing GEM concentrations in the study region.
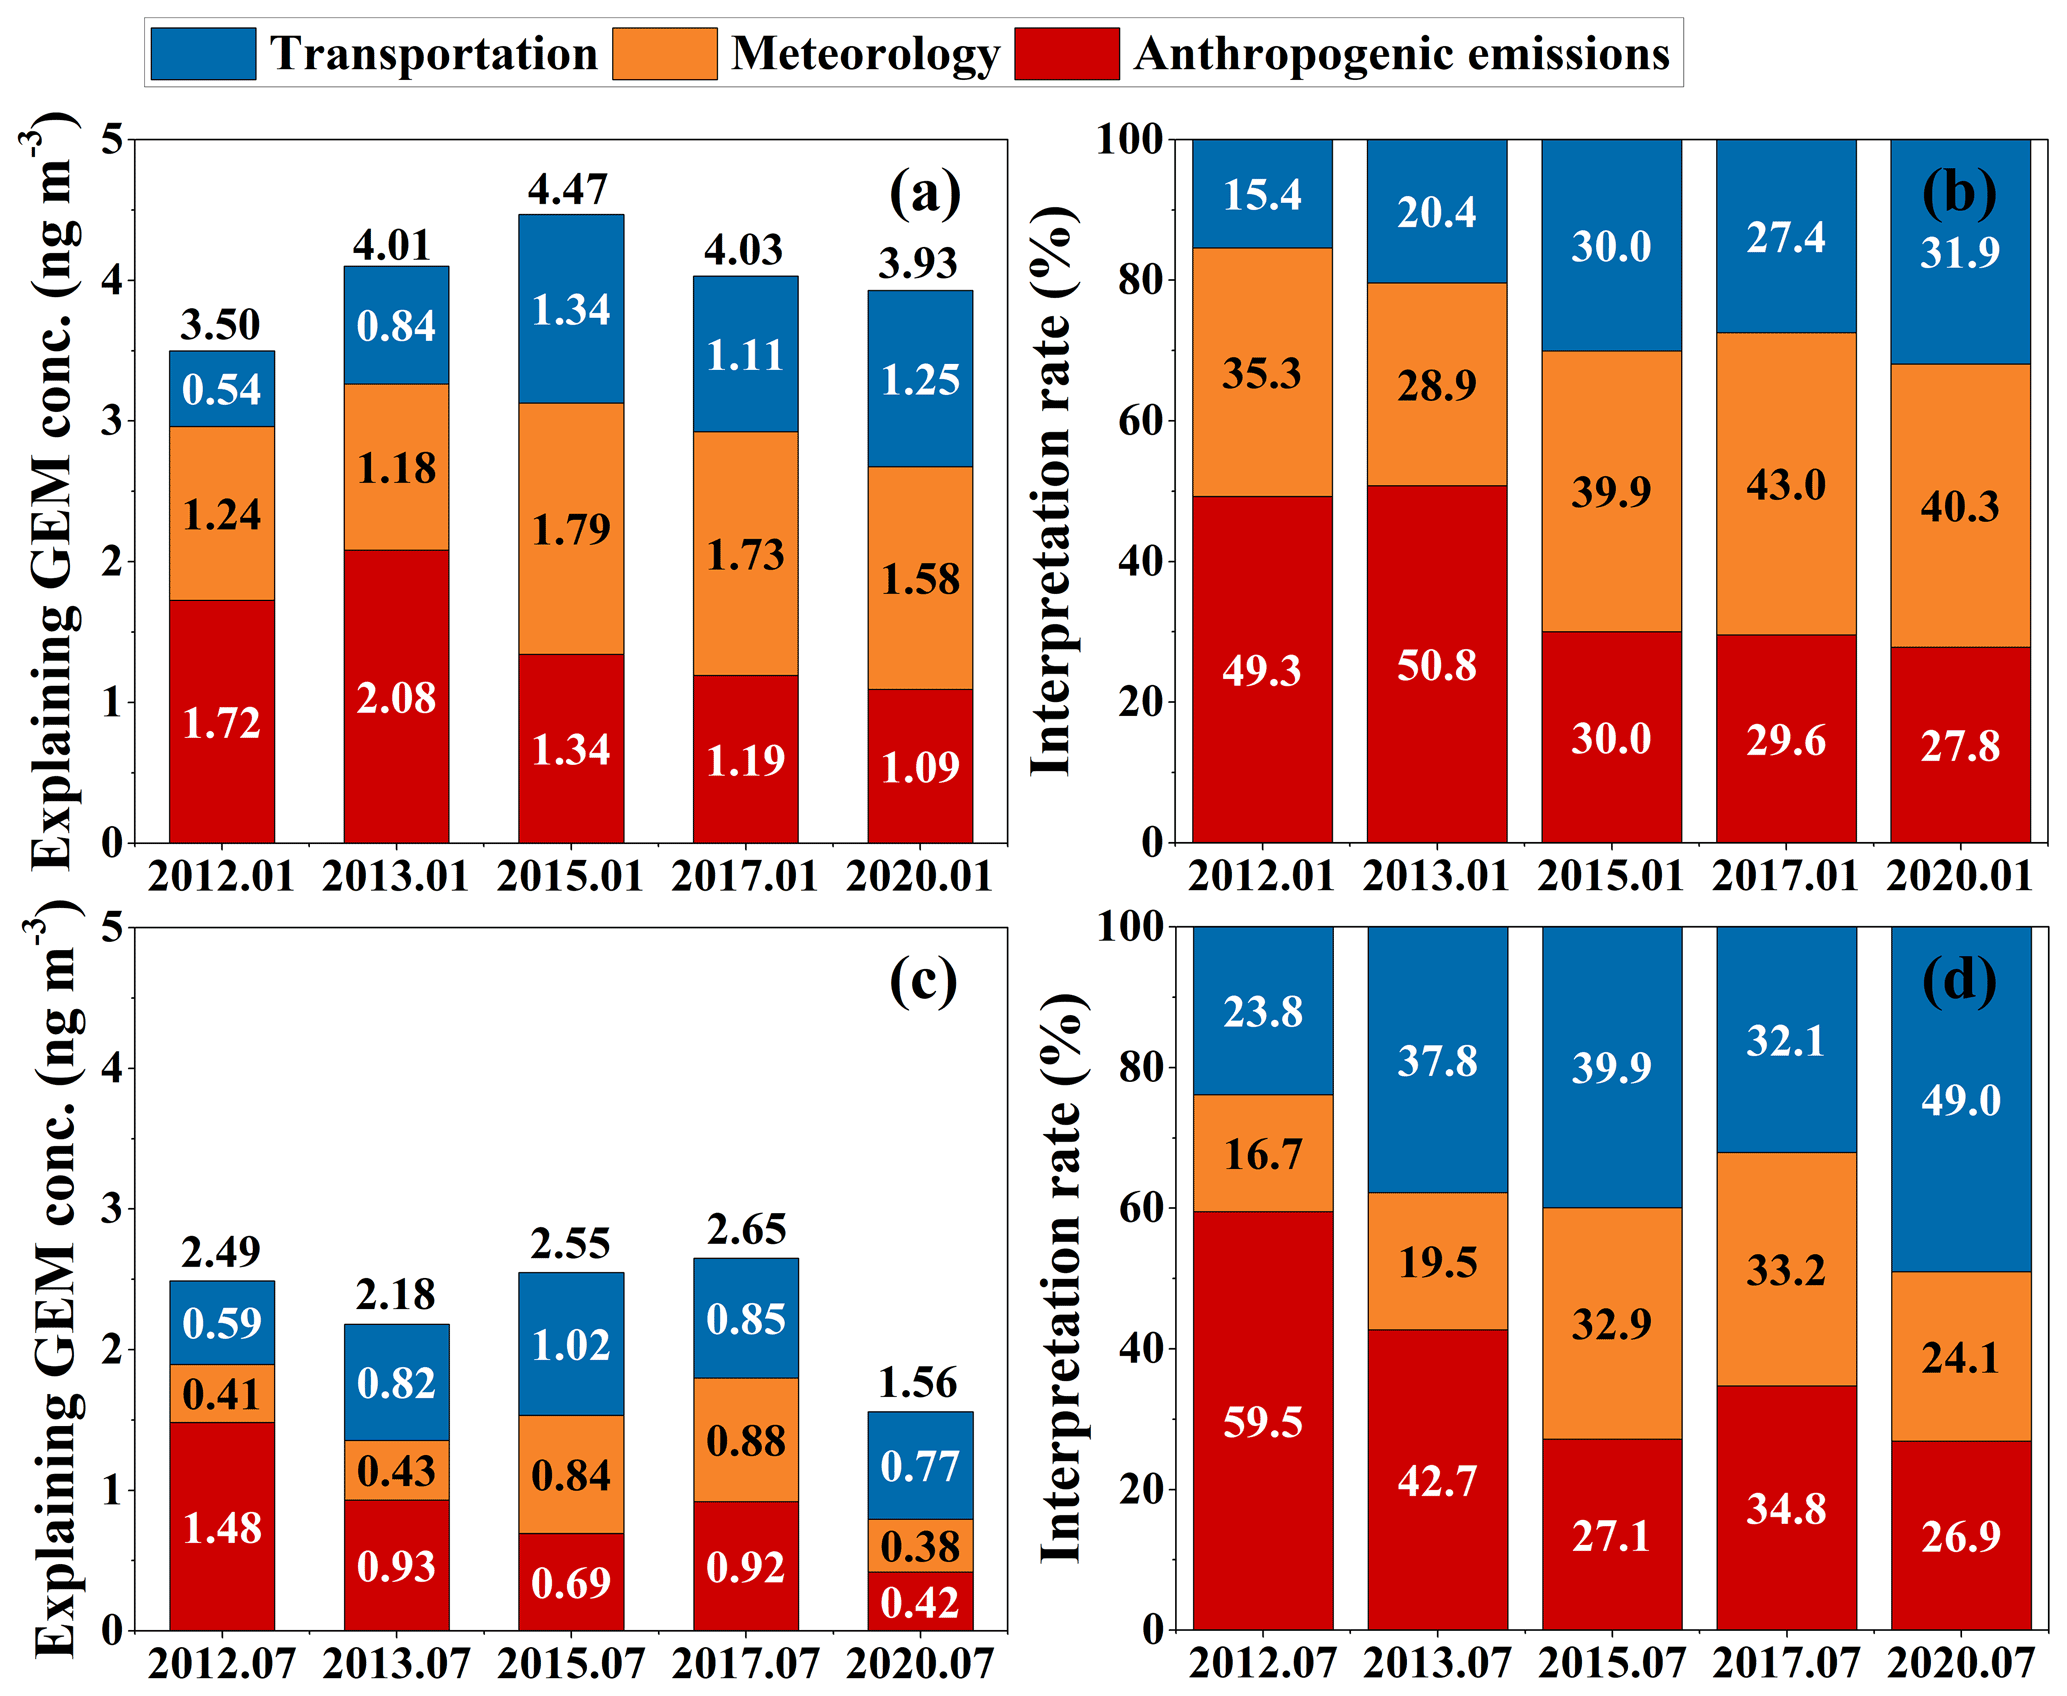
Figure 7The explaining concentration (ng m−3) (a, c) and interpretation rate (%) (b, d) of the three factors to the variation of GEM concentrations during the study years.
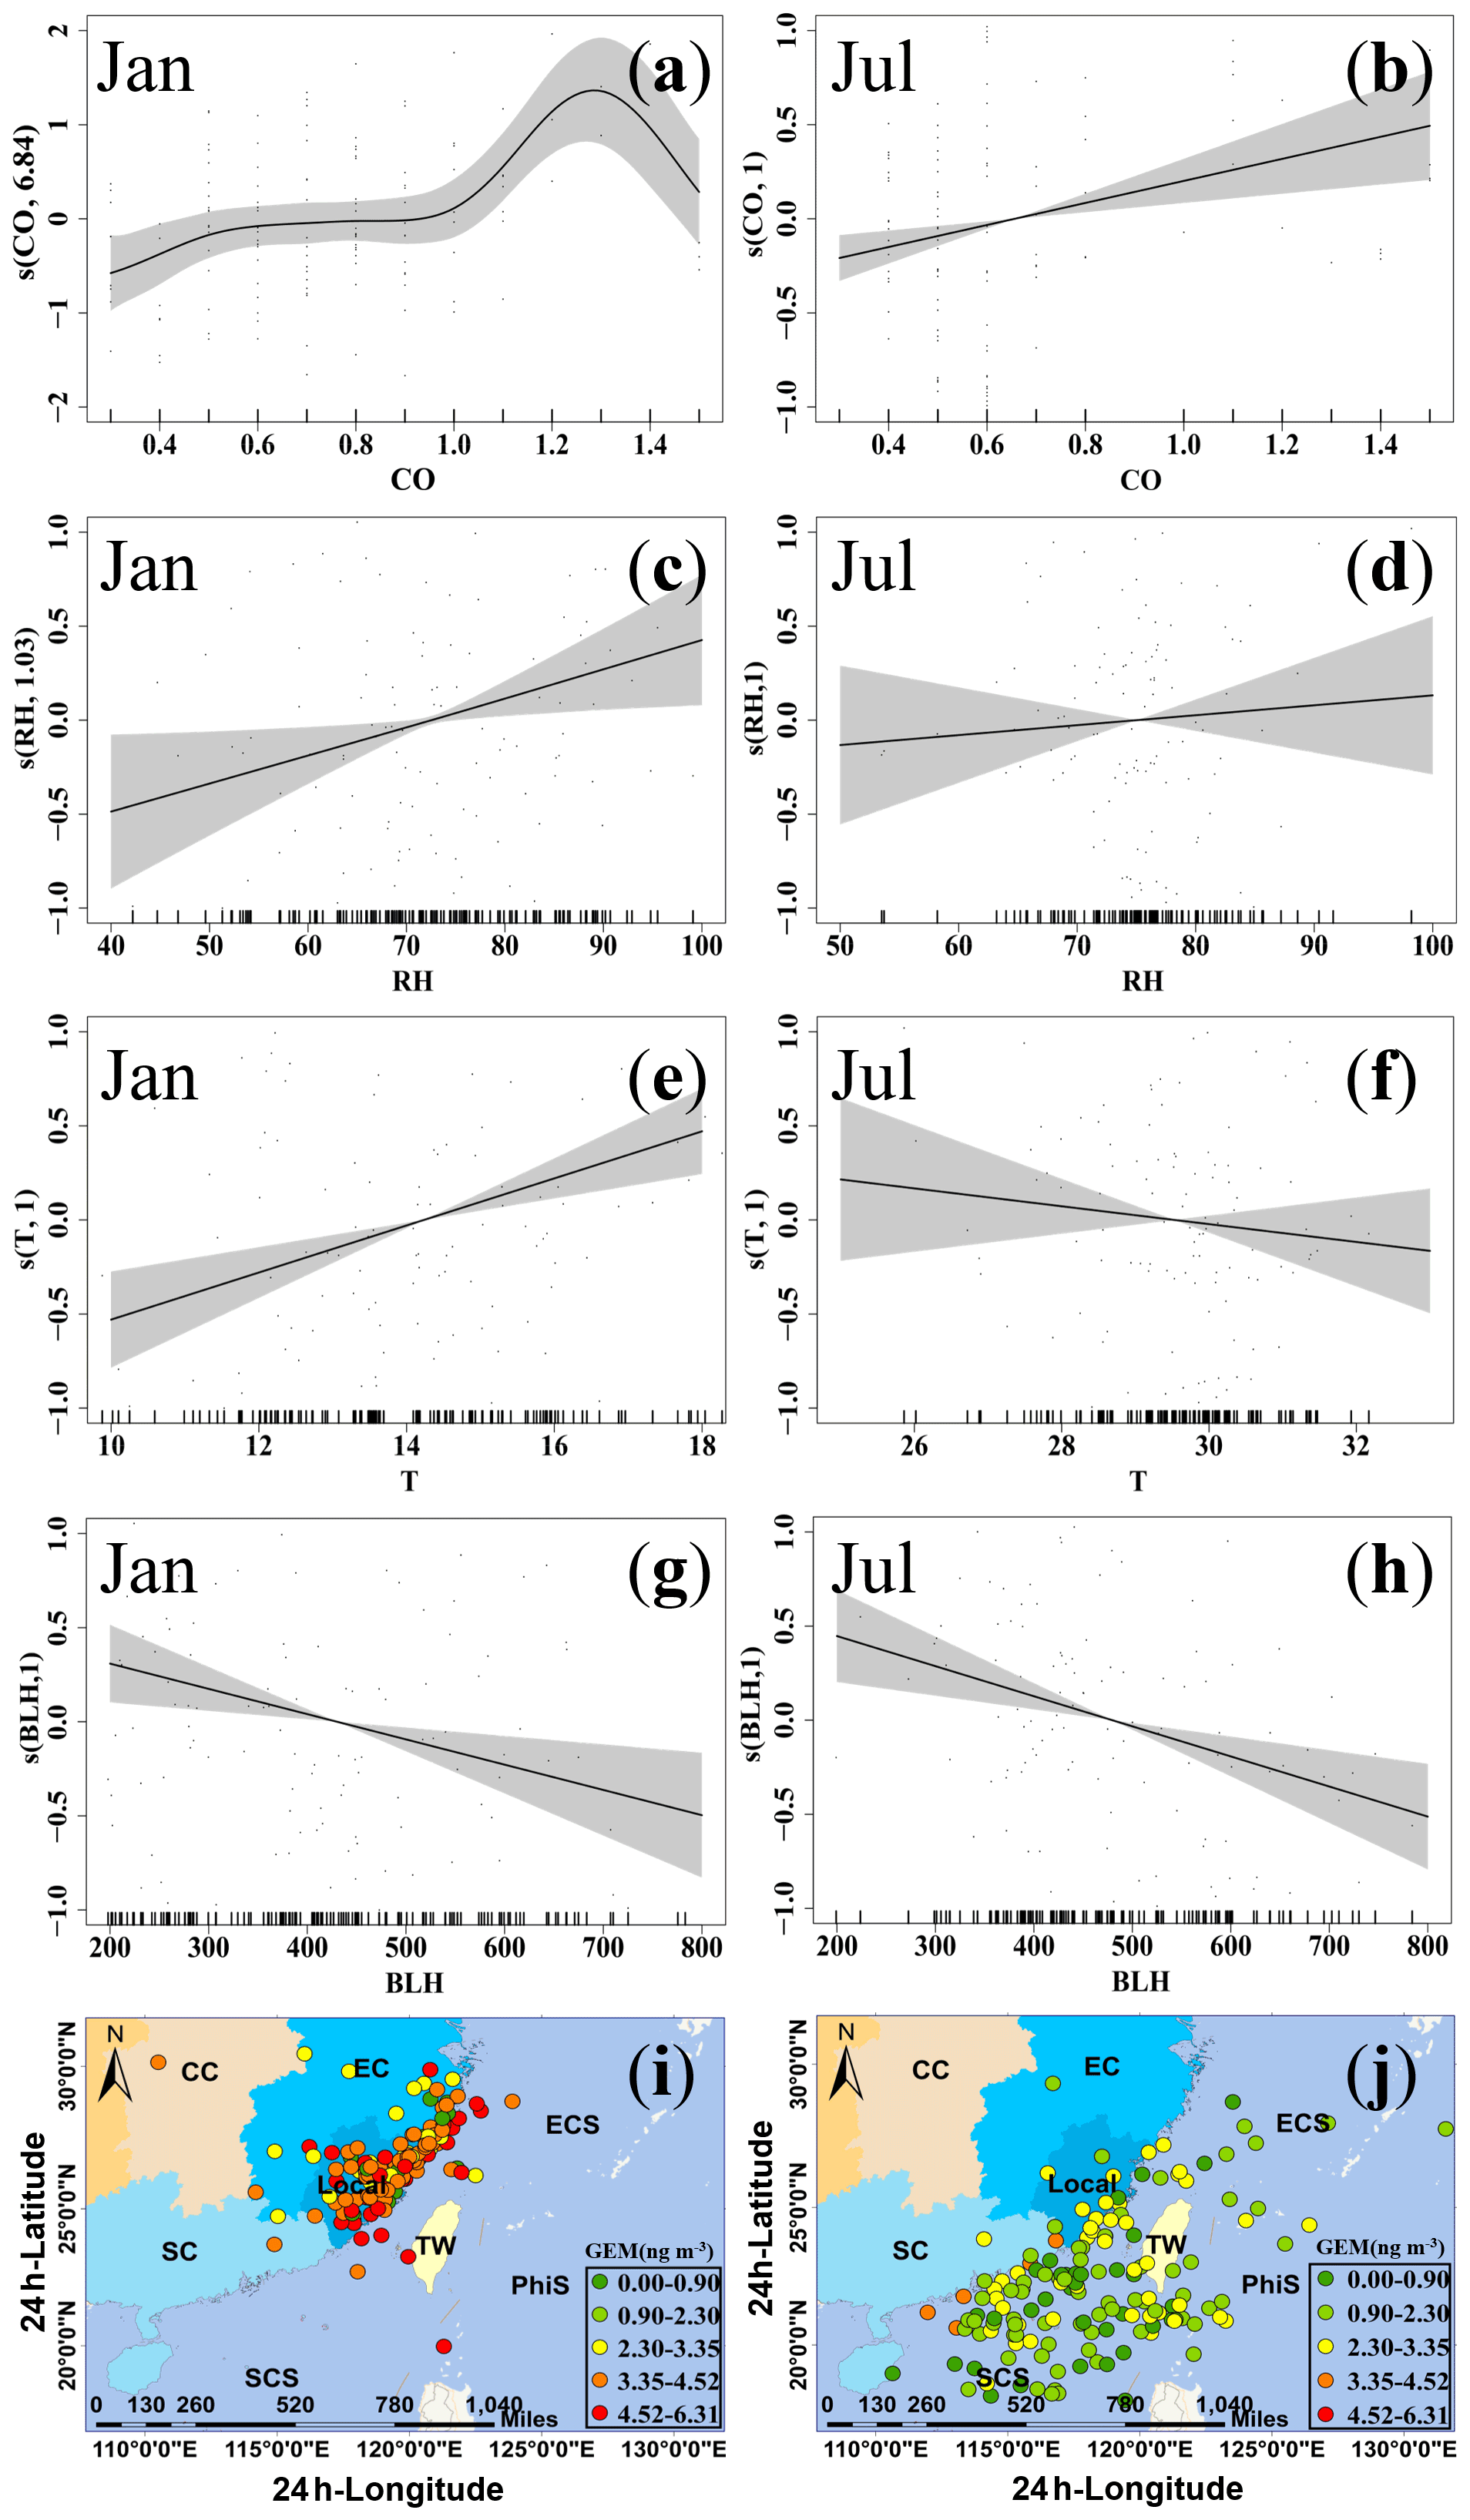
Figure 8Spline of GEM to the chosen variables, (a, b) CO (mg m−3) in January and July, (c, d) RH (%) in January and July, (e, f) temperature (∘C) in January and July, (g, h) BLH (m) in January and July, and (i, j) 24 h longitude and 24 h latitude in January and July. The grey background around the line is 95 % confidence bounds for the response. The short lines on the x axes show the distribution of data points. The numbers in brackets on the y axis labels are the estimated degrees of freedom. The colored dots in (i, j) represent the interactive influence of 24 h backward trajectories' latitude and longitude coordinates.
Meteorology was another important factor which explained, on average, 31.4 %±9.0 % to the variation of GEM concentrations during the whole study period. The inter-annual interpretation rate of meteorology largely varied from 28.9 % to 43.0 % in January and from 16.7 % to 33.2 % in July. The largest part of GEM concentrations explained by meteorological factor occurred in January 2015 and July 2017, which were 1.79 and 0.88 ng m−3, respectively. The meteorological factor was represented by RH, T, and BLH interaction, which influenced GEM variations by several pathways. One is that the meteorological factor drives the Hg chemical transformation (Ariya et al., 2015). In this study, GEM concentrations linearly increased with the increasing RH (Fig. 8c). The increase in RH might enhance the liquid-phase reduction of the process that converts reactive Hg to GEM (Horowitz et al., 2017; Saiz-Lopez et al., 2018; Huang et al., 2019). Another important role is that the meteorological factor is highly related to the Hg emissions from natural surfaces. According to Fig. 8e and f, GEM concentrations increased with the increase of temperature in January, possibly because the increase of temperature would have promoted the Hg emissions from the natural surface (Horowitz et al., 2017; Qin et al., 2019). The meteorological factor also affects the physical state of the atmosphere. A higher BLH likely indicated good diffusion conditions and was more conducive to the reduction of GEM concentrations (Fig. 8g, h). A case in 18–28 January 2013 showed that the daily GEM concentrations increased with the increase of T and RH as well as the decrease of BLH (Fig. S8). The case also implies that increased temperature likely accelerated natural surface emissions and that high RH being favorable for the liquid-phase reduction of reactive Hg to GEM contributed to GEM in the atmosphere.
Regional transportation explained a comparable proportion of GEM concentrations with the meteorological factor, which made up 30.8±9.9 % of total variation during the whole study period. During the period of 2012–2020, the interpretation rate of transportation displayed an increasing variation from 15.4 % to 31.9 % in January and a slightly large variation between 23.8 % and 49.0 % in July. The endpoint of 24 h backward trajectories and corresponding GEM concentrations are shown in Fig. 8i, j. The high GEM concentrations mostly presented in the areas with 24 h longitude of 116–124∘ E and 24 h latitude of 24–30∘ N. This is consistent with the backward trajectory results in Sect. 3.3.2 that the main source regions of GEM were Fujian Province and East China. The interpretation rate of transportation increased significantly among the years, indicating the growing importance of transportation from the high Hg emission zone to a low-emission zone in the background of national anthropogenic emissions reduction.
Long-term observation of GEM concentrations, along with conventional pollutants and meteorological parameters, was conducted in Xiamen, Southeast China. GEM concentrations showed no distinct variation trends over the period 2012–2020. GEM concentrations in January were highest in 2015 (4.47 ng m−3) and decreased to 2020 (3.93 ng m−3), while GEM concentrations in July were highest in 2017 (2.65 ng m−3) and lowest in 2020 (1.56 ng m−3). The temporal variation of GEM was characterized by higher values in winter than in summer and in nighttime than in daytime, which is consistent with values in most urban cities.
Upwind point sources within Xiamen contributed to the elevated GEM concentrations at the study site. Nevertheless, the inter-annual variation trend of GEM was not consistent with that of local SO2 and NOx emissions, suggesting that anthropogenic emissions might not be the dominant influencing factor for GEM variation. The CWT results showed that the pronounced high GEM concentrations in winter 2015 were a regional phenomenon, which was likely due to a combination of high-level Hg emissions and adverse meteorological conditions.
The three factors anthropogenic emissions, meteorological conditions, and transportation, which were represented by CO; RH, T, and BLH interaction; and 24 h longitude and 24 h latitude interaction, explained 37.8 %±11.9 %, 31.4 %±9.0 %, and 30.8 %±9.9% of the variation of GEM concentrations during the whole study period, respectively. There was a positive relationship of GEM with T and RH, suggesting that the meteorological factor influenced GEM variations via several pathways, possibly by affecting the emissions from the natural surface and the liquid-phase reduction of reactive Hg to GEM. The interpretation rate of transportation and meteorology on GEM variations displayed an increasing trend. In contrast, anthropogenic emissions have showed a decreasing interpretation rate since 2012, indicating the effectiveness of emission mitigation measures in reducing GEM concentrations in the study region.
A dataset for this paper can be accessed at https://doi.org/10.5281/zenodo.6573605 (Shi et al., 2022). High-altitude meteorology parameters can be acquired from the European Centre for Medium-Range Weather Forecasts (ECMWF) reanalysis (https://cds.climate.copernicus.eu/cdsapp#!/dataset/reanalysis-era5-single-levels?tab=form, last access: 23 March 2022; Hersbach et al., 2018), Gridded meteorological data are available from the Global Data Assimilation System (ftp://ftp.arl.noaa.gov/pub/archives/gdas1, last access: 5 May 2022; Draxler and Rolph, 2004). Details are also available upon request from the corresponding author.
The supplement related to this article is available online at: https://doi.org/10.5194/acp-22-11187-2022-supplement.
JS and LX designed this study and analyzed the data. YuC, LX, YH, ML, XF, YaC, CY, GC, TL, XJ, and JC were involved in the scientific discussion and offered valuable suggestions for modifications. JS and LX wrote the manuscript. YuC and JC helped revise the manuscript, and LY managed finances. All authors reviewed the paper.
The contact author has declared that none of the authors has any competing interests.
Publisher's note: Copernicus Publications remains neutral with regard to jurisdictional claims in published maps and institutional affiliations.
We would like to thank the Xiamen Atmospheric Environment Observation and Research Station of Fujian Province for providing data support for this research. We would like to thank Siqing Zhang for his help with the daily maintenance of the Tekran system. We also thank the members of the Atmospheric Environment Research Group of the Urban Environment Institute for their help and support with data analysis.
This research has been supported by the National Natural Science Foundation of China (grant nos. 21507127 and 41575146) and the CAS Center for Excellence in Regional Atmospheric Environment (grant no. E0L1B20201).
This paper was edited by Aurélien Dommergue and reviewed by two anonymous referees.
AMAP/UNEP (Arctic Monitoring and Assessment Programme and United Nations Environment Programme): Global mercury assessment 2018 – draft technical background document, AMAP/UNEP, Geneva, Switzerland, 430, ISBN 978-82-7971-108-7, 2018.
Ariya, P. A., Amyot, M., Dastoor, A., Deeds, D., Feinberg, A., Kos, G., Poulain, A., Ryjkov, A., Semeniuk, K., Subir, M., and Toyota, K.: Mercury physicochemical and biogeochemical transformation in the atmosphere and at atmospheric interfaces: a review and future directions, Chem. Rev., 115, 3760–3802, https://doi.org/10.1021/cr500667e, 2015.
Axelrad, D. A., Bellinger, D. C., Ryan, L. M., and Woodruff, T. J.: Dose-response relationship of prenatal mercury exposure and IQ: an integrative analysis of epidemiologic data, Environ. Health Perspect., 115, 609–615, https://doi.org/10.1289/ehp.9303, 2007.
Cai, X. R., Cai, B. F., Zhang, H. R., Chen, L., Zheng, C. Y., Tong, P. F., Lin, H. M., Zhang, Q. R., Liu, M. D., Tong, Y. D., and Wang, X. J.: Establishment of High-Resolution Atmospheric Mercury Emission Inventories for Chinese Cement Plants Based on the Mass Balance Method, Environ. Sci. Technol., 54, 13399–13408, https://doi.org/10.1021/acs.est.0c02963, 2020.
Chen, L., Liu, M., Xu, Z., Fan, R., Tao, J., Chen, D., Zhang, D., Xie, D., and Sun, J.: Variation trends and influencing factors of total gaseous mercury in the Pearl River Delta – A highly industrialised region in South China influenced by seasonal monsoons, Atmos. Environ., 77, 757–766, https://doi.org/10.1016/j.atmosenv.2013.05.053, 2013.
Cheng, I., Zhang, L., Blanchard, P., Dalziel, J., and Tordon, R.: Concentration-weighted trajectory approach to identifying potential sources of speciated atmospheric mercury at an urban coastal site in Nova Scotia, Canada, Atmos. Chem. Phys., 13, 6031–6048, https://doi.org/10.5194/acp-13-6031-2013, 2013.
Custodio, D., Ebinghaus, R., Spain, T. G., and Bieser, J.: Source apportionment of atmospheric mercury in the remote marine atmosphere: Mace Head GAW station, Irish western coast, Atmos. Chem. Phys., 20, 7929–7939, https://doi.org/10.5194/acp-20-7929-2020, 2020.
Diéguez, M. C., Bencardino, M., García, P. E., D'Amore, F., Castagna, J., De Simone, F., Soto Cárdenas, C., Ribeiro Guevara, S., Pirrone, N., and Sprovieri, F.: A multi-year record of atmospheric mercury species at a background mountain station in Andean Patagonia (Argentina): Temporal trends and meteorological influence, Atmos. Environ., 214, 116819, https://doi.org/10.1016/j.atmosenv.2019.116819, 2019.
Draxler, R. R. and Rolph, G. D.: HYSPLIT (HYbrid Single-particle Lagrangian Integrated Trajectory) Model Access via NOAA ARL READY Website, NOAA Air Resour. Lab., Silver Spring, Md., ftp://ftp.arl.noaa.gov/pub/archives/gdas1 (last access: 26 August 2022), 2004.
Duan, L., Wang, X., Wang, D., Duan, Y., Cheng, N., and Xiu, G.: Atmospheric mercury speciation in Shanghai, China, Sci. Total Environ., 578, 460–468, https://doi.org/10.1016/j.scitotenv.2016.10.209, 2017.
Fang, G. C., Lo, C. T., Cho, M. H., Zhuang, Y. J., Tsai, K. H., Huang, C. Y., and Xiao, Y. F.: Annual ambient atmospheric mercury speciation measurement from Longjing, a rural site in Taiwan, Environ. Geochem. Health, 39, 901–911, https://doi.org/10.1007/s10653-016-9861-x, 2017.
Feng, X., Shang, L., Wang, S., Tang, S., and Zheng, W.: Temporal variation of total gaseous mercury in the air of Guiyang, China, J. Geophys. Res.-Atmos., 109, D03303, https://doi.org/10.1029/2003jd004159, 2004.
Friedli, H. R., Arellano, A. F., Cinnirella, S., and Pirrone, N.: Initial estimates of mercury emissions to the atmosphere from global biomass burning, Environ. Sci. Technol., 43, 3507–3513, https://doi.org/10.1021/es802703g, 2009.
Fu, X., Feng, X., Zhu, W., Wang, S., and Lu, J.: Total gaseous mercury concentrations in ambient air in the eastern slope of Mt. Gongga, South-Eastern fringe of the Tibetan plateau, China, Atmos. Environ., 42, 970–979, https://doi.org/10.1016/j.atmosenv.2007.10.018, 2008.
Fu, X. W., Zhang, H., Yu, B., Wang, X., Lin, C.-J., and Feng, X. B.: Observations of atmospheric mercury in China: a critical review, Atmos. Chem. Phys., 15, 9455–9476, https://doi.org/10.5194/acp-15-9455-2015, 2015.
Fu, X. W., Feng, X., Liang, P., Deliger, Zhang, H., Ji, J., and Liu, P.: Temporal trend and sources of speciated atmospheric mercury at Waliguan GAW station, Northwestern China, Atmos. Chem. Phys., 12, 1951–1964, https://doi.org/10.5194/acp-12-1951-2012, 2012.
Gong, X., Hong, S., and Jaffe, D. A.: Ozone in China: Spatial Distribution and Leading Meteorological Factors Controlling O3 in 16 Chinese Cities, Aerosol Air Qual. Res., 18, 2287–2300, https://doi.org/10.4209/aaqr.2017.10.0368, 2018.
Gong, X., Kaulfus, A., Nair, U., and Jaffe, D. A.: Quantifying O3 Impacts in Urban Areas Due to Wildfires Using a Generalized Additive Model, Environ. Sci. Technol., 51, 13216–13223, https://doi.org/10.1021/acs.est.7b03130, 2017.
Hersbach, H., Bell, B., Berrisford, P., Biavati, G., Horányi, A., Muǹoz Sabater, J., Nicolas, J., Peubey, C., Radu, R., Rozum, I., Schepers, D., Simmons, A., Soci, C., Dee, D., and Thépaut, J.-N.: ERA5 hourly data on single levels from 1959 to present. Copernicus Climate Change Service (C3S) Climate Data Store (CDS), https://doi.org/10.24381/cds.adbb2d47, 2018.
Hong, Q., Xie, Z., Liu, C., Wang, F., Xie, P., Kang, H., Xu, J., Wang, J., Wu, F., He, P., Mou, F., Fan, S., Dong, Y., Zhan, H., Yu, X., Chi, X., and Liu, J.: Speciated atmospheric mercury on haze and non-haze days in an inland city in China, Atmos. Chem. Phys., 16, 13807–13821, https://doi.org/10.5194/acp-16-13807-2016, 2016.
Hong, Y., Chen, J., Deng, J., Tong, L., Xu, L., Niu, Z., Yin, L., Chen, Y., and Hong, Z.: Pattern of atmospheric mercury speciation during episodes of elevated PM2.5 levels in a coastal city in the Yangtze River Delta, China, Environ. Pollut., 218, 259–268, https://doi.org/10.1016/j.envpol.2016.06.073, 2016.
Horowitz, H. M., Jacob, D. J., Zhang, Y., Dibble, T. S., Slemr, F., Amos, H. M., Schmidt, J. A., Corbitt, E. S., Marais, E. A., and Sunderland, E. M.: A new mechanism for atmospheric mercury redox chemistry: implications for the global mercury budget, Atmos. Chem. Phys., 17, 6353–6371, https://doi.org/10.5194/acp-17-6353-2017, 2017.
Huang, Q., Chen, J., Huang, W., Reinfelder, J. R., Fu, P., Yuan, S., Wang, Z., Yuan, W., Cai, H., Ren, H., Sun, Y., and He, L.: Diel variation in mercury stable isotope ratios records photoreduction of PM2.5-bound mercury, Atmos. Chem. Phys., 19, 315–325, https://doi.org/10.5194/acp-19-315-2019, 2019.
Lee, G.-S., Kim, P.-R., Han, Y.-J., Holsen, T. M., Seo, Y.-S., and Yi, S.-M.: Atmospheric speciated mercury concentrations on an island between China and Korea: sources and transport pathways, Atmos. Chem. Phys., 16, 4119–4133, https://doi.org/10.5194/acp-16-4119-2016, 2016.
Lee, S.-H., Lee, J.-I., Kim, P.-R., Kim, D.-Y., Jeon, J.-W., and Han, Y.-J.: Factors influencing concentrations of atmospheric speciated mercury measured at the farthest island West of South Korea, Atmos. Environ., 213, 239–249, https://doi.org/10.1016/j.atmosenv.2019.05.063, 2019.
Li, K., Jacob, D. J., Liao, H., Shen, L., Zhang, Q., and Bates, K. H.: Anthropogenic drivers of 2013–2017 trends in summer surface ozone in China, P. Natl. Acad. Sci. USA, 116, 422–427, https://doi.org/10.1073/pnas.1812168116, 2019.
Liu, C., Fu, X., Zhang, H., Ming, L., Xu, H., Zhang, L., and Feng, X.: Sources and outflows of atmospheric mercury at Mt. Changbai, northeastern China, Sci. Total Environ., 663, 275–284, https://doi.org/10.1016/j.scitotenv.2019.01.332, 2019.
Liu, K., Wang, S., Wu, Q., Wang, L., Ma, Q., Zhang, L., Li, G., Tian, H., Duan, L., and Hao, J.: A Highly Resolved Mercury Emission Inventory of Chinese Coal-Fired Power Plants, Environ. Sci. Technol., 52, 2400–2408, https://doi.org/10.1021/acs.est.7b06209, 2018.
Liu, K., Wu, Q., Wang, L., Wang, S., Liu, T., Ding, D., Tang, Y., Li, G., Tian, H., Duan, L., Wang, X., Fu, X., Feng, X., and Hao, J.: Measure-Specific Effectiveness of Air Pollution Control on China's Atmospheric Mercury Concentration and Deposition during 2013-2017, Environ. Sci. Technol., 53, 8938–8946, https://doi.org/10.1021/acs.est.9b02428, 2019.
Liu, M., Chen, L., Xie, D., Sun, J., He, Q., Cai, L., Gao, Z., and Zhang, Y.: Monsoon-driven transport of atmospheric mercury to the South China Sea from the Chinese mainland and Southeast Asia-Observation of gaseous elemental mercury at a background station in South China, Environ. Sci. Pollut. Res., 23, 21631–21640, https://doi.org/10.1007/s11356-016-7432-4, 2016.
Marumoto, K., Hayashi, M., and Takami, A.: Atmospheric mercury concentrations at two sites in the Kyushu Islands, Japan, and evidence of long-range transport from East Asia, Atmos. Environ., 117, 147–155, https://doi.org/10.1016/j.atmosenv.2015.07.019, 2015.
Mason, R.: Mercury emissions from natural sources and their importance in the global mercury cycle, Chapter 7. Interim Report of the UNEP Global Partnership on Atmospheric Mercury Transport and Fate Research, 20, https://doi.org/10.1007/978-0-387-93958-2, 2008.
Nguyen, L. S. P., Nguyen, K. T., Griffith, S. M., Sheu, G. R., Yen, M. C., Chang, S. C., and Lin, N. H.: Multiscale Temporal Variations of Atmospheric Mercury Distinguished by the Hilbert-Huang Transform Analysis Reveals Multiple El Nino-Southern Oscillation Links, Environ. Sci. Technol., 56, 1423–1432, https://doi.org/10.1021/acs.est.1c03819, 2022.
Qin, X., Wang, X., Shi, Y., Yu, G., Zhao, N., Lin, Y., Fu, Q., Wang, D., Xie, Z., Deng, C., and Huang, K.: Characteristics of atmospheric mercury in a suburban area of east China: sources, formation mechanisms, and regional transport, Atmos. Chem. Phys., 19, 5923–5940, https://doi.org/10.5194/acp-19-5923-2019, 2019.
Qin, X., Zhang, L., Wang, G., Wang, X., Fu, Q., Xu, J., Li, H., Chen, J., Zhao, Q., Lin, Y., Huo, J., Wang, F., Huang, K., and Deng, C.: Assessing contributions of natural surface and anthropogenic emissions to atmospheric mercury in a fast-developing region of eastern China from 2015 to 2018, Atmos. Chem. Phys., 20, 10985–10996, https://doi.org/10.5194/acp-20-10985-2020, 2020.
Rallo, M., Lopez-Anton, M. A., Contreras, M. L., and Maroto-Valer, M. M.: Mercury policy and regulations for coal-fired power plants, Environ. Sci. Pollut. Res. Int., 19, 1084–1096, https://doi.org/10.1007/s11356-011-0658-2, 2012.
Roman, H. A., Walsh, T. L., Coull, B. A., Dewailly, E., Guallar, E., Hattis, D., Marien, K., Schwartz, J., Stern, A. H., Virtanen, J. K., and Rice, G.: Evaluation of the cardiovascular effects of methylmercury exposures: current evidence supports development of a dose-response function for regulatory benefits analysis, Environ. Health Perspect., 119, 607–614, https://doi.org/10.1289/ehp.1003012, 2011.
Saiz-Lopez, A., Sitkiewicz, S. P., Roca-Sanjuan, D., Oliva-Enrich, J. M., Davalos, J. Z., Notario, R., Jiskra, M., Xu, Y., Wang, F., Thackray, C. P., Sunderland, E. M., Jacob, D. J., Travnikov, O., Cuevas, C. A., Acuna, A. U., Rivero, D., Plane, J. M. C., Kinnison, D. E., and Sonke, J. E.: Photoreduction of gaseous oxidized mercury changes global atmospheric mercury speciation, transport and deposition, Nat. Commun., 9, 4796, https://doi.org/10.1038/s41467-018-07075-3, 2018.
Schroeder, W. H. and Munthe, J.: Atmospheric mercury – An overview, Atmos. Environ., 32, 809–822, https://doi.org/10.1016/s1352-2310(97)00293-8, 1998.
Sheu, G.-R., Phu Nguyen, L. S., Truong, M. T., and Lin, D.-W.: Characteristics of atmospheric mercury at a suburban site in northern Taiwan and influence of trans-boundary haze events, Atmos. Environ., 214, 116827, https://doi.org/10.1016/j.atmosenv.2019.116827, 2019.
Sheu, G.-R., Lin, N.-H., Lee, C.-T., Wang, J.-L., Chuang, M.-T., Wang, S.-H., Chi, K. H., and Ou-Yang, C.-F.: Distribution of atmospheric mercury in northern Southeast Asia and South China Sea during Dongsha Experiment, Atmos. Environ., 78, 174–183, https://doi.org/10.1016/j.atmosenv.2012.07.002, 2013.
Shi, J., Chen, Y., Xu, L., Hong, Y., Li, M., Fan, X., Yin, L., Chen, Y., Yang, C., Chen, G., Liu, T., Ji, X., and Chen, J.: Measurement report: Atmospheric mercury in a coastal city of Southeast China: inter-annual variations and influencing factors, Zenodo [data set], https://doi.org/10.5281/zenodo.6573605, 2022.
Slemr, F., Martin, L., Labuschagne, C., Mkololo, T., Angot, H., Magand, O., Dommergue, A., Garat, P., Ramonet, M., and Bieser, J.: Atmospheric mercury in the Southern Hemisphere – Part 1: Trend and inter-annual variations in atmospheric mercury at Cape Point, South Africa, in 2007–2017, and on Amsterdam Island in 2012–2017, Atmos. Chem. Phys., 20, 7683–7692, https://doi.org/10.5194/acp-20-7683-2020, 2020.
Sprovieri, F., Pirrone, N., Bencardino, M., D'Amore, F., Carbone, F., Cinnirella, S., Mannarino, V., Landis, M., Ebinghaus, R., Weigelt, A., Brunke, E.-G., Labuschagne, C., Martin, L., Munthe, J., Wängberg, I., Artaxo, P., Morais, F., Barbosa, H. D. M. J., Brito, J., Cairns, W., Barbante, C., Diéguez, M. D. C., Garcia, P. E., Dommergue, A., Angot, H., Magand, O., Skov, H., Horvat, M., Kotnik, J., Read, K. A., Neves, L. M., Gawlik, B. M., Sena, F., Mashyanov, N., Obolkin, V., Wip, D., Feng, X. B., Zhang, H., Fu, X., Ramachandran, R., Cossa, D., Knoery, J., Marusczak, N., Nerentorp, M., and Norstrom, C.: Atmospheric mercury concentrations observed at ground-based monitoring sites globally distributed in the framework of the GMOS network, Atmos. Chem. Phys., 16, 11915–11935, https://doi.org/10.5194/acp-16-11915-2016, 2016.
Tang, Y., Wang, S., Wu, Q., Liu, K., Wang, L., Li, S., Gao, W., Zhang, L., Zheng, H., Li, Z., and Hao, J.: Recent decrease trend of atmospheric mercury concentrations in East China: the influence of anthropogenic emissions, Atmos. Chem. Phys., 18, 8279–8291, https://doi.org/10.5194/acp-18-8279-2018, 2018.
UN Environment: Financial Rules for the Minamata Convention on Mercury, United Nations Environment Programme, Geneva, Switzerland, https://www.mercuryconvention.org/en/resources/financial-rules-minamata-convention-mercury (last access: 26 August 2022), 2017.
Wang, C., Wang, Z., and Zhang, X.: Two years measurement of speciated atmospheric mercury in a typical area of the north coast of China: Sources, temporal variations, and influence of regional and long-range transport, Atmos. Environ., 228, 117235, https://doi.org/10.1016/j.atmosenv.2019.117235, 2020.
Wang, C., Wang, Z., and Zhang, X.: Speciated atmospheric mercury during haze and non-haze periods in winter at an urban site in Beijing, China: Pollution characteristics, sources, and causes analyses, Atmos. Res., 247, 105209, https://doi.org/10.1016/j.atmosres.2020.105209, 2021.
Wood, S. N. and Augustin, N. H.: GAMs with integrated model selection using penalized regression splines and applications to environmental modelling, Ecol. Model., 157, 157–177, https://doi.org/10.1016/S0304-3800(02)00193-X, 2002.
Wu, Q., Tang, Y., Wang, S., Li, L., Deng, K., Tang, G., Liu, K., Ding, D., and Zhang, H.: Developing a statistical model to explain the observed decline of atmospheric mercury, Atmos. Environ., 243, 117868, https://doi.org/10.1016/j.atmosenv.2020.117868, 2020.
Wu, Q. R., Wang, S. X., Li, G. L., Liang, S., Lin, C. J., Wang, Y. F., Cai, S. Y., Liu, K. Y., and Hao, J. M.: Temporal Trend and Spatial Distribution of Speciated Atmospheric Mercury Emissions in China During 1978–2014, Environ. Sci. Technol., 50, 13428–13435, https://doi.org/10.1021/acs.est.6b04308, 2016.
Wu, Q. R., Tang, Y., Wang, L., Wang, S. X., Han, D. M., Ouyang, D. W., Jiang, Y. Q., Xu, P., Xue, Z. G., and Hu, J. N.: Impact of emission reductions and meteorology changes on atmospheric mercury concentrations during the COVID-19 lockdown, Sci. Total Environ., 750, 7, https://doi.org/10.1016/j.scitotenv.2020.142323, 2021.
Wu, Y., Wang, S., Streets, D. G., Hao, J., Chan, M., and Jiang, J.: Trends in anthropogenic mercury emissions in China from 1995 to 2003, Environ. Sci. Technol., 40, 5312–5318, https://doi.org/10.1021/es060406x, 2006.
Xu, L., Chen, J., Yang, L., Niu, Z., Tong, L., Yin, L., and Chen, Y.: Characteristics and sources of atmospheric mercury speciation in a coastal city, Xiamen, China, Chemosphere, 119, 530–539, https://doi.org/10.1016/j.chemosphere.2014.07.024, 2015.
Yi, H., Tong, L., Lin, J.-m., Cai, Q.-l., Wang, K.-q., Dai, X.-r., Li, J.-r., Chen, J.-s., and Xiao, H.: Temporal variation and long–range transport of gaseous elemental mercury (GEM) over a coastal site of East China, Atmos. Res., 233, 104699, https://doi.org/10.1016/j.atmosres.2019.104699, 2020.
Yin, X., Kang, S., de Foy, B., Ma, Y., Tong, Y., Zhang, W., Wang, X., Zhang, G., and Zhang, Q.: Multi-year monitoring of atmospheric total gaseous mercury at a remote high-altitude site (Nam Co, 4730 m a.s.l.) in the inland Tibetan Plateau region, Atmos. Chem. Phys., 18, 10557–10574, https://doi.org/10.5194/acp-18-10557-2018, 2018.
Yin, X., Zhou, W., Kang, S., de Foy, B., Yu, Y., Xie, J., Sun, S., Wu, K., and Zhang, Q.: Latest observations of total gaseous mercury in a megacity (Lanzhou) in northwest China, Sci. Total Environ., 720, 137494, https://doi.org/10.1016/j.scitotenv.2020.137494, 2020.
Yu, B., Wang, X., Lin, C. J., Fu, X., Zhang, H., Shang, L., and Feng, X.: Characteristics and potential sources of atmospheric mercury at a subtropical near-coastal site in East China, J. Geophys. Res.-Atmos., 120, 8563–8574, https://doi.org/10.1002/2015jd023425, 2015.
Yuan, C. S., Jhang, Y. M., Ie, I. R., Lee, C. E., Fang, G. C., and Luo, J. J.: Exploratory investigation on spatiotemporal variation and source identification of atmospheric speciated mercury surrounding the Taiwan Strait, Atmos. Pollut. Res., 12, 54–64, https://doi.org/10.1016/j.apr.2021.01.015, 2021.
Zhang, H., Fu, X., Lin, C.-J., Shang, L., Zhang, Y., Feng, X., and Lin, C.: Monsoon-facilitated characteristics and transport of atmospheric mercury at a high-altitude background site in southwestern China, Atmos. Chem. Phys., 16, 13131–13148, https://doi.org/10.5194/acp-16-13131-2016, 2016.
Zhang, L., Wang, S. X., Wang, L., and Hao, J. M.: Atmospheric mercury concentration and chemical speciation at a rural site in Beijing, China: implications of mercury emission sources, Atmos. Chem. Phys., 13, 10505–10516, https://doi.org/10.5194/acp-13-10505-2013, 2013.
Zhang, L., Zhou, P., Zhong, H., Zhao, Y., Dai, L., Wang, Q. g., Xi, M., Lu, Y., and Wang, Y.: Quantifying the impacts of anthropogenic and natural perturbations on gaseous elemental mercury (GEM) at a suburban site in eastern China using generalized additive models, Atmos. Environ., 247, 118181, https://doi.org/10.1016/j.atmosenv.2020.118181, 2021.
Zhang, L., Wang, S., Wang, L., Wu, Y., Duan, L., Wu, Q., Wang, F., Yang, M., Yang, H., Hao, J., and Liu, X.: Updated Emission Inventories for Speciated Atmospheric Mercury from Anthropogenic Sources in China, Environ. Sci. Technol., 49, 3185–3194, https://doi.org/10.1021/es504840m, 2015.
Zhang, Y., Jacob, D. J., Horowitz, H. M., Chen, L., Amos, H. M., Krabbenhoft, D. P., Slemr, F., St Louis, V. L., and Sunderland, E. M.: Observed decrease in atmospheric mercury explained by global decline in anthropogenic emissions, P. Natl. Acad. Sci. USA, 113, 526–531, https://doi.org/10.1073/pnas.1516312113, 2016.
Zhu, J., Wang, T., Talbot, R., Mao, H., Hall, C. B., Yang, X., Fu, C., Zhuang, B., Li, S., Han, Y., and Huang, X.: Characteristics of atmospheric Total Gaseous Mercury (TGM) observed in urban Nanjing, China, Atmos. Chem. Phys., 12, 12103–12118, https://doi.org/10.5194/acp-12-12103-2012, 2012.