the Creative Commons Attribution 4.0 License.
the Creative Commons Attribution 4.0 License.
 | 31 Aug 2022
Aerosol characterisation in the subtropical eastern North Atlantic region using long-term AERONET measurements
África Barreto
Rosa D. García
Carmen Guirado-Fuentes
Emilio Cuevas
A. Fernando Almansa
Celia Milford
Carlos Toledano
Francisco J. Expósito
Juan P. Díaz
Sergio F. León-Luis
A comprehensive characterisation of atmospheric aerosols in the subtropical eastern North Atlantic has been carried out using long-term ground-based Aerosol Robotic NETwork (AERONET) photometric observations over the period 2005–2020 from a unique network made up of four stations strategically located from sea level to 3555 m on the island of Tenerife. This site can be considered a sentinel for the passage of airmasses going to Europe from Africa, and therefore the aerosol characterisation performed here adds important information for analysing their evolution during their path toward Northern Europe. Two of these stations (Santa Cruz de Tenerife – SCO – at sea level and La Laguna – LLO – at 580 m a.s.l.) are located within the marine atmospheric boundary layer (MABL), and the other two (Izaña – IZO – at 2373 m a.s.l. and Teide Peak – TPO – at 3555 m a.s.l.) are high mountain stations within the free troposphere (FT). Monthly climatology of the aerosol optical depth (AOD), Ångström exponent (AE), aerosol concentration, size distribution and aerosol optical properties has been obtained for the MABL and FT. Measurements that are quite consistent across the four sites have been used to categorise the main atmospheric scenarios, and these measurements confirm an alternation between predominant background conditions and predominant dust-loaded Saharan air mass conditions caused by seasonal dust transport over the subtropical North Atlantic. Background conditions prevail in the MABL and FT for most of the year, while dust-laden conditions dominate in July and August.
The MABL under background conditions appears as a well-mixed layer with a low aerosol concentration (the volume concentration, VolCon, ranges from 0.02 ± 0.01 to 0.04 ± 0.02 µm3 µm−2), a predominance of coarse-mode marine aerosols (the effective radius, Reff, changes from 1.60 ± 0.19 to 1.91 ± 0.34 µm), and a volume contribution of the fine-mode fraction <0.35. The clean FT is characterised by remarkably low aerosol loading and a predominant impact of fine-mode aerosols throughout the year ( has a maximum value of 0.93 ± 0.13), with an average Reff of 0.16 ± 0.02 µm. However, under dust-laden conditions and mainly in summer, we observe a predominance of coarse-mode aerosols with maximum VolCon values of 0.26 ± 0.23 µm3 µm−2 for the MABL and 0.16 ± 0.12 (0.06 ± 0.05) µm3 µm−2 for IZO (TPO), and a similar and quite consistent fine-mode fraction of 0.12 ± 0.03 in the vertical within the MABL and FT. Similarities in micro-physical and optical intensive aerosol properties confirm that the Saharan Air Layer (SAL) is a well-mixed layer in terms of the particulate composition. An estimation of the difference in the aerosol loading in the 1 km layer between IZO and TPO (in terms of VolCon and AOD) is performed in this study, and this shows that aerosol loading at IZO is double that at TPO, but they have similar fine-mode fractions, effective radii and intensive optical properties. The long-term trend analysis at SCO shows a significant negative trend in the fine-mode AOD between 2005 and 2020 (−1.8 ± 0.5) × 10−5 yr−1, which might be linked to the large reduction in oil-refining SO2 emissions from the SCO refinery in 2012.
- Article
(2719 KB) - Full-text XML
-
Supplement
(623 KB) - BibTeX
- EndNote


Tropospheric aerosols impact climate by directly scattering and absorbing the incoming solar radiation and by an indirect effect related to their impact on cloud microphysics. The most recent estimates of the radiative forcing exerted by anthropogenic aerosols on climate confirm the assessment that it is virtually certain that the total aerosol effective radiative forcing (ERF) is negative (Arias et al., 2021). This cooling effect of atmospheric aerosols, set at −1.3 [−2.0 to −0.6] W m−2, partly counteracts the warming effects of anthropogenic greenhouse gases, and is considered the largest uncertainty in the effect of short-lived climate forcers in future climate projections (Arias et al., 2021).
Aerosol observations from surface networks and satellite-based systems have been enhanced and expanded considerably in recent decades, contributing to the improvements in the understanding and quantification of the net effect of aerosols on climate. Different approaches with diverse temporal and spatial scales provide complementary pieces of knowledge to overcome the main difficulties in the study of aerosol ERF: the highly variable aerosol concentration, composition and distribution over space (horizontally and vertically) and time (Toledano et al., 2007; Putaud et al., 2010; Laj et al., 2020). In this regard, AERONET (AErosol RObotic Network, Holben et al., 1998; Giles et al., 2019) is the major ground-based aerosol network providing globally distributed and near-real-time aerosol observations that are freely available to the scientific community. The aerosol optical depth (AOD) is a key variable to study the aerosol radiative forcing. However, due to the lack of scattering information contained in the AOD observations, it is important to extract more information from the angular distribution of sky radiance to properly understand the aerosol radiative effect (Dubovik and King, 2000; Kok et al., 2017; Torres et al., 2017). This information is critical to validate aerosol models as well as to assess the prescribed attributes usually given to atmospheric aerosols in current models or inversion schemes (Dubovik et al., 2006; Kok et al., 2017; Torres et al., 2017). There are other surface networks such as SKYNET (Sky Radiometer Network; Takamura and Nakajima, 2004; Nakajima et al., 2020) and GAW-PFR (Global Atmospheric Watch-Precision Filter Radiometer Network; Wehrli, 2000) that, although less extensive, are also capable of providing very useful information for aerosol monitoring.
In this study, we describe the long-term seasonal evolution of atmospheric aerosols by using AERONET observations at four different sites at different altitudes in Tenerife, in the subtropical eastern North Atlantic region. This region can be considered a key location for aerosol monitoring because it is in the path of long-range transports such as mineral dust from the Sahel-Sahara regions (Carlson and Prospero, 1972; Prospero and Carlson, 1972; Tsamalis et al., 2013; Cuevas et al., 2015; Rodríguez et al., 2015, 2020; Barreto et al., 2022), dust from North America (García et al., 2017a), or sulfates, biomass burning and other pollutants from North America, Europe or Africa (Viana et al., 2002; Basart et al., 2009; Rodríguez et al., 2011; García et al., 2017b; Rodríguez et al., 2020; Wang et al., 2021). On the northern edge of the dust belt in summer, but still affected by dust transport in winter (Alonso-Pérez et al., 2007, 2011, 2012; Rodríguez et al., 2011; Cuevas et al., 2015), this region presents a stronger seasonal dependence of dust transport than tropical latitudes, which is representative of the almost pure Saharan dust present in summer and winter (Barreto et al., 2022). Furthermore, the strong vertical stratification in the lower troposphere that is typical of this eastern side of the subtropical North Atlantic implies the presence of several layers and transition levels with different vertical humidity and temperature gradients, which strongly affect the aerosol layering (Carrillo et al., 2016; Barreto et al., 2022). A humid and relatively cold marine atmospheric boundary layer (MABL) is well differentiated in the lowermost troposphere and limited at the top by a strong temperature inversion layer, with a dry and relatively warm free troposphere (FT) above (Font-Tullot, 1956; Cuevas, 1995; Carrillo et al., 2016, and references therein). Most of the year, the trade wind layer (TWL) separates the MABL and the FT as a consequence of quasi-permanent subsidence conditions modulated by the descending branch of the Hadley cell (Carrillo et al., 2016). The contrasting aerosol regimes observed at this site and the very stable and low aerosol turbidity within the FT make it an excellent site for aerosol monitoring and calibration (Toledano et al., 2018; Cuevas et al., 2019b). Thus, Izaña Observatory, located in the FT, is one of the two sites around the world used for the absolute calibration of both the AERONET and GAW-PFR global networks (Toledano et al., 2018; Cuevas et al., 2019b).
The main objective of this paper is to perform a characterisation of atmospheric aerosols in terms of their optical and micro-physical properties using long-term records (for 2005–2020) from two stations within the MABL (Santa Cruz de Tenerife (SCO) and La Laguna (LLO)) and an additional two stations within the FT (Izaña (IZO) and Teide Peak (TPO)). These four databases provide high-quality information on aerosols for a period of between 9 and 16 years. The possible variation of aerosol properties with height and the different seasonalities of aerosols as a consequence of the main aerosol transports over this region are also studied. In this regard, background and dust-laden conditions have been identified and characterised as the predominant conditions at the four sites. Section 2.1 and 2.2 describe the experimental sites, aerosol data sets and instrumentation used in this work. The main results are shown in Sect. 3. Section 3.1 is dedicated to the seasonal characterisation of optical aerosol properties in the MABL and FT in terms of the AOD and Angström exponent (AE). Section 3.2 describes the seasonal characterisation of aerosol optical and micro-physical properties in these two atmospheric layers from photometric inversion products. In Sect. 3.3, a preliminary trend analysis of key optical micro-physical properties is evaluated for the Santa Cruz and Izaña observatories. These two stations have been selected due to their long and high-quality aerosol databases, representative of MABL and FT conditions, respectively. Finally, the main conclusions of this study are summarised in Sect. 4.
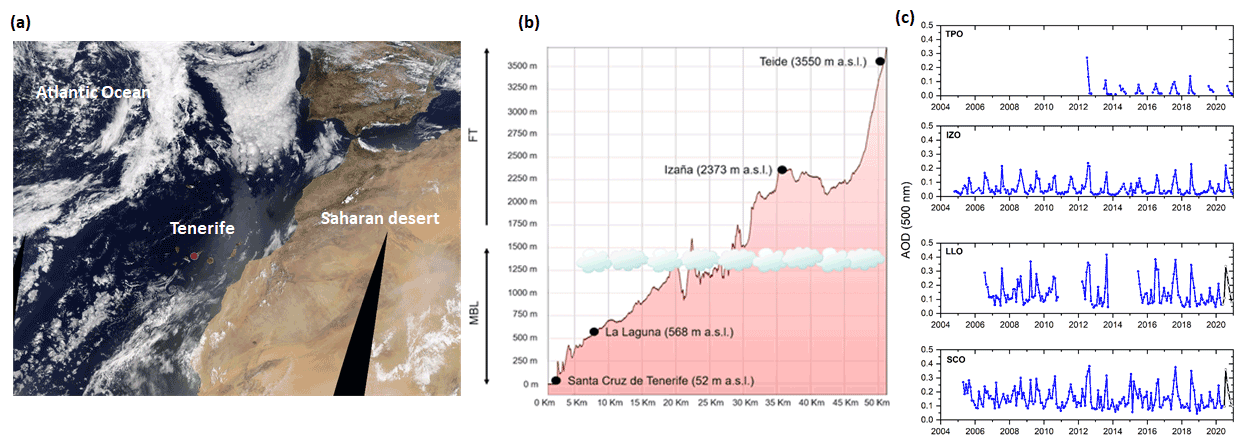
Figure 1(a) MODIS visible imagery on 26 August 2021 over western Africa and the northern Atlantic Ocean. The red dot indicates the location of the island of Tenerife. Image credit: NASA Worldwide (https://worldview.earthdata.nasa.gov, last access: 22 March 2022). (b) The elevation profile of Tenerife, indicating the corresponding elevations of the four stations (SCO, LLO, IZO and TPO) and their locations with respect to the marine atmospheric boundary layer (MABL) and the free troposphere (FT). The stratocumulus cloud top is limited by trade wind inversion. (c) Time series of the monthly mean AOD at 500 nm at SCO, LLO, IZO and TPO. The blue dots represent AERONET version 3.0 level 2.0 AOD data and the black dots represent level 1.5 data.
2.1 The sites
The island of Tenerife is located in the subtropical eastern North Atlantic region (Fig. 1a), under the influence of the north-east trade wind regime, which causes two well-differentiated layers to be present in the lowermost subtropical North Atlantic troposphere. A humid and relatively cold MABL limited at its top by a strong temperature inversion layer is capped by a very dry FT above. SCO and LLO are located in the MABL, while IZO and TPO are located in the FT, normally above a temperature inversion layer.
Ground-based aerosol observations from four AERONET stations located at different altitudes on Tenerife (Canary Islands, Spain) have been used in this work (Fig. 1). These stations (Fig. 1b), which have a maximum horizontal distance between them of 50 km, are:
-
Santa Cruz de Tenerife Observatory (SCO; 28.5∘ N, 16.2∘ W, 52 m a.s.l.), a coastal urban station (Cuevas et al., 2019a) located in the centre of Santa Cruz de Tenerife and very close to the city harbour. Following Basart et al. (2009), marine coarse aerosols are predominant at this site throughout the year, while the Saharan dust contribution is predominant from winter to spring due to the frequent dust outbreaks over this region. However, the portion of fine-mode aerosols from local (urban or industrial) activities is smaller than expected for such an urban station because of the dispersion of pollutants by the predominant trade-wind regime and the sea breeze circulation during daylight (Rodríguez et al., 2008).
-
La Laguna Observatory (LLO; 28.5∘ N, 16.3∘ W, 568 m a.s.l.), an urban station far from industrial activities. North-westerly winds are the prevailing regime, leading to a cloudy and wet climate except under when it is the influence of Saharan air masses, when humid north-easterly air masses are displaced by drier ones from the African continent.
-
Izaña Observatory (IZO; 28.3∘ N, 16.5∘ W, 2373 m a.s.l.) is located on a mountain plateau with no significant local pollution sources. It is normally above the temperature inversion layer and dominated by north-westerly winds and a very dry and stable atmosphere with clear sky and clean air (pristine) conditions. It is affected by mineral dust when the Saharan Air Layer (SAL) top exceeds the station height, mainly in summer. Despite the latter, it is an excellent site for remote-sensing atmospheric research and monitoring. IZO enrolled in the World Meteorological Organization (WMO) Global Atmosphere Watch (GAW) programme in 1989, and it has contributed to several international networks such as GAW-PFR (since 2001) and AERONET (since 2004: it is one of the two absolute AERONET calibration sites; https://aerospain.aemet.es/, last access: 22 March 2022). In July 2014, IZO was appointed a WMO Commission for Instruments and Methods of Observations Testbed for Aerosols and Water Vapor Remote Sensing Instruments (WMO-CIMO, WMO, 2014). More details of the measurement programmes can be found in Cuevas et al. (2019a).
-
Teide Peak Observatory (TPO; 28.3∘ N, 16.6∘ W, 3550 m a.s.l.), located at the cable car terminal on Teide Volcano in Teide National Park. TPO is characterised by extremely pristine conditions and, similarly to IZO, is affected by mineral dust when the SAL top exceeds the TPO height, mainly in summer. TPO was established as a satellite station of IZO in 2012 (Cuevas et al., 2019a).
The SCO, IZO and TPO stations are managed by the Izaña Atmospheric Research Centre (IARC), which is part of the State Meteorological Agency of Spain (AEMET; more information at http://izana.aemet.es; last access: 22 March 2022), while LLO is managed by La Laguna University (https://www.ull.es; last access: 22 March 2022). SCO, LLO and IZO are devoted to continuous long-term monitoring. AERONET measurements at TPO, due to adverse weather conditions, are mainly available between mid-spring and mid-autumn, with continuous records available from September 2020.
2.2 Cimel sun photometer data sets
In this study, aerosol measurements were obtained from two different Cimel sun photometer CE318 versions: CE318-N (Holben et al., 1998) and CE318-TS (Barreto et al., 2016; Giles et al., 2019). Ground-based CE318 sun measurements were performed at eight or nine nominal wavelengths (340 to 1640 nm) with an approximate field of view of ∼ 1.3∘ (Holben et al., 1998; Torres et al., 2013) and a full-width-at-half-maximum (FWHM) bandwidth of 10 nm, except at 340 and 380 nm (with an FWHM of 2 and 4 nm, respectively) and at 1640 nm (with an FWHM of 25 nm). AOD and AE have been retrieved as products from direct measurements. The AOD total uncertainty is approximately 0.01–0.02 for field sun photometers and 0.002–0.009 for reference instruments (both are spectrally dependent, with higher errors in the UV) (Eck et al., 1999; Holben et al., 2001; Giles et al., 2019). AE represents the AOD spectral dependence and is a qualitative indicator of the predominant aerosol size (Ångström, 1929; Eck et al., 1999). Linear fit determination of AE in the range 440–870 nm (440, 500 (when available), 670 and 870 nm) has been used (AE440−870 nm).
Aerosol micro-physical and optical properties obtained from the AERONET inversion algorithm are also analysed: the particle volume size distribution, volume particle concentration (VolCon), fine-mode volume fraction (), effective radius (Reff), single scattering albedo (SSA), refractive index, and asymmetry parameter (g). Dubovik and King (2000), Dubovik et al. (2006) and Sinyuk et al. (2020) describe AERONET retrieval, measurement accuracy and error estimates. It should be noted that AERONET level 2.0 retrievals for the SSA and imaginary refractive index are limited to AOD440 nm>0.4 and solar zenith angles > 50∘, which strongly limits the amount of data available for aerosol characterisation (Sinyuk et al., 2020).
The AERONET version 3.0 level 2.0 (or level 1.5, depending on the data available at the station) data set (Sinyuk et al., 2020; https://aeronet.gsfc.nasa.gov, last access: 22 March 2022) has been used in this work (Fig. 1). More specifically, the AERONET level 2.0 data series at IZO is available from October 2004 to December 2020. This data set is composed of records from a total of 16 reference instruments for the period 2004–2020. However, the homogeneity and quality of this AERONET-Cimel AOD data series at Izaña has been confirmed by Cuevas et al. (2019b) using a long-term AOD and AE comparison with the three GAW-PFR reference instruments, the WMO AOD reference that was running at Izaña during the same time period, and also by Toledano et al. (2018), who assessed the suitability of Izaña as a Langley plot calibration site using 15 years of Langley calibrations. AERONET level 2.0 measurements at SCO and LLO are available from April 2005 and July 2006, respectively, until June 2020. Level 1.5 is used from June to December 2020. Both data sets are obtained from field instruments that are replaced every year. Regarding TPO, the data series is composed of discontinuous records from field instruments since July 2012. Level 2.0 is available until December 2020.
3.1 MABL and FT AOD and AE aerosol seasonal characterisation
Monthly mean AOD values at 440, 500, 675, 870 and 1020 nm and AE440−870 nm values are shown in Fig. 2 for the four sites in Tenerife. SCO (Fig. 2a) and LLO (Fig. 2c) display low AOD500 nm values in May (0.12 ± 0.09 at SCO and 0.09 ± 0.07 at LLO) and between October and February, with values of 0.12 ± 0.03 at SCO and 0.10 ± 0.03 at LLO. In those months, mean AOD500 nm<0.15 and AE440−870 nm values are between 0.5 and 0.75, indicating an atmosphere dominated by marine aerosol (Fig. 2b and d) (e.g. Holben et al., 2001; Dubovik et al., 2002; Smirnov et al., 2002; Basart et al., 2009). For both stations, higher AOD500 nm values are recorded in July (0.24 ± 0.22 at SCO and 0.26 ± 0.23 at LLO) and August (0.26 ± 0.23 at SCO and 0.25 ± 0.25 at LLO), together with mean AE440−870 nm values of <0.5, due to the presence of the SAL over Tenerife during these months (Barreto et al., 2022). It is important to note that the maximum AOD standard deviation found in the summer months (June to August) is a consequence of the strong AOD variations due to the seasonal dust transport (Prospero and Carlson, 1980; Prospero, 1996; Karyampudi et al., 1999; Engelstaedter et al., 2006). A secondary maximum of the AOD500 nm (0.16 ± 0.16 at SCO and 0.15 ± 0.17 at LLO) and a minimum of the AE440−870 nm (0.54 ± 0.30 at SCO and 0.62 ± 0.35 at LLO) is observed in March, when mineral dust is transported at lower altitudes, directly affecting the MABL (Barreto et al., 2022). Our results show a MABL characterised by a marked seasonality due to mineral dust transport at these latitudes in summer, with a predominant influence of marine aerosols during the rest of the year. Consistent results between the two stations located at different altitudes within the MABL indicate that this is a well-mixed layer with similar aerosol loadings and particle size distributions throughout the layer.
Regarding the FT, low mean AOD500 nm values are observed between October and February (average values of 0.03 ± 0.04) at IZO (Fig. 2e) and between October and December (0.02 ± 0.01) at TPO (Fig. 2g). Accordingly, AE440−870 nm values of 1.01 ± 0.34 at IZO (Fig. 2f) and 1.21 ± 0.25 at TPO (Fig. 2g) are also observed, indicating an extremely clean atmosphere with predominant fine aerosols. In contrast to these dominating background conditions, higher AOD500 nm and lower AE440−870 nm values are recorded in July (AOD500 nm of 0.15 ± 0.16 and AE440−870 nm of 0.54 ± 0.47 at IZO; 0.10 ± 0.14 and 0.60 ± 0.45 at TPO) and August (0.13 ± 0.14 and 0.53 ± 0.43 at IZO; 0.07 ± 0.09 and 0.63 ± 0.42 at TPO). Those records indicate the presence of larger particles when mineral dust is transported over Tenerife at a high altitude within the SAL at this time of the year (Carlson, 2016; Barreto et al., 2022).
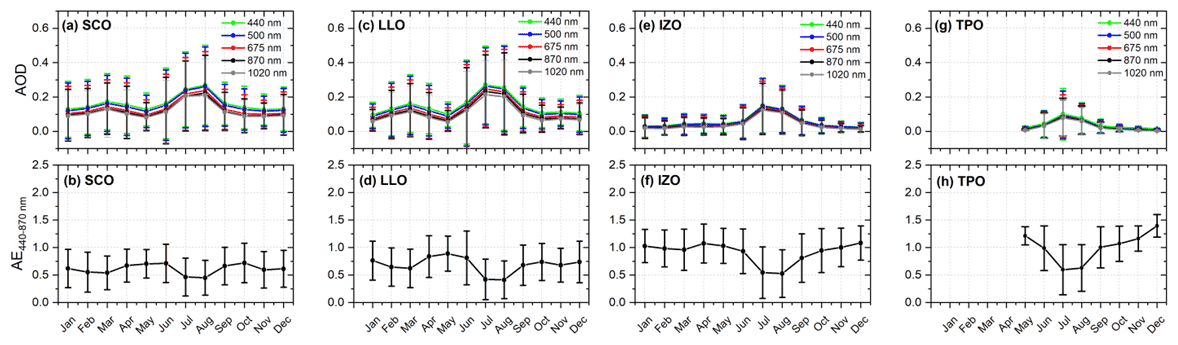
Figure 2Monthly mean aerosol optical depth (AOD) at 440, 500, 675, 870 and 1020 nm and Ångström exponent (AE440−870 nm) at SCO from April 2005 and December 2020 (a, b), at LLO between July 2006 and December 2020 (c, d), at IZO between from October 2004 and December 2020 (e, f), and at TPO between July 2012 and December 2020 (g, h). Error bars indicate the standard deviation.
Our results, as well as those published by other authors (Rodríguez et al., 2011; Cuevas et al., 2019b; Barreto et al., 2022), confirm that the situation alternates between predominant background conditions characterised by fine aerosols and remarkably stable AODs and predominant dust-laden conditions with coarse-mode particles at the four sites. We have therefore used the criterion based on AOD500 nm and AE440−870 nm thresholds defined by Barreto et al. (2022) to perform a more detailed classification of the predominant atmospheric scenarios at these sites.
The data set corresponding to AOD500 nm<0.15 and AE at SCO has been selected for the study of background conditions in the MABL (41 % of the total measurements for SCO and 50 % of the total measurements for LLO) (Barreto et al., 2022). AOD500 nm≥0.15 and AE at SCO have been selected for the study of dust-laden conditions in the MABL (24 % and 26 % for SCO and LLO, respectively) (Fig. 3a, b). The rest of the cases have been classified as “mixed aerosols.” Our results indicate that background conditions prevail in the MABL for most of the year (Fig. 4a), particularly in May and June (more than 15 d per month), as previously reported by Cuevas et al. (2015), who identified a clean atmosphere and sporadic dust intrusions during these 2 months by the analysis of lidar vertical profiles at SCO. In July and August, dust-laden conditions dominate, while dust-laden air masses are less frequent between October and May, with the exception of a slight increase in March.
Regarding the FT, background conditions are identified as those at IZO, with AOD500 nm≤0.10 and AE used as the threshold values (Barreto et al., 2022).
This data selection comprises ∼ 73 % of all observations (Fig. 3c and d). For the identification of dust-laden conditions, we have set AOD500nm≥0.10 and AE as the threshold values.
Dust-laden conditions, as defined in this paper, follow the seasonal pattern displayed in Fig. 4b. IZO is mostly under background FT conditions for more than 50 % of the days every month, except in July and August, when the number of days under dust-laden and background conditions are quite similar. Background conditions are most frequent in April, May and June (21, 25 and 22 d per month, respectively). Dust conditions are scarce from October to February, when dust transport rarely reaches the altitude of the station (Fig. 4b).
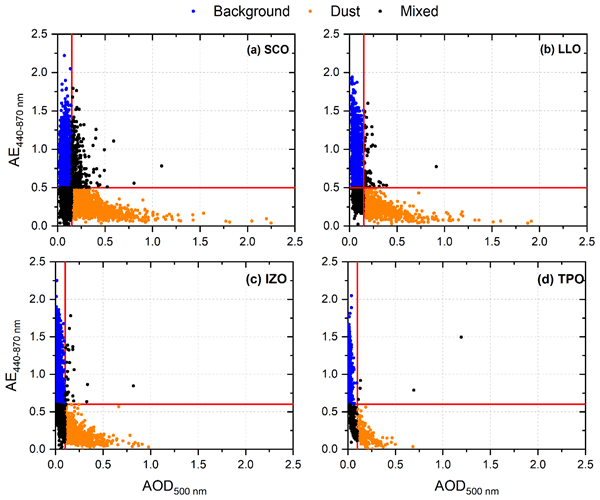
Figure 3Scatterplots of the daily values of AE440−870 nm versus AOD500 nm at (a) SCO, (b) LLO, (c) IZO and (d) TPO. In (a) and (b), the red lines indicate the threshold limits established for background conditions (AOD500 nm<0.15 and AE (blue dots)) and for the dust-laden scenario (AOD500 nm≥0.15 and AE (orange dots)) at SCO and LLO. Similarly, in (c) and (d), the red lines indicate the threshold limits for background conditions (AOD500 nm<0.10 and AE (blue dots)) and the dust-laden scenario (AOD500 nm≥0.10 and AE (orange dots)) for IZO and TPO. Black dots indicate the presence of mixed aerosols.
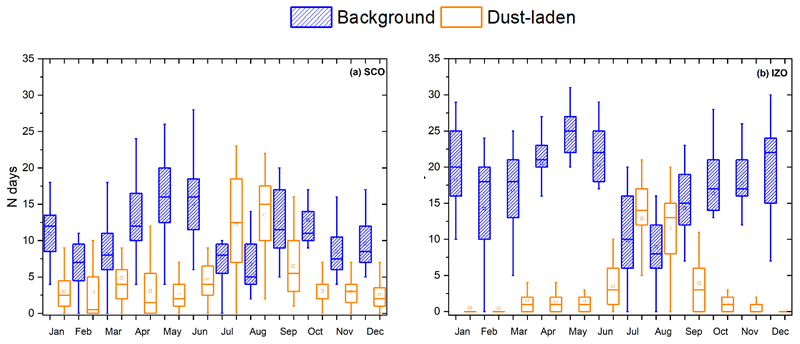
Figure 4Number of days per month under background and dust-laden conditions at (a) SCO and (b) IZO. The lower and upper boundaries for each box are the 25th and 75th percentiles, the solid line is the median value, and the point represents the mean value. Hyphens at the end of the error bars show the maximum and minimum values.
3.2 Extensive MABL and FT aerosol characterisation based on photometric inversion products
Optical and micro-physical aerosol properties inferred from AERONET inversion products have been used in this study to incorporate some important information into climate and radiative studies (Dubovik and King, 2000; Dubovik et al., 2006; Boucher et al., 2013). Monthly mean aerosol volume size distributions (ddlnR) for background and dust-laden conditions are displayed in Figs. 5 and 7, while monthly mean aerosol volume concentration (VolCon) and effective radius (Reff) values for the total, fine and coarse modes in addition to the fine-mode fraction () are presented in Figs. 6 and 8, respectively. Figure 9 also presents other inversion products at the four stations, but only for dust-laden (high aerosol loading) conditions: these are the asymmetry factor (g), the single scattering albedo (SSA) and the real (n) and imaginary (k) parts of the refractive index at 440, 675, 870 and 1020 nm. The reason for not including these parameters for background conditions is the high uncertainty in AERONET inversion products under low aerosol loading, as reported by Sinyuk et al. (2020).
3.2.1 Background conditions
The MABL is characterised by a bimodal lognormal size distribution with a coarse mode that predominates throughout the year and slightly increases in the summer and spring months in the case of LLO (Fig. 5a and b). These characteristics are quite consistent between the two stations within the MABL, confirming effective vertical mixing within the cloud-free subtropical MABL (Carrillo et al., 2016; Barreto et al., 2022). This predominant coarse mode is also evident from the low fine fraction () observed for the two stations in Fig. 6c and f (below 0.35 throughout the year). These features are in agreement with the results presented by Smirnov et al. (2002) and Dubovik et al. (2002) for a marine background environment. Relatively stable and low total VolCon values are observed during the year: between 0.02 ± 0.01 and 0.04 ± 0.02 µm3 µm−2 at the two stations. The behaviour of Reff is seen to be quite consistent between SCO and LLO (see Fig. 6b and e, respectively). Fine-mode aerosols with a Reff of 0.15 ± 0.02 µm seem to be present at the two stations throughout the year, while the Reff of coarse aerosols shows a small seasonal dependence, with minimum values (1.60 ± 0.19 µm) occurring in late spring to early summer and maximum values (1.91 ± 0.34 µm) occurring in winter. The average fine-mode Reff values are 0.15 ± 0.02 µm (0.15 ± 0.02 µm) for SCO (LLO), and the average coarse-mode Reff values are 1.73 ± 0.23 µm (1.75 ± 0.27 µm) for SCO (LLO). These values are in agreement with the Reff values reported by Smirnov et al. (2002) and Sayer et al. (2012) at Atlantic sites (0.12–0.16 µm for fine-mode and 1.69–1.93 µm for coarse-mode aerosols).

Figure 5Monthly mean aerosol particle size distributions at (a) SCO, (b) LLO, (c) IZO and (d) TPO under background conditions.
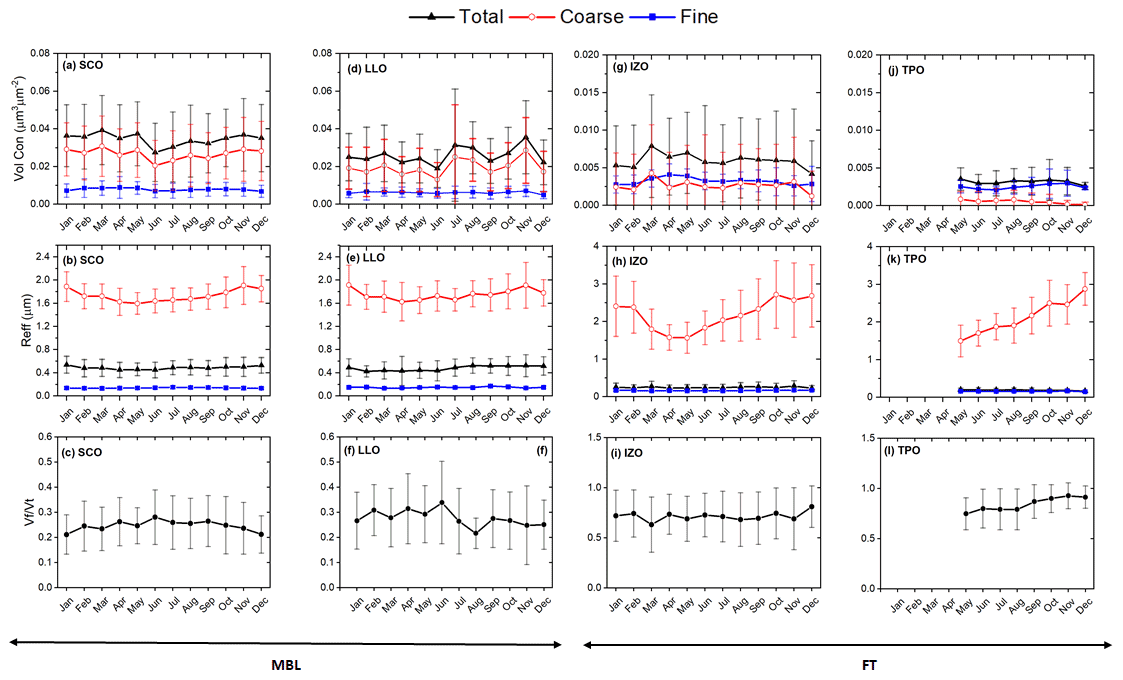
Figure 6Monthly mean volume particle concentration (VolCon; µm3 µm−2) and effective radius (Reff; µm) of the total (black), coarse (red) and fine (blue) modes and the fine-mode volume fractions () at SCO (a, b, c), LLO (d, e, f), IZO (g, h, i) and TPO (j, k, l) under background conditions. The error bars indicate the standard deviation. Note the different scales used for the stations within the MABL and those within the FT.
Regarding the FT, Fig. 5c and d show background conditions with remarkably low aerosol loadings characterised by a slight bimodality of the aerosol particle size distribution that is dependent on the season. A dominant fine mode is present throughout the year. These results are consistent with the high AE440−870 nm values observed for these two sites in Sect. 3.1 and the VolCon values in Fig. 6g and j for IZO and TPO, respectively.
A dominance of fine-mode aerosols (average of 0.72 ± 0.25 in IZO and 0.84 ± 0.16 in TPO, with a maximum value of 0.93 ± 0.13 in November in TPO) with an average fine Reff of 0.16 ± 0.02 µm is observed in Fig. 6h and i for IZO and in Fig. 6k and l for TPO. Note that the mean values at TPO correspond to a fraction of the year, from May to December.
The presence of some residual dust on the days considered to be under background conditions can play a role in aerosol characterisation, especially when desert dust intrusions are more frequent. The presence of recirculated dust (with a lower Reff) might be the reason for the small decrease in aerosol radius observed in the MABL and FT during the late spring to summer months.
3.2.2 Dust-laden conditions
The seasonal evolution of the volume size distribution and the most important inversion products in the MABL (SCO and LLO) under dust-laden conditions are displayed in Figs. 7, 8 and 9. Significant seasonal changes are observed at the two stations. A bimodal particle size distribution in the MABL with a dominant coarse mode is clearly observed throughout the year in Figs. 7a and b for SCO and LLO, respectively. This coarse mode is centred at 1.58 ± 0.12 µm according to Fig. 8b and e, with quite consistent values observed at the two stations within the MABL. High aerosol loading was measured in summer (July and August), in some transition months (March and April) and in winter (January and February). These relatively high values correspond to the presence of desert dust in the MABL as a result of the dust transport over this region at higher levels in summer and at lower levels (below 2 km) in winter (Rodríguez et al., 2011; Barreto et al., 2022). It is important to realise that dust transport in summer provides a slightly higher aerosol content (maximum coarse VolCon values of 0.26 ± 0.23 and 0.27 ± 0.24 µm3 µm−2 measured in June in SCO and LLO, respectively) than dust transport in autumn and wintertime (minimum coarse VolCon values of 0.12 ± 0.08 and 0.09 ± 0.06 measured in October and January in SCO and LLO, respectively). These results are consistent with the AOD and AE analysis previously described in Sect. 3.1.
A lower contribution of fine-mode aerosols ( of 0.12 ± 0.03) is observed in this case, corroborating a more pronounced coarse mode in this dust scenario in comparison to MABL background marine conditions (Dubovik et al., 2002). Nearly constant Reff values of 0.12 ± 0.02 and 1.58 ± 0.12 µm for the fine and coarse fractions, respectively, have been found to be representative of MABL dust-laden conditions throughout the year. Similarly to , fine and coarse Reff values are lower than the values found for clean marine aerosols in Sect. 3.2.1, and also lower than the values of 0.17 and 1.73 µm found for fine and coarse modes, respectively, of pure Saharan dust in the SAMUM-2 field campaign (Toledano et al., 2011). This observed decrease in the effective radius of aerosols in dust-laden conditions is attributed to an effective mixture of mineral dust and marine aerosols.
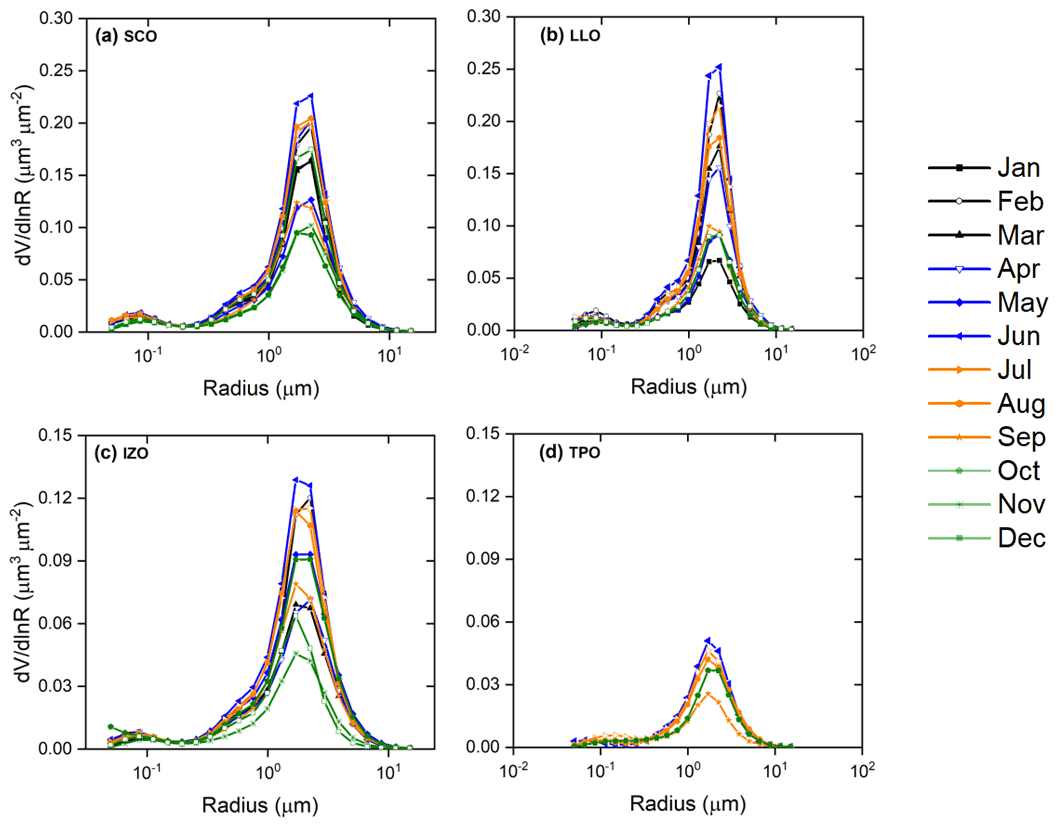
Figure 7Monthly mean aerosol particle size distributions at (a) SCO, (b) LLO, (c) IZO and (d) TPO under dust-laden conditions.
Size distributions in the FT display a similar seasonal pattern to those in the MABL, a consequence of the dust transport pattern over this region. Similar bimodal size distributions are observed in Fig. 7c and d at the two sites, with a more prominent coarse mode in summer and spring months that is centred at 1.57 ± 0.14 µm, similar to the results presented in Smirnov et al. (1998). These results can be explained by the presence of the SAL as an elevated layer (up to 6 km) in summer and the preferred low-altitude transport of dust in winter (below 2 km), which can also sporadically impact the FT (Barreto et al., 2022). This pattern is corroborated by maximum VolCon values of 0.16 ± 0.12 µm3 µm−2 in summer in IZO and 0.06 ± 0.05 µm3 µm−2 for the same season in TPO. Similar values of 0.12 ± 0.03 to those observed in the MABL were measured in the FT as a consequence of the effective mixing with altitude within the SAL (Barreto et al., 2022). However, these values are considerably lower than those measured in the FT under background conditions. In this high aerosol loading scenario, Reff is almost constant during the year, with values ranging from 1.50 ± 0.12 and 1.47 ± 0.13 µm for coarse-mode aerosols in IZO and TPO, respectively (0.13 ± 0.02 and 0.14 ± 0.02 µm for fine-mode aerosols), which can be attributed to pure desert dust conditions. The coarse-mode aerosols in the FT have a lower effective radius than the value of 1.73 µm measured by Toledano et al. (2011) in the SAMUM-2 campaign in Cape Verde (January and February 2008), although this value corresponds to a specific campaign representative of tropical dust transport in winter, when the SAL intrudes into the MABL. In this case, gravitational settlement plays a minor role in comparison to its impact during the Saharan intrusions that take place at much higher altitudes in summer over the Canary Islands. Other authors, such as Nakajima et al. (2020, and references therein), suggest a possible underestimation of the coarse aerosols, especially for severe dust storms, as a consequence of the a priori constraint (very low volume particle size distribution or dV(r) / dlnr) introduced into the AERONET inversion procedure for aerosols larger than 10 µm. However, our findings are quite similar to the particle size distribution measured with in situ techniques at IZO by Rodríguez et al. (2011) during dust episodes. These authors found two main modes, a fine-mode fraction (radius of ∼ 0.1 µm) attributed to ammonium sulfate and a coarse mode (radius of ∼ 1.5 µm) attributed to Saharan advected dust.
No marked seasonal dependence can be observed from the different inversion products presented in Fig. 9. Annually averaged values are presented in Table 1. The lack of seasonal change in this scenario is hypothesised to be due to the stable conditions within the SAL in terms of the thermodynamics and aerosol composition, as already reported by other authors (Prospero and Carlson, 1980; Carlson, 2016; Barreto et al., 2022).
The MABL appears, at both SCO and LLO, as a layer with an average asymmetry parameter that reaches its maximum at 440 nm (g of 0.77 ± 0.03) and is quite constant at the other wavelengths (g of 0.75–0.76). These values are in agreement with the results reported by Dubovik et al. (2002) for a mixture of desert dust and marine aerosols in Cape Verde, in the tropical eastern North Atlantic. Regarding the SSA, aerosols in the MABL are characterised by increasing SSA with wavelength, with maximum values at 440 nm of 0.93 ± 0.03 and 0.95 ± 0.04 in SCO and LLO, respectively. SSA values in the visible and near-infrared seem to be neutral with λ, with average values of 0.98 ± 0.01 at the two stations. This pattern is coherent with the results expected for a scenario dominated by dust (large) particles (Dubovik et al., 2002). The real part of the refractive index (n) adds important additional information on the aerosol's scattering properties, while information on the aerosol chemical composition can be inferred from the imaginary part of the refractive index (k). An average n(λ) of 1.45 ± 0.03 and an average k(λ) value of 0.004 ± 0.002 (maximum values at 440 nm) are retrieved for SCO and LLO. These results are similar to the values reported by Dubovik et al. (2006, and references therein) and consistent between the two stations.
Despite the low data availability, especially at TPO, the two stations in the dust-laden FT exhibit a similar pattern in terms of the four variables. In these stations, the spectral dependence of g seems to be reduced (∼ 0.74 ± 0.01 for the four wavelengths). Regarding the SSA, rather similar values (0.94–0.95) to those found in LLO were reported. These results agree well with the in situ SSA (0.95) and g (0.74–0.81) which were measured at IZO by polar aerosol photometry on filter samples using a light source resembling the solar spectrum (Kandler et al., 2007). Average n(λ) and k(λ) values of 1.46 ± 0.01 and 0.002 ± 0.001 were found, consistent with the values reported in the literature for desert dust conditions. An average complex refractive index of 1.59–7 × 10⁻³i was obtained at IZO from the mineralogical model composition derived by electron microscopy (Kandler et al., 2007), which is in excellent agreement with direct optical measurements.
An important point to highlight about these results is the lower impact of dust transport on TPO. Following Barreto et al. (2022), the maximum aerosol loading within the summer SAL is located at an altitude of ∼ 2.5 km (slightly higher than the altitude of IZO, 2.4 km), with aerosol extinction decreasing from this altitude. The winter SAL transports dust at lower altitudes than it does in summer – up to about 2 km height, around the level of IZO – and therefore the dust-laden SAL is not expected to reach the TPO altitude during winter. We observe a decrease in total VolCon between IZO and TPO of 0.09 µm3 µm−2 (Fig. 8), which corresponds to an average reduction of 43.7 %. This reduction is also consistent with the average AOD in dust-laden conditions (59.2 %) and a regression analysis of the AOD difference between IZO and TPO against the AOD at IZO (used as the reference), for which a slope of 0.323 and a Pearson coefficient (R) of 0.75 were found (Fig. S1 in the Supplement). With these three pieces of information, we can estimate that the aerosol loading at the level of IZO is double that of the measured value in the layer 1 km above, at TPO.
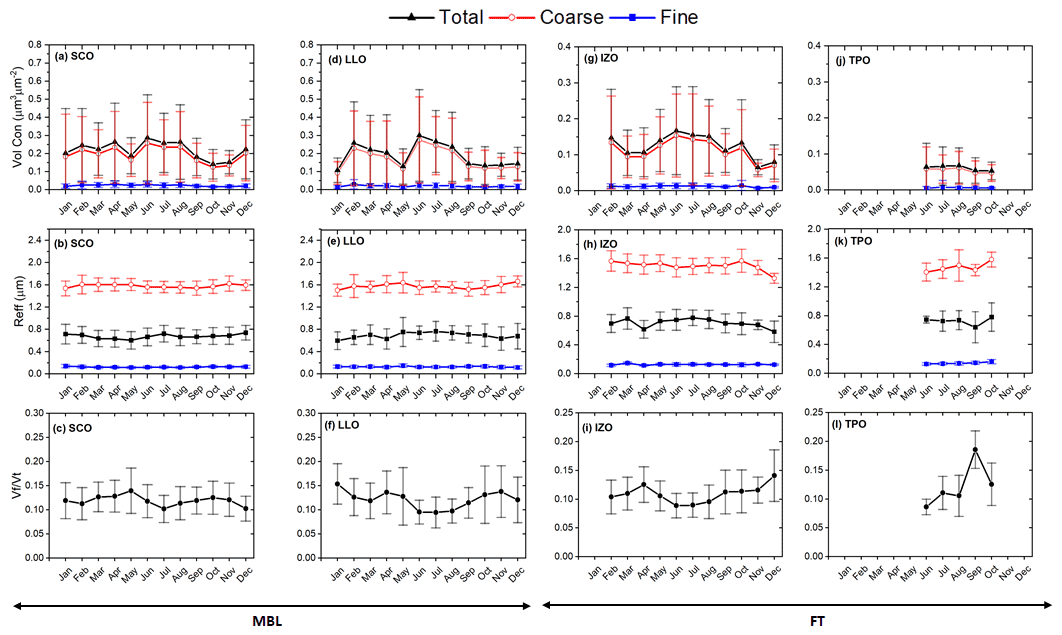
Figure 8Monthly mean volume particle concentration (VolCon; µm3 µm−2) and effective radius (Reff; µm) of the total (black), coarse (red) and fine (blue) modes and the fine-mode volume fractions () at (a, b, c, d) SCO, (e, f, g, h) LLO, (i, j, k, l) IZO and (m, n, o, p) TPO under dust-laden conditions. The error bars indicate the standard deviation.
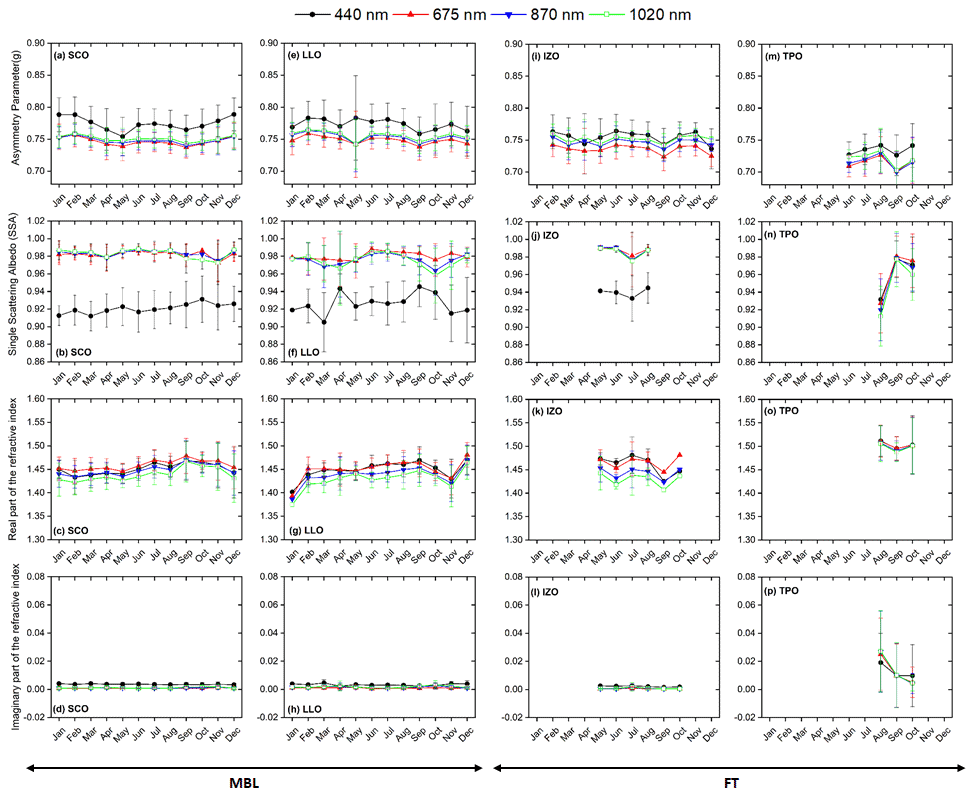
Figure 9Monthly mean asymmetry parameter (g), single scattering albedo (SSA), and real (n) and imaginary (k) parts of the refractive index at 440 (black), 675 (red), 870 (blue) and 1020 nm (green) at SCO (a–d), LLO (e–h), IZO (i–l) and TPO (m–p) under dust-laden conditions. Error bars indicates the standard deviation.
3.3 Long-term trends
For the determination of possible trends in the AOD series in both the MABL and the FT, the data from the main station in each layer – SCO and IZO, respectively – have been used, as these are the stations with the longest and most complete data series. The time series of monthly mean total-, fine- and coarse-mode AOD at these two stations during a period of 15 and 16 years, respectively, have been deseasonalised by subtracting the mean monthly value of the corresponding month considering all the available years.
The total-, fine- and coarse-mode AOD at IZO and the total- and coarse-mode AOD at SCO show no trend across the whole period (as shown in the Supplement), in agreement with results obtained by Li et al. (2014). However, the fine-mode AOD at SCO decreases during the study period (Fig. 10), with a trend of −1.8 ± 0.5 × 10⁻⁵ yr−1 (p value ≪ 0.01). By applying Lanzante’s method (Lanzante, 1996) to the monthly mean fine-mode AOD values, we confirm that there is one change point in August 2012. Although this discontinuity is significant at the 95 % confidence level, the time series show no significant drifts during these periods. We attribute this change point to the cessation of crude oil refining operations at the Santa Cruz de Tenerife refinery (Milford et al., 2018).
As stated in Sect. 2.1, SCO station is located in Santa Cruz de Tenerife, the capital of Tenerife, a city affected by a complex mixture of anthropogenic sources of pollutants (both on-road and maritime traffic and industrial emissions from an oil refinery) (Milford et al., 2020). The crude oil refinery is located in the SW of the city, at about 3 km from SCO. The impact of the refinery emissions is maximised in the 10:00–17:00 GMT period due to meteorological and photochemical effects (González and Rodríguez, 2013) that coincide with maximum heating and vertical mixing within the MABL. González and Rodríguez (2013) found that ultrafine particulate concentrations were more sensitive to fresh emissions from sources than PM2.5, which was mostly linked to aged fine particles (0.1–1 µm) of the urban background.
Given that there are no continuous records of fine-mode particulate matter during the study period that would allow us to detect its changes over time as a consequence of changes in refinery emissions and compare them with those of the fine-mode AOD series, we have used the SO2 concentration series measured in the city as a proxy for the temporal evolution of fine-mode particulate matter resulting from refinery emissions. Hourly ambient concentrations of SO2 at Tome Cano station, located in the centre of the city, around 1.5 km from SCO, were obtained from the ambient Air Quality Monitoring Network of the Canary Islands Government (https://www3.gobiernodecanarias.org/medioambiente/calidaddelaire/inicio.do, last access: 22 March 2022).
The 2005–2020 monthly mean SO2 series shows two break points (Fig. 10) according to the method of Lanzante (1996). The first of the break points occurs in February 2009: there is an increase in the average annual concentration of SO2 during the period 2005–2008 and a subsequent decrease following this date. The second break point takes place in February 2013, coinciding with a sharp decline in oil refining activity. Although the fine-mode AOD series shows a change in behaviour after 2008, no break point is detected at this date. We can confirm that during the periods of 2005–2008, 2009–2013 and 2013–2020, mean SO2 concentrations of 24.3 ± 0.02, 18.2 ± 1.2 and 4.5 ± 0.4 µg m−3, respectively, were recorded, corresponding to a decrease of 81 % in the 2013–2020 period compared to the 2005–2008 period. This observed decrease in SO2 concentrations since 2013 occurred in response to the large reduction of oil-refining SO2 emissions in the city (Milford et al., 2018). This decrease in the concentration of SO2 corresponds to a decrease in fine-mode AOD of 57 %.
Table 1Annual mean values at 440, 675, 870 and 1020 nm of the aerosol properties g (the asymmetry parameter), SSA (the simple scattering albedo) and n and k (the values of the real and imaginary parts of the refractive index, respectively) at SCO, LLO, IZO and TPO, including the standard deviation.

Long-term ground-based AERONET observations have been used in this study to perform a comprehensive characterisation of atmospheric aerosols in the subtropical eastern North Atlantic. Photometric measurements from four stations with extensive temporal (9 to 16 years) and vertical (from sea level to 3555 m height) coverage allowed us to perform a robust assessment of tropospheric aerosols in this subtropical region. Santa Cruz de Tenerife – SCO – and La Laguna – LLO – are stations within the MABL, while the other two stations, Izaña – IZO – and Teide Peak – TPO – are high mountain stations within the FT.
The MABL and FT AOD and AE aerosol characterisation performed in this study confirms that this region shows alternation between predominant background conditions and predominant dust-loaded Saharan air mass outbreaks that seasonally affect the four sites as a result of the seasonal dust transport over the subtropical North Atlantic. Background conditions prevail in the MABL for most of the year, particularly in May and June (> 15 d per month), while dust-laden conditions dominate in July and August. Regarding the FT, dust-laden conditions follow a seasonal pattern, with background FT conditions dominating for most of the year (> 50 % of the days every month), except in July and August, when the number of days spent under dust-laden conditions is similar to the number spent under background conditions.
Under MABL background conditions, a bimodal lognormal size distribution with a predominant coarse mode, relatively stable and low VolCon values (between 0.02 ± 0.01 and 0.04 ± 0.02 µm3 µm−2), and a quite consistent behaviour of Reff have been found in the two stations within the MABL throughout the year (aerosols in the coarse mode with Reff ranging from 1.60 ± 0.19 µm in late spring to early summer to 1.91 ± 0.34 µm in winter). These results confirm that there is effective vertical mixing within the cloud-free subtropical MABL (Carrillo et al., 2016; Barreto et al., 2022). Regarding the FT, background conditions with remarkably low aerosol loadings characterised by a slight bimodality of the aerosol particle size distribution are observed at the two high-mountain stations, with a predominant impact of fine-mode aerosols throughout the year ( has its maximum value, 0.93 ± 0.13, in November) and an average Reff of 0.16 ± 0.02 µm.
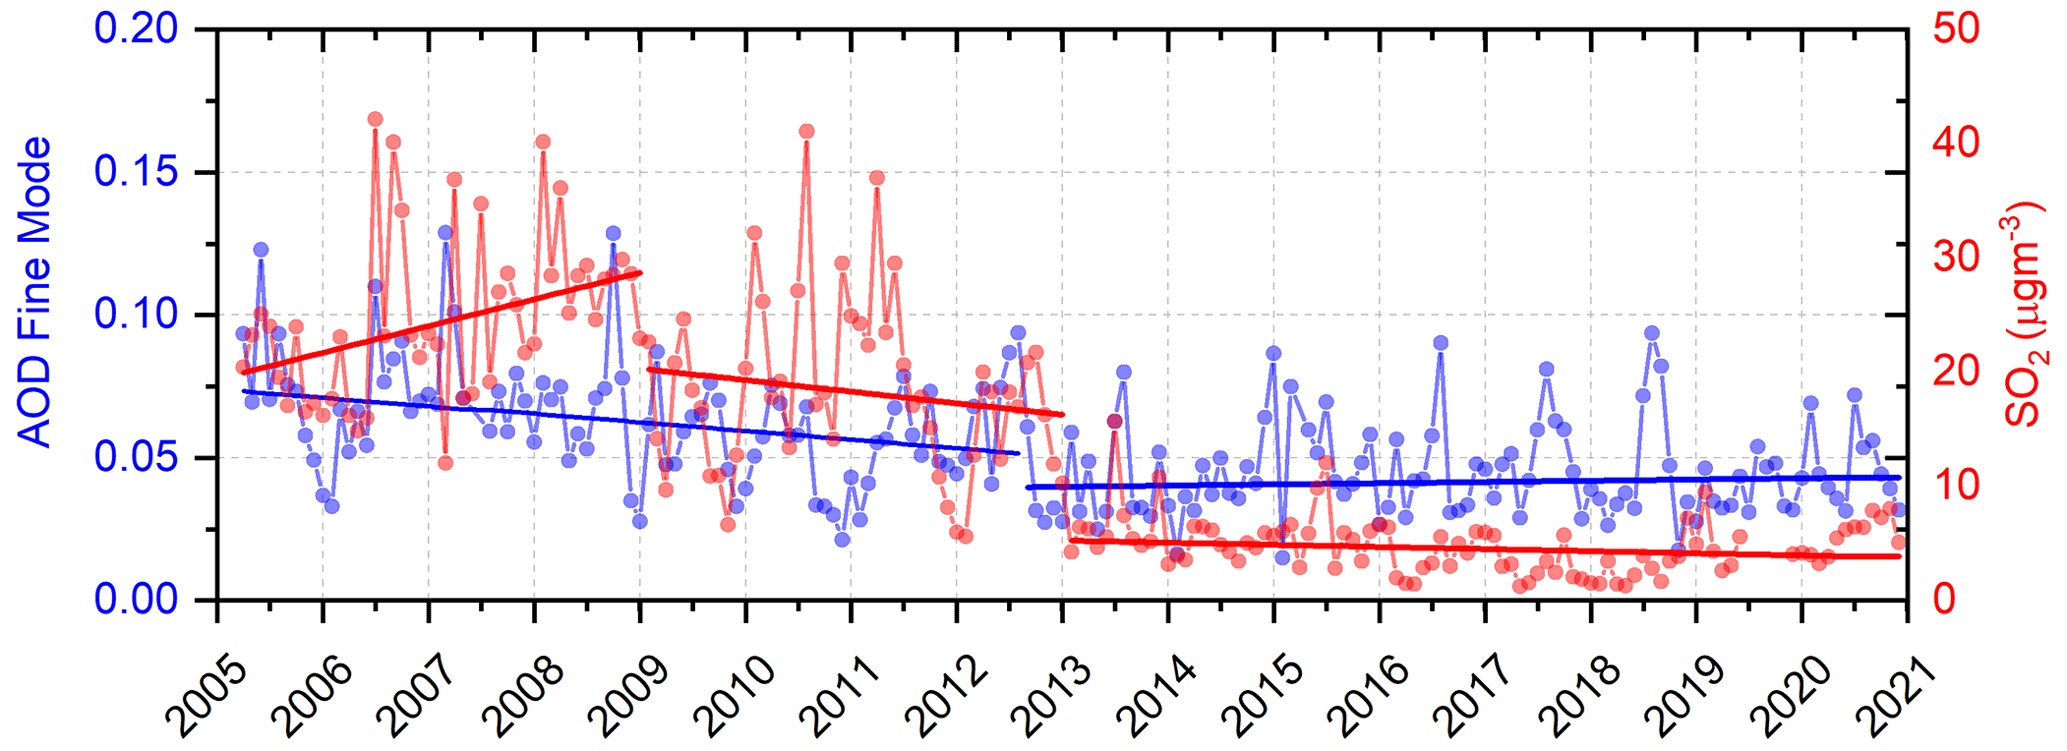
Figure 10Series of monthly mean values of fine-mode AOD (SCO, in blue) and SO2 (Tomé Cano station, in red) for the study period 2005–2020.
Dust-laden conditions are characterised by a bimodal particle-size distribution in the MABL, with a dominant coarse mode centred at 1.58 ± 0.12 µm observed throughout the year. Maximum aerosol loading was measured in summer (July and August) (maximum VolCon of 0.27 ± 0.24 µm3 µm−2) because dust is transported at higher levels over the Saharan convective boundary layer – a structure that is more prevalent in the free troposphere (Reid et al., 2003) and can often extend to 5–6 km height (Prospero and Carlson, 1972, 1980; Carlson, 2016; Barreto et al., 2022) – in summer. Our results indicate that the aerosol concentration in the MABL under dust-laden conditions is almost 1 order of magnitude higher in comparison to marine background conditions, with a lower contribution of fine-mode aerosols ( of 0.12 ± 0.03) and nearly constant Reff values of 0.12 ± 0.02 and 1.58 ± 0.12 µm for the fine and coarse fractions, respectively. Furthermore, coarse Reff values are lower than the values of 1.73 ± 0.23 and 1.75 ± 0.27 µm found for clean marine aerosols. Values that are quite consistent between the two stations within the MABL are also observed. A seasonal pattern in the aerosol volume size distribution is also observed in the FT as a consequence of the dust transport pattern over this region. Bimodal size distributions with a more prominent coarse mode in summer and spring months that is centred at 1.57 ± 0.14 µm are observed at the two sites, with a maximum VolCon value of 0.16 ± 0.12 µm3 µm−2 in summer. A similar value of 0.12 ± 0.03 to those observed in the MABL was measured in the FT, but this was considerably lower than those measured in the FT under background conditions. Reff is observed to be almost constant during the year, with values ranging from 1.50 ± 0.12 and 1.47 ± 0.13 µm, which can be attributed to pure desert dust conditions in the subtropical North Atlantic.
The lack of the seasonal dependence observed for the rest of the inversion products (g, SSA, n and k) in the dust-laden scenario is hypothesised to be due to the stable conditions within the SAL in terms of thermodynamics and aerosol composition. The MABL appears as a layer with an average asymmetry parameter maximum at 440 nm (g of 0.77 ± 0.03) and wavelength-independent SSA values in the visible and near-infrared, with an average value of 0.98 ± 0.01 at the two stations (0.93–0.95 for 440 nm). Average values of 1.45 ± 0.03 for n(λ) and 0.004 ± 0.002 for k(λ) (maximum values at 440 nm) were found to be representative of the MABL. The spectral dependence of g seems to be reduced in the FT, with a value of 0.74 ± 0.01 obtained for all four wavelengths. Regarding the SSA, rather similar values to those found in the MABL were reported. Average n and k values of 1.46 ± 0.01 and 0.002 ± 0.001 were found, respectively.
The low impact of dust transport at the TPO level is an important outcome of this paper, with an observed decrease in the aerosol concentration at TPO ranging from 32.3 % to 59.2 %. With this information, we have estimated the aerosol loading at the level of IZO to be double the aerosol concentration in the layer 1 km above, at TPO.
A subsequent long-term trend analysis in Santa Cruz over a 15-year period showed a negative trend in fine-mode AOD, with a trend of −1.8 ± 0.5 × 10⁻⁵ yr−1 (p value ≪ 0.01). No significant trend was observed in the total- and coarse-mode AOD at SCO nor in the total-, fine- and coarse-mode AOD at IZO for the whole period. The SO2 concentration time series at SCO was used as a proxy for the temporal evolution of fine-mode particulate matter resulting from refinery emissions. This information helped us to link the decrease in the concentration of SO2 in response to the large reduction in oil-refining SO2 emissions at Santa Cruz refinery to the decrease observed in the fine-mode AOD, estimated at 57 %. These results suggest that AERONET AOD observations, and specifically the fine-mode AOD, appear to be sensitive enough to detect long-term changes in air quality in a city.
The aerosol characterisation performed in this paper has the potential to provide a wide set of aerosol properties that are relevant for climate studies in a region that can be considered a key location to study the seasonal dependence of the dust transport from the Sahel-Sahara to the Caribbean region. This is a robust characterisation of the MABL and FT achieved by means of a consistent analysis of four stations under different and contrasting aerosol regimes, including background marine conditions, pure Saharan dust conditions, and the very stable and low aerosol turbidity present within the FT. Such observations can be useful for studying long-term trends in atmospheric composition within the MABL or changes that affect the FT. These observations in the FT are considered representative of large areas that avoid possible contamination from local or regional sources and can be used to validate aerosol models or to properly constrain pre-defined parameters in current inversion schemes.
Table A1Monthly mean, median and standard deviation (SD) of the aerosol optical depth (AOD) at 440, 500, 675 and 870 nm and the Ångström exponent (AE440−870 nm) at SCO from April 2005 and December 2020 and at LLO between July 2006 and December 2020.
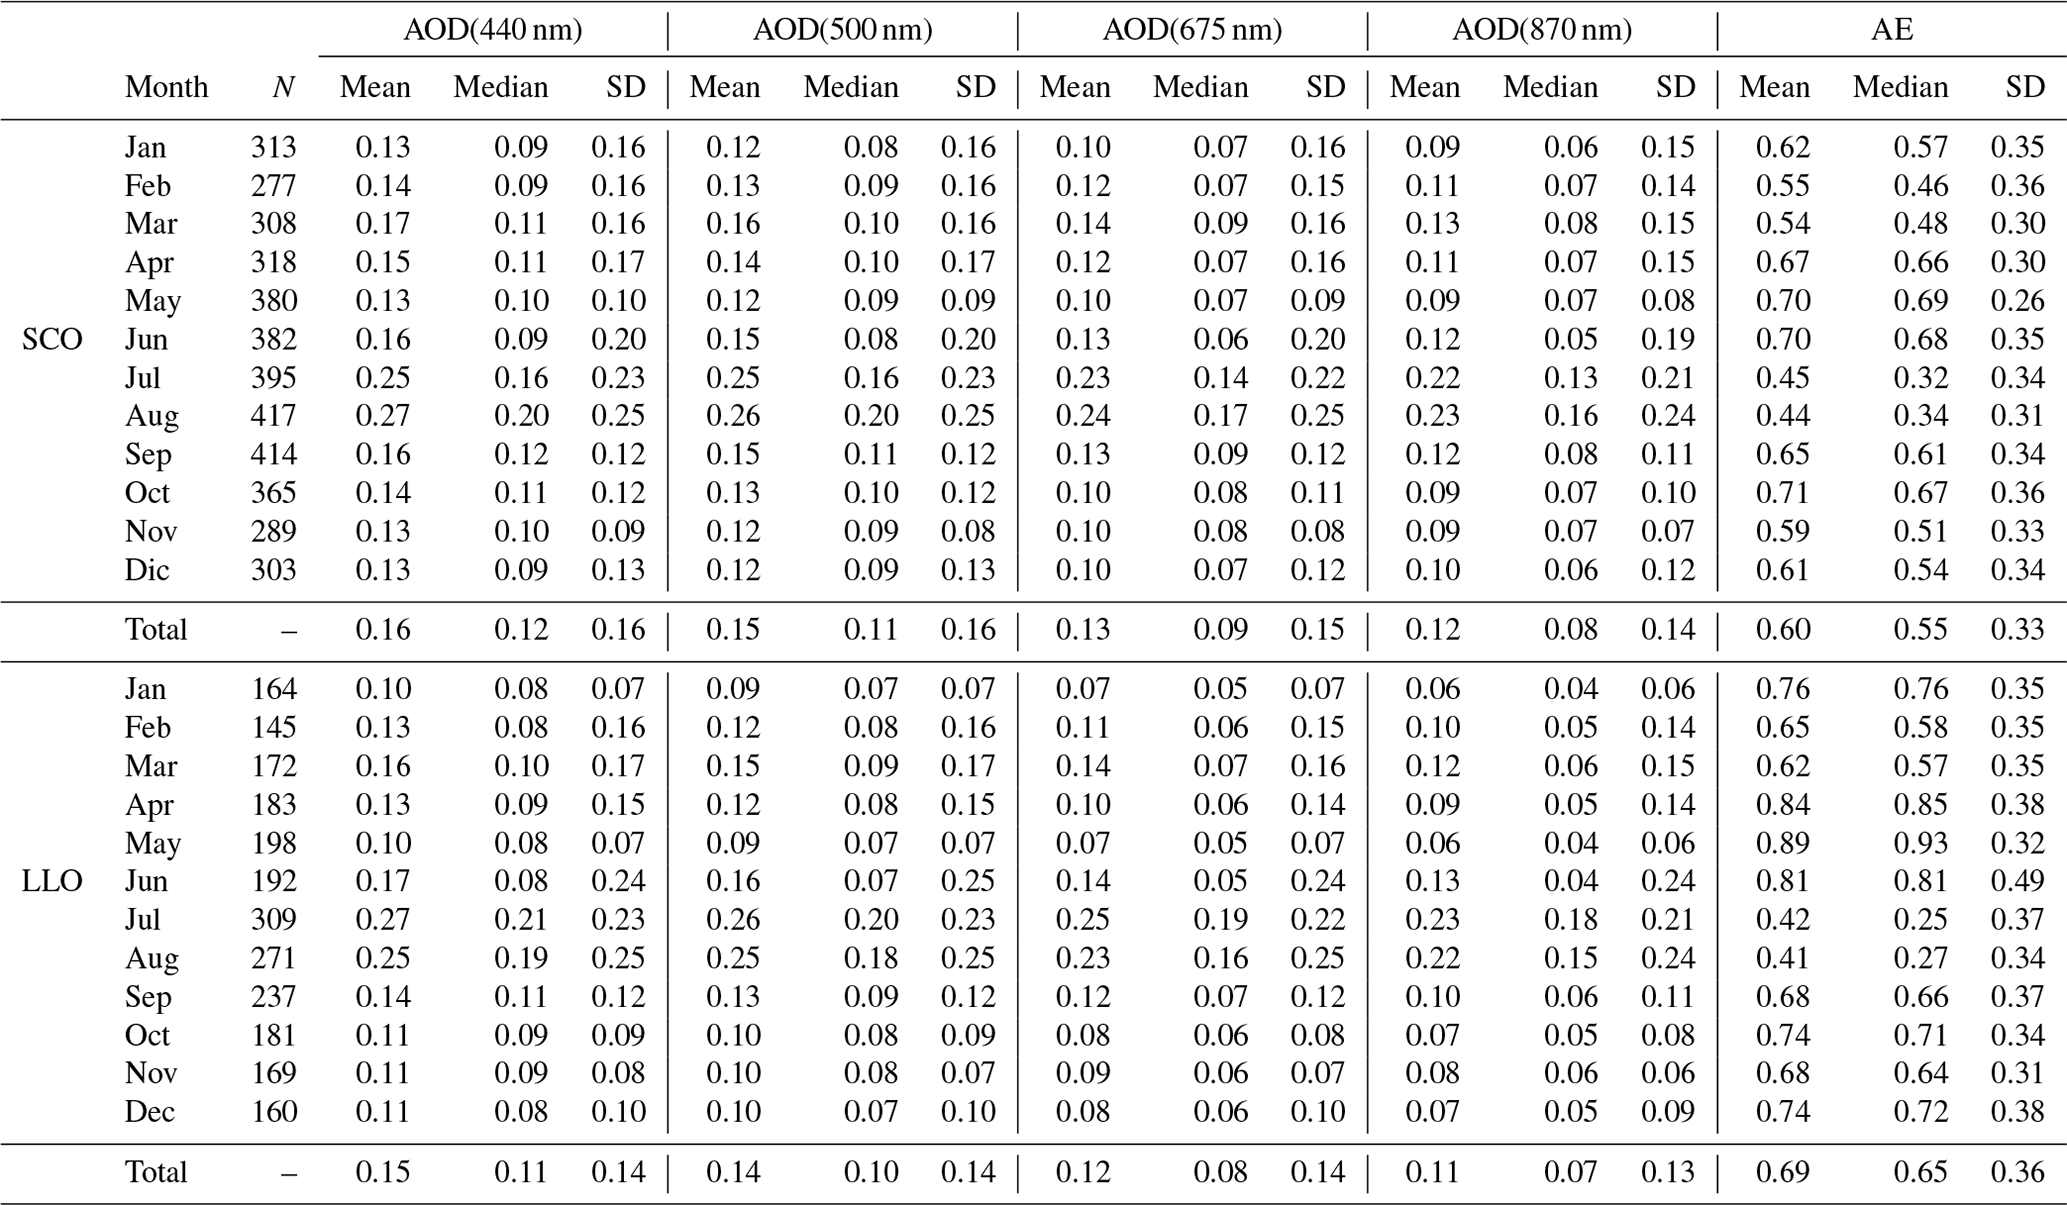
N is the number of data.
Table B1Monthly mean, median and standard deviation (SD) of the aerosol optical depth (AOD) at 440, 500, 675 and 870 nm and the Ångström exponent (AE440−870 nm) at IZO between from October 2004 and December 2020 and at TPO between July 2012 and December 2020.
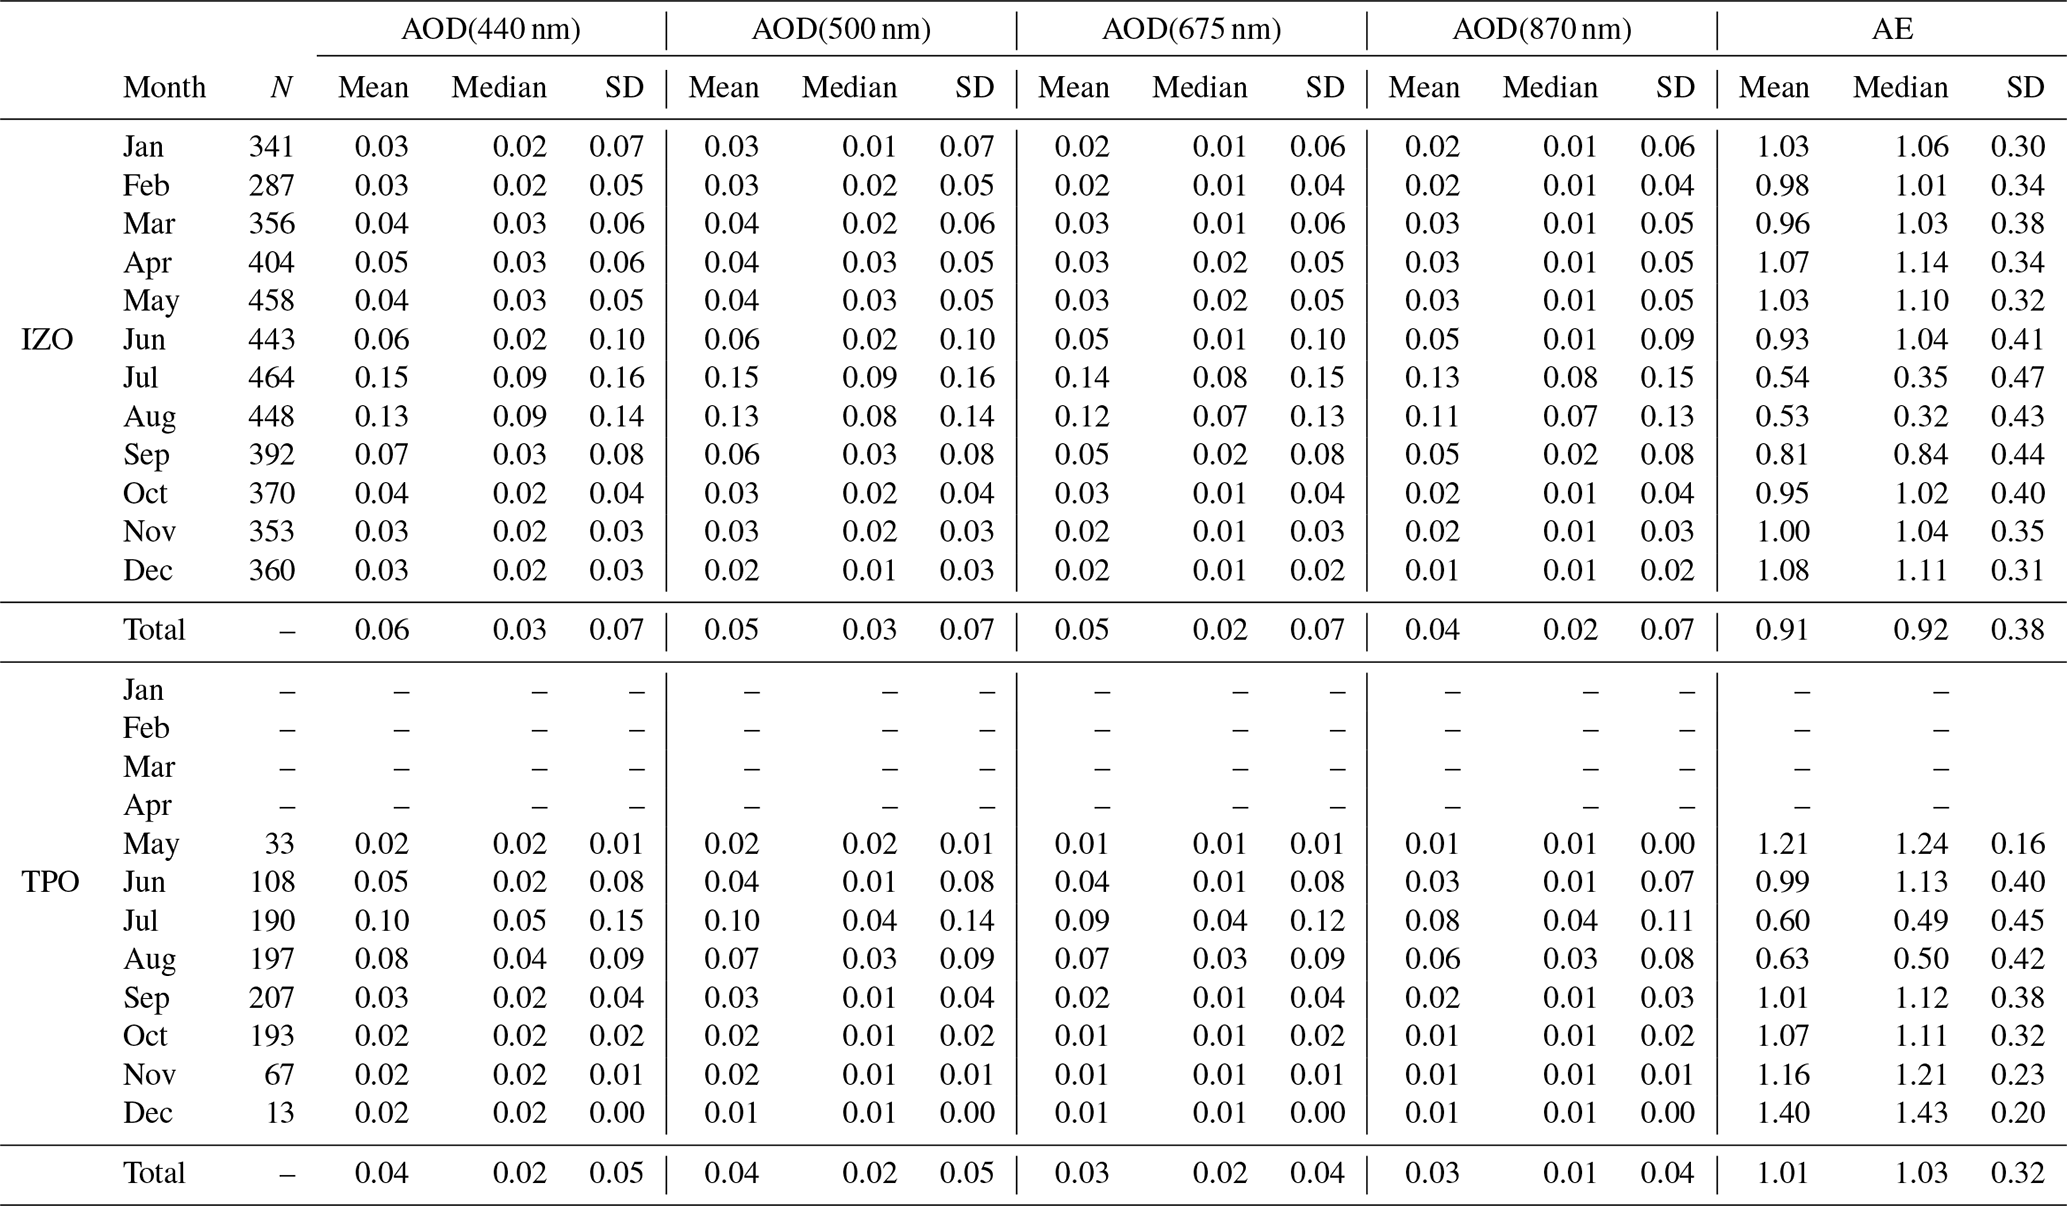
N is the number of data.
The data from AERONET used in the present study can be freely obtained from https://aeronet.gsfc.nasa.gov (Holben et al., 1998). The data from SIMAC (Gobierno de Canarias) can be freely accessed at https://www3.gobiernodecanarias.org/medioambiente/calidaddelaire/inicio.do (last access: 22 March 2022).
The supplement related to this article is available online at: https://doi.org/10.5194/acp-22-11105-2022-supplement.
CG and EC designed the structure and methodology of an early version of the paper. AB and RDG redesigned the structure and methodology to obtain the final paper. RDG computed the calculations required. AB, RDG EC, CM, FA SL and CT discussed the results and participated in the retrievals analysis. EC, CM and RDG wrote Sect. 3.3. FE and JD ensured the provision of funds and the operation of the LLO. All authors discussed the results and contributed to the final paper.
The contact author has declared that none of the authors has any competing interests.
Publisher’s note: Copernicus Publications remains neutral with regard to jurisdictional claims in published maps and institutional affiliations.
This article is part of the special issue “Dust aerosol measurements, modeling and multidisciplinary effects (AMT/ACP inter-journal SI)”. It is not associated with a conference.
We gratefully acknowledge the data provided by the AERONET network. We wish to express our appreciation to the staff of AEMET and ULL for maintaining the instrumentation and ensuring the quality of the data. The AERONET sun photometers at Izaña were calibrated through the AEROSPAIN Central Facility (https://aerospain.aemet.es/, last access: 22 Mach 2022). This study is a contribution to the Barcelona Dust Forecast Centre (https://dust.aemet.es/, last access: 22 Mach 2022). The authors also acknowledge the support from ACTRIS, Ministerio de Ciencia e Innovación, Spain, through the projects SYNERA (PID2020-118793GA-I00) and ePOLAAR (RTI2018-097864-B-I00) and from Junta de Castilla y León (grant no. VA227P20).
This paper was edited by Stelios Kazadzis and reviewed by three anonymous referees.
Alonso-Pérez, S., Cuevas, E., Querol, X., Viana, M., and Guerra, J.: Impact of the Saharan dust outbreaks on the ambient levels of total suspended particles (TSP) in the marine boundary layer (MBL) of the Subtropical Eastern North Atlantic Ocean, Atmos. Environ., 41, 9468–9480, https://doi.org/10.1016/j.atmosenv.2007.08.049, 2007. a
Alonso-Pérez, S., Cuevas, E., Pérez, C., Querol, X., Baldasano, J., Draxler, R., and Bustos, J. D.: Trend changes of African airmass intrusions in the marine boundary layer over the subtropical Eastern North Atlantic region in winter, Tellus B, 63, 255–265, https://doi.org/10.1111/j.1600-0889.2010.00524.x, 2011. a
Alonso-Pérez, S., Cuevas, E., Querol, X., Guerra, J., and Pérez, C.: African dust source regions for observed dust outbreaks over the Subtropical Eastern North Atlantic region, above 25∘ N, J. Arid Environ., 78, 100–109, https://doi.org/10.1016/j.jaridenv.2011.11.013, 2012. a
Ångström, A.: On the atmospheric transmission of sun radiation and on dust in the air, Geogr. Ann., 11, 156–166, https://doi.org/10.2307/519399, 1929. a
Arias, P., Bellouin, N., Coppola, E., Jones, R., Krinner, G., Marotzke, J., Naik, V., Palmer, M., Plattner, G.-K., Rogelj, J., Rojas, M., Sillmann, J., Storelvmo, T., Thorne, T., Trewin, B., Achuta Rao, K., Adhikary, B., Allan, R., Armour, K., Bala, G., Barimalala, R., Berger, S., Canadell, J., Cassou, C., Cherchi, A., Collins, W., Collins, W., Connors, S., Corti, S., Cruz, F., Dentener, F., Dereczynski, C., Di Luca, A., Diongue Niang, A., Doblas-Reyes, F., Dosio, A., Douville, H., Engelbrecht, F., Eyring, V., Fischer, E., Forster, P., Fox-Kemper, B., Fuglestvedt, J.S.and Fyfe, J., Gillett, N., Goldfarb, L., Gorodetskaya, I., Gutierrez, J., Hamdi, R., Hawkins, E., Hewitt, H., Hope, P., Islam, A., Jones, C., Kaufman, D., Kopp, R., Kosaka, Y., Kossin, J., Krakovska, S., Lee, J.-Y., Li, J., Mauritsen, T., Maycock, T., Meinshausen, M., M. S.-K., Monteiro, P., Ngo-Duc, T., Otto, F., Pinto, I., Pirani, A., Raghavan, K., Ranasinghe, R., Ruane, A., Ruiz, L., Sallée, J.-B., Samset, B., Sathyendranath, S., Seneviratne, S., Sörensson, A., Szopa, S., Takayabu, I., Tréguier, A.-M., van den Hurk, B., Vautard, R., von Schuckmann, K., Zaehle, S., Zhang, Y., and Zickfel, K.: Climate Change 2021: The Physical Science Basis. Contribution of Working Group14 I to the Sixth Assessment Report of the Intergovernmental Panel on Climate Change; Technical Summary, The Intergovernmental Panel on Climate Change AR6, Cambridge University Press, Cambridge, United Kingdom and New York, NY, USA, https://doi.org/10.1017/9781009157896.002, 2021. a, b
Barreto, A., Cuevas, E., Granados-Muñoz, M.-J., Alados-Arboledas, L., Romero, P. M., Gröbner, J., Kouremeti, N., Almansa, A. F., Stone, T., Toledano, C., Román, R., Sorokin, M., Holben, B., Canini, M., and Yela, M.: The new sun-sky-lunar Cimel CE318-T multiband photometer – a comprehensive performance evaluation, Atmos. Meas. Tech., 9, 631–654, https://doi.org/10.5194/amt-9-631-2016, 2016. a
Barreto, A., Cuevas, E., García, R. D., Carrillo, J., Prospero, J. M., Ilić, L., Basart, S., Berjón, A. J., Marrero, C. L., Hernández, Y., Bustos, J. J., Ničković, S., and Yela, M.: Long-term characterisation of the vertical structure of the Saharan Air Layer over the Canary Islands using lidar and radiosonde profiles: implications for radiative and cloud processes over the subtropical Atlantic Ocean, Atmos. Chem. Phys., 22, 739–763, https://doi.org/10.5194/acp-22-739-2022, 2022. a, b, c, d, e, f, g, h, i, j, k, l, m, n, o, p, q, r
Basart, S., Pérez, C., Cuevas, E., Baldasano, J., and Gobbi, G.: Aerosol characterization in Northern Africa, Northeastern Atlantic, Mediterranean Basin and Middle East from direct-sun AERONET observations, Atmos. Chem. Phys., 9, 8265–8282, https://doi.org/10.5194/acp-9-8265-2009, 2009. a, b, c
Boucher, O., Randall, D., Artaxo, P., Bretherton, C., Feingold, G., Forster, P., Kerminen, V.-M., Kondo, Y., Liao, H., Lohmann, U., Rasch, P., Satheesh, S., Sherwood, S., Stevens, B., and Zhang, X.: Clouds and Aerosols, book section 7, 571–658, Cambridge University Press, Cambridge, United Kingdom and New York, NY, USA, https://doi.org/10.1017/CBO9781107415324.016, 2013. a
Carlson, T. N.: The Saharan Elevated Mixed Layer and its Aerosol Optical Depth, Open Atmos. Sci. J., 10, 26–38, https://doi.org/10.2174/1874282301610010026, 2016. a, b, c
Carlson, T. N. and Prospero, J. M.: The Large-Scale Movement of Saharan Air Outbreaks over the Northern Equatorial Atlantic, J. Appl. Meteorol. Climatol., 11, 283–297, https://doi.org/10.1175/1520-0450(1972)011<0283:TLSMOS>2.0.CO;2, 1972. a
Carrillo, J., Guerra, J. C., Cuevas, E., and Barrancos, J.: Characterization of the Marine Boundary Layer and the Trade-Wind Inversion over the Sub-tropical North Atlantic, Bound.-Lay. Meteorol., 158, 311–330, https://doi.org/10.1007/s10546-015-0081-1, 2016. a, b, c, d, e
Cuevas, E.: Estudio del Comportamiento del Ozono Troposferico en el Observatorio de Izaña (Tenerife) y su Relación con la Dinámica Atmosférica, Ph.D. thesis, Universidad Complutense de Madrid, https://eprints.ucm.es/id/eprint/1964/ (last access: 22 March 2022), 1995. a
Cuevas, E., Camino, C., Benedetti, A., Basart, S., Terradellas, E., Baldasano, J. M., Morcrette, J. J., Marticorena, B., Goloub, P., Mortier, A., Berjón, A., Hernández, Y., Gil-Ojeda, M., and Schulz, M.: The MACC-II 2007–2008 reanalysis: atmospheric dust evaluation and characterization over northern Africa and the Middle East, Atmos. Chem. Phys., 15, 3991–4024, https://doi.org/10.5194/acp-15-3991-2015, 2015. a, b, c
Cuevas, E., Milford, C., Bustos, J. J., García, O. E., García, R. D., Gómez-Peláez, A. J., Guirado-Fuentes, C., Marrero, C., Prats, N., Ramos, R., Redondas, A., Reyes, E., Rivas-Soriano, P. P., Rodríguez, S., Romero-Campos, P. M., Torres, C. J., Schneider, M., Yela, M., Belmonte, J., del Campo-Hernández, R., Almansa, F., Barreto, A., López-Solano, C., Basart, S., Terradellas, E., Werner, E., Afonso, S., Bayo, C., Berjón, A., Carreño, V., Castro, N. J., Chinea, N., Cruz, A. M., Damas, M., De Ory-Ajamil, F., García, M. I., Gómez-Trueba, V., Hernández, C., Hernández, Y., Hernández-Cruz, B., León-Luís, S. F., López-Fernández, R., López-Solano, J., Parra, F., Rodríguez, E., Rodríguez-Valido, M., Sálamo, C., Sanromá, E., Santana, D., Santo Tomás, F., Sepúlveda, E., and Sosa, E.: Izaña Atmospheric Research Center Activity Report 2017–2018, Tech. Rep. WMO/GAW No. 247, World Meteorological Organization & Izaña Atmospheric Resear Center (AEMET), https://izana.aemet.es/wp-content/docs/Izana_Report_2017_2018.pdf (last access: 22 March 2022), 2019a. a, b, c
Cuevas, E., Romero-Campos, P. M., Kouremeti, N., Kazadzis, S., Räisänen, P., García, R. D., Barreto, A., Guirado-Fuentes, C., Ramos, R., Toledano, C., Almansa, F., and Gröbner, J.: Aerosol optical depth comparison between GAW-PFR and AERONET-Cimel radiometers from long-term (2005–2015) 1 min synchronous measurements, Atmos. Meas. Tech., 12, 4309–4337, https://doi.org/10.5194/amt-12-4309-2019, 2019b. a, b, c, d
Dubovik, O. and King, M. D.: A flexible inversion algorithm for retrieval of aerosol optical properties from Sun and sky radiance measurements, J. Geophys. Res.-Atmos., 105, 20673–20696, https://doi.org/10.1029/2000JD900282, 2000. a, b, c
Dubovik, O., Holben, B., Eck, T. F., Smirnov, A., Kaufman, Y. J., King, M. D., Tanré, D., and Slutsker, I.: Variability of Absorption and Optical Properties of Key Aerosol Types Observed in Worldwide Locations, J. Atmos. Sci., 59, 590–608, https://doi.org/10.1175/1520-0469(2002)059<0590:VOAAOP>2.0.CO;2, 2002. a, b, c, d, e
Dubovik, O., Sinyuk, A., Lapyonok, T., Holben, B. N., Mishchenko, M., Yang, P., Eck, T. F., Volten, H., Muñoz, O., Veihelmann, B., van der Zande, W. J., Leon, J.-F., Sorokin, M., and Slutsker, I.: Application of spheroid models to account for aerosol particle nonsphericity in Remote Sens. of desert dust, J. Geophys. Res.-Atmos., 111, 148–227, https://doi.org/10.1029/2005JD006619, 2006. a, b, c, d
Eck, T. F., Holben, B. N., Reid, J., Dubovik, O., Smirnov, A., O'Neill, N., Slutsker, I., and Kinne, S.: Wavelength dependence of the optical depth of biomass burning, urban, and desert dust aerosols, J. Geophys. Res., 104349, 333–31, https://doi.org/10.1029/1999JD900923, 1999. a, b
Engelstaedter, S., Tegen, I., and Washington, R.: North African dust emissions and transport, Earth-Sci. Rev., 79, 73–100, https://doi.org/10.1016/j.earscirev.2006.06.004, 2006. a
Font-Tullot, I.: The weather in the Canary Islands (in Spanish) Madrid, Servicio Nacional de Meteorologıa, Publ. Ser. A, 26, 1956. a
García, M. I., Rodríguez, S., and Alastuey, A.: Impact of North America on the aerosol composition in the North Atlantic free troposphere, Atmos. Chem. Phys., 17, 7387–7404, https://doi.org/10.5194/acp-17-7387-2017, 2017a. a
García, M. I., Van Drooge, B. L., Rodríguez, S., and Alastuey, A.: Speciation of organic aerosols in the Saharan Air Layer and in the free troposphere westerlies, Atmos. Chem. Phys., 17, 8939–8958, https://doi.org/10.5194/acp-17-8939-2017, 2017b. a
Giles, D. M., Sinyuk, A., Sorokin, M. G., Schafer, J. S., Smirnov, A., Slutsker, I., Eck, T. F., Holben, B. N., Lewis, J. R., Campbell, J. R., Welton, E. J., Korkin, S. V., and Lyapustin, A. I.: Advancements in the Aerosol Robotic Network (AERONET) Version 3 database – automated near-real-time quality control algorithm with improved cloud screening for Sun photometer aerosol optical depth (AOD) measurements, Atmos. Meas. Tech., 12, 169–209, https://doi.org/10.5194/amt-12-169-2019, 2019. a, b, c
González, Y. and Rodríguez, S.: A comparative study on the ultrafine particle episodes induced by vehicle exhaust: A crude oil refinery and ship emissions, Atmos. Res., 120/121, 43–54, https://doi.org/10.1016/j.atmosres.2012.08.001, 2013. a, b
Holben, B., Eck, T., Slutsker, I., Tanré, D., Buis, J., Setzer, A., Vermote, E., Reagan, J., Kaufman, Y., Nakajima, T., Lavenu, F., Jankowiak, I., and Smirnov, A.: AERONET – A Federated Instrument Network and Data Archive for Aerosol Characterization, Remote Sens. Environ., 66, 1–16, https://doi.org/10.1016/S0034-4257(98)00031-5, 1998 (data available at: https://aeronet.gsfc.nasa.gov, last access: 22 March 2022). a, b, c, d
Holben, B. N., Tanré, D., Smirnov, A., Eck, T. F., Slutsker, I., Abuhassan, N., Newcomb, W. W., Schafer, J. S., Chatenet, B., Lavenu, F., Kaufman, Y. J., Castle, J. V., Setzer, A., Markham, B., Clark, D., Frouin, R., Halthore, R., Karneli, A., O'Neill, N. T., Pietras, C., Pinker, R. T., Voss, K., and Zibordi, G.: An emerging ground-based aerosol climatology: Aerosol optical depth from AERONET, J. Geophys. Res.-Atmos., 106, 12067–12097, https://doi.org/10.1029/2001JD900014, 2001. a, b
Kandler, K., Benker, N., Cuevas, E., Ebert, M., Knippertz, P., Rodriguez, S., Schütz, L., and Weinbruch, S.: Chemical composition and complex refractive index of Saharan Mineral Dust at Izaña, Tenerife (Spain) derived by electron microscopy, Atmos. Environ., 41, 8058–8074, https://doi.org/10.1016/j.atmosenv.2007.06.047, 2007. a, b
Karyampudi, V. M., Palm, S. P., Reagen, J. A., Fang, H., Grant, W. B., Hoff, R. M., Pierce, H. F., Torres, O., Browell, E. V., and Melfi, S. H.: Validation of the Saharan Dust plume conceptual model using Lidar, Meteosat, and ECMWF Data, B. Am. Meteorol. Soc., 80, 1045–1075, https://doi.org/10.1175/1520-0477(1999)080<1045:VOTSDP>2.0.CO;2, 1999. a
Kok, J. F., Ridley, D. A., Zhou, Q., Miller, R. L., Zhao, C., Heald, C. L., Ward, D. S., Albani, S., and Haustein, K.: Smaller desert dust cooling effect estimated from analysis of dust size and abundance, Nat. Geosci., 10, 274–278, https://doi.org/10.1038/ngeo2912, 2017. a, b
Laj, P., Bigi, A., Rose, C., Andrews, E., Lund Myhre, C., Collaud Coen, M., Lin, Y., Wiedensohler, A., Schulz, M., Ogren, J. A., Fiebig, M., Gliß, J., Mortier, A., Pandolfi, M., Petäja, T., Kim, S.-W., Aas, W., Putaud, J.-P., Mayol-Bracero, O., Keywood, M., Labrador, L., Aalto, P., Ahlberg, E., Alados Arboledas, L., Alastuey, A., Andrade, M., Artíñano, B., Ausmeel, S., Arsov, T., Asmi, E., Backman, J., Baltensperger, U., Bastian, S., Bath, O., Beukes, J. P., Brem, B. T., Bukowiecki, N., Conil, S., Couret, C., Day, D., Dayantolis, W., Degorska, A., Eleftheriadis, K., Fetfatzis, P., Favez, O., Flentje, H., Gini, M. I., Gregorič, A., Gysel-Beer, M., Hallar, A. G., Hand, J., Hoffer, A., Hueglin, C., Hooda, R. K., Hyvärinen, A., Kalapov, I., Kalivitis, N., Kasper-Giebl, A., Kim, J. E., Kouvarakis, G., Kranjc, I., Krejci, R., Kulmala, M., Labuschagne, C., Lee, H.-J., Lihavainen, H., Lin, N.-H., Löschau, G., Luoma, K., Marinoni, A., Martins Dos Santos, S., Meinhardt, F., Merkel, M., Metzger, J.-M., Mihalopoulos, N., Nguyen, N. A., Ondracek, J., Pérez, N., Perrone, M. R., Petit, J.-E., Picard, D., Pichon, J.-M., Pont, V., Prats, N., Prenni, A., Reisen, F., Romano, S., Sellegri, K., Sharma, S., Schauer, G., Sheridan, P., Sherman, J. P., Schütze, M., Schwerin, A., Sohmer, R., Sorribas, M., Steinbacher, M., Sun, J., Titos, G., Toczko, B., Tuch, T., Tulet, P., Tunved, P., Vakkari, V., Velarde, F., Velasquez, P., Villani, P., Vratolis, S., Wang, S.-H., Weinhold, K., Weller, R., Yela, M., Yus-Diez, J., Zdimal, V., Zieger, P., and Zikova, N.: A global analysis of climate-relevant aerosol properties retrieved from the network of Global Atmosphere Watch (GAW) near-surface observatories, Atmos. Meas. Tech., 13, 4353–4392, https://doi.org/10.5194/amt-13-4353-2020, 2020. a
Lanzante, J. R.: Resistant, robust and non-parametric techniques for the analysis of climate data: Theory and examples, including applications to historical radiosonde station data, Int. J. Climatol., 16, 1197–1226, https://doi.org/10.1002/(SICI)1097-0088(199611)16:11<1197::AID-JOC89>3.0.CO;2-L, 1996. a, b
Li, J., Carlson, B. E., Dubovik, O., and Lacis, A. A.: Recent trends in aerosol optical properties derived from AERONET measurements, Atmos. Chem. Phys., 14, 12271–12289, https://doi.org/10.5194/acp-14-12271-2014, 2014. a
Milford, C., Cuevas, E., Rodríguez, E., Marrero, C., Bustos, J., and Torres, C.: Air quality trends in a coastal city, Santa Cruz de Tenerife, in: 11th International Conference on Air Quality Science and Application, Proceedings, 51, 51102080, https://doi.org/10.18745/PB.19829, 2018. a, b
Milford, C., Cuevas, E., Marrero, C. L., Bustos, J., Gallo, V., Rodríguez, S., Romero-Campos, P. M., and Torres, C.: Impacts of Desert Dust Outbreaks on Air Quality in Urban Areas, Atmosphere, 11, 23, https://doi.org/10.3390/atmos11010023, 2020. a
Nakajima, T., Campanelli, M., Che, H., Estellés, V., Irie, H., Kim, S.-W., Kim, J., Liu, D., Nishizawa, T., Pandithurai, G., Soni, V. K., Thana, B., Tugjsurn, N.-U., Aoki, K., Go, S., Hashimoto, M., Higurashi, A., Kazadzis, S., Khatri, P., Kouremeti, N., Kudo, R., Marenco, F., Momoi, M., Ningombam, S. S., Ryder, C. L., Uchiyama, A., and Yamazaki, A.: An overview of and issues with sky radiometer technology and SKYNET, Atmos. Meas. Tech., 13, 4195–4218, https://doi.org/10.5194/amt-13-4195-2020, 2020. a, b
Prospero, J. M.: Saharan dust transport over the north Atlantic Ocean and Mediterranean: An Overview, in The Impact of Desert Dust from Northern Africa Across the Mediterranean, Springer, Dordrecht, https://doi.org/10.1007/978-94-017-3354-0, 1996. a
Prospero, J. M. and Carlson, T. N.: Vertical and areal distribution of Saharan dust over the western equatorial north Atlantic Ocean, J. Geophys. Res., 77, 5255–5265, https://doi.org/10.1029/JC077i027p05255, 1972. a, b
Prospero, J. M. and Carlson, T. N.: Saharan air outbreaks over the Tropical North Atlantic, Pure Appl. Geophys., 119, 677–691, https://doi.org/10.1007/BF00878167, 1980. a, b, c
Putaud, J.-P., Van Dingenen, R., Alastuey, A., Bauer, H., Birmili, W., Cyrys, J., Flentje, H., Fuzzi, S., Gehrig, R., Hansson, H., Harrison, R., Herrmann, H., Hitzenberger, R., Hüglin, C., Jones, A., Kasper-Giebl, A., Kiss, G., Kousa, A., Kuhlbusch, T., Löschau, G., Maenhaut, W., Molnar, A., Moreno, T., Pekkanen, J., Perrino, C., Pitz, M., Puxbaum, H., Querol, X., Rodriguez, S., Salma, I., Schwarz, J., Smolik, J., Schneider, J., Spindler, G., ten Brink, H., Tursic, J., Viana, M., Wiedensohler, A., and Raes, F.: A European aerosol phenomenology – 3: Physical and chemical characteristics of particulate matter from 60 rural, urban, and kerbside sites across Europe, Atmos. Environ., 44, 1308–1320, https://doi.org/10.1016/j.atmosenv.2009.12.011, 2010. a
Reid, J. S., Kinney, J. E., Westphal, D. L., Holben, B. N., Welton, E. J., Tsay, S.-C., Eleuterio, D. P., Campbell, J. R., Christopher, S. A., Colarco, P. R., Jonsson, H. H., Livingston, J. M., Maring, H. B., Meier, M. L., Pilewskie, P., Prospero, J. M., Reid, E. A., Remer, L. A., Russell, P. B., Savoie, D. L., Smirnov, A., and Tanré, D.: Analysis of measurements of Saharan dust by airborne and ground-based remote sensing methods during the Puerto Rico Dust Experiment (PRIDE), J. Geophys. Res.-Atmos., 108, D19, https://doi.org/10.1029/2002JD002493, 2003. a
Rodríguez, S., Cuevas, E., González, Y., Ramos, R., P. M., Romero, N., Pérez, Querol, X., and Alastuey, A.: Influence of sea breeze circulation and road traffic emissions on the relationship between particle number, black carbon, PM1, PM2.5 and PM2.5−10 concentrations in a coastal city, Atmos. Environ., 42, 6523–6534, https://doi.org/10.1016/j.atmosenv.2008.04.022, 2008. a
Rodríguez, S., Alastuey, A., Alonso-Pérez, S., Querol, X., Cuevas, E., Abreu-Afonso, J., Viana, M., Pérez, N., Pandolfi, M., and de la Rosa, J.: Transport of desert dust mixed with North African industrial pollutants in the subtropical Saharan Air Layer, Atmos. Chem. Phys., 11, 6663–6685, https://doi.org/10.5194/acp-11-6663-2011, 2011. a, b, c, d, e
Rodríguez, S., Cuevas, E., Prospero, J. M., Alastuey, A., Querol, X., López-Solano, J., García, M. I., and Alonso-Pérez, S.: Modulation of Saharan dust export by the North African dipole, Atmos. Chem. Phys., 15, 7471–7486, https://doi.org/10.5194/acp-15-7471-2015, 2015. a
Rodríguez, S., Calzolai, G., Chiari, M., Nava, S., García, M. I., López-Solano, J., Marrero, C., López-Darias, J., Cuevas, E., Alonso-Pérez, S., Prats, N., Amato, F., Lucarelli, F., and Querol, X.: Rapid changes of dust geochemistry in the Saharan Air Layer linked to sources and meteorology, Atmos. Environ., 223, 117186, https://doi.org/10.1016/j.atmosenv.2019.117186, 2020. a, b
Sayer, A., Smirnov, A., Hsu, N., and Holben, B.: A pure marine aerosol model for use in remote sensing applications, J. Geophys. Res., 117, D05213, https://doi.org/10.1029/2011JD016689, 2012. a
Sinyuk, A., Holben, B. N., Eck, T. F., Giles, D. M., Slutsker, I., Korkin, S., Schafer, J. S., Smirnov, A., Sorokin, M., and Lyapustin, A.: The AERONET Version 3 aerosol retrieval algorithm, associated uncertainties and comparisons to Version 2, Atmos. Meas. Tech., 13, 3375–3411, https://doi.org/10.5194/amt-13-3375-2020, 2020. a, b, c, d
Smirnov, A., Holben, B. N., Slutsker, I., Welton, E, J., and Formenti, P.: Optical properties of Saharan dust during ACE 2, J. Geophys. Res., 103, 28079–28092, https://doi.org/10.1029/98JD01930, 1998. a
Smirnov, A., Holben, B., Kaufman, Y., Dubovik, O., Eck, T., Slutsker, I., Pietras, C., and Halthore, R.: Optical Properties of Atmospheric Aerosol in Maritime Environments, J. Atmos. Sci., 59, 501–523, https://doi.org/10.1175/1520-0469(2002)059<0501:OPOAAI>2.0.CO;2, 2002. a, b, c
Takamura, T. and Nakajima, T.: Overview of SKYNET and its activities, Opt. Pura Apl., 37, 3303–3308, 2004. a
Toledano, C., Cachorro, V. E., Berjon, A., de Frutos, A. M., Sorribas, M., de la Morena, B. A., and Goloub, P.: Aerosol optical depth and Ångström exponent climatology at El Arenosillo AERONET site (Huelva, Spain), Q. J. Roy. Meteorol. Soc., 133, 795–807, https://doi.org/10.1002/qj.54, 2007. a
Toledano, C., Wiegner, M., Groß, S., Freudenthaler, V., Gasteiger, J., Müller, D., Müller, T., Schladitz, A., Weinzierl, B., Torres, B., and O’Neill, N.: Optical properties of aerosol mixtures derived from sun-sky radiometry during SAMUM-2, Tellus B, 63, 635–648, https://doi.org/10.1111/j.1600-0889.2011.00573.x, 2011. a, b
Toledano, C., González, R., Fuertes, D., Cuevas, E., Eck, T. F., Kazadzis, S., Kouremeti, N., Gröbner, J., Goloub, P., Blarel, L., Román, R., Barreto, A., Berjón, A., Holben, B. N., and Cachorro, V. E.: Assessment of Sun photometer Langley calibration at the high-elevation sites Mauna Loa and Izaña, Atmos. Chem. Phys., 18, 14555–14567, https://doi.org/10.5194/acp-18-14555-2018, 2018. a, b, c
Torres, B., Toledano, C., Berjón, A., Fuertes, D., Molina, V., González, R., Canini, M., Cachorro, V. E., Goloub, P., Podvin, T., Blarel, L., Dubovik, O., Bennouna, Y., and de Frutos, A. M.: Measurements on pointing error and field of view of Cimel-318 Sun photometers in the scope of AERONET, Atmos. Meas. Tech., 6, 2207–2220, https://doi.org/10.5194/amt-6-2207-2013, 2013. a
Torres, B., Dubovik, O., Fuertes, D., Schuster, G., Cachorro, V. E., Lapyonok, T., Goloub, P., Blarel, L., Barreto, A., Mallet, M., Toledano, C., and Tanré, D.: Advanced characterisation of aerosol size properties from measurements of spectral optical depth using the GRASP algorithm, Atmos. Meas. Tech., 10, 3743–3781, https://doi.org/10.5194/amt-10-3743-2017, 2017. a, b
Tsamalis, C., Chédin, A., Pelon, J., and Capelle, V.: The seasonal vertical distribution of the Saharan Air Layer and its modulation by the wind, Atmos. Chem. Phys., 13, 11235–11257, https://doi.org/10.5194/acp-13-11235-2013, 2013. a
Viana, M., Querol, X., Alastuey, A., Cuevas, E., and Rodrıguez, S.: Influence of African dust on the levels of atmospheric particulates in the Canary Islands air quality network, Atmos. Environ., 36, 5861–5875, https://doi.org/10.1016/S1352-2310(02)00463-6, 2002. a
Wang, Y., Zheng, G., Jensen, M. P., Knopf, D. A., Laskin, A., Matthews, A. A., Mechem, D., Mei, F., Moffet, R., Sedlacek, A. J., Shilling, J. E., Springston, S., Sullivan, A., Tomlinson, J., Veghte, D., Weber, R., Wood, R., Zawadowicz, M. A., and Wang, J.: Vertical profiles of trace gas and aerosol properties over the eastern North Atlantic: variations with season and synoptic condition, Atmos. Chem. Phys., 21, 11079–11098, https://doi.org/10.5194/acp-21-11079-2021, 2021. a
Wehrli, C.: Calibrations of filter radiometer for determination of atmospheric optical depth, Metrologia, 37, 419, https://doi.org/10.1088/0026-1394/37/5/16, 2000. a
WMO: Commission for Instruments and Methods of Observation: Sixteenth session, Tech. Rep. WMO No. 1138, World Meteorological Organization, https://library.wmo.int/doc_num.php?explnum_id=5576 (last access: 22 March 2022), 2014. a