the Creative Commons Attribution 4.0 License.
the Creative Commons Attribution 4.0 License.
 | 31 Aug 2022
Measurement report: A multi-year study on the impacts of Chinese New Year celebrations on air quality in Beijing, China
Benjamin Foreback
Lubna Dada
Kaspar R. Daellenbach
Lili Wang
Ying Zhou
Tom V. Kokkonen
Mona Kurppa
Rosaria E. Pileci
Yonghong Wang
Tommy Chan
Juha Kangasluoma
Lin Zhuohui
Yishou Guo
Chang Li
Rima Baalbaki
Joni Kujansuu
Xiaolong Fan
Zemin Feng
Pekka Rantala
Shahzad Gani
Federico Bianchi
Veli-Matti Kerminen
Tuukka Petäjä
Markku Kulmala
Yongchun Liu
Pauli Paasonen
This study investigates the influence of the Chinese New Year (CNY) celebrations on local air quality in Beijing from 2013 through 2019. CNY celebrations include burning of fireworks and firecrackers, which consequently has a significant short-term impact on local air quality. In this study, we bring together comprehensive observations at the newly constructed Aerosol and Haze Laboratory at Beijing University of Chemical Technology – West Campus (BUCT-AHL) and hourly measurements from 12 Chinese government air quality measurement stations throughout the Beijing metropolitan area. These datasets are used together to provide a detailed analysis of air quality during the CNY over multiple years, during which the city of Beijing prohibited the use of fireworks and firecrackers in an effort to reduce air pollution before CNY 2018. Datasets used in this study include particulate matter mass concentrations (PM2.5 and PM10), trace gases (NOx, SO2, O3, and CO), and meteorological variables for 2013–2019; aerosol particle size distributions; and concentrations of sulfuric acid and black carbon for 2018 and 2019. Studying the CNY over several years, which has rarely been done in previous studies, can show trends and effects of societal and policy changes over time, and the results can be applied to study problems and potential solutions of air pollution resulting from holiday celebrations. Our results show that during the 2018 CNY, air pollutant concentrations peaked during the CNY night (for example, PM2.5 reached a peak around midnight of over 250 µg cm−3, compared to values of less than 50 µg cm−3 earlier in the day). The pollutants with the most notable spikes were sulfur dioxide, particulate matter, and black carbon, which are emitted in burning of fireworks and firecrackers. Sulfuric acid concentration followed the sulfur dioxide concentration and showed elevated overnight concentration. Analysis of aerosol particle number size distribution showed direct emissions of particles with diameters around 100 nm in relation to firework burning. During the 2019 CNY, the pollution levels were somewhat lower (PM2.5 peaking at around 150 µg cm−3 on CNY compared to values around 100 µg cm−3 earlier in the day), and only minor peaks related to firework burning were observed. During both CNYs 2018 and 2019 secondary aerosol formation in terms of particle growth was observed. Meteorological conditions were comparable between these 2 years, suggesting that CNY-related emissions were less in 2019 compared to 2018. During the 7-year study period, it appears that there has been a general decrease in CNY-related emissions since 2016. For example, the peak in PM2.5 in 2016 was over 600 µg cm−3, and in the years following, the peak was less each year, with a peak around 150 µg cm−3 in 2019. This is indicative of the restrictions and public awareness of the air quality issues having a positive effect on improving air quality during the CNY. Going into the future, long-term observations will offer confirmation for these trends.
- Article
(9589 KB) - Full-text XML
-
Supplement
(1220 KB) - BibTeX
- EndNote


Anthropogenic emissions associated with festivities, notably fireworks and firecrackers (hereafter simply fireworks), are known for their hazardous effects, and even short-term exposure can have significant impacts on human health (Bach et al., 2007; Chen et al., 2011; Jiang et al., 2015; Yang et al., 2014). Firework celebrations are found to increase the concentrations of trace gases and particle concentrations (Kong et al., 2015; Li et al., 2013). Furthermore, some studies have related these festivities to the occurrence of haze episodes in the days following a firework event (Li et al., 2013; Feng et al., 2012).
The Chinese New Year (CNY) is a traditional annual holiday occurring in wintertime – in January or in February as the exact date is based on the lunar cycle. Because of the adverse impacts on health, pollution from fireworks during the CNY has gathered attention worldwide. For instance, studies including Yang et al. (2014) in Jinan, Shi et al. (2014) in Tianjin, and Feng et al. (2012) and Zhang et al. (2010) in Shanghai have shown that there is noticeable degradation in air quality associated with Chinese New Year celebrations in these cities. Wang et al. (2007) has shown that firework celebrations emit significant amounts of sulfur dioxide and black carbon. The effects of fireworks on air pollution are known for various holidays in other countries as well. Studies in India, for example, during the country's annual Diwali festival in the late autumn have also shown results of high pollution from firework use (Ravindra et al., 2003; Mönkkönen et al., 2004; Barman et al., 2007; Singh et al., 2009; Yerramesetti et al., 2013). As another example, a study by Liu et al. (1997) in southern California, USA, showed enhanced concentrations of particulate matter and trace gas pollutants during firework celebrations.
Because of the rising awareness of air quality problems during holiday celebrations, the government of Beijing decided to implement a prohibition on firework burning within the 5th Ring Road of Beijing in an effort to reduce air pollution, which is described in a study by Liu et al. (2019). Their study reported that the prohibition resulted in about a 40 % decrease in the total number of fireworks and firecrackers sold in the city of Beijing during the 2018 CNY holiday compared to 2016. Furthermore, Liu et al. (2019) reported that observed concentrations of air pollutants during the 2018 CNY was significantly less than that in 2016.
Therefore, an aim of this study is to confirm the conclusions of the Liu et al. (2019) study, using not only a 2016 vs. 2018 comparison, but a longer study of each year between 2013 and 2019. Furthermore, this study offers a spatial comparison of the area where fireworks were prohibited (inside the 5th Ring) with a region where there was no prohibition (outside the ring). Currently, there are no previous studies that perform such a side-by-side comparison of areas with different firework burning policies.
This paper provides a detailed view of how CNY celebrations have influenced air quality and atmospheric chemistry in the Beijing metropolitan area. We start with an in-depth analysis of data from 2018 and 2019, and then we expand with the longer 7-year dataset. Combined, these datasets provide perspective into the impacts of the imposed restrictions on firework use in the Beijing area. The specific questions we aim to answer include (1) how the CNY celebrations and associated increase in precursor and aerosol emissions reflect the atmospheric concentrations of trace gases and particulate matter and particle number size distribution; (2) how these changes are connected with meteorological conditions; (3) how the influence of CNY affects regional air quality variation spatially over the Beijing area; and (4) how the influence of CNY on Beijing air quality has changed during the recent years, including the result of the firework prohibition beginning in 2018.
The observations used in this study include measurements collected from the Beijing University of Chemical Technology Aerosol and Haze Laboratory (BUCT-AHL), an academic research station in Beijing, China (Liu et al., 2020), along with 7 years of data from 12 measurement stations throughout the Beijing metropolitan area, operated by the Chinese Ministry of Environmental Protection (MEP). The long-term datasets also provide spatial context on the scale of the greater Beijing area, including a comparison of measurements inside versus outside of the prohibition area. Here we investigated years 2013–2019. Although data from the 2020 CNY are available, we have decided not to include them in this study because of the widespread impacts of the COVID-19 virus that affected China during this time. Due to the unfortunate circumstance, many Chinese citizens refrained from travel, public celebrations, and time spent in public. Consequently, the 2020 CNY is not directly comparable to previous years.
This study is novel and unique in a few ways. First, it is one of only a few studies to not only show measurements for a single CNY (or similar celebratory holidays in other countries), but it studies the holiday over 7 continuous years. This offers the ability to show trends and effects of, for example, policy changes over time. Furthermore, this study uses data from multiple institutions, which demonstrates the value of collaborations between different institutions when it comes to solving major global problems such as air pollution. This study also compares the CNY inside the center of the city to the greater Beijing area, which is unique compared to any previous CNY (or similar holiday) air quality study that uses data at a single location. Our insights offer value to scientists and policymakers around the world who are interested in improving air quality during holidays that involve firework celebrations. Improving air quality, even short-term, can have a significant positive impact on the health and wellbeing of citizens.
2.1 Measurement sites
This study uses data collected from two sources. First, we used data from the newly constructed station near the 3rd Ring Road of Beijing (39∘56′ N, 116∘17′ E; see Fig. 1 in Liu et al., 2020). The station, known as the Aerosol and Haze Laboratory, is located at Beijing University of Chemical Technology – West Campus, on the roof of a five-floor building near a busy highway. The station (BUCT-AHL) follows the concept of the Station for Measuring Ecosystem–Atmosphere Relations (SMEAR) in Hyytiälä, southern Finland (Hari and Kulmala, 2005). BUCT-AHL was built in collaboration with the Institute of Atmospheric and Earth System Research (INAR) at the University of Helsinki as part of the effort to build a global SMEAR network (Kulmala, 2018; Peltonen, 2017), with the aim to understand atmospheric chemical cocktails in megacities (Kulmala, 2015). In addition to collecting data for in-depth air quality analysis, this joint work increases collaboration between atmospheric scientists in China and Finland.
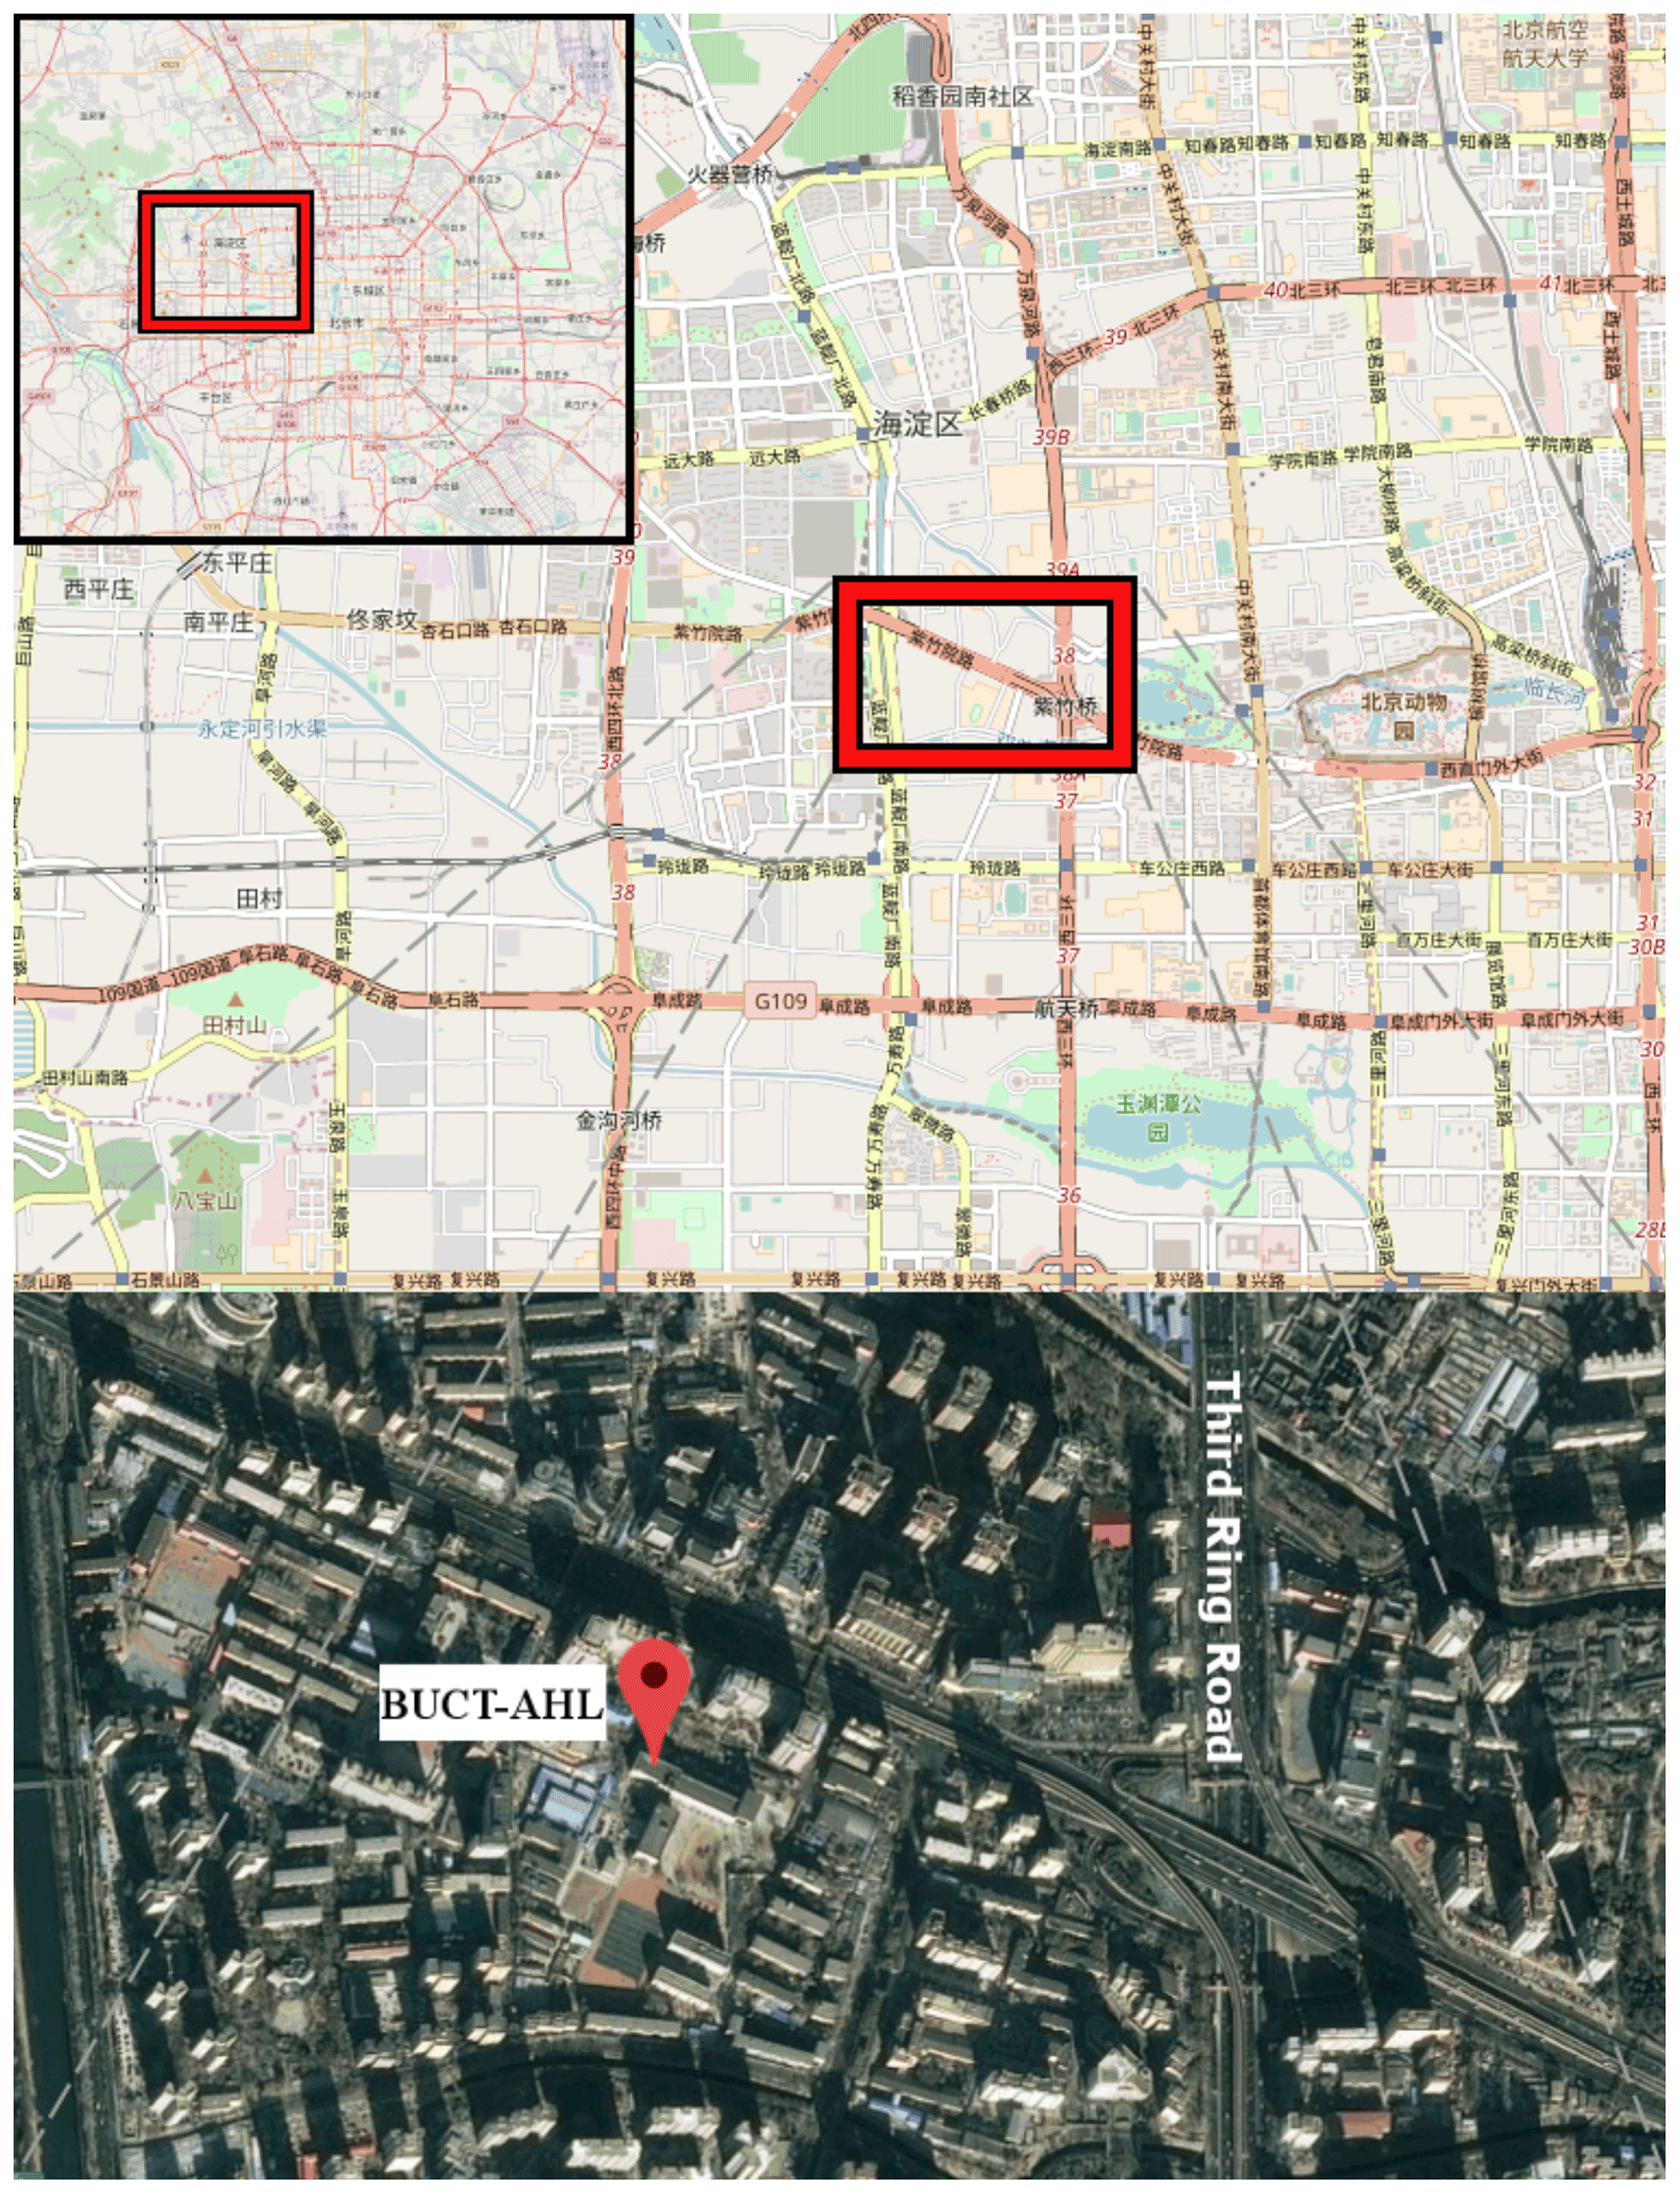
Figure 1Location of the BUCT-AHL site within the Beijing metropolitan area. © OpenStreetMap contributors 2022. Distributed under the Open Data Commons Open Database License (ODbL) v1.0.
In our analysis, the following datasets from BUCT-AHL during the 2018 and 2019 CNY are used: (1) trace gas concentrations – nitrogen oxides (NOx), sulfur dioxide (SO2), ozone (O3), and carbon monoxide (CO); (2) black carbon mass concentration (BC); (3) sub-micron aerosol particle number size distributions; (4) gas-phase sulfuric acid (H2SO4) concentration; (5) meteorological observations. Technical details of the instruments, including manufacturer, parameters measured, time resolution, and available time periods of measurements, can be found in Table S2 in the Supplement. These details are also described in Liu et al. (2020).
Additionally, we obtained datasets from several national air quality monitoring sites within the Beijing metropolitan area (NAQMS; Song et al., 2017; Tao et al., 2016). These datasets were obtained from the Chinese Ministry of Environmental Protection (MEP), which contain the following: (1) fine and coarse particulate matter mass concentrations (PM2.5 and PM10) and (2) trace gases (NOx, SO2, O3, and CO) from 2013 through 2019 for a multi-year comparison. This also provided insights into the spatial variability within the Beijing city and particularly contrast the area where the ban for the fireworks was implemented against the urban background air quality.
2.2 Instrumentation
2.2.1 Observations at the BUCT-AHL station
Trace gas measurements
Concentrations of carbon monoxide (CO), sulfur dioxide (SO2), ozone (O3), and nitrogen oxides (NOx) were measured with Thermo Environmental Instruments models 48i, 43i-TLE, 42i, and 49i, respectively. They were sampled through a common inlet through the roof of the building. The length of the sampling tube was approximately 3 m long (Zhou et al., 2020). The time resolution of the measurements was 5 min, but to be consistent with the MEP datasets, 1 h averages were used in this study.
Meteorological observations
Meteorological datasets for 2018–2019 at BUCT-AHL were collected with a Vaisala automatic weather station, AWS310, including wind speed and direction, ambient air temperature, and relative humidity. Boundary layer height (BLH) was measured using a Vaisala CL-51 ceilometer. Meteorological and BLH measurements were taken on the rooftop of BUCT-AHL.
Archived meteorological data for Beijing from 2013–2017 were obtained from the Weather Underground website (https://www.wunderground.com/history/daily/cn/beijing/ZBNY/, last access: 15 February 2022) (Beijing, People's Republic Of China Weather History, 2022). The station used is the Beijing Nanyuan Airport (ICAO identifier ZBNY), a small airport located between the 4th and 5th Ring Road, south of Beijing city center. The station is approximately 17 km from BUCT-AHL.
Sub-micron aerosol particle number size distributions and total number concentrations
Particle size distribution (PSD) between 3 nm and 1 µm was measured using an instrument of the same name, PSD (Liu et al., 2014). The instrument is composed of a nano-scanning mobility particle sizer (nano-SMPS; 3–55 nm, mobility diameter), a long SMPS (25–650 nm, mobility diameter), and an aerodynamic particle sizer (APS; 0.55–10 µm, aerodynamic diameter). It was fitted with a cyclone to remove particles larger than 10 µm from entering the system. Sampling was done from the rooftop using a 3 m long sampling tube. Additional information about the setup of these instruments can be found in Zhou et al. (2020) and Vanhanen et al. (2011).
Aerosol particle sizes have been further divided into four modes, based on particle diameter: cluster mode (sub-3 nm), nucleation mode (3–25 nm), Aitken mode (25–100 nm), and accumulation mode (100–1000 nm). The method is described in Zhou et al. (2020).
Gas-phase sulfuric acid
Sulfuric acid was measured by a chemical ionization atmospheric-pressure interface time-of-flight mass spectrometer equipped with a nitrate chemical ionization source (CI-APi-TOF; Jokinen et al., 2012). The ionization was done with NO as the reagent ion in ambient pressure (e.g., Petäjä et al., 2009). Nitrate reagent ions were produced by ionizing a mixture of 3 mL min−1 ultrahigh-purity nitrogen flow containing nitric acid with 20 mL min−1 zero air with an X-ray source. This mixture acted as the sheath flow and was introduced into a coaxial laminar flow reactor concentric to the sample flow. The sample flow was 8.8 L min−1, but only 0.8 L min−1 was drawn into the pinhole of the CI-APi-TOF. The sampling line was a 1.6 m long stainless-steel tube having an inner diameter of in. and positioned horizontally. The instrument was calibrated with known concentrations of sulfuric acid. Further information about the calibration procedure can be found in Kürten et al. (2012).
Black carbon mass concentration
An aethalometer AE33 (Magee Scientific) monitored the light absorption related to the aerosol. Equivalent black carbon (eBC) was computed based on the change in time of the light attenuation using procedures presented in Virkkula et al. (2015).
2.2.2 Chinese MEP data
Beginning in 2013, the Chinese Ministry of Environmental Protection (MEP) began installing a China-wide network of air quality monitoring stations to measure local and regional air quality. Real-time datasets from this sensor network are published hourly by the China Environmental Monitoring Center (CEMC), which includes PM10, PM2.5, SO2, NOx, and CO. There are over 1000 active sensors across China (Song et al., 2017; Tao et al., 2016; Shen et al., 2011).
In this study, data from 12 MEP sites throughout Beijing are used (see Table S1 for a list of these sites and their locations). The Guangyuan (GY) site is the closest site to BUCT-AHL, about 5 km east. The data used in this paper have been quality-controlled, described in Wu et al. (2018).
2.2.3 Back trajectories with HYSPLIT
Back trajectories to the BUCT station were calculated using the Hybrid Single-Particle Lagrangian Integrated Trajectory (HYSPLIT) model. This model is developed by the National Oceanic and Atmospheric Administration (NOAA) Air Resources Laboratory and the Australian Bureau of Meteorology Research Centre, and it is one of the most widely used models to determine the origin of an air mass (Stein et al., 2015). In this work, HYSPLIT trajectories were calculated for the CNY each year from 2013–2019, with the trajectories arriving between 18:00 and 06:00 (all times refer to local time, UTC+8) during the CNY. This adds value to the analysis in two ways: first, it can show whether the air masses in Beijing originated over other urban areas in China, e.g., the greater Beijing–Tianjin–Hebei (BTH) area, or whether the air mass came from more rural areas, e.g., Inner Mongolia or Mongolia. Additionally, it gives a synoptic overview of the weather conditions leading up to CNY. This in turn provides information on whether the air mass is more stagnant within the BTH area, which would result in higher pollution buildup, or whether it originated farther away, which would mean it would be cleaner from the start (Wang et al., 2010; Chen et al., 2015; Zhu et al., 2021).
Higher atmospheric concentrations due to elevated pollutant emissions during the Chinese New Year were observed at both BUCT-AHL and the MEP sites during the analysis periods. The observed features include sudden spikes in concentrations of trace gases, aerosol particles, and BC. These observations agree with the previous studies showing a connection between holiday-related firework celebrations and degraded air quality (Jiang et al., 2015; Yang et al., 2014; Shi et al., 2014; Feng et al., 2012; Zhang et al., 2010). In the sections below, we delve into these results, which can broaden scientific understanding of the impacts of firework celebrations on local and regional air quality, especially in the context of a wide metropolitan area over the course of several years.
3.1 Characteristics of air quality during the Chinese New Years 2018 and 2019
The CNY was on 16 February 2018 and 5 February 2019. Figure 2 shows a time series of air pollutant concentrations from 8 d before to 8 d after the 2018 and 2019 CNY at BUCT-AHL (except for PM2.5, which is from the nearby MEP sites). We observed sharp peaks in particulate matter mass (PM2.5), SO2, sulfuric acid, CO, BC, NO, and NO2 and ozone during firework events. In 2018 the peak in PM2.5 was over 250 µg m−3, compared to less than 50 µg m−3 half a day before, and in 2019 the peak of PM2.5 was over 150 µg m−3 compared to less than 100 µg m−3 earlier in the day. Similar spikes in BC, gas-phase sulfuric acid, and trace gas concentrations of several times the values earlier in the day were observed in 2018 as well.
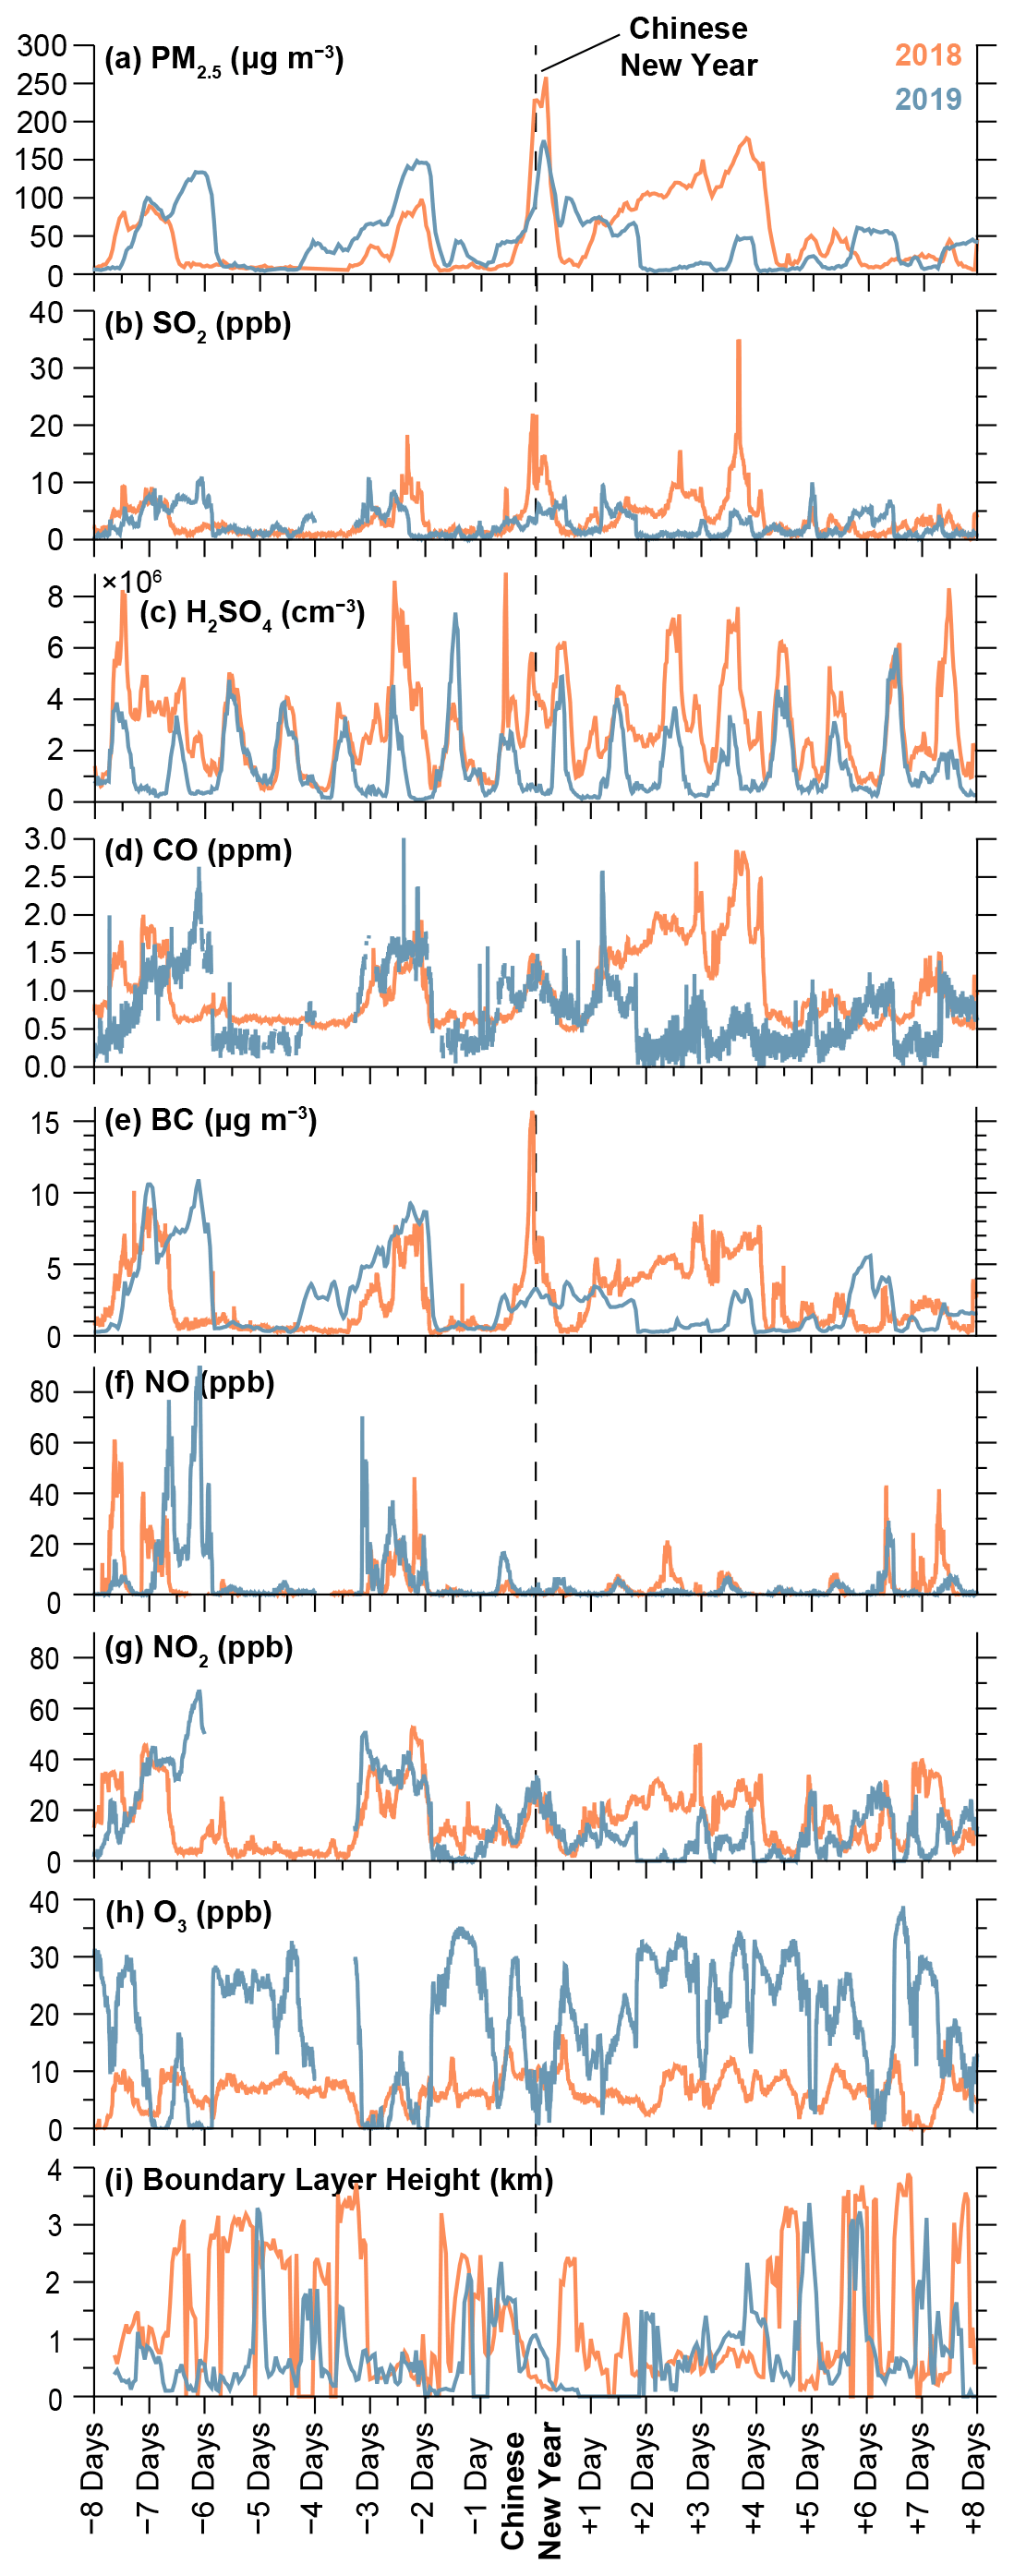
Figure 2Concentrations of main pollutants measured and boundary layer height in Beijing during the 2018 CNY (orange) and 2019 CNY (blue).
In contrast, in 2019, PM2.5 was observed to have less noticeable enhancement in concentration. While there was a noticeable spike in SO2 overnight of the CNY in 2018 (a spike over 20 ppb compared to less than 5 ppb earlier in the day), shown in Fig. 2, a much less noticeable enhancement of SO2 was observed overnight of the 2019 CNY (a peak around 5 ppb compared to around 3 ppb earlier in the day).
The measurements showed elevated nighttime concentration of H2SO4 on CNY in 2018 exceeding 3×106 cm−3 during the whole night, which was an order of magnitude higher than typical nighttime H2SO4 concentrations of 5×105 cm−3 (Dada et al., 2020). In 2019, there was no evident indication of anomalies in nighttime H2SO4 concentration during CNY. An unknown spike in H2SO4 was noticed at noon the day before CNY in 2018, and its association with celebratory activities is unclear. Like with PM2.5 and SO2, Fig. 2 shows a distinctive spike in BC around midnight of the 2018 CNY. Although SO2 and BC also originate from coal combustion and other emission sources (Wang et al., 2018), because of the shortness of the peak and the fact that it occurs at exactly midnight, these simultaneous peaks of BC and SO2 during the nighttime of CNY most likely originate from firework burning.
However, there appeared to be little to no effect of CNY on BC in 2019. The measurements showed an elevated concentration of NO2 overnight of the CNY in both years (45 ppb in 2018 and 20 ppb in 2019), yet no obvious spike in NO concentration. A high ratio can be caused by accumulation of pollutants emitted the previous afternoon (Chou et al., 2009), but in the case of CNY night it is straightforward to conclude that it is due to firework burning, which has been shown to emit NO2 but no NO (Jiang et al., 2015).
Figure 2 also shows that during the CNY celebrations in 2018 concentrations of the primary pollutants, SO2, CO, BC, NO, and NO2, were elevated, implying enhanced direct emissions during the CNY period. Secondary pollutants are formed through chemical reactions (Seinfeld and Pandis, 2016) including, for instance, sulfuric acid and ozone. The concentrations of these secondary pollutants were as expected: sulfuric acid concentration increased due to enhanced formation rate with increased SO2 concentration, and ozone concentration decreased with increased chemical sink by NOx and CO (and probably other carbon compounds). However, in 2019, only the concentrations of CO and NO2 were observed to increase during CNY celebrations, leading to a decrease in ozone concentration.
Interestingly, in addition to the short-term enhancement of pollutant concentrations, Fig. 2 shows degraded air quality between 16–20 February 2018, following the Chinese New Year, which closely resembles the characteristics of a haze event as described in Zhao et al. (2013, 2011) and Zhang et al. (2020). Using the data from BUCT-AHL, this period was quantifiably classified as a haze event using the algorithm in Zhou et al. (2020). These haze events have elevated concentrations of pollution continuously for multiple days, and concentrations gradually increase throughout the episodes. The haze eventually ends with sudden decline, often caused by an arrival of a cold front or change in synoptic weather conditions. Several previous studies, including Jiang et al. (2015) and Li et al. (2013), suggest that fireworks likely contribute to haze formation. It is plausible that the increased level of pollutants observed overnight during the 2018 CNY likely contributed to this subsequent haze period. However, the meteorological conditions and air mass origins are also important for haze formation and are discussed in Sect. 3.2.
3.2 Effects of meteorology and boundary layer height
Because the meteorological conditions during CNY vary between different years, it is important to address the impact of local- and synoptic-scale meteorological parameters on air pollution when comparing different years to each other. Specifically, wind speed and direction, relative humidity (RH), boundary layer height, and precipitation can affect pollutant concentrations during and after the fireworks.
However, none of the measured local meteorological variables showed drastic differences between CNY nights of 2018 and 2019. The wind speed during the night of the 2018 CNY peaked at ∼ 2 m s−1, and during the night of the 2019 CNY, it remained to values less than ∼ 1 m s−1 (Figs. 3 and S1 in the Supplement). Temperature was between 0 and 5 ∘C in both years. Some difference was observed in relative humidity as CNY 2018 took place in very dry conditions (RH ∼ 20 %), whereas during CNY 2019 RH was roughly 40 %. Precipitation was not measured at BUCT-AHL in either year, and weather data measured at ZBNY show there was no precipitation in the region during either of the years (data obtained from Weather Underground), which was supported by observed RH values below 50 %. The nocturnal boundary layer heights were less than 500 m in both years (Fig. 2), which is unfavorable for vertical mixing of the pollutants. Due to the slightly lower wind speeds in 2019 than 2018, we would expect more efficient dispersion of pollutants and thus lower concentrations in 2018. Higher RH is also often related to higher concentrations of aerosol pollutants (Sun et al., 2013). However, what we observed was that there were higher concentrations in 2018 than 2019. This indicates that the reason for lower pollutant concentrations in 2019 is not differences in the local meteorological conditions.
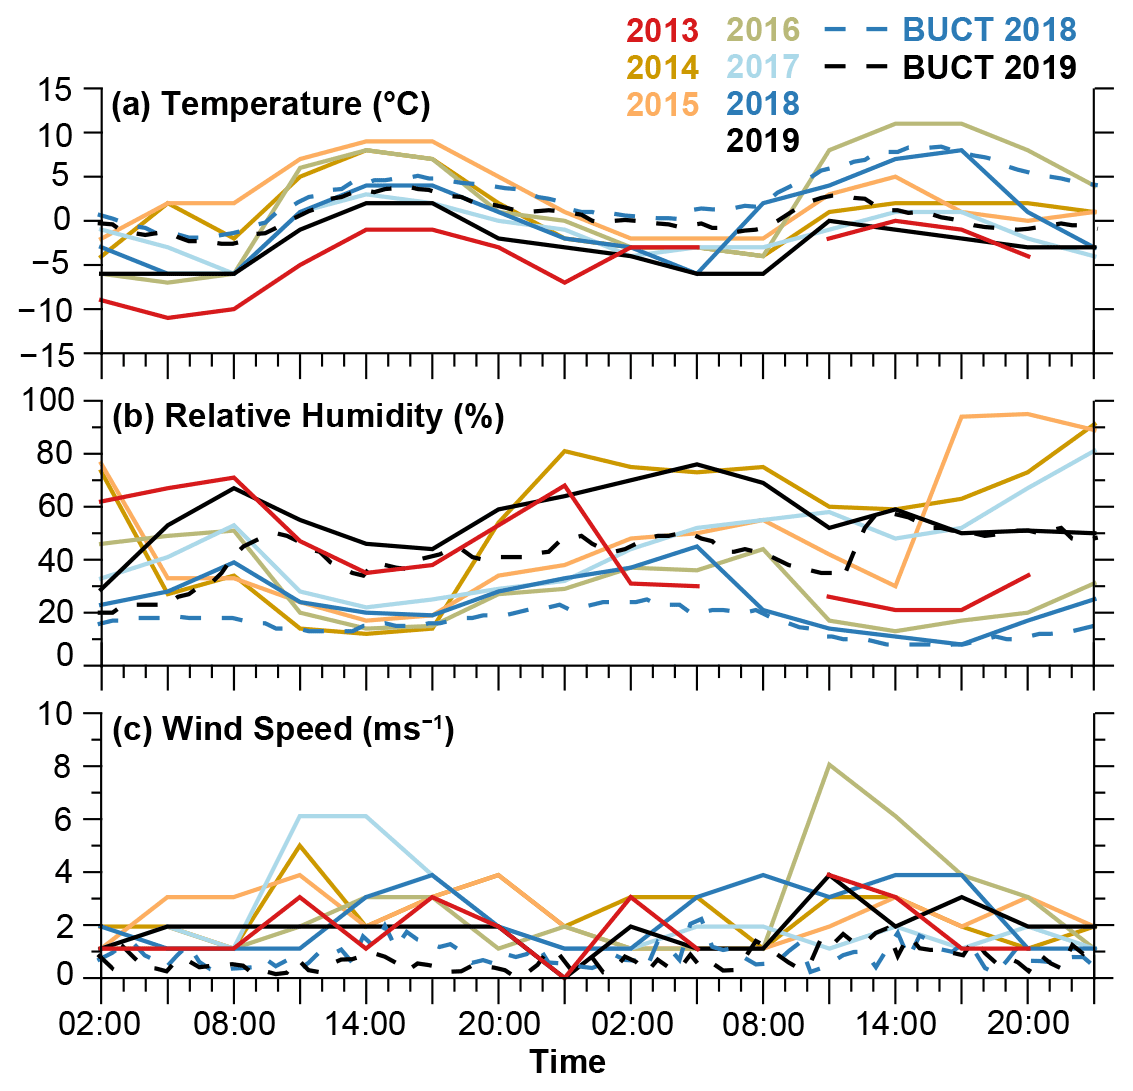
Figure 3Meteorological conditions during CNY night ± 1 d measured in Beijing from 2013–2019. Solid lines are measurements from Beijing Nanyuan Airport (ZBNY). These measurements are every 3 h. Dashed lines are measurements at BUCT-AHL during 2018–2019, with a time resolution of 1 h.
The lower concentrations observed during the emission spike in 2019 can be either due to lower emission rates in the area with which the measured air mass is in contact or due to a shorter exposure to roughly similar emissions during both years. Figure 4 shows 96 h back trajectories by HYSPLIT, during the night of CNY in 2018 and 2019, showing the sources of the air masses. This provides further insights into the history of the air masses in Beijing, including how clean we can expect the air masses to be before CNY and whether the air masses are stagnant around Beijing or whether clean air is being transported into the city.
These trajectories show the following: in 2018, the air masses from 6 h prior to CNY through CNY are from the southwest, and from 2 through 6 h after CNY, the air mass is from the west. In 2019, air masses from 6 h prior to CNY through 2 h prior to CNY are from the east, and following the CNY the air masses are primarily from the west.
Based on Wang et al. (2019), air masses from the east are expected to be cleaner than from the southwest due to more diffusion and fewer emissions from industry. However, we observed the opposite: from 6 through 2 h prior to midnight (i.e., the background value before the spike in pollution), the background pollutant concentrations are higher in 2019 than in 2018. This gives further indication that the emission sources are likely localized and short-term as opposed to long-range transport.
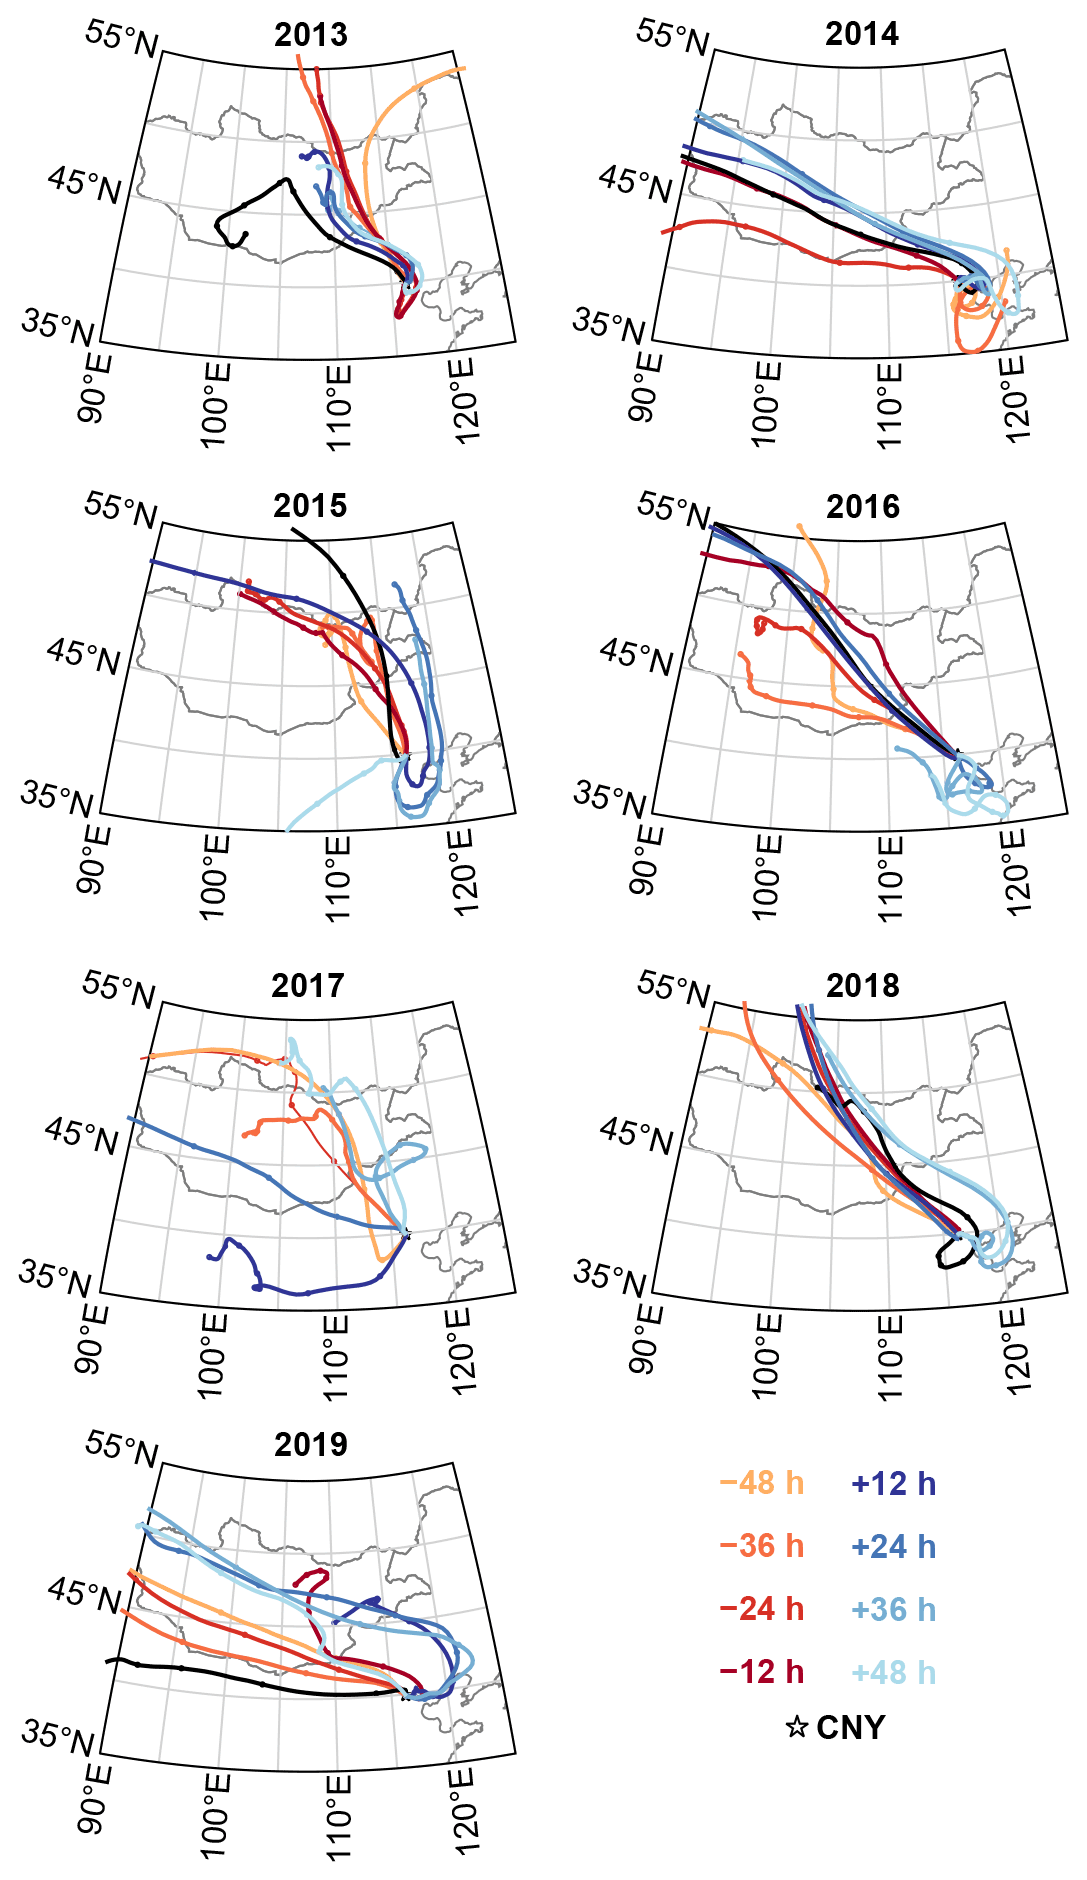
Figure 4HYSPLIT 96 h back trajectories for air masses arriving at BUCT-AHL between 18:00 and 06:00 LT, the night of CNY in 2013 through 2019. The markers are every 12 h.
3.3 Aerosol particle number concentrations and aerosol number size distribution
Further exploring the effects of the fireworks on air pollution, Fig. 5 shows PSD at BUCT-AHL from the day before to the day after CNY. Shortly before midnight on CNY in 2018, an elevated concentration of aerosol particles with diameters of roughly 100 nm was observed, simultaneously with the spike in SO2 concentration. After the spike, SO2 concentration remained elevated until the next morning. PM2.5 concentration increases simultaneously with the SO2 concentration but did not show the same spike as SO2. PM2.5 concentration remained high (>200 µg m−3) until the next morning, when it decreased to low values (<30 µg m−3) together with decreasing SO2 concentration. The nocturnal pollution episode showed a very similar pattern in both SO2 and PM2.5, despite the spike in SO2 occurring together with increased number concentration of roughly 100 nm particles and BC (Fig. 2e). This is consistent with air pollution from firework burning. It might have originated from a source nearby, but it can also be transported as a single strong plume from further away, e.g., from outside the 5th Ring Road, which was the edge of the prohibited area for firework activity. The overnight elevated concentration of PM2.5 and SO2, excluding the SO2 spike, may be related to an accumulated mixture of firework- and other festivity-related emissions, e.g., from traffic or cooking. The accumulation of PM2.5 seems to be related to secondary aerosol formation since the particle size distribution shows growth of particles in the dominant particle mode during the CNY night (concentration )) over 3.3×104 cm−3 between diameters 40 and 200 nm at around 20:00 and between diameters 60 and close to 300 nm at around 04:00).
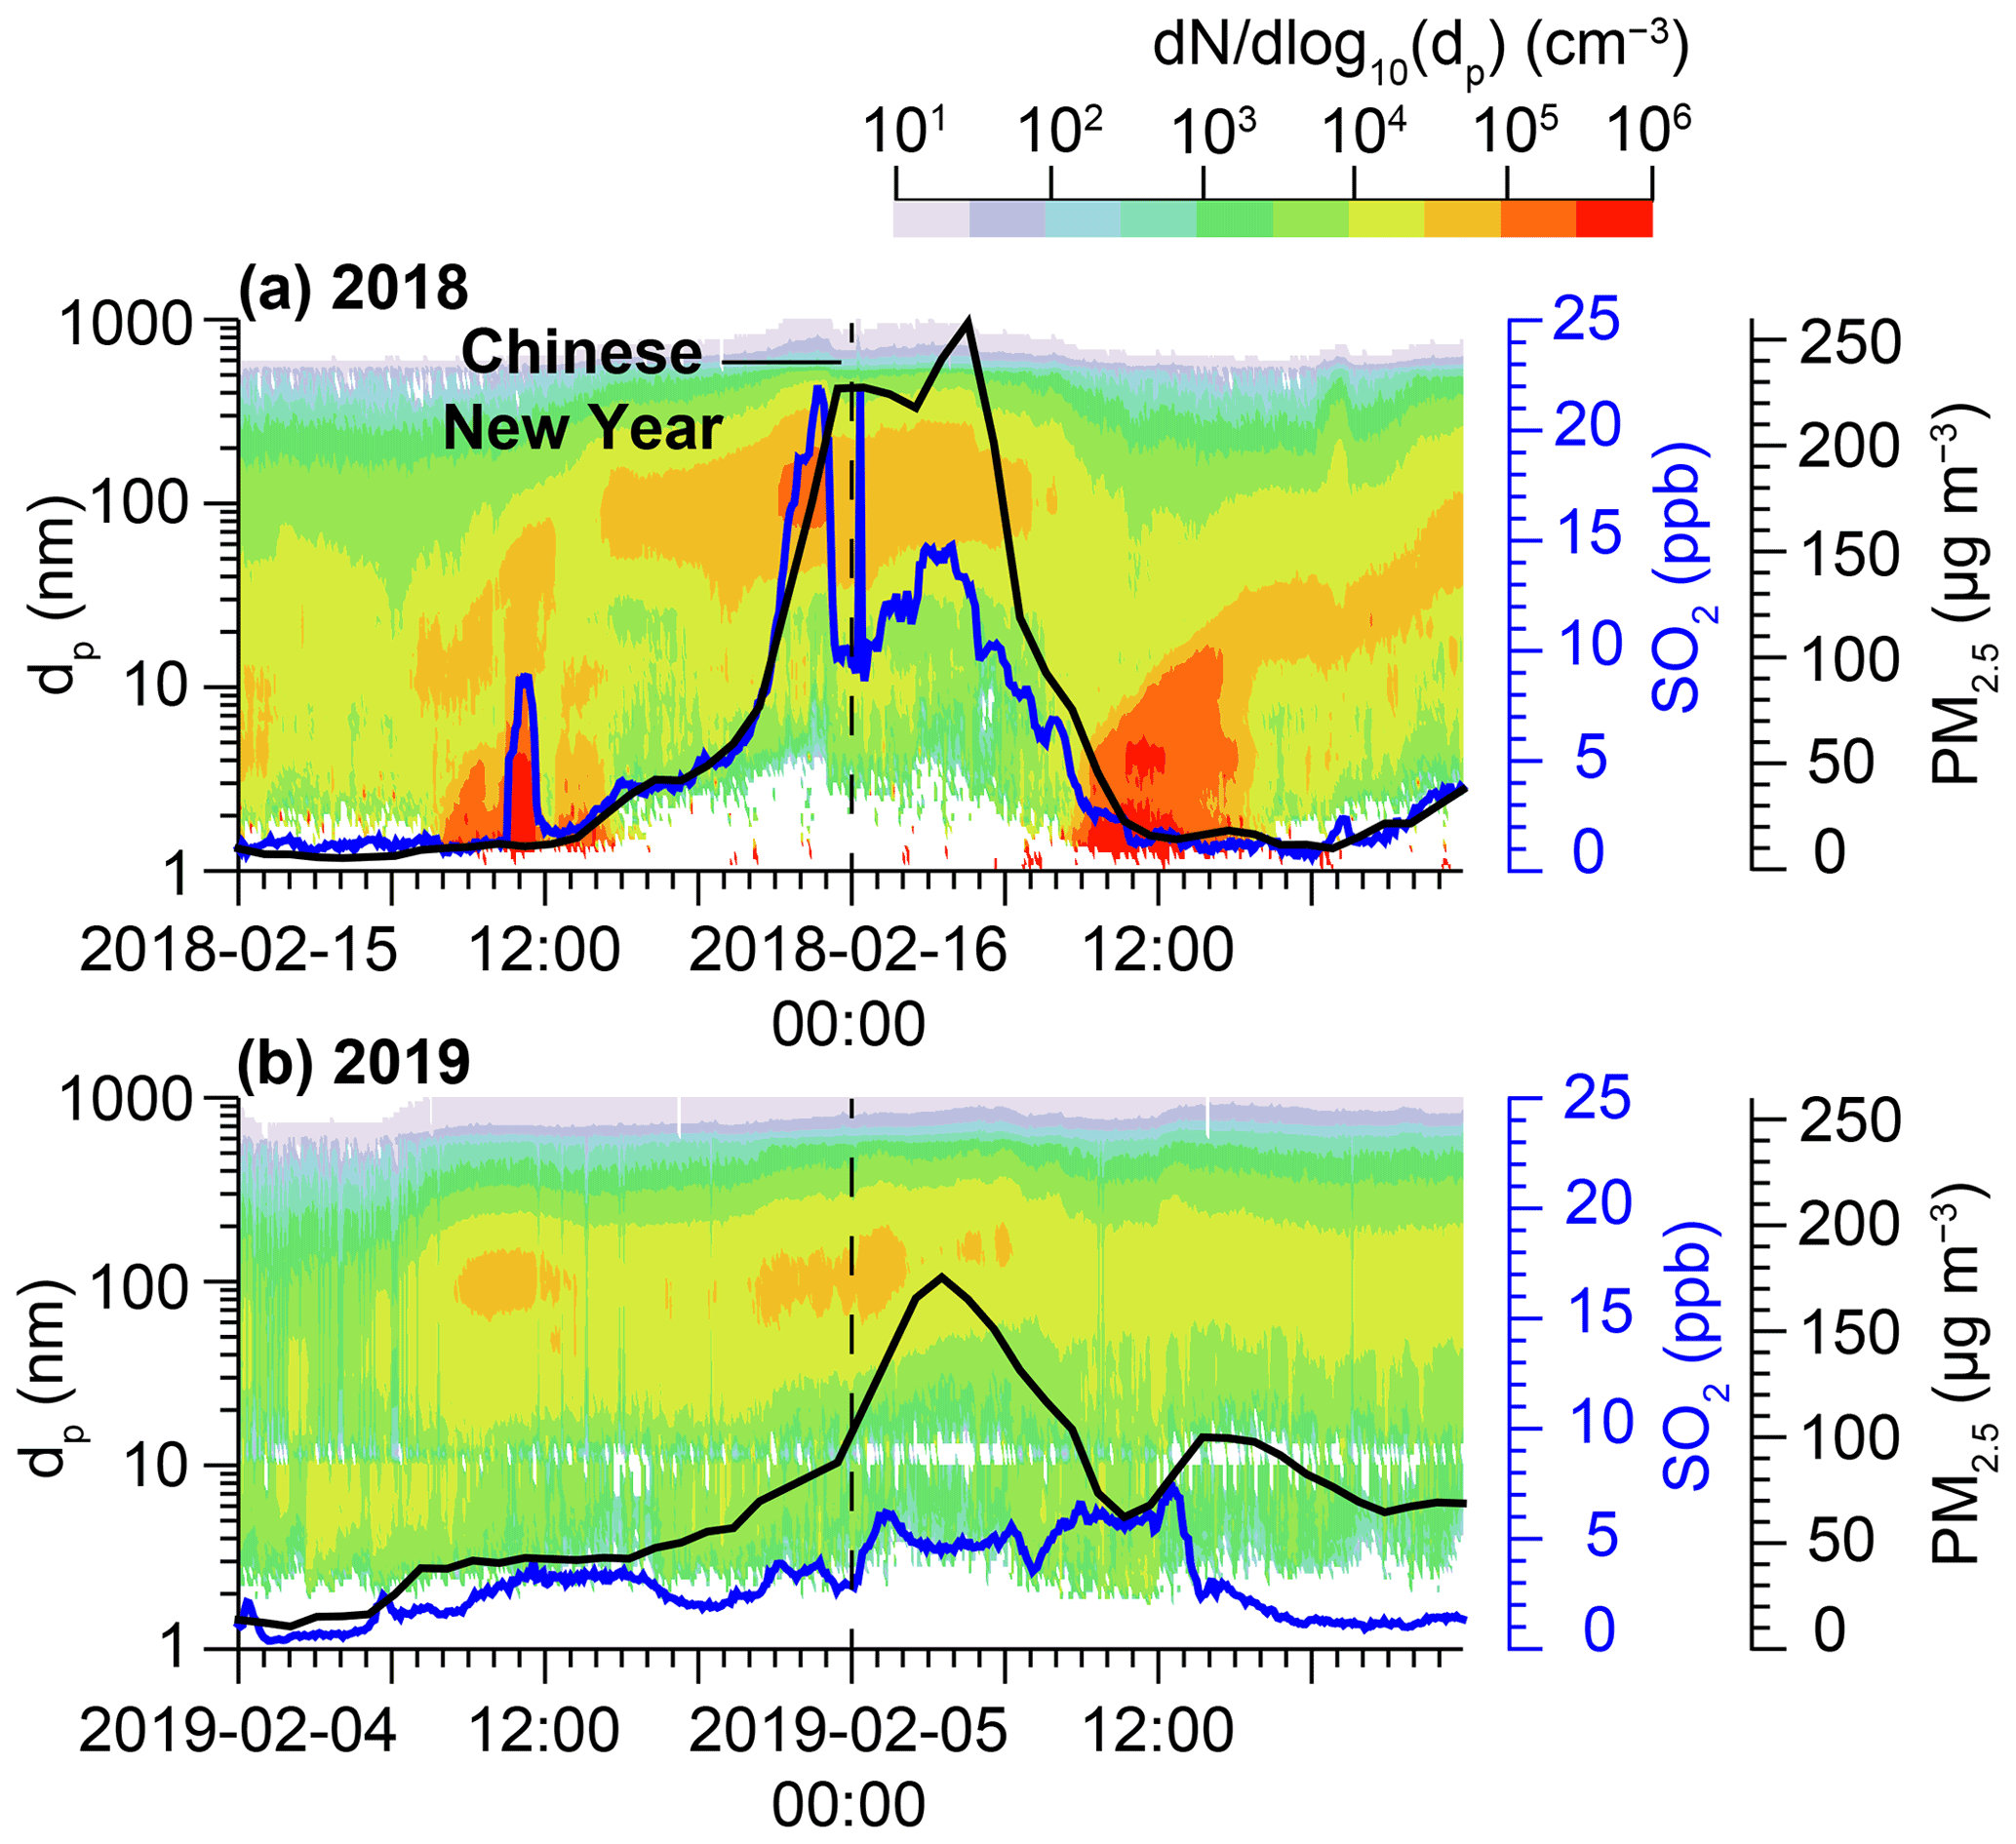
Figure 5Aerosol particle number size distribution (PSD) from 1 d before the CNY through 1 d following the CNY in 2018 and 2019, overlain with aerosol mass concentration PM2.5 (black lines) and SO2 (blue lines).
In 2019, secondary aerosol mass formation was also observed as the particle mode grew in diameter steadily between 18:00 and 06:00, and the PM2.5 concentration increased simultaneously until 04:00. The peak PM2.5 concentration was, however, much lower in 2019 than in 2018 (roughly 100 and close to 250 µm m−3, respectively). SO2 increased steadily throughout the night and exhibited only a mild peak, from 3 to 6 ppb, shortly after midnight. This peak was again accompanied by a simultaneous increase in concentration of particles with diameters around 100 nm and in BC concentration (Fig. 2), which suggests a contribution from fireworks. However, since the SO2 concentration showed only a mild peak and did not follow the PM2.5 concentration, the contribution of nearby firework activity to the overall pollution was estimated to be negligible.
Figure 6 shows the particle number concentrations in four size modes, specifically sub-3 nm cluster mode, 3–25 nm nucleation mode, 25–100 nm Aitken mode, and 100–1000 nm accumulation mode, as a function of PM2.5 concentration measured at BUCT-AHL in 2018 and 2019. This figure starts 48 h before CNY and runs through 48 h after the CNY. The filled circles mark the nighttime measurements on the CNY (21:00–05:00). The nighttime mass concentrations are noticeably greater. The mass-to-number concentration comparison for CNY follows the same general curve during nighttime as the full time period. The pattern, particularly the nighttime observations, is consistent with recent investigation by Zhou et al. (2020), which showed that in general concentrations of pollutants are higher during nighttime, attributed to a lower boundary layer and consequent high concentrations within the boundary layer. As noted in Sect. 3.1, the PM2.5 concentrations during the CNY period in 2018 were nearly an order of magnitude higher than before and after this time. The elevated PM2.5 concentration is directly connected to the elevated number concentration of accumulation-mode particles (Fig. 6, bottom right panel), and the CNY data points do not diverge from the overall coupling. This indicates that the typical sizes of particles contributing to PM2.5 remain similar during CNY compared to before and after it. Since the accumulation-mode particle concentrations form the main part of the total particle surface acting as a condensation sink for vapors forming new particles in the atmosphere and a coagulation sink for small cluster- and nucleation-mode particles, it is natural that the concentrations of cluster and nucleation mode decrease with increasing PM2.5 (Fig. 6, upper panels).
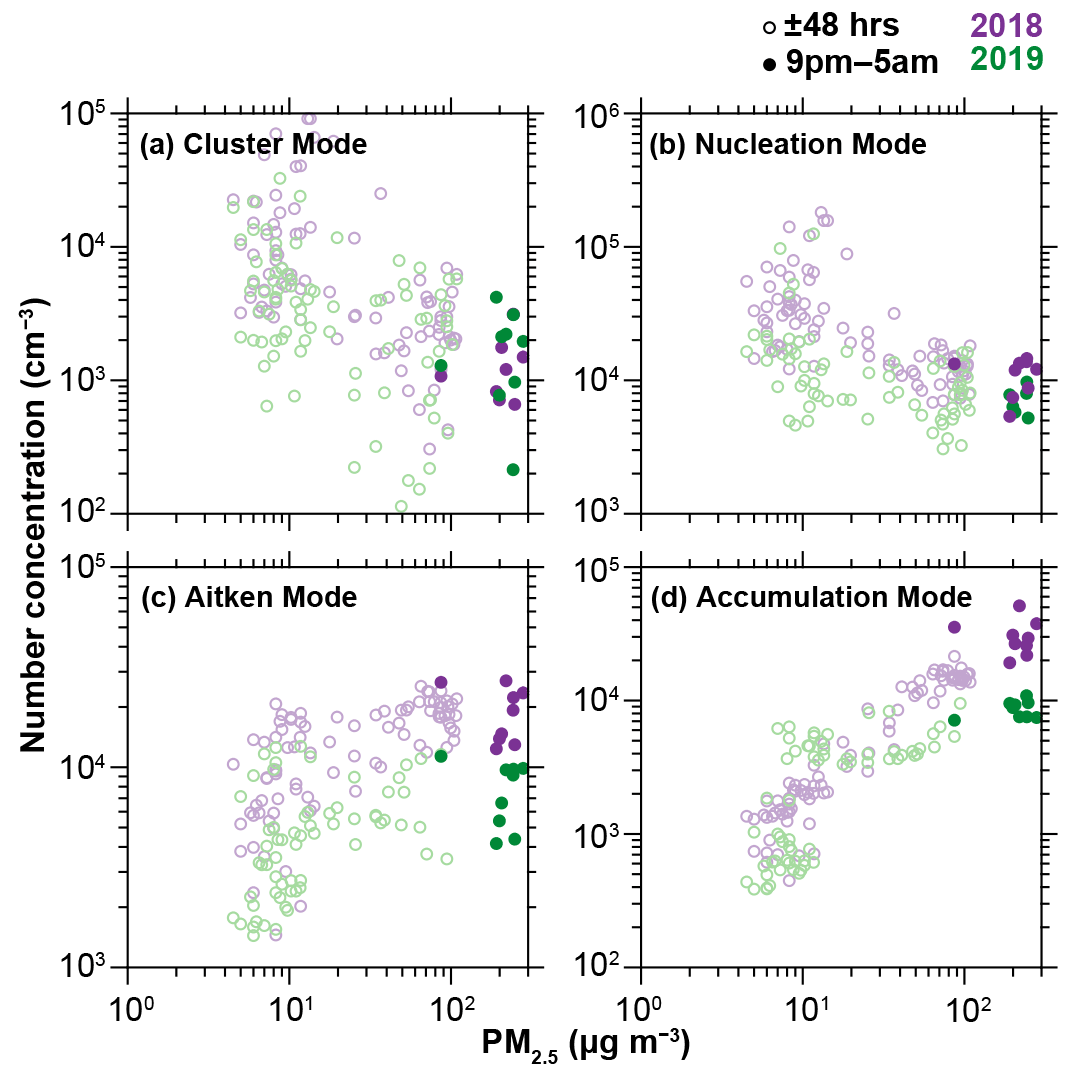
Figure 6Aerosol particle number concentrations in cluster, nucleation, Aitken, and accumulation modes as a function of PM2.5 mass concentration in 2018 (purple) and 2019 (green), separated from 21:00 through 05:00 the night of the CNY (filled circles), and those of CNY ± 48 h (open circles). The data are from BUCT-AHL.
In short, the CNY activities seem to not cause any major deviance for the typical aerosol dynamics other than the enhancement of the source of accumulation-mode particles.
Figure 7 depicts the cluster-, nucleation-, Aitken-, and accumulation-mode particle number concentrations as a function of gas-phase sulfuric acid concentration in 2018 and in 2019 inside and outside of the CNY period. Looking at the clusters, the results show a general strong dependency on the sulfuric acid as it is one of the main precursors driving the process of gas-to-particle conversion (e.g, Sipilä et al., 2010; Kulmala et al., 2013; Yao et al., 2018). However, the high nocturnal sulfuric acid concentration during CNY celebrations in 2018 does not lead to high cluster- or nucleation-mode concentration. In fact, the particle number concentrations in these modes deviate from the otherwise clear response to sulfuric acid concentrations. The reason for this is visible in the panel for accumulation-mode concentration vs. sulfuric acid concentration: during the CNY 2018 the high concentrations of accumulation-mode particles correlate with sulfuric acid concentration, thus plausibly neglecting the enhanced particle cluster and particle formation rates by an enhanced coagulation sink as explained earlier.
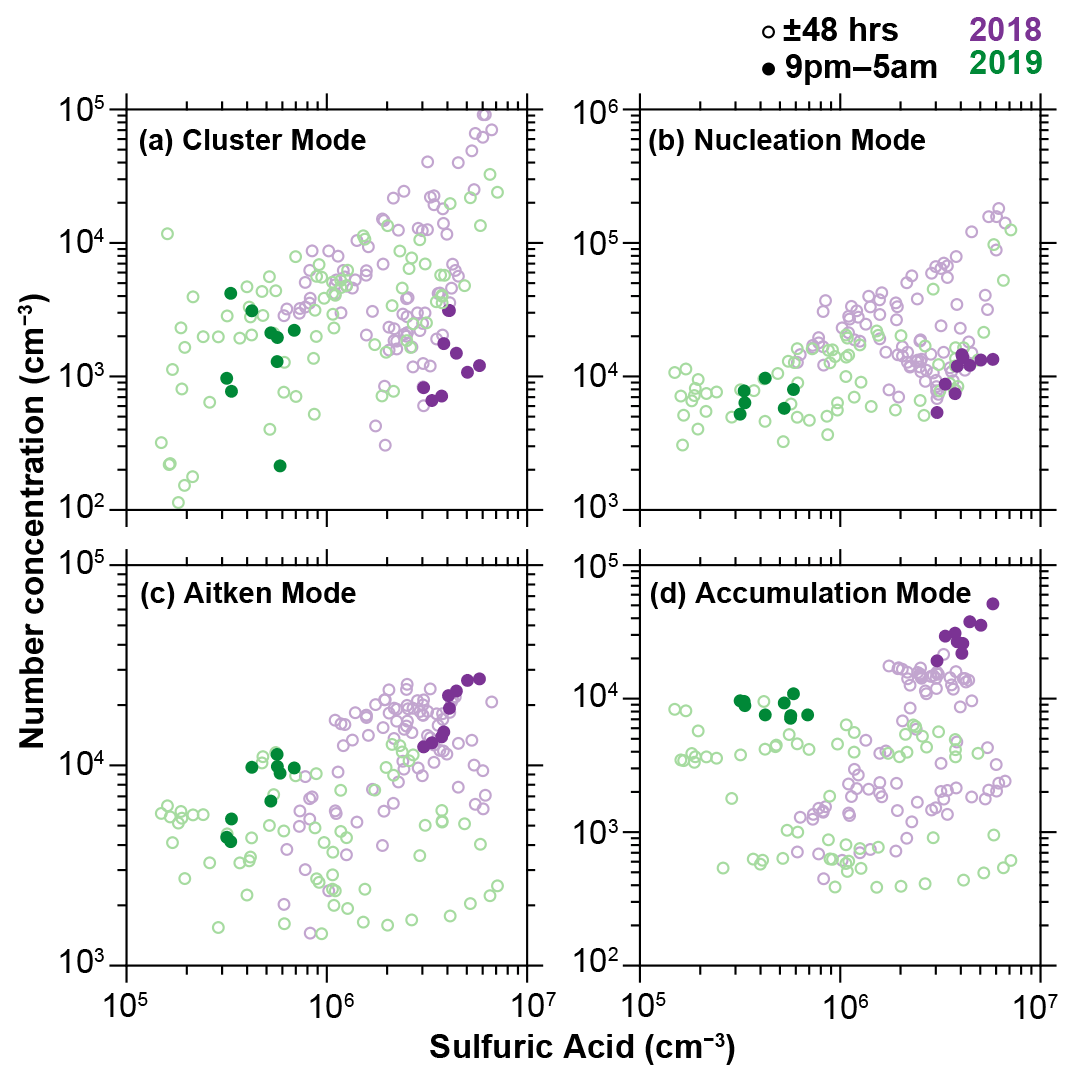
Figure 7Aerosol particle number concentrations in cluster, nucleation, Aitken, and accumulation modes as a function of gas-phase sulfuric acid concentration in 2018 (purple) and 2019 (green), separated from 21:00 through 05:00 the night of the CNY (filled circles), and those of CNY ± 48 h (open circles). The data are from BUCT-AHL.
3.4 Multi-year variation in Chinese New Year effects in Beijing
Fireworks were formally prohibited within the 5th Ring Road of Beijing beginning in 2018, whereas outside the 5th Ring Road, there were no prohibitions (Liu et al., 2019). Still, there was some evidence of firework burning observed at BUCT-AHL, which is within the prohibition area.
A longer-term multi-year study can be useful in demonstrating whether or not the policy is effective in reducing firework-related pollution and if there is an overall decreasing trend of pollution effects from fireworks over multiple years. To investigate this question, it is useful to compare the 2018 and 2019 CNY with previous years in Beijing. Datasets have been analyzed from 12 MEP stations in the Beijing area from 2013 through 2019.
Figure 8 shows that each year, there was a spike in pollution around midnight during the CNY. The highest levels were observed in 2016, with the peak in PM2.5 around midnight of the CNY reaching almost 700 µg cm−3, while values earlier in the day were less than 100 µg cm−3. The lowest levels of PM2.5 were in 2019, with the overnight peak less than 200 µg cm−3 compared to daytime values around 50 µg cm−3. Observations from 2013, 2014, 2015, and 2017 also showed similarly high or higher levels of PM2.5 as in 2018 (unfortunately the 2017 dataset is incomplete and does not extend beyond 00:00 of New Year's Day due to a network outage). The measurements for all 7 years are in agreement with other studies that have linked elevated air pollution levels to CNY celebrations (Yang et al., 2014; Shi et al., 2014; Feng et al., 2012; Zhang et al., 2010), and this study further shows that the peak in 2019 is lower than in 2018, which is lower than in 2016 and 2017.
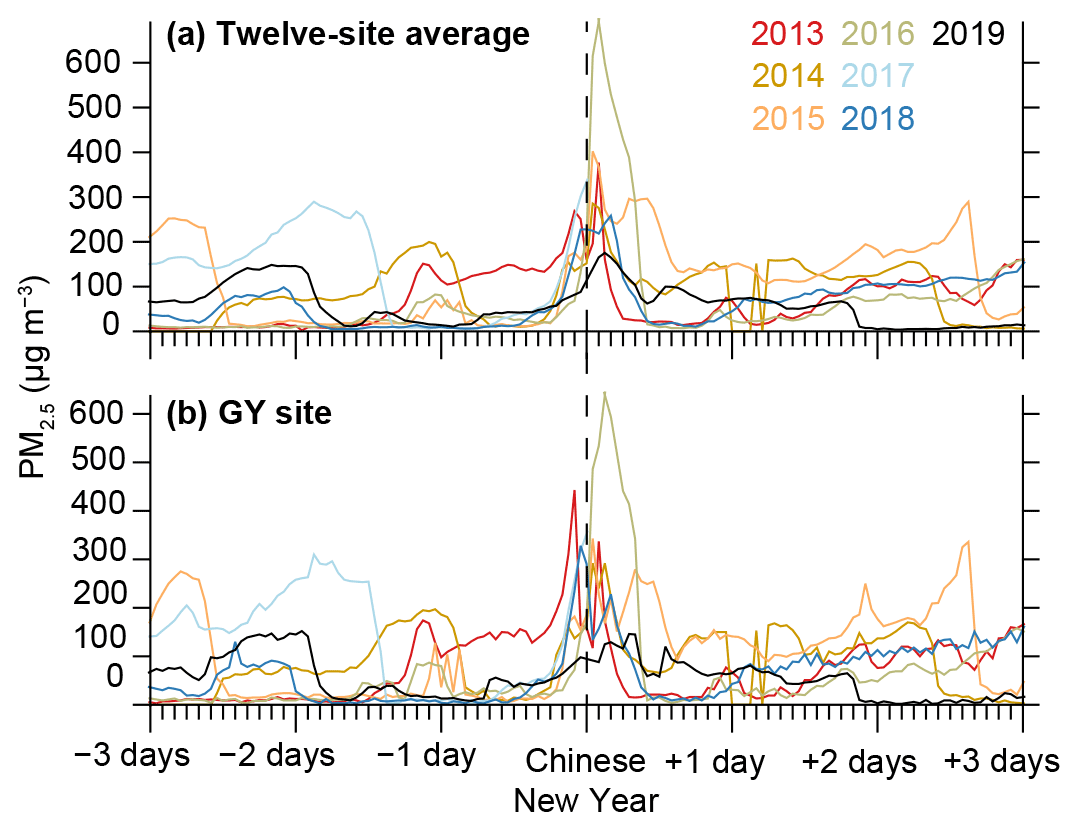
Figure 8PM2.5 averaged from 12 MEP sites in Beijing (a) and from only the Guangyuan (GY) site, which is the closest MEP measurement site to BUCT-AHL (b), from 3 d before through 3 d after the 2013–2019 CNY. The highest peak of pollution during the CNY overnight was in 2016, and the lowest was in 2019.
Data from the CNYs have also been compiled into box plots in Fig. 9, depicting the distributions of pollutant concentrations from 18:00 on CNY Eve to 06:00 on the CNY day each year at all 12 MEP stations. The highest PM concentrations during this time were in 2016, and the 75th and 99th percentile concentrations have decreased after that. On the other hand, the median concentration remained high during 2017 and 2018 but decreased in 2019 by roughly a factor of 2. Concentrations of NO2 and SO2 show a more steady decrease than PM2.5 since the median concentration of both pollutants decreased steadily from 2016 (regarding NO2 for 2017), but for CO there is no clear pattern. It should be noted that in 2017, the data are missing after midnight due to an unknown network outage. The more noticeable decrease in NO2 and SO2 is an expected outcome for a ban on firework burning since both are produced by fireworks and have shorter lifetimes than CO and PM2.5 (Seinfeld and Pandis, 2016; Lee et al., 2011). Thus, they are less affected by long-range transport and accumulation. The decrease in pollutant concentrations since 2016 agrees with the results obtained by Liu et al. (2019). Since ozone is a secondary product, and it reacts with several primary pollutants, its concentration pattern being roughly opposite to those of primary pollutants is as expected.
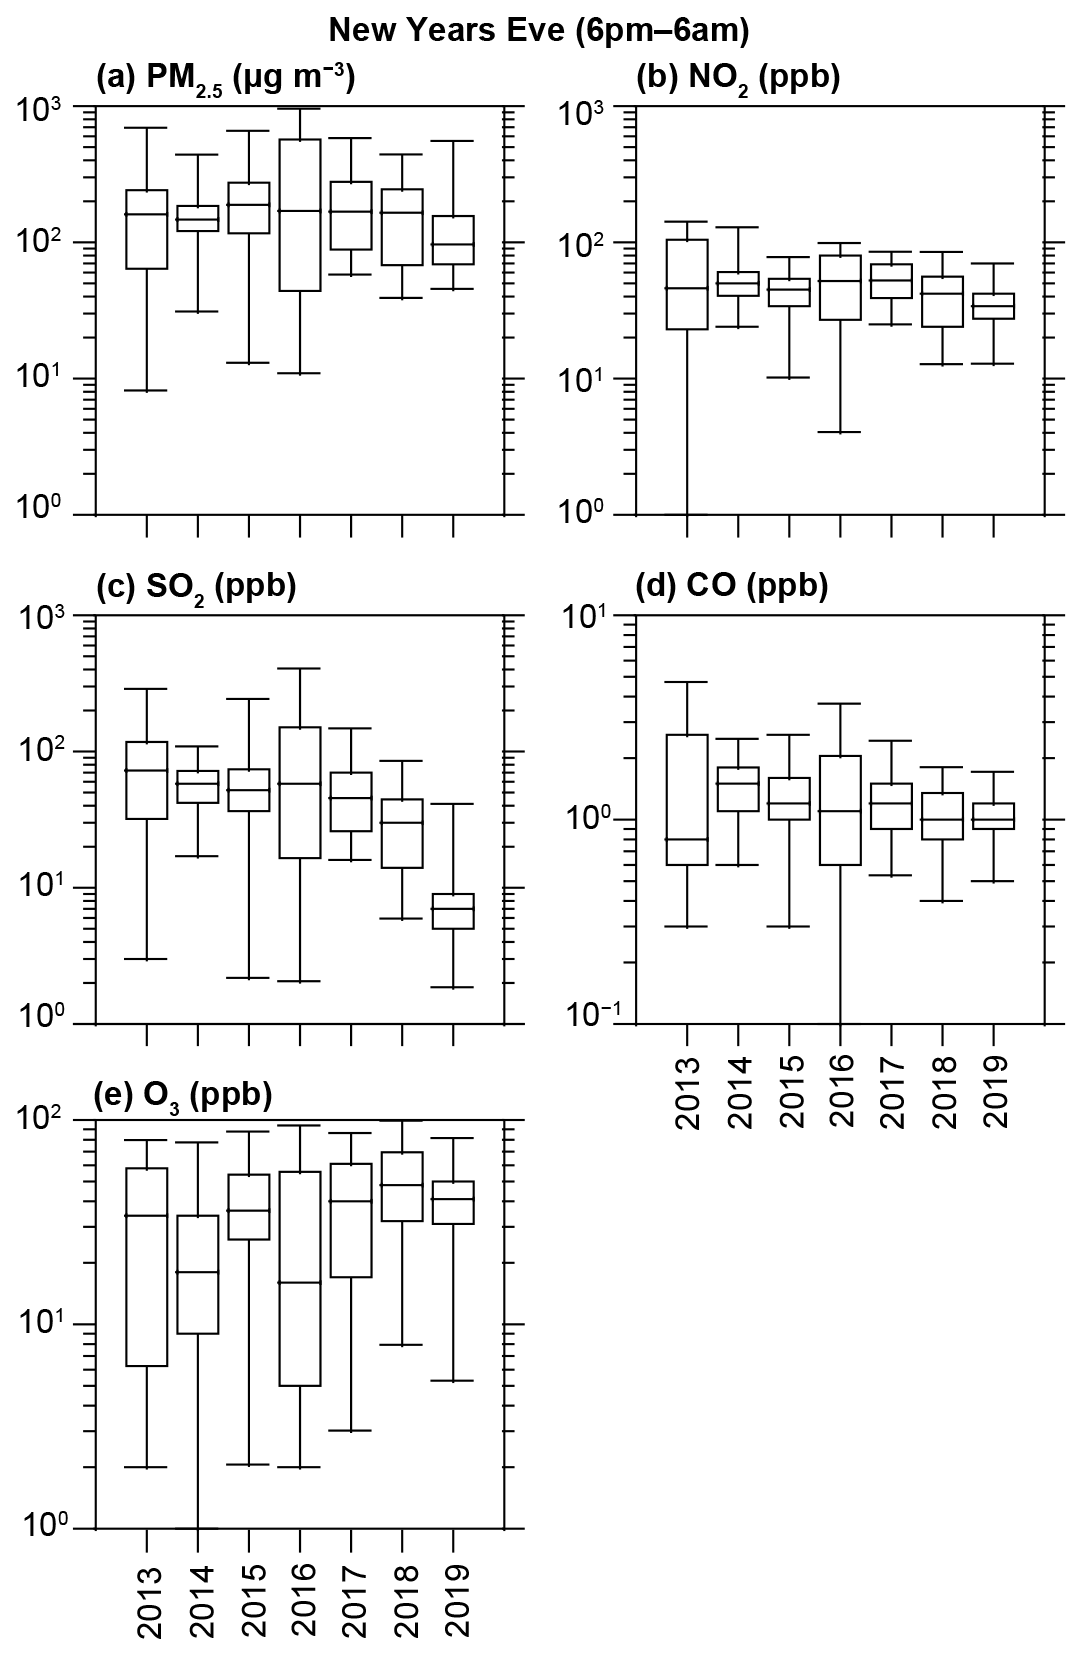
Figure 9Boxplots of PM2.5 and trace gases between 18:00 and 06:00 on the night of the Chinese New Year in the years 2013–2019. The boxplots show 1st, 25th, 50th, 75th, and 99th percentiles of the data across the 12 sites during this 12 h period (13 time points, inclusively).
Based on HYSPLIT back trajectories (Fig. 4), we see that in 2013–2015 the air masses spent more time in the BTH area prior to arrival. This differs from the air mass sources in 2016–2017, where the air masses come directly from the northwest. These areas to the northwest of Beijing, including Inner Mongolia and Mongolia, usually contain fewer pollutants due to low anthropogenic emissions, and thus we can expect air masses from this region to be cleaner (Xu et al., 2008). Based on the air mass history, if emissions were the same, then there should be higher concentrations in 2013–2015; however, we see the highest concentrations of pollutants in 2016, followed by a decline after that. In 2018 and 2019, the air masses spent around 2 d in the BTH area leading up to arrival at the station. Based on air mass source alone, we would have expected higher pollutant concentrations in 2018 and 2019, but this is not the case. Thus, we can conclude that emissions must have been highest in 2016, with lower emissions in 2018 and 2019. This agrees with Liu et al. (2019).
3.5 Spatial variability based on MEP measurement network data
Next, we performed a spatial comparison of the MEP measurements across the Beijing region. This includes comparing the observations inside the 5th Ring Road, where fireworks were prohibited, to outside the ring. Figure 10 maps the 12 MEP stations in the Beijing region for 2013–2019, showing the ratio between mean PM2.5 concentration from 21:00 through 05:00 during the night of CNY and the mean concentration within ±48 h of the CNY at each site. Figures S2–S13 show observations of PM2.5 from the 12 individual MEP sites and the corresponding differences year by year from 2013–2019. Based on Fig. 10, we can see significant variation from year to year as to which station measures the highest pollution. It is important to note that the population density is greater closer to the city center, and thus the population density could impact the results. However, it is plausible to assume that the relative population density difference between the city center and the surrounding areas does not change dramatically during the few years' time period.
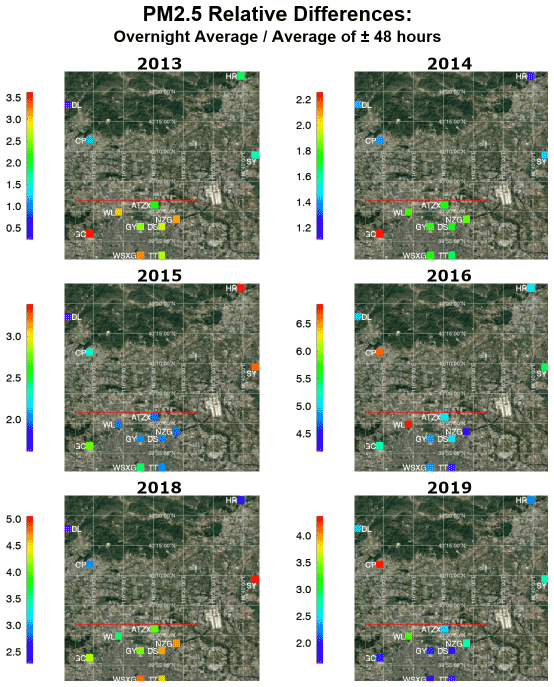
Figure 10The 12 MEP sites mapped in the Beijing metropolitan area, showing the ratio of overnight PM2.5 observations during the CNY (21:00–05:00) to all data during the period of 48 h before through 48 h after the CNY. The red line marks the approximate location of the 5th Ring Road. Note that the color bars on each map are relative to only that year, and the color bar range is not the same in different years. The year 2017 is omitted from this figure because data after 00:00 were not available. A list of the sites' full names in English and Chinese, along with their latitude and longitude coordinates, can be found in Table S1. Imagery: © Google Earth.
Figure 10 illustrates that in 2013 and 2014, the enhancement in PM2.5 concentrations during CNY is greater inside the 5th Ring than outside. In 2015, the enhancement is much greater at the two northeastern sites (HR: Huairou; SY: Shunyi). In 2016, the differences vary, with no clear difference inside or outside the 5th Ring. In 2018, the enhancement of PM2.5 is higher inside the 5th Ring than outside, except for the SY site to the far northeast, which had significantly high enhancement compared to the other sites. In 2019 the enhancement is overall less inside compared to outside. The enhancement factors outside the 5th Ring Road (excluding the single highest value) and at the northern inside stations nearest to the Ring Road are quite similar in 2019, roughly in the range of 2.5 to 3, but the peak times of pollution are a few hours earlier at the outside stations than the northern inside stations (Fig. S12). The measurement sites closer to central Beijing, on the other hand, show clearly lower enhancement factors of values of 2 or below. Based on these spatial and temporal differences and on the northerly winds observed at the time, it is possible that the higher enhancement factors inside but close to the 5th Ring Road are related to emissions from outside the Ring Road.
Figure 11 shows differences between the PM2.5 mean of the sites inside the 5th Ring Road and the mean of the sites outside the 5th Ring (that is the mean of the eight inside sites minus the mean of the outside four stations) 48 h before through 48 h after the CNY for 2013–2019. In 2013, 2014, and 2018, the enhancement of PM2.5 during the CNY overnight is greater inside than outside the 5th Ring Road. However, in 2015 and 2019, as well as immediately after the CNY midnight in 2016, PM2.5 was lower inside than outside. While we were lacking the detailed data on local meteorology during 2013–2016, we were still able to analyze the meteorological conditions in terms of air mass trajectories. Figure 4 shows that, similar to 2019, as discussed previously, in 2015 and CNY midnight of 2016, air masses arriving in Beijing were from the cleaner northwestern sector and arrived with much higher velocity in comparison to the years 2013, 2014, and 2018, during which the air masses made a turn to the south or east before arrival in Beijing. Even though the CNYs during which the increase in PM2.5 enhancement inside the 5th Ring Road is less pronounced than outside seem to be related to faster arrival of cleaner air masses, we have no clear view for the reason of this difference, and, due to the qualitative nature of this comparison, it is well possible that this connection is pure coincidence. The similarity of the years 2015 and 2019 in terms of the spatial variation in CNY midnight pollution peak suggests that meteorology may be at least part of the reason for the lesser enhancement of pollution levels inside the 5th Ring Road than outside. Nevertheless, the notably lower concentrations of PM2.5 and gaseous air pollutants in 2019 than in 2015 indicate that, even with similarities in spatial distribution of changes in concentrations, the most likely reason for lower concentrations during CNY night is the lower emissions.
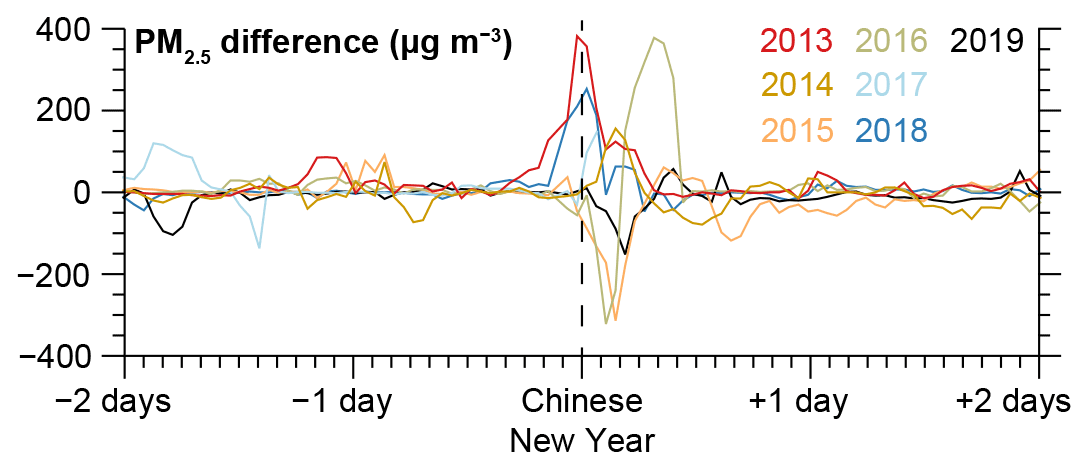
Figure 11Differences between mean PM2.5 concentrations inside and outside the 5th Ring Road of Beijing from 2013 through 2019. Positive values indicate higher concentration inside 5th Ring Road.
In this study, we looked at comprehensive measurements over CNY 2018 and 2019 at a measurement station in Beijing, along with long-term datasets across the Beijing metropolitan area.
Our study confirms that CNY consistently impacts air quality in Beijing. Based on our observations at the BUCT-AHL station in Beijing, in 2018, we detected higher-than-typical nighttime concentrations of particulate mass (PM2.5), particle number, trace gas, and sulfuric acid concentrations during the CNY. This was expected, and these results are consistent with previous studies that have linked the CNY (and other similar holiday celebrations involving firework burning around the world) to degraded air quality both locally and regionally.
Our results suggest that the regulations from CNY 2018 to limit firework use have improved the air quality within the restriction zone inside the 5th Ring Road in Beijing, and from 2016 to 2019 there has been a decrease in the effects of holiday-related pollution, which offers an optimistic outlook on the air quality impacts caused by CNY and the consequential public health concerns stemming from air pollution.
During the CNY night in 2018, we observed the appearance of particles with diameters of roughly 100 nm that seemed to be linked to enhanced sulfur dioxide, sulfuric acid, and black carbon concentrations, most likely as a result of firework burning. Based on the MEP data, the peaks in concentrations of different pollutants were lower than in the previous years. In 2019, a peak in pollution was observed overnight, but it was significantly lower than in 2018, while meteorological conditions were comparable in both years. The significant year-to-year variability depended presumably on the meteorological conditions. A common phenomenon for both 2018 and 2019 CNY nights was the accumulation of secondary aerosol throughout the night, seen as a diameter growth of the dominant particle mode in particle number size distributions. Measurements at BUCT-AHL showed that in 2018 a moderate haze episode began 1 d following the CNY, potentially related to the firework burning.
Comparing the level of increase in pollutant concentrations during CNY night inside Beijing's 5th Ring Road (firework prohibition area) to outside revealed that in 2019 the increase inside this area was smaller than outside. During most – but not all – of the previous CNYs, the increase in concentration was higher inside than outside. This was also the case in 2018. However, as also in previous years the ratio of inside and outside concentrations during CNY has varied, it is unclear if this is related to the efficacy of the emission prohibition or, for example, to larger-scale air mass movements or simply due to the fact that fireworks are sporadic and localized emission sources. Nonetheless, in terms of absolute concentrations, our results show a decrease in CNY pollution within the prohibition area since 2016 and especially in 2019. This is in agreement with the previous Liu et al. (2019) study, which compared the 2016 and 2018 CNY (before and after the prohibition took effect).
To conclude, this long-term analysis, which combines BUCT data with multiple years of Chinese government data at 12 locations in the Beijing area, demonstrates the importance of analyzing multiple data sources to determine overall trends rather than making conclusions based on a single dataset. This also demonstrates the usefulness of long-term measurements. Using these datasets together, we see excellent potential that can be utilized to investigate the changes in (a) atmospheric chemistry, such as ozone dynamics and sulfuric acid formation; (b) atmospheric gas-to-particle conversion; (c) boundary layer dynamics; and (d) air quality. Using CNY as a case study offers excellent insight into how rapid changes in emissions will affect air quality, health, and quality of life, especially in megacities such as Beijing. To confirm and quantify the influence of banning the firework burning in Beijing and the impact of varying meteorological conditions, similar data from coming CNYs are needed. Therefore, we suggest ongoing measurements at both BUCT-AHL and MEP sites into multiple future years.
Data used for this study can be found at https://doi.org/10.5281/zenodo.6966820 (Foreback et al., 2022).
The supplement related to this article is available online at: https://doi.org/10.5194/acp-22-11089-2022-supplement.
All BUCT-affiliated authors, plus KRD, BC, YW, TC, and PR, contributed to measurement collection at BUCT. LW provided the quality-controlled MEP data. BF, LD, KRD, TP, FB, PP, and MK conceptualized and conducted the data analysis. TVK, MoK, REP, and RB participated in the data analysis. TVK and MoK provided the meteorology data. KRD, TP, FB, PP, and MK supervised the study. BF visualized the data with assistance from SG. BF wrote the original draft and prepared the manuscript. PP, TP, and all other authors reviewed and edited the manuscript.
The contact author has declared that none of the authors has any competing interests.
Publisher’s note: Copernicus Publications remains neutral with regard to jurisdictional claims in published maps and institutional affiliations.
The authors wish to acknowledge the Finnish Centre for Scientific Computing (CSC) – IT Center for Science, Finland, for computational resources.
The work has been supported by the Academy of Finland via the Center of Excellence in Atmospheric Sciences (project no. 272041) and via ACCC Flagship (project no. 337549) and by the European Research Council via ATM-GTP (grant no. 742206). This research has also received funding from the Academy of Finland (project nos. 316114, 315203, and 307537); Business Finland via the MegaSense project (grant no. 6884/31/2018); the European Commission via ERA-NET Cofund project SMart URBan Solutions for air quality, disasters and city growth (grant no. 689443); Jane and Aatos Erkko Foundation project “Quantifying carbon sink, CarbonSink+ and their interaction with air quality”; the European Union’s Horizon 2020 research and innovation program (RI-URBANS, grant agreement no. 101036245); and the Doctoral Programme in Atmospheric Sciences at the University of Helsinki. Partial support was provided by the National Key R&D Program of China (grant no. 2016YFC0200500) and the National Natural Science Foundation of China (grant nos. 91544231 and 41725020).
Open-access funding was provided by the Helsinki University Library.
This paper was edited by Zhanqing Li and reviewed by four anonymous referees.
Bach, W., Daniels, A., Dickinson, L., Hertlein, F., Morrows, J., Margolis, S., and Dinh, V.: Fireworks pollution and health, Int. J. Environ. Stud., 7, 183–192, https://doi.org/10.1080/00207237508709692, 2007.
Barman, S., Singh, R., Negi, M., and Bhargava, S.: Ambient air quality of Lucknow City (India) during use of fireworks on Diwali Festival, Environ. Monit. Assess., 137, 495–504, https://doi.org/10.1007/s10661-007-9784-1, 2007.
Beijing, People's Republic Of China Weather History: Weather Underground, Wunderground.com, https://www.wunderground.com/history/weekly/cn/beijing/ZBNY/date/2019-2-4, last access: 22 January 2022.
Chen, B., Kan, H., Chen, R., Jiang, S., and Hong, C.: Air Pollution and Health Studies in China – Policy Implications, J. Air Waste Manage., 61, 1292–1299, https://doi.org/10.1080/10473289.2011.604288, 2011.
Chen, Z., Zhang, J., Zhang, T., Liu, W., and Liu, J.: Haze observations by simultaneous lidar and WPS in Beijing before and during APEC, 2014, Sci. China. Chem., 58, 1385–1392, https://doi.org/10.1007/s11426-015-5467-x, 2015.
Chou, C., Tsai, C., Shiu, C., Liu, S., and Zhu, T.: Measurement of NOyduring Campaign of Air Quality Research in Beijing 2006 (CAREBeijing-2006): Implications for the ozone production efficiency of NOx, J. Geophys. Res., 114, D00G01, https://doi.org/10.1029/2008jd010446, 2009.
Dada, L., Ylivinkka, I., Baalbaki, R., Li, C., Guo, Y., Yan, C., Yao, L., Sarnela, N., Jokinen, T., Daellenbach, K. R., Yin, R., Deng, C., Chu, B., Nieminen, T., Wang, Y., Lin, Z., Thakur, R. C., Kontkanen, J., Stolzenburg, D., Sipilä, M., Hussein, T., Paasonen, P., Bianchi, F., Salma, I., Weidinger, T., Pikridas, M., Sciare, J., Jiang, J., Liu, Y., Petäjä, T., Kerminen, V.-M., and Kulmala, M.: Sources and sinks driving sulfuric acid concentrations in contrasting environments: implications on proxy calculations, Atmos. Chem. Phys., 20, 11747–11766, https://doi.org/10.5194/acp-20-11747-2020, 2020.
Feng, J., Sun, P., Hu, X., Zhao, W., Wu, M., and Fu, J.: The chemical composition and sources of PM2.5 during the 2009 Chinese New Year's holiday in Shanghai, Atmos. Res., 118, 435–444, https://doi.org/10.1016/j.atmosres.2012.08.012, 2012.
Foreback, B., Dada, L., Daellenbach, K. R., Yan, C., Wang, L., Chu, B., Zhou, Y., Kokkonen, T. V., Kurppa, M., Pileci, R. E., Wang, Y., Chan, T., Kangasluoma, J., Zhuohui, L., Guo, Y., Li, C., Baalbaki, R., Kujansuu, J., Fan, X., Feng, Z., Rantala, P., Gani, S., Bianchi, F., Kerminen, V.-M., Petäjä, T., Kulmala, M., Liu Y., and Paasonen, P.: Data for “Measurement Report: A Multi-Year Study on the Impacts of Chinese New Year Celebrations on Air Quality in Beijing, China”, Zenodo [data set], https://doi.org/10.5281/zenodo.6966820, 2022.
Hari, P. and Kulmala, M.: Station for measuring Ecosystem-Atmosphere relations (SMEAR II), Boreal Environ. Res., 10, 315–322, 2005.
Jiang, Q., Sun, Y. L., Wang, Z., and Yin, Y.: Aerosol composition and sources during the Chinese Spring Festival: fireworks, secondary aerosol, and holiday effects, Atmos. Chem. Phys., 15, 6023–6034, https://doi.org/10.5194/acp-15-6023-2015, 2015.
Jokinen, T., Sipilä, M., Junninen, H., Ehn, M., Lönn, G., Hakala, J., Petäjä, T., Mauldin III, R. L., Kulmala, M., and Worsnop, D. R.: Atmospheric sulphuric acid and neutral cluster measurements using CI-APi-TOF, Atmos. Chem. Phys., 12, 4117–4125, https://doi.org/10.5194/acp-12-4117-2012, 2012.
Kong, S. F., Li, L., Li, X. X., Yin, Y., Chen, K., Liu, D. T., Yuan, L., Zhang, Y. J., Shan, Y. P., and Ji, Y. Q.: The impacts of firework burning at the Chinese Spring Festival on air quality: insights of tracers, source evolution and aging processes, Atmos. Chem. Phys., 15, 2167–2184, https://doi.org/10.5194/acp-15-2167-2015, 2015.
Kulmala, M.: Atmospheric chemistry: China's choking cocktail, Nature, 526, 497–499, https://doi.org/10.1038/526497a, 2015.
Kulmala, M.: Build a global Earth observatory, Nature, 553, 21–23, 2018.
Kulmala, M., Kontkanen, J., Junninen, H., Lehtipalo, K., Manninen, H., Nieminen, T., Petäjä, T., Sipilä, M., Schobesberger, S., Rantala, P., Franchin, A., Jokinen, T., Järvinen, E., Äijälä, M., Kangasluoma, J., Hakala, J., Aalto, P., Paasonen, P., Mikkilä, J., Vanhanen, J., Aalto, J., Hakola, H., Makkonen, U., Ruuskanen, T., Mauldin, R., Duplissy, J., Vehkamäki, H., Bäck, J., Kortelainen, A., Riipinen, I., Kurtén, T., Johnston, M., Smith, J., Ehn, M., Mentel, T., Lehtinen, K., Laaksonen, A., Kerminen, V., and Worsnop, D.: Direct Observations of Atmospheric Aerosol Nucleation, Science, 339, 943–946, https://doi.org/10.1126/science.1227385, 2013.
Kürten, A., Rondo, L., Ehrhart, S., and Curtius, J.: Calibration of a Chemical Ionization Mass Spectrometer for the Measurement of Gaseous Sulfuric Acid, J. Phys, Chem. A., 116, 6375–6386, https://doi.org/10.1021/jp212123n, 2012.
Lee, C., Martin, R., van Donkelaar, A., Lee, H., Dickerson, R., Hains, J., Krotkov, N., Richter, A., Vinnikov, K., and Schwab, J.: SO2 emissions and lifetimes: Estimates from inverse modeling using in situ and global, space-based (SCIAMACHY and OMI) observations, J. Geophys. Res., 116, D06304, https://doi.org/10.1029/2010jd014758, 2011.
Li, W., Shi, Z., Yan, C., Yang, L., Dong, C., and Wang, W.: Individual metal-bearing particles in a regional haze caused by firecracker and firework emissions, Sci. Total Environ., 443, 464–469, https://doi.org/10.1016/j.scitotenv.2012.10.109, 2013.
Liu, D., Rutherford, D., Kinsey, M., and Prather, K.: Real-Time Monitoring of Pyrotechnically Derived Aerosol Particles in the Troposphere, Anal. Chem., 69, 1808–1814, https://doi.org/10.1021/ac9612988, 1997.
Liu, J., Jiang, J., Zhang, Q., Deng, J., and Hao, J.: A spectrometer for measuring particle size distributions in the range of 3 nm to 10 µm, Front. Env. Sci. Eng., 10, 63–72, https://doi.org/10.1007/s11783-014-0754-x, 2014.
Liu, J., Chen, Y., Chao, S., Cao, H., and Zhang, A.: Levels and health risks of PM2.5-bound toxic metals from firework/firecracker burning during festival periods in response to management strategies, Ecotox. Environ. Safe., 171, 406–413, https://doi.org/10.1016/j.ecoenv.2018.12.104, 2019.
Liu, Y., Yan, C., Feng, Z., Zheng, F., Fan, X., Zhang, Y., Li, C., Zhou, Y., Lin, Z., Guo, Y., Zhang, Y., Ma, L., Zhou, W., Liu, Z., Dada, L., Dällenbach, K., Kontkanen, J., Cai, R., Chan, T., Chu, B., Du, W., Yao, L., Wang, Y., Cai, J., Kangasluoma, J., Kokkonen, T., Kujansuu, J., Rusanen, A., Deng, C., Fu, Y., Yin, R., Li, X., Lu, Y., Liu, Y., Lian, C., Yang, D., Wang, W., Ge, M., Wang, Y., Worsnop, D., Junninen, H., He, H., Kerminen, V., Zheng, J., Wang, L., Jiang, J., Petäjä, T., Bianchi, F., and Kulmala, M.: Continuous and comprehensive atmospheric observations in Beijing: a station to understand the complex urban atmospheric environment, Big Earth Data, 4, 295–321, https://doi.org/10.1080/20964471.2020.1798707, 2020.
Mönkkönen, P., Koponen, I., Lehtinen, K., Uma, R., Srinivasan, D., Hämeri, K., and Kulmala, M.: Death of nucleation and Aitken mode particles: observations at extreme atmospheric conditions and their theoretical explanation, J. Aerosol Sci., 35, 781–787, https://doi.org/10.1016/j.jaerosci.2003.12.004, 2004.
Petäjä, T., Mauldin, III, R. L., Kosciuch, E., McGrath, J., Nieminen, T., Paasonen, P., Boy, M., Adamov, A., Kotiaho, T., and Kulmala, M.: Sulfuric acid and OH concentrations in a boreal forest site, Atmos. Chem. Phys., 9, 7435–7448, https://doi.org/10.5194/acp-9-7435-2009, 2009.
Peltonen, M.: University of Helsinki builds an air quality measuring station in Beijing, University of Helsinki, https://www.helsinki.fi/en/news/climate-change-and-biodiversity/university-helsinki-builds-air-quality-measuring-station-beijing (last access: 22 January 2022), 2017.
Ravindra, K., Mor, S., and Kaushik, C.: Short-term variation in air quality associated with firework events: A case study, J. Environ. Monitor., 5, 260–264, https://doi.org/10.1039/b211943a, 2003.
Seinfeld, J. and Pandis, S.: Atmospheric Chemistry and Physics: From Air Pollution to Climate Change, 3rd edn., Wiley, ISBN 978-1-118-94740-1, 2016.
Shen, X. J., Sun, J. Y., Zhang, Y. M., Wehner, B., Nowak, A., Tuch, T., Zhang, X. C., Wang, T. T., Zhou, H. G., Zhang, X. L., Dong, F., Birmili, W., and Wiedensohler, A.: First long-term study of particle number size distributions and new particle formation events of regional aerosol in the North China Plain, Atmos. Chem. Phys., 11, 1565–1580, https://doi.org/10.5194/acp-11-1565-2011, 2011.
Shi, G., Liu, G., Tian, Y., Zhou, X., Peng, X., and Feng, Y.: Chemical characteristic and toxicity assessment of particle associated PAHs for the short-term anthropogenic activity event: During the Chinese New Year's Festival in 2013, Sci. Total Environ., 482–483, 8–14, https://doi.org/10.1016/j.scitotenv.2014.02.107, 2014.
Singh, D., Gadi, R., Mandal, T., Dixit, C., Singh, K., Saud, T., Singh, N., and Gupta, P.: Study of temporal variation in ambient air quality during Diwali festival in India, Environ. Monit. Asses., 169, 1–13, https://doi.org/10.1007/s10661-009-1145-9, 2009.
Sipilä, M., Berndt, T., Petäjä, T., Brus, D., Vanhanen, J., Stratmann, F., Patokoski, J., Mauldin, R., Hyvärinen, A., Lihavainen, H., and Kulmala, M.: The Role of Sulfuric Acid in Atmospheric Nucleation, Science, 327, 1243–1246, https://doi.org/10.1126/science.1180315, 2010.
Song, C., Wu, L., Xie, Y., He, J., Chen, X., Wang, T., Lin, Y., Jin, T., Wang, A., Liu, Y., Dai, Q., Liu, B., Wang, Y., and Mao, H.: Air pollution in China: Status and spatiotemporal variations, Environ. Pollut., 227, 334–347, https://doi.org/10.1016/j.envpol.2017.04.075, 2017.
Stein, A., Draxler, R., Rolph, G., Stunder, B., Cohen, M., and Ngan, F.: NOAA's HYSPLIT Atmospheric Transport and Dispersion Modeling System, B. Am. Meteorol. Soc., 96, 2059–2077, https://doi.org/10.1175/bams-d-14-00110.1, 2015.
Sun, Y., Wang, Z., Fu, P., Jiang, Q., Yang, T., Li, J., and Ge, X.: The impact of relative humidity on aerosol composition and evolution processes during wintertime in Beijing, China, Atmos. Environ., 77, 927–934, https://doi.org/10.1016/j.atmosenv.2013.06.019, 2013.
Tao, M., Chen, L., Li, R., Wang, L., Wang, J., Wang, Z., Tang, G., and Tao, J.: Spatial oscillation of the particle pollution in eastern China during winter: Implications for regional air quality and climate, Atmos. Environ, 144, 100–110, https://doi.org/10.1016/j.atmosenv.2016.08.049, 2016.
Vanhanen, J., Mikkilä, J., Lehtipalo, K., Sipilä, M., Manninen, H., Siivola, E., Petäjä, T., and Kulmala, M.: Particle Size Magnifier for Nano-CN Detection, Aerosol Sci. Tech., 45, 533–542, https://doi.org/10.1080/02786826.2010.547889, 2011.
Virkkula, A., Chi, X., Ding, A., Shen, Y., Nie, W., Qi, X., Zheng, L., Huang, X., Xie, Y., Wang, J., Petäjä, T., and Kulmala, M.: On the interpretation of the loading correction of the aethalometer, Atmos. Meas. Tech., 8, 4415–4427, https://doi.org/10.5194/amt-8-4415-2015, 2015.
Wang, F., Chen, D., Cheng, S., Li, J., Li, M., and Ren, Z.: Identification of regional atmospheric PM10 transport pathways using HYSPLIT, MM5-CMAQ and synoptic pressure pattern analysis, Environ. Modell. Softw., 25, 927–934, https://doi.org/10.1016/j.envsoft.2010.02.004, 2010.
Wang, Y., Zhuang, G., Xu, C., and An, Z.: The air pollution caused by the burning of fireworks during the lantern festival in Beijing, Atmos. Environ., 41, 417–431, https://doi.org/10.1016/j.atmosenv.2006.07.043, 2007.
Wang, Y., Li, Z., Zhang, Y., Du, W., Zhang, F., Tan, H., Xu, H., Fan, T., Jin, X., Fan, X., Dong, Z., Wang, Q., and Sun, Y.: Characterization of aerosol hygroscopicity, mixing state, and CCN activity at a suburban site in the central North China Plain, Atmos. Chem. Phys., 18, 11739–11752, https://doi.org/10.5194/acp-18-11739-2018, 2018.
Wang, Y., Dörner, S., Donner, S., Böhnke, S., De Smedt, I., Dickerson, R. R., Dong, Z., He, H., Li, Z., Li, Z., Li, D., Liu, D., Ren, X., Theys, N., Wang, Y., Wang, Y., Wang, Z., Xu, H., Xu, J., and Wagner, T.: Vertical profiles of NO2, SO2, HONO, HCHO, CHOCHO and aerosols derived from MAX-DOAS measurements at a rural site in the central western North China Plain and their relation to emission sources and effects of regional transport, Atmos. Chem. Phys., 19, 5417–5449, https://doi.org/10.5194/acp-19-5417-2019, 2019.
Wu, H., Tang, X., Wang, Z., Wu, L., Lu, M., Wei, L., and Zhu, J.: Probabilistic Automatic Outlier Detection for Surface Air Quality Measurements from the China National Environmental Monitoring Network, Adv. Atmos. Sci., 35, 1522–1532, https://doi.org/10.1007/s00376-018-8067-9, 2018.
Xu, X., Barsha, N., and Li, J.: Analyzing Regional Inluence of Particulate Matter on the City of Beijing, China, Aerosol Air Qual. Res., 8, 78–93, https://doi.org/10.4209/aaqr.2007.09.0038, 2008.
Yang, L., Gao, X., Wang, X., Nie, W., Wang, J., Gao, R., Xu, P., Shou, Y., Zhang, Q., and Wang, W.: Impacts of firecracker burning on aerosol chemical characteristics and human health risk levels during the Chinese New Year Celebration in Jinan, China, Sci. Total Environ., 476–477, 57–64, https://doi.org/10.1016/j.scitotenv.2013.12.110, 2014.
Yao, L., Garmash, O., Bianchi, F., Zheng, J., Yan, C., Kontkanen, J., Junninen, H., Mazon, S., Ehn, M., Paasonen, P., Sipilä, M., Wang, M., Wang, X., Xiao, S., Chen, H., Lu, Y., Zhang, B., Wang, D., Fu, Q., Geng, F., Li, L., Wang, H., Qiao, L., Yang, X., Chen, J., Kerminen, V., Petäjä, T., Worsnop, D., Kulmala, M., and Wang, L.: Atmospheric new particle formation from sulfuric acid and amines in a Chinese megacity, Science, 361, 278–281, https://doi.org/10.1126/science.aao4839, 2018.
Yerramsetti, V., Sharma, A., Gauravarapu Navlur, N., Rapolu, V., Dhulipala, N., and Sinha, P.: The impact assessment of Diwali fireworks emissions on the air quality of a tropical urban site, Hyderabad, India, during three consecutive years, Environ. Monit. Asses, 185, 7309–7325, https://doi.org/10.1007/s10661-013-3102-x, 2013.
Zhang, M., Wang, X., Chen, J., Cheng, T., Wang, T., Yang, X., Gong, Y., Geng, F., and Chen, C.: Physical characterization of aerosol particles during the Chinese New Year's firework events, Atmos. Environ. 44, 5191–5198, https://doi.org/10.1016/j.atmosenv.2010.08.048, 2010.
Zhang, X., Shen, H., Li, T., and Zhang, L.: The Effects of Fireworks Discharge on Atmospheric PM2.5 Concentration in the Chinese Lunar New Year, Int. J. Environ. Res. Public Health, 17, 9333, https://doi.org/10.3390/ijerph17249333, 2020.
Zhao, X., Zhang, X., Pu, W., Meng, W., and Xu, X.: Scattering properties of the atmospheric aerosol in Beijing, China, Atmos. Res., 101, 799–808, https://doi.org/10.1016/j.atmosres.2011.05.010, 2011.
Zhao, X. J., Zhao, P. S., Xu, J., Meng,, W., Pu, W. W., Dong, F., He, D., and Shi, Q. F.: Analysis of a winter regional haze event and its formation mechanism in the North China Plain, Atmos. Chem. Phys., 13, 5685–5696, https://doi.org/10.5194/acp-13-5685-2013, 2013.
Zhou, Y., Dada, L., Liu, Y., Fu, Y., Kangasluoma, J., Chan, T., Yan, C., Chu, B., Daellenbach, K. R., Bianchi, F., Kokkonen, T. V., Liu, Y., Kujansuu, J., Kerminen, V.-M., Petäjä, T., Wang, L., Jiang, J., and Kulmala, M.: Variation of size-segregated particle number concentrations in wintertime Beijing, Atmos. Chem. Phys., 20, 1201–1216, https://doi.org/10.5194/acp-20-1201-2020, 2020.
Zhu, Y. Y., Gao, Y. X., Chai, W. X., Wang, S., Li, L., Wang, W., Wang, G., Liu, B., Wang, X. Y., and Li, J. J.: Analysis of regional heavy PM2.5 pollution events in Beijing-Tianjin-Hebei and the surrounding area in China during 2015–2018, Global NEST J., 23, 475–482, https://doi.org/10.30955/gnj.003589, 2021.