the Creative Commons Attribution 4.0 License.
the Creative Commons Attribution 4.0 License.
 | 29 Aug 2022
A comprehensive study on hygroscopic behaviour and nitrate depletion of NaNO3 and dicarboxylic acid mixtures: implications for nitrate depletion in tropospheric aerosols
Qiong Li
Yunhong Zhang
The nitrate depletion and HNO3 release in internally mixed nitrate and dicarboxylic acid (DCA) particles have been widely detected in field and laboratory studies. Nevertheless, considerable discrepancies are still present among these measurements, and the influencing factors for this acid-displacement reaction have not yet been elucidated. In this work, the hygroscopic growth and chemical composition evolution of mixtures of NaNO3 and DCAs, i.e. oxalic acid (OA), malonic acid (MA), and glutaric acid (GA), were measured using attenuated total reflectance Fourier transform infrared spectroscopy (ATR-FTIR) and vacuum FTIR techniques. The nitrate depletion from NaNO3–OA mixtures was observed in both the measurements, owing to the relatively higher acidity of OA compared to MA and GA. At the same time, the NaNO3 phase state was found to act as a key regulator of nitrate depletion. Amorphous NaNO3 solids at relative humidity (RH) <5 % were inert to liquid OA. With increasing RH, the mixtures experienced three interesting stages of phase changes showing different HNO3 release rates; e.g. at around 15 % RH, the slow HNO3 release was detected by the vacuum IR spectra, potentially indicating the transformation of amorphous solids to semisolid NaNO3. In the second stage (sudden RH increase from ∼15 % to 61 %), the HNO3 release rate was increased by about an order of magnitude. When NaNO3 deliquescence occurred in the third stage, this displacement reaction proceeded due to more available NO ion formation. Compared to OA, MA and GA reacted with nitrate only in vacuum FTIR measurement, while in ATR-FTIR measurement, the mixtures tended to be effloresced completely without nitrate depletion. Further, the influences of ambient pressure, chemical composition, and water activity on HNO3 release rates were estimated via Maxwell steady-state diffusive mass transfer equation. The results showed that weaker acidity of MA and GA as well as relatively lower HNO3 diffusion rate in the ambient gas phase mainly contributed to the unobserved nitrate depletion in ATR-FTIR measurement. Our findings reveal that chemical component, phase state, and water activity of particles, as well as HNO3 gas-phase diffusion, play crucial roles in HNO3 release from nitrate and DCA mixtures. This work may provide a new perspective on nitrate depletion in the ageing processes during transport of tropospheric aerosols.
- Article
(5506 KB) - Full-text XML
-
Supplement
(3649 KB) - BibTeX
- EndNote


Aerosol particles in the atmosphere can play crucial roles in determining Earth's climate, air quality, and human health (Pöschl, 2006; Stevens and Feingold, 2009; Carslaw et al., 2013; Ramanathan et al., 2001; Brown et al., 2006), depending on their various physicochemical properties, e.g. chemical composition, phase state, volatility, reactivity, hygroscopicity, and the ability to absorb and scatter solar light as well as act as cloud condensation nuclei (CCN) (Pöschl, 2006; Mcfiggans et al., 2006; Haywood and Boucher, 2000; Farmer et al., 2015; Shiraiwa et al., 2017; Freney et al., 2018; Kuwata and Martin, 2012).
Sea salt and mineral dust aerosols can provide highly reactive surfaces for nitrate production through heterogeneous reactions of gaseous nitrogen oxides such as HNO3, N2O5, NO2, and NO3 (Gibson et al., 2006; Song and Carmichael, 2001; Finlayson-Pitts and Hemminger, 2000). Furthermore, heterogeneous and aqueous oxidation of dicarboxylic acid precursors and gas–particle partitioning of dicarboxylic acids (DCAs) in the atmosphere will cause the internal mixing of DCAs with sea salt and mineral dust aerosols (Tervahattu et al., 2002; Sullivan and Prather, 2007; Laskin et al., 2012; Wang et al., 2010), greatly influencing the hygroscopic behaviour and surface tension of mixed particles (Facchini et al., 1999; Jing et al., 2018; Peng et al., 2001; Ovadnevaite et al., 2017; Hodas et al., 2015).
It is well known that the displacement of strong acids, i.e. HCl or HNO3, by weak organic acids, e.g. DCAs, is not thermodynamically favoured in bulk solutions (Laskin et al., 2012), whereas the nitrate and chloride depletion in mixed nitrate/chloride and organic acid particles has been widely detected in field and laboratory measurements, which could be expressed as (Laskin et al., 2012; Wang and Laskin, 2014; Ma et al., 2019b; Ghorai et al., 2014; Shao et al., 2018)
The driving force for this displacement reaction is mainly governed by the acidity difference and volatility difference between the organic acids and HCl/HNO3 (Laskin et al., 2012; Wang and Laskin, 2014; Chen et al., 2021). The acidity difference tends to shift the reaction equilibrium to the left, demonstrating that the more dominating driving force for the substitution of strong acids by weak organic acids is the volatility difference (Laskin et al., 2012; Chen et al., 2021). For instance, dissociated HCl concentration is ∼1010 times higher than dissociated citric acid within mixed NaCl–citric acid ( molar ratio) droplets, while the equilibrium gas-phase concentration of HCl far exceeds that of citric acid with a factor of ∼1019, suggesting the HCl partition into the gas phase would manage the direction of acid-displacement reaction (Laskin et al., 2012). In general, the less acidity difference, i.e. higher acid dissociation constants (Ka1) of organic acids, and larger volatility difference, i.e. higher Henry's law constants (KH) of organic acids, are favourable for gaseous HCl/HNO3 liberation.
As indicated by previous studies, reactions between nitrate or chloride and oxalic acid (OA), which had a log ionization constant () of 1.23 (Haynes and Lide, 2011), always occurred in mixed aerosols, causing the formation of less hygroscopic metal oxalates (Ma et al., 2013, 2019a, b; Ma and He, 2012). Nevertheless, there were considerable discrepancies among earlier observations for internally mixed NaCl and malonic acid (MA) (pKa1=2.83). Laskin et al. (2012), Ghorai et al. (2014), Laskina et al. (2015), and Li et al. (2017) supported the occurrence of HCl substitution by MA, while Choi and Chan (2002), Pope et al. (2010), and Ma et al. (2013) did not observe this displacement reaction. Likewise, Ma et al. (2013) suggested that succinic acid (SA) (pKa1=4.20) does not react with internally and externally mixed NaCl, while Ghorai et al. (2014) found that glutaric acid (GA) (pK1=4.32) was reactive to NaCl. In another publication, nitrates were proven to be reactive to MA and GA, leading to nitrate depletion (Wang and Laskin, 2014). Indeed, the differences in particle sizes, substrate materials, acidity, and volatility of DCAs may be responsible for these controversial results, but it is true that the interactions between organic acids and nitrate/chloride are still not clear.
To the best of our knowledge, the influence of particle-phase state on nitrate depletion has not been considered yet. As Wang et al. (2017) indicated, the OA droplets deposited on polytetrafluoroethylene (PTFE) substrate would crystallize to form OA dihydrate at ∼71 % relative humidity (RH) during dehydration, which further lost crystalline water to form anhydrous OA at ∼5 % RH; meanwhile, no deliquescence was observed upon hydration. Pure NaNO3 droplets might not be effloresced but convert into highly concentrated droplets at low RH upon drying (Liu et al., 2008) or effloresced at certain RH values; e.g. levitated NaNO3 droplets effloresced at RH near 40 % (Lamb et al., 1996), or deposited NaNO3 particles on hydrophobic and ZnSe substrates effloresced at 34 % RH and 62.5 % RH, respectively (Zhang et al., 2014). Furthermore, atmospheric aerosols can exist in highly viscous (i.e. semisolid or glassy), solid, liquid, or solid–liquid mixing states (Krieger et al., 2012; Mikhailov et al., 2009; Virtanen et al., 2010; Koop et al., 2011), depending on varying ambient RH, temperature, heterogeneous inclusions, and so on (Ma et al., 2021b). Additionally, the particle-phase state has been proven to play a critical role in determining the reactivity of secondary organic material (SOM) upon ammonia exposure (Kuwata and Martin, 2012). These scenarios pose a key issue concerning how the particle-phase state would affect nitrate depletion in sea salt and mineral dust particles.
In this work, two measurement techniques, i.e. attenuated total reflectance Fourier transform infrared spectroscopy (ATR-FTIR) and vacuum FTIR, were carried out to measure the hygroscopic behaviour and nitrate depletion of mixed NaNO3 and DCA particles. The effects of HNO3 gas-phase diffusion, as well as chemical component, phase state, and water activity of mixed particles on nitrate depletion, were further explored. This work enhances our understanding of interaction mechanisms of DCAs and nitrate.
2.1 Sample preparation
The 0.1 mol L−1 solutions of NaNO3–OA, NaNO3–MA, and NaNO3–GA with a molar ratio of 1:1 (or 3:1) were prepared by dissolving nitrate and DCAs into ultrapure water (18.2 MΩ cm resistivity). The bulk solutions were nebulized ultrasonically to produce aerosol droplets deposited on two CaF2 windows in vacuum FTIR measurement and the Ge substrate in ATR-FTIR measurement.
2.2 Vacuum FTIR measurement
The vacuum FTIR technique was composed of a vacuum FTIR spectrometer and a RH controlling system. The experimental apparatus and method have been described in detail by our previous studies (Leng et al., 2015; Zhang et al., 2017; Ma et al., 2019c). Briefly, the vacuum FTIR spectrometer (Bruker VERTEX 80v) consisted of a vacuum optics bench, a sample compartment, and a vacuum pump. The RH controlling system was composed of a high-purity water reservoir, a sample chamber, and another vacuum pump. Water vapour from the water reservoir was fed into the sample chamber and was pumped out by the vacuum pump. Two solenoid valves were installed in the pipeline of water vapour to instantaneously switch water vapour inlet and outlet. Meanwhile, two needle valves were configured to respectively adjust the flow rates of water vapour inlet and outlet.
The radius of deposited droplets on CaF2 windows was in the range of ∼ 1–3 µm (Zhang et al., 2017). After the nebulization, the CaF2 windows were installed onto the sample chamber to seal it. The air in the optics bench, sample compartment, and sample chamber was pumped out to remove water vapour and CO2. The baseline pressure in the optics bench and sample compartment was pumped to ∼0.21 kPa, and the sample chamber arrived at ∼0.01 kPa to remove water vapour and CO2. A differential pressure transmitter (Rosemount 3051, accuracy >0.5 %) was used to measure water vapour pressure in the sample chamber, which could be used to calibrate the ambient RH (Zhang et al., 2017). The water content of deposited particles could be estimated by the integrated absorbance of the stretching vibration band of liquid water molecules at 3400 cm−1 (Ma et al., 2019c). The resolution of the collected IR spectra was 4 cm−1. All measurements were made at 23–26∘ C.
2.3 ATR-FTIR measurement
A detailed description of ATR-FTIR measurement has been reported elsewhere (Zhang et al., 2014; Ren et al., 2016). Briefly, the IR spectra of deposited particles on a horizontal ATR (Spectra-Tech Inc. USA) accessory with the Ge substrate were measured by a Nicolet Magna-IR model 560 FTIR spectrometer equipped with a liquid-nitrogen-cooled mercury–cadmium–telluride (MCT) detector. The ambient RH in the sample cell was controlled by adjusting the flow rate ratio of gas streams of dry and humidified nitrogen with a total flow rate of 800 mL min−1. The ambient RH and temperature were recorded by a hygrometer (Centertek Center 310, accuracy of ±2.5 %) in the outlet of a sample cell. The diameter of deposited droplets was 1–5 µm, with a median diameter of ∼3 µm (Zhang et al., 2014). The IR spectra were collected between 4000 and 600 cm−1 with a resolution of 4 cm−1. Similar to vacuum FTIR measurement, the water content in aerosol particles was determined by the integrated absorbance of the stretching vibration band of liquid water.
3.1 Hygroscopic growth and chemical composition evolution of NaNO3–OA mixtures
The hygroscopic behaviour and IR features of individual components, i.e. NaNO3, OA, MA, and GA, are shown in the Supplement. Figure 1 displays the hygroscopic growth and chemical composition evolution of 1:1 NaNO3–OA mixtures during a RH cycle. In vacuum FTIR measurement, the deposited droplets on CaF2 windows are first dried in a vacuum and then undergo a humidification–dehumidification cycle. As shown in Fig. 1c, there are two feature bands assigned to the stretching mode of COOH functional groups (ν(COOH)) at ∼3.8 % RH, i.e. the 1740 cm−1 band assigned to liquid OA and 1710 cm−1 band assigned to crystalline anhydrous OA (Wang et al., 2019), indicating the coexistence of liquid OA and anhydrous OA. The 1355 cm−1 band is attributed to NO asymmetric stretching vibration (ν3(NO)) of amorphous NaNO3 solids, as discussed in the Supplement. The weak absorption at 1620 cm−1 indicates small amounts of crystalline oxalate formation (Hind et al., 1998; Wang et al., 2019), judged from the IR features of Na2C2O4 solids shown in Fig. S4. In addition, the peak at 1465 cm−1 is attributed to the O–H bending mode of HC2O ions (Villepin and Novak, 1971), indicative of the dissociated HC2O formation. Likewise, Wang et al. (2017) observed the formation of NH4HC2O4 in mixed (NH4)2SO4–OA droplets upon drying. As already indicated, the release of HNO3 and associated organic acid salt formation have been detected in several previous studies; thus herein, these observations can demonstrate the HNO3 release and nitrate depletion in NaNO3–OA mixtures, which is expected to occur in the vacuuming process. As RH increases to 21.2 %, the feature bands at 3441 and 3404 cm−1 appear, indicating the transformation of anhydrous OA to OA dihydrate. After that, the stronger 1620 and 1417 cm−1 bands, assigned to C2O ion vibration (Wang et al., 2019), and weaker 1465 cm−1 band indicate the conversion of aqueous NaHC2O4 to crystalline Na2C2O4. Thus, the acid-displacement reaction for NaNO3–OA mixtures can be expressed as
In previous studies, the reaction between NaCl or NaNO3 and OA was found to produce disodium oxalate (Ma et al., 2013, 2019b). To our knowledge, the formation of an intermediate product of sodium hydrogen oxalate is first observed here.
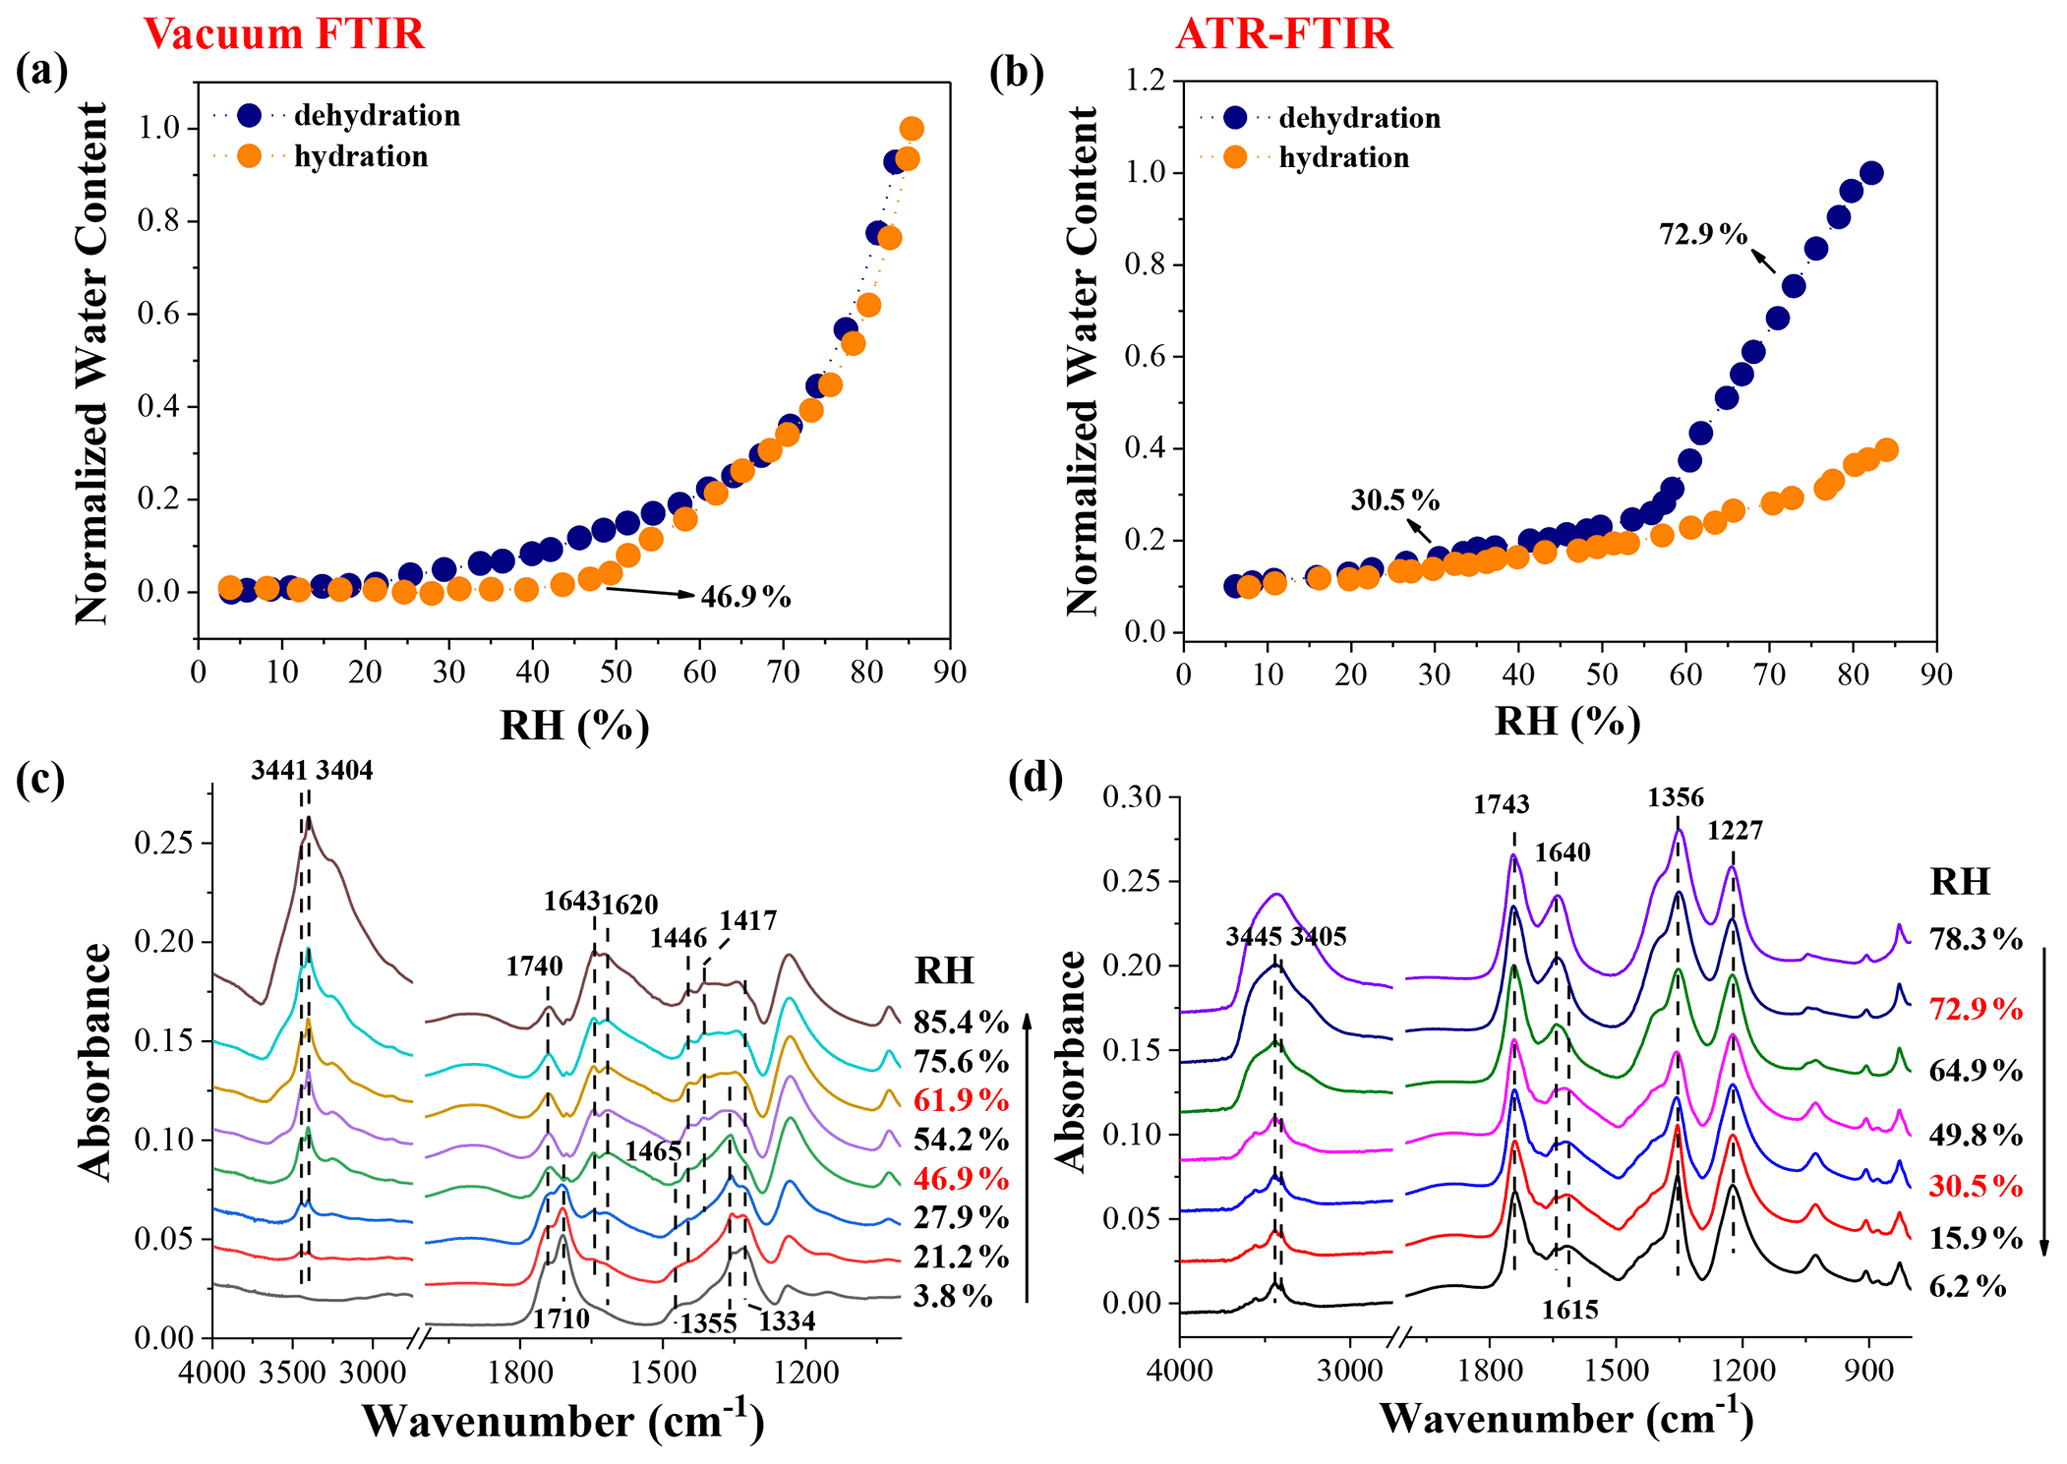
Figure 1Hygroscopic growth curves of 1:1 mixed NaNO3–OA particles measured by vacuum FTIR (a) and ATR-FTIR (b), as well as corresponding IR spectra during the humidification in vacuum FTIR measurement (c) and during the dehumidification in ATR-FTIR measurement (d).
As shown in Fig. 1a and c, we can infer that the NaNO3 deliquescence proceeds at 46.9 %–61.9 % RH in NaNO3–OA mixtures, significantly lower than the deliquescence relative humidity (DRH) of pure NaNO3 particles (seen Fig. S2). Indeed, the aerosol DRH can be significantly reduced by the mixing of organic acids and inorganic salts, according to experimental measurements and thermodynamic model predictions (Bouzidi et al., 2020; Hodas et al., 2015; Marcolli et al., 2004). Furthermore, the OA dihydrate and crystalline Na2C2O4 cannot be fully deliquesced due to their very high DRHs (Ma et al., 2013; Wang et al., 2019). Note that a solid–liquid equilibrium may be established; i.e. small amounts of OA dihydrate and Na2C2O4 dissolve into the aqueous phase (Hodas et al., 2016). The IR spectra during the dehumidification are shown in Fig. S5a. As seen, the 1357 cm−1 band becomes sharper at ∼13.6 % RH, indicating the remaining NaNO3 efflorescence. Moreover, the residue of reactants indicates the incomplete reaction between OA and NaNO3, consistent with the observations by Ma et al. (2019b) for Ca(NO3)2–OA, NaNO3–OA, and Zn(NO3)2–OA mixed systems.
Figure 1b and d display the hygroscopic growth and IR spectra of 1:1 NaNO3–OA mixtures measured by ATR-FTIR. Mixed particles undergo a dehumidification–humidification cycle. Upon dehydration, the water content of particles gradually decreases with decreasing RH. When the RH attains ∼72.9 %, the shoulder bands at 3445 and 3405 cm−1 assigned to OA dihydrate appear, as shown in Fig. 1d. Meanwhile, a new peak located at 1615 cm−1 is observed, suggesting the formation of disodium oxalate. As RH decreases to 30.5 %, the 1356 cm−1 band assigned to ν3(NO) becomes sharper, indicating the NaNO3 efflorescence. Upon hydration, the water content above ∼60 % RH (solid orange circles in Fig. 1b) is far below that upon dehydration (solid blue circles), owing to the persistence of crystalline OA and Na2C2O4 (Ma et al., 2013; Wang et al., 2017; Peng and Chan, 2001; Wu et al., 2011). Only NaNO3 solids are deliquesced, identified by the broader NO feature band at 1356 cm−1 (seen Fig. S5b). For a better illustration of phase state changes of mixed particles, the optical images of 1:1 NaNO3–OA mixture during two RH cycles are determined by an optical microscope operated with a video camera, which has been described in detail elsewhere (Ma et al., 2021a). For comparison with our vacuum FTIR measurement, the sample droplet first undergoes the rapid drying process and then two humidification–dehumidification cycles. As shown in Fig. 2, at 6.0 % RH in the first humidification process, the particle shape is roughly round and smooth, indicative of the amorphous structure of the NaNO3 component (Hoffman et al., 2004; Laskin et al., 2006; Tang and Fung, 1997). As RH increases to ∼43.2 %, the particle morphology becomes darker, potentially indicating the uptake of trace amounts of water. After NaNO3 deliquescence, nonhygroscopic OA dihydrate and Na2C2O4 still remain in crystalline states. The mixed particle exists in a solid–liquid mixing state involving liquid OA and NaNO3, crystalline Na2C2O4, and OA dihydrate. When the RH decreases to 5.1 %, the particle surface becomes irregular, differing from the initial particle morphology, which may be attributed to the higher fraction of crystalline Na2C2O4 as a reaction product. During the second RH cycle, the particle absorbs and releases water routinely, indicative of the presence of residual nitrate.
Besides, as shown in Fig. 1c, the absorbance of the 1620 cm−1 band assigned to oxalate shows a slight increase at RH as low as 21.2 %, implying the nitrate depletion proceeds at relatively low RH. Therefore, the effect of nitrate phase state on nitrate depletion needs to be further explored.
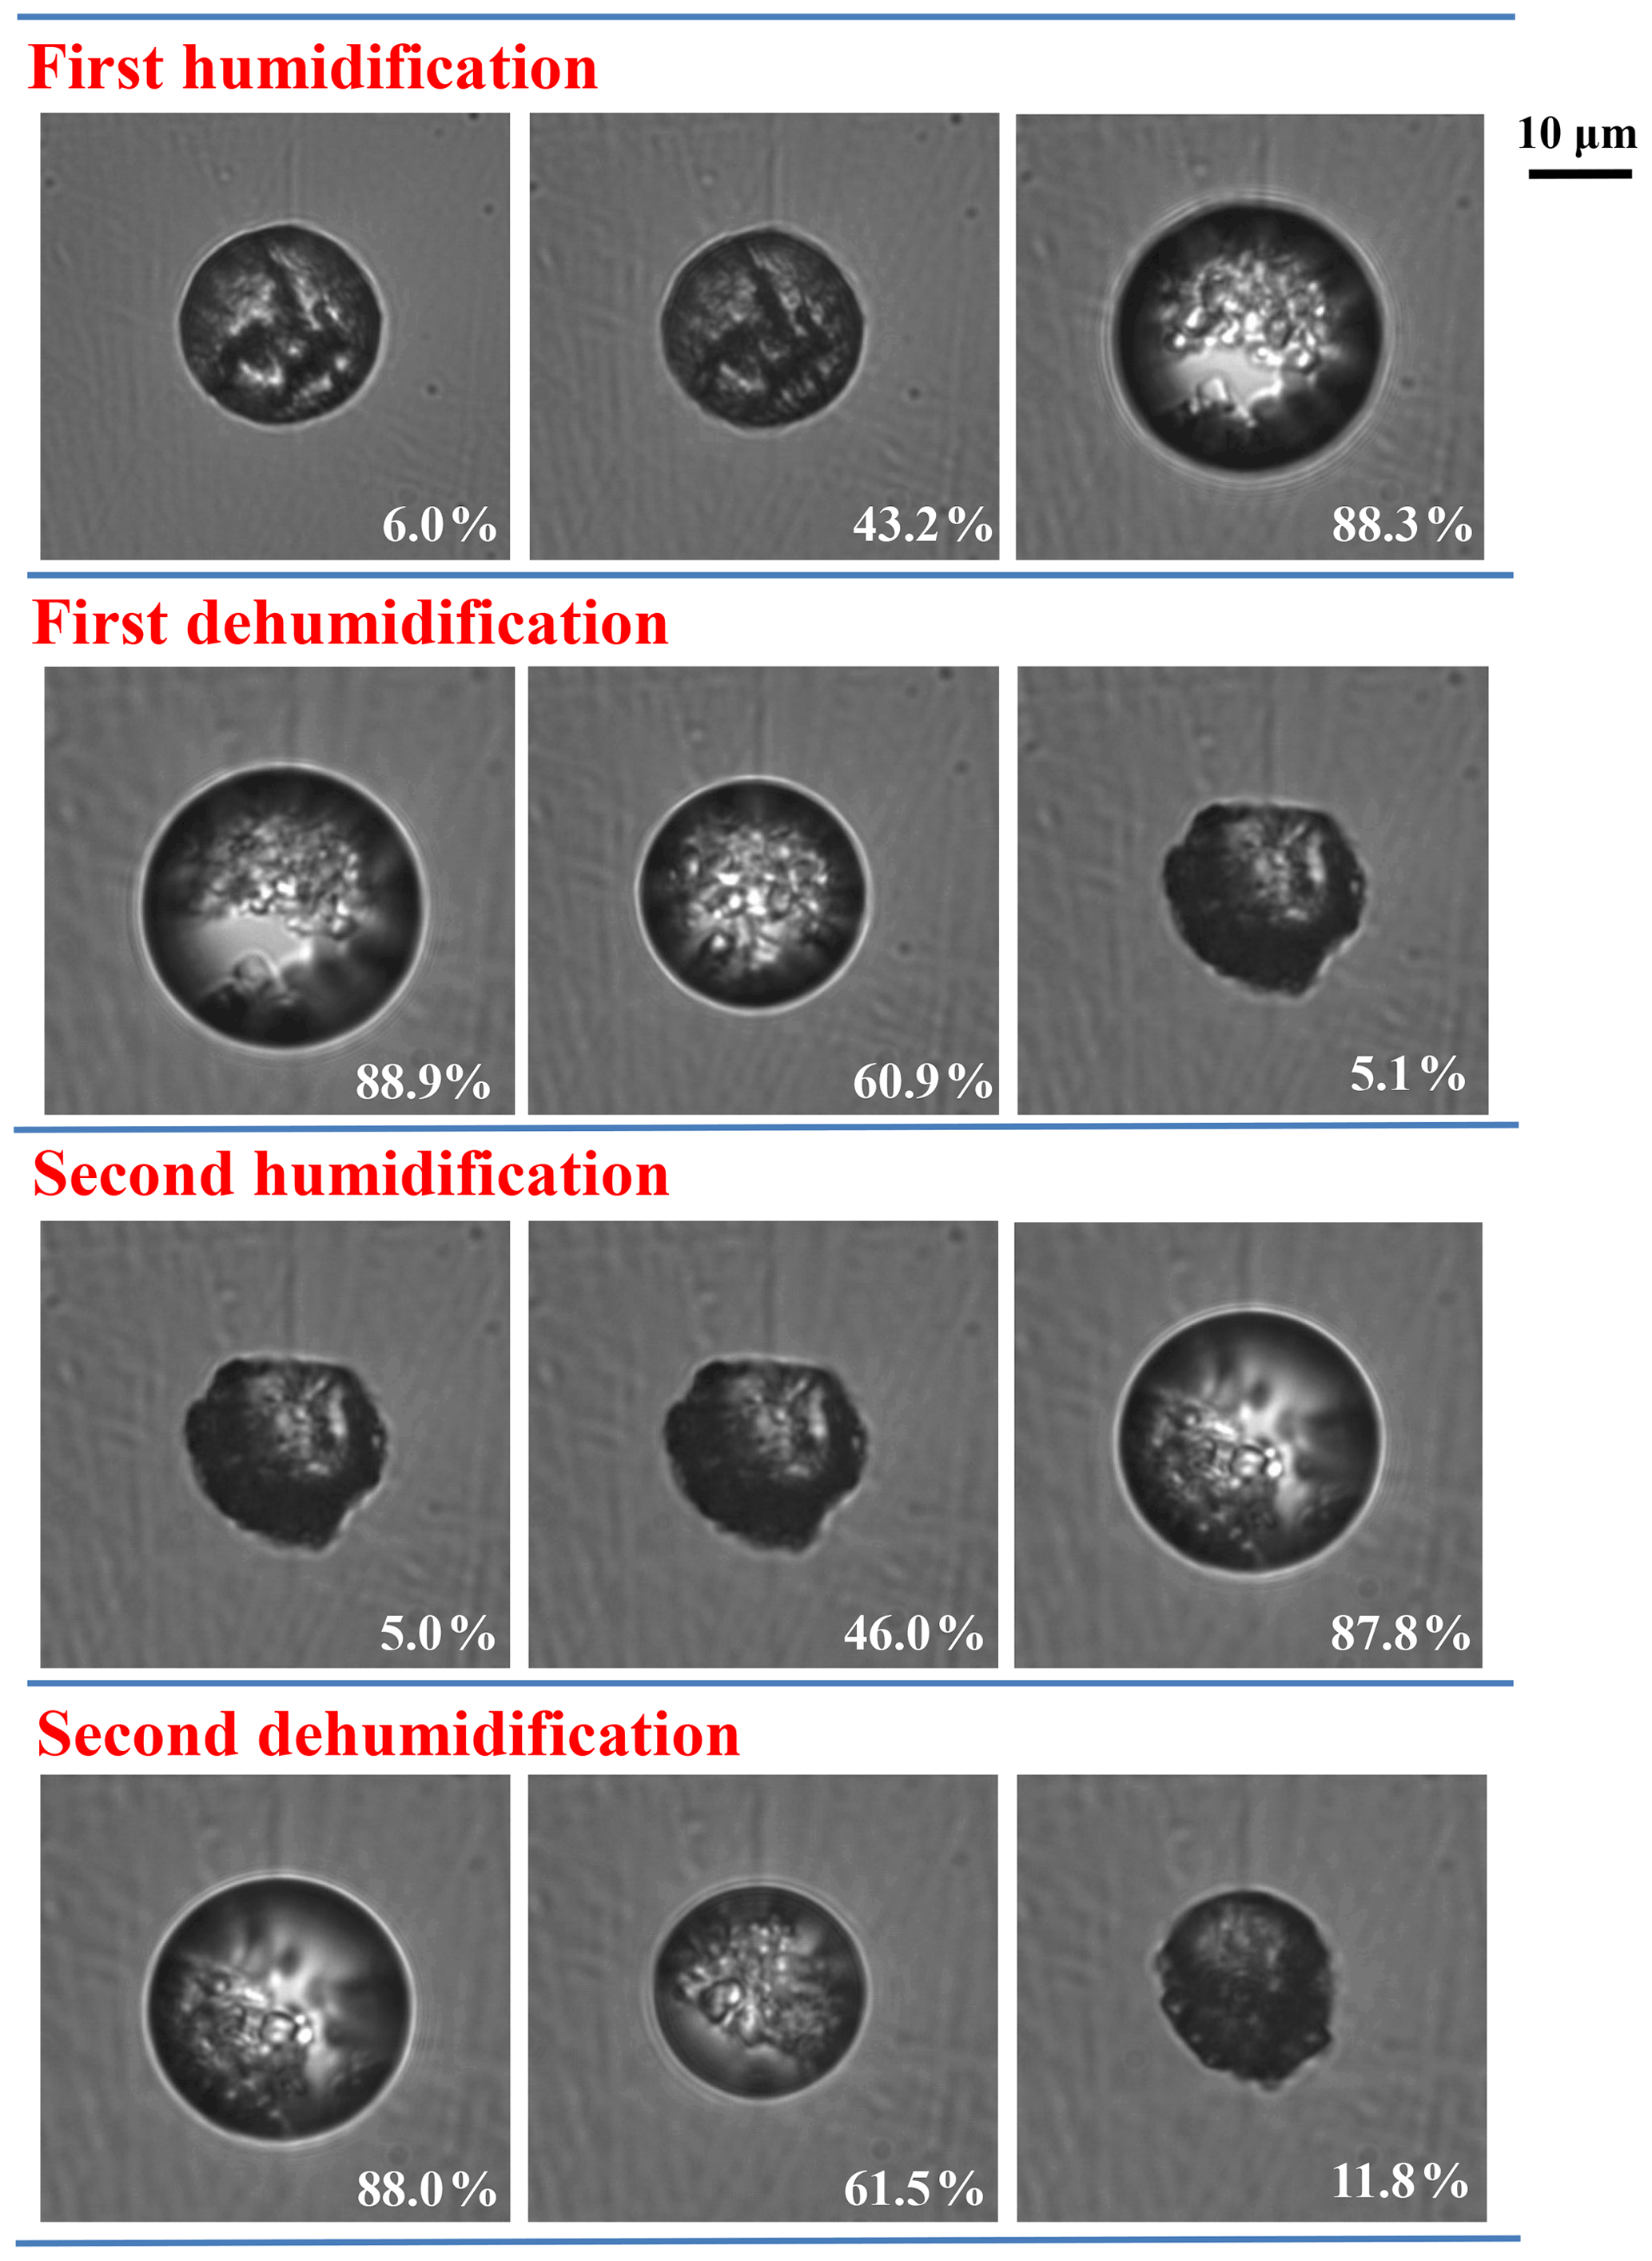
Figure 2Optical images of 1:1 mixed NaNO3–OA particles during two RH cycles. The corresponding ambient RH is marked at the bottom right of the images.
3.2 Effect of nitrate phase state on nitrate depletion for NaNO3–OA mixtures
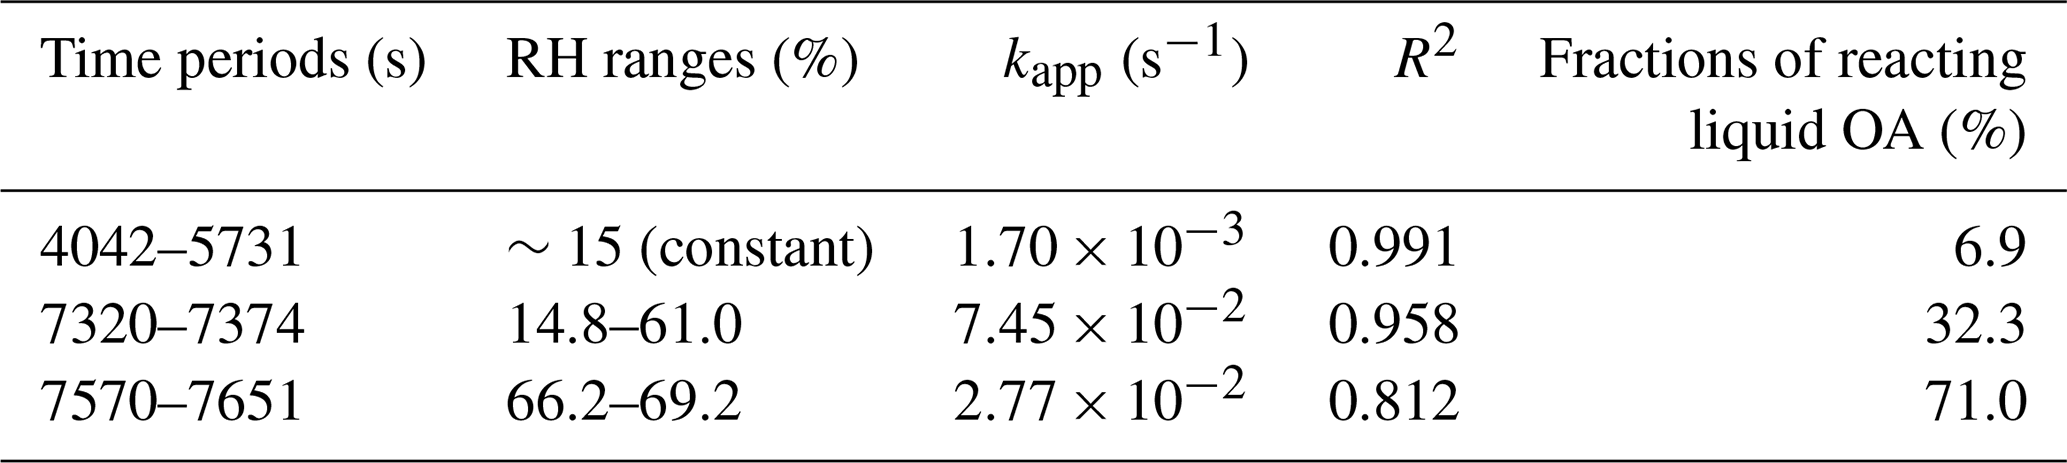
To better understand the phase state effect on this acid-displacement reaction, 3:1 NaNO3–OA mixtures are dried in a vacuum and then exposed to stepwise-increasing RH. The integrated absorbance difference (ΔA), derived from the deducted spectra of IR spectra at a certain time to that at the initial time, of the 1741 cm−1 band (assigned to COOH stretching mode, ν(COOH)) and 1620 cm−1 band (assigned to COO− asymmetric stretching vibration, νas(COO−)) as a function of time is determined and shown in Fig. 3a. First, the ΔA remains almost unchanged at RH <5 %. As RH increases to ∼15 %, the ΔA of the νas(COO−) band exhibits a considerable increase, indicative of the occurrence of nitrate depletion. At the same time, the ΔA value of ∼0.3 when the reaction equilibrium is reached implies that the nitrate depletion is limited at low RH. Note that the IR spectra changes with time at constant ∼15 % RH are supplied in Fig. S6. Almost no 1620 cm−1 band is observed at the initial time, suggesting almost no Na2C2O4 formation in the vacuuming process, potentially owing to the minimization of HNO3 release arising from rapid water evaporation (Ma et al., 2013). Then, the 1620 cm−1 band appears and becomes stronger with time, suggesting Na2C2O4 can be continuously produced at constant ∼15 % RH. Considering the constant droplet water activity at constant 15 % RH, these scenarios may provide more direct and powerful evidence for oxalate formation and associated nitrate depletion. Besides, coupled with the particle morphology changes shown in Fig. 2, we can infer the conversion of amorphous NaNO3 solids to highly viscous NaNO3 semisolids due to the uptake of trace amounts of moisture. As RH continues to increase, the ΔA values of the νas(COO−) and ν(COOH) bands respectively increase or decrease. Finally, the ΔA values of the two bands remain constant with time.

Figure 3(a) Temporal changes in ΔA values of ν(COOH) and νas(COO−) bands with stepwise-increasing RH for 3:1 NaNO3–OA mixed particles. (b) Temporal changes in ΔA values of ν(COOH), νas(COO−), and liquid water bands with increasing RH corresponding to the shaded period in (a).
Further, the variation in ΔA and water content as RH increases from ∼14.8 % to ∼69.2 % (shaded period in Fig. 3a) is processed and depicted in Fig. 3b. First, four stages are classed. In stage I, as RH increases from ∼14.8 % to ∼61.0 %, the liquid water content (yellow pentagram) shows a very slight increase, while the ΔA of the νas(COO−) band (pink pane) and ν(COOH) band (green circle) increases or decreases significantly. This implies that the absorbed moisture with increasing RH is favourable for nitrate depletion. In stage II, the RH increases slightly; meanwhile, the water content and the ΔA values remain almost unchanged. As the RH increases to ∼66.2 %, the deliquescence of remaining NaNO3 occurs, causing a sharp increase in liquid water content (stage III); meanwhile, the ΔA values of the νas(COO−) and ν(COOH) bands respectively increase or decrease, indicating further nitrate depletion due to more available NO ion formation. In stage IV, the reaction equilibrium is reached, and ΔA values remain unchanged. In addition, corresponding IR spectra changes of 3:1 mixtures during the shaded period are supplied in Fig. S7. At ∼69.2 % RH, the presence of the 1741 cm−1 band indicates the excess of liquid OA, suggesting this displacement reaction tends to reach equilibrium with comparable final concentrations of “reactants” and “products” (Wang and Laskin, 2014).
For the quantitative evaluation of the phase state effect, the kinetics of this displacement reaction should be further explored. For a given second-order reaction, (P = products), the reaction rate can be determined as
where k refers to the second-order rate constant (cm3 molecule−1 s−1), and [A] and [B] refer to the concentration of reactants A and B, respectively. Herein, during stepwise increasing of RH, the concentration of reactant A, i.e. aqueous NO, is limited, and the concentration of reactant B, i.e. liquid OA, is in excess, and hence, this displacement reaction can be treated as a pseudo-first-order reaction (He et al., 2017; Gao et al., 2018). The rate Eq. (1) can be rewritten as
and then
where kapp is the pseudo-first-order rate constant (s−1) and equals k[B]. [A0] refers to the initial concentration of reactant A. Based on this, the concentrations of reactant A and products P will change exponentially. Additionally, the integrated absorbance of the 1620 cm−1 (νas(COO−)) band can be used to describe the product concentration; thus the pseudo-first-order rate constant kapp can be determined by the exponential changes in absorbance difference of the νas(COO−) band, , as a function of reaction time (Hung and Ariya, 2007; Hung et al., 2005; Gao et al., 2018). Namely, , where , At and A∞ represent the integrated absorbance at time t and infinite time, respectively.
As shown in Fig. 3, the HNO3 release process can be divided into three stages, corresponding to three RH ranges, i.e. constant ∼15 %, sudden RH increase from ∼14.8 % to ∼61.0 %, and 66.2 %–69.2 %. The measured kapp values are shown in Table 1, and the changes with initialized reaction time are depicted in Fig. S8. As seen, the HNO3 release is relatively slow with a kapp value of s−1 at constant ∼15 % RH, possibly owing to limited NO concentration and mass transfer limitation within the particle phase; the humidification process at 14.8 %–61.0 % RH exhibits the fastest HNO3 release with the kapp value of s−1; during NaNO3 deliquescence, the HNO3 release rate slightly decreases but is still about 1 order of magnitude higher than that at constant ∼15 % RH. It is noteworthy that the R2 of exponential fitting of as a function of initialized reaction time at 66.2 %–69.2 % RH is only 0.812, implying this displacement reaction may no longer obey to pseudo-first-order reaction after NaNO3 deliquescence due to the formation of large quantities of available NO ions; in other words, the concentration of aqueous NO is no longer limited. Furthermore, the fractions of reacting liquid OA at the end of three RH ranges are measured by the ratio of integrated absorbance of the 1741 cm−1 (ν(COOH)) band at a certain time to that before the reaction; they show a value of ∼32.3 % before NaNO3 deliquescence and reach ∼71.0 % after deliquescence. These results further confirm that aqueous NaNO3 tends to be more reactive to liquid OA than amorphous and semisolid NaNO3 due to the presence of large quantities of available NO ions.
Table 1The pseudo-first-order rate constant kapp and fractions of reacting liquid OA corresponding to different time periods and RH ranges.
A summary of phase state changes and chemical compositional evolution of NaNO3–OA mixed particles is shown in Fig. 4. During the rapid drying (i.e. vacuuming process), mixed droplets release water, and then OA dihydrate forms. After that, mixed particles are effloresced to produce amorphous NaNO3 solids, and OA dihydrate is converted into anhydrous OA. At the same time, the aqueous NaHC2O4 is formed, accompanied by the release of gaseous HNO3. For the humidification process, first, amorphous NaNO3 solids at <5 % RH are inert to liquid OA, due to the unavailable dissociative NO ions for HNO3 liberation. As RH increases to around 15 % (or even lower), amorphous solids are converted into viscous semisolids, which can exhibit chemical reactivity to liquid OA, causing nitrate depletion. When the NaNO3 is deliquesced, more available NO ions are formed, and thus aqueous NaNO3 is more reactive to liquid OA, causing higher nitrate depletion extent. In previous studies, Li et al. (2017) indicated that the reaction between MA and NaCl could occur when aqueous H+ from MA and Cl− ions from NaCl were available for HCl liberation; meanwhile, the reaction would slow down or stop once the amount of available H+ became small, or the particles were effloresced. Besides, Kuwata and Martin (2012) investigated the phase state effect of atmospheric SOM on its reactivity upon ammonia exposure. They found that the semisolid adipic acid and α-pinene SOM could take up small amounts of ammonia even at low RH. At high RH, the particles existed in a liquid state, and the absorbed water could act as a plasticizer which decreased the viscosity of particles and increased the diffusion coefficient of ammonia, thereby leading to extensive ammonia uptake. It was noteworthy that the ammonia uptake was also thermodynamically or kinetically limited, showing that aqueous SOM particles were not fully neutralized even for the highest NH3 concentration.
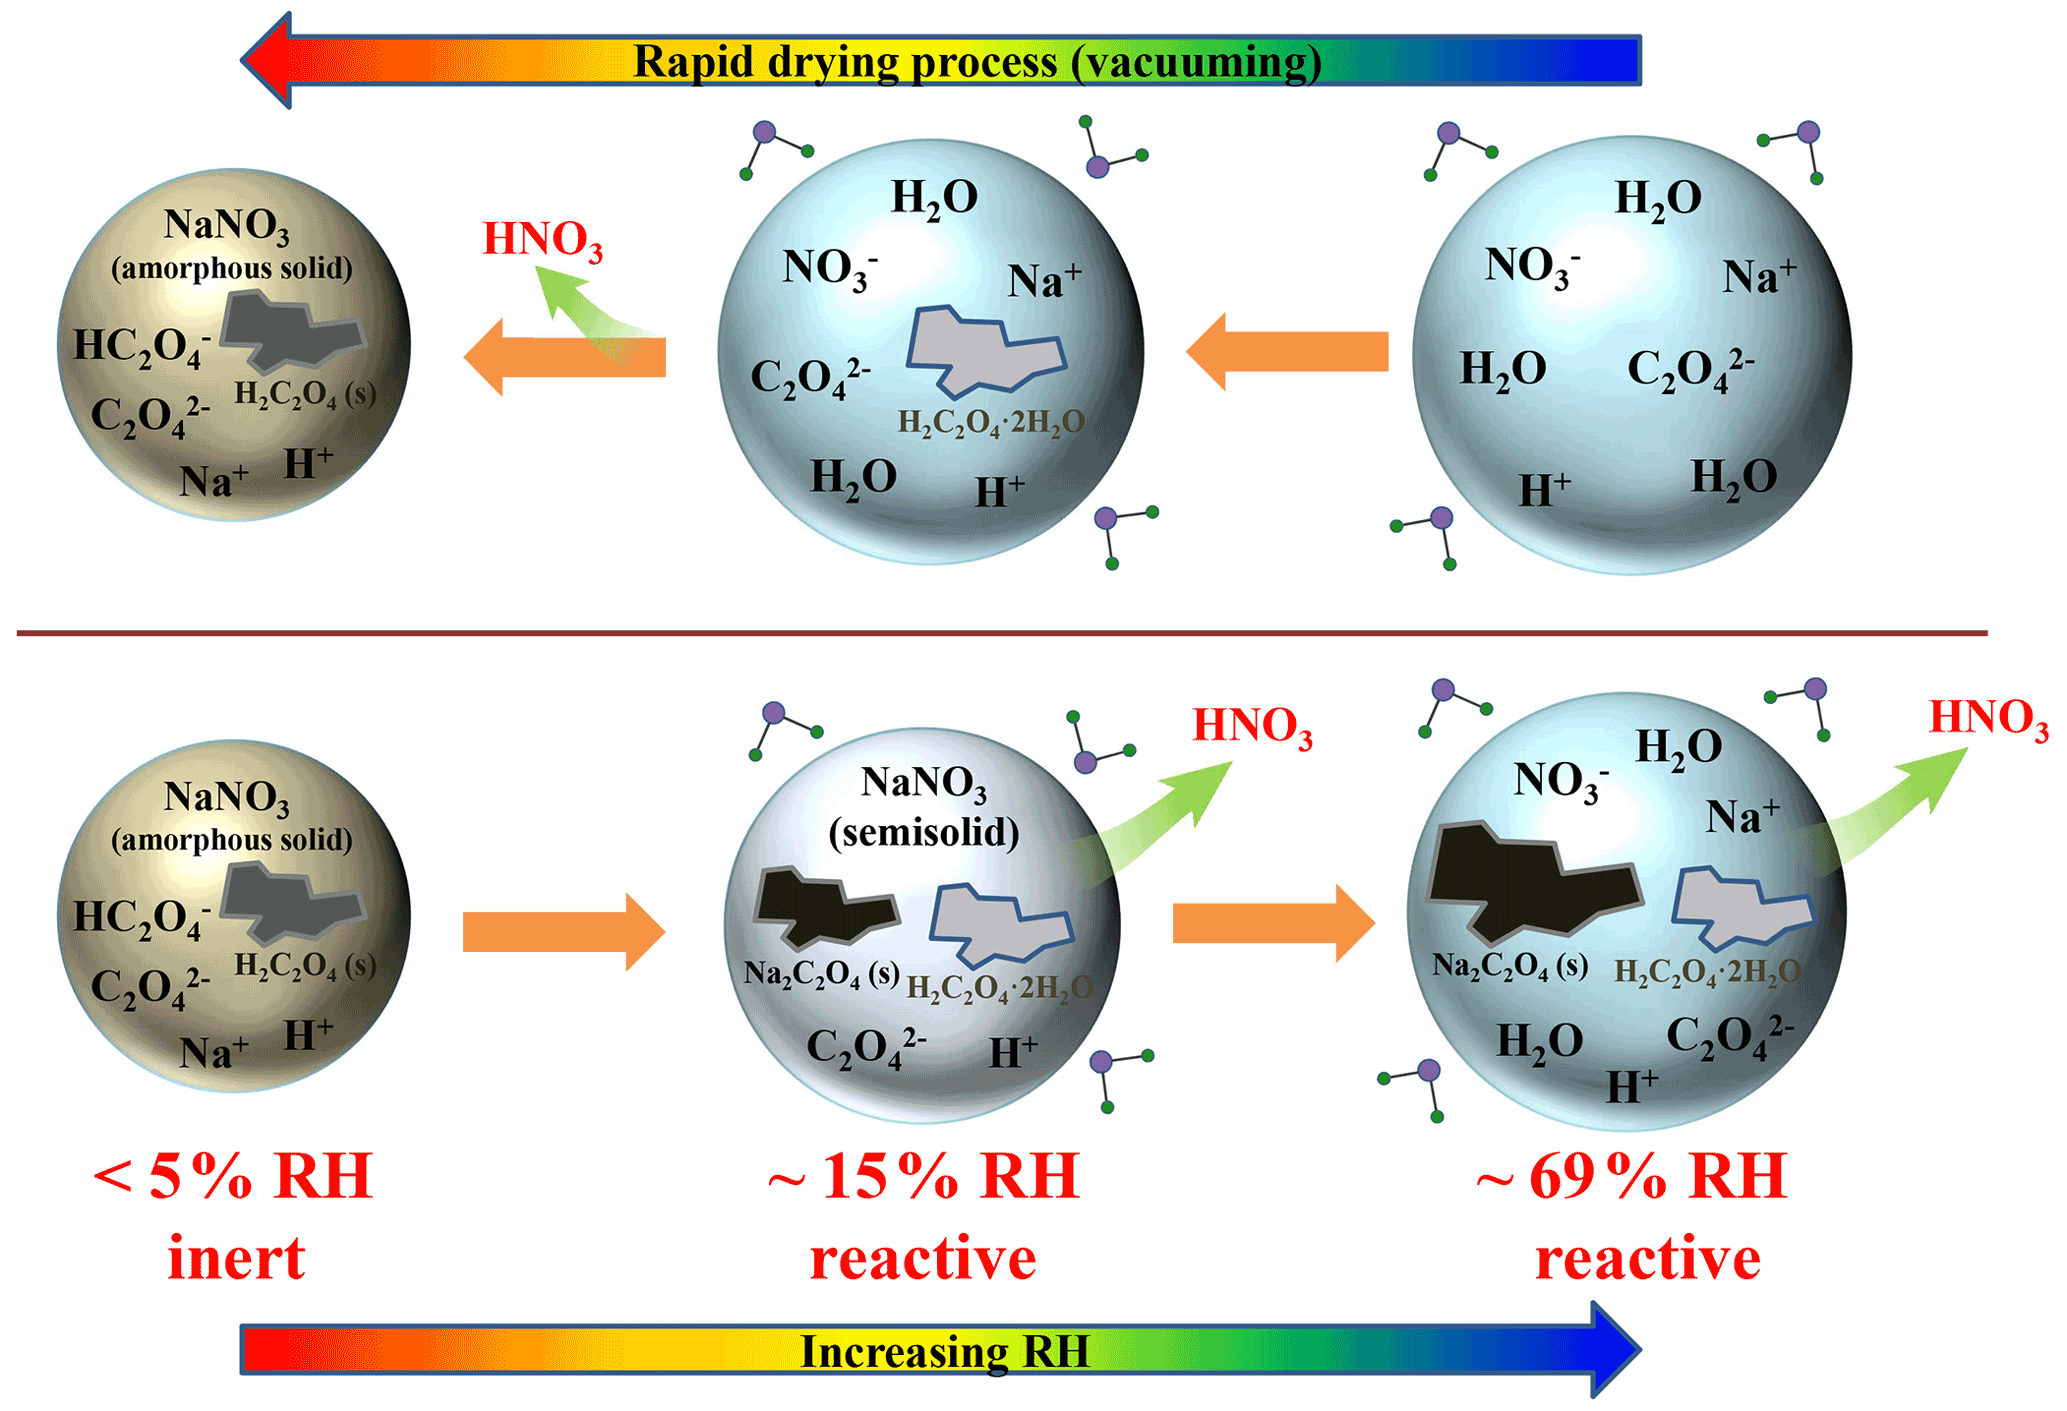
Figure 4Schematic diagram of phase state changes and chemical compositional evolution of NaNO3–OA mixed particles in the vacuuming and humidification processes.
3.3 Hygroscopic growth and chemical composition evolution of NaNO3–MA mixtures
Figure 5a and b display the hygroscopic behaviour of mixed NaNO3–MA particles deposited on CaF2 windows and Ge substrate measured by vacuum FTIR and ATR-FTIR, respectively. Correspondingly, the IR spectra upon hydration and upon dehydration are shown in Fig. 5c and d. Note that the IR spectra upon dehydration in vacuum FTIR measurement and upon hydration in ATR-FTIR measurement are shown in Fig. S9a and b, respectively. In vacuum FTIR measurement, the water content of mixed particles increases or decreases continuously with changing RH without distinct phase transitions (seen Fig. 5a). In other words, the addition of MA can totally inhibit the NaNO3 crystallization. Likewise, Braban and Abbatt (2004) and Parsons et al. (2004) did not observe the efflorescence of (NH4)2SO4 or MA in 1:1 mixed (NH4)2SO4–MA particles under dry conditions. Also, no efflorescence was observed by Ghorai et al. (2014) for a 1:1 NaCl–MA mixed system. In Fig. 5c, the 1722 cm−1 band is assigned to ν(C = O) of aqueous MA, and the 1407, 1218, and 1171 cm−1 bands are also the characteristics of aqueous MA (Shao et al., 2017). The 1361 cm−1 band is assigned to ν3(NO) of the NaNO3 solution phase. More importantly, a new band located at 1595 cm−1 indicates the formation of monosodium malonate (HOOCCH2COONa) (Wang et al., 2019; Shao et al., 2018). Thus, the displacement reaction between NaNO3 and MA is confirmed by vacuum FTIR measurement as follows:
The production of monosodium malonate has also been observed in mixed NaCl–MA aerosols by Li et al. (2017). They explained that the first acid dissociation constant (Ka1) of MA was about , which was ∼3 orders of magnitude larger than the second one (), resulting in much more HOOCCH2COO− dissociated from MA than CH2(COO (Li et al., 2017). Besides, no disodium salts are observed in the NaNO3–MA system, differing from the NaNO3–OA system, which may be due to the higher acidity of OA (pKa2=4.19) than MA (pKa2=5.70). To further validate this displacement reaction, the IR spectra of NaNO3–MA mixtures before and after the RH cycle are supplied in Fig. S10. It is clear that the 1722 cm−1 band assigned to ν(COOH) of MA becomes weaker; meanwhile, the 1595 cm−1 band assigned to νas(COO−) of HOOCCH2COO− ions dissociated from monosodium malonate becomes stronger after the RH cycle.
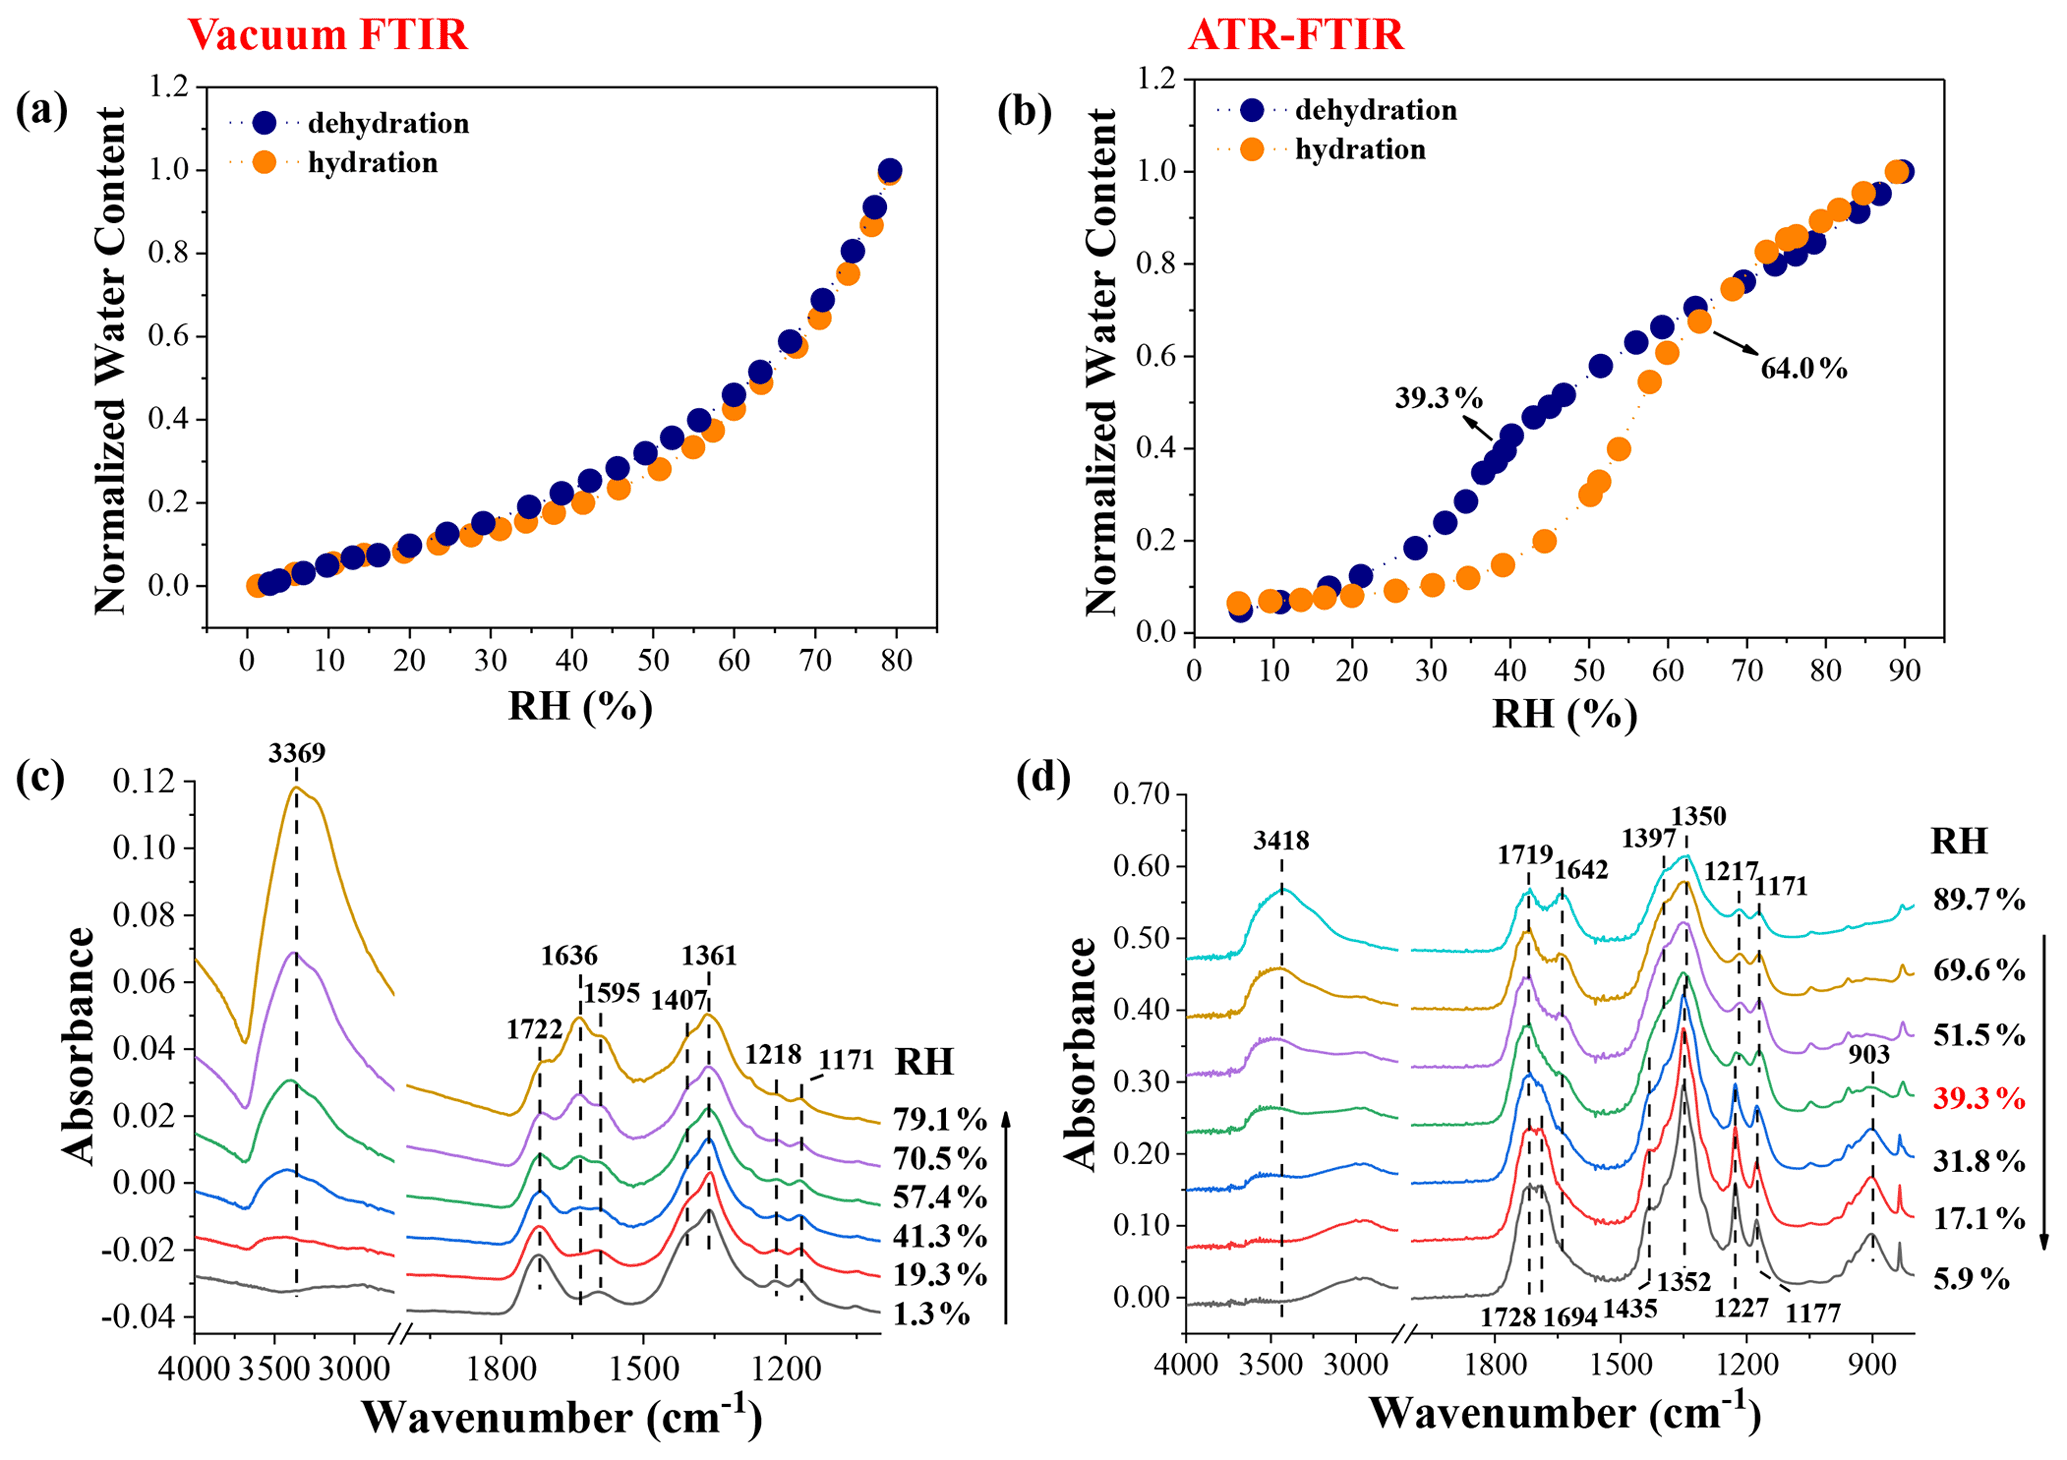
Figure 5Hygroscopic growth curves of 1:1 mixed NaNO3–MA particles measured by vacuum FTIR (a) and ATR-FTIR (b), as well as corresponding IR spectra during the humidification in vacuum FTIR measurement (c) and during the dehumidification in ATR-FTIR measurement (d).
In ATR-FTIR measurement, deposited particles on the Ge substrate show distinct efflorescence and deliquescence transitions during the RH cycle. The initial efflorescence relative humidity (ERH) is ∼39.9 %, and the RH where the particles are fully deliquesced is ∼64.0 %. As shown in Fig. 5d, the IR features of mixtures at 89.7 % RH are comparable to that measured by vacuum FTIR, whereas, as RH decreases to 39.3 %, the 1719 cm−1 band, assigned to ν(COOH) of aqueous MA, is split into two shoulder peaks located at 1728 and 1694 cm−1. Furthermore, the 1397, 1217, and 1171 cm−1 bands red-shift to 1435, 1227, and 1177 cm−1, respectively. A new peak located at 903 cm−1 appears. All these scenarios indicate the liquid–solid phase transition of MA (Shao et al., 2017). The 1350 cm−1 band assigned to ν3(NO) of aqueous NO turns into a sharp peak at 1352 cm−1, suggesting the formation of NaNO3 solids. In other words, the efflorescence of MA and NaNO3 occurs synchronously at ∼39.3 % RH. As compared to vacuum FTIR results, we can infer that the heterogeneous efficacy of Ge substrate is much higher than CaF2 windows, resulting in heterogeneous nucleation of MA and NaNO3 upon dehydration (Ma et al., 2021b). As shown in Figs. 5b and S9b, the solid–liquid phase transition of crystalline MA and NaNO3 ends at ∼64.0 % RH, which is lower than the deliquescence points of pure components. Specially, no IR features of malonate sodium salts are observed, indicative of no nitrate depletion in ATR-FTIR measurement, which differs from the vacuum FTIR observation. The causes for this discrepancy are discussed in detail in Sect. 3.5. Besides, the chlorine depletion in 1:1 mixed NaCl–MA particles with two different RH changing rates is also experimentally detected to further probe the influence factors for acid-displacement reactions, and the detailed discussion is presented in the Supplement. Briefly, the disodium malonate is produced in 1:1 mixed NaCl–MA particles during the dehumidification with the RH changing rate of 0.04 % RH per second, while in the faster dehumidification process (2.20 % RH per second), no malonate sodium salts are formed, and the mixtures are effloresced completely. There are two probable causes for no chloride depletion observed in the fast-drying process. One is the minimization of HCl release caused by rapid water evaporation (Ma et al., 2013). Another cause is the efflorescence transition of mixed droplets at relatively high RH arising from the lower temperature of droplets caused by rapid water evaporation (Ma et al., 2019c).
3.4 Hygroscopic growth and chemical composition evolution of NaNO3–GA mixtures
The hygroscopic growth curve and corresponding IR spectra of 1:1 mixed NaNO3–GA particles measured by vacuum FTIR are shown in Fig. 6a and c, respectively. Routinely, mixed particles are first dried in a vacuum and then undergo a RH cycle. In Fig. 6c, at ∼3.4 % RH, the shoulder peaks located at 1718 and 1695 cm−1 are attributed to ν(C = O) of crystalline GA, and the ν(C–O) band at 1292 cm−1 and rocking vibration mode of CH2 (γ(CH2)) located at 1196 cm−1 are also the characteristics of GA solids (Wu et al., 2019a). The 1358 cm−1 band is attributed to ν3(NO) of NaNO3 solids. Indeed, mixed NaNO3–GA particles exhibit distinctly different efflorescence behaviour compared with NaNO3–MA mixtures, considerably consistent with the observation by Ghorai et al. (2014) for NaCl–GA(MA) mixed systems. This may be attributed to a weaker inhibiting effect of GA than MA on inorganic salt crystallization (Ma et al., 2021b). In addition, a weak peak located at 1548 cm−1 appears upon hydration, indicating the formation of dissociated glutarate sodium salts. The weaker intensity compared with the NaNO3–MA system indicates the substantially weaker chemical reactivity of GA (pKa1=4.32) than MA (pKa1=2.83) (Ghorai et al., 2014). As RH increases to 65.6 %, mixed NaNO3–GA particles are fully deliquesced, and corresponding IR feature changes are consistent with the observation by Wu et al. (2019b). During the dehumidification, aqueous droplets are effloresced at ∼28.4 % RH, judged mainly from the IR feature changes of mixtures shown in Fig. S12a. It should be noted that only the ν3(NO) band experiences a red shift from 1344 to 1358 cm−1, implying that only the NaNO3 component effloresces, and GA cannot be crystallized upon dehydration. The particle morphology of partial crystallization for mixtures of GA and nitrates was also observed by Wang and Laskin (2014). Braban (2004) found that GA would not effloresce upon drying for the (NH4)2SO4–GA mixed system, potentially owing to the fact that the residual (NH4)2SO4 in the solution phase added an extra barrier to the formation of GA crystalline germ (Braban and Abbatt, 2004). Wu et al. (2019b) studied the stepwise efflorescence process of 1:1 mixed NaNO3–GA particles in the pulsed RH mode with the vacuum FTIR method. They found that effloresced particles reversibly absorb and release water with pulsed RH changes when the minimal RH values were below 10 %, suggesting that there were still small amounts of water retained in mixed particles; i.e. the mixed particles were partially crystallized. In addition, the crystallization of GA in the vacuuming process can be explained by the lower temperature of droplets arising from rapid water evaporation, as discussed in the Supplement.
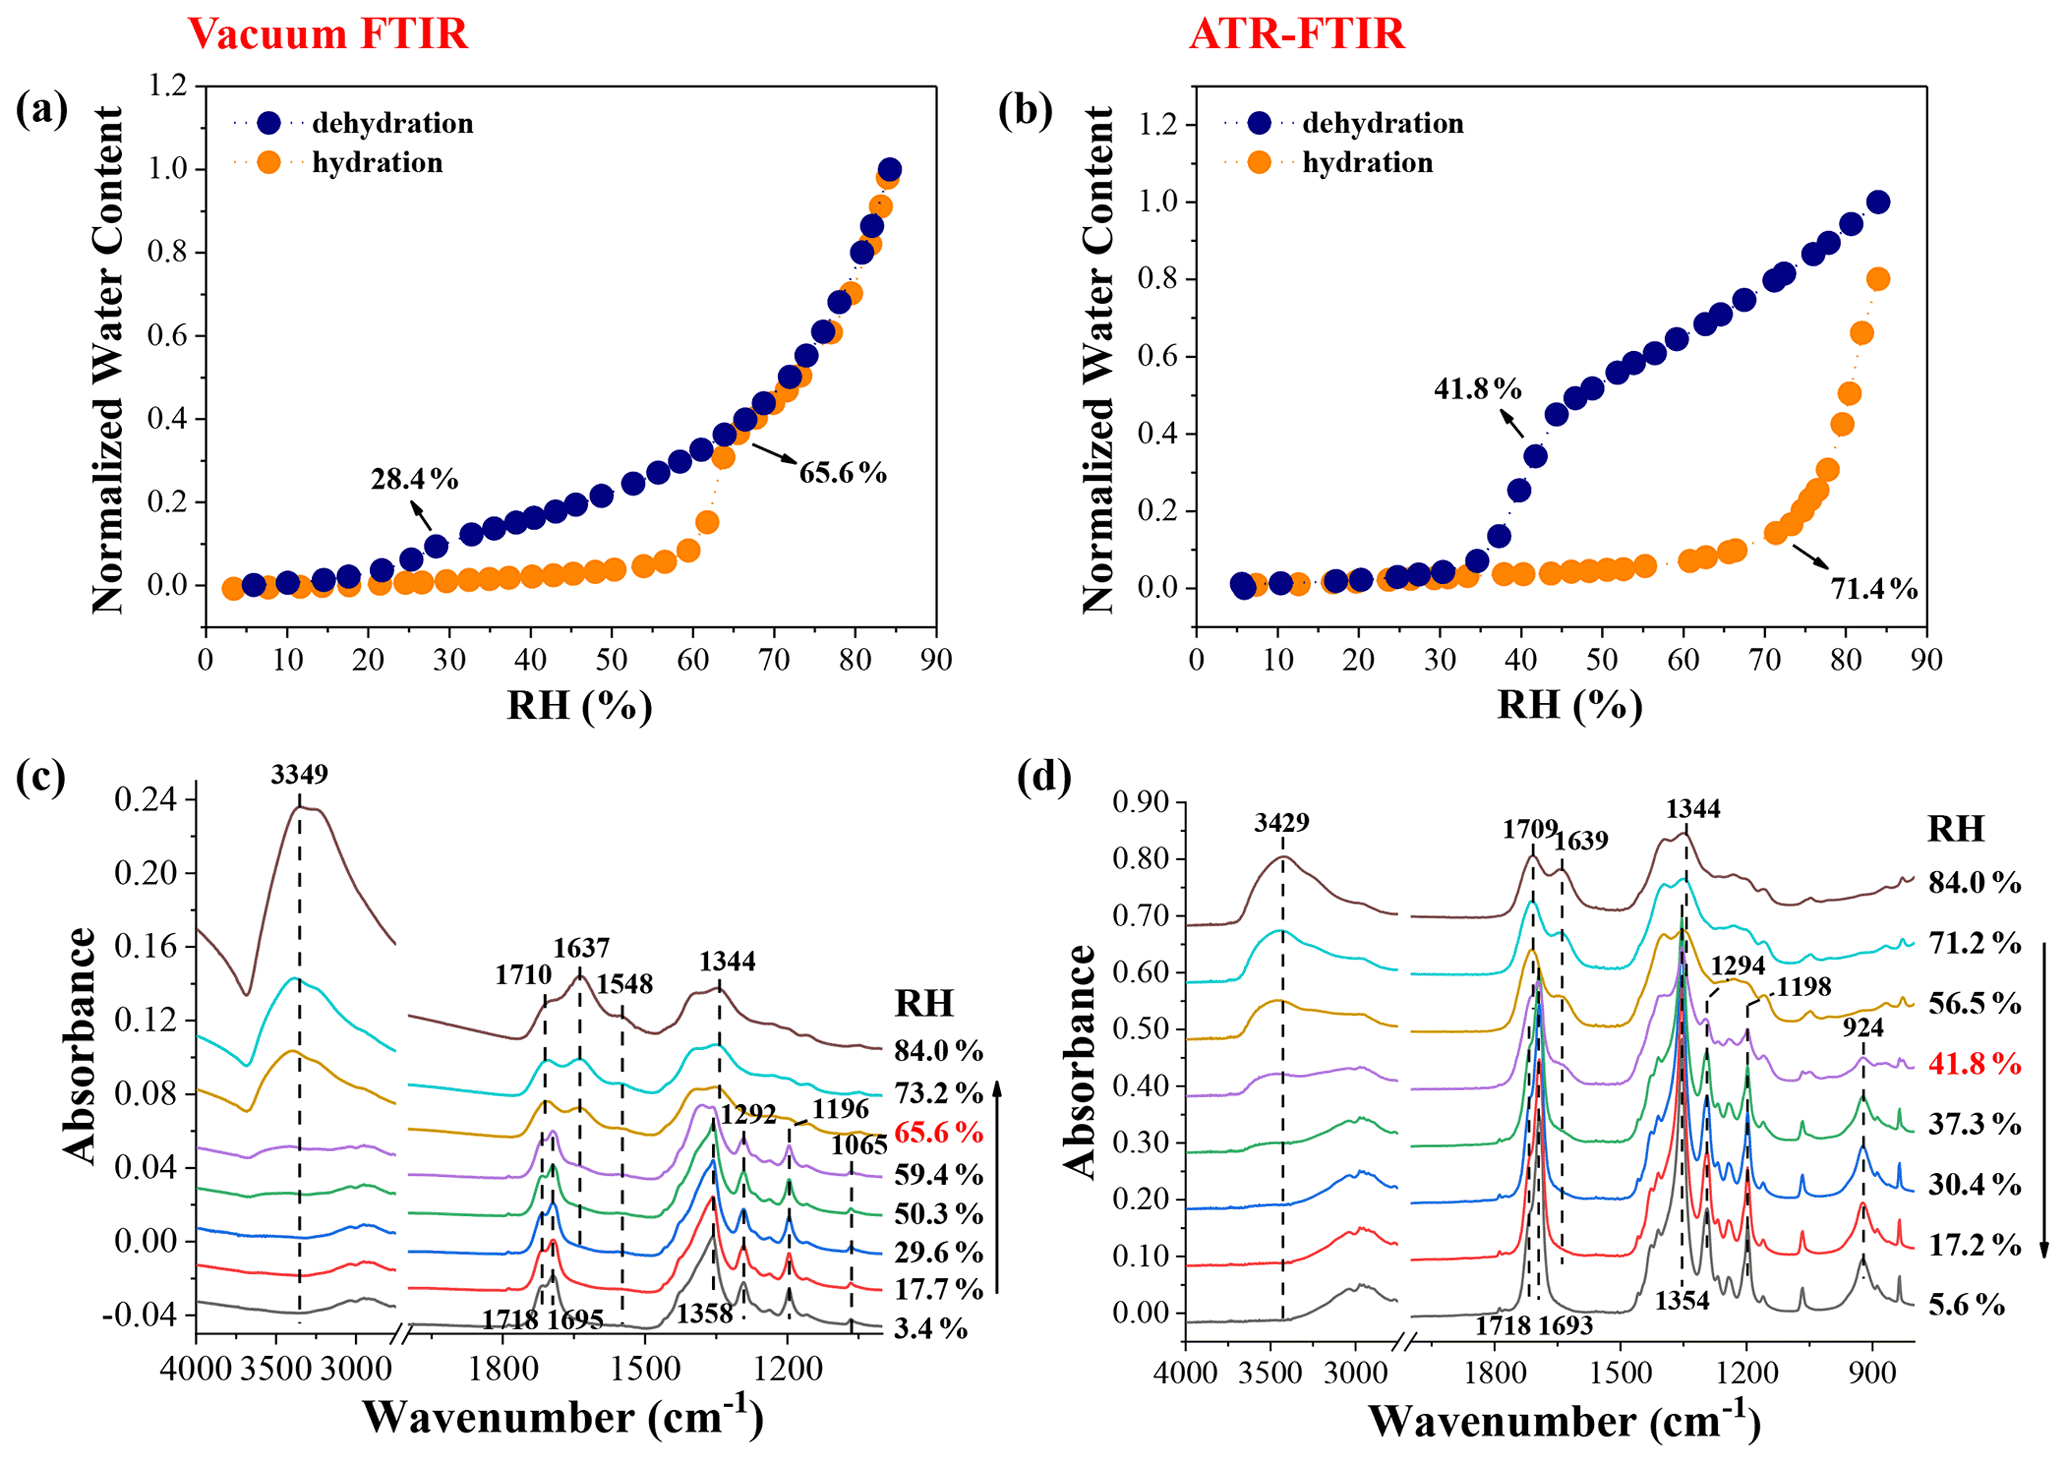
Figure 6Hygroscopic growth curves of 1:1 mixed NaNO3–GA particles measured by vacuum FTIR (a) and ATR-FTIR (b), as well as corresponding IR spectra during the humidification in vacuum FTIR measurement (c) and during the dehumidification in ATR-FTIR measurement (d).
In ATR-FTIR measurement, the efflorescence of mixed NaNO3–GA particles occurs at ∼41.8 % RH, showing an abrupt decrease in water content with decreasing RH (seen Fig. 6b). For the humidification process, mixed particles obviously take up water at ∼71.4 % RH. The water content cannot match that in the dehumidification process even until ∼84.0 % RH, suggesting that the GA component cannot be deliquesced completely due to its high DRH (Marcolli et al., 2004; Yeung et al., 2010). This is further confirmed by corresponding IR features shown in Fig. S12b. As seen, the feature bands at 1207 and 924 cm−1 assigned to GA crystals are still observed at RH as high as 84.0 %. Likewise, partial dissolution of GA was also observed for the (NH4)2SO4–GA system by Ling and Chan (2008). More importantly, there are no IR features of glutarate sodium salts observed during the RH cycle, which is further explained in Sect. 3.5.
3.5 Influence factors for acid-displacement reactions
As already indicated, the driving out of gaseous HCl/HNO3 from chloride–nitrate and organic acid mixtures is mainly dominated by two factors, i.e. Ka1 and KH of organic acids (Wang and Laskin, 2014; Laskin et al., 2012). Note that the acid dissociation constant (pKa1, pKa2) and equilibrium constants K1, K2, and K3 utilized in the pH change simulation as well as Henry's law constant (KH) at 298 K for different acids involved in this study are listed in Table 2. In our previous review, the chlorine depletion in mixed NaCl–diacid systems was suggested to be related to the acidity and environmental concentration of organic acids, as well as ambient RH and particle size of mixtures (Chen et al., 2021). First, stronger acidity would cause more available H+ in the aqueous phase, favouring the acid-displacement reaction. The acidity of diacids followed the order of OA > MA > SA > GA. Then, the higher acid concentration and lower RH would lead to greater HCl partial pressure, which was favourable for the partitioning of HCl into the gas phase. Finally, the chlorine depletion extent, ξ, was determined to be inversely proportional to r2, where r was the droplet radius. In other words, the depletion extent ξ would increase greatly with decreasing droplet size.
As known, the driving out of volatile species such as HNO3 from aqueous droplets can be quantified by the Maxwell steady-state diffusive mass transfer equation (Chen et al., 2021; Cai et al., 2014; Ray et al., 1979). The mass flux of HNO3 partitioning from particle to gas phase can be determined as
where m denotes the mass of HNO3 within the droplets (g); t denotes the evaporation time (s); M and D represent the molecular weight (g mol−1) and diffusion coefficient of HNO3 in the air (m2 s−1), respectively; R is the ideal gas constant (J mol−1 K−1); T is the temperature (K); r is the droplet radius (m); and p∞ and pr represent the partial pressure of HNO3 (Pa) at infinite distance and droplet surface, respectively.
When the RH decreases continuously, the evaporation rate of HNO3 at a certain RH, kRH (g s−1), can be expressed as (assuming p∞=0)
In the ATR-FTIR measurement, the diffusion coefficient of HNO3 in the air is m2 s−1 under the condition of T=298 K and P=1 atm (Durham and Stockburger, 1986). Assuming that the droplet radius at 90 % RH is ∼1.5 µm, the droplet size r at any RH can be determined according to the size growth factors predicted by the Extended Aerosol Inorganic Model (E-AIM); pr can also be estimated by the E-AIM model. Note that the E-AIM predictions are performed with the UNIFAC model with parameters modified by Peng et al. (2001). In addition, the RH can be converted to water activity, aw, by the Köhler equation to minimize the Kelvin curvature effect, as shown in the Supplement (Jing et al., 2016). Based on these, the kRH for 1:1 mixed NaNO3–OA, NaNO3–MA, and NaNO3–GA systems as a function of aw in ATR-FTIR measurement can be estimated and shown in Fig. 7a. Note that the solid-phase formation is prevented from obtaining the simulation data of supersaturated droplets at low RH.
Besides, according to the Chapman–Enskog method, the diffusion coefficient of HNO3 in the gas phase can be expressed as (Reid et al., 1987)
where subscripts A and B denote species A and B; P is the ambient pressure (bar); (g mol−1); σAB represents the characteristic length (Å); and ΩD is the diffusion collision integral. Thus, the HNO3 diffusion coefficient in vacuum FTIR measurement, D*, is much higher than that in ATR-FTIR measurement, due to the much lower ambient pressure in vacuum FTIR, P*, which can be expressed as
where P0 denotes the saturated water vapour pressure at 298 K (bar). Based on Eqs. (6) and (7), the D* value at any RH can be determined. Accordingly, the kRH values in vacuum FTIR measurement can also be calculated for comparison, as shown in Fig. 7a. The kRH values in vacuum FTIR measurement are ∼35 times higher than those in ATR-FTIR measurement at aw=0.9, due to much lower ambient pressure in vacuum FTIR. Based on this, the discrepancies among the two measurements for nitrate depletion in NaNO3–MA(GA) systems can be mainly attributed to the higher HNO3 release rate arising from faster HNO3 gas-phase diffusion in vacuum FTIR. Previous studies have indicated that numerous atmospheric processes involving aerosol particles were often carried out at high altitudes with significantly lower pressure than the ground level (Zhao et al., 2009; Rosenberger et al., 2018; Schilling and Winterer, 2014), and aerosol properties such as hygroscopicity under reduced pressure should be further characterized (Tang et al., 2019). Furthermore, mixed NaNO3–OA systems exhibit a higher HNO3 release rate than NaNO3–MA(GA) systems due to the higher acidity of OA. Meanwhile, the HNO3 release rate for a NaNO3–OA system in ATR-FTIR measurement is comparable to that for a NaNO3–GA system in vacuum FTIR measurement. These indicate that the lower acidity and hence lower reactivity of MA and GA also contribute to the unobserved nitrate depletion in ATR-FTIR measurement. In addition, all the kRH values increase significantly with decreasing droplet water activity. Specifically, the kRH at aw=0.1 is about 2 orders of magnitude higher than that at aw=0.9. It should be noted that in ATR-FTIR measurements, HNO3 release from NaNO3–MA(GA) aqueous droplets at very low RH would exhibit comparable levels to that for a NaNO3–OA system at relatively higher RH. Therefore, considerable HNO3 release from NaNO3–MA(GA) mixtures can be expected in case of no complete efflorescence of mixtures in ATR-FTIR measurements. In other words, the crystallization of mixed droplets induced by the Ge substrate, causing the lack of aqueous H+ and NO ions available for HNO3 liberation, tends to be another cause for negligible or even no HNO3 release from NaNO3–MA(GA) mixtures.
Besides, the pH changes of 1:1 NaNO3–DCA aqueous droplets with an initial concentration of 0.1 mol L−1 as a function of nitrate depletion fraction are calculated and shown in Fig. 7b. The calculation method is similar to that for ammonium depletion simulation proposed by Wang et al. (2019) (shown in the Supplement). As the NO in the aqueous phase is depleted, the conversion of DCAs to their sodium salts proceeds, leading to the continuous reduction in droplet acidity.
Table 2The acid dissociation constant (pKa1, pKa2) and equilibrium constants K1, K2, and K3 utilized in the pH change simulation as well as Henry's law constant (KH) at 298 K for different acids involved in this study.
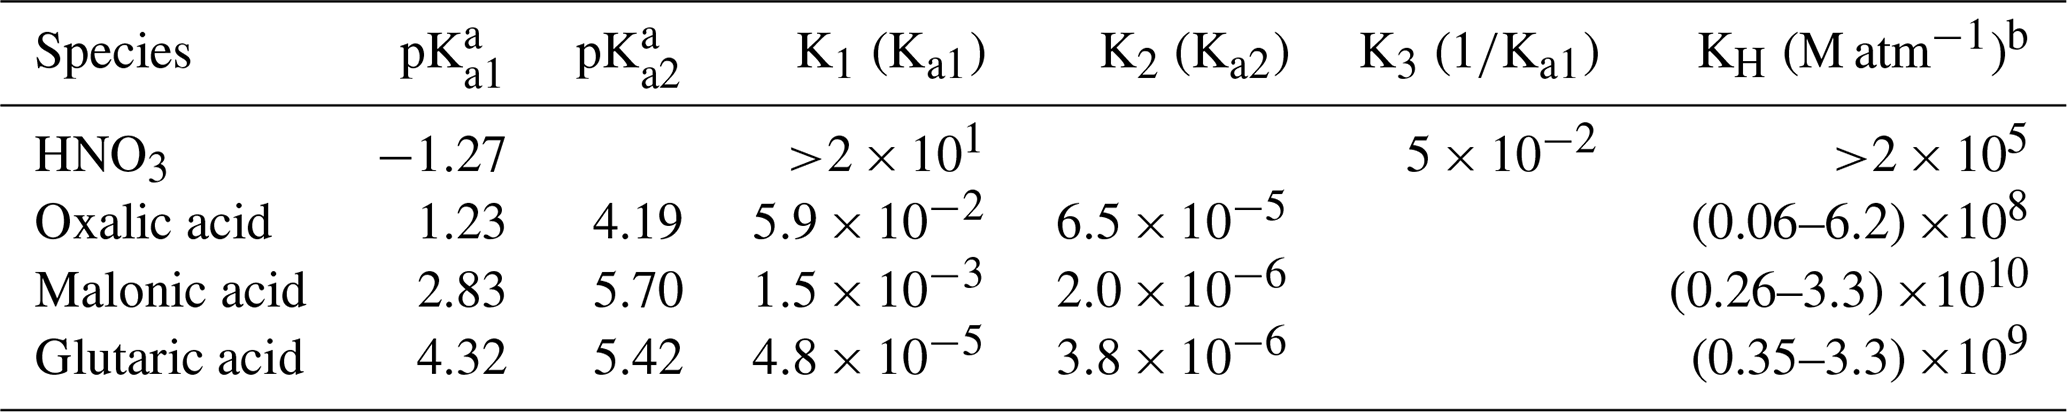
a Data from Haynes and Lide (2011). b Data from Wang and Laskin (2014), Compernolle and Müller (2014), Soonsin et al. (2010), and Bilde et al. (2003).
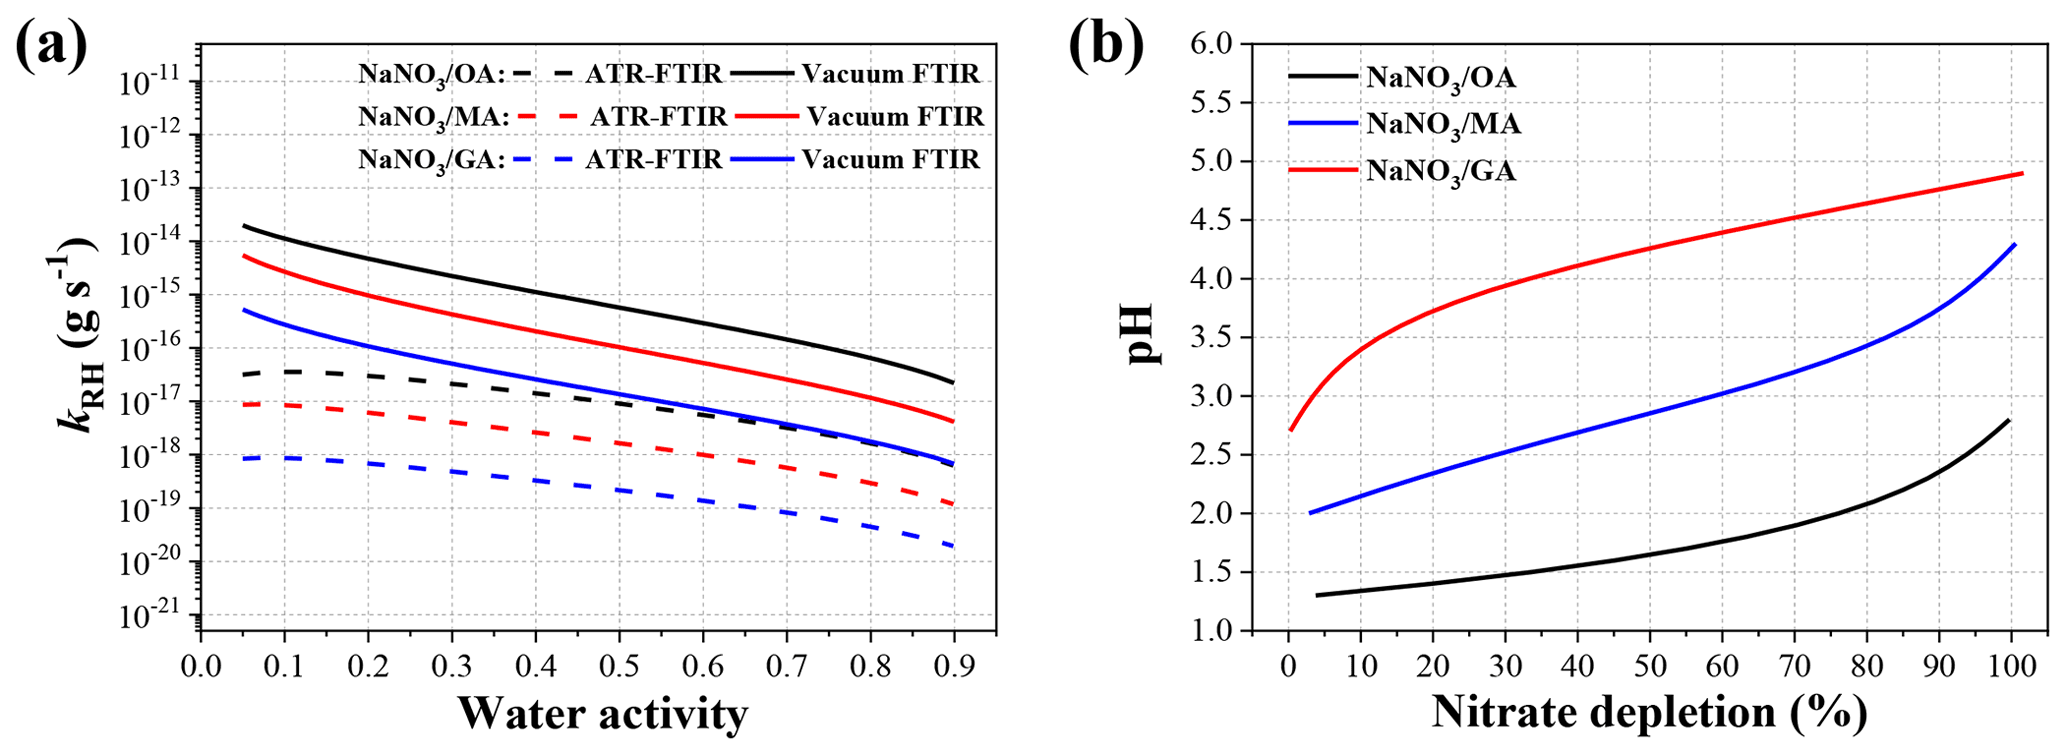
Figure 7(a) The kRH values for 1:1 mixed droplets of NaNO3 and DCAs as a function of water activity at 298 K in the two measurements, i.e. ATR-FTIR (dashed lines) and vacuum FTIR (solid lines). Note that the droplet radius is assumed to be ∼1.5 µm at aw=0.9. (b) The droplet pH of 1:1 NaNO3–DCA mixtures with initial concentration of 0.1 mol L−1 as a function of nitrate depletion fraction at 298 K.
The conversion of organic acids to organic acid salts and the internal heterogeneity can significantly alter the hygroscopic properties, acidity, optical properties, viscosity, and chemical reactivity of mixed aerosols (Ma et al., 2013, 2019b; Peng et al., 2016; Ghorai et al., 2014). However, the formation and precipitation of organic acid salts have not been considered by the current version of E-AIM. In this work, the hygroscopic behaviour and chemical composition modification of NaNO3–DCA mixtures during the RH cycle are investigated by vacuum FTIR and ATR-FTIR techniques. First, OA could react with nitrate, causing considerable nitrate depletion in both the measurements. Indeed, substantial metal oxalate complexes, which could not contribute to the CCN activity of aerosols, were frequently detected to be mixed in tropospheric aerosols (Furukawa and Takahashi, 2011). At the same time, the nitrate phase state would play a critical role in determining the occurrence and extent of nitrate depletion (e.g. amorphous NaNO3 solids were inert to liquid OA); at around 15 % RH, some moisture was absorbed to form semisolid NaNO3 accompanied by HNO3 liberation; the nitrate depletion extent and HNO3 release rate increased with increasing RH; during NaNO3 deliquescence, the displacement reaction proceeded due to more available NO ion formation. In addition, dried NaNO3 particles can be treated as a surrogate for a broad class of amorphous or semisolid species existing in tropospheric aerosols, which undergo homogeneous or heterogeneous reactions, causing secondary inorganic or organic aerosol formation. Therefore, the phase state effect may also be suitable for relevant aerosol reaction systems.
MA and GA exhibited weaker chemical reactivity to nitrate than OA in vacuum FTIR measurement. More importantly, almost no sodium salts of MA and GA were produced in ATR-FTIR measurements, differing from the vacuum FTIR observations. This discrepancy was confirmed to be mainly dominated by the faster HNO3 gas-phase diffusion arising from much lower ambient pressure in vacuum FTIR. Besides, the weaker acidity of MA and GA, lower HNO3 release rate at higher RH, and the occurrence of efflorescence transition of aqueous droplets also contributed to the unobserved nitrate depletion in ATR-FTIR measurements. These scenarios indicate that organic acids have a potential to deplete nitrate based on the comprehensive consideration of acidity, particle-phase state, droplet water activity, and HNO3 gas-phase diffusion (influenced by ambient pressure and so on). Our results reveal that faster HNO3 gas-phase diffusion, higher acidity of organic acids, lower droplet water activity, and the absence of efflorescence transition upon drying would be favourable for HNO3 partitioning into the gas phase. In atmospheric aerosols, insoluble materials such as mineral dust inclusions frequently induce the heterogeneous nucleation of aerosol droplets at relatively high RH, and thus displacement reactions between MA or GA and nitrates may rarely contribute to the nitrate depletion in aerosols. Indeed, in supermicrometer sea salt aerosols, the chloride depletion was mainly attributed to sulfate and nitrate, followed by methanesulfonate and oxalate, while malonate and glutarate played a minor role in Cl− loss (Kerminen et al., 1998).
Besides, this work will help us understand the discrepancies among previous observations of chloride–nitrate depletion. For instance, in the study of Ghorai et al. (2014), the submicrometer NaCl–MA(GA) particles deposited on Si3N4 windows and transmission electron microscope (TEM) grids tended to stay in a metastable state under dry conditions, leading to no or partial crystallization of mixtures, which facilitated the HCl liberation (Ghorai et al., 2014). Likewise, the micrometre-sized NaNO3–MA(GA) particles deposited on carbon-filmed grids and Si3N4 windows would exist in amorphous liquid or a viscous semisolid state after drying, causing significant HNO3 liberation (Wang and Laskin, 2014). In contrast, Ma et al. (2013) did not observe the chlorine depletion in mixed NaCl–MA(GA) particles placed in an aluminium sample holder and deposited on a Ge substrate, which might be attributed to the heterogeneous nucleation of mixed droplets in the fast-drying process. Also, the formation of Na2C2O4 was observed in internally mixed NaCl–OA particles due to the higher acidity of OA (Ma et al., 2013).
All data are available upon request from the corresponding authors.
The supplement related to this article is available online at: https://doi.org/10.5194/acp-22-10955-2022-supplement.
SM and YZ designed the experimental plan. SM and QL preformed the measurements. QL helped with data analysis. SM and YZ wrote the paper. All authors discussed and contributed to the manuscript.
The contact author has declared that none of the authors has any competing interests.
Publisher’s note: Copernicus Publications remains neutral with regard to jurisdictional claims in published maps and institutional affiliations.
The authors would like to thank the reviewers for their helpful comments and discussions.
This research has been supported by the National Natural Science Foundation of China (grant nos. 42127806 and 41875144).
This paper was edited by Daniel Knopf and reviewed by two anonymous referees.
Bilde, M., Svenningsson, B., Mønster, J., and Rosenørn, T.: Even-odd alternation of evaporation rates and vapor pressures of C3–C9 dicarboxylic acid aerosols, Environ. Sci. Technol., 37, 1371–1378, https://doi.org/10.1021/es0201810, 2003.
Bouzidi, H., Zuend, A., Ondráèek, J., Schwarz, J., and Ždímal, V.: Hygroscopic behavior of inorganic–organic aerosol systems including ammonium sulfate, dicarboxylic acids, and oligomer, Atmos. Environ., 229, 117481, https://doi.org/10.1016/j.atmosenv.2020.117481, 2020.
Braban, C. F.: Laboratory studies of model tropospheric aerosol phase transitions, Ph.D. thesis, University of Toronto, Toronto, 2004.
Braban, C. F. and Abbatt, J. P. D.: A study of the phase transition behavior of internally mixed ammonium sulfate – malonic acid aerosols, Atmos. Chem. Phys., 4, 1451–1459, https://doi.org/10.5194/acp-4-1451-2004, 2004.
Brown, S. S., Ryerson, T. B., Wollny, A. G., Brock, C. A., Peltier, R., Sullivan, A. P., Weber, R. J., Dube, W. P., Trainer, M., Meagher, J. F., Fehsenfeld, F. C., and Ravishankara, A. R.: Variability in nocturnal nitrogen oxide processing and its role in regional air quality, Science, 311, 67–70, https://doi.org/10.1126/science.1120120, 2006.
Cai, C., Stewart, D. J., Preston, T. C., Walker, J. S., Zhang, Y. H., and Reid, J. P.: A new approach to determine vapour pressures and hygroscopicities of aqueous aerosols containing semi-volatile organic compounds, Phys. Chem. Chem. Phys., 16, 3162–3172, https://doi.org/10.1039/c3cp54948h, 2014.
Carslaw, K. S., Lee, L. A., Reddington, C. L., Pringle, K. J., Rap, A., Forster, P. M., Mann, G. W., Spracklen, D. V., Woodhouse, M. T., Regayre, L. A., and Pierce, J. R.: Large contribution of natural aerosols to uncertainty in indirect forcing, Nature, 503, 67–71, https://doi.org/10.1038/nature12674, 2013.
Chen, Z., Liu, P., Liu, Y., and Zhang, Y. H.: Strong acids or bases displaced by weak acids or bases in aerosols: Reactions driven by the continuous partitioning of volatile products into the gas phase, Acc. Chem. Res., 54, 3667–3678, https://doi.org/10.1021/acs.accounts.1c00318, 2021.
Choi, M. Y. and Chan, C. K.: The effects of organic species on the hygroscopic behaviors of inorganic aerosols, Environ. Sci. Technol., 36, 2422–2428, https://doi.org/10.1021/es0113293, 2002.
Compernolle, S. and Müller, J.-F.: Henry's law constants of diacids and hydroxy polyacids: recommended values, Atmos. Chem. Phys., 14, 2699–2712, https://doi.org/10.5194/acp-14-2699-2014, 2014.
Durham, J. L. and Stockburger, L.: Nitric acid-air diffusion coefficient: Experimental determination, Atmos. Environ., 20, 559–563, https://doi.org/10.1016/0004-6981(86)90098-3, 1986.
Facchini, M. C., Mircea, M., Fuzzi, S., and Charlson, R. J.: Cloud albedo enhancement by surface-active organic solutes in growing droplets, Nature, 401, 257–259, https://doi.org/10.1038/45758, 1999.
Farmer, D. K., Cappa, C. D., and Kreidenweis, S. M.: Atmospheric processes and their controlling influence on cloud condensation nuclei activity, Chem. Rev., 115, 4199–4217, https://doi.org/10.1021/cr5006292, 2015.
Finlayson-Pitts, B. J. and Hemminger, J. C.: Physical chemistry of airborne sea salt particles and their components, J. Phys. Chem. A, 104, 11463–11477, https://doi.org/10.1021/jp002968n, 2000.
Freney, E., Sellegri, K., Chrit, M., Adachi, K., Brito, J., Waked, A., Borbon, A., Colomb, A., Dupuy, R., Pichon, J.-M., Bouvier, L., Delon, C., Jambert, C., Durand, P., Bourianne, T., Gaimoz, C., Triquet, S., Féron, A., Beekmann, M., Dulac, F., and Sartelet, K.: Aerosol composition and the contribution of SOA formation over Mediterranean forests, Atmos. Chem. Phys., 18, 7041–7056, https://doi.org/10.5194/acp-18-7041-2018, 2018.
Furukawa, T. and Takahashi, Y.: Oxalate metal complexes in aerosol particles: implications for the hygroscopicity of oxalate-containing particles, Atmos. Chem. Phys., 11, 4289–4301, https://doi.org/10.5194/acp-11-4289-2011, 2011.
Gao, X. Y., Zhang, Y. H., and Liu, Y.: A kinetics study of the heterogeneous reaction of n-butylamine with succinic acid using an ATR-FTIR flow reactor, Phys. Chem. Chem. Phys., 20, 15464–15472, https://doi.org/10.1039/C8CP01914B, 2018.
Ghorai, S., Wang, B. B., Tivanski, A., and Laskin, A.: Hygroscopic properties of internally mixed particles composed of NaCl and water-soluble organic acids, Environ. Sci. Technol., 48, 2234-2241, https://doi.org/10.1021/es404727u, 2014.
Gibson, E. R., Hudson, P. K., and Grassian, V. H.: Physicochemical properties of nitrate aerosols: Implications for the atmosphere, J. Phys. Chem. A, 110, 11785–11799, https://doi.org/10.1021/jp063821k, 2006.
Haynes, W. M. and Lide, D. R.: CRC handbook of chemistry and physics, CRC Press, Boca Raton, FL, ISBN 978-1-4398-5511-9, 2011.
Haywood, J. and Boucher, O.: Estimates of the direct and indirect radiative forcing due to tropospheric aerosols: A review, Rev. Geophys., 38, 513–543, https://doi.org/10.1029/1999RG000078, 2000.
He, X., Leng, C., Pang, S., and Zhang, Y.: Kinetics study of heterogeneous reactions of ozone with unsaturated fatty acid single droplets using micro-FTIR spectroscopy, RSC Adv., 7, 3204–3213, https://doi.org/10.1039/c6ra25255a, 2017.
Hind, A. R., Bhargava, S. K., Van Bronswijk, W., Grocott, S. C., and Eyer, S. L.: On the aqueous vibrational spectra of alkali metal oxalates, Appl. Spectrosc., 52, 683–691, https://doi.org/10.1366/0003702981944355, 1998.
Hodas, N., Zuend, A., Mui, W., Flagan, R. C., and Seinfeld, J. H.: Influence of particle-phase state on the hygroscopic behavior of mixed organic–inorganic aerosols, Atmos. Chem. Phys., 15, 5027–5045, https://doi.org/10.5194/acp-15-5027-2015, 2015.
Hodas, N., Zuend, A., Schilling, K., Berkemeier, T., Shiraiwa, M., Flagan, R. C., and Seinfeld, J. H.: Discontinuities in hygroscopic growth below and above water saturation for laboratory surrogates of oligomers in organic atmospheric aerosols, Atmos. Chem. Phys., 16, 12767–12792, https://doi.org/10.5194/acp-16-12767-2016, 2016.
Hoffman, R. C., Laskin, A., and Finlayson-Pitts, B. J.: Sodium nitrate particles: physical and chemical properties during hydration and dehydration, and implications for aged sea salt aerosols, J. Aerosol Sci., 35, 869–887, https://doi.org/10.1016/j.jaerosci.2004.02.003, 2004.
Hung, H.-M., Katrib, Y., and Martin, S. T.: Products and mechanisms of the reaction of oleic acid with ozone and nitrate radical, J. Phys. Chem. A, 109, 4517–4530, https://doi.org/10.1021/jp0500900, 2005.
Hung, H.-M. and Ariya, P.: Oxidation of oleic acid and oleic acid/sodium chloride(aq) mixture droplets with ozone: changes of hygroscopicity and role of secondary reactions, J. Phys. Chem. A, 111, 620–632, https://doi.org/10.1021/jp0654563, 2007.
Jing, B., Tong, S., Liu, Q., Li, K., Wang, W., Zhang, Y., and Ge, M.: Hygroscopic behavior of multicomponent organic aerosols and their internal mixtures with ammonium sulfate, Atmos. Chem. Phys., 16, 4101–4118, https://doi.org/10.5194/acp-16-4101-2016, 2016.
Jing, B., Wang, Z., Tan, F., Guo, Y., Tong, S., Wang, W., Zhang, Y., and Ge, M.: Hygroscopic behavior of atmospheric aerosols containing nitrate salts and water-soluble organic acids, Atmos. Chem. Phys., 18, 5115–5127, https://doi.org/10.5194/acp-18-5115-2018, 2018.
Kerminen, V.-M., Teinilä, K., Hillamo, R., and Pakkanen, T.: Substitution of chloride in sea-salt particles by inorganic and organic anions, J. Aerosol Sci., 29, 929–942, https://doi.org/10.1016/S0021-8502(98)00002-0, 1998.
Koop, T., Bookhold, J., Shiraiwa, M., and Pöschl, U.: Glass transition and phase state of organic compounds: dependency on molecular properties and implications for secondary organic aerosols in the atmosphere, Phys. Chem. Chem. Phys., 13, 19238–19255, https://doi.org/10.1039/c1cp22617g, 2011.
Krieger, U. K., Marcolli, C., and Reid, J. P.: Exploring the complexity of aerosol particle properties and processes using single particle techniques, Chem. Soc. Rev., 41, 6631–6662, https://doi.org/10.1039/c2cs35082c, 2012.
Kuwata, M. and Martin, S. T.: Phase of atmospheric secondary organic material affects its reactivity, P. Natl. Acad. Sci. USA., 109, 17354–17359, https://doi.org/10.1073/pnas.1209071109, 2012.
Lamb, D., Moyle, A. M., and Brune, W. H.: The environmental control of individual aqueous particles in a cubic electrodynamic levitation system, Aerosol Sci. Technol., 24, 263–278, https://doi.org/10.1080/02786829608965371, 1996.
Laskin, A., Cowin, J. P., and Iedema, M. J.: Analysis of individual environmental particles using modern methods of electron microscopy and X-ray microanalysis, J. Electron Spectrosc. Relat. Phenom., 150, 260–274, https://doi.org/10.1016/j.elspec.2005.06.008, 2006.
Laskin, A., Moffet, R. C., Gilles, M. K., Fast, J. D., Zaveri, R. A., Wang, B. B., Nigge, P., and Shutthanandan, J.: Tropospheric chemistry of internally mixed sea salt and organic particles: Surprising reactivity of NaCl with weak organic acids, J. Geophys. Res.-Atmos., 117, D15302, https://doi.org/10.1029/2012jd017743, 2012.
Laskina, O., Morris, H. S., Grandquist, J. R., Qin, Z., Stone, E. A., Tivanski, A. V., and Grassian, V. H.: Size matters in the water uptake and hygroscopic growth of atmospherically relevant multicomponent aerosol particles, J. Phys. Chem. A, 119, 4489–4497, https://doi.org/10.1021/jp510268p, 2015.
Leng, C. B., Pang, S. F., Zhang, Y., Cai, C., Liu, Y., and Zhang, Y. H.: Vacuum FTIR observation on the dynamic hygroscopicity of aerosols under pulsed relative humidity, Environ. Sci. Technol., 49, 9107–9115, https://doi.org/10.1021/acs.est.5b01218, 2015.
Li, X., Gupta, D., Lee, J., Park, G., and Ro, C.-U.: Real-time investigation of chemical compositions and hygroscopic properties of aerosols generated from NaCl and malonic acid mixture solutions using in situ Raman microspectrometry, Environ. Sci. Technol., 51, 263–270, https://doi.org/10.1021/acs.est.6b04356, 2017.
Ling, T. Y. and Chan, C. K.: Partial crystallization and deliquescence of particles containing ammonium sulfate and dicarboxylic acids, J. Geophys. Res.-Atmos., 113, D14205, https://doi.org/10.1029/2008jd009779, 2008.
Liu, Y., Yang, Z. W., Desyaterik, Y., Gassman, P. L., Wang, H., and Laskin, A.: Hygroscopic behavior of substrate-deposited particles studied by micro-FT-IR spectroscopy and complementary methods of particle analysis, Anal. Chem., 80, 633–642, https://doi.org/10.1021/ac701638r, 2008.
Ma, Q. X. and He, H.: Synergistic effect in the humidifying process of atmospheric relevant calcium nitrate, calcite and oxalic acid mixtures, Atmos. Environ., 50, 97–102, https://doi.org/10.1016/j.atmosenv.2011.12.057, 2012.
Ma, Q. X., Ma, J. Z., Liu, C., Lai, C. Y., and He, H.: Laboratory study on the hygroscopic behavior of external and internal C2–C4 dicarboxylic acid–NaCl mixtures, Environ. Sci. Technol., 47, 10381–10388, https://doi.org/10.1021/es4023267, 2013.
Ma, Q. X., Liu, C., Ma, J. Z., Chu, B. W., and He, H.: A laboratory study on the hygroscopic behavior of H2C2O4-containing mixed particles, Atmos. Environ., 200, 34–39, https://doi.org/10.1016/j.atmosenv.2018.11.056, 2019a.
Ma, Q. X., Zhong, C., Liu, C., Liu, J., Ma, J. Z., Wu, L. Y., and He, H.: A comprehensive study about the hygroscopic behavior of mixtures of oxalic acid and nitrate salts: Implication for the occurrence of atmospheric metal oxalate complex, ACS Earth Space Chem., 3, 1216–1225, https://doi.org/10.1021/acsearthspacechem.9b00077, 2019b.
Ma, S. S., Yang, W., Zheng, C. M., Pang, S. F., and Zhang, Y. H.: Subsecond measurements on aerosols: From hygroscopic growth factors to efflorescence kinetics, Atmos. Environ., 210, 177–185, https://doi.org/10.1016/j.atmosenv.2019.04.049, 2019c.
Ma, S., Chen, Z., Pang, S., and Zhang, Y.: Observations on hygroscopic growth and phase transitions of mixed 1, 2, 6-hexanetriol(NH4)2SO4 particles: investigation of the liquid–liquid phase separation (LLPS) dynamic process and mechanism and secondary LLPS during the dehumidification, Atmos. Chem. Phys., 21, 9705–9717, https://doi.org/10.5194/acp-21-9705-2021, 2021a.
Ma, S. S., Pang, S. F., Li, J., and Zhang, Y. H.: A review of efflorescence kinetics studies on atmospherically relevant particles, Chemosphere, 277, 130320, https://doi.org/10.1016/j.chemosphere.2021.130320, 2021b.
Marcolli, C., Luo, B., and Peter, T.: Mixing of the organic aerosol fractions: Liquids as the thermodynamically stable phases, J. Phys. Chem. A, 108, 2216–2224, https://doi.org/10.1021/jp036080l, 2004.
McFiggans, G., Artaxo, P., Baltensperger, U., Coe, H., Facchini, M. C., Feingold, G., Fuzzi, S., Gysel, M., Laaksonen, A., Lohmann, U., Mentel, T. F., Murphy, D. M., O'Dowd, C. D., Snider, J. R., and Weingartner, E.: The effect of physical and chemical aerosol properties on warm cloud droplet activation, Atmos. Chem. Phys., 6, 2593–2649, https://doi.org/10.5194/acp-6-2593-2006, 2006.
Mikhailov, E., Vlasenko, S., Martin, S. T., Koop, T., and Pöschl, U.: Amorphous and crystalline aerosol particles interacting with water vapor: conceptual framework and experimental evidence for restructuring, phase transitions and kinetic limitations, Atmos. Chem. Phys., 9, 9491–9522, https://doi.org/10.5194/acp-9-9491-2009, 2009.
Ovadnevaite, J., Zuend, A., Laaksonen, A., Sanchez, K. J., Roberts, G., Ceburnis, D., Decesari, S., Rinaldi, M., Hodas, N., Facchini, M. C., Seinfeld, J. H., and O' Dowd, C.: Surface tension prevails over solute effect in organic-influenced cloud droplet activation, Nature, 546, 637–641, https://doi.org/10.1038/nature22806, 2017.
Parsons, M. T., Knopf, D. A., and Bertram, A. K.: Deliquescence and crystallization of ammonium sulfate particles internally mixed with water-soluble organic compounds, J. Phys. Chem. A, 108, 11600–11608, https://doi.org/10.1021/jp0462862, 2004.
Peng, C. G., Chan, M. N., and Chan, C. K.: The hygroscopic properties of dicarboxylic and multifunctional acids: Measurements and UNIFAC predictions, Environ. Sci. Technol., 35, 4495–4501, https://doi.org/10.1021/es0107531, 2001.
Peng, C., Jing, B., Guo, Y. C., Zhang, Y. H., and Ge, M. F.: Hygroscopic behavior of multicomponent aerosols involving NaCl and dicarboxylic acids, J. Phys. Chem. A, 120, 1029–1038, https://doi.org/10.1021/acs.jpca.5b09373, 2016.
Peng, C. G. and Chan, C. K.: The water cycles of water-soluble organic salts of atmospheric importance, Atmos. Environ., 35, 1183–1192, https://doi.org/10.1016/S1352-2310(00)00426-X, 2001.
Pope, F. D., Dennis-Smither, B. J., Griffiths, P. T., Clegg, S. L., and Cox, R. A.: Studies of single aerosol particles containing malonic acid, glutaric acid, and their mixtures with sodium chloride. I. Hygroscopic growth, J. Phys. Chem. A, 114, 5335–5341, https://doi.org/10.1021/jp100059k, 2010.
Pöschl, U.: Atmospheric aerosols: composition, transformation, climate and health effects, Angew. Chem., Int. Ed., 44, 7520–7540, https://doi.org/10.1002/anie.200501122, 2006.
Ramanathan, V., Crutzen, P. J., Kiehl, J. T., and Rosenfeld, D.: Aerosols, climate, and the hydrological cycle, Science, 294, 2119–2124, https://doi.org/10.1126/science.1064034, 2001.
Ray, A. K., Davis, E. J., and Ravindran, P.: Determination of ultra-low vapor pressures by submicron droplet evaporation, J. Chem. Phys., 71, 582–587, https://doi.org/10.1063/1.438408, 1979.
Reid, R. C., Prausnitz, J. M., and Poling, B. E.: The properties of gases and liquids, McGraw-Hill, New York, ISBN 978-0-07-051799-8, 1987.
Ren, H. M., Cai, C., Leng, C. B., Pang, S. F., and Zhang, Y. H.: Nucleation kinetics in mixed NaNO3 glycerol droplets investigated with the FTIR-ATR technique, J. Phys. Chem. B, 120, 2913–2920, https://doi.org/10.1021/acs.jpcb.5b12442, 2016.
Rosenberger, T., Münzer, A., Kiesler, D., Wiggers, H., and Kruis, F. E.: Ejector-based sampling from low-pressure aerosol reactors, J. Aerosol Sci., 123, 105–115, https://doi.org/10.1016/j.jaerosci.2018.06.003, 2018.
Schilling, C. and Winterer, M.: Preserving particle characteristics at increasing production rate of ZnO nanoparticles by chemical vapor synthesis, Chem. Vap. Deposition, 20, 138–145, https://doi.org/10.1002/cvde.201307094, 2014.
Shao, X., Zhang, Y., Pang, S. F., and Zhang, Y. H.: Vacuum FTIR observation on hygroscopic properties and phase transition of malonic acid aerosols, Chem. Phys., 483–484, 7–11, https://doi.org/10.1016/j.chemphys.2016.11.001, 2017.
Shao, X., Wu, F. M., Yang, H., Pang, S. F., and Zhang, Y. H.: Observing HNO3 release dependent upon metal complexes in malonic acid/nitrate droplets, Spectrochim. Acta A, 201, 399–404, https://doi.org/10.1016/j.saa.2018.05.026, 2018.
Shiraiwa, M., Li, Y., Tsimpidi, A. P., Karydis, V. A., Berkemeier, T., Pandis, S. N., Lelieveld, J., Koop, T., and Pöschl, U.: Global distribution of particle phase state in atmospheric secondary organic aerosols, Nat. Commun., 8, 15002, https://doi.org/10.1038/ncomms15002, 2017.
Song, C. H. and Carmichael, G. R.: Gas-particle partitioning of nitric acid modulated by alkaline aerosol, J. Atmos. Chem., 40, 1-22, https://doi.org/10.1023/A:1010657929716, 2001.
Soonsin, V., Zardini, A. A., Marcolli, C., Zuend, A., and Krieger, U. K.: The vapor pressures and activities of dicarboxylic acids reconsidered: the impact of the physical state of the aerosol, Atmos. Chem. Phys., 10, 11753–11767, https://doi.org/10.5194/acp-10-11753-2010, 2010.
Stevens, B. and Feingold, G.: Untangling aerosol effects on clouds and precipitation in a buffered system, Nature, 461, 607–613, https://doi.org/10.1038/nature08281, 2009.
Sullivan, R. C. and Prather, K. A.: Investigations of the diurnal cycle and mixing state of oxalic acid in individual particles in Asian aerosol outflow, Environ. Sci. Technol., 41, 8062–8069, https://doi.org/10.1021/es071134g, 2007.
Tang, I. N. and Fung, K. H.: Hydration and Raman scattering studies of levitated microparticles: Ba(NO3)2, Sr(NO3)2, and Ca(NO3)2, J. Chem. Phys., 106, 1653–1660, https://doi.org/10.1063/1.473318, 1997.
Tang, M., Chan, C. K., Li, Y. J., Su, H., Ma, Q., Wu, Z., Zhang, G., Wang, Z., Ge, M., Hu, M., He, H., and Wang, X.: A review of experimental techniques for aerosol hygroscopicity studies, Atmos. Chem. Phys., 19, 12631–12686, https://doi.org/10.5194/acp-19-12631-2019, 2019.
Tervahattu, H., Hartonen, K., Kerminen, V.-M., Kupiainen, K., Aarnio, P., Koskentalo, T., Tuck, A. F., and Vaida, V.: New evidence of an organic layer on marine aerosols, J. Geophys. Res.-Atmos., 107, 4053, https://doi.org/10.1029/2000JD000282, 2002.
Villepin, J. de and Novak, A.: Vibrational spectra of and isotope effect in hydrogen bonded potassium hydrogen oxalate, Spectrosc. Lett., 4, 1–8, https://doi.org/10.1080/00387017108078634, 1971.
Virtanen, A., Joutsensaari, J., Koop, T., Kannosto, J., Yli-Pirila, P., Leskinen, J., Makela, J. M., Holopainen, J. K., Pöschl, U., Kulmala, M., Worsnop, D. R., and Laaksonen, A.: An amorphous solid state of biogenic secondary organic aerosol particles, Nature, 467, 824–827, https://doi.org/10.1038/nature09455, 2010.
Wang, B. B. and Laskin, A.: Reactions between water-soluble organic acids and nitrates in atmospheric aerosols: Recycling of nitric acid and formation of organic salts, J. Geophys. Res.-Atmos., 119, 3335–3351, https://doi.org/10.1002/2013jd021169, 2014.
Wang, G., Xie, M., Hu, S., Gao, S., Tachibana, E., and Kawamura, K.: Dicarboxylic acids, metals and isotopic compositions of C and N in atmospheric aerosols from inland China: implications for dust and coal burning emission and secondary aerosol formation, Atmos. Chem. Phys., 10, 6087–6096, https://doi.org/10.5194/acp-10-6087-2010, 2010.
Wang, N., Jing, B., Wang, P., Wang, Z., Li, J. R., Pang, S. F., Zhang, Y. H., and Ge, M. F.: Hygroscopicity and compositional evolution of atmospheric aerosols containing water-soluble carboxylic acid salts and ammonium sulfate: Influence of ammonium depletion, Environ. Sci. Technol., 53, 6225–6234, https://doi.org/10.1021/acs.est.8b07052, 2019.
Wang, X., Jing, B., Tan, F., Ma, J., Zhang, Y., and Ge, M.: Hygroscopic behavior and chemical composition evolution of internally mixed aerosols composed of oxalic acid and ammonium sulfate, Atmos. Chem. Phys., 17, 12797–12812, https://doi.org/10.5194/acp-17-12797-2017, 2017.
Wu, F. M., Wang, N., Pang, S. F., and Zhang, Y. H.: Hygroscopic behavior and fractional crystallization of mixed (NH4)2SO4 glutaric acid aerosols by vacuum FTIR, Spectrochim. Acta A, 208, 255–261, https://doi.org/10.1016/j.saa.2018.10.010, 2019a.
Wu, F. M., Wang, X. W., Pang, S. F., and Zhang, Y. H.: Measuring hygroscopicity of internally mixed NaNO3 and glutaric acid particles by vacuum FTIR, Spectrochim. Acta A, 219, 104–109, https://doi.org/10.1016/j.saa.2019.04.034, 2019b.
Wu, Z. J., Nowak, A., Poulain, L., Herrmann, H., and Wiedensohler, A.: Hygroscopic behavior of atmospherically relevant water-soluble carboxylic salts and their influence on the water uptake of ammonium sulfate, Atmos. Chem. Phys., 11, 12617–12626, https://doi.org/10.5194/acp-11-12617-2011, 2011.
Yeung, M. C., Ling, T. Y., and Chan, C. K.: Effects of the polymorphic transformation of glutaric acid particles on their deliquescence and hygroscopic properties, J. Phys. Chem. A, 114, 898–903, https://doi.org/10.1021/jp908250v, 2010.
Zhang, Q. N., Zhang, Y., Cai, C., Guo, Y. C., Reid, J. P., and Zhang, Y. H.: In situ observation on the dynamic process of evaporation and crystallization of sodium nitrate droplets on a ZnSe substrate by FTIR-ATR, J. Phys. Chem. A, 118, 2728–2737, https://doi.org/10.1021/jp412073c, 2014.
Zhang, Y., Cai, C., Pang, S. F., Reid, J. P., and Zhang, Y. H.: A rapid scan vacuum FTIR method for determining diffusion coefficients in viscous and glassy aerosol particles, Phys. Chem. Chem. Phys., 19, 29177–29186, https://doi.org/10.1039/c7cp04473a, 2017.
Zhao, H., Liu, X. F., and Tse, S. D.: Effects of pressure and precursor loading in the flame synthesis of titania nanoparticles, J. Aerosol Sci., 40, 919–937, https://doi.org/10.1016/j.jaerosci.2009.07.004, 2009.