the Creative Commons Attribution 4.0 License.
the Creative Commons Attribution 4.0 License.
 | 22 Aug 2022
Impact of urban heat island on inorganic aerosol in the lower free troposphere: a case study in Hangzhou, China
Hanqing Kang
Bin Zhu
Gerrit de Leeuw
Bu Yu
Ronald J. van der A
Wen Lu
Urban heat island (UHI) and urban air pollution are two major environmental problems faced by many metropolises. The UHI affects air pollution by changing the local circulation and the chemical reaction environment, e.g. air temperature and relative humidity. In this study, the WRF-CMAQ (Weather Research and Forecasting Community Multiscale Air Quality) model was used to investigate the impact of an UHI on the vertical distribution of aerosol particles, especially secondary inorganic aerosol (SIA), taking the strong UHI in Hangzhou, China, as an example. The results show that during the day with the strongest UHI case of the 8 d simulation, the UHI effect resulted in a decrease in the PM2.5 concentrations in the boundary layer (BL) by about 33 %, accompanied by an increase in the lower free troposphere (LFT) by about 19 %. This is mostly attributed to the UHI circulation (UHIC) effect, which accounted for 91 % of the UHI-induced variations in PM2.5, rather than the UHI temperature or humidity effects, which contributed only 5 % and 4 %, respectively. The UHIC effect plays a dominant role, ranging from 72 % to 93 %, in UHI-induced PM2.5 variation in all eight UHI cases. The UHIC not only directly transports aerosol particles from ground level to the LFT but also redistributes aerosol precursors. During the strongest UHI case, about 80 % of the UHIC-induced increase in the aerosol particles in the LFT is due to direct transport of aerosol particles, whereas the other 20 % is due to secondary aerosol formation resulting from the transport of aerosol precursor gases. Of this 20 %, 91 % is contributed by SIA, especially ammonium nitrate aerosol formed from ammonia and nitric acid. In the atmosphere, ammonium nitrate is in equilibrium with ammonia and nitric acid, and the equilibrium depends on the ambient temperature. In the lower urban BL, the temperature is higher than in the LFT, and the ammonium nitrate equilibrium in the lower BL is more toward the gas phase than in the LFT; when these gases are transported by the UHIC into the colder LFT, the equilibrium shifts to the aerosol phase. Hence, the UHIC changes the vertical distribution of SIA, which may have potential implications on the radiation budget, cloud formation, and precipitation in the urban and surrounding areas.
- Article
(6514 KB) - Full-text XML
-
Supplement
(1141 KB) - BibTeX
- EndNote


With the fast economic development, China has experienced rapid industrialization and urbanization in the past decades. The urbanization process has replaced natural land surface with artificial constructions. The radiative, aerodynamic, thermal, and moisture properties of these urban constructions are radically different from the natural landscape. Lower albedo, larger energy storage, higher Bowen ratio, and the release of anthropogenic heat in urban areas lead to the urban heat island (UHI) phenomenon (Rotach et al., 2005; Oke et al., 2017). Meanwhile, the increase in fossil fuel consumption and the rapid growth of the population have led to a sharp increase in anthropogenic emissions in urban areas, resulting in serious urban air pollution problems such as haze and photochemical smog (Zhao et al., 2017; Wang et al., 2019; Gao et al., 2017). Crutzen (2004) pointed out that the UHI and air pollution are far from being independent phenomena but rather co-exist.
Urbanization affects local meteorological conditions, which in turn influence the distribution and formation of air pollutants. UHI leads to strong thermal convection and diffusion, which promote the vertical transport of heat, water vapor, and atmospheric pollutants from ground level to the upper atmosphere, and subsequently affects cloud formation, precipitation, and chemical reactions (Kang et al., 2014; Li et al., 2019; Zhu et al., 2015; Zhong et al., 2015). The vertical transport of water vapor caused by urban thermal convection is the source of water for cloud formation and precipitation (Baik et al., 2006), resulting in the increase in precipitation in the city and downwind (Changnon, 1979; Wan et al., 2013; Xie et al., 2016). Variations in cloud cover and precipitation will inevitably impact the liquid-phase chemistry of aerosol and the wet removal of air pollutants.
The UHI effect also influences chemical processes in the urban atmosphere. The increase in air temperature accelerates certain chemical cycles in the atmosphere, most of which lead to enhanced ground-level ozone production (Narumi et al., 2009; Zhan and Xie, 2022). The UHI circulation (UHIC) can also affect chemical reactions by changing the distribution of air pollutants and their precursors. Zhu et al. (2015) indicated that the UHIC transports NOx and volatile organic compounds (VOCs), the precursors of O3, from ground level to higher altitudes, leading to a significant increase in the photochemical production of O3 there. The impact of the UHI effect on PM2.5 is very complicated. Liu et al. (2016) suggested that the UHIC and high surface roughness in urban areas reduce the horizontal wind speed at ground level and hence suppress the outflow of air pollutants, resulting in the increase in PM2.5. In contrast, other studies indicated that UHI reduces ground-level aerosol concentrations by enhancing turbulent mixing in a deeper urban boundary layer (BL) (Zhu et al., 2017; Li et al., 2018; Liao et al., 2015). Several studies have investigated the impact of UHI on aerosol, but few of them focused on how UHI affects the secondary formation of inorganic aerosols, such as sulfate, nitrate, and ammonium. These scattering aerosols can attenuate incident solar radiation, leading to an overall cooling of the surface and inhibiting the development of the PBL (planetary boundary layer; Li et al., 2017; Ma et al., 2020). In addition, sulfate and nitrate aerosol particles are very hygroscopic and thus act as cloud condensation nuclei in a high relative humidity environment (Tao et al., 2012). Therefore, the vertical distribution and secondary formation of inorganic aerosol in the urban environment play an important role in the local radiation budget, cloud formation, and precipitation.
In this study, a strong UHI case that occurred in Hangzhou, China, on 18 September 2017 was chosen to investigate the impact of the UHI effect on the distribution and formation of PM2.5 and its inorganic components. We conducted four simulations using the regional meteorological model WRF (Weather Research and Forecasting) coupled with the chemical transport model CMAQ (Community Multiscale Air Quality; WRF-CMAQ) to simulate the UHI effect and quantify the impact of UHI-induced variations in circulation, temperature, and humidity on secondary inorganic aerosol (SIA). This paper is organized as follows. Section 2 describes the model configuration, experiment design, and verification. The UHI effect and its impact on PM2.5 and its inorganic components are presented in Sect. 3 and the conclusions in Sect. 4.
2.1 Model description and configuration
The WRF model version 3.9.1 coupled with a multilayer building energy parameterization (BEP) urban canopy model was employed to simulate the UHI effect and provide the meteorological fields for the chemical transport model. The model was set up with three nested domains (Fig. 1a) with horizontal grid numbers (grid spacing) of 300 × 300 (9 km), 240 × 240 (3 km), and 140 × 140 (1 km). The innermost domain was centered on the city of Hangzhou (Fig. 1b), the Yangtze River Delta's second largest megacity, located by Hangzhou Bay and with a population of over 12 million. The model was divided vertically into 37 sigma levels from the surface to 50 hPa, the lowest 20 of which are below 2 km to better resolve the processes within the BL, and the five lowest layers, each with a thickness of about 10 m, are within the urban canopy. The parameterization used in the WRF simulation is described in Table S1 in the Supplement. A 10 d simulation (from 00:00 UTC on 10 September to 00:00 UTC on 20 September 2017) was conducted with the initial conditions (ICONs) and the outermost boundary conditions (BCONs) from the National Center for Environmental Prediction's 1∘ grid spacing operational Global Forecast System final analyses. The fine-resolution (30 s) Moderate Resolution Imaging Spectroradiometer (MODIS) 20-category land use data were used to represent the urban land type in the innermost domain. Two experiments were designed to investigate the UHI effect of the city of Hangzhou. The first, known as CTL simulation, used MODIS land use data as the default surface (with the city of Hangzhou) description for the control experiment; the second, NUB simulation, was a sensitivity experiment, in which the urban land use of the city of Hangzhou was replaced by cropland. By comparison of the result from the two experiments, the UHI effects of the city of Hangzhou can be identified. The 2 m air temperature difference between the two experiments (CTL − NUB) reflects the UHI intensity (UHII), the humidity difference indicates the intensity of urban dry island, and the difference in wind fields reveals the UHIC.
The CMAQ model version 5.0.2 was applied to simulate concentrations of gaseous and particulate air pollutants with the same grid settings as the WRF model. The output of the two WRF experiments (CTL and NUB) provided the meteorological inputs for the CMAQ simulations. The CMAQ simulations cover the same time period as the WRF simulations with the first 2 d used as spin-up time. The ICONs and BCONs for the outermost domain of the CMAQ simulations were derived from the Model for Ozone and Related Chemical Tracers version 4 (MOZART-4) (Emmons et al., 2010). The BCONs for the CMAQ nested domains were extracted from the immediate concentration files of their parent domains. The monthly Multi-resolution Emission Inventory for China (MEIC; http://www.meicmodel.org/, last access: 20 July 2021) with the reference year of 2017 was used for anthropogenic emissions except for Hangzhou. The anthropogenic emissions in Hangzhou were derived from the Hangzhou Municipal Ecology and Environment Bureau's anthropogenic emission survey in 2016 with a horizontal grid space of 1 km × 1 km. Biogenic emissions were generated from the Model for Emissions of Gases and Aerosols from Nature (MEGAN) version 2.1 (Guenther et al., 2012). Sea salt and dust emissions were calculated online. The carbon bond 5 version (CB05) and the sixth generation of CMAQ aerosol module (AERO6) mechanisms were chosen for gas-phase chemistry and aerosols, respectively.
The process analysis technique (Gipson, 1999), which can determine the contributions of the physical and chemical processes to atmospheric species, was implemented in the CMAQ simulations. The processes discussed in this study include horizontal advection (HADV), vertical advection (ZADV), vertical diffusion (VDIF), and aerosol (AERO) processes.
It should be noted that all simulation experiments use the same emission inventory. Therefore, the impact of the UHI on aerosol properties can be derived from the difference between the CTL and NUB CMAQ simulations. In order to identify the impact of the UHI-induced changes in temperature, humidity, and circulation (the UHIC is caused by the increased temperature in the urban area, but temperature and temperature-induced circulation affect air pollutants in different ways) on the aerosol properties, two additional sensitivity experiments were designed. One is the TMP simulation, in which the air temperature used in the aerosol module where the SIA formation was calculated, was derived from the NUB simulation, and other parameters were kept the same as in the CTL simulation. The other one is the T&H simulation, in which the air temperature and specific humidity were derived from the NUB simulation, while other parameters were kept the same as in the CTL simulation. The difference between CTL and TMP simulations indicates the UHI temperature effect on aerosol. By comparing the CTL and T&H simulations, the overall effect from temperature and humidity can be derived. Hence the humidity and circulation effects can be separated. Details of the experimental designs are provided in Table 1.
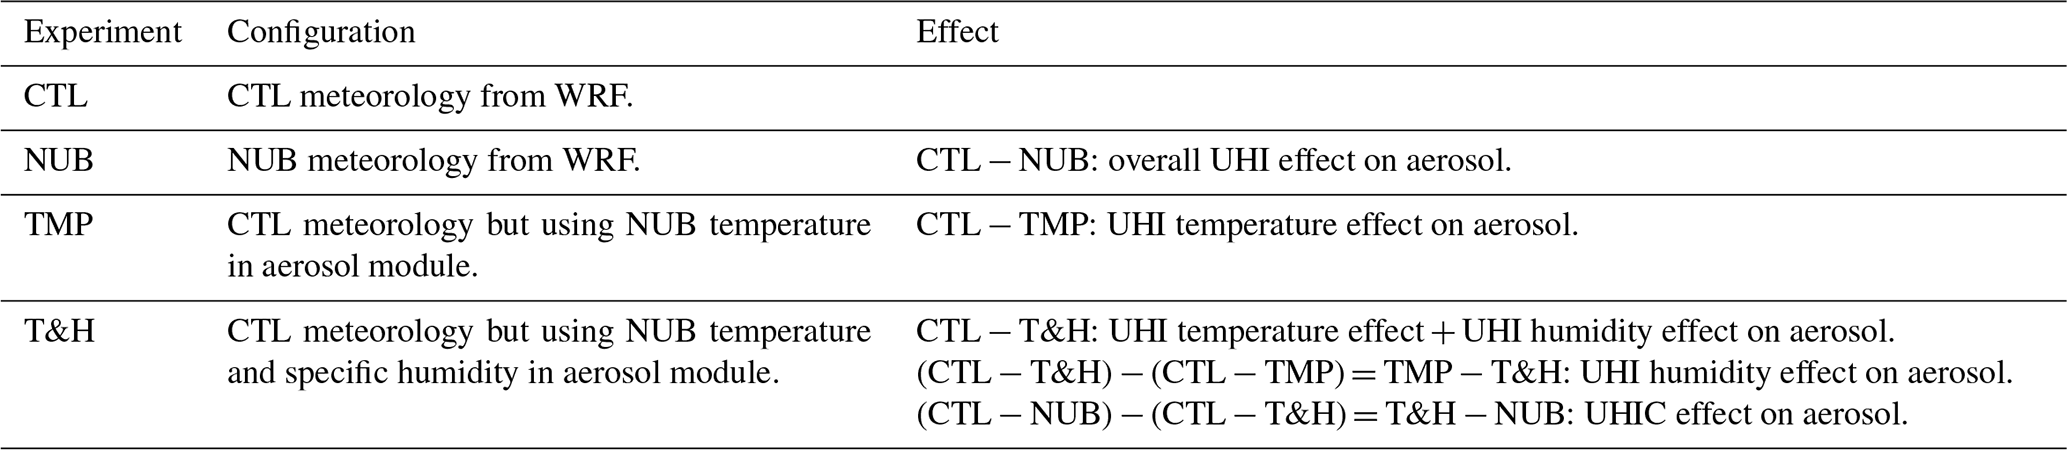

Figure 1The three nested modeling domains (a) and land use categories over the innermost domain (b). The horizontal spacings for domain d01, d02, and d03 are 9, 3, and 1 km, respectively. The line AB in (b) denotes the location of the vertical cross section shown in Figs. 3 and 4. The yellow filled circles represent locations of the 10 PM2.5 monitoring sites, and the white stars are the locations of the 10 meteorological observation sites.
2.2 Model evaluation
The model performance for the meteorological parameters (air temperature, relative humidity, and wind speed) and PM2.5 concentrations in Hangzhou was extensively evaluated on an hourly scale, using surface measurements at 10 meteorological observation sites (white stars in Fig. 1b) and 10 PM2.5 monitoring sites (yellow filled circles in Fig. 1b) released by the Hangzhou Meteorological Bureau (HMB) and the China National Environmental Monitoring Center (CNEMC), respectively. Statistical metrics including the correlation coefficient, normalized mean bias (NMB), normalized mean error (NME), index of agreement (IOA), mean fractional bias (MFB), and mean fractional error (MFE) were calculated to compare the model simulations with observations. The NMB, NME, IOA, MFB, and MFE were calculated as follows:
where Mi are the hourly model simulations, Oi are the hourly observations, and N denotes the number of data pairs.
The time series of hourly ground-level air temperature, relative humidity, wind speed, and PM2.5 concentrations from both the CTL simulation and observations at the 10 HMB sites and the 10 CNEMC sites are compared in Fig. 2. The CTL simulation captures the diurnal variations and magnitude of meteorological parameters and PM2.5 well at most of the sites. The correlation coefficient, NMB, and NME between observations and CTL simulations at the 10 meteorological observation sites and the 10 PM2.5 monitoring sites are shown in Fig. 3. The correlation coefficients for air temperature and relative humidity are around 0.9 at all 10 sites, and for wind speed they are between 0.6 and 0.8 (Fig. 3a). The NMBs for air temperature and relative humidity at all sites are within ±10 %, and for wind speed they are within ±20 %. The NMEs for air temperature, relative humidity, and wind speed at all 10 sites are <10 %, <20 %, and <50 %, respectively (Fig. 3a). The correlation coefficients for PM2.5 are >0.6 except for one site (Fig. 3b). The NMBs for PM2.5 at all sites are within ±30 %, and all NMEs are <60 % (Fig. 3b). The IOA, MFB, and MFE for both meteorological parameters (Fig. S1a) and PM2.5 (Fig. S1b) at each site show a pattern similar to that for the correlation coefficients, NMB, and NME, respectively. The average correlation coefficient, NMB, NME, IOA, MFB, and MFE for PM2.5 at the 10 sites are 0.68, 0.5 %, 44.7 %, 0.78, −12 %, and 45.4 %, respectively. In general, the WRF-CMAQ model performed well in the simulation of both meteorological parameters and PM2.5 concentrations.
To evaluate the impact of urban land surface on ground-level PM2.5 simulation, the NUB simulations were also compared with the observations. The results from these comparisons show that if the Hangzhou urban surface is replaced by cropland, the ground-level PM2.5 concentration would be larger by approximately 60 % (NMB for the NUB experiment is 60 %), and simulation error would increase by approximately 30 % (NME for the NUB experiment is 74 %). These results suggest that the urban land surface and UHI effect exert an important impact on urban air quality.
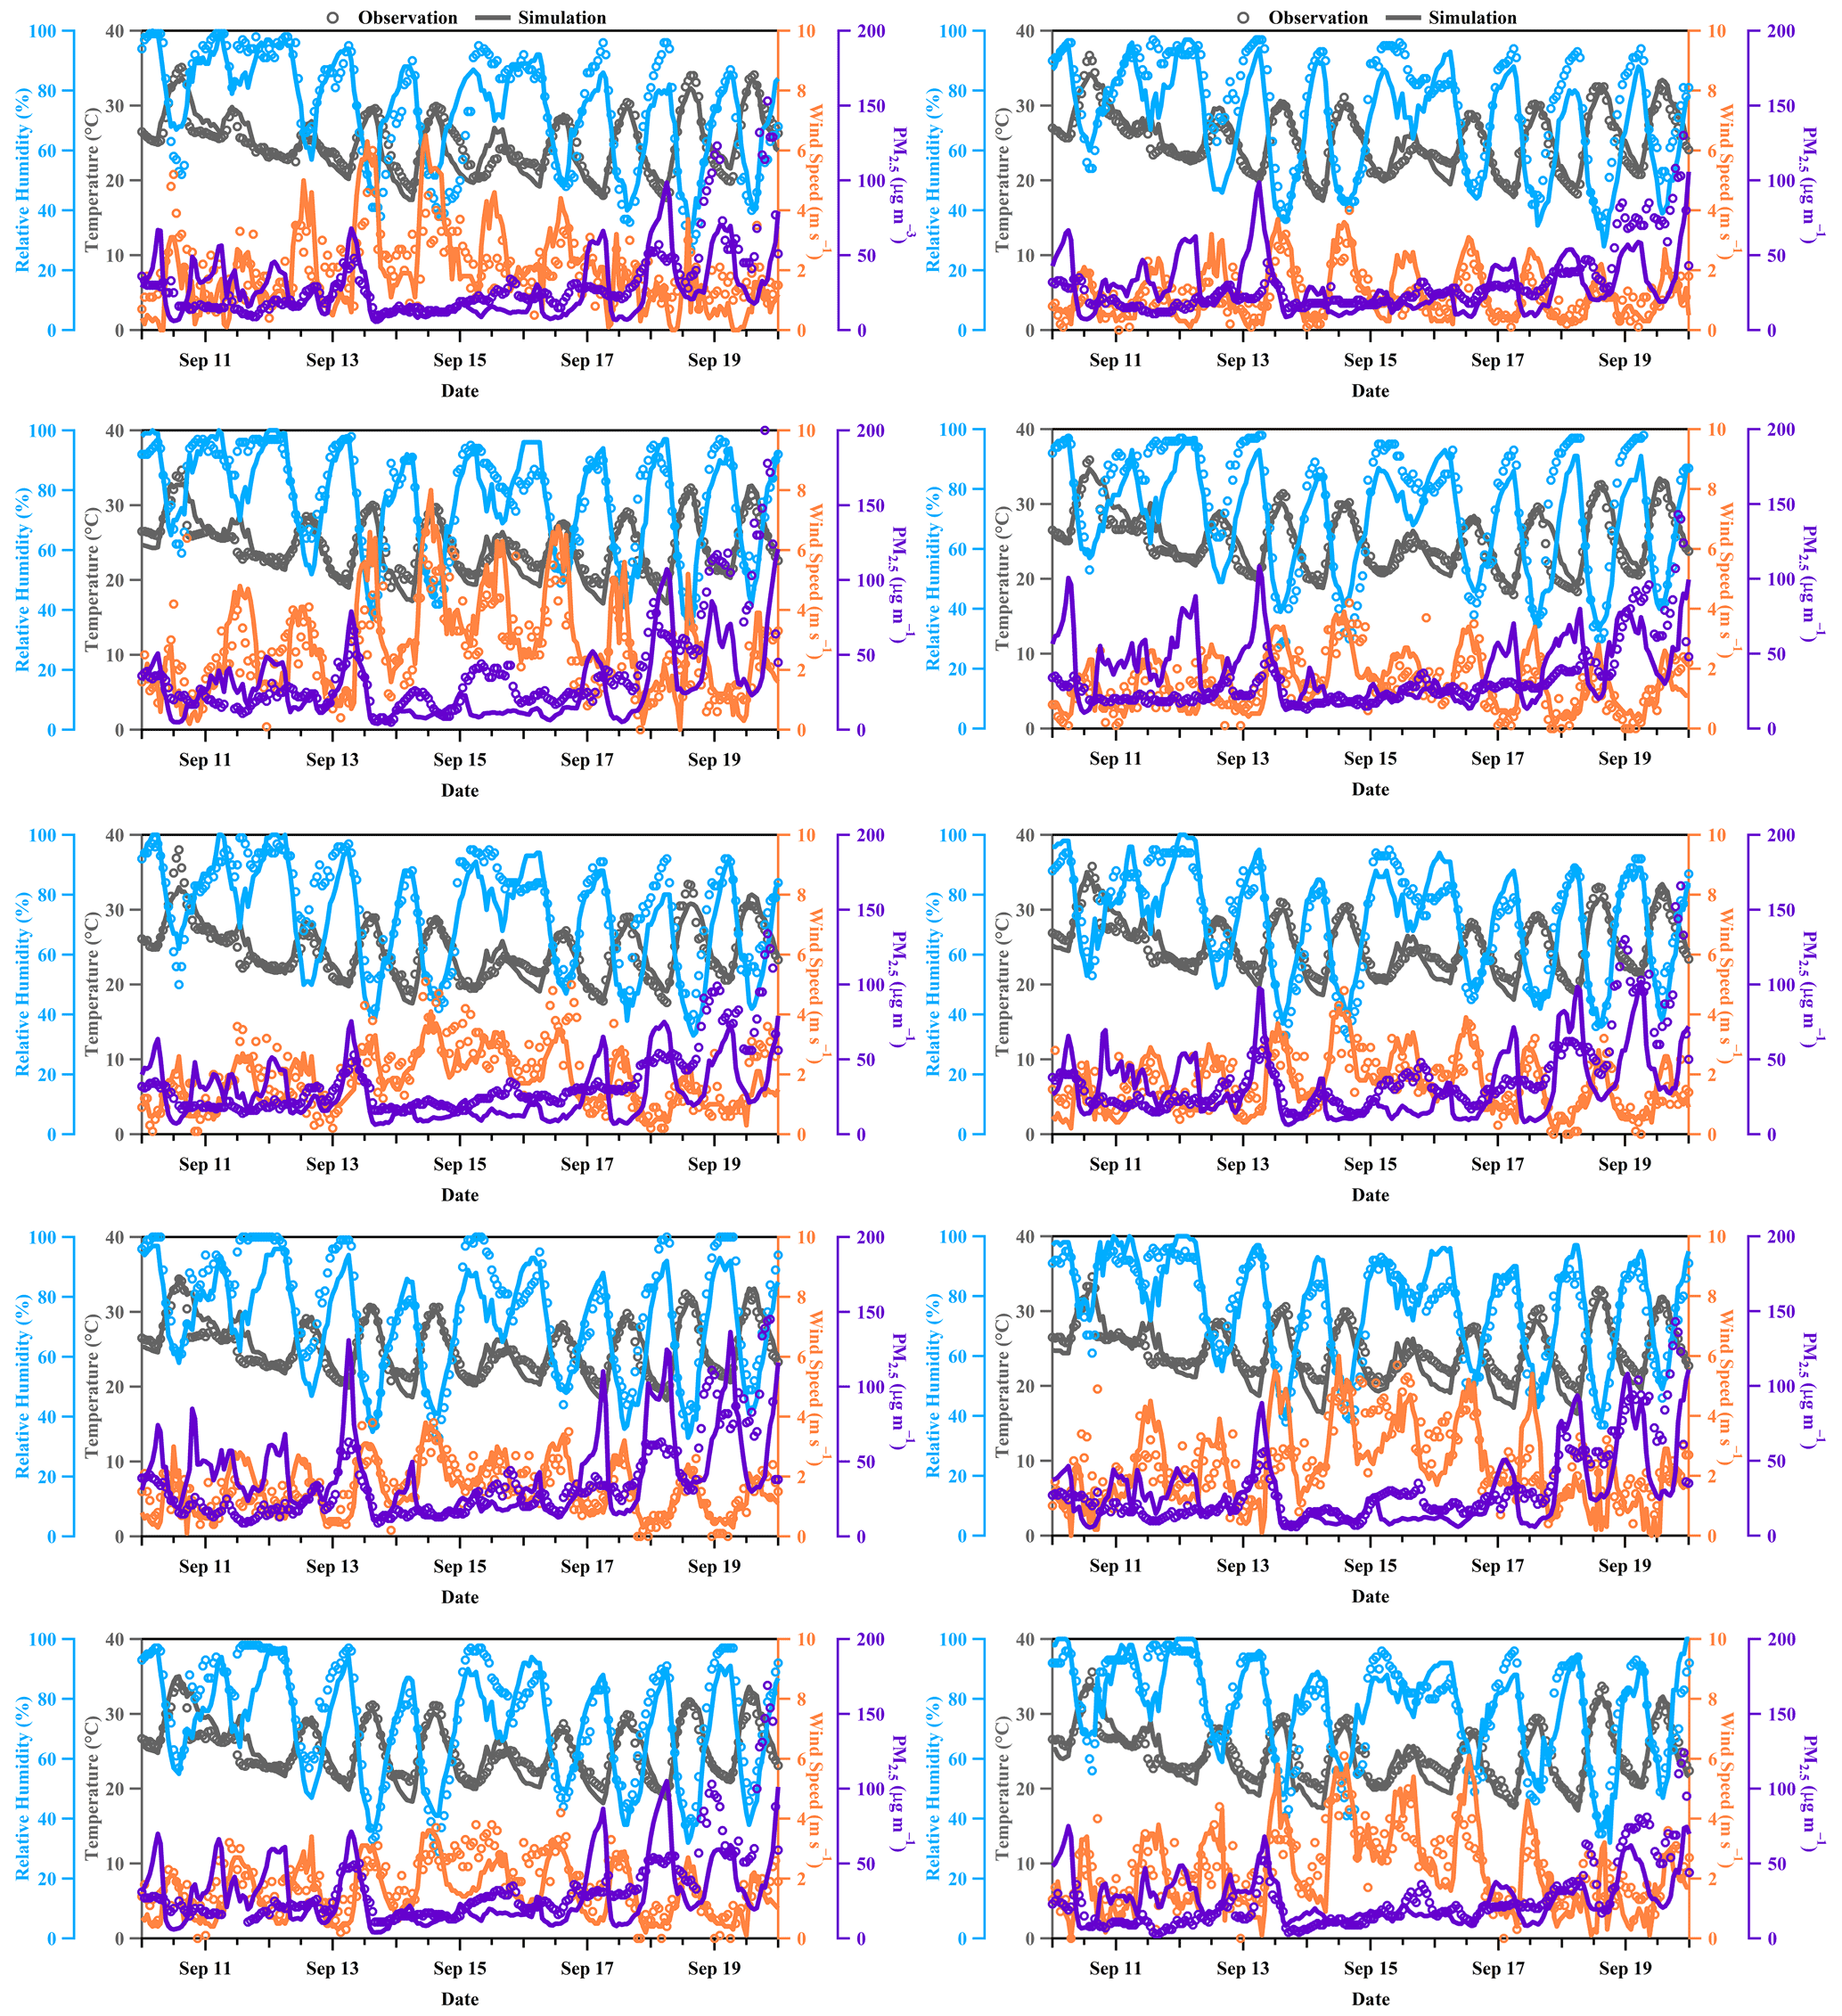
Figure 2Time series of simulated and observed air temperature, relative humidity, wind speed, and PM2.5 concentration from 00:00 LT 12 September to 00:00 LT 20 September 2017 at 10 meteorological and 10 PM2.5 monitoring sites.
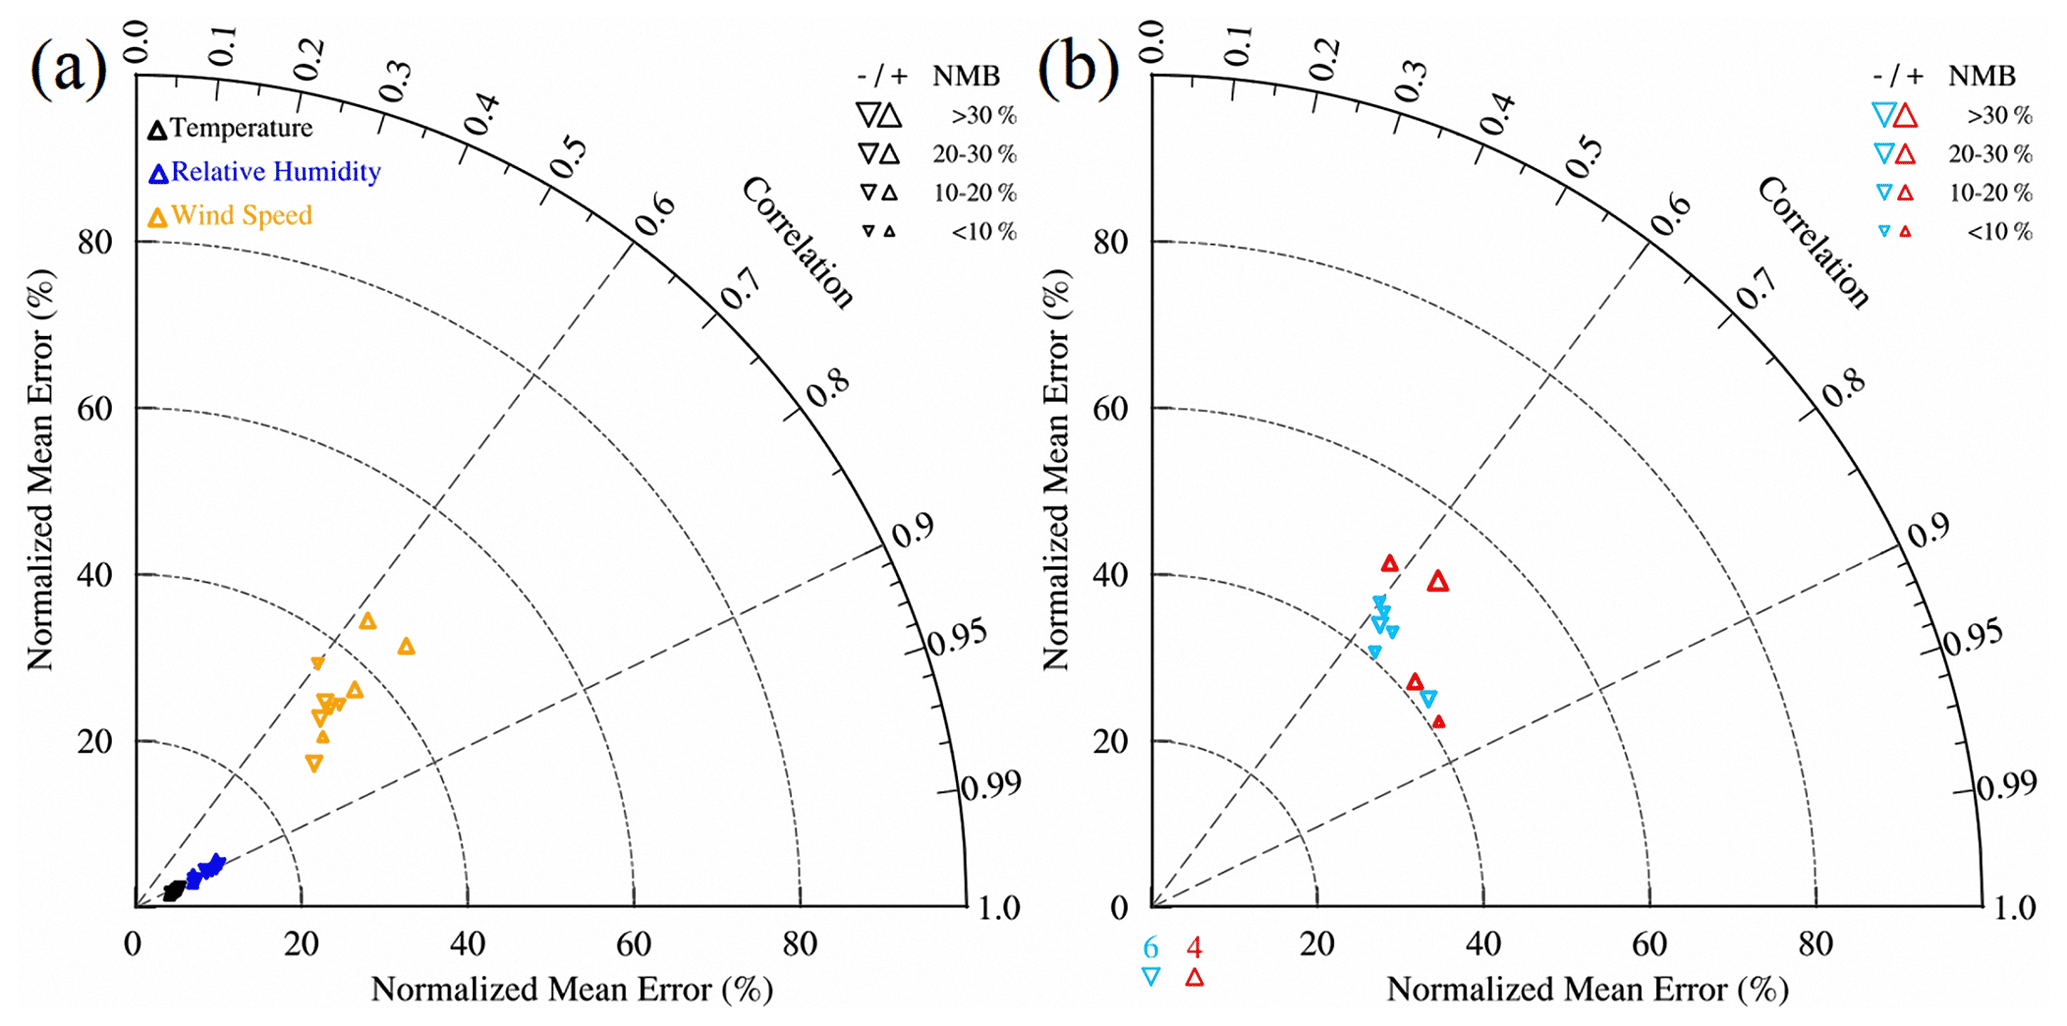
Figure 3Taylor diagram of correlation coefficient, normalized mean bias (NMB), and normalized mean error (NME) between simulated (CTL experiment) and observed (a) air temperature, relative humidity, and wind speed at 10 sites in Hangzhou (white stars in Fig. 1b) and (b) PM2.5 concentrations at 10 sites in Hangzhou (yellow filled circles in Fig. 1b).
The UHI affects the concentrations of atmospheric pollutants and their spatial and vertical distribution by changing the local circulation and chemical reaction environment, e.g. air temperature and humidity, in the overlying atmospheric column. The impacts of these effects over Hangzhou and its surrounding area were investigated by comparison of the meteorological parameters simulated in the CTL experiment with those from the NUB experiment.
3.1 Urban heat island effect
The spatial-averaged (urban region of Hangzhou) UHII during each afternoon (12:00–17:00 LT) ranged from 1.1 to 1.9 ∘C during the 8 d (excluding 2 spin-up days) experiment. A strong UHI case is characterized by the low wind speed and high temperature. Low wind speeds are conducive to the coexistence of UHI with urban air pollution (Ulpiani, 2021). Observations show that PM2.5 started to accumulate from 17 to 19 September due to decreasing wind speeds (Fig. 2). During the 8 d experiment, the strongest UHI case occurred on 18 September, which coincided with high temperatures and low wind speeds (Fig. 2). This case will be discussed in detail below.
The time-averaged (from 12:00 to 17:00 LT, on 18 September 2017) vertical distribution of air temperature, relative humidity, and wind vectors in the CTL experiment along line AB (see Fig. 1b) over Hangzhou shows an obvious UHI effect, which is characterized by the higher air temperature, lower relative humidity, and stronger upward movement over the urban area than over the surrounding rural areas (Fig. S2). The differences in the air temperature, specific humidity, and wind vectors between the CTL and NUB experiments along line AB show that the warming, drying, and circulation effects of the UHI reach an altitude of ∼ 2.0 km (Fig. 4). Kang et al. (2014) suggested that the maximum surface UHII occurs in the evening, while the strongest UHIC appears in the afternoon. The UHIC reaches 2.0 km at 15:00–16:00 LT with a vertical speed of ∼ 0.2 m s−1, as shown by the diurnal variation of the UHII and UHIC profiles over Hangzhou (Fig. S3). Although the near-surface UHII is at its highest, the UHIC is insignificant in the evening.
The UHIC plays a prominent role in the horizontal and vertical distributions of air pollutants in urban atmosphere (Zhu et al., 2015). The changes in the air temperature and specific humidity may potentially affect the secondary formation of aerosols. Meanwhile, the average boundary layer height (BLH) over Hangzhou in the CTL simulation was approximately 1.0 km, 0.3 km higher than that in the NUB simulation. The deeper BL is the result of the stronger turbulence which is due to the warmer urban surface. As a result, the air pollutants are mixed over a deeper BL. The UHIC clearly shows the convergence in the lower BL and the strong upward transport except for a small area near the urban center, where the Qiantang River is located. The vertical branches of UHIC penetrate the top of the urban BL (∼ 1.0 km) to reach the lower free troposphere (LFT) (∼ 2.0 km) (Fig. 4), which may have significant effects on the vertical transport of aerosol and its precursors. Similar UHI effects are also observed in the other seven cases (Fig. S4). The maximum height that the UHIC can reach varies from case to case and is strongly dependent on the UHII and wind speed. In the 8 d experiment, the difference in boundary-layer averaged vertical wind speed between the CTL and NUB experiments, which can be used to determine the intensity of UHIC, shows that when the UHII is strong and the BL wind speed is low, strong UHIC occurs, whereas when the UHII is weak and the BL wind speed is high, weak UHIC occurs (Table S2).
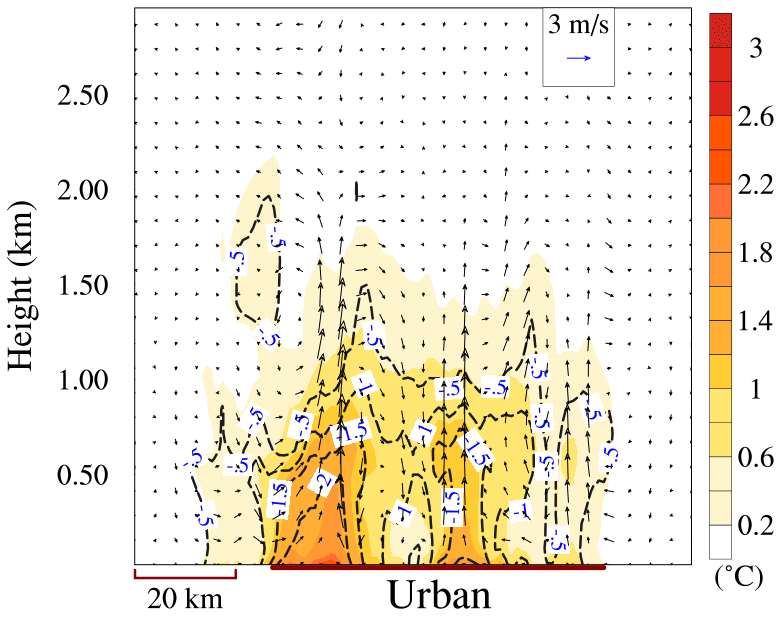
Figure 4Vertical cross section of the difference in averaged (from 12:00 to 17:00 LT, on 18 September 2017) temperature (∘C; filled colors), specific humidity (g kg−1; dashed contour lines), and in-plane wind vectors (m s−1; arrows) between the CTL and NUB experiments (CTL − NUB). Note that the vertical wind speed vectors are expanded 10 times.
3.2 Impact of the UHI on PM2.5
In the CTL experiment, the vertical distribution of PM2.5 along the line AB shows higher PM2.5 concentrations and a much deeper aerosol layer over the urban area than over the surrounding rural area (Fig. S5). To evaluate the UHI effect on the PM2.5 vertical distribution, the vertical cross section of differences of the averaged (from 12:00 to 17:00 LT on 18 September 2017) PM2.5 and in-plane wind vectors between the CTL and NUB experiments along the line AB are shown in Fig. 5. The PM2.5 differences show that PM2.5 concentrations in the BL decreased, on average 8.5 µg m−3 (33 %), and increased in the LFT, on average 3.1 µg m−3 (19 %). The other seven cases show a similar effect of UHI on PM2.5 (Fig. S6). However, the impact of UHI on PM2.5 is negligible on 14 and 15 September because on these two days the largest boundary-layer wind speed and the weakest UHI effect occurred (Table S2). Similar UHI effects were also obtained by WRF-Chem model simulations in the Yangtze River Delta (Liao et al., 2015), south China (Zhu et al., 2017), and California (Li et al., 2019).
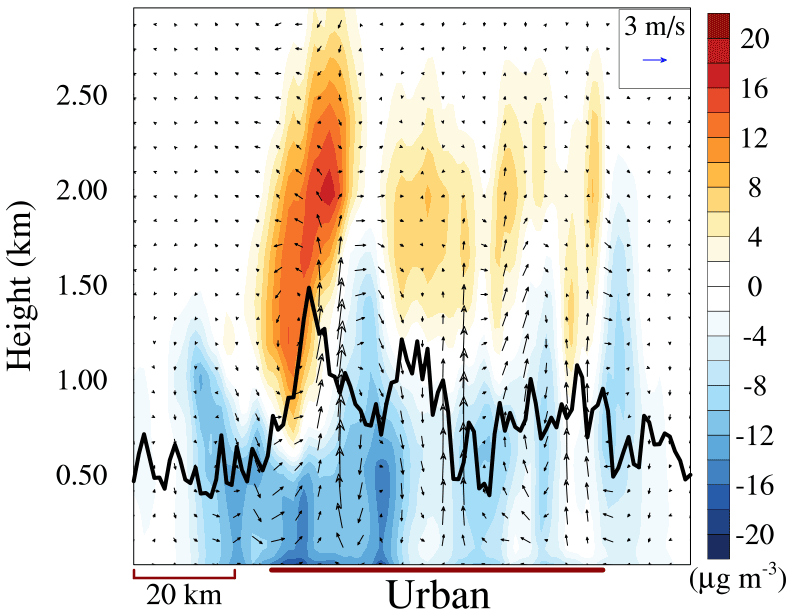
Figure 5Vertical cross section of the differences in averaged (from 12:00 to 17:00 LT, on 18 September 2017) PM2.5 concentration (µg m−3; filled colors) and in-plane wind vectors (m s−1; arrows) between the CTL and NUB experiments. Note that the vertical wind speed is expanded by a factor of 10. The black line denotes the BL height.
In addition to influencing the distributions of the concentrations of aerosol particles and precursor gases by changing the local circulation, the UHI also affects the secondary formation of aerosol particles by changing the air temperature and the humidity. By comparing the four experiments (Table 1), the contributions of the changes in temperature, humidity, and circulation to the vertical distribution of the PM2.5 concentrations over Hangzhou can be identified. Figure 6 shows the vertical profiles of the PM2.5 concentrations from the CTL, NUB, and T&H simulations and the effects of several processes on them. The difference between the PM2.5 concentration profiles from the CTL and T&H simulations is very small as compared to the difference between the CTL and NUB simulations (left panel in Fig. 6; the PM2.5 profile from the TMP simulation is not shown in the figure because it is very close to the profiles from the CTL and T&H simulations). The simulations show that the effects of air temperature and humidity on the PM2.5 concentration account for only 9.7 % of the total UHI effect, of which the contributions of temperature and humidity are 5 % and 4 %, respectively, while the contribution from the circulation effect accounts for about 91 %.
To further investigate how the UHI affects the vertical distribution of PM2.5 by changing physical and chemical processes, a process analysis technique was performed (Fig. 6). The profiles of the area-averaged PM2.5 contribution from the vertical advection process (ZADV) show that in the CTL experiment the negative contributions (−25 µg m−3 on average) in the middle and lower part of the BL are higher than in the NUB experiment (−5 µg m−3 on average), whereas in the LFT the CTL contributions are positive (14 µg m−3 on average) and stronger than in the NUB experiment (2 µg m−3 on average). This suggests that the UHICs induce the transport of aerosol from the lower part of the BL to the upper part and into the free troposphere. The difference in horizontal advection process (HADV) between the CTL and NUB experiments indicates that the UHIC results in stronger convergence (21 µg m−3) of aerosol in the BL and stronger divergence (−15 µg m−3) in the LFT.
The vertical diffusion process (VDIF) results in uniform mixing of PM2.5 in the BL. In the afternoon of 18 September 2017, the mean BL height over Hangzhou was about 1 km. Stronger turbulent mixing in the CTL experiment due to higher temperature and urban surface roughness resulted in a higher urban BL height and a smaller PM2.5 vertical gradient than that in the NUB experiment. Since the emissions of PM2.5 are near the surface, there is a strong negative contribution from vertical diffusion near ground level (Fig. 6). The positive contributions in the middle and lower BL (<0.8 km) indicate that vertical diffusion transports aerosol from ground level to the upper atmosphere by turbulent mixing. Weak negative PM2.5 contributions (∼ −1 µg m−3) from vertical diffusion, especially in CTL experiment, appear in the upper BL and LFT.
The contributions of aerosol process (AERO) to PM2.5 concentrations are negative (−3 µg m−3 on average) in the lower BL (<0.4 km) but positive (4 µg m−3 on average) in the upper air (0.4–2.0 km) (Fig. 6), which suggests that the aerosols are dissociated in the lower BL while they formed in the upper air. Under the influence of UHI, a much stronger secondary aerosol formation occurs in the upper BL and the LFT. This is probably due to the transport of aerosol precursors from ground level to the upper air by the UHIC.
In the LFT, the UHIC contributed ∼ 95 % (the average contribution from ground level to LFT is ∼ 90 %) of the aerosol increase. Process analysis shows that vertical advection (ZADV) and aerosol (AERO) processes are responsible for this increase. The differences between the ZADV and the AERO contributions from the T&H and NUB simulations show that direct vertical advection of aerosol contributes 80 % of the UHIC-induced aerosol increase in the LFT, and secondary formation of aerosol from vertically transported aerosol precursors contributes the remaining 20 % of the UHIC effect.
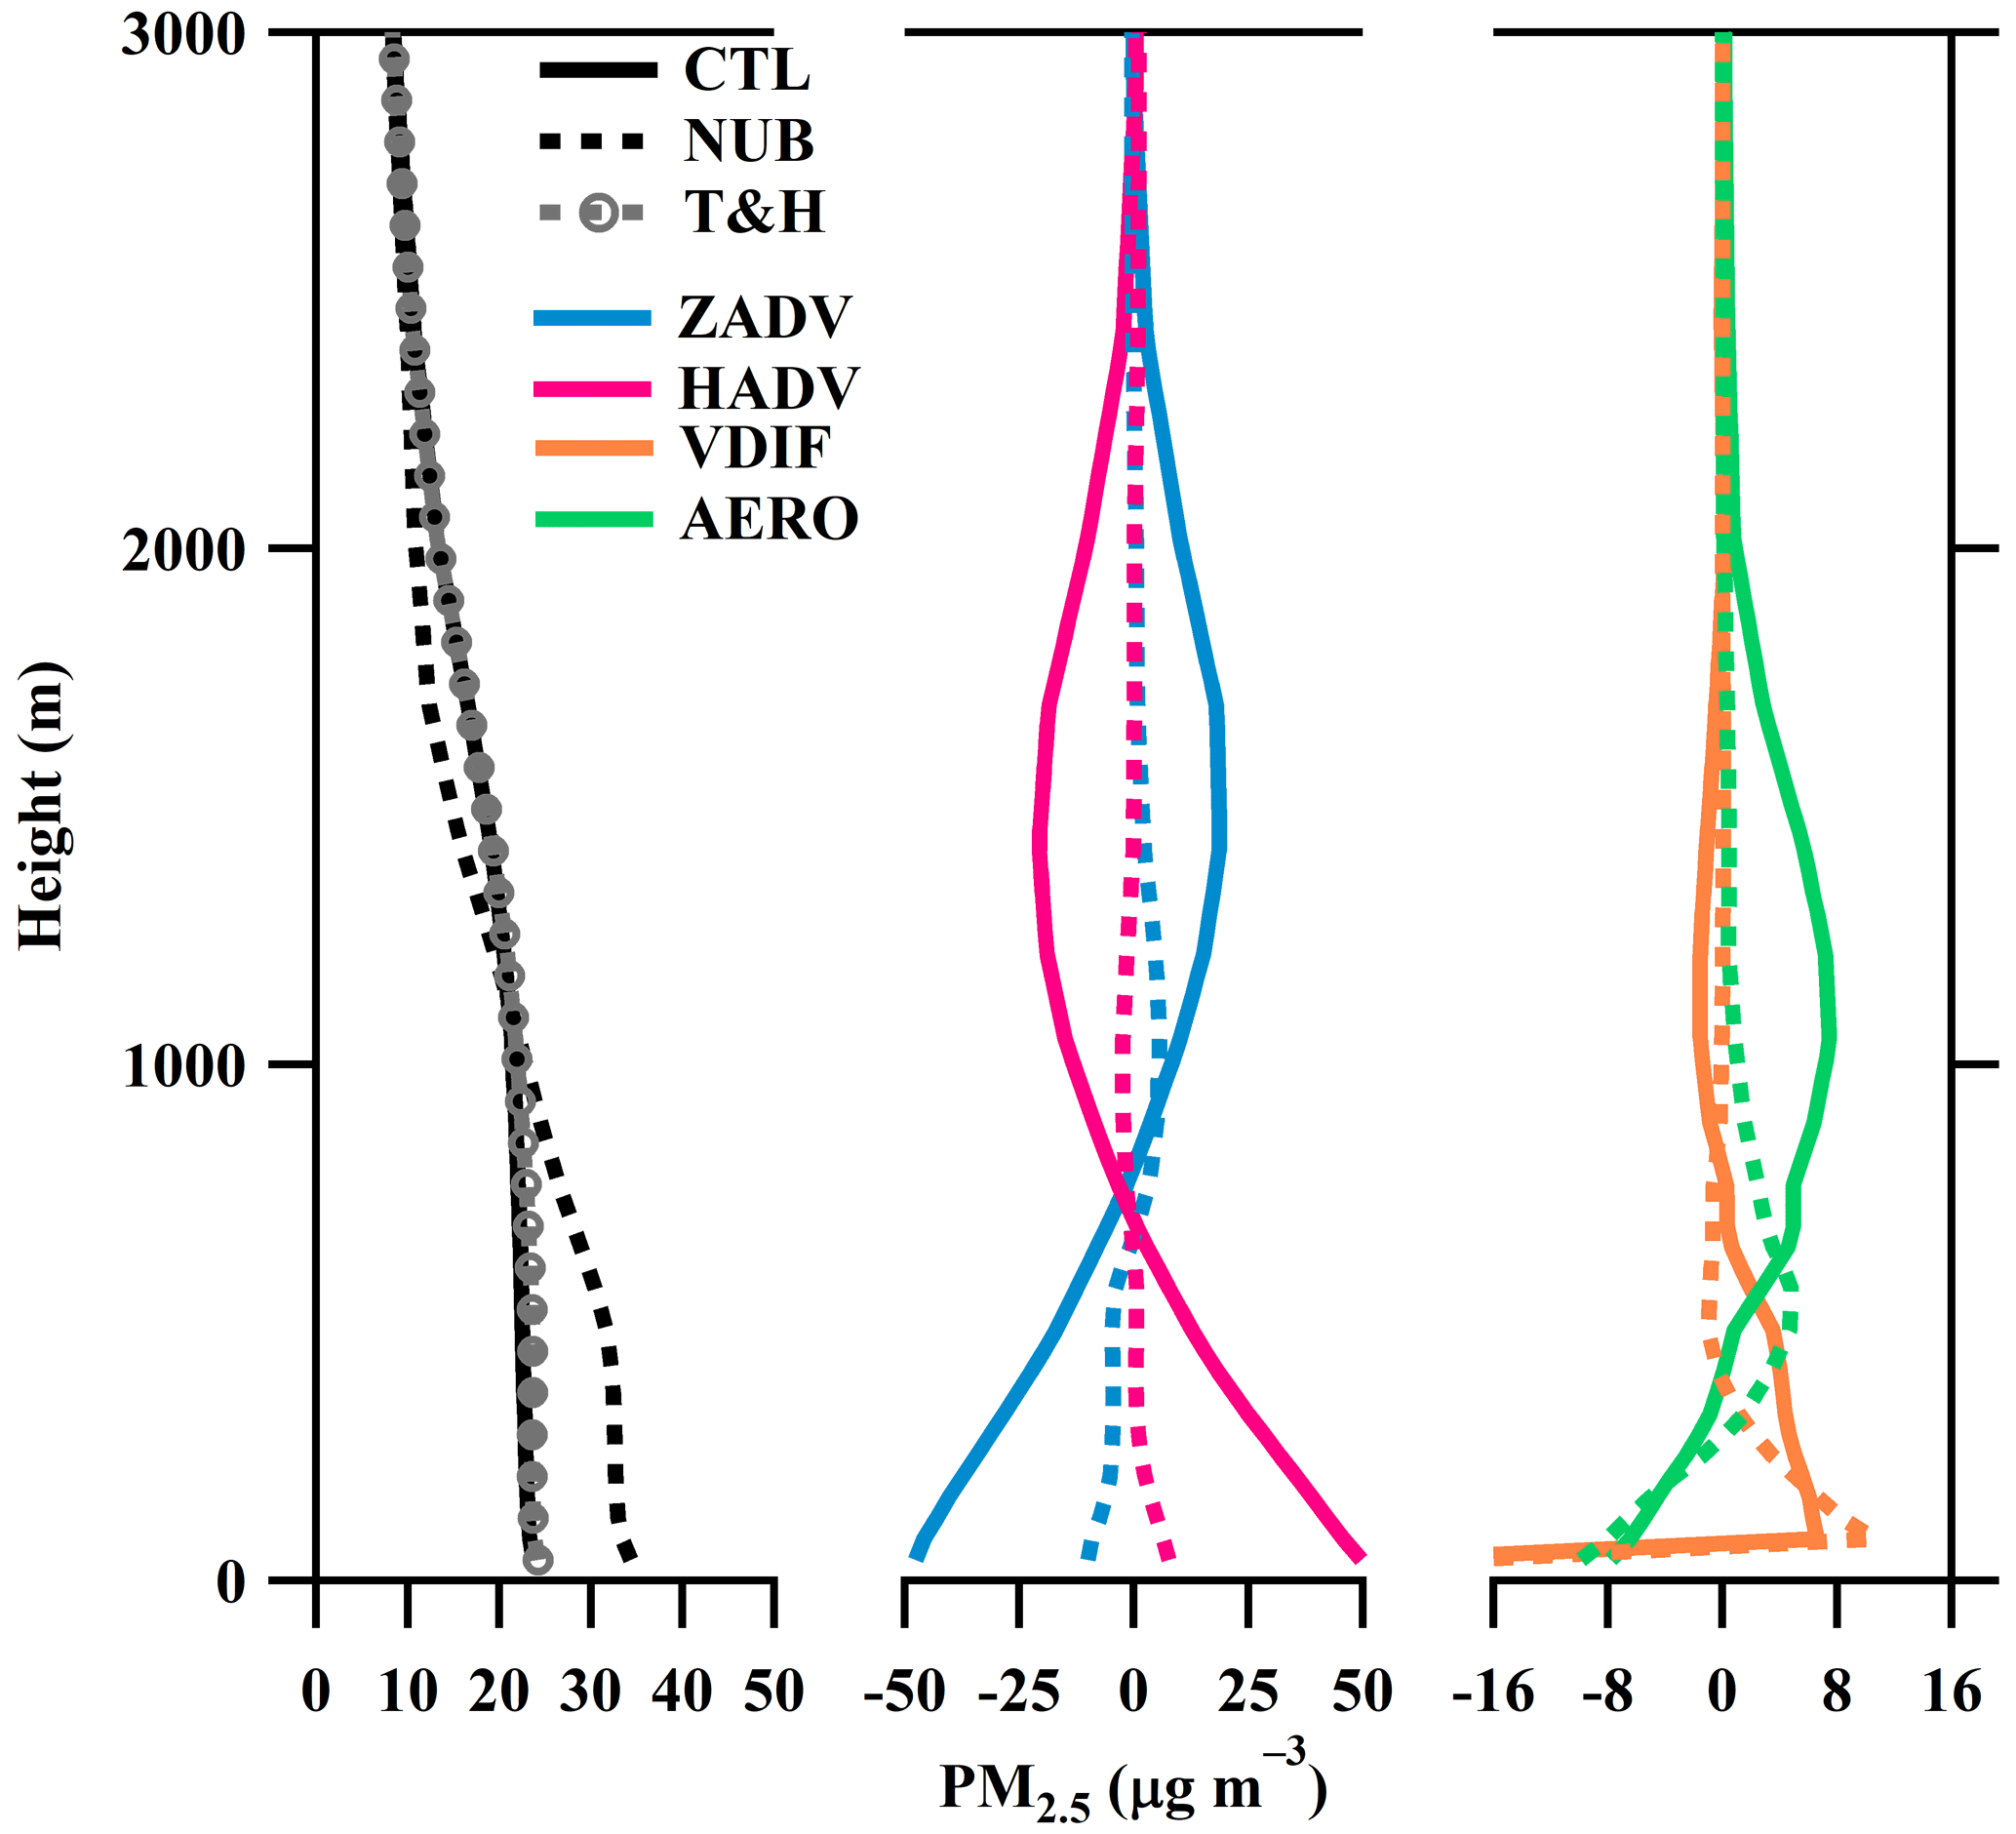
Figure 6Vertical profiles of averaged (from 12:00 to 17:00 LT, on 18 September 2017) PM2.5 concentrations from the CTL (solid line), NUB (dashed line), and T&H (dashed line and circle) experiments and contributions of vertical advection (ZADV), horizontal advection (HADV), vertical diffusion (VDIF), and aerosol (AERO) processes to PM2.5 concentration from the CTL and NUB experiments.
3.3 Impact of the UHI on inorganic aerosol
To quantify the impact of the UHI on the dissociation and formation of SIA over the urban atmosphere, the process analysis technique was applied. The results in Fig. 7 show that the UHI affects the vertical distribution of sulfate mainly through circulation rather than secondary formation (Fig. 7a). The negative contributions of the aerosol process to PM2.5 in the lower BL are mostly attributed to the dissociation of ammonium nitrate (Fig. 7b, c). Meanwhile, the positive contributions of the aerosol process in the upper air are mostly attributed to the secondary formation of ammonium nitrate aerosol. The formation and dissociation of ammonium nitrate aerosol involves an equilibrium reaction between the particle-phase NH4NO3 and gas-phase HNO3 and NH3:
Process analysis shows that the aerosol process provides positive contributions to ammonia and nitric acid in the lower BL but negative contributions in the upper atmosphere (Fig. 8) – the opposite of the result from ammonium nitrate aerosol. This finding supports the conclusion that ammonium nitrate aerosols are formed in the upper atmosphere and dissociate in the lower BL.

Figure 7Averaged (from 12:00 to 17:00 LT, 18 September 2017) vertical profiles of sulfate (a), nitrate (b), and ammonium (c) aerosol concentrations and contributions of vertical advection (ZADV), horizontal advection (HADV), vertical diffusion (VDIF), and aerosol (AERO) processes to their mass concentrations in the CTL (solid line) and NUB (dashed line) experiments.
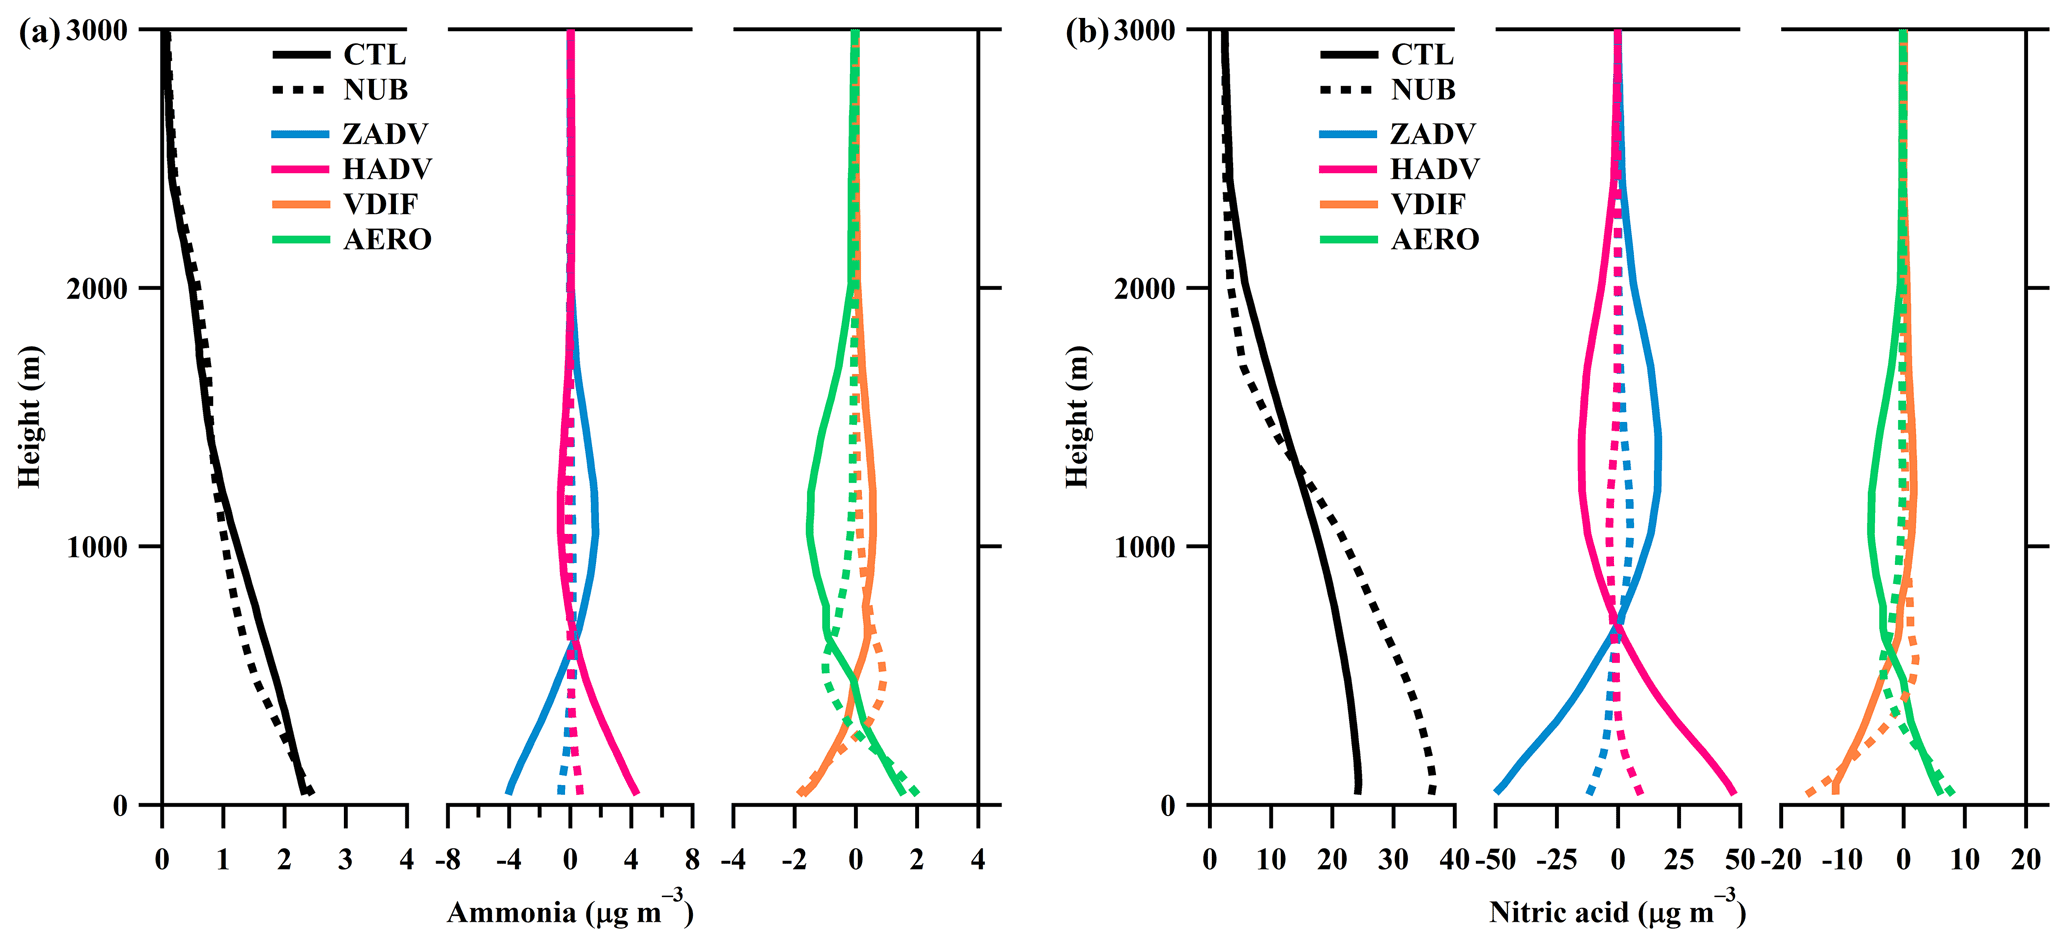
Figure 8Averaged (from 12:00 to 17:00 LT, on 18 September 2017) vertical profiles of ammonia (a) and gas-phase nitric acid (b) concentrations and contributions of vertical advection (ZADV), horizontal advection (HADV), vertical diffusion (VDIF), and aerosol (AERO) processes to their mass concentrations in the CTL (solid line) and NUB (dashed line) experiments.
The dissociation of ammonium nitrate aerosol strongly depends on the air temperature, and the dissociation constant in the model was calculated using Eq. (7) (Mozurkewich, 1993):
where K (nanobar: nb2) is the dissociation constant, and T (K) is atmospheric temperature. Air temperature over Hangzhou decreased from 30 ∘C at ground level to 20 ∘C at 1 km altitude, resulting in the decrease in the dissociation constant from 160 nb2 near the surface to 10 nb2 at 1 km. Therefore, in the warm lower urban BL, the ammonium nitrate equilibrium (Eq. 6) shifts to dissociate into ammonia and nitric acid, and at high elevation where the air is colder, the balance is on the side of ammonium nitrate aerosol. Consequently, the peak concentrations of the ammonium and nitrate aerosol profiles appear in the upper atmosphere rather than near ground level (Fig. 7b, c), which is consistent with flight observations in California (Neuman, 2003) and Cabauw (Aan De Brugh et al., 2012), as well as model simulations in Milan (Curci et al., 2015). Through vertical diffusion, ammonium nitrate aerosol is transported from the upper air to the lower BL (Fig. 7b, c) where it dissociates into ammonia and nitric acid (Fig. 8). Meanwhile, ammonia and nitric acid are transported from ground level to the upper atmosphere by vertical advection and diffusion processes (Fig. 8) and then form ammonium nitrate aerosol.
For comparison with NH4NO3, the dissociation constant for the equilibrium relationship between particle-phase (NH4)2SO4 and aqueous-phase NH and SO,
was calculated using Eq. (9) (Kim et al., 1993):
where T0=298 K, K(T0)=1.817 mol3 kg−3, , and b=38.57. The dissociation constant of ammonium sulfate aerosol slowly decreased from 1.892 mol3 kg−3 near the surface to 1.736 mol3 kg−3 at 1 km. This is why there is less secondary formed sulfate in the LFT (Fig. 7a).
Table 2Average PM2.5 concentrations and the impact of the UHI effects on aerosol during the 8 d experiment for each day between 12:00 and 17:00 LT.

1 Average PM2.5 concentration in the urban BL in the CTL simulation. 2 Average PM2.5 concentration in the LFT in the CTL simulation. 3 The proportion of the UHI-induced PM2.5 variations in the urban BL. 4 The proportion of the UHI-induced PM2.5 variations in the LFT. 5 Average contribution of the UHIC effect on the UHI-induced PM2.5 variations. 6 Average contribution of the UHI temperature effect on the UHI-induced PM2.5 variations. 7 Average contribution of the UHI humidity effect on the UHI-induced PM2.5 variations. 8 The proportion of the UHI-induced nitrate aerosol variations in the LFT. 9 The proportion of the UHI-induced ammonium aerosol variations in the LFT. 10 The proportion of the UHI-induced sulfate variations in the LFT.
Comparison of the CTL and NUB experiments shows that the CTL experiment produces much more ammonium nitrate aerosol in the upper BL and LFT (Fig. 7b, c). This is due to the UHI effect: more ammonia and nitric acid gases and aerosol particles (provide reaction interface for ammonium nitrate) are transported from the surface to higher elevation (Fig. 8) and hence promote the secondary formation of ammonium nitrate aerosol in the cold upper atmosphere. The nitrate and ammonium aerosols formed in the LFT account for approximately 91 % of the total secondary formed aerosol and 20 % of the PM2.5 at that altitude.
In general, the CTL experiment shows that the PM2.5 concentration in the lower BL is reduced by the UHI effect, which can be attributed to the intensified upward transport of aerosol by strong vertical advection and turbulent mixing processes in the urban atmosphere. The larger PM2.5 concentration in the LFT in the CTL simulation is ascribed to the inflow of aerosol by strengthened vertical advection and the secondary formation of inorganic aerosols. However, the impact of enhanced vertical advection and formation of SIA in the urban atmosphere have been generally ignored in previous studies.
In the 8 d simulation period, the UHI effects decreased the PM2.5 concentrations in the BL by 6 % to 33 % and increased the PM2.5 concentrations in the LFT by 1 % to 19 % (Table 2). The simulations show that the impact of the UHI on aerosol is highly dependent on the UHI effect's intensity and background wind speed. The impact of the UHI on PM2.5 concentrations in both the BL and the LFT is larger on 18 and 19 September (Table 2), when the UHII and UHIC are stronger and the BL wind speed is lower, than on other days (Table S2). On 14 September the BL wind speed was the highest, and on 15 September the UHII was the weakest (Table S2), resulting in a substantially smaller UHI impact on the PM2.5 concentrations on these days (Table 2). The UHIC effect consistently plays a dominant role (72 % to 93 %) in affecting the vertical distribution of PM2.5 in all UHI cases (Table 2). During the 8 d experiment, the UHI effect increased the mean concentrations of PM2.5, nitrate, ammonium, and sulfate in the LFT by 7 %, 20 %, 8 %, and 3 %, respectively (Table 2). This suggests that ammonium nitrate aerosols increased considerably in the LFT due to the UHI effects.
In this study, the impacts of the UHI on the transport, diffusion, formation, and distribution of PM2.5, especially SIA, over the city of Hangzhou were investigated using different simulation experiments with the WRF-CMAQ model. By comparison of the results from the CTL and NUB experiments, the UHI effects were separated out. The result from the strongest UHI case (18 September 2017) during the 8 d simulation shows that in the afternoon, due to the UHI effect, the BLH increased by about 0.3 km, and the UHICs can penetrate the top of the BL to reach the LFT.
The UHI effect exerted profound impacts on the PM2.5 concentrations over the urban area. In the absence of the UHI effect, the ground-level PM2.5 concentrations would be about 60 % larger. In the strongest UHI case, the PM2.5 concentration in the urban BL over Hangzhou decreased by ∼ 33 % due to the UHI effect, but in the LFT the PM2.5 concentration increased by ∼ 19 %. This variation is mostly attributed to the effect of UHIC (accounting for 91 %) rather than to the UHI temperature and humidity effects. The UHIC effect consistently plays a dominant role (72 % to 93 %) in affecting the vertical distribution of PM2.5 in all UHI cases. Process analysis shows that UHIC strengthens vertical advection, resulting in the transport of a large amount of PM2.5 and its precursors from ground level to the free troposphere. Elevated BL and strengthened turbulence caused by the UHI promotes vertical diffusion of PM2.5, resulting in the decrease in PM2.5 in the lower BL.
Moreover, the UHI effect promoted the secondary formation of inorganic aerosols, especially nitrate and ammonium aerosols, in the upper BL and the LFT by transporting more precursors, e.g. ammonia and nitric acid, from ground level to the upper atmosphere. During the 8 d experiment, the UHI effect increased the mean concentrations of nitrate, ammonium, and sulfate in the LFT by 20 %, 8 %, and 3 %, respectively. At higher altitudes, where the air temperature is substantially lower than at the surface, the dissociation constant for ammonium nitrate was reduced, and nitrate was driven into the particle phase. In the strongest UHI case, the nitrate and ammonium aerosols formed in the upper BL and the LFT account for approximately 90 % of the total secondary formed aerosol and 20 % of PM2.5 at that altitude. The UHI-induced SIA increase in the LFT may have implications for the transmission of solar radiation, for cloud formation, and for precipitation in the urban and surrounding areas.
The MEIC anthropogenic emission data can be downloaded from http://meicmodel.org/ (last access: 20 July 2021) after registration. The hourly ground meteorological parameters and PM2.5 concentrations that were used for model validation are available from https://doi.org/10.5281/zenodo.6983877 (Kang et al., 2022). Model outputs and 1 km × 1 km anthropogenic emission data in Hangzhou can be obtained from the authors upon request.
The supplement related to this article is available online at: https://doi.org/10.5194/acp-22-10623-2022-supplement.
HK was responsible for paper writing, model simulation, and data analysis. BZ proposed the idea and designed the research. GdL and RJvdA contributed to the paper revision and language editing. BY designed the research and provided high-resolution anthropogenic emission data. WL performed observation data collection.
The contact author has declared that none of the authors has any competing interests.
Publisher’s note: Copernicus Publications remains neutral with regard to jurisdictional claims in published maps and institutional affiliations.
This work was supported by the National Natural Science Foundation of China (grant nos. 42021004 and 41605091). The study contributes to the ESA/MOST cooperation project DRAGON5, Topic 3 Atmosphere, sub-topic 3.2 Air-Quality.
This research has been supported by the National Natural Science Foundation of China (grant nos. 42021004 and 41605091).
This paper was edited by Graciela Raga and reviewed by two anonymous referees.
Aan de Brugh, J. M. J., Henzing, J. S., Schaap, M., Morgan, W. T., van Heerwaarden, C. C., Weijers, E. P., Coe, H., and Krol, M. C.: Modelling the partitioning of ammonium nitrate in the convective boundary layer, Atmos. Chem. Phys., 12, 3005–3023, https://doi.org/10.5194/acp-12-3005-2012, 2012.
Baik, J. J., Kim, Y. H., Kim, J. J., and Han, J. Y.: Effects of boundary-layer stability on urban heat island-induced circulation, Theor. Appl. Climatol., 89, 73–81, https://doi.org/10.1007/s00704-006-0254-4, 2006.
Changnon, S. A.: Rainfall Changes in Summer Caused by St. Louis, Science, 205, 402–404, https://doi.org/10.1126/science.205.4404.402, 1979.
Crutzen, P.: New Directions: The growing urban heat and pollution “island” effect – impact on chemistry and climate, Atmos. Environ., 38, 3539–3540, https://doi.org/10.1016/s1352-2310(04)00297-3, 2004.
Curci, G., Ferrero, L., Tuccella, P., Barnaba, F., Angelini, F., Bolzacchini, E., Carbone, C., Denier van der Gon, H. A. C., Facchini, M. C., Gobbi, G. P., Kuenen, J. P. P., Landi, T. C., Perrino, C., Perrone, M. G., Sangiorgi, G., and Stocchi, P.: How much is particulate matter near the ground influenced by upper-level processes within and above the PBL? A summertime case study in Milan (Italy) evidences the distinctive role of nitrate, Atmos. Chem. Phys., 15, 2629–2649, https://doi.org/10.5194/acp-15-2629-2015, 2015.
Emmons, L. K., Walters, S., Hess, P. G., Lamarque, J.-F., Pfister, G. G., Fillmore, D., Granier, C., Guenther, A., Kinnison, D., Laepple, T., Orlando, J., Tie, X., Tyndall, G., Wiedinmyer, C., Baughcum, S. L., and Kloster, S.: Description and evaluation of the Model for Ozone and Related chemical Tracers, version 4 (MOZART-4), Geosci. Model Dev., 3, 43–67, https://doi.org/10.5194/gmd-3-43-2010, 2010.
Gao, W., Tie, X., Xu, J., Huang, R., Mao, X., Zhou, G., and Chang, L.: Long-term trend of O3 in a mega City (Shanghai), China: Characteristics, causes, and interactions with precursors, Sci. Total Environ., 603–604, 425–433, https://doi.org/10.1016/j.scitotenv.2017.06.099, 2017.
Gipson, G. L.: Science Algorithms of the EPA Models-3 Community Multiscale Air Quality (CMAQ) Modeling System: Process analysis, EPA/600/R-99/030, U.S. EPA, https://www.cmascenter.org/cmaq/science_documentation/pdf/ch16.pdf (last access: 6 June 2022), 1999.
Guenther, A. B., Jiang, X., Heald, C. L., Sakulyanontvittaya, T., Duhl, T., Emmons, L. K., and Wang, X.: The Model of Emissions of Gases and Aerosols from Nature version 2.1 (MEGAN2.1): an extended and updated framework for modeling biogenic emissions, Geosci. Model Dev., 5, 1471–1492, https://doi.org/10.5194/gmd-5-1471-2012, 2012.
Kang, H., Zhu, B., de Leeuw, G., Yu, B., van der A, R. J., and Lu, W: Impact of urban heat island on inorganic aerosol in the lower free troposphere: a case study in Hangzhou, China, Zenodo [data set], https://doi.org/10.5281/zenodo.6983877, 2022.
Kang, H.-Q., Zhu, B., Zhu, T., Sun, J.-L., and Ou, J.-J.: Impact of Megacity Shanghai on the Urban Heat-Island Effects over the Downstream City Kunshan, Bound.-Lay. Meteorol., 152, 411–426, https://doi.org/10.1007/s10546-014-9927-1, 2014.
Kim, Y. P., Seinfeld, J. H., and Saxena, P.: Atmospheric Gas-Aerosol Equilibrium I. Thermodynamic Model, Aerosol Sci. Tech., 19, 157–181, https://doi.org/10.1080/02786829308959628, 1993.
Li, H., Meier, F., Lee, X., Chakraborty, T., Liu, J., Schaap, M., and Sodoudi, S.: Interaction between urban heat island and urban pollution island during summer in Berlin, Sci. Total Environ., 636, 818–828, https://doi.org/10.1016/j.scitotenv.2018.04.254, 2018.
Li, Y., Zhang, J., Sailor, D. J., and Ban-Weiss, G. A.: Effects of urbanization on regional meteorology and air quality in Southern California, Atmos. Chem. Phys., 19, 4439–4457, https://doi.org/10.5194/acp-19-4439-2019, 2019.
Li, Z., Guo, J., Ding, A., Liao, H., Liu, J., Sun, Y., Wang, T., Xue, H., Zhang, H., and Zhu, B.: Aerosol and boundary-layer interactions and impact on air quality, Natl. Sci. Rev., 4, 810–833, https://doi.org/10.1093/nsr/nwx117, 2017.
Liao, J., Wang, T., Jiang, Z., Zhuang, B., Xie, M., Yin, C., Wang, X., Zhu, J., Fu, Y., and Zhang, Y.: WRF/Chem modeling of the impacts of urban expansion on regional climate and air pollutants in Yangtze River Delta, China, Atmos. Environ., 106, 204–214, https://doi.org/10.1016/j.atmosenv.2015.01.059, 2015.
Liu, H., Ma, W., Qian, J., Cai, J., Ye, X., Li, J., and Wang, X.: Effect of urbanization on the urban meteorology and air pollution in Hangzhou, J. Meteorol. Res., 29, 950–965, https://doi.org/10.1007/s13351-015-5013-y, 2016.
Ma, Y., Ye, J., Xin, J., Zhang, W., Vilà-Guerau de Arellano, J., Wang, S., Zhao, D., Dai, L., Ma, Y., Wu, X., Xia, X., Tang, G., Wang, Y., Shen, P., Lei, Y., and Martin, S. T.: The Stove, Dome, and Umbrella Effects of Atmospheric Aerosol on the Development of the Planetary Boundary Layer in Hazy Regions, Geophys. Res. Lett., 47, e2020GL087373, https://doi.org/10.1029/2020gl087373, 2020.
Mozurkewich, M.: The dissociation constant of ammonium nitrate and its dependence on temperature, relative humidity and particle size, Atmos. Environ. A.-Gen., 27, 261–270, https://doi.org/10.1016/0960-1686(93)90356-4, 1993.
Narumi, D., Kondo, A., and Shimoda, Y.: The effect of the increase in urban temperature on the concentration of photochemical oxidants, Atmos. Environ., 43, 2348–2359, https://doi.org/10.1016/j.atmosenv.2009.01.028, 2009.
Neuman, J. A.: Variability in ammonium nitrate formation and nitric acid depletion with altitude and location over California, J. Geophys. Res., 108, 4557, https://doi.org/10.1029/2003jd003616, 2003.
Oke, T. R., Mills, G., Christen, A., and Voogt, J. A.: Urban climates, 1st edn., Cambridge University Press, University Printing House, Cambridge CB2 8BS, United Kingdom, ISBN 9781139016476, https://doi.org/10.1017/9781139016476, 2017.
Rotach, M. W., Vogt, R., Bernhofer, C., Batchvarova, E., Christen, A., Clappier, A., Feddersen, B., Gryning, S. E., Martucci, G., Mayer, H., Mitev, V., Oke, T. R., Parlow, E., Richner, H., Roth, M., Roulet, Y. A., Ruffieux, D., Salmond, J. A., Schatzmann, M., and Voogt, J. A.: BUBBLE – an Urban Boundary Layer Meteorology Project, Theor. Appl. Climatol., 81, 231–261, https://doi.org/10.1007/s00704-004-0117-9, 2005.
Tao, W.-K., Chen, J.-P., Li, Z., Wang, C., and Zhang, C.: Impact of aerosols on convective clouds and precipitation, Rev. Geophys., 50, RG2001, https://doi.org/10.1029/2011rg000369, 2012.
Ulpiani, G.: On the linkage between urban heat island and urban pollution island: Three-decade literature review towards a conceptual framework, Sci. Total Environ., 751, 141727, https://doi.org/10.1016/j.scitotenv.2020.141727, 2021.
Wan, H., Zhong, Z., Yang, X., and Li, X.: Impact of city belt in Yangtze River Delta in China on a precipitation process in summer: A case study, Atmos. Res., 125–126, 63–75, https://doi.org/10.1016/j.atmosres.2013.02.004, 2013.
Wang, Q., Kwan, M. P., Zhou, K., Fan, J., Wang, Y., and Zhan, D.: The impacts of urbanization on fine particulate matter (PM2.5) concentrations: Empirical evidence from 135 countries worldwide, Environ. Pollut., 247, 989–998, https://doi.org/10.1016/j.envpol.2019.01.086, 2019.
Xie, M., Liao, J., Wang, T., Zhu, K., Zhuang, B., Han, Y., Li, M., and Li, S.: Modeling of the anthropogenic heat flux and its effect on regional meteorology and air quality over the Yangtze River Delta region, China, Atmos. Chem. Phys., 16, 6071–6089, https://doi.org/10.5194/acp-16-6071-2016, 2016.
Zhao, B., Jiang, J. H., Gu, Y., Diner, D., Worden, J., Liou, K.-N., Su, H., Xing, J., Garay, M., and Huang, L.: Decadal-scale trends in regional aerosol particle properties and their linkage to emission changes, Environ. Res. Lett., 12, 054021, https://doi.org/10.1088/1748-9326/aa6cb2, 2017.
Zhong, S., Qian, Y., Zhao, C., Leung, R., and Yang, X.-Q.: A case study of urbanization impact on summer precipitation in the Greater Beijing Metropolitan Area: Urban heat island versus aerosol effects, J. Geophys. Res.-Atmos., 120, 10903–10914, https://doi.org/10.1002/2015jd023753, 2015.
Zhan, C. and Xie, M.: Land use and anthropogenic heat modulate ozone by meteorology: a perspective from the Yangtze River Delta region, Atmos. Chem. Phys., 22, 1351–1371, https://doi.org/10.5194/acp-22-1351-2022, 2022.
Zhu, B., Kang, H., Zhu, T., Su, J., Hou, X., and Gao, J.: Impact of Shanghai urban land surface forcing on downstream city ozone chemistry, J. Geophys. Res.-Atmos., 120, 4340–4351, https://doi.org/10.1002/2014jd022859, 2015.
Zhu, K., Xie, M., Wang, T., Cai, J., Li, S., and Feng, W.: A modeling study on the effect of urban land surface forcing to regional meteorology and air quality over South China, Atmos. Environ., 152, 389–404, https://doi.org/10.1016/j.atmosenv.2016.12.053, 2017.