the Creative Commons Attribution 4.0 License.
the Creative Commons Attribution 4.0 License.
 | 15 Aug 2022
Long-range transport of Asian dust to the Arctic: identification of transport pathways, evolution of aerosol optical properties, and impact assessment on surface albedo changes
Xiaoxi Zhao
Kan Huang
Joshua S. Fu
Sabur F. Abdullaev
Airborne dust is one of the most important natural aerosols; it has various environmental impacts on air quality, ocean fertilization, and the global climate change. Asian dust, representing one of the major dust sources in the world, has been widely studied due to its long-range transport capability. However, its transport to the Arctic has been less investigated. In this study, two typical transport routes were identified based on the recorded dust events in China during 2011–2015. Accordingly, two specific Asian dust long-range transport events were selected and compared, i.e., one observed at Barrow, Alaska (traveled mostly over lands within 6–7 d), and the other one observed at Alert, Canada (traveled mostly over oceans within 7–8 d). The transport routes of the two dust events had been cross-validated by using air mass trajectory modeling, meteorology reanalysis data, ground-based aerosol columnar and profiling observations, and spaceborne remote sensing. It was found that different transport routes to the Arctic had divergent effects on the evolution of aerosol properties, revealing different mixing extents between dust, anthropogenic particles, smoke, and sea salts. Based on the Snow, Ice, and Aerosol Radiative (SNICAR) model, the albedo simulation indicated that dust and elemental carbon together reduced the surface albedo by 0.35 % to 2.63 % compared to the pure snow condition. This study implied that the dust long-range transport from China to the Arctic was ubiquitous and may be a potential contributor to the Arctic regional climate.
- Article
(17044 KB) - Full-text XML
-
Supplement
(1249 KB) - BibTeX
- EndNote


In the context of global warming, the Arctic temperature has been increasing at a rate higher than the global average in recent decades, which is the so-called “Arctic amplification” effect (Serreze et al., 2009; Serreze and Francis, 2006). Although the increase in greenhouse gases concentrations was an important driver of the Arctic and global warming, the underlying cause of Arctic amplification remained uncertain as Arctic warming and ice cap melting were also associated with changes in surface albedo, aerosol radiative forcing, cloud cover, atmospheric water vapor content, and seawater temperature (Screen and Simmonds, 2010; Gillett et al., 2008). The magnitudes of direct radiative forcing of Arctic aerosols were closely related to the origin of aerosol and its transport and deposition (Quinn et al., 2008). During the long transport of aerosols to the Arctic, the solar radiation could be absorbed or scattered by some components in the aerosols (black carbon, sulfate, etc.), which led to a decrease in the amount of solar radiation reaching the surface. However, this cooling effect may be diminished by the decrease in Arctic aerosol concentrations in recent decades (Gagne et al., 2017; Breider et al., 2017). On the other hand, aerosol–radiation interactions also contributed to Arctic warming in the following ways. Firstly, absorbing aerosols at low latitudes could enhance the latitudinal gradient of temperature, thus enhancing heat transport from other regions to the Arctic (Sand et al., 2013a, b); secondly, absorbing aerosols absorbed solar radiation and warmed the Arctic atmosphere while the surface was cooled, which enhanced atmospheric stability and constrained the diffusion of air pollutants (Blanchet and List, 2010; Koch and Del Genio, 2010; Brock et al., 2011); thirdly, deposition of absorbing aerosols onto snow and ice could reduce the surface albedo of the Arctic and thus lead to local warming. Besides, the formation of mixed-phase clouds in the Arctic was found to be related to low concentrations and acid coating of dust particles based on both global and parcel model simulations (Fan, 2013). Overall, direct and indirect radiative forcings caused by aerosols had significant impacts on the Arctic climate as demonstrated by the model simulation results (Shindell and Faluvegi, 2009; Flanner, 2013). In addition to the impact of absorbing aerosols on the Arctic climate, the snow–albedo feedback and cloud–albedo feedback in central Siberia significantly regulated the variation of dust emissions in spring over the Gobi Desert (Liu et al., 2018).
Due to the sparse human activities in the Arctic, most of the air pollutants originated from the middle and lower latitudes, e.g., Eurasia, Siberia, North America, and Southeast Asia. Eurasia was the main source area for the lower Arctic altitudes, and the higher Arctic altitudes were mainly influenced by South and Central Asia (Qi et al., 2017; Fisher et al., 2011; Sharma et al., 2013; Stohl, 2006). Di Pierro et al. (2011) and Huang et al. (2015) both used ground-based lidar data and satellite remote sensing images to demonstrate that aerosols from China can be transported to the Arctic within 4–6 d. Similarly, Di Biagio et al. (2018) found that aerosols in the high Arctic north of Svalbard from October 2014 to June 2015 were mainly from Russia. Warneke et al. (2010) found that forest fires in Russia strongly affected air pollutant concentrations in the Arctic atmosphere and surface snowpack based on aircraft observations and numerical simulation. Marelle et al. (2015) investigated a long-range transport event from Europe to the Arctic in April 2008 and estimated a maximum shortwave radiation of 3.3 W m−2 at the top of the atmosphere, yielding a significant local warming effect. Sobhani et al. (2018) applied the WRF-STEM (Weather Research and Forecasting – sulfur transport and deposition model) model to study the long-range transport of aerosols to the Arctic and calculated the contribution of various anthropogenic and biomass burning emissions. Europe and China were found as the main source regions of Arctic black carbon, contributing about 46 % and 25 % in the middle and upper troposphere, respectively.
Different from black carbon, dust had a much larger geographic influencing coverage due to the fact that dust particles were usually accompanied by strong winds. Although a number of studies focused on local or regional dust in the Arctic (Ferrero et al., 2019; Ranjbar et al., 2021; Dagsson-Waldhauserova et al., 2019), the long-range transport of dust to the Arctic has been frequently observed. Asian dust can be transported across the Pacific Ocean to reach North America and even the Arctic (Wang et al., 2018b; Guo et al., 2017). Zwaaftink et al. (2016) combined a Lagrangian particle dispersion model FLEXPART (FLEXible PARTicle dispersion model) and surface particle concentration observations to simulate the global dust emissions. It was found that the instantaneous radiative forcing in the Arctic caused by dust was also dominated by Asia and Africa. In addition, the deposition of dust on snow was responsible for almost all instantaneous radiative forcing at the bottom of the atmosphere (Kylling et al., 2018).
Although both observational and modeling studies showed a persistent source of the Arctic dust from Asia (Fan, 2013; Ginoux et al., 2012), the transport pathways were seldom explored. Huang et al. (2015) revealed an unreported transport path of Asian dust to the Arctic and estimated its transport duration. In this study, the frequency of dust from East Asia that had the capability to be transported to the Arctic was estimated. Two typical dust transport pathways to the Arctic were investigated based on a synergy of remote sensing data and Arctic monitoring data. The evolutions of aerosol optical properties during the long-range transport were analyzed. Finally, the potential impact of absorbing aerosol on the decrease in surface albedo was quantified.
2.1 Receptor sites in the Arctic
Two Arctic monitoring sites were chosen as the investigated receptors (Fig. 1). They are almost the most northern sites in the Arctic Circle and located in the remote regions where human activities are negligible. Thus, the long-range-transported particles can be easily discerned. One site is Barrow (71.32∘ N, 156.61∘ W), located in the northernmost part of the Alaska region of the US. It is surrounded by the Arctic Ocean on three sides and has a large ice cap. Barrow is characterized by a cold and dry climate and covered by snow and ice all year-round with an average annual temperature of about −11 ∘C (Dong et al., 2010). In winter, the frequency of northerly air currents was high. The average surface temperature reached as low as −25 ∘C in January and February, and most of the snowfall occurred at the end of February. Since April, the invasion of warm and moist air masses from the North Pacific Ocean began to prompt the snowpack in Alaska to melt (Stone et al., 2002). This site is managed by the Earth System Research Laboratory of the National Oceanic and Atmospheric Administration.

Figure 1Two receptor sites (Barrow and Alert) in the Arctic. The map was created by ArcGIS 10.2.
The other site is Alert (82.50∘ N, 62.34∘ W) in the Nunavut region of Canada, the northernmost permanent human settlement in the world. This site is located about 500 km north of Greenland, near the North Pole and far from any industrial emissions. It is very cold due to the long-lasting polar night of 4 months in a year. The average temperature was below −30 ∘C from December to March, and the average annual temperature was −17.9 ∘C (Weijers et al., 2017). This site is managed by Environment Canada.
2.2 Aerosol measurements
Particles at Barrow and Alert were measured by the three-wavelength (450, 550, and 700 nm) integrating nephelometer (model 3563). The nephelometer measured the angular integral of light scattering, and the Beer–Lambert law was applied to calculate the light extinction. In this study, the measurement results at 550 nm were used. Aerosol absorption was measured by a filter absorption photometer. The aerosol absorption coefficients were obtained at three wavelengths of 467, 530, and 660 nm. The measurement results at 530 nm were used. Aerosol Robotic Network (AERONET) established a global observational network of columnar aerosol optical properties based on Cimel-31 sun photometers (Holben et al., 1998). Key parameters of aerosol optical properties were retrieved at 440, 670, 870, and 1020 nm, respectively. The quality-assured level 2.0 data were used. The AD-Net (Asian dust and aerosol lidar observation network) operated by the National Institute for Environmental Studies (NIES) established a lidar network of dual-wavelength depolarization lidars (model L2S-SM II), aiming to obtain the four-dimensional distributions (sites/time/height/aerosol properties) of aerosol particles in East Asia (Shimizu et al., 2017). The lidar could measure backscattering coefficients and the depolarization ratio at the wavelength of 532 nm. The lidar continuously operated with 15 min intervals and 30 m vertical resolution.
In addition to the ground-based sites, remote sensing from space was used to provide widespread spatial information of aerosols. The MODIS (Moderate Resolution Imaging Spectroradiometer) Level-3 aerosol products () were obtained from NASA's Giovanni (https://giovanni.gsfc.nasa.gov/giovanni/, last access: 4 August 2022). Aerosol optical depth (AOD; 550 nm) data were based on the Dark Target (Levy et al., 2007) and Deep Blue (Hsu et al., 2013) algorithm, and Angström exponent (0.412–0.47 nm) data were based on the Deep Blue algorithm. The CALIOP (Cloud-Aerosol Lidar with Orthogonal Polarization) Lidar aboard the CALIPSO (Cloud-Aerosol Lidar and Infrared Pathfinder Satellite Observation) satellite provided global data on aerosol and cloud layers with a horizontal and vertical resolution of around 5 km and 60 m. Track-scale vertical aerosol profiles were derived. In addition, major aerosol subtypes can be identified, including dust, smoke, clean continental, polluted continental, clean marine, and polluted dust (Omar et al., 2009).
2.3 Air mass trajectories modeling
To track the possible source regions of airborne particles, HYSPLIT4 (HYbrid Single-Particle Lagrangian Integrated Trajectory) was run online at the NOAA (National Oceanic and Atmospheric Administration) ARL (Air Resource Laboratory) READY (Real-time Environmental Applications and Display sYstem) website (https://www.ready.noaa.gov/HYSPLIT.php, last access: 4 August 2022). The HYSPLIT model is a complete system for calculating simple air mass backward trajectories, in addition to dispersion and complex deposition simulations (Draxier and Hess, 1998). The meteorological input data used in the model were obtained from the National Center for Environmental Prediction's (NCEP) Global Data Assimilation System (GDAS) with a horizontal resolution of .
2.4 Snow albedo modeling
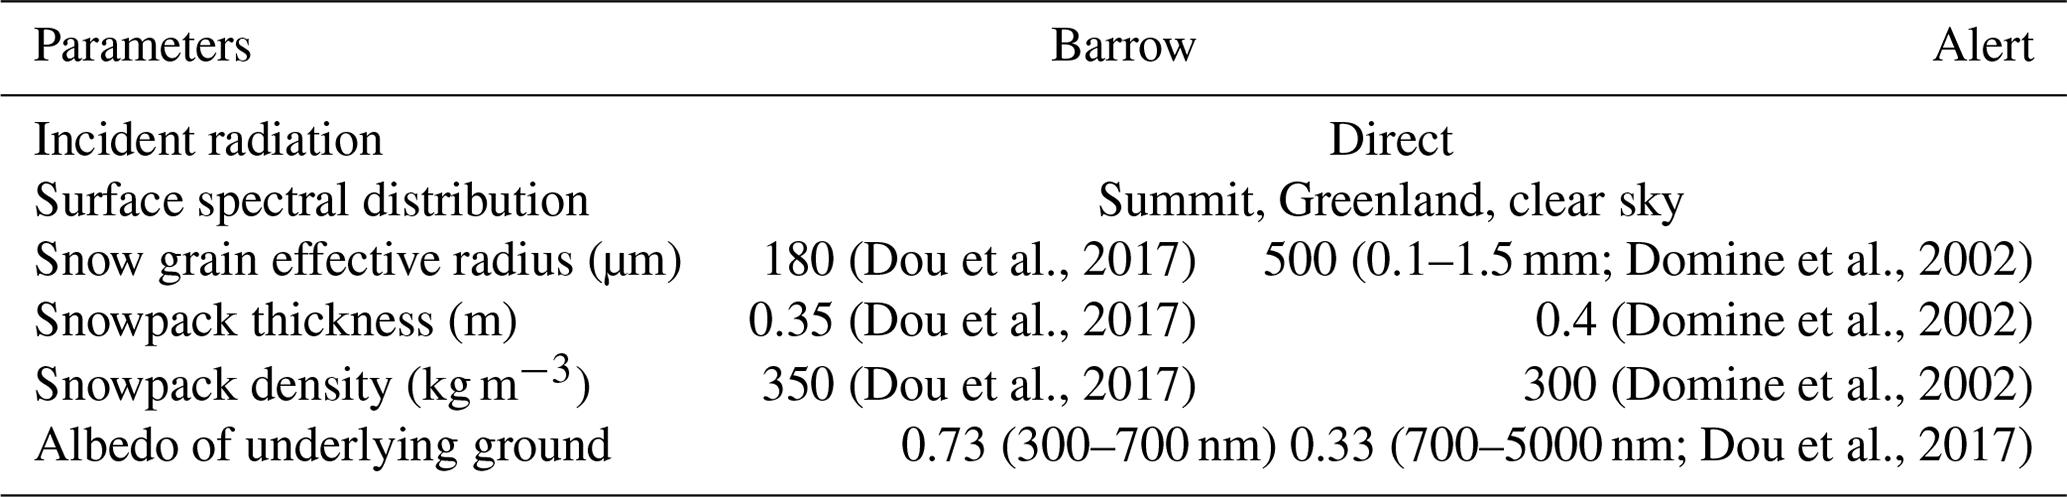
The Snow, Ice, and Aerosol Radiative (SNICAR) model was used to simulate the impact of impurity (e.g., dust, black carbon, and volcanic ash) on the surface albedo of snow and ice (Flanner et al., 2007). The application of the SNICAR model required inputs such as snow grain effective radius, snowpack thickness/density, surface albedo, and the concentrations of impurities in snow. The effective grain sizes of snow ranged from 100 µm for fresh clean snow to 1500 µm for aged snow and granular ice. Table 1 lists the parameters considered for SNICAR in this study. The parameters of snow were derived from field measurements at Barrow in April 2015 (Dou et al., 2017) and near Alert in February and April 2000 (Domine et al., 2002). The estimation of concentrations of impurities in snow will be presented in Sect. 3.7.1.
3.1 Overview of dust events in China from 2011–2015
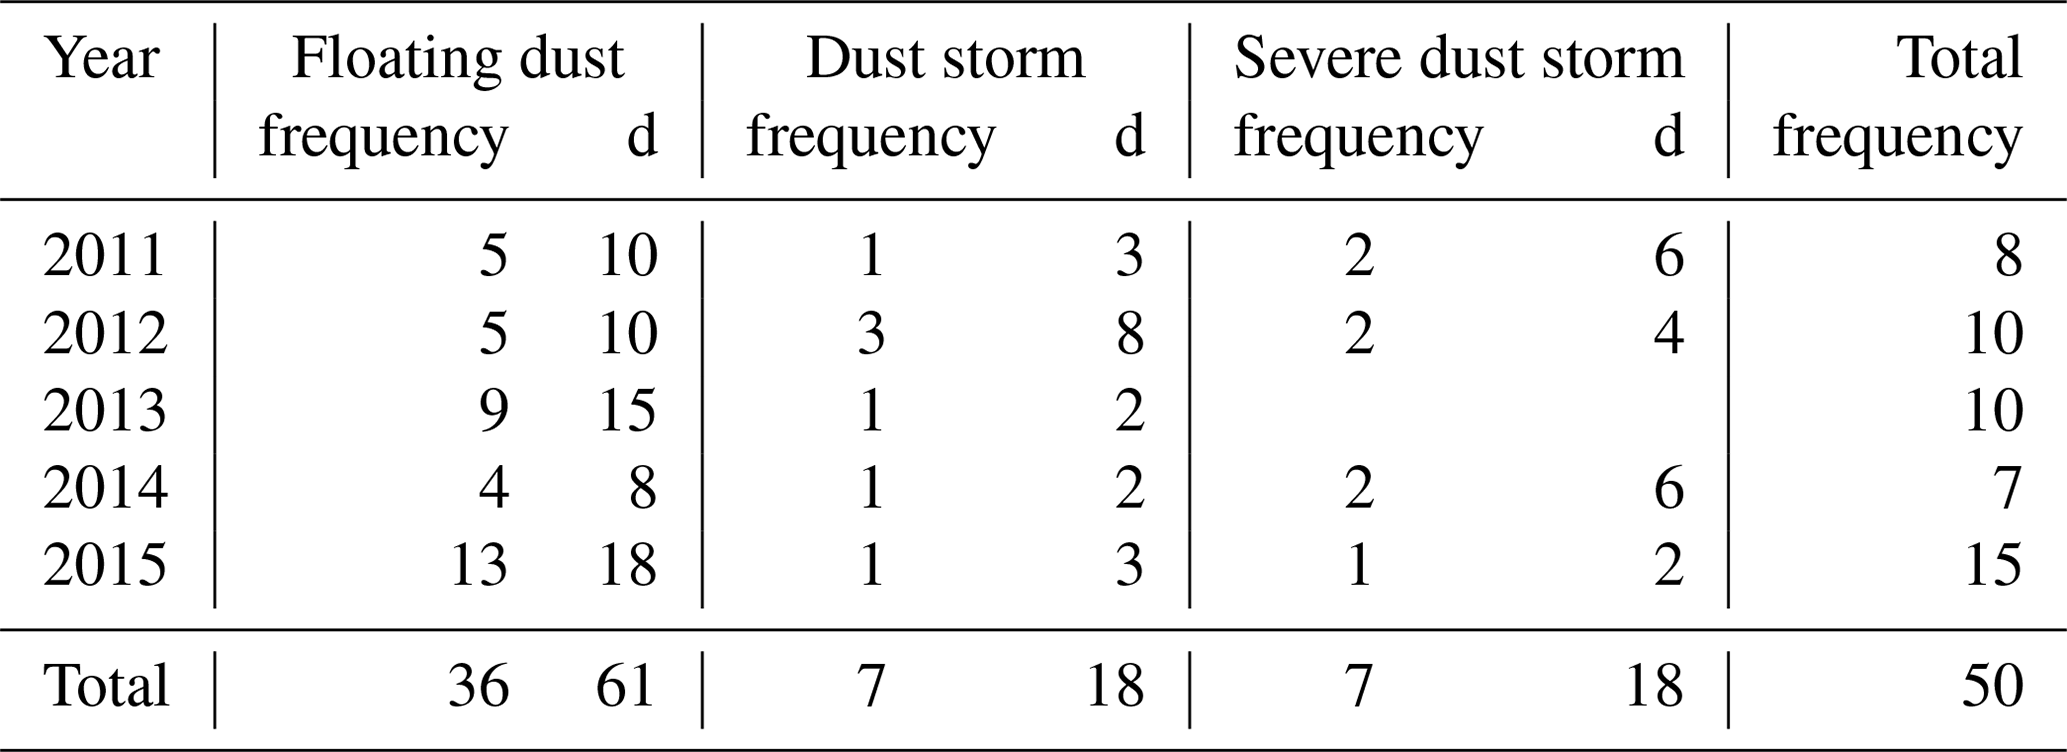
Table 2 summarizes the occurrence frequency and duration of dust events in the dust source regions of China during 2011–2015 recorded by China's Sand-dust Weather Almanac (CMA, 2013, 2014, 2015, 2016, 2017). A total of 50 dust events occurred, which were categorized into three types, i.e., floating dust, dust storm, and severe dust storm. Among them, the occurrence frequency of floating dust reached 36, accounting for 72 % of the total dust events. On average, floating dust occurred about seven times a year with a total duration of 61 d. The occurrence frequencies of dust storm and severe dust storm events were both seven times with the total duration of 18 d. Compared with 2000–2010, the frequency of dust storm and severe dust storm events during the last 5 years decreased significantly, while that of floating dust increased.
Table 2Summary of dust weather conditions in China during 2011–2015.
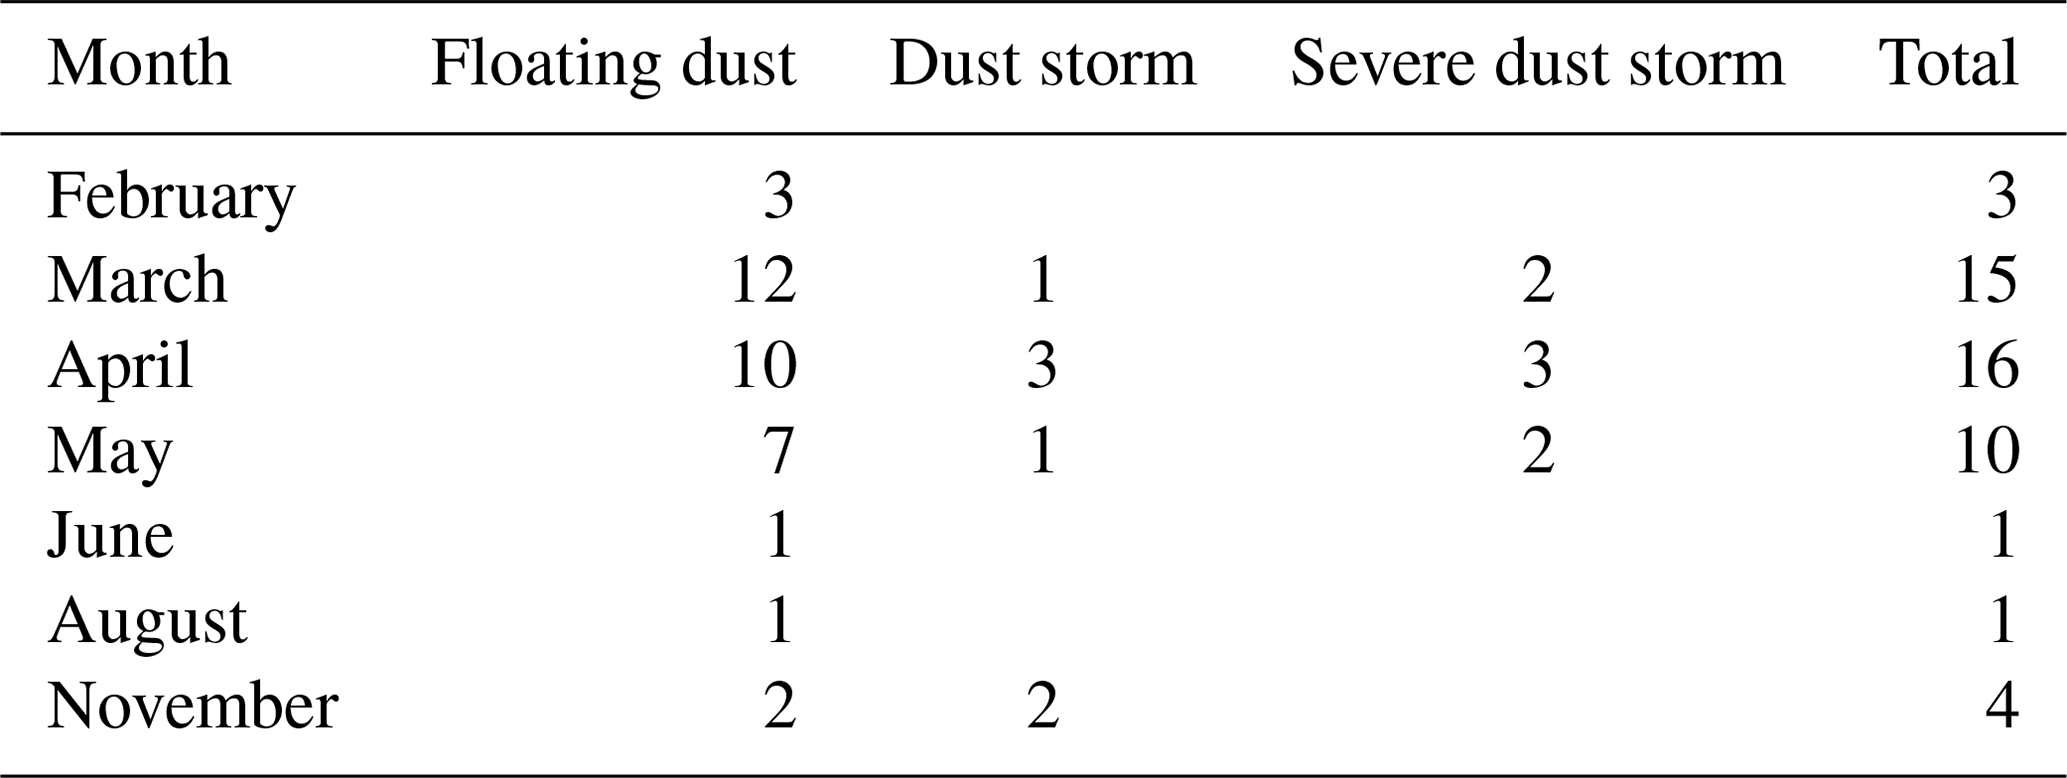
On a seasonal basis (Table 3), the springtime (March–May) was the peak period of dust outbreak in China. A total of 41 dust events occurred, accounting for 82 % of the total dust events, of which relatively high frequencies of dust storm and severe dust storm events were observed, accounting for 37.5 % of the total events in April. This high frequency of dust occurrence in the spring of China was mainly related to the climatic characteristics, geographic conditions, and geological structure of northern China. Strong winds caused by the Inner Mongolia cyclone and cold fronts in spring resulted in the frequent outbreak of dusty weather in northern China. In terms of the geographical dust source areas in China, the source regions of dust included the south Xinjiang basin, central and western Inner Mongolia, central and western Gansu, and northern Shaanxi.
Table 3Monthly summary of dust days in China during 2011–2015.
3.2 Transport pathways of Asian dust to the Arctic
In order to investigate the frequency and transport pathways of dust from China to the Arctic, the HYSPLIT trajectory model was applied in this study. Based on the outbreak time and source areas of dust recorded by China's Sand-dust Weather Almanac, 10–15 d forward trajectories starting at typical altitudes of lifted dust (500, 1000, and 1500 m) were computed for each dust event in China during 2011–2015. If the trajectories entered the Arctic Circle (latitudes higher than 66∘34′ N), the specific dust event was recorded as one dust long-range transport event from China to the Arctic.
Based on this criterion, 38 out of the 50 dust events that originated from China during 2011–2015 had the potential of migrating to the Arctic Circle. Among these identified dust events, most occurred in spring with 32 events, and the transport duration varied between 4 and 13 d. Two main types of dust transport from China to the Arctic were distinguished in Fig. 2. As for type I (Fig. 2a), dust mainly originated from the central parts of Inner Mongolia and central Gansu. It passed through northern China, the Korean Peninsula, Japan and the North Pacific Ocean, and finally reached Siberia and the northern part of Alaska. This transport type was characterized by wide geographic coverage, relatively long transport duration (about 7–10 d), and mainly over the open ocean. This was due to the high lifting altitude (mostly over 1500 m) over the dust source regions, so particles can be transported to even further areas.
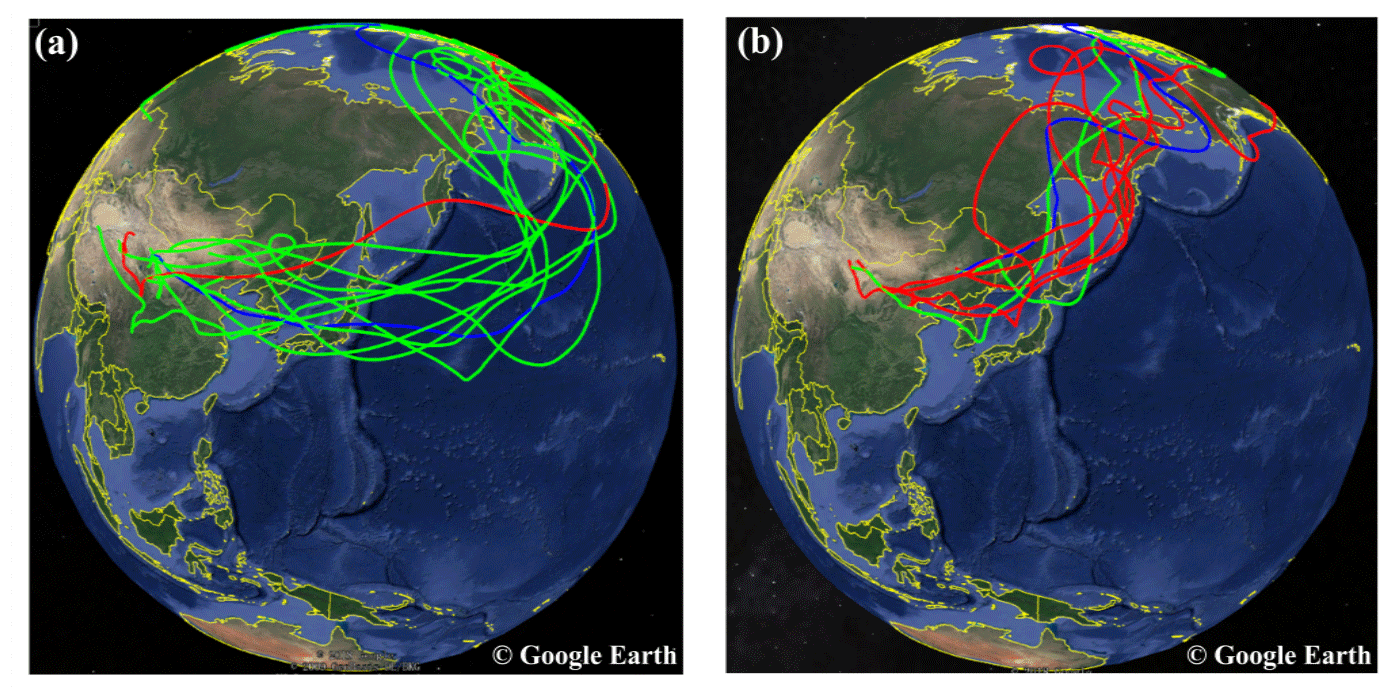
Figure 2Two common transport pathways of dust originating from China to the Arctic, i.e., (a) the northern China–Korean Peninsula/Japan–North Pacific Ocean–Arctic pathway and (b) the northern China–Korean Peninsula/Japan–Kamchatka Peninsula–East Siberia–Arctic pathway. Red, blue, and green curves represent forward trajectories starting at altitudes of 500, 1000, and 1500 m, respectively. © Google Earth 2019.
As for type II (Fig. 2b), dust mainly originates from northeast China and western Inner Mongolia; then passes over the Korean Peninsula, northern Japan, and the Kamchatka Peninsula; and finally reaches East Siberia and its northern areas. Compared to type I, the type II transport pathways traveled more over land and had relatively shorter duration of about 4–8 d. This was due to the presence of a low-pressure system over northern Japan in spring, which induced the air masses deflecting northward. In Sect. 3.4, more details about the low-pressure system will be presented based on case analysis. More explicit characterizations of the transport pathways from the dust source regions to the Arctic will be discussed later in Sect. 3.5.
3.3 Two cases of long-range-transported dust to the Arctic
Figure 3a shows the time series of scattering coefficients (σsp) of PM1 and PM10 at 550 nm at Barrow during 17–21 April 2015. The scattering coefficients stayed at low levels from the early morning of 17 April to the evening of 18 April, which were similar to the annual average values at Barrow in 2015 (4.8 and 8.1 Mm−1 for PM1 and PM10, respectively). Since the early morning of 19 April both σsp(PM1) and σsp(PM10) climbed simultaneously, indicating the invasion of air pollutants. At 15:00 UTC on 19 April, σsp(PM1) reached relatively high value of 19.8 Mm−1 and was still close to that of PM10 with the σsp(PM(PM10) ratio of 0.82, indicating fine particles dominated during this period. Afterwards, σsp(PM10) continued to increase until it reached the maximum value of 42.2 Mm−1 at 04:00 UTC on 20 April, more than 5 times its annual average. The mean σsp(PM(PM10) ratio during 14:00 UTC, 19 April–12:00 UTC on 21 April decreased to 0.47±0.10, obviously indicating the enrichment of coarse particles. This episode is defined as CASE I.
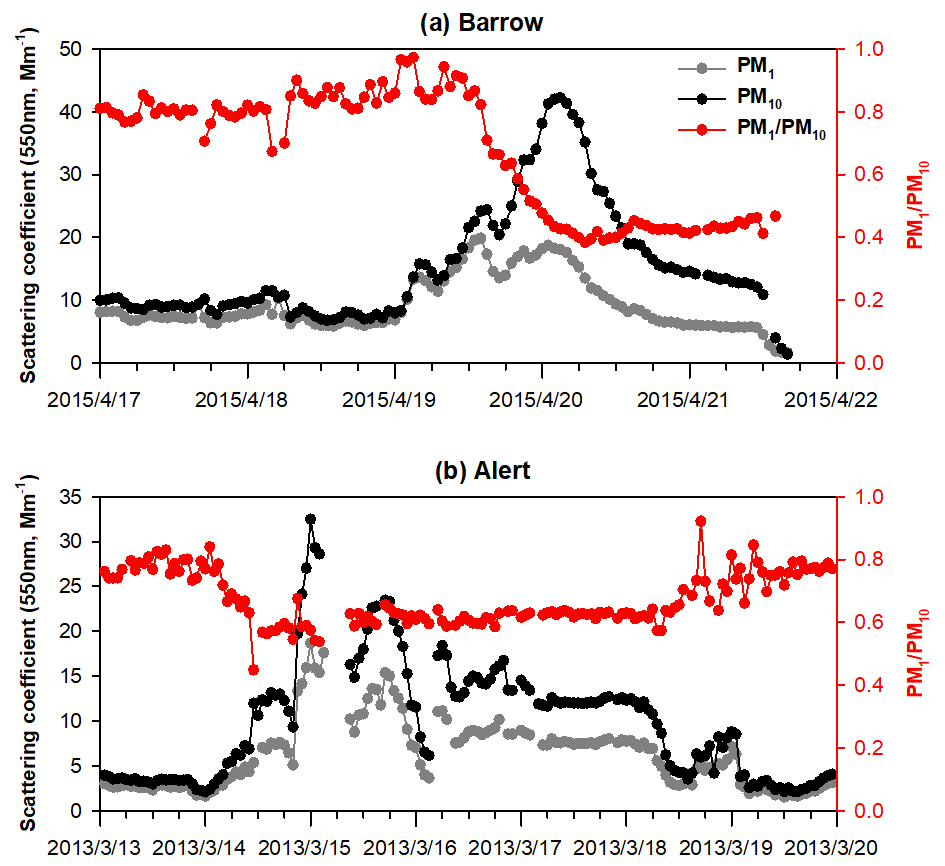
Figure 3(a) Time series of hourly scattering coefficients of PM1 and PM10 at 550 nm and the ratio of PMPM10 at Barrow during 17–21 April 2015. (b) The same but for Alert during 13 to 19 March 2013.
Figure 3b shows the time series of scattering coefficients of PM1 and PM10 at 550 nm at Alert from 13–19 March 2013. The annual average σsp(PM1) and σsp(PM10) at Alert was 4.2 and 6.0 Mm−1, respectively, slightly lower than those observed at Barrow. From 00:00 UTC on 14 March, σsp(PM1) and σsp(PM10) started to increase and reached the maximum values of 18.6 and 32.3 Mm−1 at 00:00 UTC on 15 March, which were more than 4 and 5 times their annual average, respectively. The mean σsp(PM(PM10) ratio during 11:00 UTC on 14 March to 07:00 UTC on 18 March was 0.61±0.03, also indicating the enrichment of coarse particles. This episode is defined as CASE II.
In comparison, the pollution during CASE I lasted for a relatively short period of about 2.5 d while it had higher peak values of σsp(PM10) than CASE II, indicating that CASE I was subject to stronger long-range transport and more significant variations of synoptic conditions. The pollution during CASE II lasted for nearly 4 d, suggesting relatively weak cleanup processes of the air pollutants. As for the σsp(PM(PM10) ratio, it was much lower in CASE I than that in CASE II. This indicated the intrusion of coarse particles was more intense during CASE I, which could be related to various factors such as the emission source regions, transport pathways, and evolution of particles. In the next section, the transport pathways of the two cases above were validated by using backward trajectory analysis and remote sensing from both space- and ground-based observations.
3.4 Identification of dust long-range transport pathways
To determine the sources and transport pathways of the two Arctic pollution events, the HYSPLIT model was applied to compute the air mass transport trajectories. Figure 4a shows the 7 d backward trajectory simulated at an altitude of 6 km above Barrow starting from 04:00 UTC on 20 April 2015 (CASE I). The different segments of the trajectory were colored to represent the continuous dates. On 14–15 April, air masses originated from the Taklamakan and Gobi deserts in China; then passed over East Asia, Siberia of Russia, and the Pacific Ocean; and finally reached Barrow about 6 d later. The geopotential height fields based on the NCEP reanalysis data are plotted in Fig. 4c–f to verify the dust transport path. On 16 April a low-pressure trough over Northeast China caused the eastward air masses to turn northward. On 17 April the air masses followed the high-pressure ridge over eastern Russia and entered the North Pacific. Then its direction was again deflected by a low-pressure system near the Bering Strait on 18 and 19 April, finally reaching Barrow on 20 April.
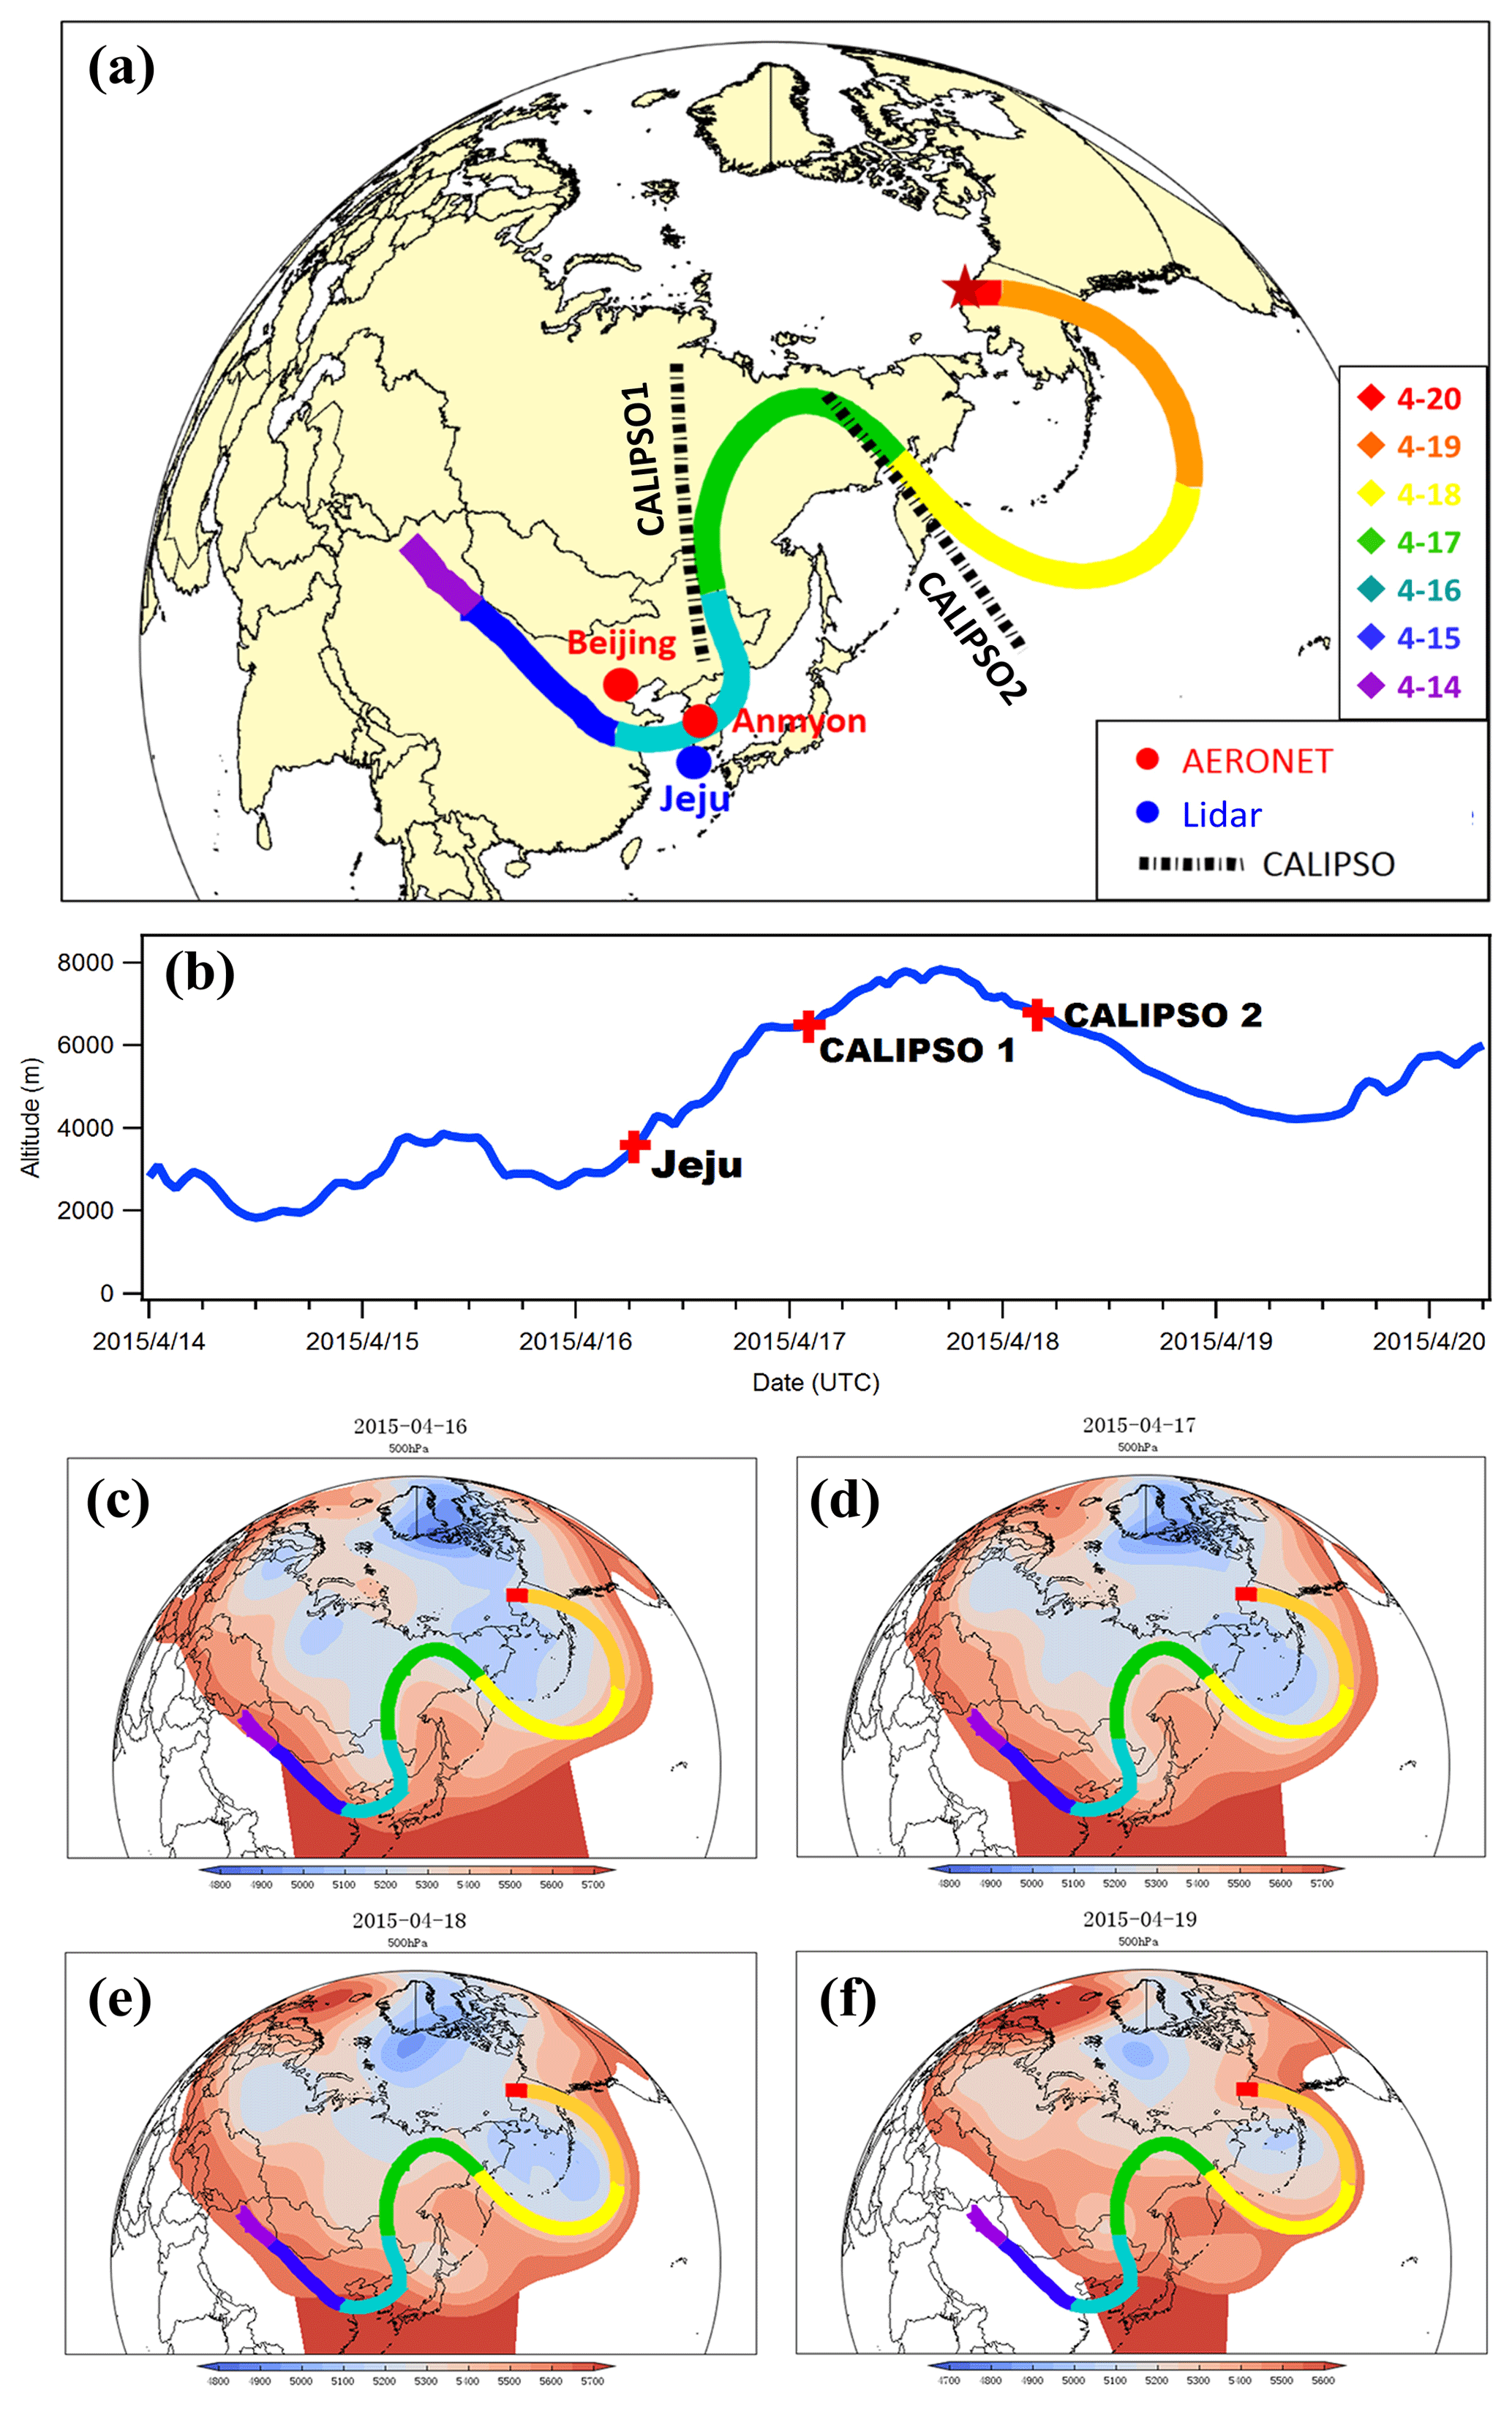
Figure 4(a) The 7 d backward trajectory simulated at an altitude of 6 km above Barrow starting from 04:00 UTC on 20 April 2015. The locations of AERONET, lidar sites, and CALIPSO tracks near the trajectory are plotted. (b) The height of the trajectory along the transport path. The height and time of dust layers observed by lidars and CALIPSO in Fig. 4a are indicated by the red plus symbols. (c–f) Daily geopotential height fields (500 hPa) from the NCEP reanalysis data.
Figure 5a shows a typical backward trajectory simulated at an altitude of 4 km above Alert on 14 March 2013 (CASE II). On 7 March air masses traveled over the Gobi Desert on the border between Mongolia and the north of China, then passed over Korea and Japan, and directly entered the Pacific Ocean. Afterwards, they kept moving northward across the Arctic Ocean and reached Alert on 14 March. Based on the geopotential heights (Fig. 5c–h), a low-pressure system was observed over the eastern coast of Russia and kept moving to the southeast from 7 to 11 March. On 11 March the low-pressure system moved over the Sea of Okhotsk in Russia and turned to be stronger, causing the air masses to deflect and follow the geopotential height contours all the way north to Alert.
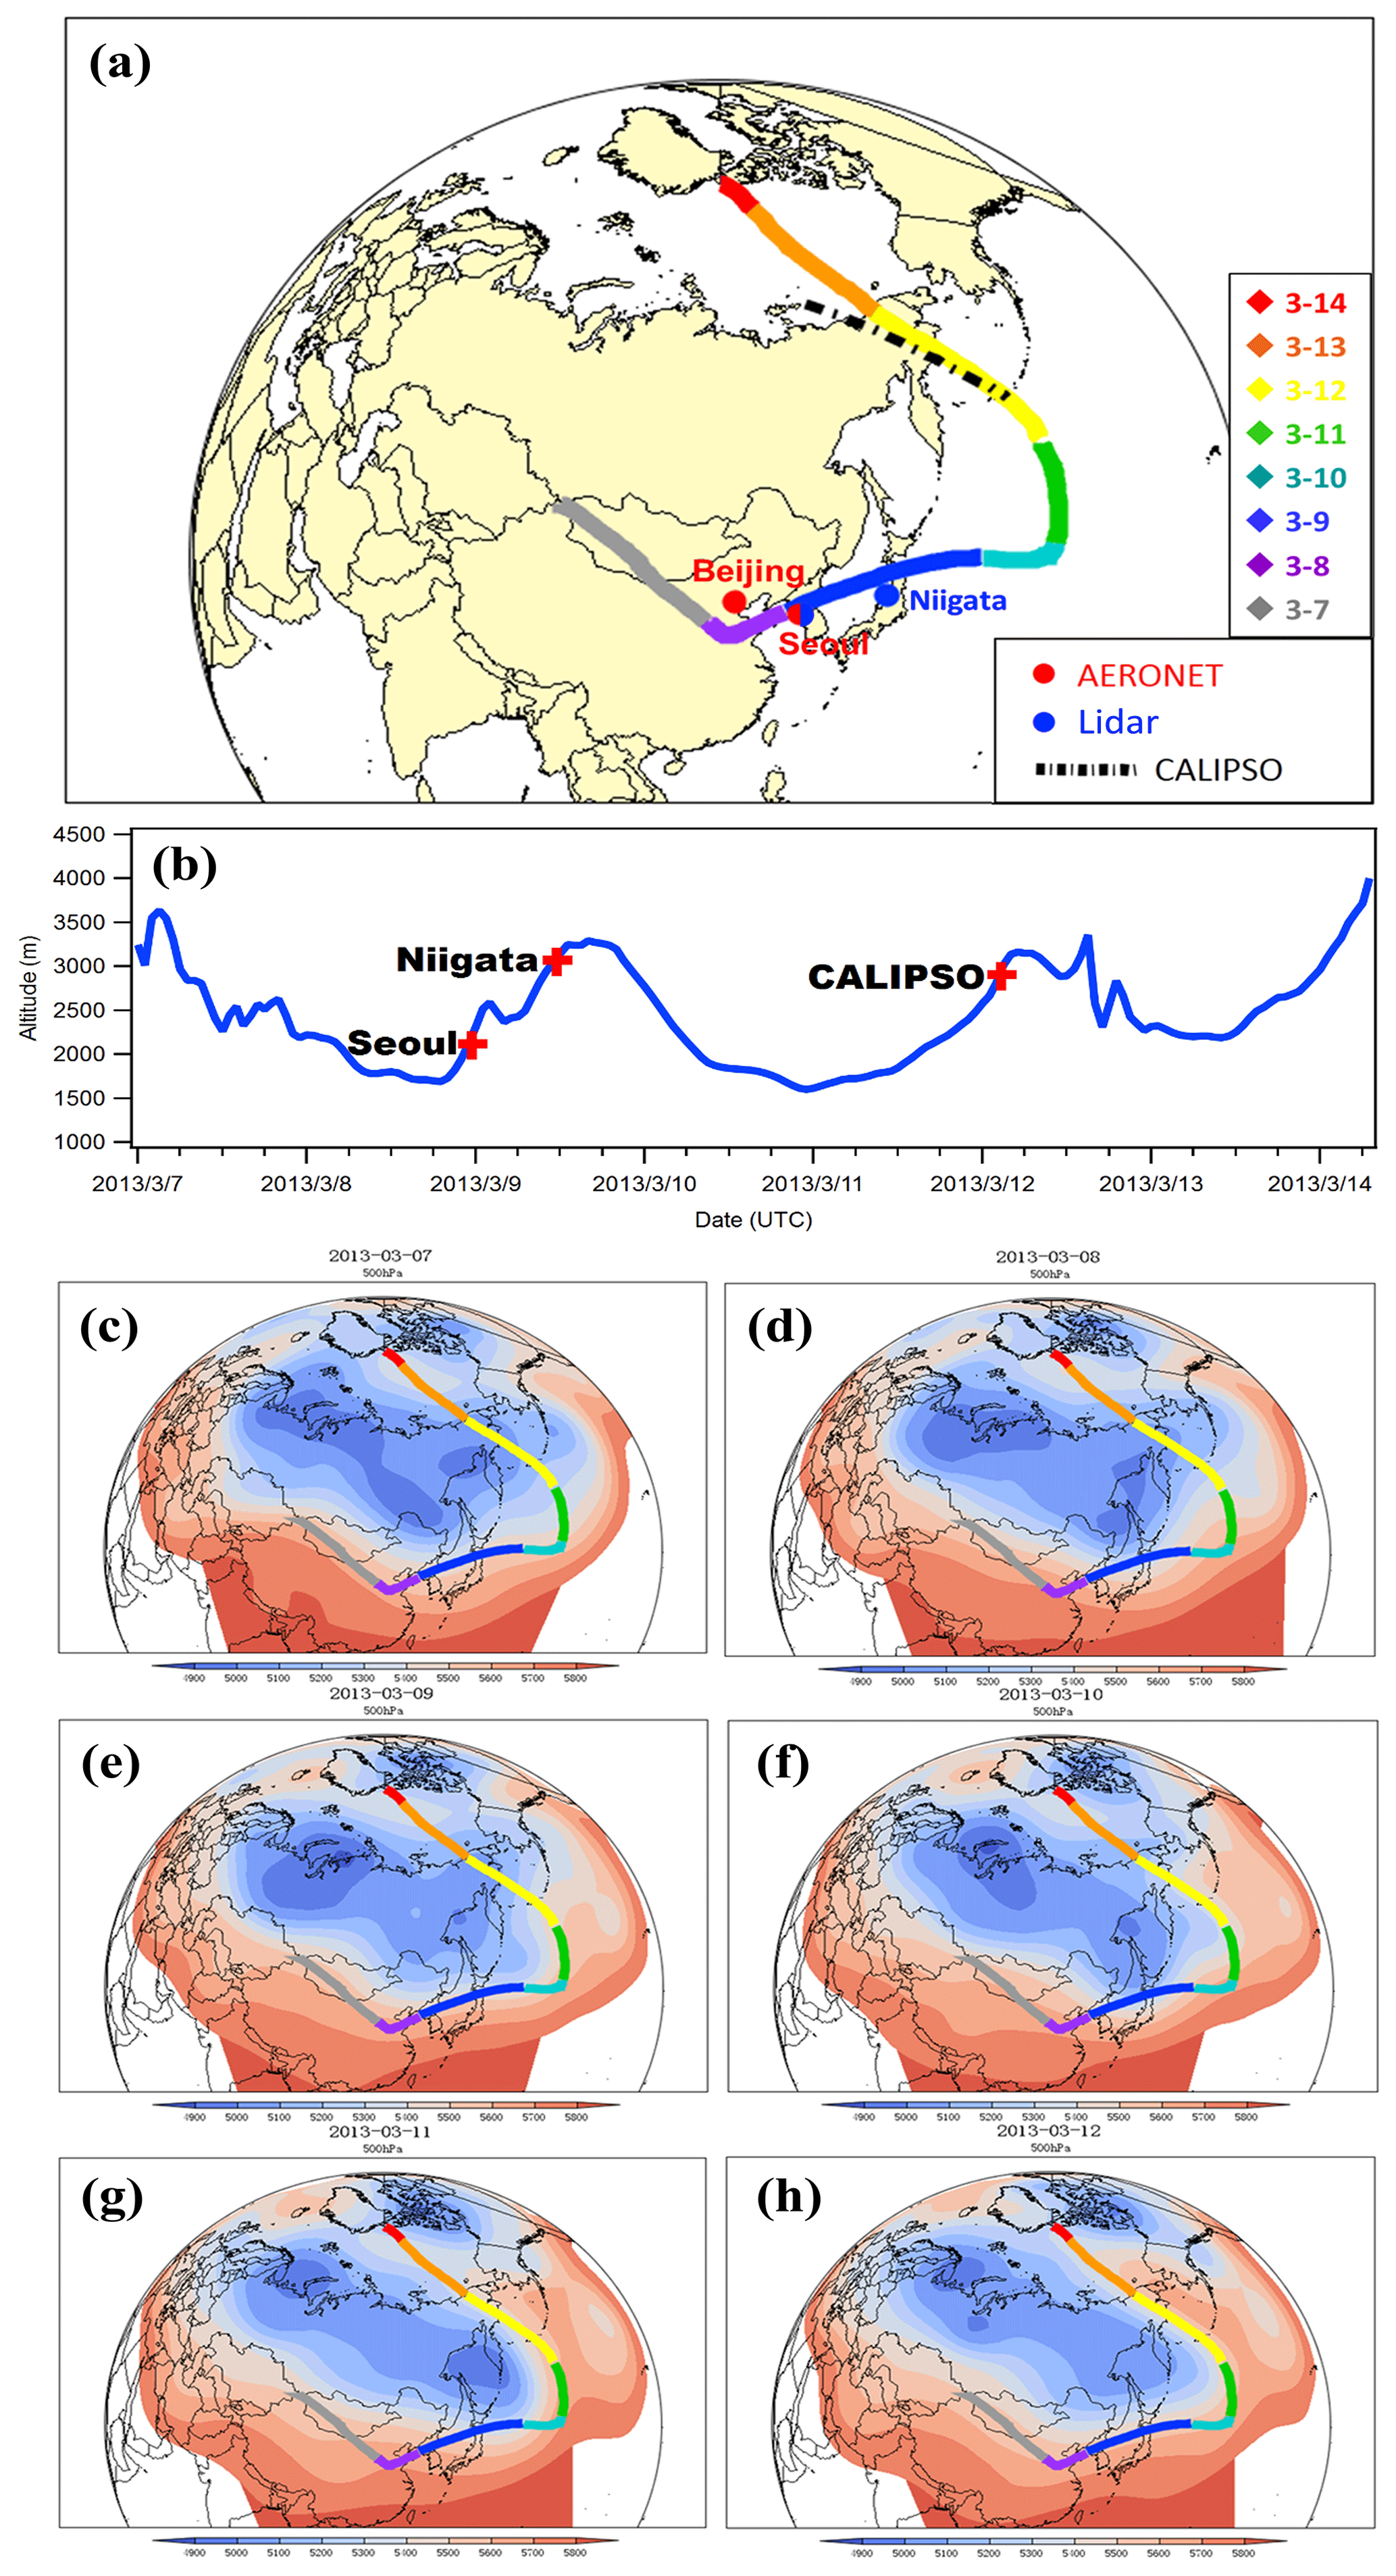
Figure 5Same as Fig. 4 but for CASE II.
3.5 Verification of dust transport pathways based on satellite and ground-based observations
Although the air mass transport pathways of the two Arctic coarse particle pollution cases were visualized based on trajectory modeling, whether dust particles were indeed present in the air masses has not been confirmed. In this section, the aerosol optical properties along the transport pathway were explored using both ground-based observations (AERONET and AD-Net) and satellite inversion data (CALIPSO). In Figs. 4a and 5a, the red dots denoted the AERONET sites, which observed columnar aerosol optical properties. The blue dots denoted the AD-Net sites, which observed vertical profiles of aerosol extinctions and particle morphology information. The black dashed lines represented the orbits of CALIPSO profiles, which were used to supplement the aerosol information in the blank areas without available ground-based observations. The validation results of the two cases are described separately as below.
3.5.1 CASE I
Figure 6 shows the aerosol optical properties of two AERONET sites, i.e., Beijing (China) and Anmyon (Korea), which were located near the air mass transport pathway in CASE I (Fig. 4a). AE (Angström exponent) is a parameter of characterizing the particle size. The smaller AE represents the larger particle size, and vice versa. In general, AE <1 suggested the dominance of coarse particles, which were usually associated with dust or sea salts, while AE >1 suggested the dominance of fine particles, which derived from anthropogenic emissions and biomass burning.
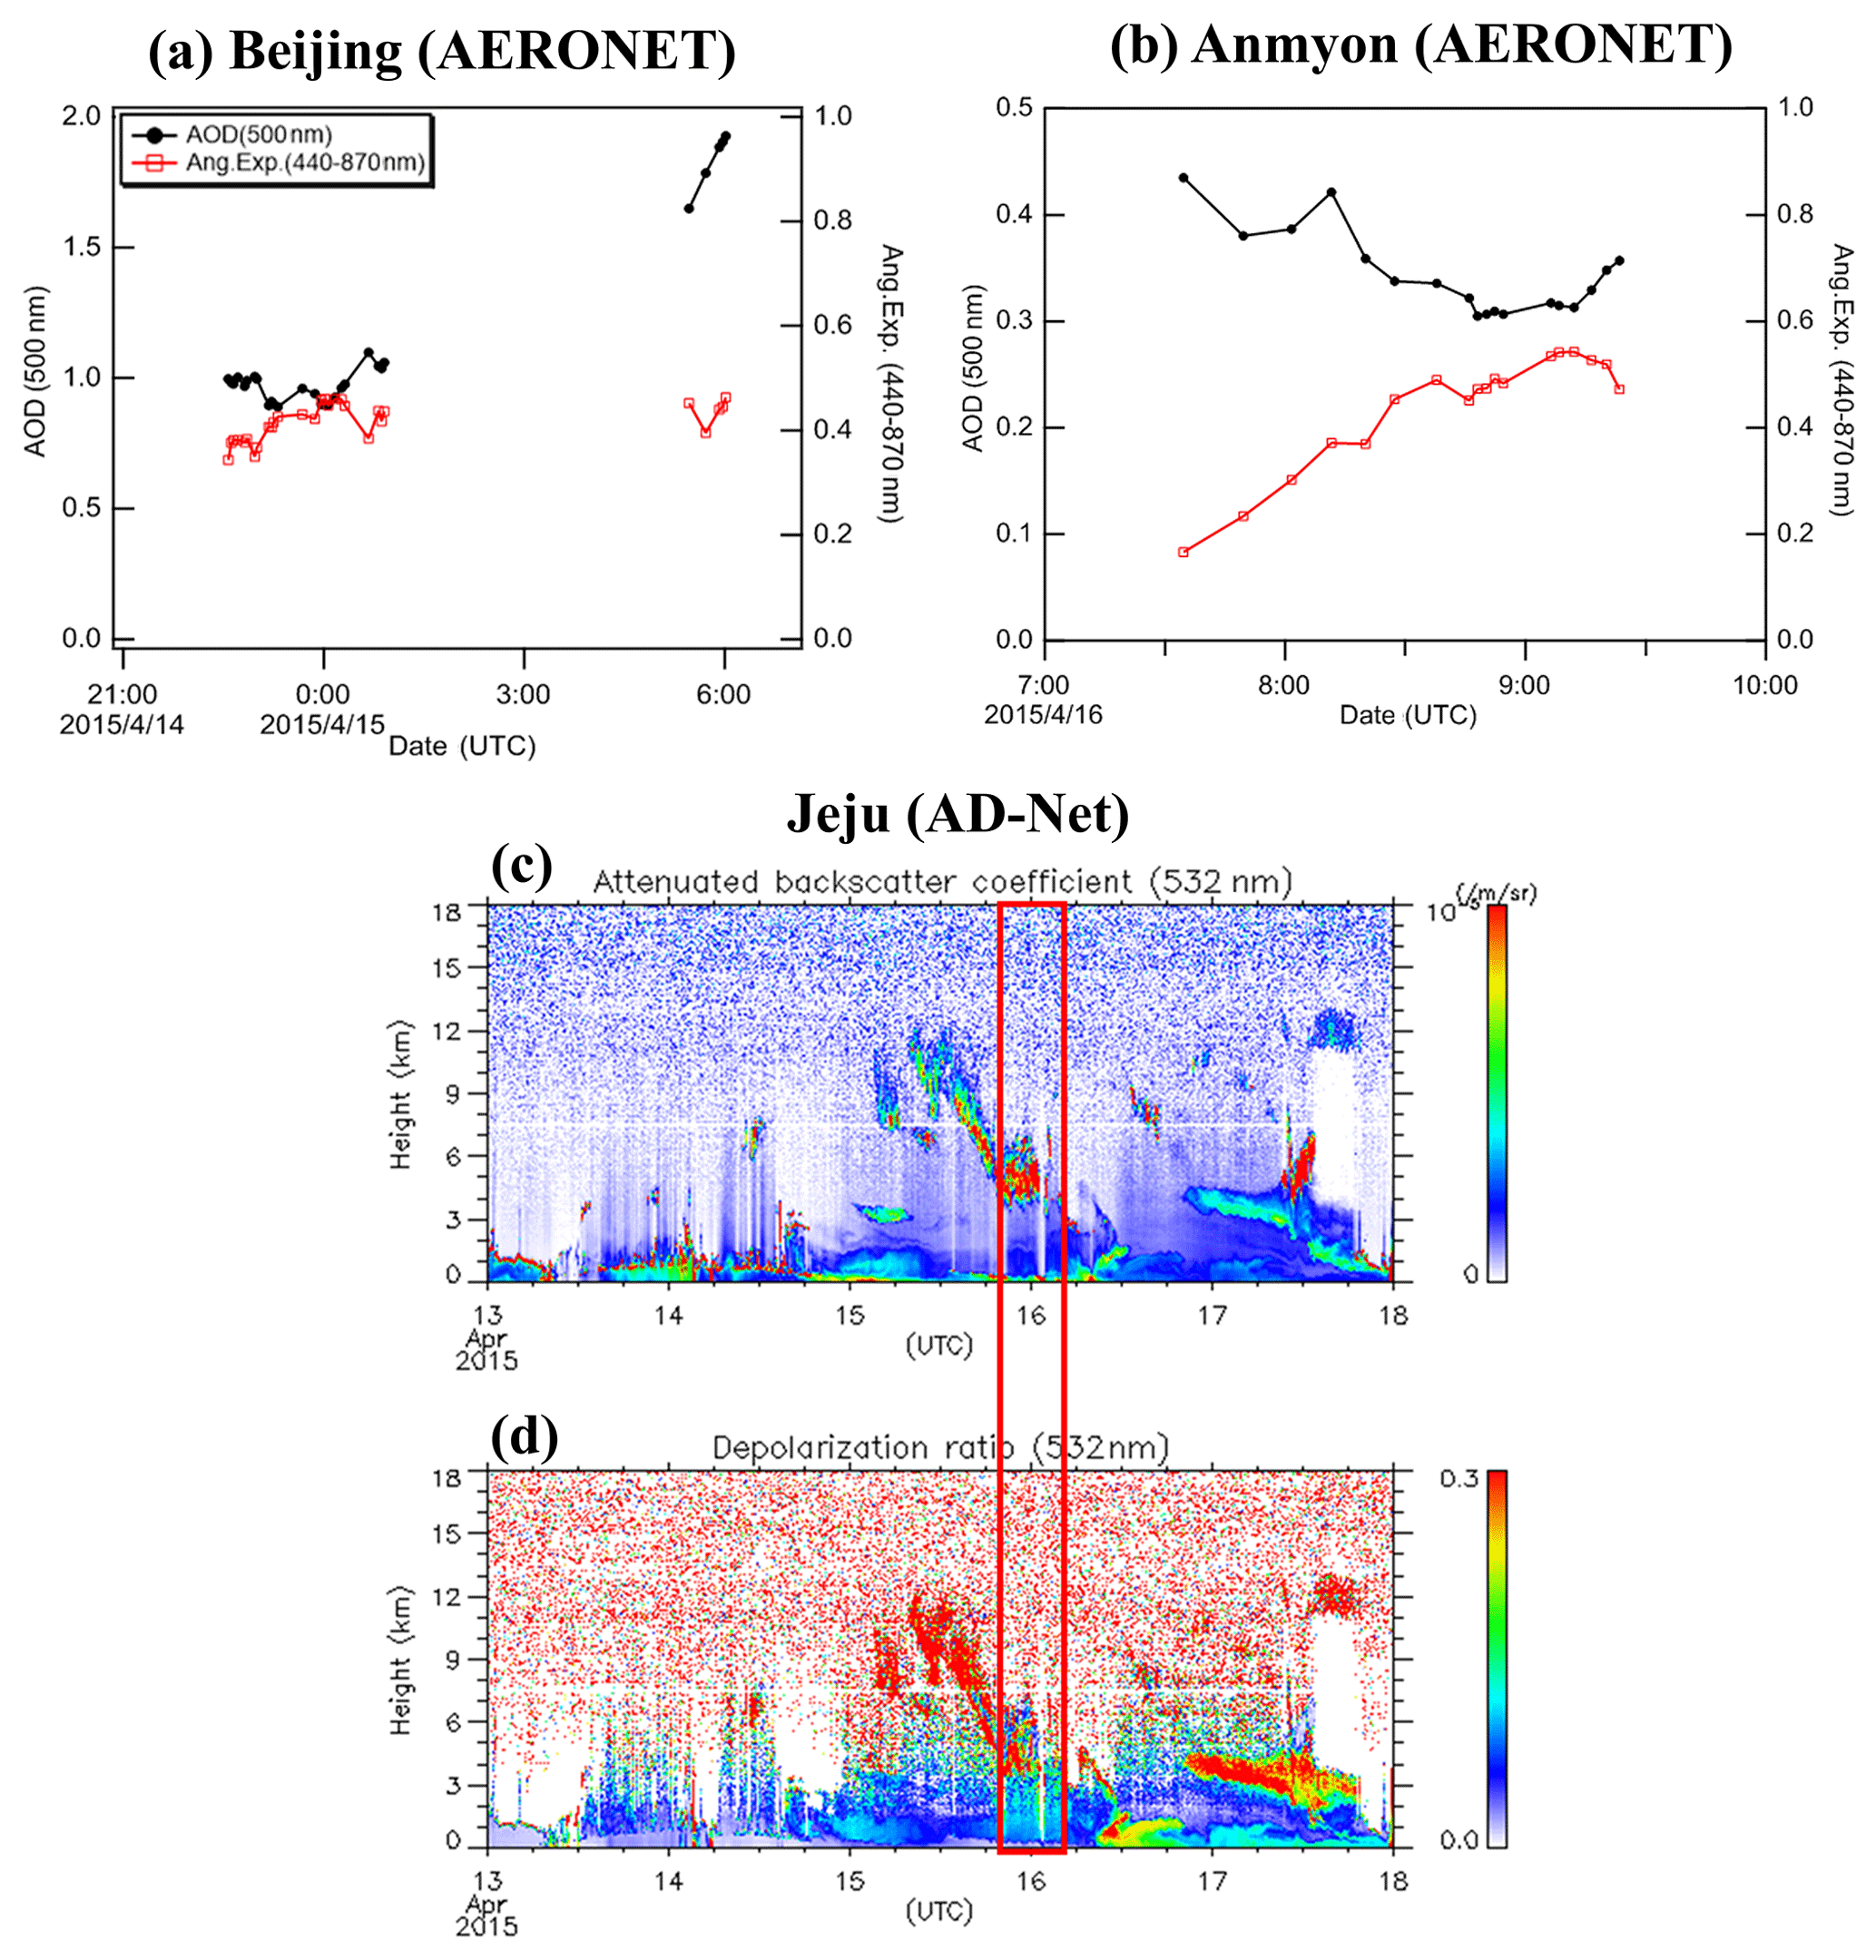
Figure 6Aerosol optical properties observed at ground-based sites during CASE I. (a) AOD (500 nm) and Angström exponent (440–870 nm) at the Beijing AERONET site. (b) AOD and Angström exponent at the Anmyon AERONET site. Vertical profiles of (c) backscattering coefficient and (d) depolarization ratio at the Jeju AD-Net site. The red rectangle denotes the time when dust passed over the site. Clouds are screened and represented by the blank pixels.
As shown in Figure 6a, AOD over Beijing doubled from about 1.0 at around 00:00 UTC on 15 April to nearly 2.0 at around 06:00 UTC, while AE (440–870 nm) remained below 0.5. When the air masses passed over Anmyon, Korea, AOD was about 0.4 at 08:00 UTC on 16 April (Fig. 6b). AOD at Anmyon was much lower compared to Beijing, which should be due to the removal process during the transport and lower local emissions at Anmyon. Similarly, AE at this site was low below 0.4, and it slightly increased to above 0.5 after 08:00 UTC. As a whole, the observation of high AOD and low AE at both sites indicated that the air masses contained abundant coarse dust aerosols.
Figure 6c shows the vertical profiles of aerosol optical properties over Jeju Island, Korea. The depolarization ratio represents the degree of particle approximation to a sphere in the range of 0–1. The depolarization ratio of a spherical object is equal to 0, and vice versa (Mishra et al., 2010). Since dust aerosols were irregularly shaped particles, the depolarization ratio of dust aerosols usually ranged between 0.2 and 0.3. As for the intense dust storm events, the depolarization ratio of particles could reach over 0.4 (Liu et al., 2003). High extinction coefficients and depolarization ratios between 0.1 and 0.3 at around 4 km over Jeju in the early morning of 16 April 2015 were observed. By comparing the simulated height of the air mass backward trajectory and the observed plume height over Jeju, good agreement was found (Fig. 4b), corroborating the same origin of the Arctic pollution and the Asian downstream dust plumes.
After 16 April the dust plume moved towards Russia and the North Pacific. Due to the lacking of ground-based observations in this region, CALIPSO inversion products were used to fill in these blank regions. At about 05:00 UTC on 17 April 2015, over the northeastern part of Russia (54.19∘ N, 122.17∘ E), CALIPSO observed an aerosol layer, about 5 km above the ground. This height was generally consistent with that of the simulated backward trajectory (Fig. 4b), and the plume was identified as a mixture of dust, polluted dust, and other types of aerosols (Fig. 7). At 02:00 UTC on 18 April, CALIPSO observed a similar mixed layer of dust, polluting dust, and lifted smoke at 4–6 km over the Kamchatka Peninsula in Russia (Fig. 7). Compared to the previous day, the lifted smoke was more abundant, suggesting that smoke aerosols from forest fires may have been mixed with the air masses passed over Russia.
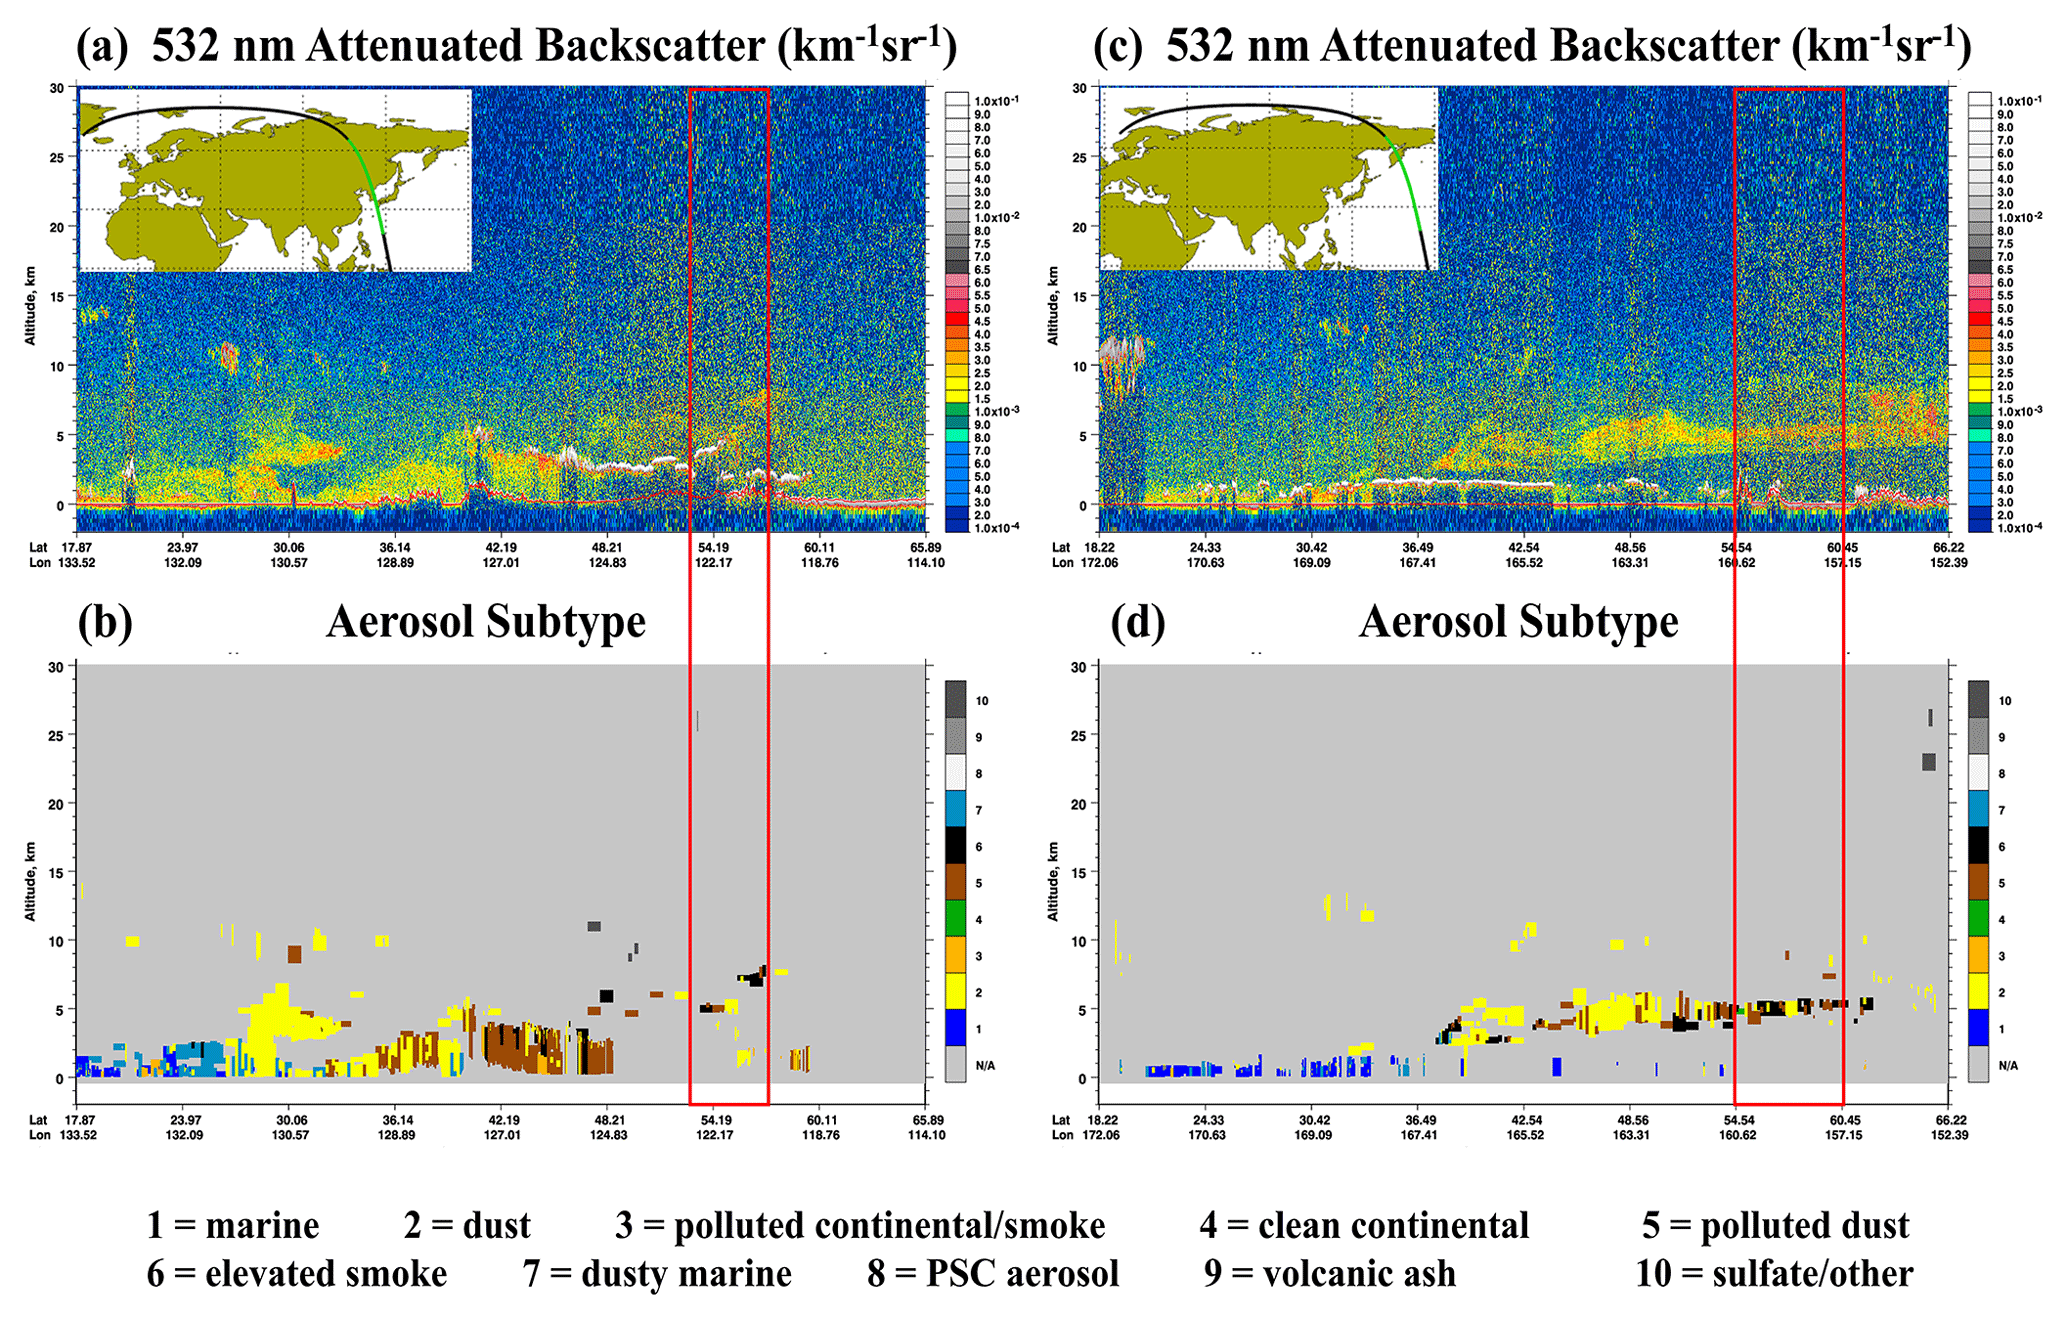
Figure 7CALIPSO profiles of aerosol backscattering coefficients and identified aerosol types on 17 (a–b) and 18 April 2015 (c–d). The red rectangles denote the regions as indicated by the CALIPSO tracks in Fig. 4a.
3.5.2 CASE II
Figure 8 shows the available ground-based observations close to the transport pathway during CASE II. At the Beijing AERONET site, at 03:00 UTC on 8 March 2013, AOD was 0.73 while AE was 0.47. This was indicative of the dominance of dust particles. Afterwards at 08:00 UTC, AOD increased more than twice and approached 2.5, while AE also increased to more than 0.9, indicating that the dust in CASE II was more mixed with fine particles than CASE I.
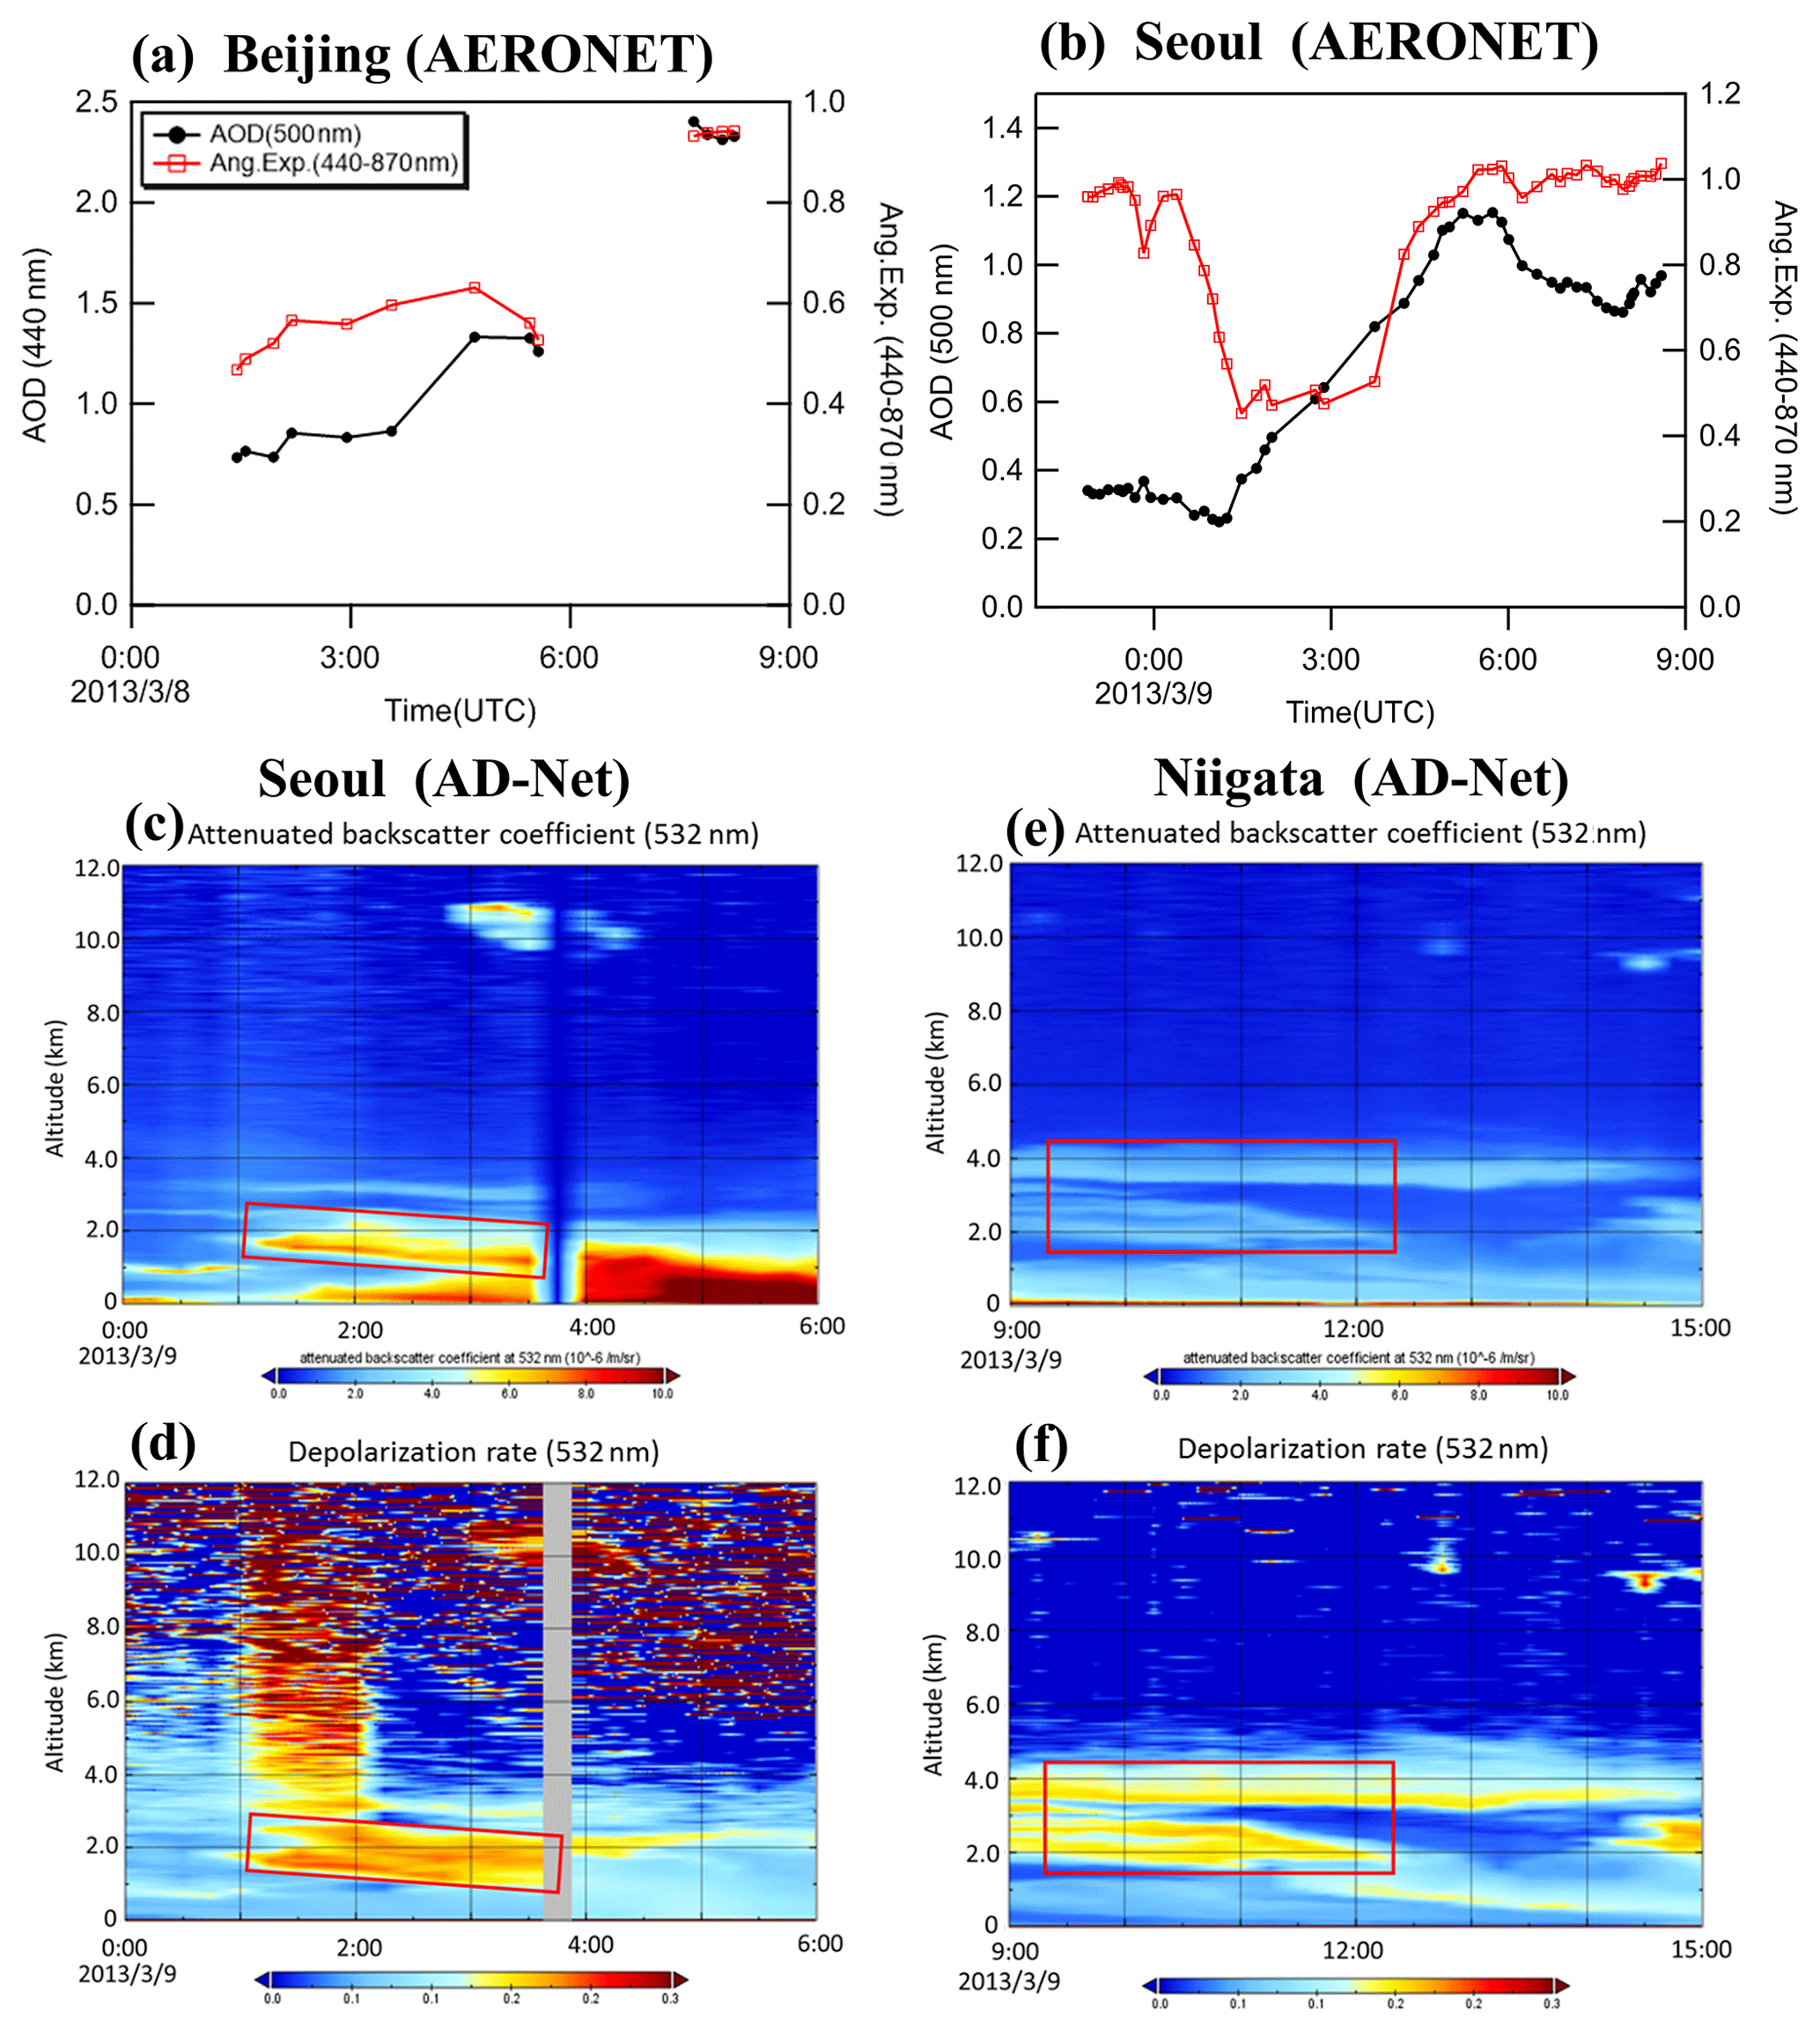
Figure 8Aerosol optical properties observed at ground-based sites during CASE II. (a) AOD (550 nm) and Angström exponent (440–870 nm) at the Beijing AERONET site, (b) AOD and Angström exponent at the Seoul AERONET site, (c–d) vertical profiles of backscattering coefficient and depolarization ratio at the Seoul AD-Net site, and (e–f) vertical profiles of backscattering coefficient and depolarization ratio at the Niigata AD-Net site. The red rectangle denotes the time when dust passed over the site.
From 00:00 to 06:00 UTC on 9 March 2013, observed AE at the Seoul AERONET site decreased to a low level of about 0.6 and increased to around 1.0 for several hours. This process was accompanied by a continuous increase in AOD, reaching a maximum of 1.15. In addition, the vertical profiles of the aerosol optical properties in the early morning of 9 March indicated a 1–2 km thick dust layer at altitudes of 1–3 km height over Seoul (Fig. 8c), which was in good agreement with the height of the backward trajectory (Fig. 5b). Figure 8d shows the lidar vertical observations in Niigata, Japan. A 1–2 km thick dust layer at altitudes of 2–4 km was also observed at 09:00–12:00 UTC on 9 March. The heights of the dust layers observed from lidars were also in good agreement with the time and height of the simulated backward trajectory as shown in Fig. 5b.
Figure 9 shows the aerosol vertical structure observed from CALIPSO over the Bering Sea (51.28∘ N, 175.96∘ E–57.23∘ N, 172.96∘ E) on 12 March 2013. At around 2.5–4 km, an aerosol layer was evident, consisting of dust and polluted dust, confirming that the aerosols transported to the remote ocean still contained a large amount of dust particles.
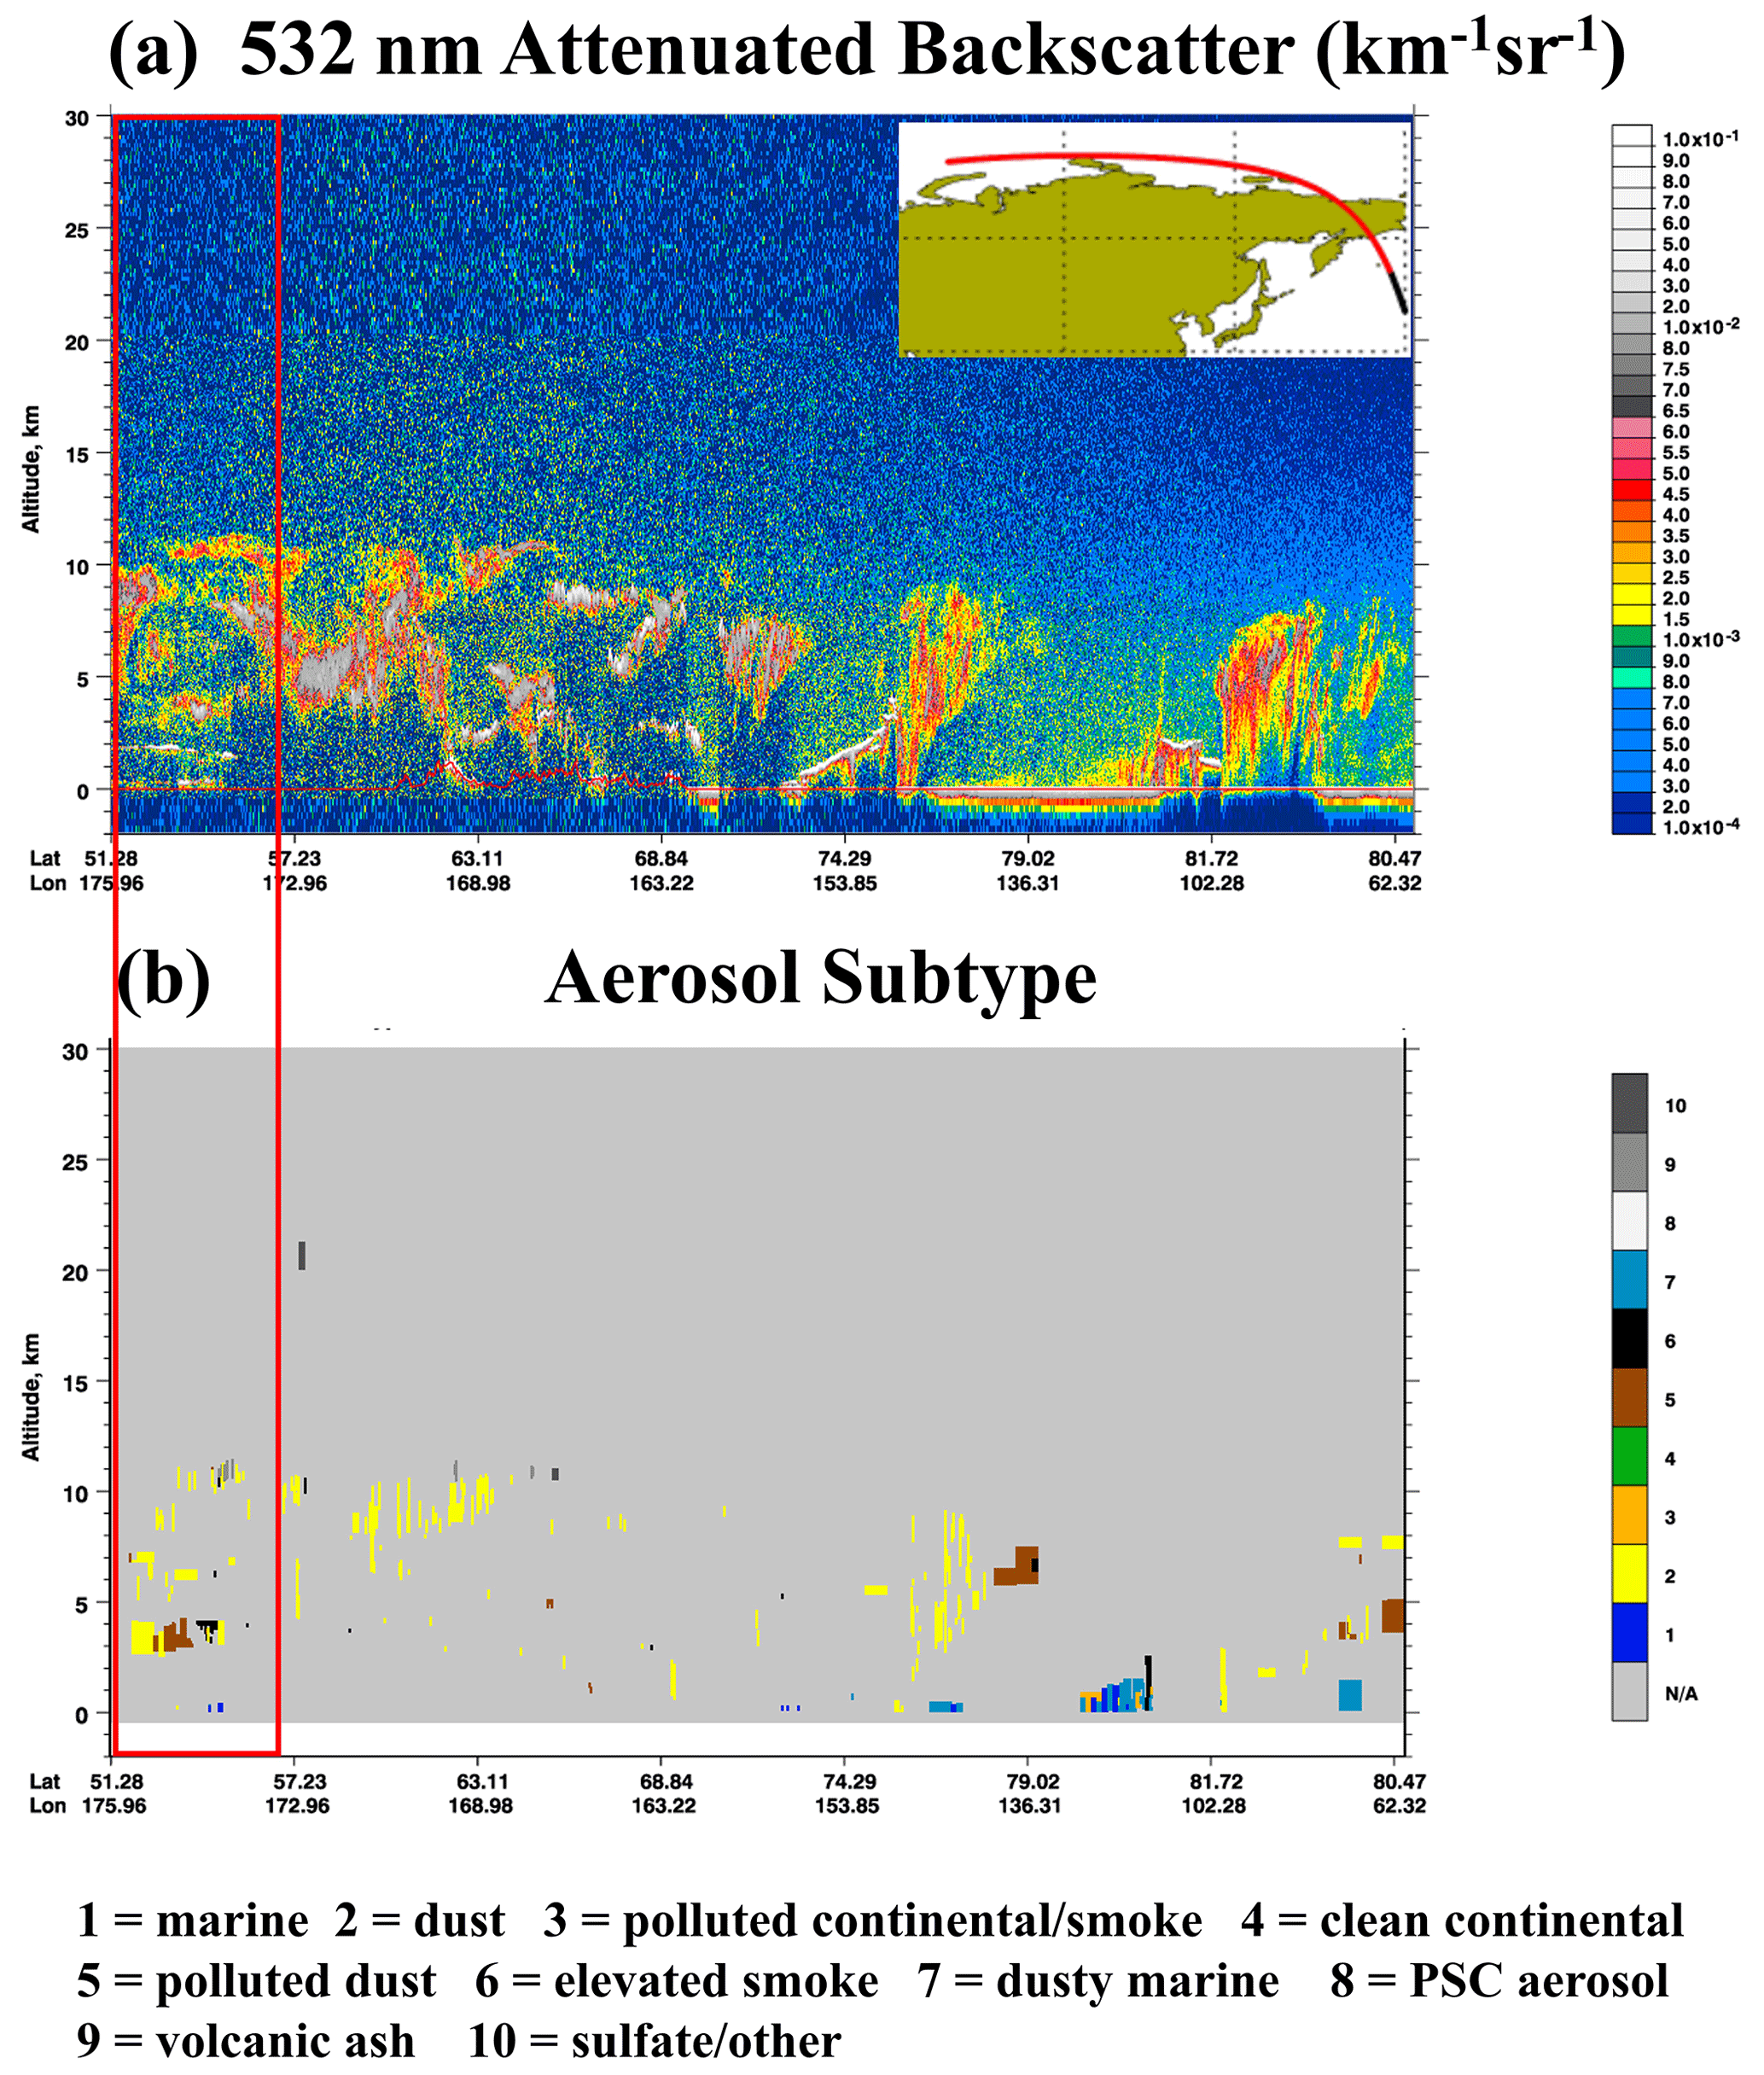
Figure 9CALIPSO profiles of (a) aerosol backscattering coefficients and (b) identified aerosol types on 12 March 2013. The red rectangles denote the regions as indicated by the CALIPSO tracks in Fig. 5a.
By comparing the transport pathways of CASE I and CASE II, CASE I passed over more terrestrial areas, increasing the probability of mixing between dust and air pollutants from anthropogenic emissions, while CASE II traveled more over the open ocean, which was more likely to mix with sea salts. In terms of transport time, the air masses in CASE I took about 4 d to reach the receptor after getting out of the Asian dust source regions, while the air masses in CASE II took about 6 d. The longer transport time in CASE II may lead to more deposition of coarse dust particles due to the gravitational effect and other removing processes such as wet scavenging.
3.6 Evolution of aerosol optical properties during long-range transport to the Arctic
In the previous section, it has been well demonstrated that the Arctic air pollution events in both CASE I and CASE II were caused by the long-range transport of Asian dust. However, only a limited observation from ground-based sites and CALIPSO was available for the analysis of aerosol properties. In order to analyze the evolution of aerosols during the transport, MODIS data with a wide spatial coverage was used to quantify the changes in aerosol optical properties.
As shown in Fig. S1 in the Supplement, MODIS data were analyzed on a daily basis. Since simulated backward trajectories were subject to certain uncertainties (Draxler and Hess, 1998), the rectangular subsection that covered the daily trajectory was extracted to represent the aerosol properties along the transport pathway. Figure 10 compares the mean values of AOD and AE over the daily transport coverage area between the two cases. As shown in Fig. 10a, AOD in CASE I exhibited an evidently decreasing trend with time. It averaged 0.86 on 14 April 2015 over the dust source regions, while it was 0.10 at Barrow on 20 April, indicating a tremendous AOD decrease of nearly 8 times. AE showed an increasing trend (Fig. 10b). This indicated that, on the one hand, the high aerosol concentrations from the dust source regions had been significantly eliminated by various physical scavenging processes. In the meantime, local air pollutants could be reduced by the strongly invaded dust (Wang et al., 2018a). On the other hand, dust mixed with fine particles such as black carbon, nitrate, and sulfate and gradually modified the irregular dust particles to be more spherical (Xu et al., 2020).
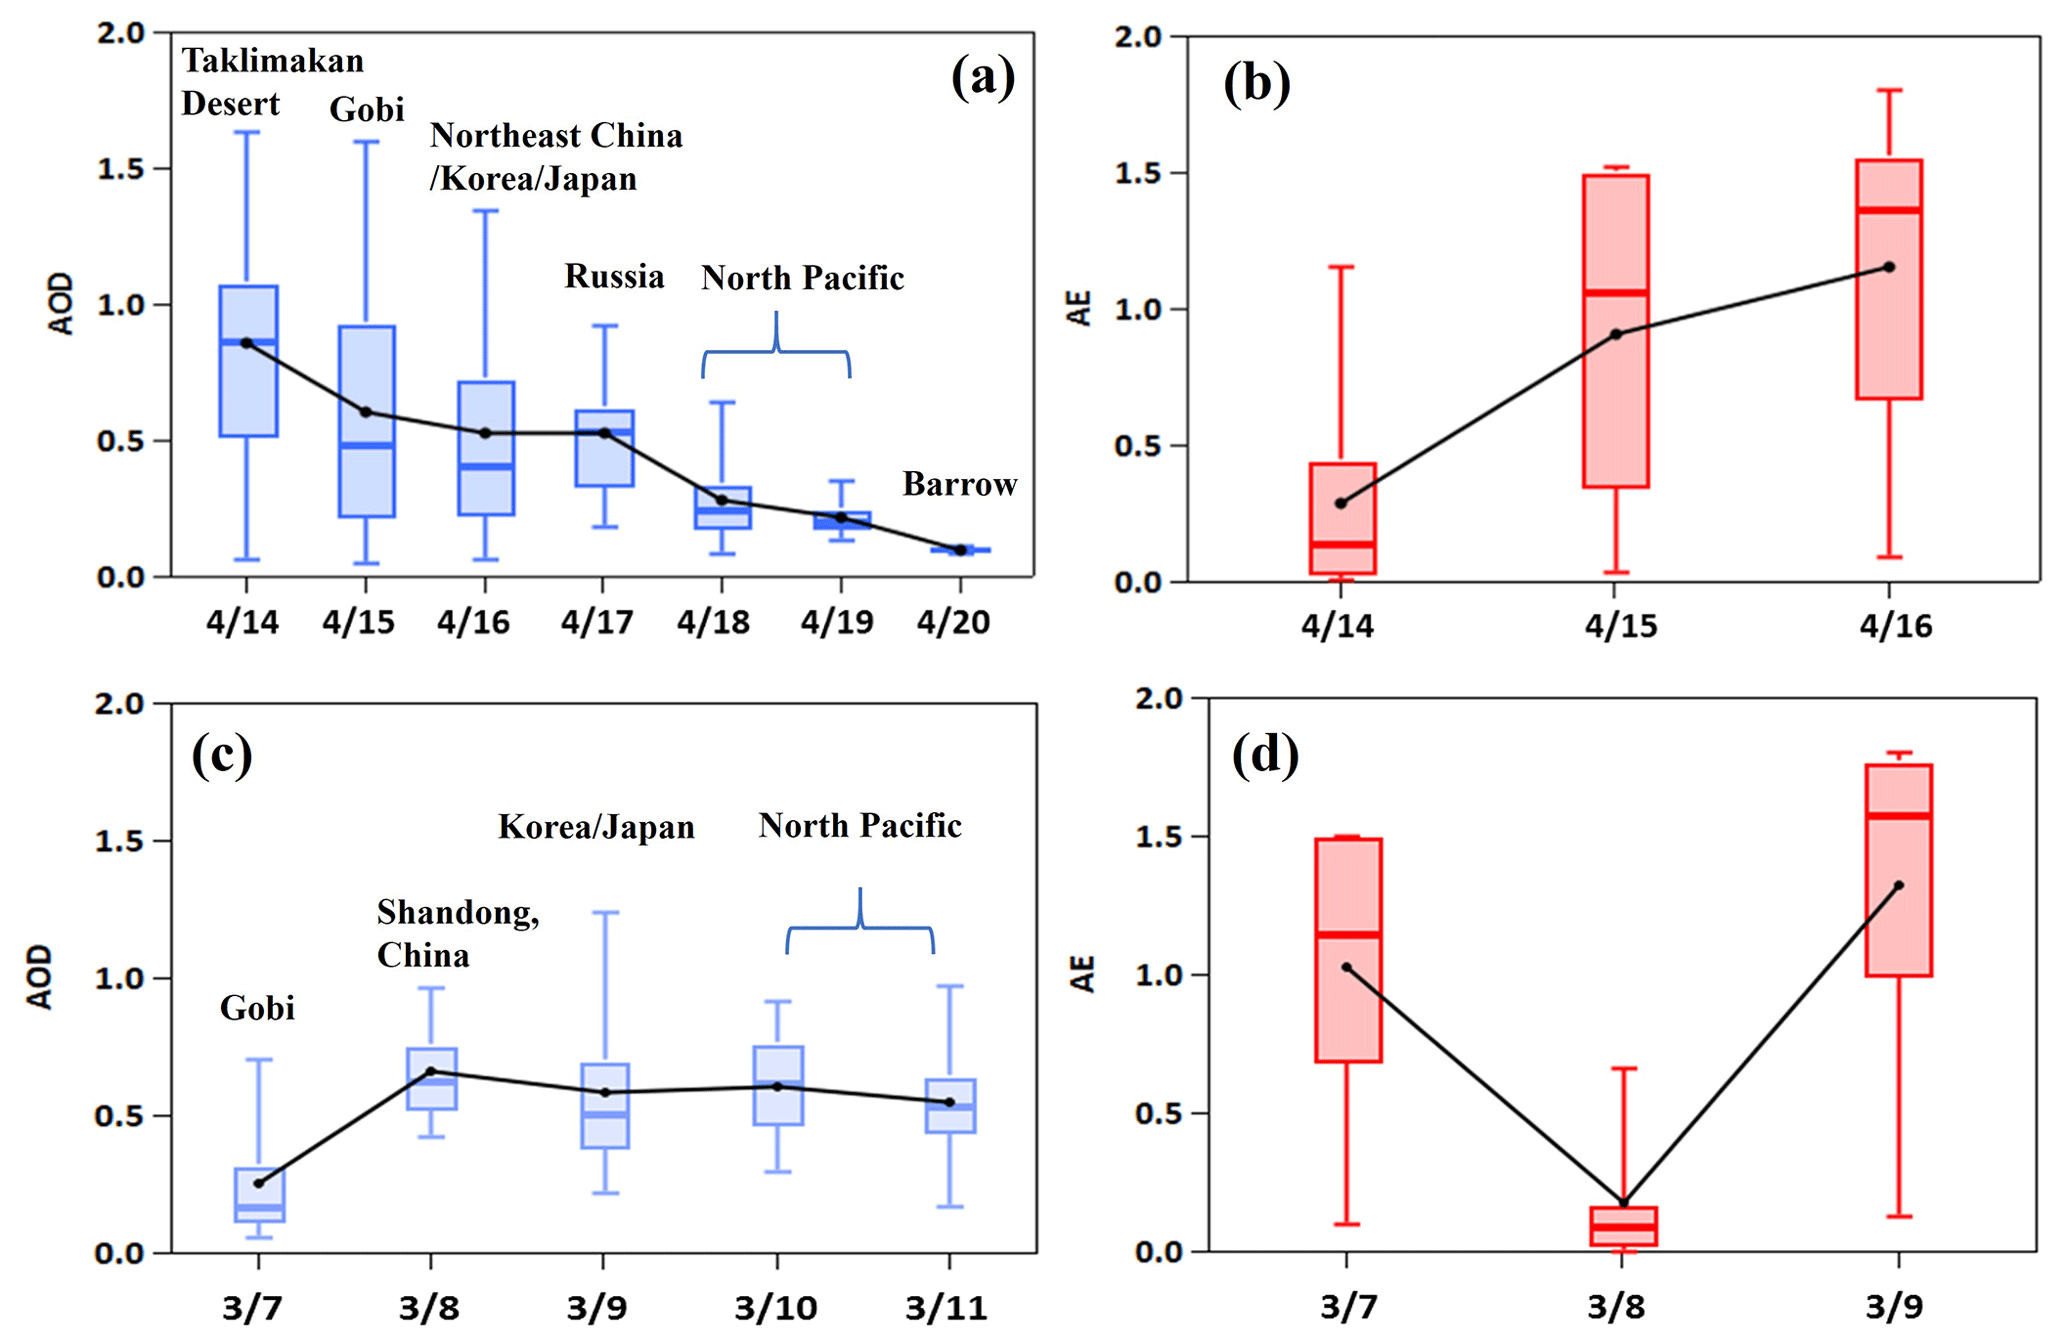
Figure 10Regional (a) AOD and (b) Angström exponent in CASE I. Regional (c) AOD and (d) Angström exponent in CASE II. The dots and lines inside the boxes represent the mean and median values, respectively; bottom and top of the boxes represent the 25 % and 75 % limits, respectively; and bottom and top short lines represent the minimum and maximum values, respectively. The geographic region in each day is defined in Fig. S1 in the Supplement.
In contrast, less variation of AOD during the transport was observed in CASE II (Fig. 10c). AOD was relatively low over the Gobi Desert on 7 March, while the mean AOD even increased to 0.56–0.68 from 8 to 11 March. As shown in Fig. S1b in the Supplement, the eastward movement of aerosol plume was evident. This probably indicated the dust plume had already drifted away from the dust source region, which explained the lower AOD in the source region than the downwind regions. Meanwhile, except for the low value of AE on 8 March (possibly due to the small number of data points as shown in Fig. S1b), the mean AE values were above 1.0 on 7 and 9 March. This suggested that dust mixed with more fine particles and coarse particles were more removed. Overall, by comparing these two cases, it was evident that different transport routes to the Arctic had divergent effects on the evolution of aerosol optical properties.
3.7 Impact assessment of transported aerosols on the Arctic surface albedo
Surface albedo is an important parameter for energy exchange between the surface and the atmosphere in polar regions. The changes in snow and ice albedos could have important climatic impacts on the polar regions as well as the whole world. Due to the large difference between the multiple scattering effect of snow and ice and absorption effects of absorbing impurities (e.g., black carbon and dust), very small amounts of deposited impurities can lead to a decrease in snow and ice albedo (Zhang et al., 2017). Hansen and Nazarenko (2004) showed that the effect of soot on reducing snow and ice albedo was around 1.5 % in the Arctic and 3 % in the snow- and ice-covered areas of the Northern Hemisphere. Kaspari et al. (2014) showed that black carbon reduced snow and ice albedo by 6 %–10 % relative to pure snow in the Himalayas in winter and spring, and other impurities such as dust even reduced snow and ice albedo by 40 %–42 %. In this regard, decreases in snow and ice albedo would cause surface warming, thinning of sea ice, melting permafrost, and consequently sea level rise that may have serious impacts on the global water resources and ecosystems.
In this section, the impacts of the two Arctic pollution events on changing the surface albedo were assessed. The SNICAR snow and ice albedo model was applied to estimate the contributions of dust and black carbon to the reduction of snow and ice albedo.
3.7.1 Estimation of mass concentrations of impurities in snow and evaluation of model performance
In this study, we only considered airborne dust and elemental carbon (EC) as the dominant contributors to the impurities in the Arctic snow and ice. Firstly, the atmospheric concentrations of absorbing aerosols were estimated by using the revised IMPROVE (the Interagency Monitoring of Protected Visual Environments) Equation (Pitchford et al., 2007). It was assumed that airborne dust and EC dominated the scattering of coarse particles and absorption of fine particles, respectively (Eqs. 1–2).
of which the constant 0.6 and 10 (m2 g−1) are the mass scattering efficiency and mass absorption efficiency of dust and EC, respectively (Pitchford et al., 2007). Since the concentrations of impurities in snow were required as inputs for the SNICAR model, we estimated them based on the following assumption. Dou et al. (2017) conducted field sampling at Barrow during April and May in 2015 and measured elemental carbon concentration of 3.30 ng g−1 in the snow sample on 30 April 2015. The airborne elemental carbon concentration was estimated to be 6.25 ng m−3 on the same day by using the equations above. Thus, the ratio of the particulate matter in the snow versus that in the atmosphere was calculated to be 0.528 m3 g−1. This ratio was then applied to estimate the concentrations of dust and elemental carbon in snow during the two cases based on the assumption that particulate dust and elemental carbon could be well mixed under the sufficiently long transport duration. Since the cumulative effect of impurities in reducing the surface albedo was not considered in this study, the simulation result by the SNICAR model was considered as the instantaneous surface albedo in the following discussions.
To evaluate the model performance, Fig. S2 compares the simulated values of surface albedo and the observations at an ARM (Atmospheric Radiation Measurement) site located at Barrow during 14–19 April 2015. A correlation coefficient of 0.74 was derived, indicating the relatively good model performance on simulating the Arctic surface albedo. However, deviations of simulated values from observations were still found. The bias may derive from the following aspects. First, the concentrations of dust and elemental carbon in snow as inputs for the model were not in situ measured, as well as for the other input parameters such as snow radius, thickness, and density. Secondly, the simulation only considered the absorbing substances deposited from the atmosphere while the pre-existing impurities in snow and ice were ignored. Last but not the least, impurities such as brown carbon were not included for the simulation.
3.7.2 Comparison of the changes in Arctic surface albedo between two cases
Table 4Simulated changes in albedo due to dust, elemental carbon, and combination of dust and elemental carbon (SA represents the simulated surface albedo of pure snow).
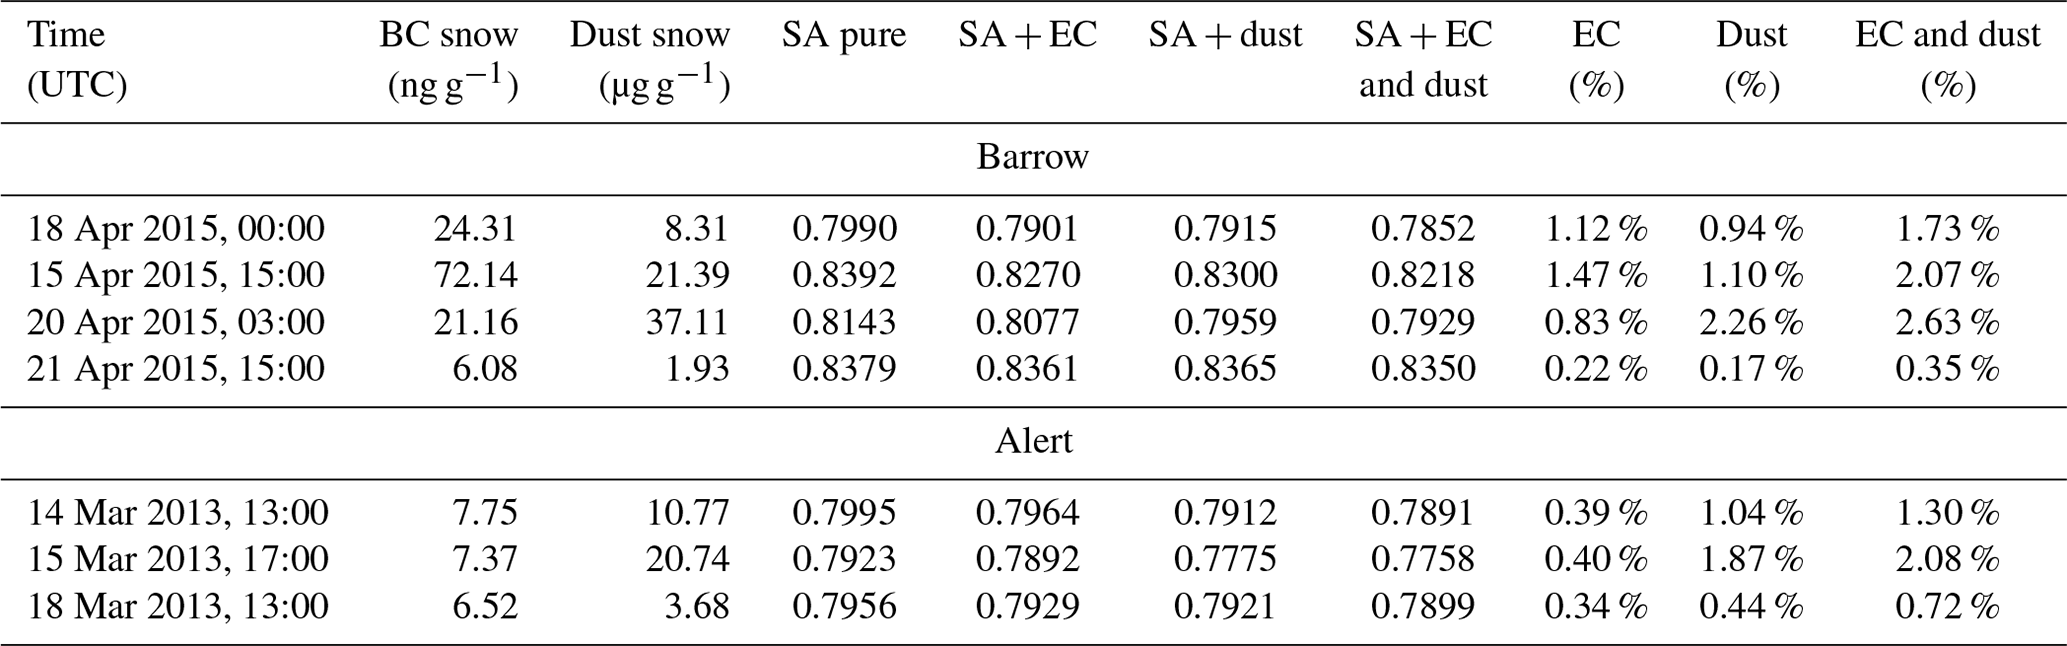
In this section, the impacts of transported particles on the change in surface albedo in both cases were evaluated. Figure S3 shows the time series of estimated dust and elemental carbon in snow during the two pollution cases. As for CASE I (Fig. S3a), the peak time of elemental carbon was about half a day ahead of that of dust. This phenomenon was as similar as some other dust events where anthropogenic air pollutants were ahead of dust pushed by the cold front (Guo et al., 2004; Wang et al., 2018a). Regarding the variations of pollutants, four representative moments were selected, i.e., 00:00 UTC on 18 April (the beginning of pollution), 13:00 UTC on 19 April (the peak time of elemental carbon), 03:00 UTC on 20 April (the peak time of dust), and 15:00 UTC on 21 April (the end of pollution). As for CASE II (Fig. S3b), the estimated concentrations of impurities in snow stayed at relatively low levels and varied less strongly compared to CASE I. We chose 12:00 UTC on 14 March (the beginning of pollution), 17:00 UTC on 15 March (the peak time of dust), and 13:00 UTC on 18 March (the end of pollution) for the analysis.
By using the SNICAR model, the effects of dust, elemental carbon, and combination of dust and elemental carbon on the surface albedo were separately assessed. As shown in Table 4, the reduction of surface albedo caused by long-range-transported Asian light-absorbing pollutants ranged from 0.35 % to 2.63 %, which were consistent with previous studies. For instance, Dou et al. (2017) calculated a 1.6 %–5.1 % reduction in snow and ice albedo caused by dust and black carbon at Barrow from late April to May 2015, with a 5–10-fold increase in pollutant concentrations compared to the pre-April period due to the snowmelt period during that time. Zhang et al. (2017) calculated that dust and black carbon reduced snow and ice albedo by 0.72 %–1.00 % on glaciers in the southeastern Tibetan Plateau in June 2015. In CASE I, the highest concentration of elemental carbon in snow reached more than 72 ng g−1, which could reduce the albedo by 1.47 %. And the highest concentration of dust reached more than 37 µg g−1, which could reduce the albedo by 2.26 %. During this pollution event, the combined effect of dust and elemental carbon significantly reduced the snow and ice albedo by 2.28 %. In CASE II, elemental carbon concentrations were much lower than CASE I, and its effect on albedo was below 0.40 %, while dust can reduce albedo up to 1.87 %. The combined effect of dust and elemental carbon reached more than 2 % compared to the pure snow condition.
As discussed above, the concentrations of dust and elemental carbon were relatively higher in CASE I; hence, the resulting effects on snow and ice albedo were more obvious. On the one hand, the transport time in CASE I was shorter, and the particulate matter was scavenged less along the transport. On the other hand, the air masses in CASE I passed over a large number of terrestrial areas, including northeast China and Siberia. Fine particles from anthropogenic emissions and biomass burning in Siberia mixed with dust and were transported to Barrow together, making the elemental carbon at the receptor significantly higher. As for CASE II, the receptor site at Alert is a higher latitudinal area, which was much less affected by local anthropogenic activities. In addition, the transport pathway of CASE II was mostly over the open ocean with a longer duration. This finally induced much lower air pollutant concentrations and had a weaker impact on the reduction of surface albedo.
In this study, the long-range transport of Asian dust to the Arctic was investigated. During 2011–2015, 50 dust events in China were recorded, of which 38 dust events had the capability to reach the Arctic based on the air mass trajectory simulation. Two main transport routes were identified. One typical transport type was characterized by wide geographic coverage, long transport duration (generally 7–10 d), and mainly marine transport due to the high lifting altitude of dust particles (mostly over 1500 m) over the dust source regions. The other typical transport type was characterized by dust transport mostly over land with a relatively short duration of about 4–8 d. This was due to the presence of a low-pressure system over northern Japan in spring, which induced the air masses deflecting northward.
Two typical coarse-particle-dominated cases observed in the Arctic were specifically investigated, i.e., one at Barrow in April 2015 (CASE I) and the other one at Alert in March 2013 (CASE II), respectively. Based on the air mass trajectory simulation, in CASE I, dust originated from the Taklamakan and Gobi deserts in China; then passed over East Asia, Siberia of Russia, and the Pacific Ocean; and finally reached Barrow. In CASE II, dust originated from the Gobi Desert, then passed over Korea and Japan and directly entered the Pacific Ocean, and finally moved northward across the Arctic Ocean and reached Alert.
The dust transport pathways during both cases were verified based on a synergy of NCEP reanalysis data (geopotential height fields), ground-based observations (AERONET aerosol columnar properties and lidar aerosol profiles), and satellite products (CALIPSO profiles). The passing time and height of the dust plume based on trajectory simulation coincided very consistently with various observations. The evolution of aerosol optical properties during the transport was assessed by using the large-scale MODIS data. In CASE I, AOD showed a significant decreasing trend while Angström exponent showed an increasing trend from the dust source region to the receptor. In contrast, AOD varied much less significantly in CASE II. It was evident that different transport routes to the Arctic had divergent effects on the evolution of aerosol properties.
The SNICAR snow and ice model was applied to simulate the impact of impurities on the reduction of surface albedo in the Arctic during the two cases. The concentrations of dust and elemental carbon in snow were estimated, and the effects of dust, elemental carbon, and combination of dust and elemental carbon on snow and ice albedo were separately quantified. The reduction of snow and ice albedo caused by long-range-transported Asian light-absorbing pollutants ranged from 0.35 % to 2.63 %. This study highlighted that the long-range transport of Asian dust to the Arctic was ubiquitous, and its impact on changing the radiative forcing and regional climate in the Arctic should be considered by the atmosphere–ocean–cryosphere interaction.
It has to be noted that the simulation of surface albedo due to the transport of dust particles was subject to large uncertainties. The concentrations of impurities in snow were estimated by empirical equations but not in situ measurement data. As a result, the cumulative effect of impurities in reducing the surface albedo was not considered. Also, the evolution of dust microphysical properties was not accounted for in the model simulation. The atmospheric aging processes, i.e., dust particles coated with various types of aerosols during the long-range transport, could further enhance the reduction of snow albedo. The dust particle refractive index is regarded as an important factor for dust absorption in snowpack (He, 2022). To reduce the uncertainties of snow albedo simulation, simultaneous in situ measurements of particle composition and optical properties in both the air and snowpack are essentially needed in the future Arctic studies.
The measurement data at Barrow and Alert are from the EBAS database (https://ebas.nilu.no/, last access: 4 August 2022, Norwegian Institute for Air Research, 2022). Aerosol columnar data are from AERONET (https://aeronet.gsfc.nasa.gov/, last access: 4 August 2022, Holben et al., 1998). Aerosol vertical profiles are from AD-Net (https://www-lidar.nies.go.jp/AD-Net, last access: 4 August 2022, Shimizu et al., 2017). The MODIS Level-3 aerosol products are from NASA's Giovanni (https://giovanni.gsfc.nasa.gov/giovanni/ last access: 4 August 2022, NASA, 2022). The NCEP/NCAR reanalysis data are from https://www.esrl.noaa.gov/psd/data/gridded/reanalysis/ (NCAR, 2022).
The supplement related to this article is available online at: https://doi.org/10.5194/acp-22-10389-2022-supplement.
KH designed this study. JSF and SFA collected the data. XZ analyzed the data. All authors reviewed and wrote the paper.
At least one of the (co-)authors is a member of the editorial board of Atmospheric Chemistry and Physics. The peer-review process was guided by an independent editor, and the authors also have no other competing interests to declare.
Publisher's note: Copernicus Publications remains neutral with regard to jurisdictional claims in published maps and institutional affiliations.
This article is part of the special issue “Dust aerosol measurements, modeling and multidisciplinary effects (AMT/ACP inter-journal SI)”. It is not associated with a conference.
We sincerely thank EBAS, AERONET, AD-Net, NASA, and NCEP/NCAR for providing the observational and modeling data. Kan Huang also acknowledges the Jiangsu Shuangchuang Program through Jiangsu Fuyu Environmental Technology Co., Ltd.
This research has been supported by the National Natural Science Foundation of China (grant nos. 42175119 and 91644105).
This paper was edited by N'Datchoh Evelyne Touré and reviewed by two anonymous referees.
Blanchet, J. P. and List, R.: Estimation of optical properties of arctic haze using a numerical model, Atmos. Ocean, 21, 444–465, https://doi.org/10.1080/07055900.1983.9649179, 2010.
Breider, T. J., Mickley, L. J., Jacob, D. J., Ge, C., Wang, J., Sulprizio, M. P., Croft, B., Ridley, D. A., McConnell, J. R., Sharma, S., Husain, L., Dutkiewicz, V. A., Eleftheriadis, K., Skov, H., and Hopke, P. K.: Multidecadal trends in aerosol radiative forcing over the Arctic: Contribution of changes in anthropogenic aerosol to Arctic warming since 1980, J. Geophys. Res.-Atmos., 122, 3573–3594, https://doi.org/10.1002/2016jd025321, 2017.
Brock, C. A., Cozic, J., Bahreini, R., Froyd, K. D., Middlebrook, A. M., McComiskey, A., Brioude, J., Cooper, O. R., Stohl, A., Aikin, K. C., de Gouw, J. A., Fahey, D. W., Ferrare, R. A., Gao, R.-S., Gore, W., Holloway, J. S., Hübler, G., Jefferson, A., Lack, D. A., Lance, S., Moore, R. H., Murphy, D. M., Nenes, A., Novelli, P. C., Nowak, J. B., Ogren, J. A., Peischl, J., Pierce, R. B., Pilewskie, P., Quinn, P. K., Ryerson, T. B., Schmidt, K. S., Schwarz, J. P., Sodemann, H., Spackman, J. R., Stark, H., Thomson, D. S., Thornberry, T., Veres, P., Watts, L. A., Warneke, C., and Wollny, A. G.: Characteristics, sources, and transport of aerosols measured in spring 2008 during the aerosol, radiation, and cloud processes affecting Arctic Climate (ARCPAC) Project, Atmos. Chem. Phys., 11, 2423–2453, https://doi.org/10.5194/acp-11-2423-2011, 2011.
CMA (China Meteorological Administration): Sand-dust Weather Almanac (2011), 1st edn., China Meteorological Press, Beijing, China, ISBN 9787502957384, 2013.
CMA (China Meteorological Administration): Sand-dust Weather Almanac (2012), 1st edn., China Meteorological Press, Beijing, China, ISBN 9787502959395, 2014.
CMA (China Meteorological Administration): Sand-dust Weather Almanac (2013), 1st edn., China Meteorological Press, Beijing, China, ISBN 9787502963347, 2015.
CMA (China Meteorological Administration): Sand-dust Weather Almanac (2014), 1st edn., China Meteorological Press, Beijing, China, ISBN 9787502965495, 2016.
CMA (China Meteorological Administration): Sand-dust Weather Almanac (2015), 1st edn., China Meteorological Press, Beijing, China, ISBN 9787502965501, 2017.
Dagsson-Waldhauserova, P., Renard, J. B., Olafsson, H., Vignelles, D., Berthet, G., Verdier, N., and Duverger, V.: Vertical distribution of aerosols in dust storms during the Arctic winter, Sci. Rep.-UK, 9, 16122, https://doi.org/10.1038/s41598-019-51764-y, 2019.
Di Biagio, C., Pelon, J., Ancellet, G., Bazureau, A., and Mariage, V.: Sources, Load, Vertical Distribution, and Fate of Wintertime Aerosols North of Svalbard From Combined V4 CALIOP Data, Ground-Based IAOOS Lidar Observations and Trajectory Analysis, J. Geophys. Res.-Atmos., 123, 1363–1383, https://doi.org/10.1002/2017jd027530, 2018.
Di Pierro, M., Jaeglé, L., and Anderson, T. L.: Satellite observations of aerosol transport from East Asia to the Arctic: three case studies, Atmos. Chem. Phys., 11, 2225–2243, https://doi.org/10.5194/acp-11-2225-2011, 2011.
Domine, F., Cabanes, A., and Legagneux, L.: Structure, microphysics, and surface area of the Arctic snowpack near Alert during the ALERT 2000 campaign, Atmos. Environ., 36, 2753–2765, https://doi.org/10.1016/s1352-2310(02)00108-5, 2002.
Dong, X., Xi, B., Crosby, K., Long, C. N., Stone, R. S., and Shupe, M. D.: A 10 year climatology of Arctic cloud fraction and radiative forcing at Barrow, Alaska, J. Geophys. Res.-Atmos., 115, D17212, https://doi.org/10.1029/2009jd013489, 2010.
Dou, T., Xiao, C., Du, Z., Schauer, J. J., Ren, H., Ge, B., Xie, A., Tan, J., Fu, P., and Zhang, Y.: Sources, evolution and impacts of EC and OC in snow on sea ice: a measurement study in Barrow, Alaska, Sci. Bull., 62, 1547–1554, https://doi.org/10.1016/j.scib.2017.10.014, 2017.
Draxler, R. R. and Hess, G. D.: An overview of the HYSPLIT_4 modelling system for trajectories, dispersion and deposition, Aust. Meteorol. Mag., 47, 295–308, 1998.
Fan, S. M.: Modeling of observed mineral dust aerosols in the arctic and the impact on winter season low-level clouds, J. Geophys. Res.-Atmos., 118, 11161–11174, 2013.
Ferrero, L., Ritter, C., Cappelletti, D., Moroni, B., Mocnik, G., Mazzola, M., Lupi, A., Becagli, S., Traversi, R., Cataldi, M., Neuber, R., Vitale, V., and Bolzacchini, E.: Aerosol optical properties in the Arctic: The role of aerosol chemistry and dust composition in a closure experiment between Lidar and tethered balloon vertical profiles, Sci. Total Environ., 686, 452–467, 2019.
Fisher, J. A., Jacob, D. J., Wang, Q., Bahreini, R., Carouge, C. C., Cubison, M. J., Dibb, J. E., Diehl, T., Jimenez, J. L., Leibensperger, E. M., Lu, Z., Meinders, M. B. J., Pye, H. O. T., Quinn, P. K., Sharma, S., Streets, D. G., van Donkelaar, A., and Yantosca, R. M.: Sources, distribution, and acidity of sulfate-ammonium aerosol in the Arctic in winter-spring, Atmos. Environ., 45, 7301–7318, https://doi.org/10.1016/j.atmosenv.2011.08.030, 2011.
Flanner, M. G.: Arctic climate sensitivity to local black carbon, J. Geophys. Res.-Atmos., 118, 1840–1851, https://doi.org/10.1002/jgrd.50176, 2013.
Flanner, M. G., Zender, C. S., Randerson, J. T., and Rasch, P. J.: Present-day climate forcing and response from black carbon in snow, J. Geophys. Res.-Atmos., 112, D11202, https://doi.org/10.1029/2006jd008003, 2007.
Gagne, M.-E., Fyfe, J. C., Gillett, N. P., Polyakov, I. V., and Flato, G. M.: Aerosol-driven increase in Arctic sea ice over the middle of the twentieth century, Geophys. Res. Lett., 44, 7338–7346, https://doi.org/10.1002/2016gl071941, 2017.
Gillett, N. P., Stone, D. A., Stott, P. A., Nozawa, T., Karpechko, A. Y., Hegerl, G. C., Wehner, M. F., and Jones, P. D.: Attribution of polar warming to human influence, Nat. Geosci., 1, 750–754, https://doi.org/10.1038/ngeo338, 2008.
Ginoux, P., Prospero, J. M., Gill, T. E., Hsu, N. C., and Zhao, M.: Global-Scale Attribution of Anthropogenic and Natural Dust Sources and Their Emission Rates Based on Modis Deep Blue Aerosol Products, Rev. Geophys., 50, RG3005, https://doi.org/10.1029/2012RG000388, 2012.
Guo, J., Rahn, K. A., and Zhuang, G. S.: A mechanism for the increase of pollution elements in dust storms in Beijing, Atmos. Environ., 38, 855–862, 2004.
Guo, J., Lou, M., Miao, Y., Wang, Y., Zeng, Z., Liu, H., He, J., Xu, H., Wang, F., Min, M., and Zhai, P.: Trans-Pacific transport of dust aerosols from East Asia: Insights gained from multiple observations and modeling, Environ. Pollut., 230, 1030–1039, https://doi.org/10.1016/j.envpol.2017.07.062, 2017.
Hansen, J. and Nazarenko, L.: Soot climate forcing via snow and ice albedos, P. Natl. Acad. Sci. USA, 101, 423–428, https://doi.org/10.1073/pnas.2237157100, 2004.
He, C.: Modelling light-absorbing particle–snow–radiation interactions and impacts on snow albedo: fundamentals, recent advances and future directions, Environ. Chem., https://doi.org/10.1071/EN22013, 2022.
Holben, B. N., Eck, T. F., Slutsker, I., Tanre, D., Buis, J. P., Setzer, A., Vermote, E., Reagan, J. A., Kaufman, Y. J., Nakajima, T., Lavenu, F., Jankowiak, I., and Smirnov, A.: AERONET – A federated instrument network and data archive for aerosol characterization, Remote Sens. Environ., 66, 1–16, https://doi.org/10.1016/S0034-4257(98)00031-5, 1998 (data available at: https://aeronet.gsfc.nasa.gov/, last access: 4 August 2022).
Hsu, N. C., Jeong, M.-J., Bettenhausen, C., Sayer, A. M., Hansell, R., Seftor, C. S., Huang, J., and Tsay, S.-C.: Enhanced Deep Blue aerosol retrieval algorithm: The second generation, J. Geophys. Res. Atmos., 118, 9296–9315, https://doi.org/10.1002/jgrd.50712, 2013.
Huang, Z., Huang, J., Hayasaka, T., Wang, S., Zhou, T., and Jin, H.: Short-cut transport path for Asian dust directly to the Arctic: a case study, Environ. Res. Lett., 10, 114018, https://doi.org/10.1088/1748-9326/10/11/114018, 2015.
Kaspari, S., Painter, T. H., Gysel, M., Skiles, S. M., and Schwikowski, M.: Seasonal and elevational variations of black carbon and dust in snow and ice in the Solu-Khumbu, Nepal and estimated radiative forcings, Atmos. Chem. Phys., 14, 8089–8103, https://doi.org/10.5194/acp-14-8089-2014, 2014.
Koch, D. and Del Genio, A. D.: Black carbon semi-direct effects on cloud cover: review and synthesis, Atmos. Chem. Phys., 10, 7685–7696, https://doi.org/10.5194/acp-10-7685-2010, 2010.
Kylling, A., Zwaaftink, C. D. G., and Stohl, A.: Mineral Dust Instantaneous Radiative Forcing in the Arctic, Geophys. Res. Lett., 45, 4290–4298, 2018.
Levy, R. C., Remer, L. A., Mattoo, S., Vermote, E. F., and Kaufman, Y. J.: Second-generation operational algorithm: Retrieval of aerosol properties over land from inversion of Moderate Resolution Imaging Spectroradiometer spectral reflectance, J. Geophys. Res., 112, D13211, https://doi.org/10.1029/2006JD007811, 2007.
Liu, D., Qi, F. D., Jin, C. J., Yue, G. M., and Zhou, J.: Polarization lidar observations of cirrus clouds and Asian dust aerosols over Hefei, Chin. J. Atmos. Sci., 27, 1093–1100, 2003.
Liu, H., Liu, X. D., and Dong, B. W.: Influence of Central Siberian Snow-Albedo Feedback on the Spring East Asian Dust Cycle and Connection With the Preceding Winter Arctic Oscillation, J. Geophys. Res.-Atmos., 123, 13368–13385, 2018.
Marelle, L., Raut, J.-C., Thomas, J. L., Law, K. S., Quennehen, B., Ancellet, G., Pelon, J., Schwarzenboeck, A., and Fast, J. D.: Transport of anthropogenic and biomass burning aerosols from Europe to the Arctic during spring 2008, Atmos. Chem. Phys., 15, 3831–3850, https://doi.org/10.5194/acp-15-3831-2015, 2015.
Mishra, M. K., Rajeev, K., Thampi, B. V., Parameswaran, K., and Nair, A. K. M.: Micro pulse lidar observations of mineral dust layer in the lower troposphere over the southwest coast of Peninsular India during the Asian summer monsoon season, J. Atmos. Sol.-Terr. Phy., 72, 1251–1259, https://doi.org/10.1016/j.jastp.2010.08.012, 2010.
NASA: https://giovanni.gsfc.nasa.gov/giovanni/, last access: 4 August 2022.
NCAR: https://www.esrl.noaa.gov/psd/data/gridded/reanalysis/, last access: 4 August 2022.
Norwegian Institute for Air Research: https://ebas.nilu.no/, last access: 4 August 2022.
Omar, A. H., Winker, D. M., Kittaka, C., Vaughan, M. A., Liu, Z., Hu, Y., Trepte, C. R., Rogers, R. R., Ferrare, R. A., Lee, K., Kuehn, R. E., and Hostetler, C. A.: The CALIPSO automated aerosol classification and lidar ratio selection algorithm, J. Atmos. Oceanic Technol., 26, 1994–2014, https://doi.org/10.1175/2009JTECHA1231.1, 2009.
Pitchford, M., Malm, W., Schichtel, B., Kumar, N., Lowenthal, D., and Hand, J.: Revised algorithm for estimating light extinction from IMPROVE particle speciation data, J. Air Waste Manage., 57, 1326–1336, https://doi.org/10.3155/1047-3289.57.11.1326, 2007.
Qi, L., Li, Q., Henze, D. K., Tseng, H.-L., and He, C.: Sources of springtime surface black carbon in the Arctic: an adjoint analysis for April 2008, Atmos. Chem. Phys., 17, 9697–9716, https://doi.org/10.5194/acp-17-9697-2017, 2017.
Quinn, P. K., Bates, T. S., Baum, E., Doubleday, N., Fiore, A. M., Flanner, M., Fridlind, A., Garrett, T. J., Koch, D., Menon, S., Shindell, D., Stohl, A., and Warren, S. G.: Short-lived pollutants in the Arctic: their climate impact and possible mitigation strategies, Atmos. Chem. Phys., 8, 1723–1735, https://doi.org/10.5194/acp-8-1723-2008, 2008.
Ranjbar, K., O'Neill, N. T., Ivanescu, L., King, J., and Hayes, P. L.: Remote sensing of a high-Arctic, local dust event over Lake Hazen (Ellesmere Island, Nunavut, Canada), Atmos. Environ., 246, 118102, https://doi.org/10.1016/j.atmosenv.2020.118102, 2021.
Sand, M., Berntsen, T. K., Seland, O., and Kristjansson, J. E.: Arctic surface temperature change to emissions of black carbon within Arctic or midlatitudes, J. Geophys. Res.-Atmos., 118, 7788–7798, https://doi.org/10.1002/jgrd.50613, 2013a.
Sand, M., Berntsen, T. K., Kay, J. E., Lamarque, J. F., Seland, Ø., and Kirkevåg, A.: The Arctic response to remote and local forcing of black carbon, Atmos. Chem. Phys., 13, 211–224, https://doi.org/10.5194/acp-13-211-2013, 2013b.
Screen, J. A. and Simmonds, I.: The central role of diminishing sea ice in recent Arctic temperature amplification, Nature, 464, 1334–1337, https://doi.org/10.1038/nature09051, 2010.
Serreze, M. C. and Francis, J. A.: The arctic amplification debate, Clim. Change, 76, 241–264, https://doi.org/10.1007/s10584-005-9017-y, 2006.
Serreze, M. C., Barrett, A. P., Stroeve, J. C., Kindig, D. N., and Holland, M. M.: The emergence of surface-based Arctic amplification, The Cryosphere, 3, 11–19, https://doi.org/10.5194/tc-3-11-2009, 2009.
Sharma, S., Ishizawa, M., Chan, D., Lavoue, D., Andrews, E., Eleftheriadis, K., and Maksyutov, S.: 16-year simulation of Arctic black carbon: Transport, source contribution, and sensitivity analysis on deposition, J. Geophys. Res.-Atmos., 118, 943–964, https://doi.org/10.1029/2012jd017774, 2013.
Shimizu, A., Nishizawa, T., Jin, Y., Kim, S. W., Wang, Z. F., Batdorj, D., and Sugimoto, N.: Evolution of a lidar network for tropospheric aerosol detection in East Asia, Opt. Eng., 56, 031219, https://doi.org/10.1117/1.OE.56.3.031219, 2017 (data available at: https://www-lidar.nies.go.jp/AD-Net, last access: 4 August 2022).
Shindell, D. and Faluvegi, G.: Climate response to regional radiative forcing during the twentieth century, Nat. Geosci., 2, 294–300, https://doi.org/10.1038/ngeo473, 2009.
Sobhani, N., Kulkarni, S., and Carmichael, G. R.: Source sector and region contributions to black carbon and PM2.5 in the Arctic, Atmos. Chem. Phys., 18, 18123–18148, https://doi.org/10.5194/acp-18-18123-2018, 2018.
Stohl, A.: Characteristics of atmospheric transport into the Arctic troposphere, J. Geophys. Res.-Atmos., 111, D11306, https://doi.org/10.1029/2005jd006888, 2006.
Stone, R. S., Dutton, E. G., Harris, J. M., and Longenecker, D.: Earlier spring snowmelt in northern Alaska as an indicator of climate change, J. Geophys. Res.-Atmos., 107, 4089, https://doi.org/10.1029/2000jd000286, 2002.
Wang, Q., Dong, X., Fu, J. S., Xu, J., Deng, C., Jiang, Y., Fu, Q., Lin, Y., Huang, K., and Zhuang, G.: Environmentally dependent dust chemistry of a super Asian dust storm in March 2010: observation and simulation, Atmos. Chem. Phys., 18, 3505–3521, https://doi.org/10.5194/acp-18-3505-2018, 2018a.
Wang, Z., Pan, X., Uno, I., Chen, X., Yamamoto, S., Zheng, H., Li, J., and Wang, Z.: Importance of mineral dust and anthropogenic pollutants mixing during a long-lasting high PM event over East Asia, Environ. Pollut., 234, 368–378, https://doi.org/10.1016/j.envpol.2017.11.068, 2018b.
Warneke, C., Froyd, K. D., Brioude, J., Bahreini, R., Brock, C. A., Cozic, J., de Gouw, J. A., Fahey, D. W., Ferrare, R., Holloway, J. S., Middlebrook, A. M., Miller, L., Montzka, S., Schwarz, J. P., Sodemann, H., Spackman, J. R., and Stohl, A.: An important contribution to springtime Arctic aerosol from biomass burning in Russia, Geophys. Res. Lett., 37, L01801, https://doi.org/10.1029/2009gl041816, 2010.
Weijers, S., Buchwal, A., Blok, D., Loeffler, J., and Elberling, B.: High Arctic summer warming tracked by increased Cassiope tetragona growth in the world's northernmost polar desert, Glob. Change. Biol., 23, 5006–5020, https://doi.org/10.1111/gcb.13747, 2017.
Xu, L., Fukushima, S., Sobanska, S., Murata, K., Naganuma, A., Liu, L., Wang, Y., Niu, H., Shi, Z., Kojima, T., Zhang, D., and Li, W.: Tracing the evolution of morphology and mixing state of soot particles along with the movement of an Asian dust storm, Atmos. Chem. Phys., 20, 14321–14332, https://doi.org/10.5194/acp-20-14321-2020, 2020.
Zhang, Y. L., Kang, S. C., Cong, Z. Y., Schmale, J., Sprenger, M., Li, C. L., Yang, W., Gao, T. G., Sillanpaa, M., Li, X. F., Liu, Y. J., Chen, P. F., and Zhang, X. L.: Light-absorbing impurities enhance glacier albedo reduction in the southeastern Tibetan plateau, J. Geophys. Res.-Atmos., 122, 6915–6933, https://doi.org/10.1002/2016jd026397, 2017.
Zwaaftink, C. D. G., Grythe, H., Skov, H., and Stohl, A.: Substantial contribution of northern high-latitude sources to mineral dust in the Arctic, J. Geophys. Res.-Atmos., 121, 13678–13697, https://doi.org/10.1002/2016jd025482, 2016.