the Creative Commons Attribution 4.0 License.
the Creative Commons Attribution 4.0 License.
 | 12 Aug 2022
Air quality impacts of COVID-19 lockdown measures detected from space using high spatial resolution observations of multiple trace gases from Sentinel-5P/TROPOMI
Pieternel F. Levelt
Ilse Aben
Maite Bauwens
Tobias Borsdorff
Isabelle De Smedt
Henk J. Eskes
Christophe Lerot
Diego G. Loyola
Fabian Romahn
Trissevgeni Stavrakou
Nicolas Theys
Michel Van Roozendael
J. Pepijn Veefkind
Tijl Verhoelst
The aim of this paper is to highlight how TROPOspheric Monitoring Instrument (TROPOMI) trace gas data can best be used and interpreted to understand event-based impacts on air quality from regional to city scales around the globe. For this study, we present the observed changes in the atmospheric column amounts of five trace gases (NO2, SO2, CO, HCHO, and CHOCHO) detected by the Sentinel-5P TROPOMI instrument and driven by reductions in anthropogenic emissions due to COVID-19 lockdown measures in 2020. We report clear COVID-19-related decreases in TROPOMI NO2 column amounts on all continents. For megacities, reductions in column amounts of tropospheric NO2 range between 14 % and 63 %. For China and India, supported by NO2 observations, where the primary source of anthropogenic SO2 is coal-fired power generation, we were able to detect sector-specific emission changes using the SO2 data. For HCHO and CHOCHO, we consistently observe anthropogenic changes in 2-week-averaged column amounts over China and India during the early phases of the lockdown periods. That these variations over such a short timescale are detectable from space is due to the high resolution and improved sensitivity of the TROPOMI instrument. For CO, we observe a small reduction over China, which is in concert with the other trace gas reductions observed during lockdown; however, large interannual differences prevent firm conclusions from being drawn. The joint analysis of COVID-19-lockdown-driven reductions in satellite-observed trace gas column amounts using the latest operational and scientific retrieval techniques for five species concomitantly is unprecedented. However, the meteorologically and seasonally driven variability of the five trace gases does not allow for drawing fully quantitative conclusions on the reduction in anthropogenic emissions based on TROPOMI observations alone. We anticipate that in future the combined use of inverse modeling techniques with the high spatial resolution data from S5P/TROPOMI for all observed trace gases presented here will yield a significantly improved sector-specific, space-based analysis of the impact of COVID-19 lockdown measures as compared to other existing satellite observations. Such analyses will further enhance the scientific impact and societal relevance of the TROPOMI mission.
- Article
(17937 KB) - Full-text XML
- BibTeX
- EndNote


In an effort to limit the transmission of the SARS-CoV-2 virus responsible for the Coronavirus disease 2019 (hereafter referred as COVID-19), drastic lockdown measures were implemented around the globe in the first half of 2020. These policies led to dramatic reductions in human activity, especially in the transport and industrial sectors, resulting in large decreases in the concentration of air pollutants (Bauwens et al., 2020; Shi and Brasseur, 2020; Forster et al., 2020; Diamond and Wood, 2020; Kroll et al., 2020; Le Quéré et al., 2020; Guevara et al., 2021; Gkatzelis et al., 2021). These changes were observed over China as early as February 2020 (Bauwens et al., 2020; Liu et al., 2020; Z. Zhang et al., 2020; N. Zhao et al., 2020) and were detected later in many other countries as similar lockdown measures were adopted (Bauwens et al., 2020; Broomandi et al., 2020; Collivignarelli et al., 2020; Lee et al., 2020; Gkatzelis et al., 2021; Koukouli et al., 2021).
The TROPOspheric Monitoring Instrument (TROPOMI; Veefkind et al., 2012; Ludewig et al., 2020) on board the European Copernicus Sentinel-5 Precursor (S5P) satellite, launched on 13 October 2017, is specifically designed for tropospheric monitoring on the global scale and has a daily revisit time. Compared to its predecessor OMI, TROPOMI's highest spatial resolution (3.5×5.5 km2) is about 16 times better and its signal-to-noise ratio per ground pixel is substantially higher. This results in a large improvement in measurement sensitivity for relevant air quality products, including NO2, SO2, HCHO, and CHOCHO, thus enabling the study of rapid emission changes for even smaller sources as compared to previous instruments. For CO measurements, the daily global coverage of TROPOMI at a resolution of 7×5.5 km2 represents a huge improvement to its predecessor SCIAMACHY (Bovensmann et al., 1999; Borsdorff et al., 2016, 2017) with a spatial resolution of 120×30 km2.
The observations from TROPOMI thus provide a unique opportunity to observe the magnitude and timing of the changes in tropospheric trace gas constituents, resulting from unprecedented COVID-19 lockdown measures. The initial TROPOMI observations of dramatic reductions in NO2 column amount over regions with strictly enforced lockdowns, with a focus on China in particular, triggered a high level of interest worldwide and initiated a large number of studies, mainly aimed at regional scales and largely focused on NO2. However, the unparalleled capacity of TROPOMI to provide relevant information on COVID-19-driven emission reductions based on multiple species measurements has not been exploited yet. The objective of this work is to investigate the COVID-19-driven changes in the column amounts of five trace gases (NO2, SO2, CO, HCHO, and CHOCHO) from the global level down to individual cities using state-of-the-art TROPOMI operational and scientific data products. More specifically, we first aim to summarize the analysis of tropospheric NO2 at city-scale for all continents. A large body of studies investigated the impact of the COVID-19 lockdowns on NO2 concentrations (e.g., Bauwens et al., 2020; Baldasano, 2020; Huang et al., 2020) at regional and continental scales. Here, we analyze the time series of NO2 measurements from a single satellite instrument for globally distributed locations on regional to city scales. In doing so, we further demonstrate the unique capabilities of how the TROPOMI instrument can be used to consistently track changes in air quality and anthropogenic emissions across the globe.
Second, we explore the high spatial resolution and simultaneous TROPOMI observations of NO2, SO2, CO, HCHO, and CHOCHO. While all of these gases have significant anthropogenic sources, they differ in their relative contribution to energy, industry, and transport sector emissions, and each sector exhibits a different response to COVID-19 lockdown measures. Therefore, the combination of several TROPOMI trace gas products contains additional information on sector-specific emissions and COVID-19-lockdown-induced changes in atmospheric composition. We show that meaningful trends and source detection can be obtained by using the high spatial resolution of TROPOMI data and by averaging that data over relatively short time periods. Although this is in large part the result of the improved sensitivity of the instrument, we also introduce new developments in trace gas retrieval techniques and ad hoc corrections to enhance the sensitivity of the TROPOMI datasets to even smaller emissions and smaller changes in emissions. In order to achieve these goals, we discuss the strengths and limitations of each of the retrievals for tracking global- to city-scale changes.
In the next section, the TROPOMI data will first be described in general terms, followed by a description per species to address the retrieval methods, as well as a description of how we handle each data product in this study. The goal of this methods and data section is not only to explain how this study was conducted but also to provide guidance to data users on how to best interpret and analyze TROPOMI trace gas data, not only for lockdown-driven emission changes but also for other event-driven changes. This will be followed by a context-setting section reviewing the global and regional impacts of COVID-19 lockdown measures and city-scale effects for all continents using TROPOMI NO2 data. The next two sections will describe the effect of the lockdown measures on a regional scale by examining NO2, SO2, CO, HCHO, and CHOCHO for China and India. The last section will feature an outlook of future applications for this type of analysis followed by conclusions.
In this work, our analysis is primarily based on TROPOMI data for regional lockdown periods in 2020 as compared to the same periods in 2019 and will be presented in the broader context of the TROPOMI operational data record, which started on 30 April 2018. We make use of observations from the TROPOMI instrument on board S5P, which is a push-broom imaging spectrometer (Veefkind et al., 2012) measuring in the ultraviolet (UV), visible (VIS), near-infrared (NIR), and shortwave infrared (SWIR) spectral bands selected to measure the absorption by a large number of trace atmospheric constituents as well as by clouds and aerosols. Using the spectral radiance measurements from TROPOMI, atmospheric column amounts of different gases are retrieved in addition to cloud and aerosol properties. For this work, we use the following TROPOMI data products: NO2, SO2, CO, HCHO, and CHOCHO, as summarized in Table 1. We did not include the following TROPOMI data products: tropospheric ozone columns, due to the tropics-only spatial coverage; methane, due to an even longer atmospheric lifetime than CO where its sources were not as impacted by lockdown measures; and aerosol index, which is designed to highlight long-range-transported and/or elevated plumes of smoke, dust, and/or ash and is not a quantitative measure of aerosol amount or sensitive to near-surface emissions.
Table 1Summary of the retrieval spectral range, atmospheric lifetime, and main emission sources for each trace gas addressed in this study.
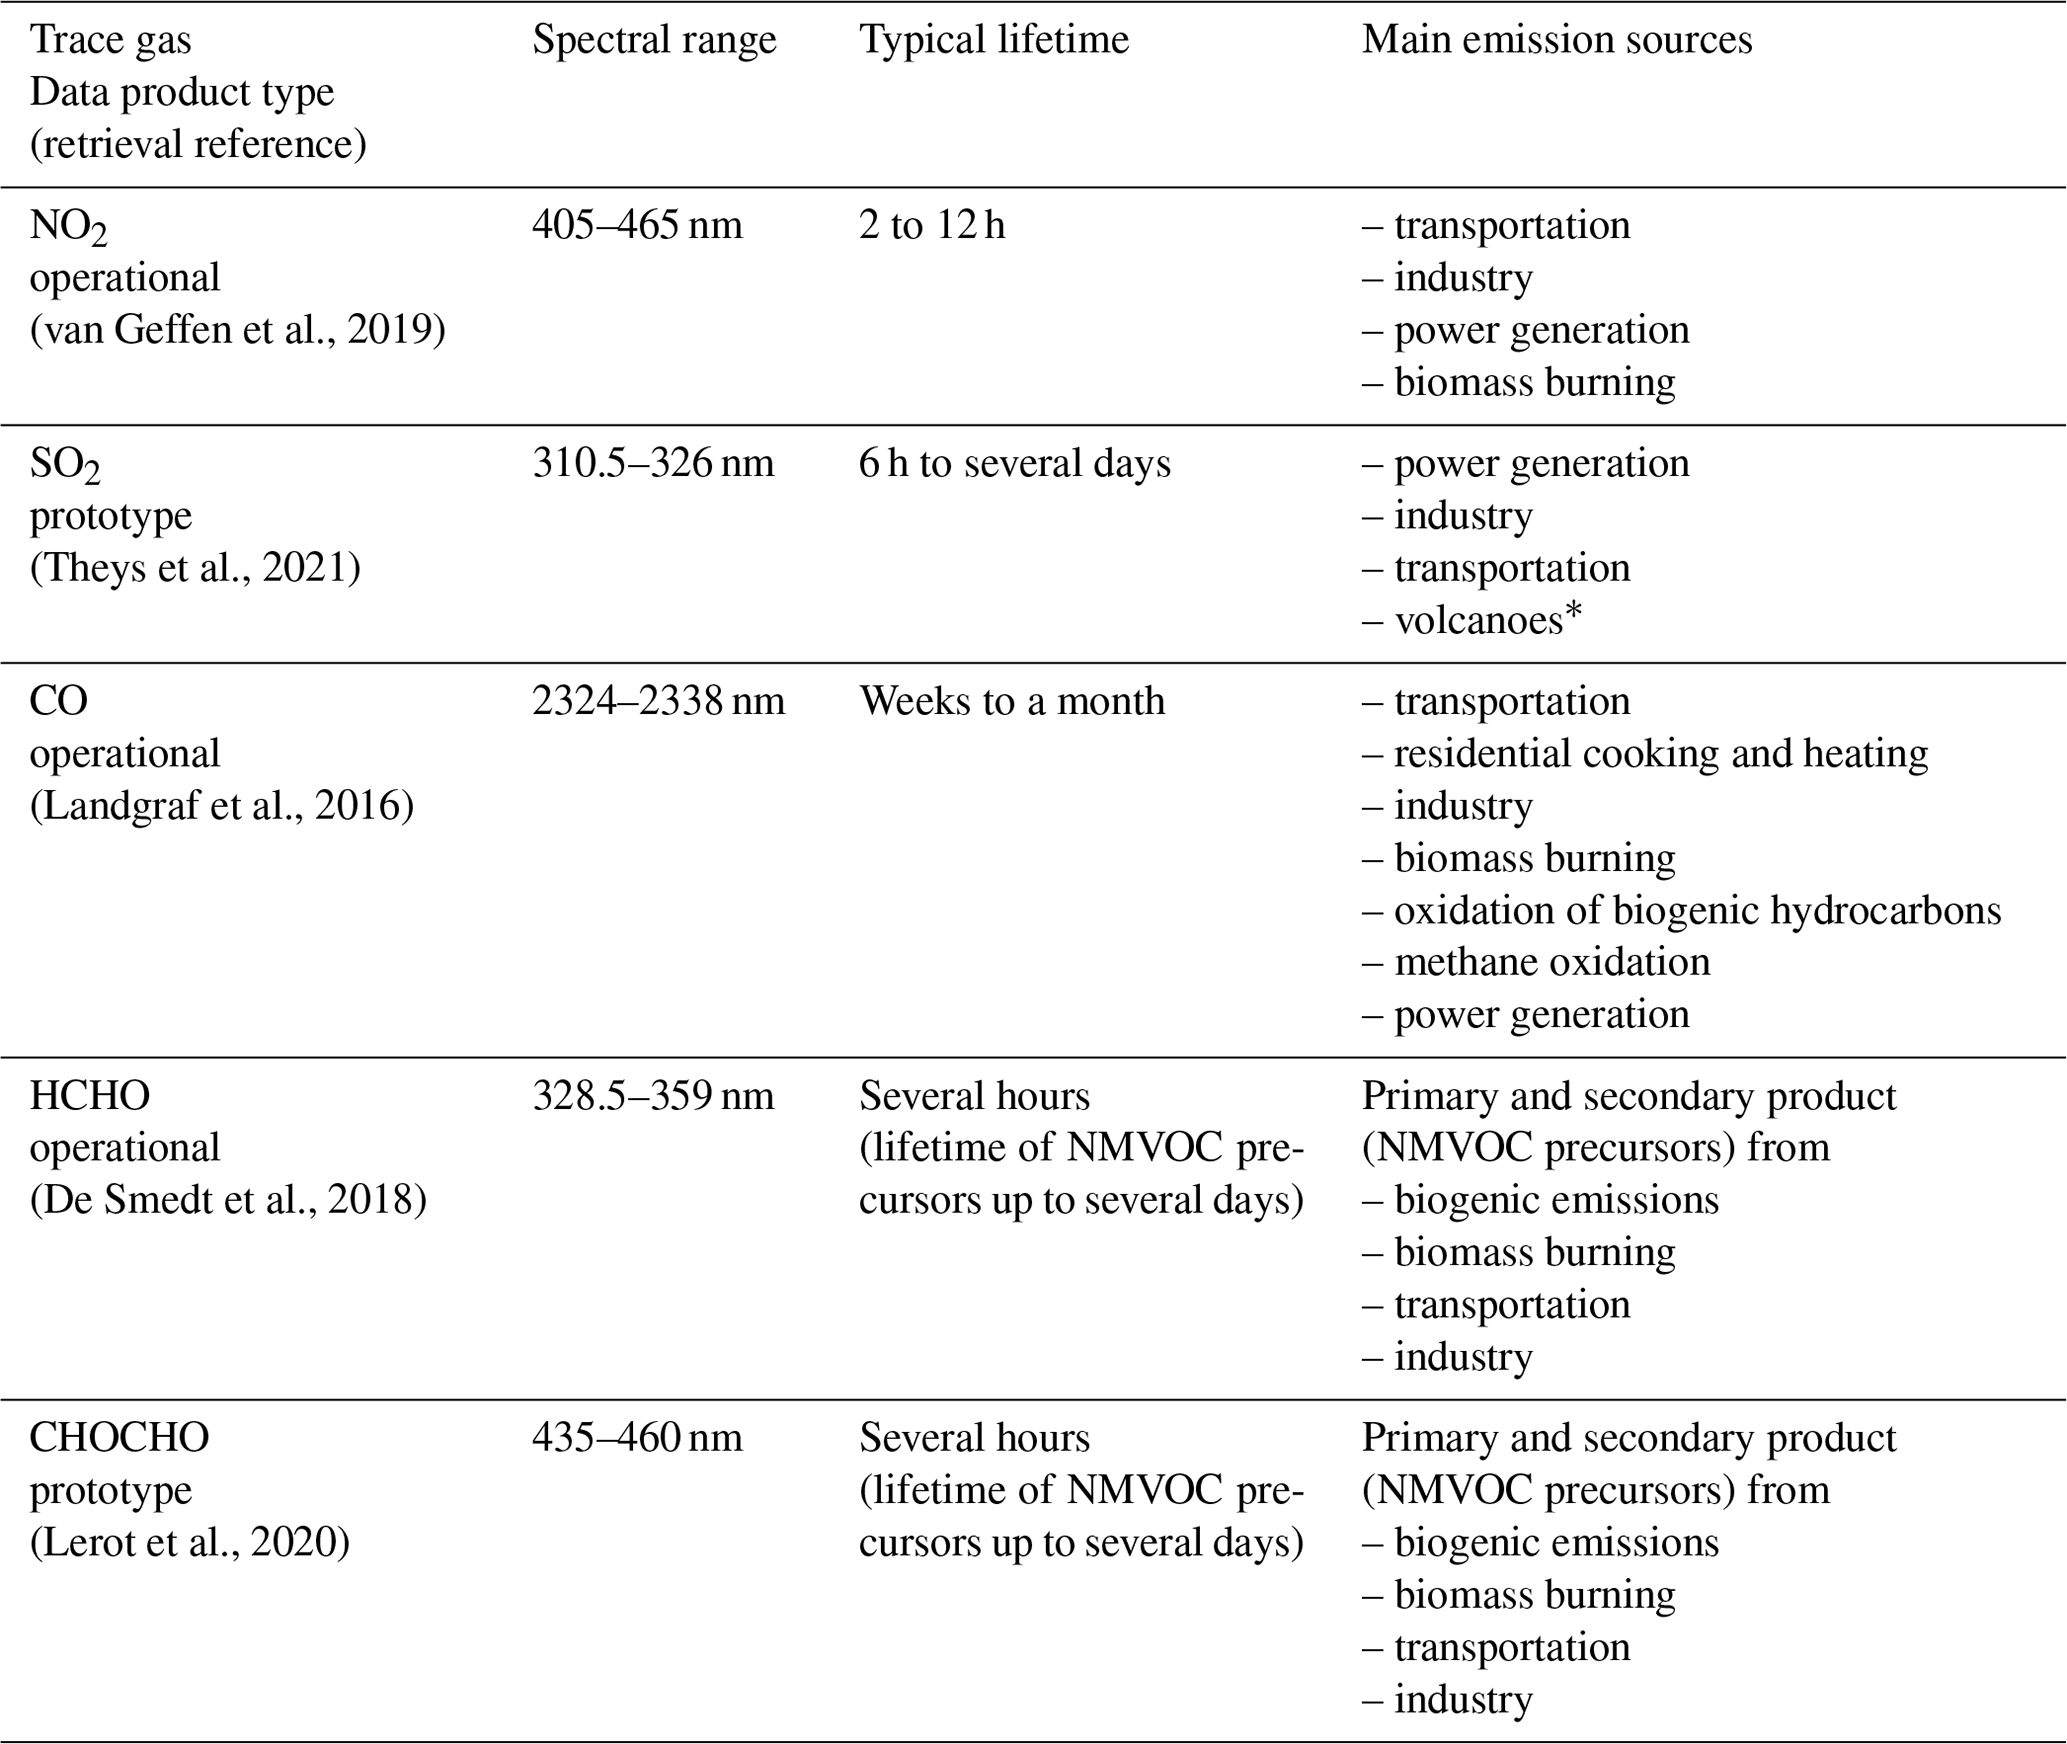
∗ Volcanic emissions are not significant for this work.
The S5P satellite flies in a sun-synchronous orbit with a local overpass time of 13:30 UTC. TROPOMI has a 2600 km wide swath, providing near-daily global coverage. The spatial sampling of TROPOMI varies over the spectral bands. The nadir sampling at the start of the operational period on 30 April 2018 was approximately 3.5×7 km2 (across-track direction × along-track direction) for the ultraviolet and visible bands and 7×7 km2 in the shortwave infrared band. On 6 August 2019, after implementation of a modified co-adding scheme, the sampling for these bands was improved to 3.5×5.5 and 7×5.5 km2, respectively.
TROPOMI observations are being widely used within and beyond the scientific community, and thus it is crucial to provide information on how these observations can best be used, interpreted, and analyzed. The COVID-19 lockdown periods provide a unique use case for the TROPOMI lead algorithm developers to highlight important differences in the individual atmospheric lifetime and detectability of each trace gas and show how these characteristics are key to the interpretation of the concomitant observations. It is not sufficient, for example, to illustrate lockdown-driven changes in emissions simply by selecting a single day or week of TROPOMI column data for a given region as measured during a lockdown period to the same day or week from year(s) prior (Braaten et al., 2020). We go further to address the importance of delineating meteorological and seasonal variability from lockdown-driven changes in emissions.
Therefore, we start this methods and data section with a general overview of considerations for the data user to take into account for analyses aimed at the quantification of changes in the emission of these trace gases. Next, in dedicated subsections, we provide a summary of the most relevant documentation and retrieval methods employed for each trace gas (see Table A1). Even though each retrieval is based on the analysis of the amount of trace-gas-specific absorption in measured radiance spectra, methods differ significantly per species.
2.1 Understanding and interpreting TROPOMI trace gas retrievals
For this paper we will focus on TROPOMI trace gas retrievals for NO2, SO2, CO, HCHO, and CHOCHO (See Table 1). To understand and interpret the TROPOMI measurements of these trace gas species and how they vary with respect to COVID-19 lockdown measures, it is necessary to consider their sources, variability through the atmospheric column, and atmospheric lifetimes. Although the mechanisms for the emission of each gas are different, there are several common anthropogenic emission sources, most notably from transportation and industry (as listed in Table 1) that were significantly impacted by lockdown measures.
A brief evaluation of how the sources of these trace gases were or were not affected by lockdown-driven changes lends insight into expected changes. In general, primary-production trace gases with relatively short atmospheric lifetimes, like NO2 and SO2, exhibit emission changes most clearly and rapidly. Although NO2 and SO2 are both important primary production anthropogenic pollutants, their sectoral sources are different. For instance, the impact of the lockdown on the transportation sector is expected to have a bigger impact on NO2 than SO2 since this sector is responsible for about 30 % of the global NOx emissions and only 1 % of the global SO2 emissions, according to the CAMS-ANT inventory (Granier et al., 2019). On the other hand, SO2 emissions are more likely to be impacted by possible changes in power generation, since this sector accounts for 52 % of the global SO2 emissions and only 30 % of the global NOx emission (Granier et al., 2019).
For CO, secondary production by methane oxidation and the oxidation of (biogenic) hydrocarbons accounts for at least 60 % of the total atmospheric CO, followed by contributions from biomass burning and fossil fuel use (Müller et al., 2018; Holloway et al., 2000). Anthropogenic CO emissions originate from the industry, transportation, and residential sectors and account for about 30 % of the global emissions (Granier et al., 2019). However, it is noted that the relative contribution of these sources varies per global region (Janssens-Maenhout et al., 2015). Although local impacts of lockdown are likely for locations with strong anthropogenic CO emissions, overall a much smaller lockdown-driven impact is expected for CO based on its longer atmospheric lifetime and smaller contributions from lockdown-affected sources (Clark et al., 2021).
Both HCHO and CHOCHO are short-lived indicators of non-methane volatile organic compound (NMVOC) emissions resulting from biogenic processes, large biomass burning events, and anthropogenic activities (Millet et al., 2008; Fu et al., 2008; Stavrakou et al., 2009; Bauwens et al., 2016; Chan Miller et al., 2016). They are mostly produced as secondary products from oxidation of other NMVOCs but are also directly emitted from combustion and industrial processes (albeit to a lesser extent). In general, the relative production of CHOCHO from such combustion processes and from the oxidation of aromatics, originating mostly from the industrial sector, is higher than for HCHO. Thus, the CHOCHO response to changes in anthropogenic emissions is expected to be stronger (Chan Miller et al., 2016; Cao et al., 2018).
It is important to note that the retrievals provide information on the tropospheric or total column amount of these gases because the spectra contain limited information on their vertical distribution in the atmosphere. TROPOMI observations thus provide a two-dimensional representation of the three-dimensional atmosphere. The vertical profiles of each trace gas vary significantly depending on the injection height of the emissions and atmospheric lifetime (see Table 1). For example, NOx emissions at the surface result in NO2 vertical profiles that peak in the near-surface layer (lowest 1–2 km of the troposphere) due to the short lifetime of NO2. Similarly, SO2 has a vertical profile that generally peaks in the lower troposphere. CO, on the other hand, has a lifetime of weeks to a month (depending on the reaction with the hydroxyl radical) and can be transported over great distances (both horizontally and vertically). Therefore, CO, even though it is often co-emitted with NO2, has a significantly higher background concentration throughout the troposphere compared to NO2. HCHO and CHOCHO have lifetimes of a few hours but are generally formed in the atmosphere via secondary production processes, which leads to an intermediate profile shape as compared to NO2 and CO.
In addition to vertical profiles that vary per trace gas species, the vertical sensitivity of the TROPOMI measurements also varies per species. For the trace gases retrieved in the UV and VIS ranges, the sensitivity decreases towards the surface so that the accuracy of the retrieved column depends on a well-characterized a priori knowledge of the vertical distribution. Due to scattering, the near-surface sensitivity is lower in the UV (SO2, HCHO) than in the VIS (NO2 and CHOCHO). In the SWIR range, the vertical sensitivity is more constant. As part of the retrieval process, a priori vertical profiles of each trace gas are scaled to match the measured tropospheric column. An uncertainty in the retrieved column amount or vertical column density (VCD) is associated with inherent differences between the true and a priori vertical profiles. However, the averaging kernels, which are reported in the data products, can be used to replace the a priori profiles with custom profiles (e.g., Eskes and Boersma, 2003; Eskes et al., 2020), thereby reducing the corresponding uncertainty. In this study, we mostly focus on relative changes in VCDs and use standard a priori profiles for each data product. Therefore, the uncertainty related to the vertical profile is rather small (as detailed in Sects. 2.2 through 2.6). Another contribution to this error is the use of partly cloudy scenes by each retrieval, which increases the amount of data available but changes the vertical sensitivity. The cloud fraction threshold for each trace gas is described in Sect. 2.2 through 2.6. In future studies, the averaging kernels could be used for inversion modeling of emissions. As explained in Eskes and Boersma (2003), relative comparisons between the observations and the model used in the inverse modeling system, and therefore the resulting emissions, no longer depend on the retrieval a priori profile shape when the kernel is applied to the model.
TROPOMI observes atmospheric concentrations of trace gases integrated over a vertical column, which is not the same as a direct measurement of the (near-surface) emission. The amount of a given trace gas integrated over a vertical column at a certain location depends not only on emission and deposition but also on atmospheric transport and (photo)chemical reactions. Note that the background concentration is higher for trace gases with a longer atmospheric lifetime. In turn, enhanced background concentrations will increase the relative importance of atmospheric transport versus local emissions. Local NO2 emissions have a relatively large impact on the measured column amounts, while for CO the contribution of remote sources can in some cases be superimposed on local emissions, thus making the interpretation more difficult. To attribute a change in concentration to a corresponding change in local emissions, the effects of meteorology and chemical lifetime must be accounted for as well.
While emissions can be estimated from satellite observations using data-driven methods (Beirle et al., 2019, Beirle et al., 2021; Fioletov et al., 2016; Goldberg et al., 2019) or using complex inverse modeling techniques (e.g., Millet et al., 2008; Stavrakou et al., 2009; Bauwens et al., 2016; Ding et al., 2020; Miyazaki et al., 2020; Borsdorff et al., 2019, 2020), here we use a more qualitative approach to probe emission changes. First we compare the column amounts in 2020 with those from the same period from earlier years and then carry out additional analysis to separate the lockdown-driven variability from seasonal and meteorological variability, taking into account local information about lockdown and anticipated impacts from different source sectors.
2.2 Nitrogen dioxide (NO2)
The tropospheric column of nitrogen dioxide (NO2) is a TROPOMI operational data product (Veefkind et al., 2012; Copernicus Sentinel-5P (processed by ESA), 2018a). Product versions are listed in the product readme file (PRF, Eskes and Eichmann, 2019a). The retrieval method is described in detail in the NO2 algorithm theoretical basis document (ATBD, van Geffen et al., 2019). The data product and data usage are described in the NO2 product user manual (PUM, Eskes et al., 2020). The dataset used for most of NO2 analyses covers the period from 1 January 2018 to 30 May 2020. For Europe, the dataset was extended through 31 August 2020.
The retrieval algorithm derives NO2 information from spectral range 405–465 nm and is largely based on the OMI NO2 retrieval developments implemented during the EU QA4ECV project (Boersma et al., 2018). The retrieval consists of three steps. The first step is based on the differential optical absorption spectroscopy (DOAS) approach, in which the total slant column of NO2 is retrieved from the TROPOMI spectra, as discussed in van Geffen et al. (2020). The second step is the estimation of the 3-D stratospheric distribution of NO2 based on an assimilation of the TROPOMI slant column data of previous days using the chemistry transport model TM5-MP (Williams et al., 2017) run at . This assimilation is set up to predominantly make use of measurements over clean areas (e.g., ocean and remote land regions) with limited tropospheric NO2. The third step is the conversion of the tropospheric slant column (total minus stratosphere) into a tropospheric vertical column by combining radiative transfer calculations with a priori profile shapes from the TM5-MP model. The data product is very comprehensive and provides all the input (such as surface and cloud information) and intermediate products.
The tropospheric column is delivered with corresponding averaging kernels and a detailed error estimate. The random error on the slant column is discussed in van Geffen et al. (2020), and is on the order of 0.56×10¹⁵ molec. cm−2 for individual measurements after 6 August 2019 (for pixel size 3.5×5.5 km2). This translates to only small random errors in the total columns on the order of 0.2×10¹⁵ molec. cm−2. Uncertainties in the estimate of the local stratospheric column amount are of the same order of magnitude. The uncertainty related to the computation of the air mass factor (AMF) is much more significant for tropospheric columns over polluted areas. The AMF uncertainties are driven by the treatment of surface albedo, clouds, aerosols, and profile shape. Such errors are multiplicative, and are of the order of 20 %–60 % depending on the geographical location, time of day, and season (van Geffen et al., 2021). These uncertainties are modeled for individual observations and are provided in the data product.
As for all operational TROPOMI data products, a quality assurance value (qa_value) is provided to filter the data and remove lower-quality data where the recommended threshold value depends on the application (see also Appendix A, Table A1). For direct visualization or gridding applications a qa_ value greater than 0.75 is recommended. For comparisons with models and data assimilation through the use of the averaging kernels, a relaxed qa_value of greater than 0.5 may be used. In this study we use NO2 retrievals with a qa_value greater than 0.75. Application of this qa_value threshold corresponds to data with mostly clear-sky conditions (cloud radiance fractions <0.5) and implies that the data are filtered to remove retrievals that do not meet certain quality criteria as described van Geffen et al. (2019).
Several recent papers discuss the validation of the NO2 product against independent observations (Verhoelst et al., 2021; Tack et al., 2021; Judd et al., 2020; Dimitropoulou et al., 2020; Ialongo et al., 2020). The main findings can be summarized as follows: the stratospheric and slant columns are in good overall agreement with other satellite measurements (van Geffen et al., 2020) and with ground-based observations (Verhoelst et al., 2021). However, the tropospheric column presents a negative bias of the order of 30 % with respect to ground-based remote sensing reference observations (Verhoelst et al., 2021; Dimitropoulou et al., 2020), as well as with imaging data from airborne measurements (Judd et al., 2020; Tack et al., 2021). Although the origin of this bias remains unclear and may be due to several causes, validation results indicate that it scales linearly with the retrieved tropospheric column amount (Verhoelst et al., 2021; see Fig. C1). As a result, (COVID-related) relative changes in the NO2 column, e.g., (2020–2019), should be largely insensitive to this bias.
2.3 Sulfur dioxide (SO2)
Initial analyses were performed using the TROPOMI operational data product for SO2 (Theys et al., 2017). However, biases present in those data (Fioletov et al., 2020) hamper the detection of the type of small changes in SO2, typically on the order of −0.1 DU, that are under investigation in this work. Therefore, an alternative retrieval scheme was applied, the so-called Covariance-Based Retrieval Algorithm (COBRA; Theys et al., 2021). In brief, the approach considers a set of SO2-free spectra in the wavelength range 310.5–326.0 nm (from TROPOMI band 3) to represent the radiance background variability in the form of a covariance matrix. The latter is updated for each orbit, TROPOMI row, and per latitude band. The covariance matrix is used to determine the SO2 slant columns from individual spectral measurements using an optimally weighted single parameter retrieval (see Walker et al., 2011). We note that COBRA does not recalculate air mass factors (AMF). These are simply extracted from the operational product to convert SO2 slant columns into vertical columns (VCDs). Compared to the operational DOAS results, COBRA significantly improves the SO2 VCDs in terms of both precision and accuracy. Because the approach empirically accounts for all sources of systematic variability in the measured signal, large-scale biases typically observed with the DOAS approach are efficiently removed, leading to a large gain in sensitivity (see Fig. C2).
In this study, we use SO2 retrievals under clear-sky conditions (cloud fractions less than 30 %) with solar zenith angles lower than 60∘, and we eliminate 25 swath edge pixels from each side of the orbit swath (450 pixels wide). The random error in the SO2 vertical columns is rather small in the range of 0.5–1.0 DU and can be largely reduced by data averaging. Errors due to spectral interferences are estimated to be very low, i.e., about 0.05 DU (Theys et al., 2021). Remaining systematic uncertainties are mostly from the auxiliary data used in the AMF calculation and are in the 30 %–50 % range. The dataset used for this analysis covers the period from May 2018 to June 2020.
2.4 Carbon monoxide (CO)
The total column of carbon monoxide (CO) is a TROPOMI operational data product obtained using TROPOMI 2.3 µm measurements (Veefkind et al., 2012; Copernicus Sentinel-5P (processed by ESA), 2018b). Product versions are listed in the Product Readme File (Landgraf et al., 2020). The data product and data usage are described in the CO product user manual (Apituley et al., 2018). This CO retrieval uses the shortwave infrared CO retrieval (SICOR) algorithm method and is described in detail in the CO algorithm theoretical basis document (Landgraf et al., 2018). The algorithm software is based on a forward scattering model and retrieves trace gas columns simultaneously with effective cloud parameters (cloud height, cloud optical thickness) from the SWIR channel to account for cloud-contaminated measurements (Landgraf et al., 2016, 2018). The inversion deploys a profile scaling approach by which a vertical CO reference profile is scaled to obtain agreement between the forward simulation and the spectral measurement (Borsdorff et al., 2014). The reference profile is based on a monthly averaged simulation from the global chemical transport model TM5 and thus varies spatially and temporally (Krol et al., 2005). The vertical sensitivity of the retrieval for clear-sky conditions is good throughout the atmosphere, while measurements for cloudy conditions have reduced sensitivity under the cloud (Borsdorff et al., 2018).
In this study, we use the CO retrieval for measurements under clear-sky and cloudy atmospheric conditions (cloud altitude less than 5000 m). This corresponds to filtering the dataset by using the quality assurance values (qa_value greater than 0.5) that are supplied with the data product. CO retrievals under low cloud conditions perform well for unpolluted scenes; however, these can lead to, e.g., lower CO values when pollution hot spots are present below the cloud due to optical shielding and scattering (Borsdorff et al., 2018). Consequently, retrievals under cloudy conditions must be considered with care, however they are essential to improve the data coverage, especially over the oceans where clear-sky measurements are hampered by the low reflectivity of water in the SWIR spectral range.
The CO retrieval skill lies well within the requirements of the TROPOMI mission (Veefkind et al., 2012) on accuracy (<15 %) and precision (<10 %). This was shown by validation with ground-based Fourier transform infrared spectroscopy (FTIR) measurements operated by the Total Carbon Column Observing Network (TCCON). TROPOMI CO is biased high compared to TCCON by about 6 ppb with a station to station variability of about 4 ppb (Borsdorff et al., 2018; Lambert et al., 2020). The dataset used for this analysis covers the period from 1 January 2018 to 30 May 2020.
2.5 Formaldehyde (HCHO)
The tropospheric column of formaldehyde (HCHO) is a TROPOMI operational data product (Veefkind et al., 2012; Copernicus Sentinel-5P (processed by ESA), 2018c). Product versions are listed in the HCHO product readme file (De Smedt et al., 2020a). The data product and data usage are described in the HCHO product user manual (PUM, Romahn et al., 2020). The TROPOMI HCHO retrieval algorithm has been fully described in De Smedt et al. (2018) and in the HCHO ATBD (De Smedt et al., 2020b). It is based on the DOAS method and is directly inherited from the OMI QA4ECV product (https://doi.org/10.18758/71021031). The fit of the slant columns is performed in the spectral interval of 328.5–359.0 nm. Reference spectra are updated daily using an average of Earth radiances selected in the Equatorial Pacific region. The conversion from total slant to tropospheric vertical columns is performed using a look-up table of vertically resolved air mass factors calculated at 340 nm. A priori vertical profiles are provided by the TM5-MP daily forecast with a spatial resolution of (Williams et al., 2017). Cloud properties are taken from the S5P operational product “Cloud as Reflecting Boundary” (CRB; Loyola et al., 2018). In order to correct for any remaining offset and striping due to instrumental artifacts or unknown misfits in the spectral retrieval, a background correction is applied based on HCHO slant columns selected in the emission-free Pacific Ocean. The background HCHO vertical column due to the methane oxidation is added using data from the TM5 model in the reference region. We use the quality assurance values (qa_value greater than 0.5) to filter out observations presenting a solar zenith angle larger than 70∘ or cloud fractions larger than 0.4.
The HCHO retrieval fulfills the requirements of the TROPOMI mission (Veefkind et al., 2012) on accuracy (40 %–80 %) and precision (12×1015 molec. cm−2). The precision of a single observation is estimated to be 5×10¹⁵ molec. cm−2 in remote locations. The dispersion is naturally larger over polluted sites (from 7 to 10×1015 molec. cm−2). Validation using a global network of FTIR measurements indicates that TROPOMI HCHO columns present a negative bias over high-emission sites (−30 % for HCHO columns larger than 7.5×10¹⁵ molec. cm−2) and a positive bias for clean sites (+20 % for HCHO columns lower than 2.5×10¹⁵ molec. cm−2) (Lambert et al., 2020; Vigouroux et al., 2020).
To characterize the HCHO interannual and seasonal variability, we have used the QA4ECV OMI dataset to construct a climatology based on recent years (2010–2018). This is justified the good agreement between OMI and TROPOMI HCHO columns, which is better than 10 % for most regions (Lambert et al., 2020). For our analysis, we use 2-week-averaged columns. This reduces the random uncertainty to about 10 %.
One of the main drivers of the observed HCHO variability is temperature, which has a direct impact on NMVOC emissions and on the chemical production of HCHO (Stavrakou et al., 2018). It results in a strong correlation between HCHO columns and surface temperatures. For this paper, we correct the HCHO column amounts for this meteorological impact prior to using the data in the analyses. We introduce a temperature correction method (Zhu et al., 2017) based on data from OMI for 2005–2020 and from TROPOMI for 2018–2020. In brief, this correction entails fitting a second-order polynomial through daily HCHO columns reported as a function of the temperature. This temperature correction is performed for each region and on the OMI and TROPOMI time series separately. On this basis, the temperature-induced variations in HCHO are removed from the time series using local daily temperatures specified by ERA5-Land 2 m meteorological datasets (Muñoz Sabater, 2019a; See Fig. C3). This correction is designed to minimize the impact of temperature fluctuations on the HCHO anomalies. Finally, a polynomial obtained using a climatology of surface temperatures is added to the differential HCHO columns in order to reintroduce the natural seasonal cycle, assuming the same temperature every year. These temperature-corrected HCHO columns are used throughout this paper. Note that the difference with uncorrected HCHO columns is generally small (less than 10 %) but can be significant when looking for small effects such as those induced by COVID-19-related emission changes. The dataset used for this analysis covers the period from May 2018 to June 2020.
2.6 Glyoxal (CHOCHO)
Glyoxal (CHOCHO) is not one of the TROPOMI operational data products. For this study we used the prototype data product developed as part of the ESA S5p+I GLYRETRO project, which relies on scientific developments performed using the GOME-2 and OMI instruments (Lerot et al., 2010). The algorithm is described in detail in the GLYRETRO ATBD (Lerot et al., 2020). In brief, the retrieval approach consists of a DOAS-type spectral fit for the observed optical depth with reference absorption cross-sections for glyoxal and other absorbing species (NO2, O3, O2-O2, liquid water and water vapor, and the Ring effect) in the spectral interval of 435–460 nm to derive glyoxal slant column densities. The latter are converted into tropospheric columns using calculated air mass factors after application of a background correction procedure aimed at reducing possible remaining (row-dependent) systematic biases. Air mass factors are calculated following the formulation of Palmer et al. (2001), which combines altitude-dependent air mass factors (or box AMFs) with a priori glyoxal concentration profiles. The box AMFs represent the instrumental sensitivity to changes in concentration at any altitude and are precomputed using the radiative transfer model VLIDORT v2.7 (Spurr and Christi, 2019), while the a priori profiles are provided by the MAGRITTE chemistry-transport model (Müller et al., 2018, 2019).
The glyoxal optical depth is very small (, which makes its retrieval very sensitive to instrumental noise and to interferences with spectral signatures of species absorbing more significantly in the same spectral region. The first factor introduces large random errors, in the range 6–10×1014 molec. cm−2, which can be reduced by spatial and temporal averaging, that is, using multiple observations averaged in time and/or space. Systematic uncertainties are dominated by spectral interferences and by uncertainties associated with the auxiliary data used as an input for the AMF calculation. These uncertainties are estimated to be 2–3×10¹⁴ molec. cm−2 (∼50 % for source regions). To limit uncertainties related to cloud contamination, glyoxal observations are only provided for scenes with effective cloud fractions smaller than 20 % (taken from the operational NO2 product). As with HCHO, to account for seasonal and interannual variability, a climatology of OMI CHOCHO columns was built to further delineate sources of variability for glyoxal column amounts.
Validation of satellite glyoxal column observations is generally limited, mostly due to the scarcity of independent ground-based data. However, a preliminary validation based on a few MAX-DOAS stations in Asia and Europe indicates that the satellite and ground instruments measure consistent glyoxal tropospheric column amounts with mean differences generally less than 2×10¹⁴ molec. cm−2, except in particular conditions such as low sun elevation or for stations that are frequently covered by clouds (Alvarado et al., 2020). The dataset used for this analysis covers the period from May 2018 to June 2020.
Numerous papers have shown that TROPOMI measurements of tropospheric NO2 column amount are well suited for detecting emission from a variety of anthropogenic sources including traffic, power plants, and industry (van der A et al., 2020; Goldberg et al., 2019). The atmospheric lifetime of NO2 and its vertical profile shape dictate that the high spatial resolution measurements from TROPOMI can readily capture rapid week-to-week changes in near-surface emissions from COVID-19-impacted cities and point sources (Sekiya et al., 2022; Fioletov et al., 2021; Stavrakou et al., 2021; Gkatzelis et al., 2021). To give context and overview, the global distribution of tropospheric NO2 based on an annual average for 2019 with an oversampling resolution of approximately is illustrated in Fig. 1.

Figure 1Global distribution of NO2 based on the annual average of tropospheric column amounts of NO2 measured by TROPOMI for 2019 (a) shown in units of micromoles per square meter. Using the same data, several zoom-in plots are shown in the middle and bottom rows: regional zoom-in for central South America (b) and a city-scale zoom-in over Santiago, Chile (c, comparing 23 March to 10 April 2020 with March–April 2019), over Paris, France (d, comparing 15 March to 15 April 2020 with March–April 2019), and over New Delhi, India (e, comparing 28 March to 22 April 2020 with April 2019). Note the different color scales in the three rows. The domain size of the panels is for Paris and for New Delhi.
The high resolution of these measurements enables further zooming to the regional, suburban, and city scale, providing detailed information about spatial distributions. Three further zoom-in cases for central Chile and its capital Santiago, for Paris, France, and for New Delhi, India, are shown in Fig. 1. These cases focus on a shorter periods coinciding with region-specific COVID-19 lockdowns (see Appendix B). Observed column amounts of NO2 are compared to similar periods in 2019, which are chosen to be longer than the 2020 period in order to reduce the effects of natural variability. Strong reductions in the NO2 tropospheric column amounts are observed during lockdown periods (Bauwens et al., 2020; Barré et al., 2021; Griffin et al., 2020; Qu et al., 2021). Interestingly, further zooming in shows that the relative reduction is not uniform over a city, reflecting differences in the mix of source contributions for different quarters of a given city.
The lockdown periods and the measures taken to mitigate the spread of COVID-19 were rolled out on country- and often city-specific basis. Figure 2 illustrates the temporal evolution of NO2 tropospheric column amounts from January to May over large cities across different continents. The observed reductions in China and India are discussed in more detail in Sects. 4 and 5. Detailed information about the lockdown measures adopted for those cities is given in Table B1. Appendix B provides a detailed description of the observed reductions during the specific lockdowns for individual (mega)cities shown in Figs. 2 and 3. The TROPOMI observations indicate substantial decreases in NO2 during the lockdowns in all studied cities, but the reductions vary significantly from one city to another.
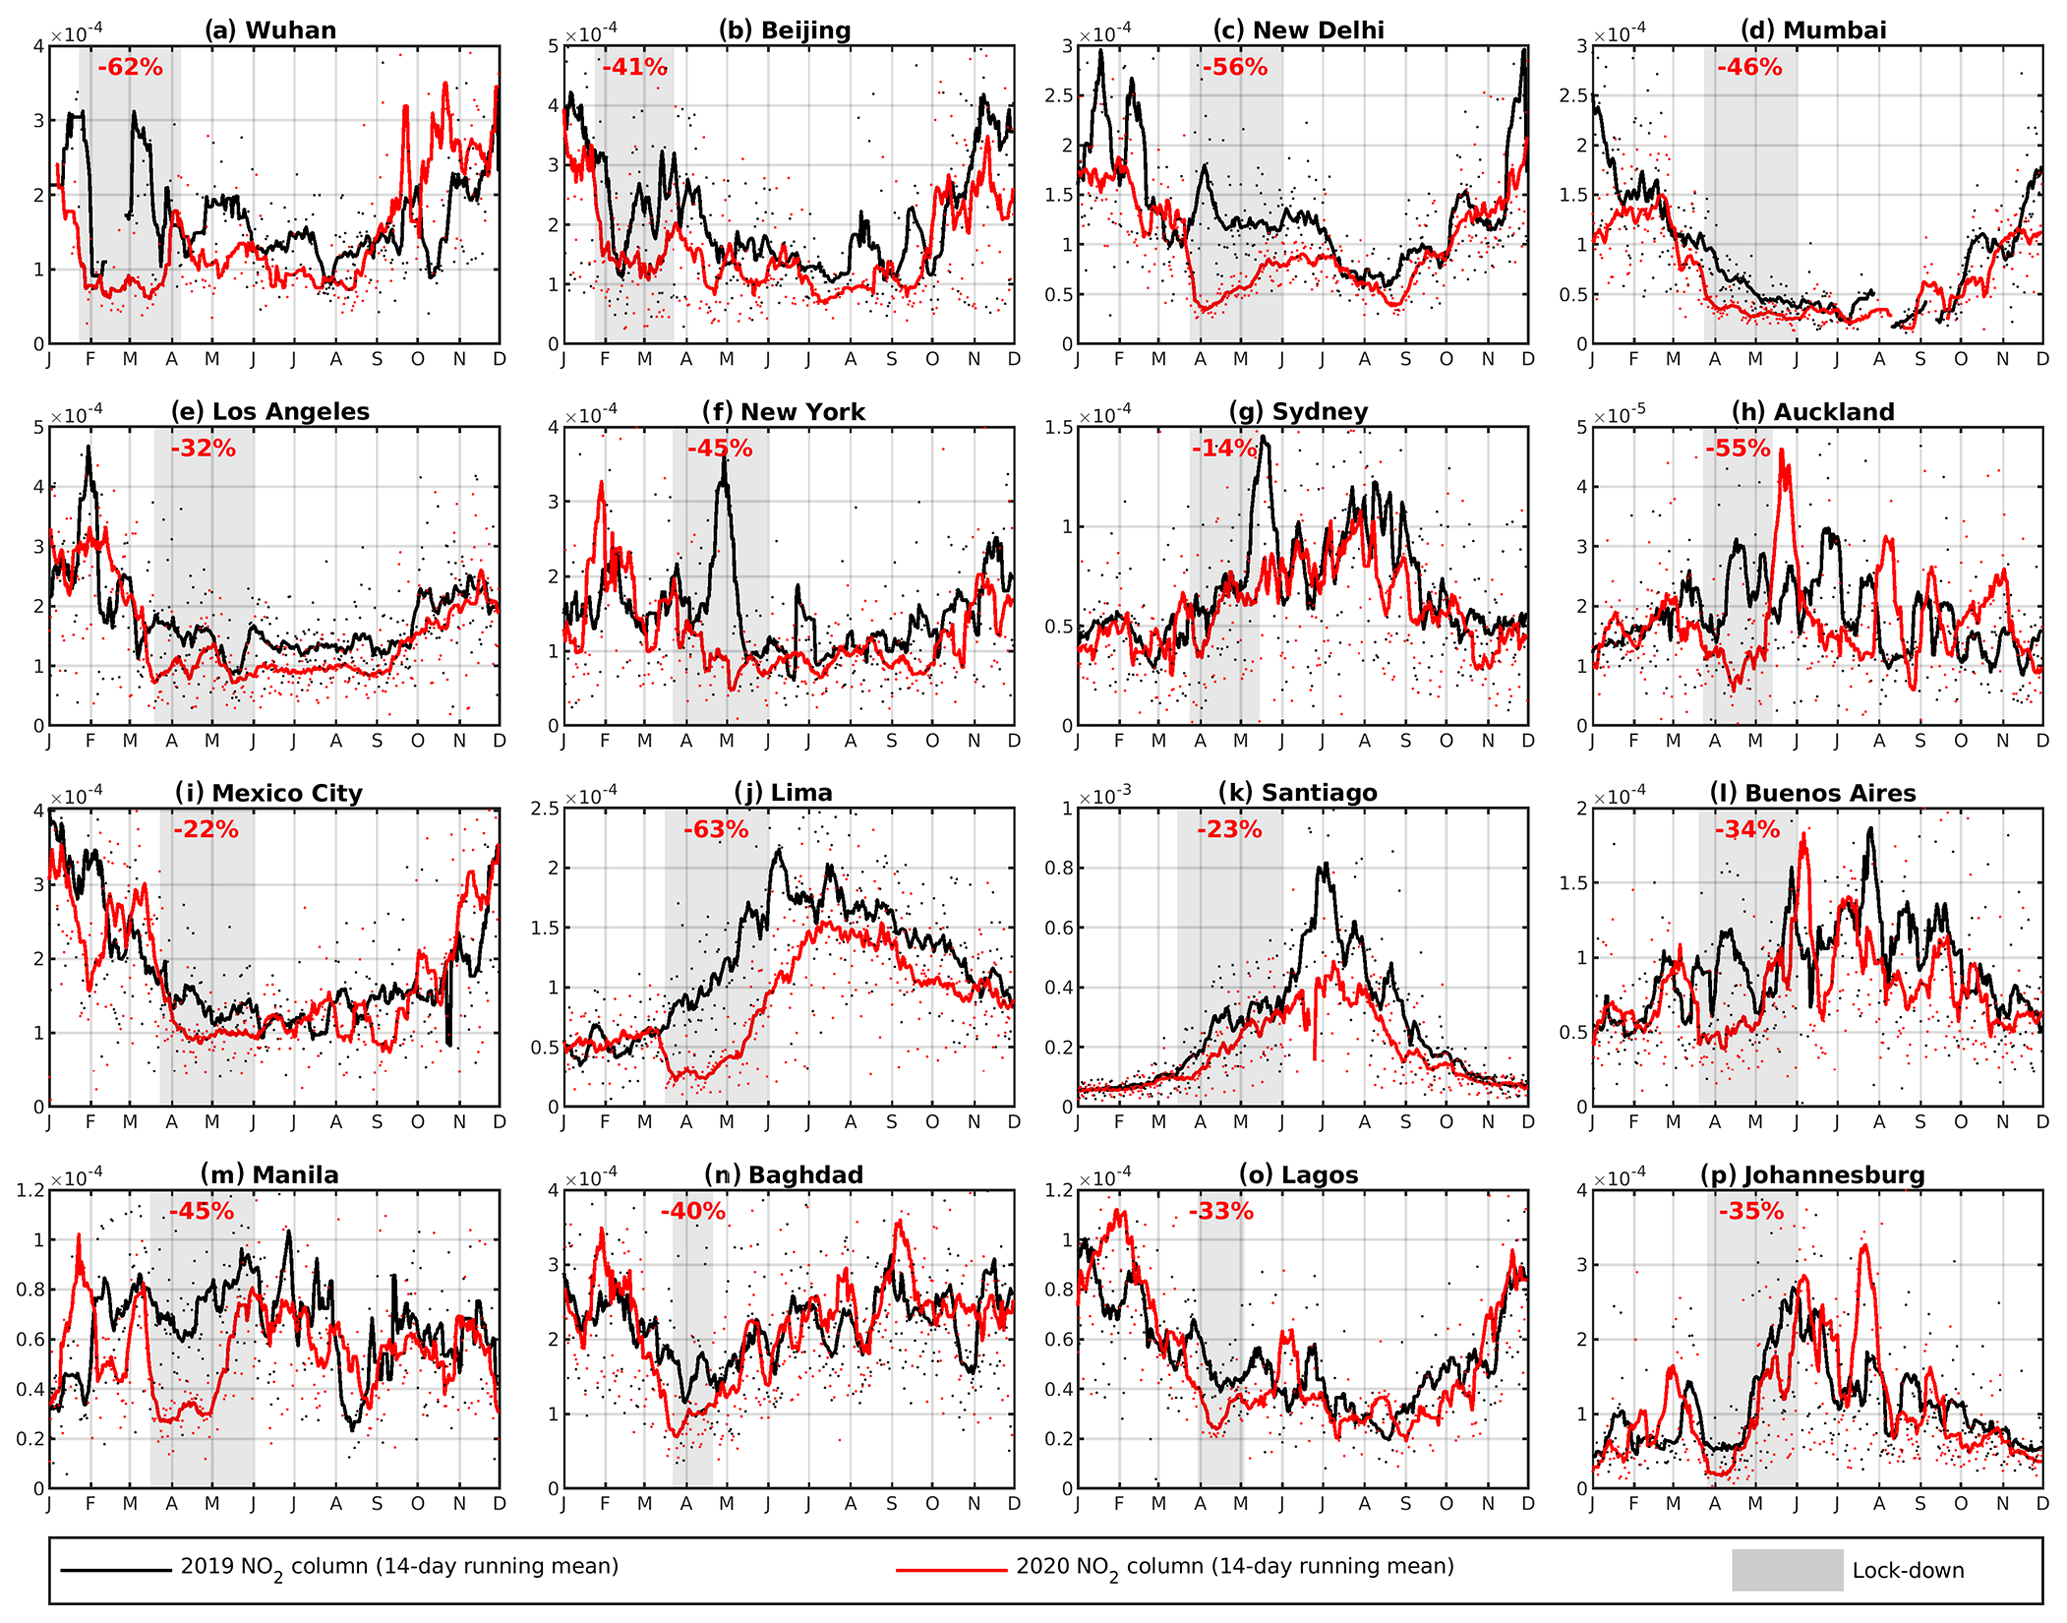
Figure 2Time series of TROPOMI NO2 column amounts (in mol m−2) for selected cities for the period 1 January to 1 December for the years 2019 (black dots) and 2020 (red dots). TROPOMI observations are averaged over a 25×25 km2 box around the city center. The lines indicate the 2-week running mean for 2019 (black) and 2020 (red). The grey zones indicate the official lockdown period for each city. The reduction in the average NO2 column during the lockdown period relative to the same period in 2019 is given inset. Details about the lockdown dates are summarized in Table B1.
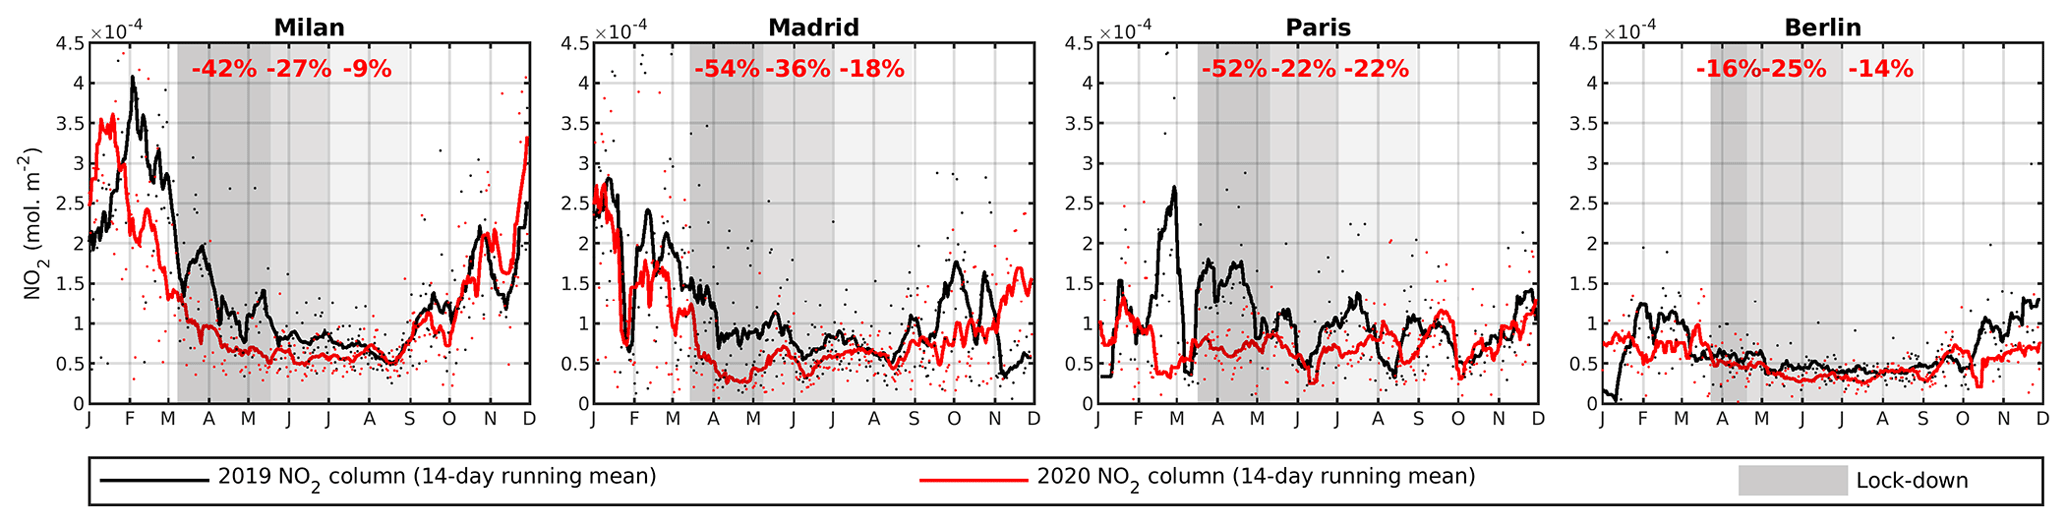
Figure 3The same as Fig. 2 but for the European cities Milan, Madrid, Paris, and Berlin for the same period of 1 January to 1 December (in mol m−2). Additional shading indicates the lockdown period (dark grey), a transition period (grey), and the period with relaxed regulations (light grey).
As mentioned previously, elative concentration changes between 2019 and 2020 (as shown in Fig. 4) should not be fully attributed to COVID-19 lockdown measures and the subsequent reduction in emissions. Daily changes in the weather have a strong influence on the NO2 concentrations, even when the data are averaged over a month. In order to estimate the impact of meteorological variability on TROPOMI-based NO2 observations, simulations were performed with the LOTOS-EUROS chemistry transport model over Europe at a resolution of . Using the same emissions for 2019 and 2020, the simulations show that meteorological variability is responsible for changes in the monthly mean, city-averaged NO2 columns with a 1-σ standard deviation of about 13 %. This variability is clearly illustrated in, e.g., the individual daily observations in Fig. 2. The drastic changes in the range of 30 %–60 % observed in the TROPOMI data and shown in Figs. 1 through 4 clearly fall outside this range and cannot be attributed to weather alone.
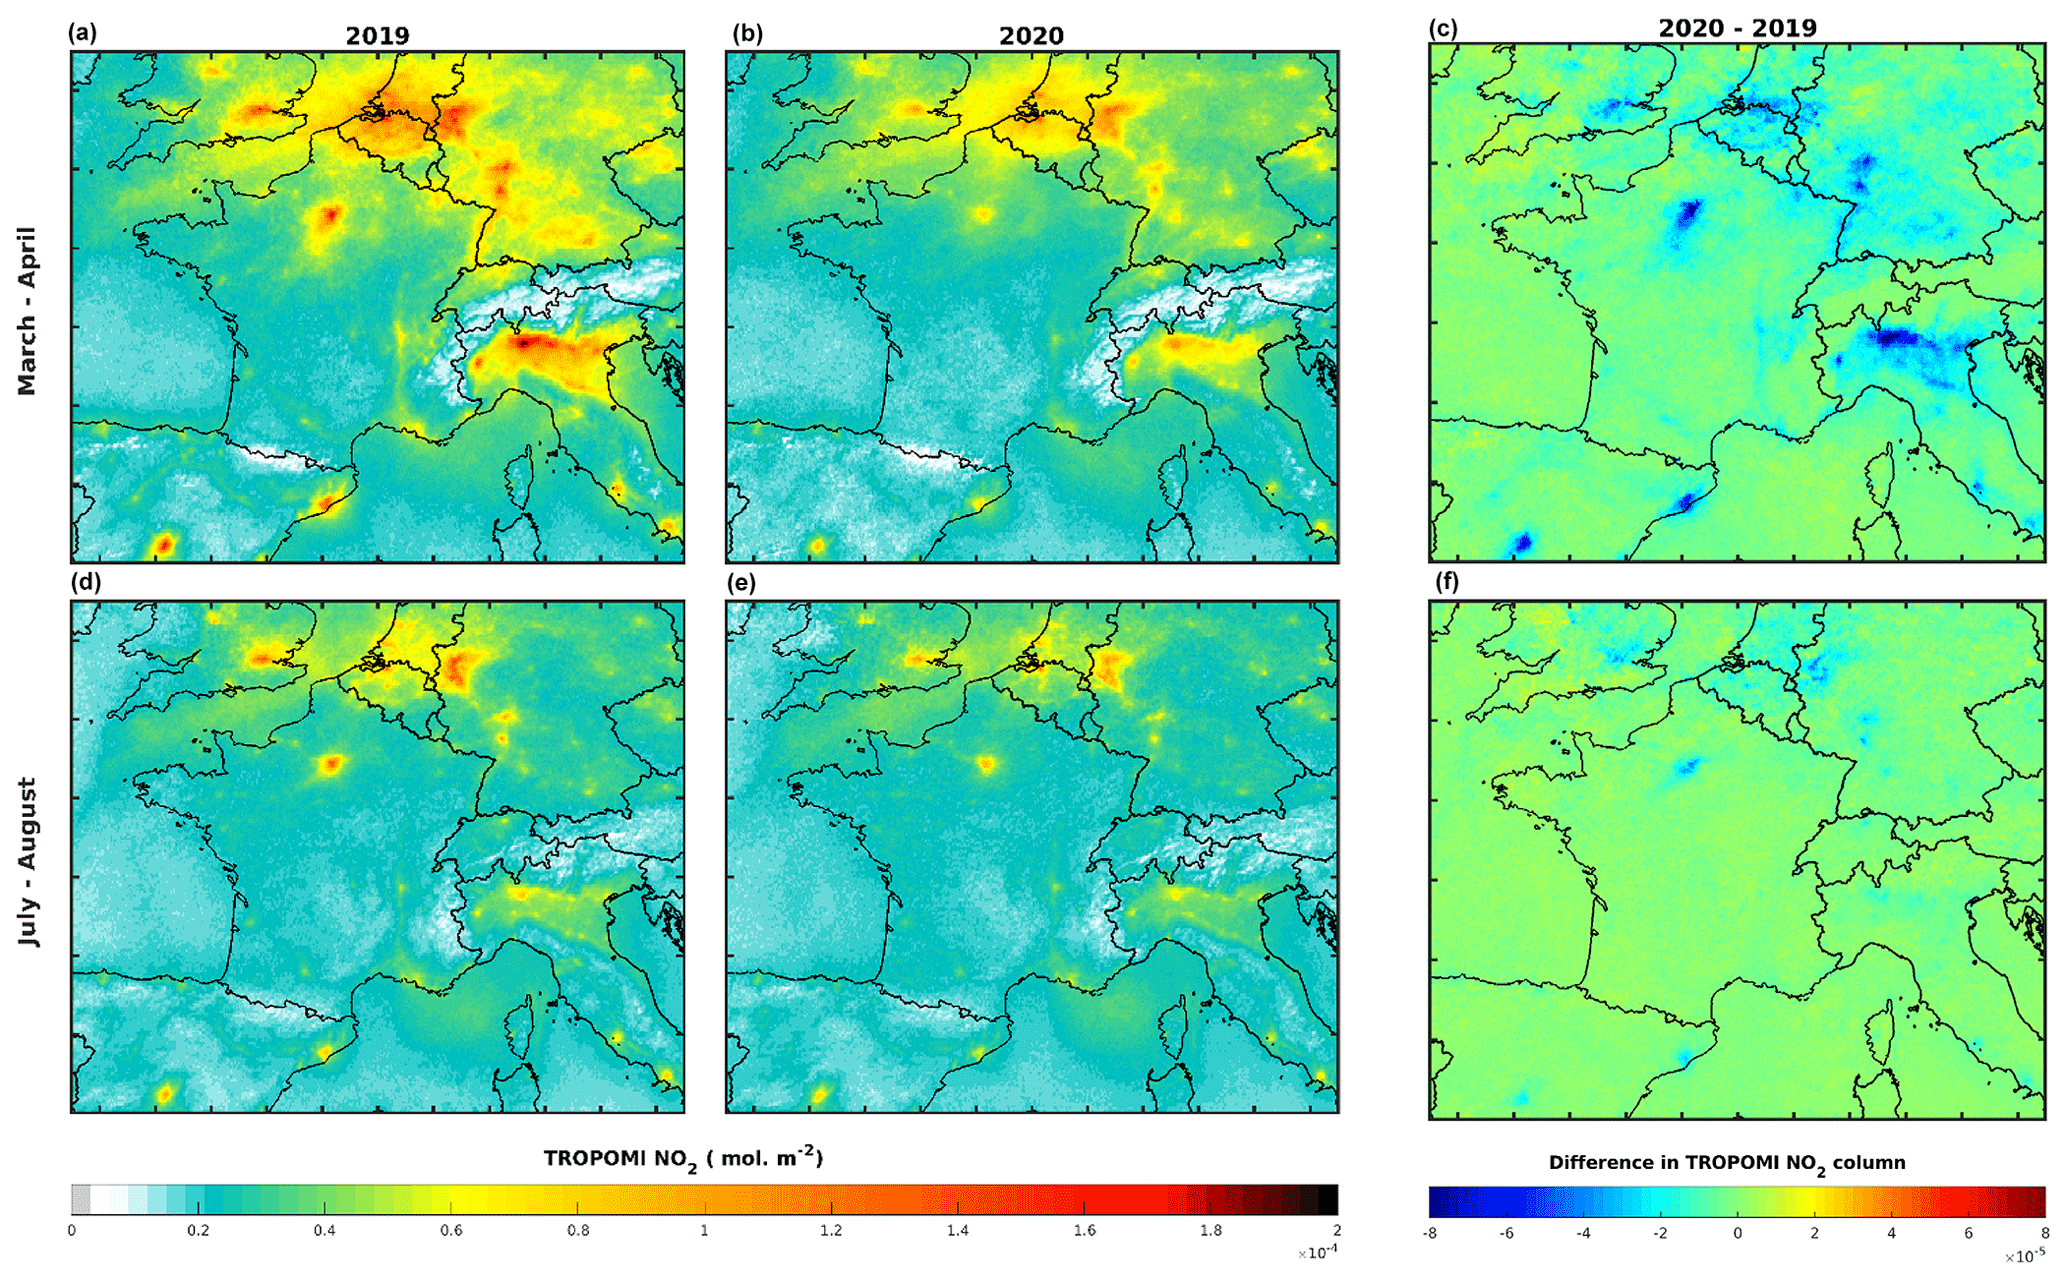
Figure 4TROPOMI NO2 tropospheric columns over Europe in the lockdown months March–April (a–c) and the post-lockdown months July–August (d–f), comparing 2019 (a, d) with 2020 (b, e) (in units of mol m−2). The difference is shown in (c) and (f).
A second complication is the presence of clouds. Months with persistent local cloud cover will therefore have a reduced number of tropospheric column observations and will exhibit more natural variability. For quantitative estimates of the COVID-19 measures, these factors should be carefully taken into account. This can be done through (i) daily based analysis of the NO2 plumes from cities using wind speed fields from meteorological models and subsequent emission derivation (Lorente et al., 2019; Goldberg et al., 2019), (ii) combining NO2 observations with analyzed wind fields (Beirle et al., 2019, 2021), (iii) regression models to estimate the impact of natural variability and emission trends in the observations (Diamond and Wood, 2020), (iv) chemistry transport modeling (Chang et al., 2020; Liu et al., 2020; Barré et al., 2021), and (v) inverse modeling and data assimilation approaches (Ding et al., 2020; Miyazaki et al., 2020).
China was the first country to impose measures to limit the spread of the SARS-CoV-2 virus. Although no national lockdown was declared, strict local lockdown measures were implemented in many cities and provinces. In Wuhan, the epicenter of the virus outbreak, the lockdown period lasted from 23 January 2020 until 8 April 2020, while in other regions it generally started in early February, with measures being eased and lifted through March. In addition to the lockdown measures, the yearly Chinese New Year holidays also affected the amount of anthropogenic emissions (Tan et al., 2009), and thus need to be considered for proper interpretation of the observations. The timing of the holiday period differs from year to year and took place from 24 January to 2 February in 2020 and in the periods 4–10 and 15–21 February for 2019 and 2018, respectively.
The impact of the COVID-19 crisis on air quality in China has already been investigated in several studies. Bauwens et al. (2020) reported that tropospheric NO2 column amounts observed by TROPOMI during the lockdown dropped by 40 %–50 % in the most-impacted cities compared to the same period in 2019 (see Sect. 3). Accordingly, top-down estimated NOx emissions exhibited sharp reductions of up to 50 % during the strict lockdown period in late January through early February (Ding et al., 2020; Liu et al., 2020; R. Zhang et al., 2020).
In situ data indicate significant reductions in ground concentrations for NO2 but also for PM, SO2, and CO (Shi and Brasseur, 2020; Wang et al., 2020; Z. Zhang et al., 2020; Y. Zhao et al., 2020). On the other hand, those studies consistently reported increases in ozone concentrations. With the support of models, Y. Zhao et al. (2020) have shown that the observed decreases in NO2 concentration were mostly caused by emissions reductions. They also show that the contribution of meteorological changes to the observed concentration reductions for other species depends on the exact location. Based on OMI observations, Z. Zhang et al. (2020) observed reductions in East Asia of about 33 % and 41 % for NO2 and SO2, respectively.
City-scale impacts of lockdowns on NO2 tropospheric column amounts for Wuhan and Beijing are presented in Sect. 3. Here, we investigate whether a lockdown signature can be detected from space at the regional scale for other key pollutants by focusing on TROPOMI tropospheric column measurement of SO2, CO, HCHO, and CHOCHO. We also compare the identified changes with the marked changes in NO2 concentration. Figure 5 compares monthly mean tropospheric columns of those different species for February 2019 and 2020. The NO2 and SO2 tropospheric column amounts are clearly lower in February 2020 compared to 2019. A small general reduction is also visible in the CO, HCHO and glyoxal column amounts. As discussed before, many factors other than the lockdown measures may explain changes in pollutant concentrations, such as the meteorology or emission reductions related to the timing of holidays. Another difficulty when comparing different years is the data sampling. In February 2019, large parts of southern China were covered by clouds, preventing space-based observation of the lowermost atmospheric layers. This is clearly illustrated in the upper row of Fig. 5 showing CHOCHO column amounts, where data are missing over large regions since this product uses the most stringent cloud filtering as compared to the other trace gases. Therefore, the following detailed discussion only focuses on the northern part of China (black box in Fig. 5, top-left panel), even though the lockdown measures were stricter in the region of Wuhan.
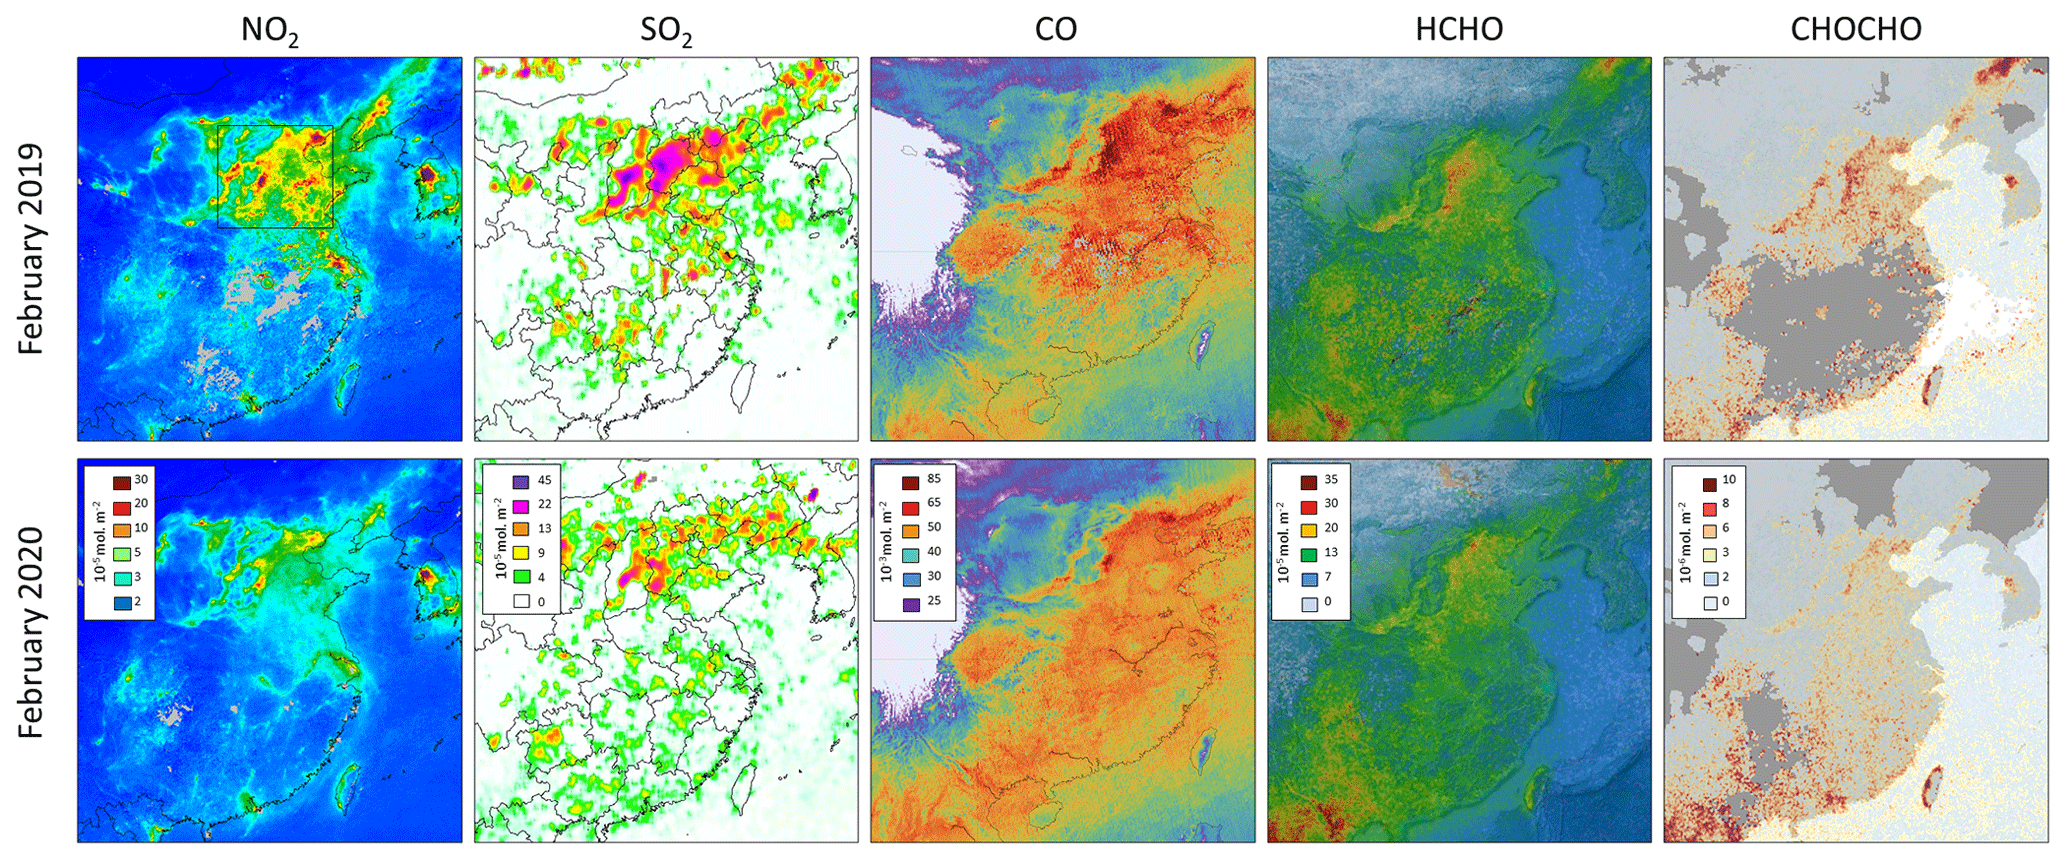
Figure 5Tropospheric and total columns for various trace gases over China as observed by TROPOMI over China in February 2019 (upper row) and 2020 (lower row) (in units of mol m−2). The black box indicates the geographical region used in the time series analysis (Fig. 6). Note that the grey-shaded regions in the NO2 and CHOCHO panels (far-left and far-right panels, respectively) indicate areas with little or no data available due to persistent local cloud cover.
Figure 6 shows the seasonal cycles for tropospheric column amounts of TROPOMI NO2, SO2, CO, HCHO, and CHOCHO for different years in northern China (region in black box highlighted in Fig. 5) starting at the beginning of the operational phase of the S5P/TROPOMI mission (30 April 2018). The different colored curves show 2-week medians of the daily mean tropospheric columns. In order to focus on the effect of COVID-19 lockdown measures for HCHO and CHOCHO, the TROPOMI-based time series are compared with an OMI-based climatology for these species using OMI data from 2010 to 2018, and shown by the dashed black curves. The associated uncertainties represent the interannual variability as estimated from OMI. This type of climatological reference based on a longer time series is not available for CO. Therefore, Fig. 6 shows CO columns starting from 1 January 2018, which have been added to extend the time series even though the data sampling was more limited in the early phase of the mission. The light vertical boxes in January and February indicate the period of Chinese New Year holidays. Note that the 2020 holiday period was slightly extended as a first measure against the COVID-19 spread.
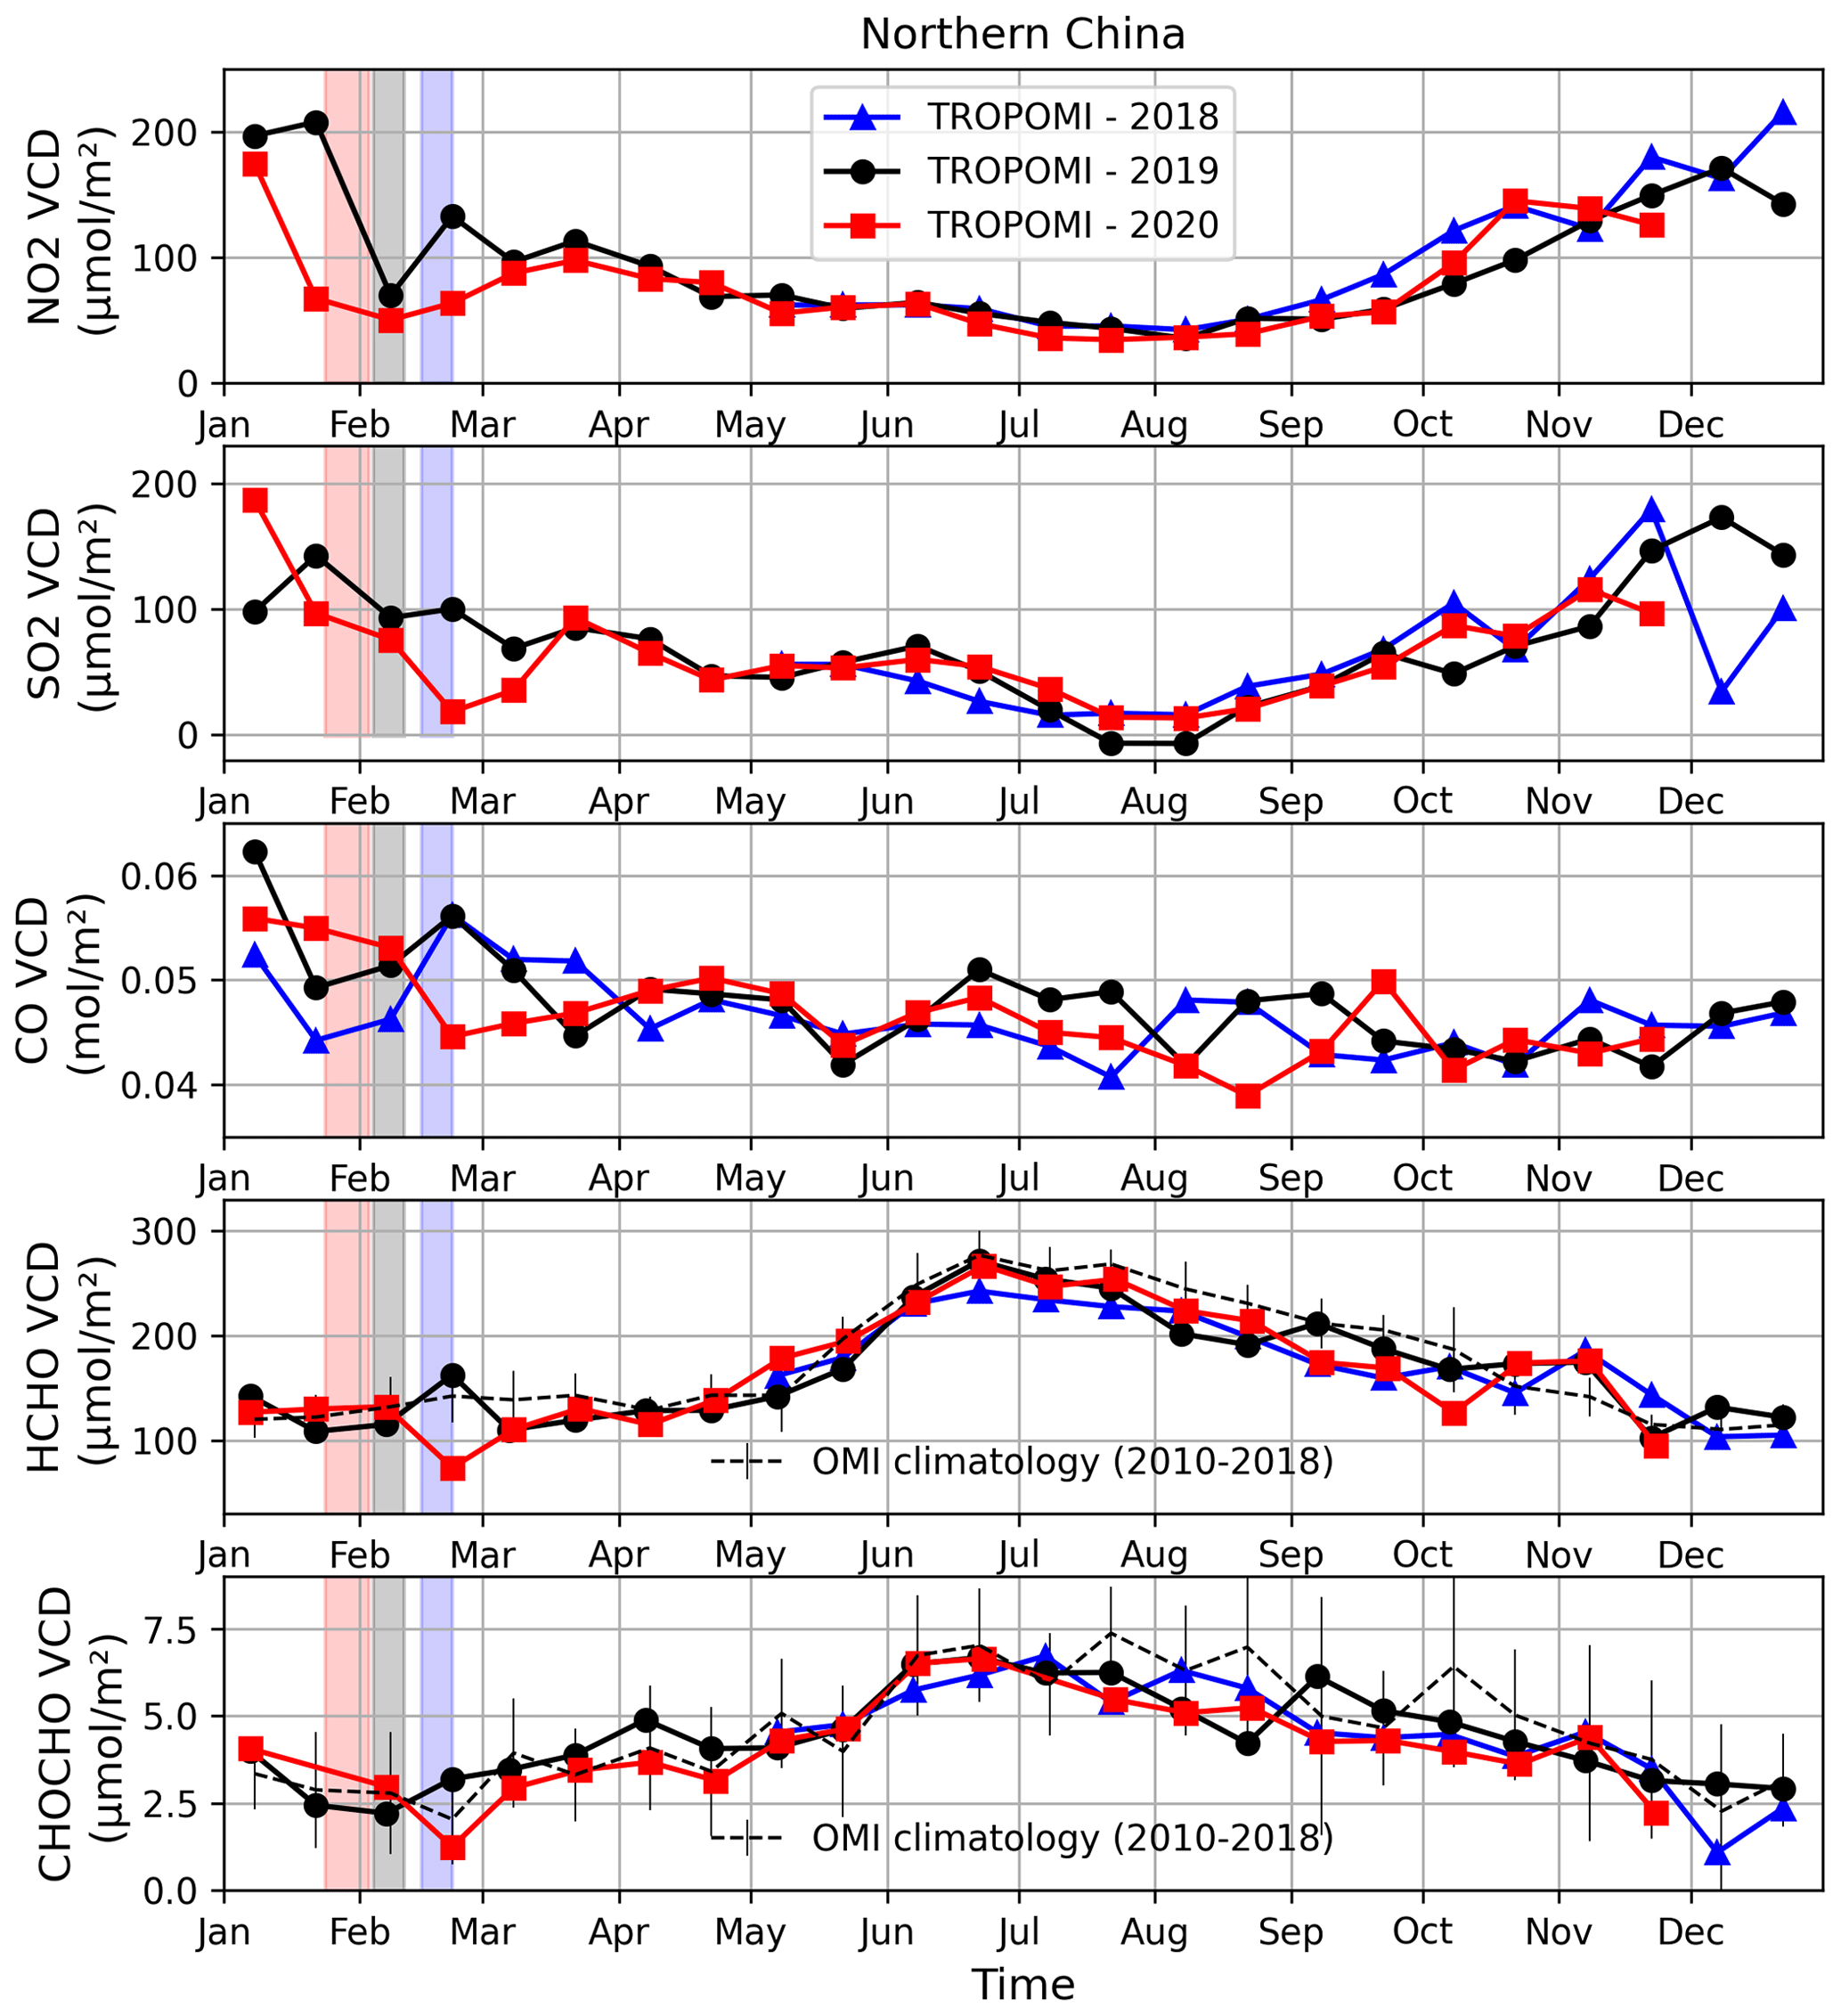
Figure 6The 2-week median tropospheric column amounts of NO2, SO2, CO, HCHO and CHOCHO (from top to bottom) for northern China (34–40∘ N, 110–120∘ E) (in units of (µ)mol m−2). The year 2020 is represented in red with square markers (2018 is shown in blue with triangle markers, and 2019 is shown in black with circle markers) and as indicated in the legend. The colored boxes correspond to the yearly Chinese New Year holidays for those same years. The dashed black lines in the HCHO and CHOCHO panels represent a climatological seasonality as obtained using the OMI datasets from 2010 to 2018 and the error bars represent the interannual variability (1-σ standard deviation).
Superimposed on the overall seasonal cycle of NO2 (maximum during wintertime caused by a longer atmospheric lifetime), a clear reduction in the NO2 columns is systematically observed which corresponds to the New Year festivities. While a quick return to higher values is usually observed after that period (Tan et al., 2009), the NO2 columns remained lower for several weeks in 2020, likely as a consequence of the reduced traffic and industrial activities. For example, NO2 column amounts at the end of February were about 45 % lower than those of 2019. In March 2020, NO2 columns progressively return to a similar level as compared to other years.
SO2 emissions in China mostly originate from fossil fuel burning of coal and oil (Wang et al., 2018). Although Chinese SO2 emissions have dropped significantly in the last decade (van der A et al., 2017; Zheng et al., 2018a), enhanced SO2 columns are still observed in some regions of northern China (Fig. 5). As illustrated in Fig. 6, SO2 column amounts are larger during wintertime, mostly due to its longer atmospheric lifetime (Lee et al., 2011). No clear reduction could be related to the yearly holidays. However, in 2020 a sharp drop is observed starting in late January through mid-March with a reduction of up to 77 % as compared to 2019. By late March–early April, values returned to levels similar to previous years, which is consistent with the NO2 lockdown signature.
In northern China the residential sector, consisting of mostly of emissions from heating and cooking, accounts for nearly half of the anthropogenic CO emissions, while the rest is distributed between traffic, power generation, and industry (Zheng et al., 2018b). Since the impact of lockdown measures is more limited for the residential sector as compared to the transport or industrial sectors, the response of CO to the lockdown measures is expected to be less distinct. In addition, due to the longer atmospheric lifetime of CO (weeks to a month), the observed column amounts result from the accumulation of the trace gas over source regions and from long-range transport from regional and global sources. As such, meteorology significantly influences CO concentrations. The observed day-to-day variability is indeed large, leading to more scatter in the 2-week median time series shown in Fig. 6. The CO columns observed in late February/early March are lower than those observed in the last two years, which might be partly caused by the lockdown measures. However, the high temporal and spatial natural variability of the CO column amount is of the same magnitude as the possible COVID-19 lockdown signal, and the large year-to-year interannual differences prevent firm conclusions from being drawn. Dedicated model simulations or a longer time series of the TROPOMI CO data may help to disentangle these effects in the future.
There are difficulties associated with the investigation of a possible lockdown signature in the satellite HCHO and CHOCHO datasets. Large uncertainties are associated with both of these column retrievals owing to their low optical depth. Moreover, HCHO and CHOCHO columns are dominated by biogenic emissions, which explains the observed seasonal pattern of HCHO and CHOCHO column values with a maximum during summertime as illustrated in Fig. 6. Variability in meteorology (temperature changes, winds, precipitation) may lead to changes in column amounts on the same order of magnitude as the expected lockdown-related reduction in anthropogenic emission changes. The interannual variability as inferred from the OMI datasets is estimated to be in the range of 1×10¹⁴ molec. cm−2 (∼30 %) and 1.2×10¹⁵ molec. cm−2 (∼12 %) for CHOCHO and HCHO, respectively. Despite those issues, a clear minimum is visible for both HCHO and CHOCHO in late February 2020, with columns significantly lower than 2019 and lower than the OMI climatology (about −40 % and −50 % for HCHO and CHOCHO, respectively). The differences are also larger than what can be explained by the typical interannual variability. This is in agreement with Sun et al. (2021), who find a significant HCHO decrease for the North China Plain. For glyoxal, a reduction in the column amounts already starts in late January, but similar reductions are observed in other years and might be related to a holiday effect similar to that observed for NO2.
It is interesting to note that local minima are observed simultaneously in late February 2020 for all species except NO2 despite the data products being generated using independent retrieval algorithms. This gives confidence to the detected reductions and their anthropogenic origin. The small delay between the initial decrease in NO2 column amount and the observed decreases in the other trace gases is related to a combination of longer atmospheric lifetimes and production being dominated by secondary processes as compared to NO2 (Stavrakou et al., 2021) and is also likely tied to the early timing of the Chinese New Year in 2020.
India implemented strict national lockdown measures limiting activities across the country starting 24 March 2020 for a period of 21 d in order to tackle the spread of the SARS-CoV-2 virus amongst its 1.3 billion inhabitants. The initial stringent phase 1 restrictions were followed by careful region-based relaxations in three subsequent phases carried out through the end of May as shown in Table 2.
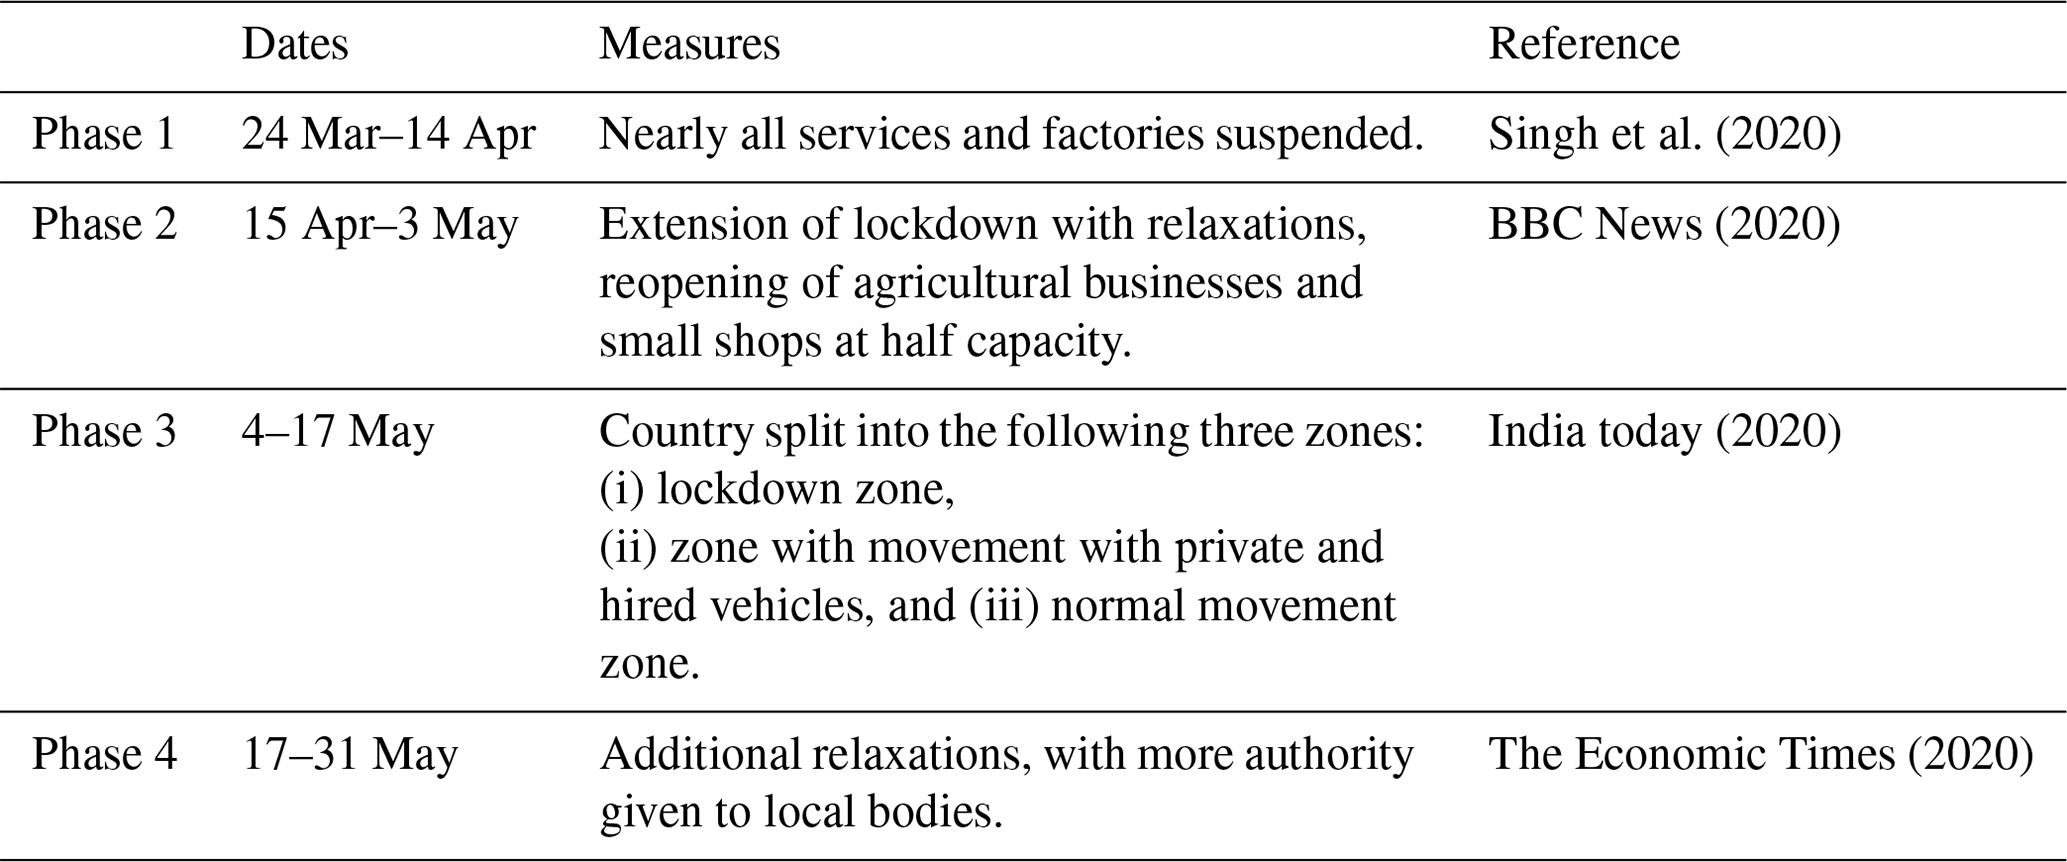
Figure 7 gives an overview of TROPOMI observations of NO2, SO2, CO, HCHO, and CHOCHO over India for April 2020, thus covering most of phase 1 and 2 of the Indian lockdown, as compared to the same month in 2019. For NO2 and SO2 the column amounts are clearly lower across the country in 2020 as compared to 2019. Although less prominent, column amounts of CO, HCHO, and CHOCHO appear to be lower in April 2020 over the domain of the Indo-Gangetic Plain (IGP), which is one of the most densely populated areas of the world, with roughly 900 million people living there.
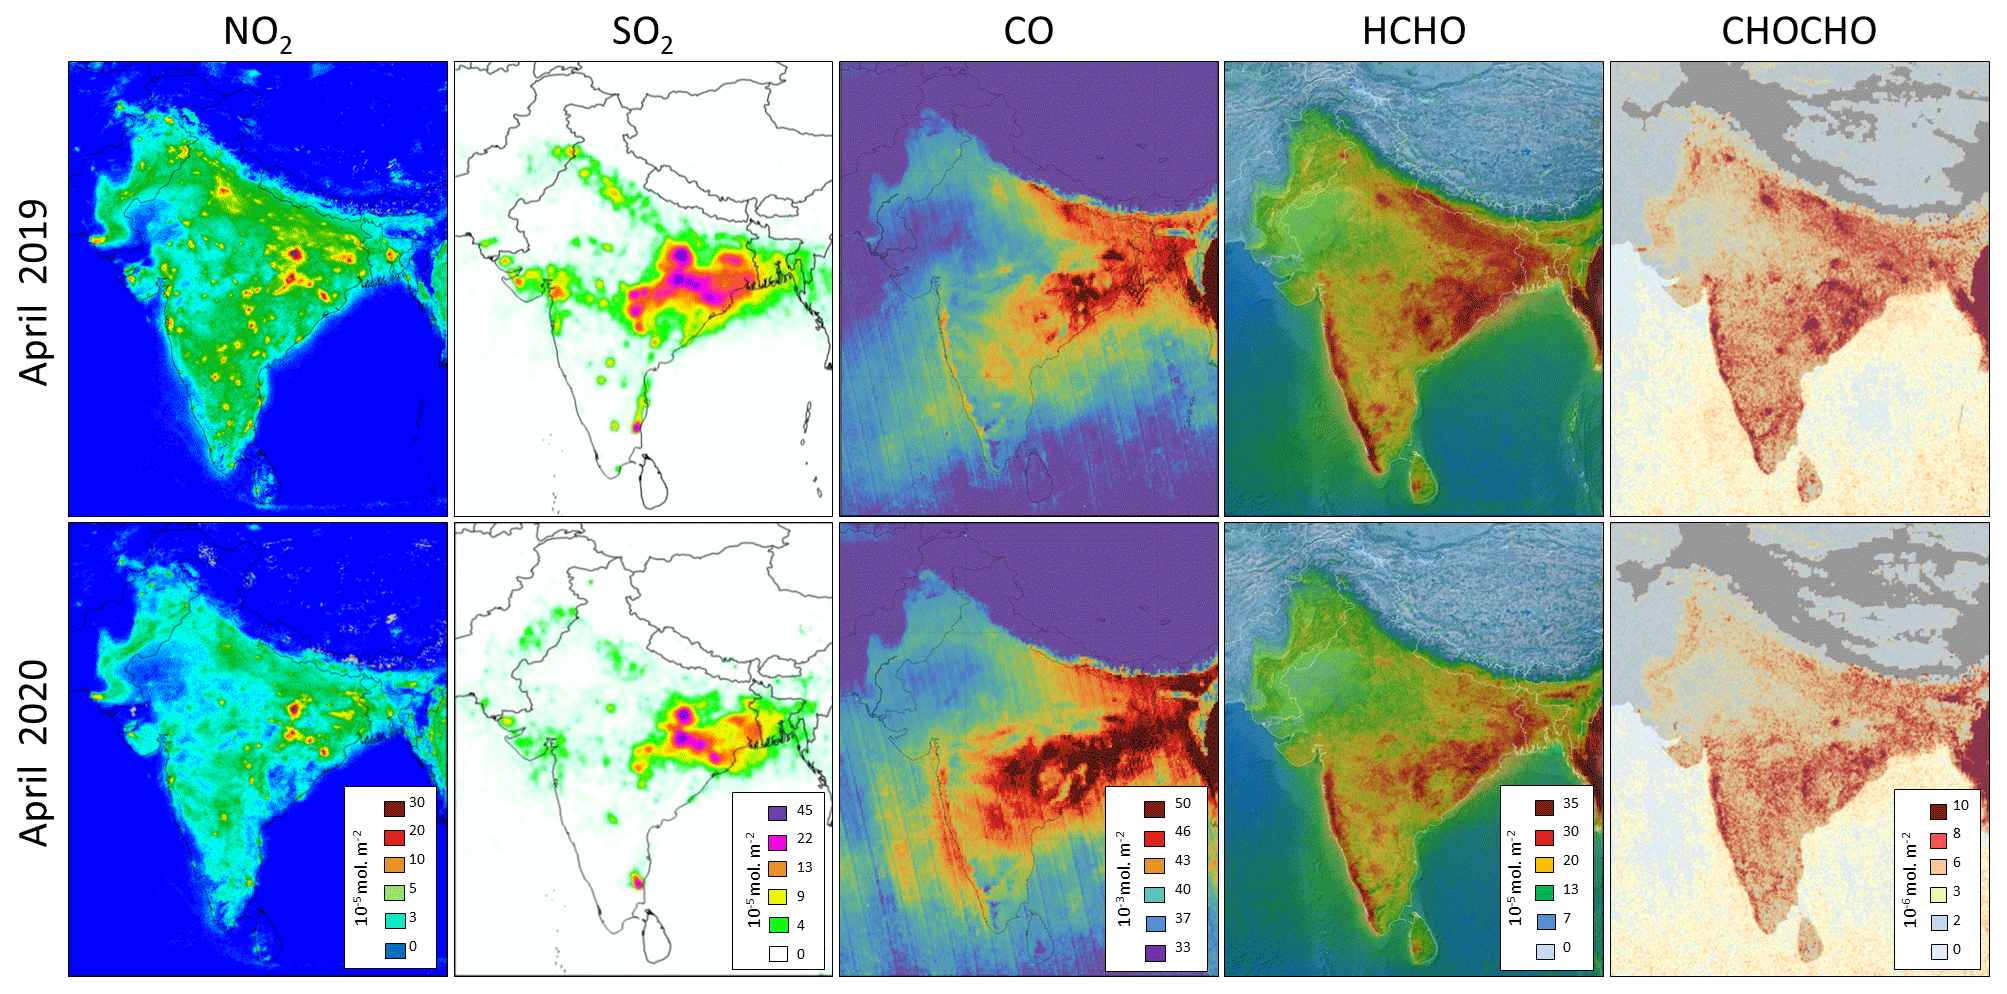
Figure 7Tropospheric and total columns maps for April 2019 (top row) and April 2020 (bottom row) for the various trace gas species measured by TROPOMI, from left to right, NO2, SO2, CO, HCHO, and CHOCHO (in units of mol m−2).
The two main sources of NO2 are road transport and power generation, each accounting for about 30 % of total anthropogenic emissions in India (Granier et al., 2019). During phase 1 of the lockdown, the Tom-Tom traffic index dropped by 80 % (Aloi et al., 2020; Prabhjote, 2020) and energy consumption dropped by 25 % compared to 2019 (Dattakiran, 2020; POSOCO, 2021) (Fig. D1). As such, we expect a particularly strong reduction in NO2 in urban areas due to large decreases in transport sector activities, and we expect a weaker reduction near power plants due to smaller decreases in energy demand.
Indeed, as indicated by the maps of NO2 column amounts in Fig. 7, a notable reduction in NO2 can be seen in April 2020 as compared to April 2019. A clear reduction is observed over major cities and over the eastern part of India where most large power plants are located. Figure 8a shows the average NO2 total column amounts as measured by TROPOMI for 2018, 2019, and 2020 for the 40 largest cities in India selected on the basis of the number of inhabitants (http://www.geonames.org, last access: 6 March 2022), where NO2 is averaged over a 15×15 km2 area around each city center. When both city centers and power plants are located within a 45×45 km2 box, this box is excluded from the averages to avoid potential outflow of one source to the other. A sharp reduction of 42 % can be seen in the amount of NO2 over cities during the first phase of the lockdown period starting at the end of March, as compared to the same period in 2019. This initial drop in NO2 is then followed by a slow but gradual increase in line with the successive relaxation phases (Table 2). Power generation is a major source for NO2 in India, especially when performed by coal-fired power plants. When examining the average amount of NO2 over the 100 largest coal-fired power plants (https://www.wri.org, last access: 6 March 2022), we observe a significant drop in NO2 during phase 1 of the lockdown period. This drop, observed over coal-fired power plants of 23 % as compared to 2019 (Fig. 8b) is less pronounced than the observed drop in NO2 over cities (Fig. 8a). The TROPOMI-observed reduction in NO2 over coal-fired power plants is in line with the initial 25 % decrease in maximum electricity demand reported by National Load Dispatch Centre (NLDC) during phase 1 and tapers to an 8 % decrease during phase 4 of the lockdown as compared to 2019 (Fig. D1, Dattakiran, 2020).

Figure 8Average tropospheric NO2 column amounts for May 2018 (green), 2019 (black), and up until December 2020 (red) over the 40 largest Indian cities (a), over the 100 largest power plants in India (b), and average SO2 concentrations over the 59 largest SO2-emitting power plants in India (c). The four different phases of the lockdown period are denoted by the different grey shading. For each phase, the reductions in NO2 (or SO2) concentrations are given relative to the same period in 2019. The dots are the daily means, and the solid lines represent the 7 d running means.
According to the CAMS-GLOB-ANT emission inventory for 2019 the major sources for SO2 in India are power generation (65 %) and industry (25 %) (Granier et al., 2019). Since India largely relies on coal for producing energy, it is the world's top emitter of anthropogenic SO2 (Li et al., 2017; Kharol et al., 2019). Therefore, most of the SO2 signal we see in TROPOMI data for this region (Fig. 7) is from coal-fired power plants, while contributions from oil and gas plants in India comprise a much smaller part of the signal (Fioletov et al., 2016). From Fig. 7, a reduction in SO2 is visible over most areas and is especially noticeable for the easternmost part of India, which is India's largest SO2-emitting region, with more than 20 coal-fired power plants.
We have investigated the SO2 VCD amounts over the largest power plants and adapted the selection method used for NO2 by considering a larger area of 50×50 km2 around each power plant. This is justified by (1) the longer lifetime of SO2 compared to NO2, (2) the lower contamination by other sources, and (3) the need to reduce the noise on the SO2 data to more clearly isolate the signal from the power plant. The results of the averaged SO2 VCD time series are presented in Fig. 8c. It should be noted that an additional selection of the power plants was applied for SO2 when compared to the process for NO2. Based on the SO2 VCD map for April 2019 (Fig. 7), only the power plants with mean SO2 columns larger than 0.15 DU were considered (59 power plants in total). Although the signal is relatively weak for SO2, we find very similar reductions in SO2 as compared to NO2. Especially during the first two phases of the lockdown, a reduction of about 20 % is found, which is in line with the NO2 observations and the reported reduction in energy demand. In May, for the different years the consistency between NO2 and SO2 VCDs is less straightforward and the reason for this is not fully understood. It should, however, be noted that the NO2 and SO2 data products do not use the same cloud products for filtering and this might be a reason for discrepancy. Moreover, the possibility of a systematic contamination of the NO2 signal over power plants by other sources cannot be ruled out completely. A noticeable feature of Fig. 8b and c is the overall excellent correspondence between NO2 and SO2 VCD evolution (on short-term or seasonal basis and outside the lockdown periods), as well as from year to year. This further strengthens the observed COVID-19-related drop in both trace gases, although it is clear that meteorology and chemistry likely play a large role in the observed VCD variability. In addition, ground-based studies in New Delhi find a more important reduction in NO2 compared to SO2 (Mahato et al., 2020; Kumari and Toshniwal, 2020).
For HCHO, CHOCHO, and CO, various regions over India have been investigated to detect a possible signal resulting from COVID-19 lockdown measures. We could only identify such a signal in the densely populated areas of the Indo-Gangetic Plain and New Delhi. These areas, due to the high intensity of traffic and industrial activities, are most likely to exhibit large impacts on atmospheric pollution levels due to COVID-19 lockdown measures.
Figure 9 shows 2-week-averaged column values for HCHO, CHOCHO, and CO over the IGP and New Delhi based on TROPOMI data from January 2018 to June 2020. To support the interpretation of the observed seasonal and interannual variations, Fig. D2 presents the corresponding temperature, precipitation amount, and fire count. The temperature starts increasing in January and reaches a maximum in June. The period from July to September corresponds to the monsoon season, with heavy rains and lower temperatures and therefore lower pollution levels. Fire activity peaks around May, with a second peak is observed in November for the IGP. The time series of the HCHO, CHOCHO, and CO columns correlate with these seasonal events, albeit with a different amplitude. For example, HCHO shows the strongest correlation with temperature (see Sect. 2.5), while CHOCHO mainly follows fire emissions. The smaller amplitude in CO variations is caused by its longer lifetime.

Figure 9Time evolution of HCHO, CHOCHO, and CO over the densely populated Indo-Gangetic plain (a, c, e, defined as the region within these 4 coordinates: 29.5∘ N, 72∘ E; 21.5∘ N 86∘ E; 24.5∘ N 88.5∘ E; 32.5∘ N 74.5∘ E) and over the megacity New Delhi (a, c, e, with a radius of 25 or 50 km for CHOCHO) as observed with TROPOMI. The year 2020 is represented in red with square markers (2018 is in blue with triangle markers, and 2019 is in black with circle markers). With the HCHO and CHOCHO time series, the OMI climatology is shown for comparison (dashed black line, 2010–2018), the error bars represent the interannual variability of the 2-week-averaged columns. The HCHO columns have been corrected in order to assume the same temperature every year (see Sect. 2).
A large part of the observed HCHO and CHOCHO columns for India are due to natural emissions, which can vary significantly due to changes in meteorology, particularly changes in temperature and precipitation. Hence, a possible reduction in the anthropogenic volatile organic compound (VOC) emissions due to the lockdown measures is expected to have a small contribution to the variability of the measured columns. During the most stringent lockdown (phase 1), a reduction in HCHO column amount is observed for the IGP and is even more pronounced over New Delhi (Fig. 9a–b; −2 and molec. cm−2 [−20 % and −40 %], respectively, compared to the OMI climatology for 2010–2018). In both cases, the anomaly is larger than the interannual variations observed during this period (about 1.5×10¹⁵ molec. cm−2), where changes in temperature or precipitation do not seem to explain the observed column decrease during phase 1. The observed column decline is even more pronounced over New Delhi than over the IGP, suggesting that the origin of the reduction is mostly anthropogenic.
The case for lockdown-driven reductions is further supported by the CHOCHO observations, which exhibit the clearest COVID-19 signal during phase 1 of the lockdown (Fig. 9). The reduction in CHOCHO during the lockdown period over the IGP is slightly larger than the interannual variability of 1×10¹⁴ molec. cm−2 (or −25 %) as determined from the OMI CHOCHO climatology. Similar to HCHO, the reduction in CHOCHO over New Delhi is twice as large (−50 %) and well beyond the 1-σ OMI climatology range. Phase 2 is also characterized by lower CHOCHO column amounts in 2020 as compared to 2019, but temperatures are also lower (unlike phase 1). Accounting for temperature-driven variability (Sect. 2.5) brings the HCHO columns close to the mean HCHO seasonal levels. The somewhat more pronounced effect of the lockdown on CHOCHO compared to HCHO in New Delhi is most likely due to the strong contribution of anthropogenic VOC precursors to CHOCHO amounts (Chan Miller et al., 2016). Interestingly, fire counts show that there were fewer fires in May 2020 compared to previous years (Fig. D2), most likely as a consequence of the lockdown measures, which may also contribute to the lower glyoxal columns.
As was the case for China, it is more difficult to identify a signal in CO column data driven by the COVID-19 lockdowns over India. An important reason for this is the much longer atmospheric residence time of CO that varies depending on the OH concentration (Holloway et al., 2000). Moreover, according to bottom-up inventories, the major anthropogenic CO sources in India are the residential sector (42 %), road transportation (21 %), agricultural waste burning (18 %), and the industrial sector (16 %) (Granier et al., 2019). Hence, during a lockdown we expect that the main source of CO, the residential sector, to be less affected. Figure 7 shows that the CO amounts in southern India are higher in 2020 as compared to 2019. The enhanced CO values in 2019 and 2020 are detected above regions (e.g., Madhya Pradesh, Odisha, and Chhattisgarh) where seasonal forest fires commonly occur in April and May (Chandra and Kumar Bhardwaj, 2015; Srikanta et al. 2020). Thus, the enhancement of CO for the different years depends not only on the fire activity but also on how the meteorological situation prevents or permits the accumulation of CO in the atmosphere. To more fully address the reasons why CO is higher in 2020 than 2019, future studies could carry out calculations using a chemical transport model. The long atmospheric residence time of CO complicates the identification of COVID-19 lockdown signals. For CO we also derived the full TROPOMI time series for the IGP and New Delhi, as shown in Fig. 9 (lower row). The time series for New Delhi in mid-April shows somewhat lower CO values in 2020 compared to 2019, but the large natural variability of CO prevents clear identification of a COVID-19-lockdown-driven effect. In future, analysis of a longer TROPOMI CO time series or model experiments may help to quantify the effect of COVID-19.
In this paper, we have analyzed the impact of COVID-19 lockdown measures on air quality around the globe based on observations of several trace gases from the Sentinel-5P/TROPOMI instrument. TROPOMI provides daily, global observations of multiple trace gases, where the measured vertical column amounts are driven by emissions and atmospheric and chemical processes of transport, transformation, and deposition. We compared the 2020 TROPOMI data with similar periods from previous years and carried out additional analysis to disentangle changes in emissions due to COVID-19 lockdown measures from meteorological variability, seasonal variability, and from other non-lockdown emission drivers. We analyzed time series of NO2 measurements from city to regional scales for several locations around the globe, showing the potential of TROPOMI to globally monitor local to regional impacts of COVID-19 lockdown measures on air quality and anthropogenic emissions. Furthermore, for the first time, we used a combination of five trace gases observed by TROPOMI, specifically NO2, SO2, CO, HCHO, and CHOCHO, to assess the impact of COVID-19-related lockdown measures on trace gas concentrations.
From global to city-level scales, we have illustrated consistent and sharp decreases in NO2 column amount driven by the COVID-19-related lockdown measures. These findings are based on detailed analysis of the distribution of NO2 using daily measurements from TROPOMI. For the city of Wuhan in China, the first city to issue a lockdown, NO2 concentrations measured by TROPOMI were about 60 % lower than the same period in February–March 2019. After China, lockdowns were issued across all continents and for the majority of countries from March through May 2020. Reductions in column amounts of tropospheric NO2 range between 14 % and 63 % for megacities all over the world. The strength of the reduction depends on the type and efficiency of local measures carried out and on the relative contribution of traffic, industry, and power generation to NO2 emissions for a given area. Owing to the unprecedented resolution of TROPOMI of about 5 km, reductions in different source contributions to NO2, such as city traffic, highways (Liu et al., 2020), power plants (Miyazaki et al., 2020), industry, and shipping (Ding et al., 2020), can be estimated separately.
As demonstrated by time series analysis of the NO2 observations, there is substantial variability even in 2-week averages, which is attributable to meteorological variability. On average, we estimate the standard deviation of this variability to be about 13 % (1-σ standard deviation) for major cities in Europe, but locally the effect can sometimes be larger. However, the large and systematic reductions (30 %–60 %) observed cannot be explained by meteorological variability alone and are therefore attributed to the effect of the lockdown measures.
For SO2, we observe significant column reductions in China and India over coal-fired power plants, which are the primary sources of anthropogenic SO2 in these areas. Over northeastern China in late February 2020, large reductions in SO2 vertical column amounts were observed as a result of lockdown measures with a decrease up to 77 % as compared to the same time period in 2019, which cannot be explained by interannual variability alone. An analysis of SO2 vertical column amounts over the largest SO2-emitting power plants in India reveals a reduction in SO2 of about 25 % during the first two phases of the lockdown as compared to 2019. For India, the reductions in SO2 were highly correlated with NO2 reductions for the same power plants and with the national energy demand for that period.
The natural variability of HCHO and CHOCHO does not allow for detection of a significant decrease due to the COVID-19 measures in most regions of the world based on TROPOMI observations alone. Exceptions are northern China and New Delhi, where observed reductions could be attributed to the lockdown measures. For northeastern China, a 50 % reduction in the CHOCHO column amount is observed during the second half of February 2020, which is larger than the typical observed interannual variability of 30 %. For HCHO, after correcting for the effect of seasonal and temperature variations, we observe a coincident 40 % reduction. We analyzed column amounts of CO, CHOCHO, and HCHO over the Indo-Gangetic Plain, which is the most densely populated region of India. For CHOCHO and HCHO, we observed small reductions in column amount due the COVID-19 measures, where these observed effects are slightly larger than the interannual variability as determined using an OMI climatology (2010–2018). The observed reduction of 25 % of CHOCHO in this region is of the same order as the typical interannual variability. A stronger reduction of 60 % is observed for the city of New Delhi, which is similar to the reduction observed over northern China but occurs later due to the difference in lockdown timing. For HCHO, we also observe a significant 40 % decrease over New Delhi in April, while a decrease of 20 % is observed over the whole Indo-Gangetic Plain.
For CO, reductions related to COVID-19 measures were much more difficult to identify. Although over northern China we see that the reductions in CO correlate with those for HCHO and CHOCHO, we could not find a similar effect for CO over New Delhi. The fact that it is so hard to draw conclusions for CO based on the TROPOMI data alone is due to the high variability in CO driven by meteorological conditions, in combination with the difficulty of distinguishing localized emission changes from the high and variable background values caused by the long atmospheric lifetime of CO.
TROPOMI data have already been used in many publications (Gkatzelis et al., 2021; Bauwens et al., 2020; Liu et al., 2020; Huang et al., 2020) aiming to analyze the impact of COVID-19 lockdown measures on air pollution levels. Predominantly, these studies have been based on the use of TROPOMI NO2 observations alone. We anticipate that the combined use of multiple trace gases from TROPOMI, together with the high spatial resolution of the measurements, has large potential for a significantly improved sector-specific analysis of the impact of the COVID-19 lockdown measures than was previously possible. Such a multi-species analysis offers promise for in-depth understanding of changes in air quality, the chemical interplay of pollutants in the atmosphere, and their relation to emissions. While keeping in mind the importance of accounting for interannual, seasonal, and meteorologically driven variability (e.g., Miyazaki et al., 2020), it is clear that a detailed analysis cannot be based on TROPOMI observations alone. For more quantitative estimates of the impact of COVID-19 lockdown measures on trace gas concentrations and emissions, we need (inverse) models driven by high-quality meteorological analyses or at least wind information or statistical relationships to account for weather-driven variability (Goldberg et al., 2020; Miyazaki et al., 2020; Ding et al., 2020).
In summary, our analyses using the most recent operational and scientific retrieval techniques have shown that by taking emission sources, atmospheric lifetime, and the seasonal and meteorological variability into account for a variety of trace gases measured by TROPOMI, rapid changes in anthropogenic emissions induced by the implementation of regional COVID-19 lockdown measures can be observed. It is our hope that this case study will serve as reference for future analyses aimed at characterizing emission changes of not just NO2 but for utilizing the concomitant observation of the variety of trace gases measured by TROPOMI.
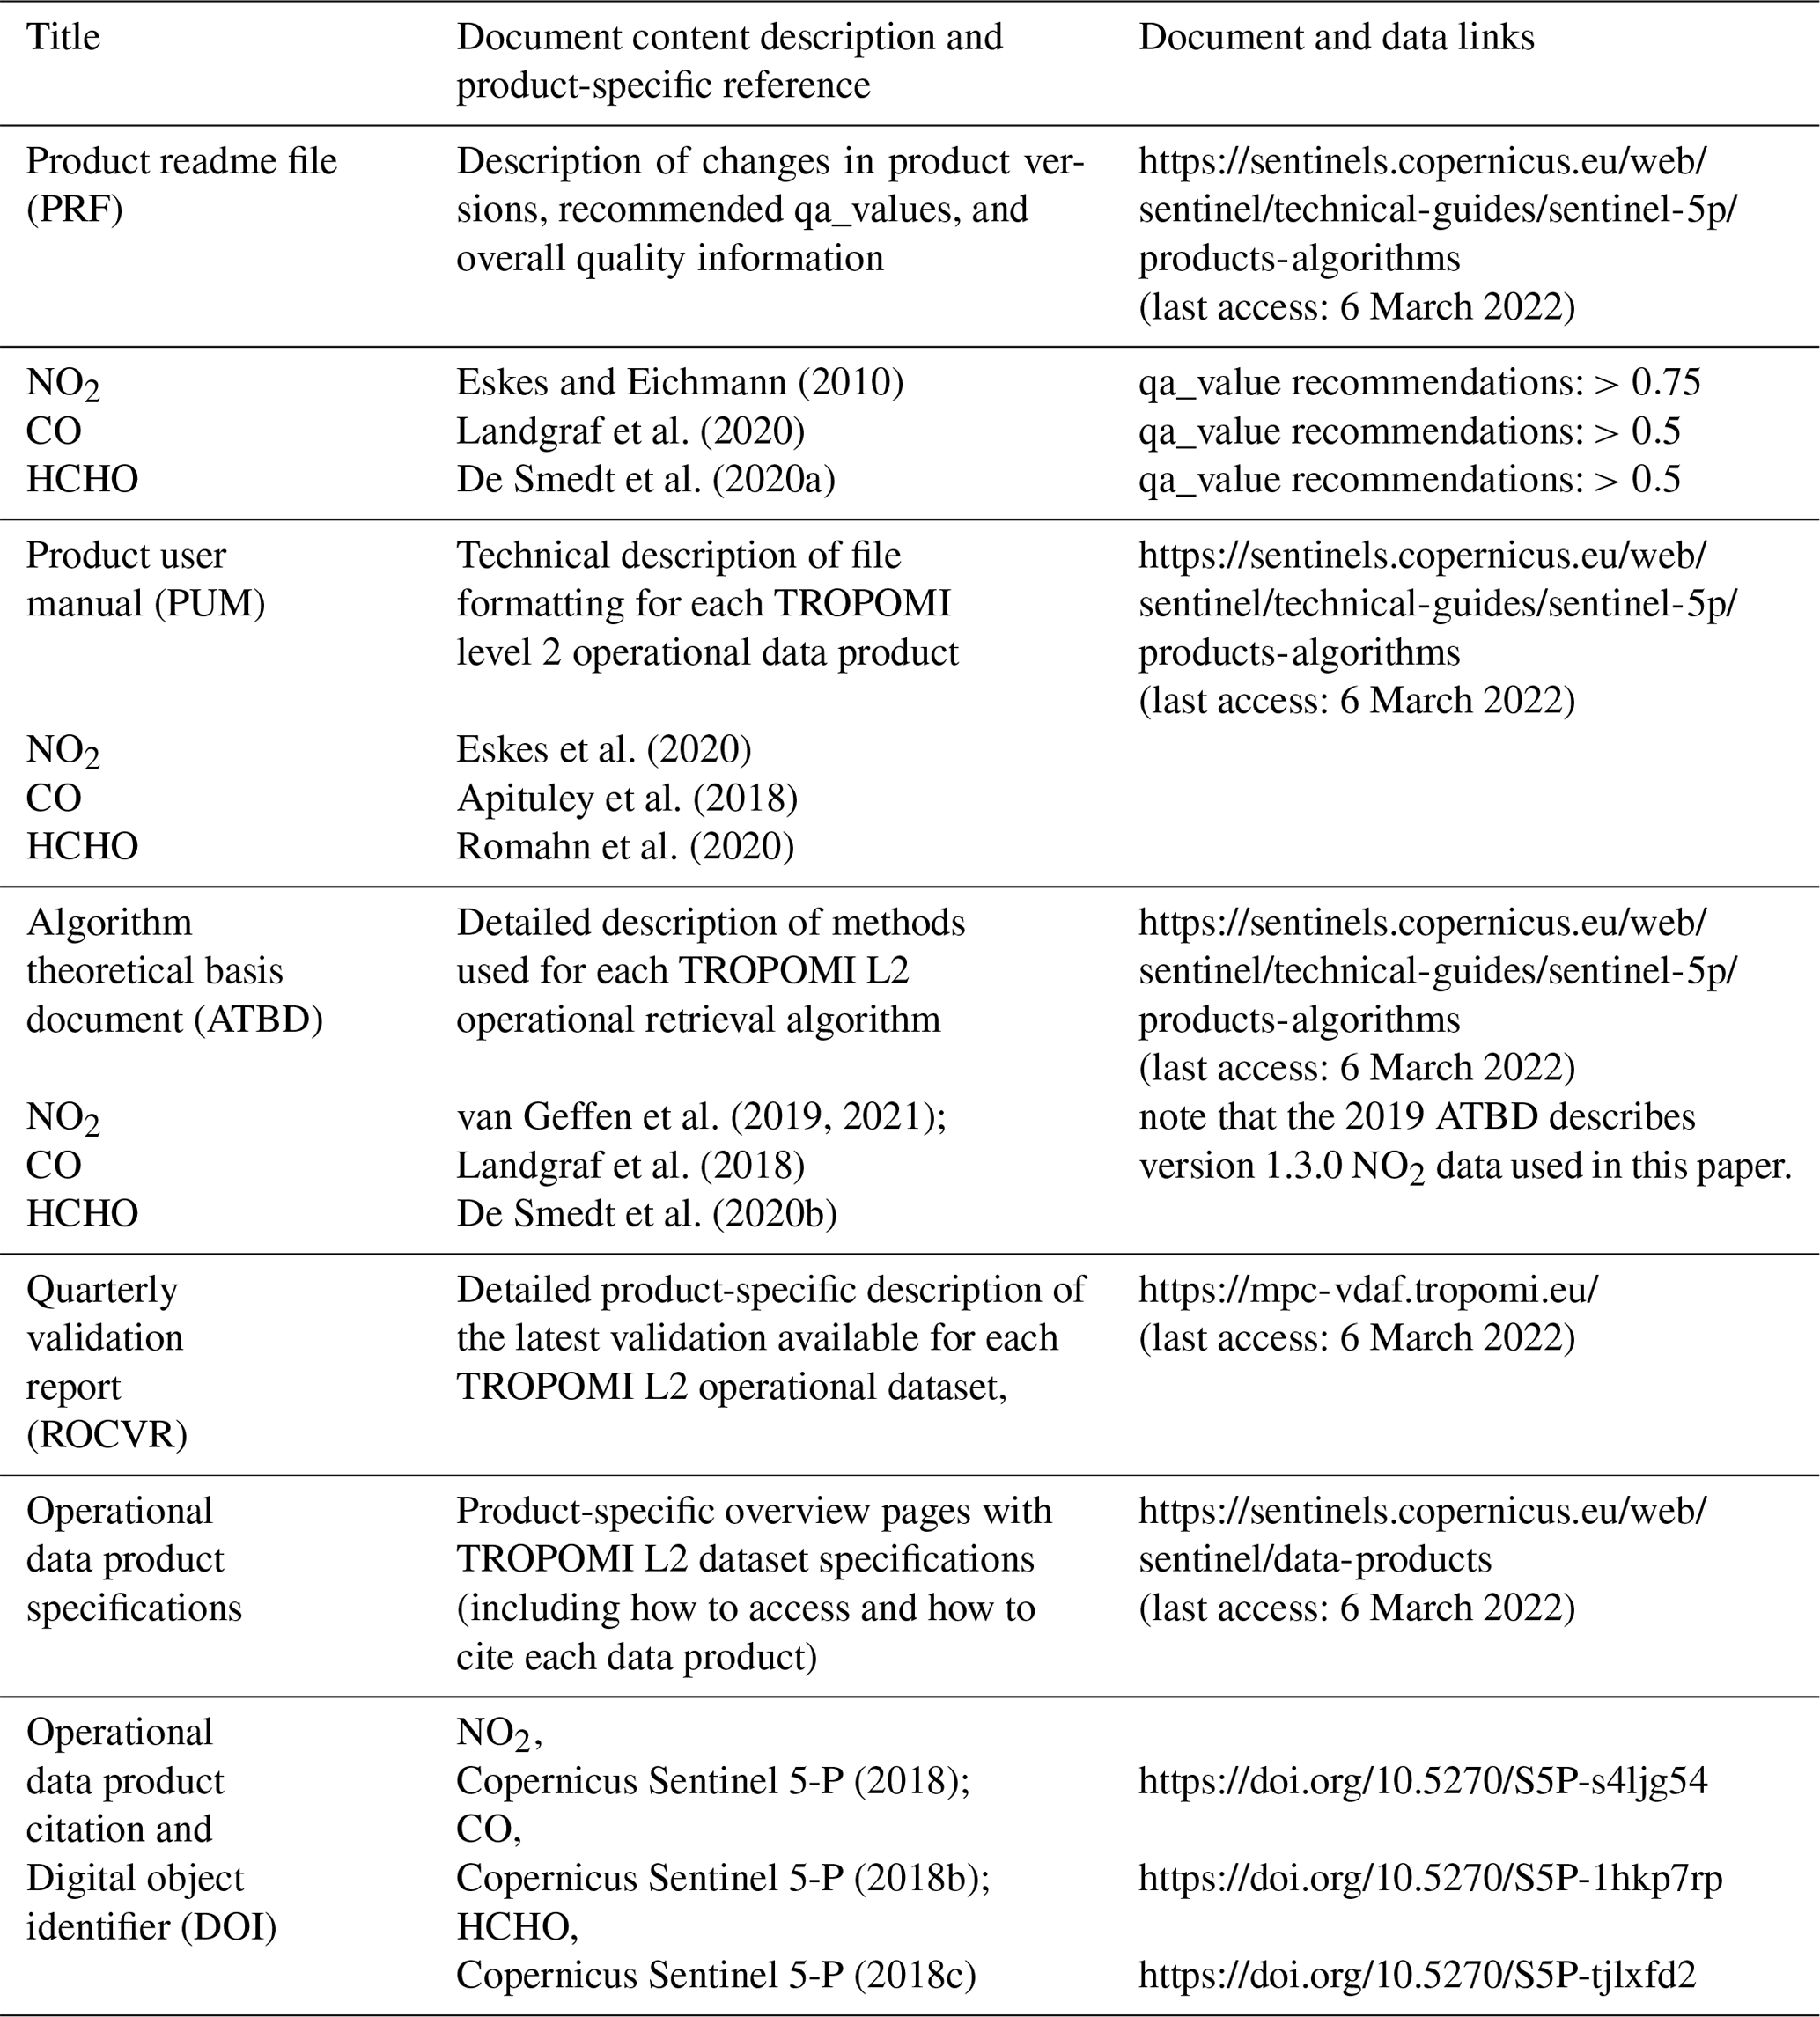
Table A1Summary of documentation available for TROPOMI operational data products from the Sentinel 5-P Library (https://sentinels.copernicus.eu/web/sentinel/technical-guides/sentinel-5p/products-algorithms, last access: 6 March 2022).
Appendix B contains additional information (Table B1) and a description supporting the timing of COVID-19-driven emissions changes for global cities evaluated in this study and shown in Fig. 2.
Table B1Details about the lockdown dates for the cities illustrated in Fig. 2.

B1 Detailed observations of NO2 reductions in major cities worldwide
Three examples of lockdown-related NO2 column reductions in major cities are shown for Santiago, Paris and New Delhi in Fig. 1 with time windows selected to reflect region-specific lockdown periods. A strong reduction in the NO2 tropospheric concentration of about 40 % is observed over Santiago. In Paris, the NO2 levels for the period 15 March to 15 April 2020 are about a factor of 2 lower than in March–April 2019 (see also Fig. 4). For New Delhi the reduction is even more striking in comparison to April 2019 (about a factor of 3, Fig. 2c). Both Paris and New Delhi also show significant reductions in background values around the cities. Background locations are subject to a variety of wind directions and are sometimes downwind of city plumes that influence background concentrations. Such plumes are typically on the order of 100 km long, and given the atmospheric residence time of NO2 (2–12 h), these plumes can fill the small domains around Paris and New Delhi shown in Fig. 1.
In Wuhan, the first city to issue quarantines and lockdown measures, the observed NO2 column drastically declined (−60 %) between 23 January and 8 April 2020 compared to the same period in 2019 (Fig. 2a, Table B1). This decrease is in good agreement with estimated reductions for the period 11 February to 2 March 2020 based on TROPOMI NO2 (−43 %, Bauwens et al., 2020) and in situ NO2 observations in Wuhan (−55 %, Shi and Brasseur, 2020). However, it should be noted that there was strong day-to-day variability in the NO2 column amount due to meteorological factors and missing data over Wuhan in February 2019 due to clouds. Model calculations by Liu et al. (2020) indicate that meteorological variability could have led to increased NO2 columns in 2020 compared to 2019, suggesting that the observed NO2 reductions underestimate the impact of emission reductions due to COVID-19. The partial lifting of the restrictions on 8 April led to a progressive increase in NO2 levels, but they remained lower than in 2019, likely because the population was still advised to stay at home and schools remained closed. A similar response in NO2 levels was observed in Beijing. The decreases were less pronounced (−40 %) and are in excellent agreement with the reported decrease based on in situ NO2 measurements (−40 %, Shi and Brasseur, 2020). The weaker response could be due to the less drastic measures adopted in Beijing because locally sustained COVID-19 cases were lower than in the Hubei province (Leung et al., 2020). Strong NO2 reductions were observed for other Chinese cities, like Nanjing, Qingdao, and Zhengzhou, based on TROPOMI NO2 observations (Bauwens et al., 2020).
India enforced strict restrictions on human activities on 24 March 2020 to tackle the spread of COVID-19. In New Delhi and Mumbai, the onset of the lockdown induced a sharp decline in the observed NO2 columns (by a factor of 2). The columns remained low during the entire lockdown period (−56 % and −46 %, respectively) (see Table 2 for timing of Indian lockdown phases). This is very much in line with the decreases reported in New Delhi based on NO2 data from monitoring stations, i.e., −53 % (Mahato et al., 2020) and −48 % (Jain and Sharma, 2020).
As compared to other cities, a very strong NO2 decrease was observed in Lima (−63 %), where strict regulations to stay indoors were enforced (Collyns, 2020). A drastic drop in NO2 compared to the 2019 levels marked the start of the lockdown, and the levels remained very low throughout the entire lockdown period. The gradual increase in NO2 columns in Lima and other Southern Hemisphere cities from January to May (Fig. 2j) reflects the natural seasonal variation when levels peak during the Southern Hemisphere winter as temperatures decrease and NO2 lifetime increases.
In Buenos Aires, the observed reduction was not as strong as that of Lima for the entire lockdown period (−34 %, Table B1) but was particularly marked during the first month of the lockdown (20 March through 20 April 2020) due to a compulsory quarantine period and the strict limitation of activities for many sectors. Although partial lifting of measures was issued after 10 April for many provinces in Argentina, the measures in the Buenos Aires agglomeration were maintained due to the elevated number of cases (Raszewski and Garrison, 2020). More moderate reductions are found for Mexico City (−22 %) and Santiago (−23 %) during the lockdown in comparison to the same period in 2019, which could be attributed to less strict adherence to and enforcement of lockdown measures (Uchoa, 2020; Pasley, 2020).
Strong reductions were observed over the entire lockdown period in the heavily hit cities in southwestern Europe, Los Angeles, and New York, with reductions ranging between −32 % and −54 % (Bauwens et al., 2020). It should be noted, however, that the start of the lockdown period is generally less marked in these regions, partly because the lockdowns were not as strictly enforced in Europe and the US as in China and India. Moreover, the observed TROPOMI data displays a strong variability attributable to meteorology, e.g., over Paris, New York, and Los Angeles in 2019.
In Sydney, the reduction was moderate (−14 %) and delayed with respect to the onset of the measures (Fig. 2g). This could be related to observations of less strict compliance in the early period of lockdown measures (New South Wales Public Health, 2020). A rapid and strong decrease was observed for NO2 column amount as a result of lockdown measures in Auckland, New Zealand (−55 %). Similarly, the lockdown measures in New Zealand were implemented swiftly with high levels of compliance (Matthews, 2020). The end of the lockdown coincided with a strong increase in NO2 pollution, from 1.8×10¹⁵ to 3×10¹⁵ molec. cm−2 in the last 3 weeks of May.
In Africa, Nigeria is among the countries most affected by COVID-19 and reported the first confirmed case in sub-Saharan Africa (Odunsi, 2020; Adigun and Anna, 2020). A 2-week lockdown period was put in place for Lagos starting 30 March 2020. The NO2 column amount decreased by 33 % during the lockdown with respect to the same period of 2019 and remained lower even after the lifting of restrictions on 4 May (Table B1). An NO2 column decrease of a similar magnitude (−35 %) was observed in Johannesburg (Fig. 2p), where a national lockdown was issued on 26 March 2020, with a gradual easing of restrictions starting 1 May. In sub-Saharan Africa, the emission reductions in April were significant for larger populous and industrialized areas, whereas no noticeable drop was found in less-developed regions (Masaki et al., 2020).
Finally, the Iraqi capital of Baghdad faced an initial lockdown from 22 March through 21 April. A second partial lockdown was issued starting 20 May in response to a sharp increase in COVID-19 cases due to the temporary relaxation of restrictions to allow the celebration of Ramadan in late April (Table B1). The NO2 column responded quickly (Fig. 2n) as confirmed by the rapid decrease once curfew measures were issues in late May.
Figures 3 and 4 illustrate the tropospheric column amount of NO2 over Europe, focusing on Milan, Madrid, Paris, and Berlin, extending the analysis to 1 December. In France, Spain, and Italy we detect strong reductions in NO2, which can be largely attributed to the lockdown measures. In Berlin, the measured differences are smaller, and a more detailed analysis of the meteorological variability is needed to quantify the impact of the lockdown (see Fig. 3). The extended time series shows a recovery of the NO2 pollution levels to pre-COVID-19 values. However, the recovery is not complete, suggesting that remaining restrictions, new stay-at-home life and working practices, and a downturn in industrial and service-based activities have contributed to a longer-lasting impact.
Appendix C contains figures that support the technical understanding of individual retrieval algorithms.
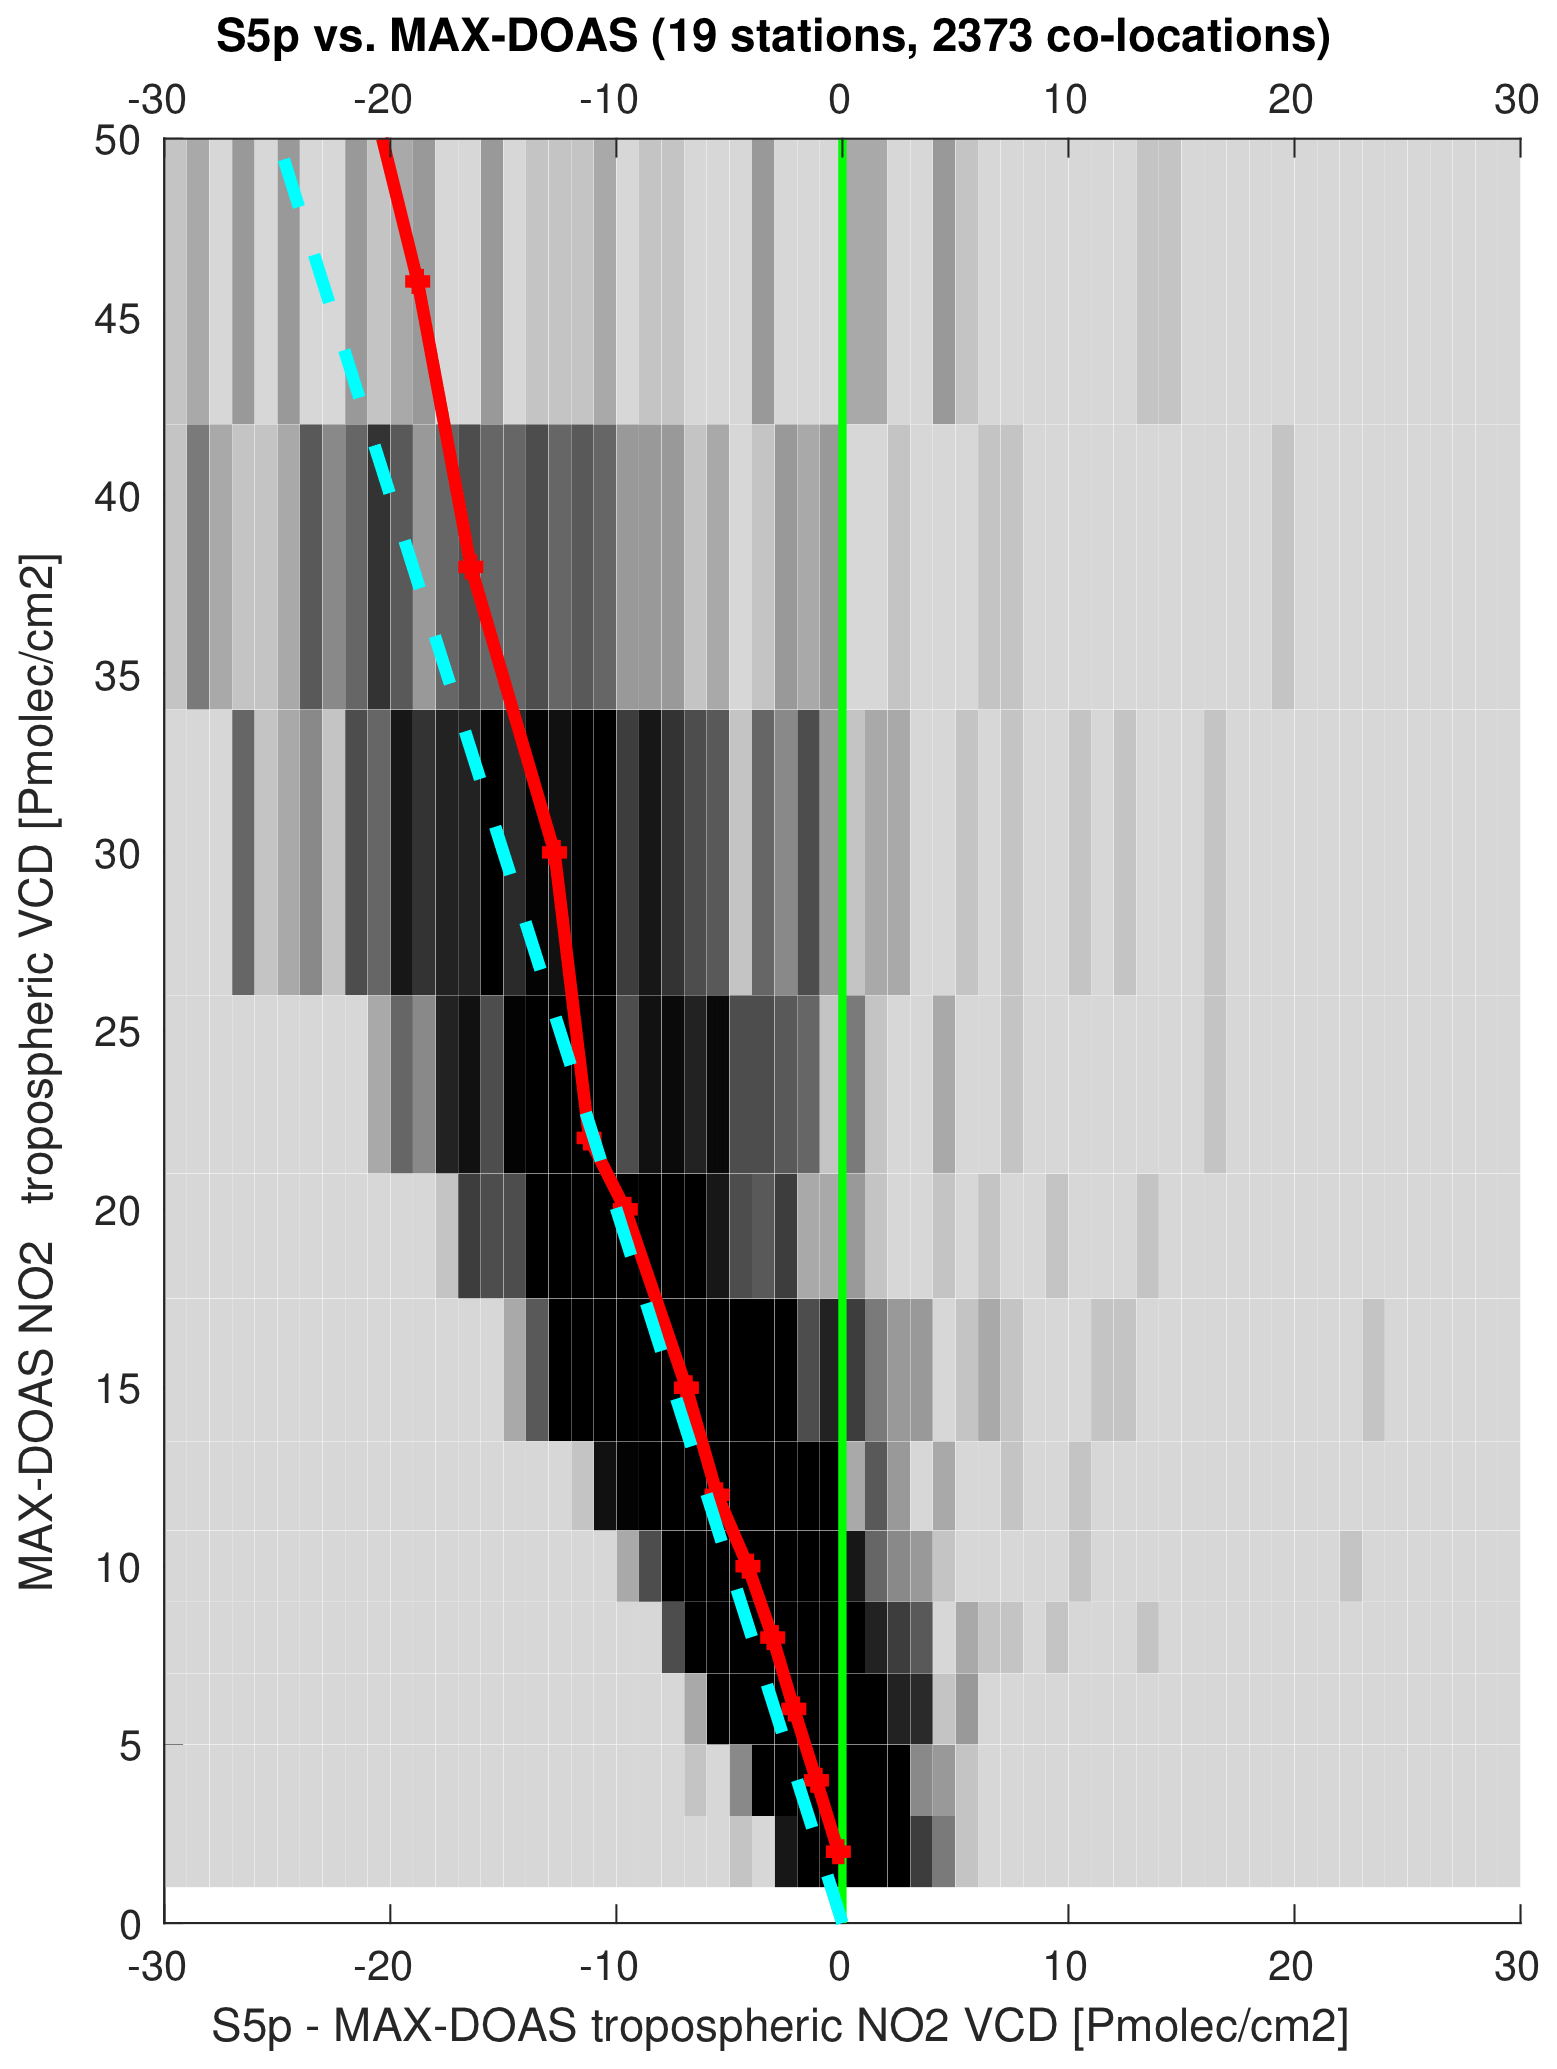
Figure C1Bias in S5p-TROPOMI tropospheric NO2 as estimated from comparisons to colocated ground-based MAX-DOAS measurements, presented as a function of the ground-based VCD measurement. The greyscale background represents a 2-D histogram, where the median difference per MAX-DOAS VCD bin is shown as the red curve, and the dashed blue line shows a multiplicative bias (b) model with VCD. More details on the ground-based data and colocation scheme can be found in Verhoelst et al. (2021).

Figure C2Monthly averaged TROPOMI SO2 columns over India for April 2019 from (a) the DOAS operational product and (b) the COBRA scientific product. The reduction in noise and offsets as described and illustrated in Theys et al. (2021) can also be seen here, where there is more contrast between the background and the individual point sources (power plants, darker pink and purple). This difference can be better discerned in the COBRA SO2 map.

Figure C3Example of temperature correction of the TROPOMI HCHO tropospheric columns in the Indo-Gangetic Plain region. The dashed line represents the HCHO columns after correction using climatological temperatures. The correlation between the local daily temperatures from ERA5-Land 2 m and the HCHO columns for the entire period is shown as an inset.
Appendix D contains additional figures that support the interpretation timing of observed changes in COVID-19-driven emissions related to power generation (Fig. D1) and meteorological conditions (Fig. D2).
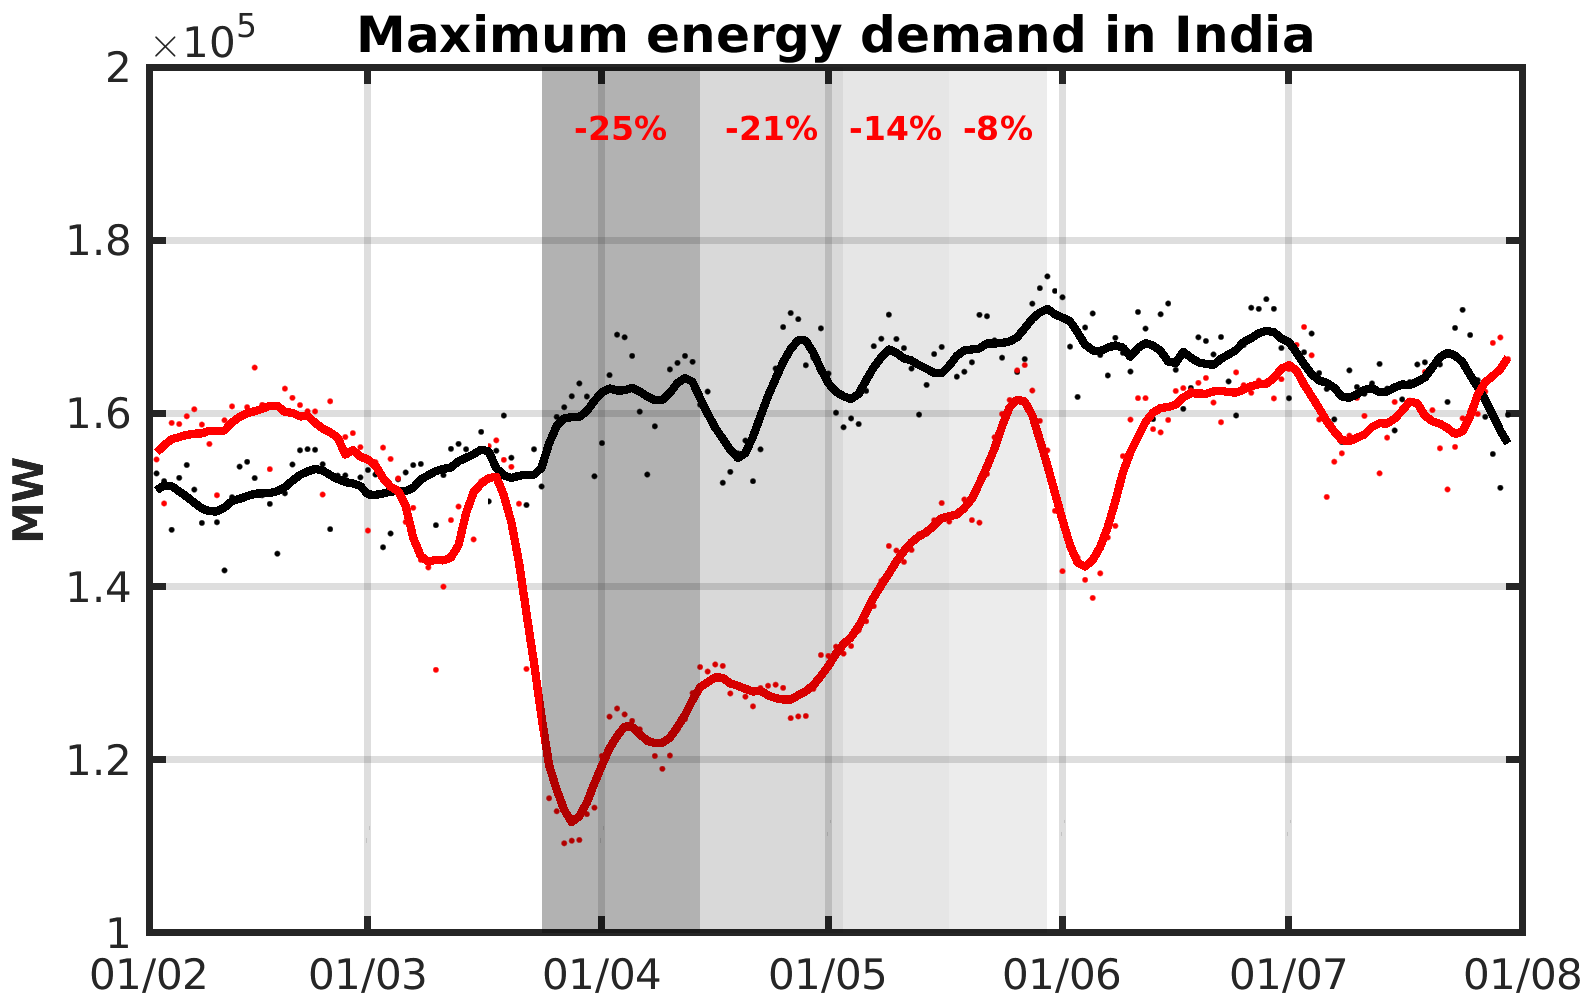
Figure D1Maximum energy demand over India during the period of the lockdown (red, lower line) compared to the same period in 2019 (black, upper line). The reductions in maximum energy demand are given relative to the same period in 2019 for each of the phases of the lockdown. Data are sourced from https://posoco.in/covid-19/ (last access: 6 March 2022).
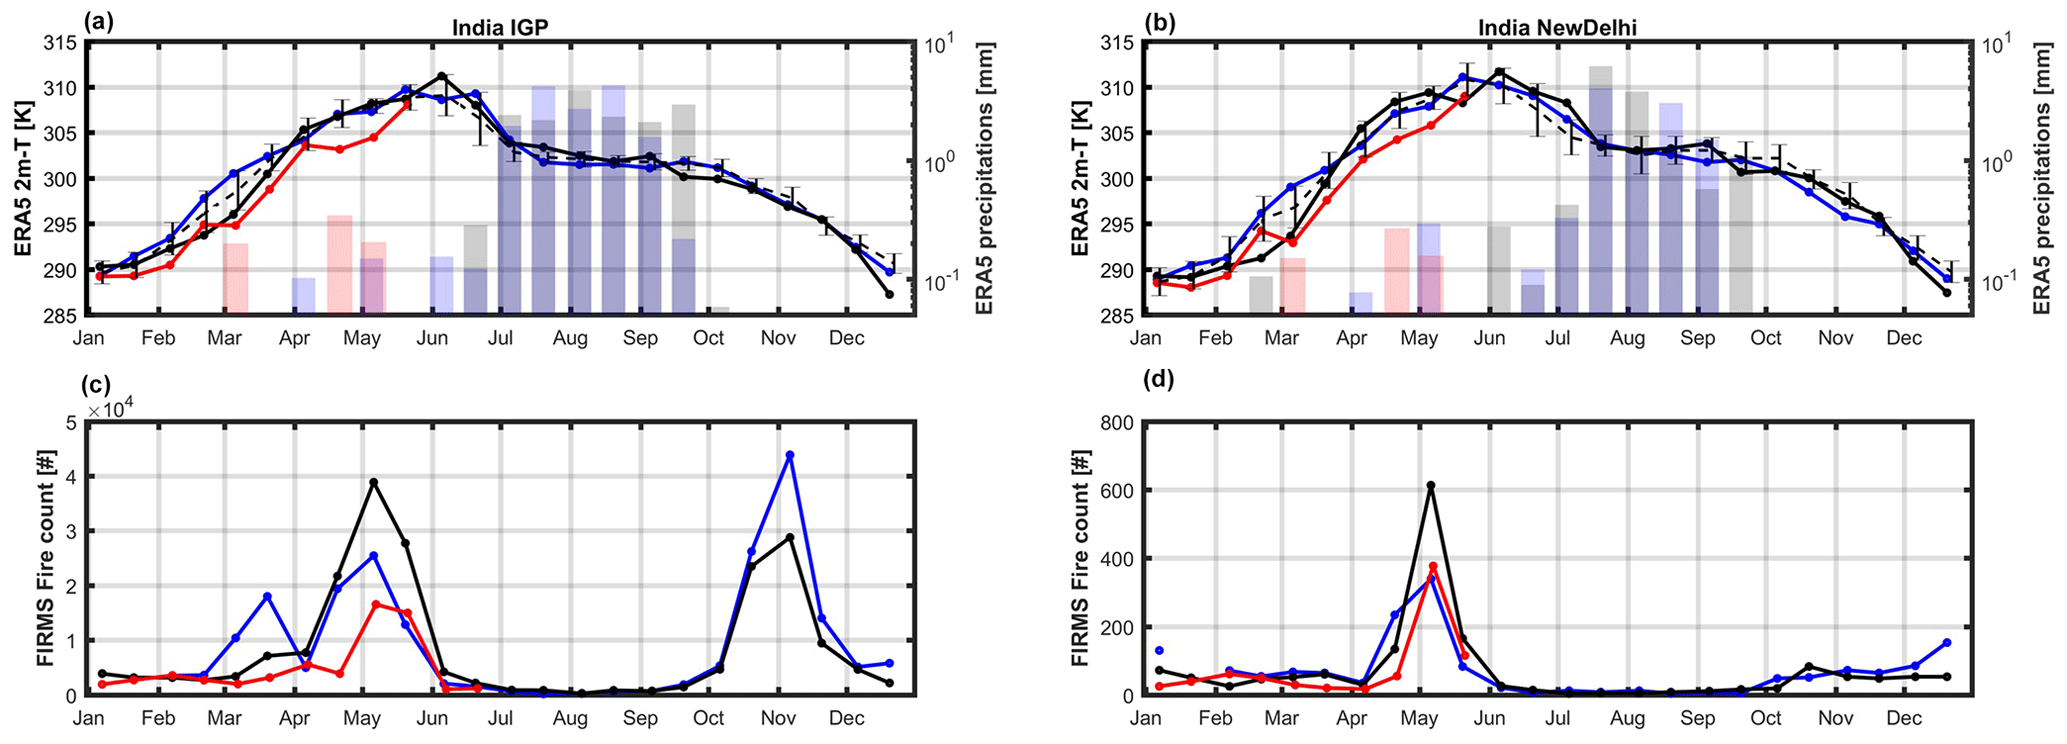
Figure D2Meteorological and fire count information for the same regions as shown in Fig. 9 (IGP plain, a, c; New Delhi, b, d). Near-surface temperature and precipitation diagrams (a, b) show the 2-week-averaged temperature at 2 m as lines and precipitation amounts as bars (source ERA5, Muñoz Sabater, 2019b). Panels (c) and (d) show fire counts (source FIRMS, https://earthdata.nasa.gov/firms, last access: 6 March 2022). The year 2020 is shown in red, 2019 is shown in black, and 2018 is shown in blue.
Operational versions of all Copernicus Sentinel 5-P TROPOMI data are freely available from the European Union/ESA/Copernicus Sentinel-5P Pre-Operations Data Hub (https://s5phub.copernicus.eu, Sentinel-5P Pre-Operations Data Hub, 2021; NO2: https://doi.org/10.5270/S5P-9bnp8q8, Copernicus Sentinel-5P (processed by ESA), 2021a; HCHO: https://doi.org/10.5270/S5P-vg1i7t0, Copernicus Sentinel-5P (processed by ESA), 2020; and CO: https://doi.org/10.5270/S5P-bj3nry0, Copernicus Sentinel-5P (processed by ESA), 2021b). The TROPOMI COBRA SO2 dataset is available on request as described in Theys et al. (2021). OMI HCHO and NO2 datasets are openly available at https://doi.org/10.18758/71021031 (De Smedt et al., 2017) and https://doi.org/10.21944/qa4ecv-no2-omi-v1.1 (Boersma et al., 2017). TROPOMI glyoxal data are available upon request as a part of the ESA S5p+I GLYRETRO project as detailed on the project website: https://doi.org/10.18758/71021069 (Lerot, 2021).
PFL conceptualized, initiated, and managed this paper with contributions from IA, MB, TB, IDS, HJE, CL, TS, DCSZ, NT, MVR, PV, and TV. Formal analysis was carried out by MB, TB, IDS, HE, CL, and NT. DGL and FR provided data curation and software support for TROPOMI HCHO data products. DCSZ prepared, edited, and co-managed the paper with contributions from IA, MB, TB, IDS, HJE, CL, PFL, TS, NT, MVR, JPV, and TV.
The contact author has declared that neither they nor their co-authors have any competing interests.
Publisher's note: Copernicus Publications remains neutral with regard to jurisdictional claims in published maps and institutional affiliations.
This paper contains modified Copernicus data (2018/2020) processed by KNMI, BIRA-IASB, DLR, and SRON.
This research has been supported by the ESA S5P MPC (grant no. 4000117151/16/I-LG), the Netherlands Space Office (TROPOMI Science Project grant), the ESA (S5p+Innovation GLYRETRO and ICOVAC projects (grant no. 4000127610/19/I-NS)), Belgium Prodex TRACE-S5P (grant no. PEA 4000105598) and TROVA-2 (grant no. PEA 4000130630), Belgium BRAIN-2.be LEGO-BEL-AQ grant, and the EU FP7 QA4ECV project (grant no. 607405).
This paper was edited by Qiang Zhang and reviewed by two anonymous referees.
Adigun, B. and Anna, C.: Nigeria confirms 1st case of new virus in sub-Saharan Africa, AP News, https://apnews.com/article/5de56b2fcaffae583c7c57b82c1a4fff (last access: 30 March 2021), 2020.
Aljazeera: Coronavirus in India: What we know about world's largest lockdown, https://www.aljazeera.com/news/2020/05/india-coronavirus-crisis-200519120521747.html, last access: 17 June 2020a.
Aljazeera: Peru extends nationwide lockdown until end of June, https://www.aljazeera.com/news/2020/05/peru-extends-nationwide-lockdown-june-200523073017946.html, last access: 17 June 2020b.
Aljazeera: South Africa coronavirus lockdown to ease from June 1, https://www.aljazeera.com/news/2020/05/ramaphosa-south-africa, last access: 17 June 2020c.
Aloi, A., Alonso, B., Benavente, J., Cordera, R., Echániz, E., González, F., Ladisa, C., Lezama-Romanelli, R., López-Parra, Á., Mazzei, V., Perrucci, L., Prieto-Quintana, D., Rodríguez, A., and Sañudo, R.: Effects of the COVID-19 Lockdown on Urban Mobility: Empirical Evidence from the City of Santander (Spain), Sustainability, 12, 3870, https://doi.org/10.3390/su12093870, 2020.
Alvarado, L., Richter, A., and Lerot, C.: GLYoxal Retrievals from TROPOMI (GLYRETRO) Validation Report, S5p+Innovation – theme 1 (CHOCHO), 5p+I_CHOCHO_BIRA_VR, 1.1, 35 pp., https://glyretro.aeronomie.be/ (last access: 6 March 2022), 2020.
Apituley, A., Pedergnana, M., Sneep, M., Veefkind, J. P., Loyola, D., Landgraf, J., and Borsdorff, T.: Sentinel-5 precursor/TROPOMI Level 2 Product User Manual Carbon Monoxide, SRON-S5P-LEV2-MA-002, 1.0.0, SRON Netherlands Institute for Space Research, Utrecht, The Netherlands, https://sentinels.copernicus.eu/web/sentinel/technical-guides/sentinel-5p/products-algorithms (last access: 6 March 2022), 2018.
Associated Press: Mexico City will begin gradually reopening June 1, mayor says, https://www.latimes.com/world-nation/story/2020-05-21/mexico-city-will-begin-gradual-reopening-coronavirus-june-1, last access: 17 June 2020.
Baldasano, J. M.: COVID-19 lockdown effects on air quality by NO2 in the cities of Barcelona and Madrid (Spain), Sci. Total Environ., 741, 140353, https://doi.org/10.1016/j.scitotenv.2020.140353, 2020.
Barré, J., Petetin, H., Colette, A., Guevara, M., Peuch, V.-H., Rouil, L., Engelen, R., Inness, A., Flemming, J., Pérez García-Pando, C., Bowdalo, D., Meleux, F., Geels, C., Christensen, J. H., Gauss, M., Benedictow, A., Tsyro, S., Friese, E., Struzewska, J., Kaminski, J. W., Douros, J., Timmermans, R., Robertson, L., Adani, M., Jorba, O., Joly, M., and Kouznetsov, R.: Estimating lockdown-induced European NO2 changes using satellite and surface observations and air quality models, Atmos. Chem. Phys., 21, 7373–7394, https://doi.org/10.5194/acp-21-7373-2021, 2021.
Bauwens, M., Stavrakou, T., Müller, J.-F., De Smedt, I., Van Roozendael, M., van der Werf, G. R., Wiedinmyer, C., Kaiser, J. W., Sindelarova, K., and Guenther, A.: Nine years of global hydrocarbon emissions based on source inversion of OMI formaldehyde observations, Atmos. Chem. Phys., 16, 10133–10158, https://doi.org/10.5194/acp-16-10133-2016, 2016.
Bauwens, M. Compernolle, S., Stavrakou, T., Müller, J.-F., van Gent, J., Eskes, H., Levelt, P. F., van der A, R., Veefkind, J. P., Vlietinck, J., Yu, H., and Zehner, C.: Impact of coronavirus outbreak on NO2 pollution assessed using TROPOMI and OMI observations, Geophys. Res. Lett., 47, e2020GL087978, https://doi.org/10.1029/2020GL087978, 2020.
BBC: India extends coronavirus lockdown by two weeks, https://www.bbc.com/news/world-asia-india-52698828, last access: 17 June 2020a.
BBC: Earlier coronavirus lockdown “could have saved 36,000 lives”, https://www.bbc.com/news/world-us-canada-52757150, last access: 17 June 2020b.
Beirle, S., Borger, C., Dörner, S., Li, A., Hu, Z., Liu, F., Wang, Y., and Wagner, T.: Pinpointing nitrogen oxide emissions from space, Sci. Adv. 5, eaax9800, https://doi.org/10.1126/sciadv.aax9800, 2019.
Beirle, S., Borger, C., Dörner, S., Eskes, H., Kumar, V., de Laat, A., and Wagner, T.: Catalog of NOx emissions from point sources as derived from the divergence of the NO2 flux for TROPOMI, Earth Syst. Sci. Data, 13, 2995–3012, https://doi.org/10.5194/essd-13-2995-2021, 2021.
Bloomberg News: China to lift lockdown over virus epicenter Wuhan on April 8, https://www.bloomberg.com/news/articles/2020-03-24/china-to-lift-lockdown, last access: 1 July 2020.
Boersma, K. F., Eskes, H., Richter, A., De Smedt, I., Lorente, A., Beirle, S., Van Geffen, J., Peters, E., Van Roozendael, M. and Wagner, T.: QA4ECV NO2 tropospheric and stratospheric vertical column data from OMI (Version 1.1), Royal Netherlands Meteorological Institute (KNMI) [data set], https://doi.org/10.21944/qa4ecv-no2-omi-v1.1, 2017.
Boersma, K. F., Eskes, H. J., Richter, A., De Smedt, I., Lorente, A., Beirle, S., van Geffen, J. H. G. M., Zara, M., Peters, E., Van Roozendael, M., Wagner, T., Maasakkers, J. D., van der A, R. J., Nightingale, J., De Rudder, A., Irie, H., Pinardi, G., Lambert, J.-C., and Compernolle, S. C.: Improving algorithms and uncertainty estimates for satellite NO2 retrievals: results from the quality assurance for the essential climate variables (QA4ECV) project, Atmos. Meas. Tech., 11, 6651–6678, https://doi.org/10.5194/amt-11-6651-2018, 2018.
Borsdorff, T., Hasekamp, O. P., Wassmann, A., and Landgraf, J.: Insights into Tikhonov regularization: application to trace gas column retrieval and the efficient calculation of total column averaging kernels, Atmos. Meas. Tech., 7, 523–535, https://doi.org/10.5194/amt-7-523-2014, 2014.
Borsdorff, T., Tol, P., Williams, J. E., de Laat, J., aan de Brugh, J., Nédélec, P., Aben, I., and Landgraf, J.: Carbon monoxide total columns from SCIAMACHY 2.3 µm atmospheric reflectance measurements: towards a full-mission data product (2003–2012), Atmos. Meas. Tech., 9, 227–248, https://doi.org/10.5194/amt-9-227-2016, 2016.
Borsdorff, T., aan de Brugh, J., Hu, H., Nédélec, P., Aben, I., and Landgraf, J.: Carbon monoxide column retrieval for clear-sky and cloudy atmospheres: a full-mission data set from SCIAMACHY 2.3 µm reflectance measurements, Atmos. Meas. Tech., 10, 1769–1782, https://doi.org/10.5194/amt-10-1769-2017, 2017.
Borsdorff, T., aan de Brugh, J., Hu, H., Hasekamp, O., Sussmann, R., Rettinger, M., Hase, F., Gross, J., Schneider, M., Garcia, O., Stremme, W., Grutter, M., Feist, D. G., Arnold, S. G., De Mazière, M., Kumar Sha, M., Pollard, D. F., Kiel, M., Roehl, C., Wennberg, P. O., Toon, G. C., and Landgraf, J.: Mapping carbon monoxide pollution from space down to city scales with daily global coverage, Atmos. Meas. Tech., 11, 5507–5518, https://doi.org/10.5194/amt-11-5507-2018, 2018.
Borsdorff, T., aan de Brugh, J., Pandey, S., Hasekamp, O., Aben, I., Houweling, S., and Landgraf, J.: Carbon monoxide air pollution on sub-city scales and along arterial roads detected by the Tropospheric Monitoring Instrument, Atmos. Chem. Phys., 19, 3579–3588, https://doi.org/10.5194/acp-19-3579-2019, 2019.
Borsdorff, T., García Reynoso, A., Maldonado, G., Mar-Morales, B., Stremme, W., Grutter, M., and Landgraf, J.: Monitoring CO emissions of the metropolis Mexico City using TROPOMI CO observations, Atmos. Chem. Phys., 20, 15761–15774, https://doi.org/10.5194/acp-20-15761-2020, 2020.
Bovensmann, H., Burrows, J. P., Buchwitz, M., Frerick, J., Noel, S., Rozanov, V. V., Chance, L.V., and Goede, A. P. H.: SCIAMACHY: Mission objectives and measurement modes, Atmos. Sci., 56, 127–150, 1999.
Braaten, J.: Monitoring air quality with S5P TROPOMI data, Medium, https://medium.com/google-earth/monitoring-air-quality-with-s5p-tropomi-data-4f6b0aebe1c0 (last access: 20 June 2021), 2020.
Broomandi, P., Karaca, F., Nikfal, A., Jahanbakhshi, A., Tamjidi, M., and Kim, J. R.: Impact of COVID-19 Event on the Air Quality in Iran, Aerosol Air Qual. Res., 20, 1793–1804, https://doi.org/10.4209/aaqr.2020.05.0205, 2020.
Calonzo, A. and Jiao C.: Duterte expands Philippine lockdown to 60 million people, https://www.bloomberg.com/news/articles/2020-03-16/duterte-widens-lockdown, last access: 17 June 2020a.
Cao, H., Fu, T.-M., Zhang, L., Henze, D. K., Miller, C. C., Lerot, C., Abad, G. G., De Smedt, I., Zhang, Q., van Roozendael, M., Hendrick, F., Chance, K., Li, J., Zheng, J., and Zhao, Y.: Adjoint inversion of Chinese non-methane volatile organic compound emissions using space-based observations of formaldehyde and glyoxal, Atmos. Chem. Phys., 18, 15017–15046, https://doi.org/10.5194/acp-18-15017-2018, 2018.
CBS News: Lockdown extended for most of coronavirus-battered New York, https://www.cbsnews.com/news/new-york-stay-at-home-extended-coronavirus-lockdown/, last access: 17 June 2020.
CGTN: Sao Paulo extends the quarantine through May, https://newsus.cgtn.com/news/2020-05-10/Sao-Paulo-extends-quarantine-through-May-QmDnOJo6bK/index.html, last access: 1 July 2020.
Chan Miller, C., Jacob, D. J., González Abad, G., and Chance, K.: Hotspot of glyoxal over the Pearl River delta seen from the OMI satellite instrument: implications for emissions of aromatic hydrocarbons, Atmos. Chem. Phys., 16, 4631–4639, https://doi.org/10.5194/acp-16-4631-2016, 2016.
Chandra, K. K. and Kumar Bhardwaj, A.: Incidence of forest fire in India and its effect on terrestrial ecosystem dynamics, nutrient and microbial status of soil, Int. J. Agric. For., 5, 69–78, 2015.
Chang, Y., Huang, R.J., Ge, X., Huang, X., Hu, J., Duan, Y., Zou, Z., Liu, X., and Lehmann, M. F.: Puzzling haze events in China during the coronavirus (COVID-19) shutdown, Geophys. Res. Lett., 47, e2020GL088533, https://doi.org/10.1029/2020GL088533, 2020.
Clark, H., Bennouna, Y., Tsivlidou, M., Wolff, P., Sauvage, B., Barret, B., Le Flochmoën, E., Blot, R., Boulanger, D., Cousin, J.-M., Nédélec, P., Petzold, A., and Thouret, V.: The effects of the COVID-19 lockdowns on the composition of the troposphere as seen by In-service Aircraft for a Global Observing System (IAGOS) at Frankfurt, Atmos. Chem. Phys., 21, 16237–16256, https://doi.org/10.5194/acp-21-16237-2021, 2021.
Collivignarelli, M. C., Abba, A., Bertanza, G., Pedrazzani, R., Ricciardi, P., and Miino, M. C.: Lockdown for Covid-2019 in Milan: What are the effects on air quality?, Sci. Total Environ., 732, 139280, https://doi.org/10.1016/j.scitotenv.2020.139280, 2020.
Collyns, D.: Peru's coronavirus response was `right on time' – so why isn't it working?, The Guardian, https://www.theguardian.com/global-development/2020/may/20/peru-coronavirus-lockdown-new-cases, last access: 17 June 2020.
Conforti K.: Alert Level 2 restrictions to begin in New Zealand this week, https://www.forbes.com/sites/kaeliconforti/2020/05/13/alert-level-2-restrictions-to-begin-in-new-zealand-this-week/#52517b326497, last access: 17 June 2020.
Copernicus Sentinel-5P (processed by ESA): TROPOMI Level 2 Nitrogen Dioxide total column products, Version 01, European Space Agency, https://doi.org/10.5270/S5P-s4ljg54, 2018a.
Copernicus Sentinel-5P (processed by ESA): TROPOMI Level 2 Carbon Monoxide total column products, Version 01, European Space Agency, https://doi.org/10.5270/S5P-1hkp7rp, 2018b.
Copernicus Sentinel-5P (processed by ESA): TROPOMI Level 2 Formaldehyde Total Column products, Version 01, European Space Agency, https://doi.org/10.5270/S5P-tjlxfd2, 2018c.
Copernicus Sentinel-5P (processed by ESA): TROPOMI Level 2 Formaldehyde Total Column products. Version 02, European Space Agency [data set], https://doi.org/10.5270/S5P-vg1i7t0, 2020.
Copernicus Sentinel-5P (processed by ESA): TROPOMI Level 2 Nitrogen Dioxide total column products. Version 02, European Space Agency [data set], https://doi.org/10.5270/S5P-9bnp8q8, 2021a.
Copernicus Sentinel-5P (processed by ESA): TROPOMI Level 2 Carbon Monoxide total column products. Version 02, European Space Agency [data set] https://doi.org/10.5270/S5P-bj3nry0, 2021b.
Dattakiran, J.: Impact of lockdown on India's electricity sector, EnergyA, http://www.energy-a.eu/impact-of-ongoing-lockdown-on-indias, last access: 9 June 2020.
De Smedt, I., Yu, H., Richter, A., Beirle, S., Eskes, H., Boersma, K. F., Van Roozendael, M., Van Geffen, J., Lorente, A., and Peters, E.: QA4ECV HCHO tropospheric column data from OMI (Version 1.1), Royal Belgian Institute for Space Aeronomy [data set], https://doi.org/10.18758/71021031, 2017.
De Smedt, I., Theys, N., Yu, H., Danckaert, T., Lerot, C., Compernolle, S., Van Roozendael, M., Richter, A., Hilboll, A., Peters, E., Pedergnana, M., Loyola, D., Beirle, S., Wagner, T., Eskes, H., van Geffen, J., Boersma, K. F., and Veefkind, P.: Algorithm theoretical baseline for formaldehyde retrievals from S5P TROPOMI and from the QA4ECV project, Atmos. Meas. Tech., 11, 2395–2426, https://doi.org/10.5194/amt-11-2395-2018, 2018.
De Smedt, I., Romahn, F., and Eichmann, K.-U.: S5P Mission Performance Centre Formaldehyde [L2__HCHO___] Readme, S5P-MPC-BIRA-PRF-HCHO, 2.1, BIRA-IASB Royal Belgian Institute for Space Aeronomy, Brussels, Belgium, https://sentinels.copernicus.eu/web/sentinel/technical-guides/sentinel-5p/products-algorithms (last access: 6 March 2022), 2020a.
De Smedt, I., Theys, N., Yu, H., Vlietinck, J., Lerot, C., and Van Roozendael, M.: S5P/TROPOMI HCHO ATBD, S5P-BIRA-L2-400F-ATBD, 2.2.0, BIRA-IASB Royal Belgian Institute for Space Aeronomy, Brussels, Belgium, https://sentinels.copernicus.eu/web/sentinel/technical-guides/sentinel-5p/products-algorithms (last access: 6 March 2022), 2020b.
Diamond, M. S. and Wood, R.: Limited regional aerosol and cloud microphysical changes despite unprecedented decline in nitrogen oxide pollution during the February 2020 COVID-19 shutdown in China, Geophys. Res. Lett., 47, e2020GL088913, https://doi.org/10.1029/2020GL088913, 2020.
Dimitropoulou, E., Hendrick, F., Pinardi, G., Friedrich, M. M., Merlaud, A., Tack, F., De Longueville, H., Fayt, C., Hermans, C., Laffineur, Q., Fierens, F., and Van Roozendael, M.: Validation of TROPOMI tropospheric NO2 columns using dual-scan multi-axis differential optical absorption spectroscopy (MAX-DOAS) measurements in Uccle, Brussels, Atmos. Meas. Tech., 13, 5165–5191, https://doi.org/10.5194/amt-13-5165-2020, 2020.
Ding, J., van der A, R. J., Eskes, H. J., Mijling, B., Stavrakou, T., van Geffen, J. H. G. M., and Veefkind, J. P.: NOx emissions reduction and rebound in China due to the COVID-19 crisis, Geophys. Res. Lett., 46, e2020GL089912, doi.org:10.1029/2020GL089912, 2020.
Do Rosario, J., Gillespie P.: Argentina orders `exceptional' Lockdown in bid to stem virus, https://www.bloomberg.com/news/articles/2020-03-20/argentina-orders-exceptional-lockdown-in-bid-to-contain-virus, last access: 17 June 2020.
Eskes, H. J. and Boersma, K. F.: Averaging kernels for DOAS total-column satellite retrievals, Atmos. Chem. Phys., 3, 1285–1291, https://doi.org/10.5194/acp-3-1285-2003, 2003.
Eskes, H. J., and Eichmann, K.-U.: S5P Mission Performance Centre Nitrogen Dioxide [L2__NO2___] Readme, S5P-MPC-KNMI-PRF-NO2, 1.6, Royal Netherlands Meteorological Institute, De Bilt, The Netherlands, https://sentinels.copernicus.eu/web/sentinel/technical-guides/sentinel-5p/products-algorithms (last access: 6 March 2022), 2020.
Eskes, H., van Geffen, J., Boersma, K. F., Eichmann, K.-U., Apituley, A., Pedergnana, M., Sneep, M., Veefkind, J. P., and Loyola, D.: Sentinel-5 precursor/TROPOMI Level 2 Product User Manual Nitrogendioxide, S5P-KNMI-L2-0021-MA, 4.0.0, Royal Netherlands Meteorological Institute, De Bilt, The Netherlands, https://sentinels.copernicus.eu/web/sentinel/technical-guides/sentinel-5p/products-algorithms (last access: 6 March 2022), 2020.
Fioletov, V., McLinden, C. A., Griffin, D., Theys, N., Loyola, D. G., Hedelt, P., Krotkov, N. A., and Li, C.: Anthropogenic and volcanic point source SO2 emissions derived from TROPOMI on board Sentinel-5 Precursor: first results, Atmos. Chem. Phys., 20, 5591–5607, https://doi.org/10.5194/acp-20-5591-2020, 2020.
Fioletov, V. E., McLinden, C. A., Krotkov, N., Li, C., Joiner, J., Theys, N., Carn, S., and Moran, M. D.: A global catalogue of large SO2 sources and emissions derived from the Ozone Monitoring Instrument, Atmos. Chem. Phys., 16, 11497–11519, https://doi.org/10.5194/acp-16-11497-2016, 2016.
Forster, P. M., Forster, H. I., Evans, M. J., Gidden, M. J., Jones, C. D., Keller, C. A., Lamboll, R. D., Le Quéré, C., Rogelj, J., Rosen, D., Schleussner, C.-F., Richardson, T. B., Smith C. J., and Turnock, S. T.: Current and future global climate impacts resulting from COVID-19, Nat. Clim. Chang., 10, 913–919, https://doi.org/10.1038/s41558-020-0883-0, 2020.
Fu, T.-M., Jacob, D. J., Wittrock, F., Burrows, J. P., Vrekoussis, M., and Henze, D. K.: Global budgets of atmospheric glyoxal and methylglyoxal, and implications for formation of secondary organic aerosols, J. Geophys. Res., 113, D15303, https://doi.org/10.1029/2007JD009505, 2008.
Gkatzelis, G. I., Gilman, J. B., Brown, S. S., Eskes, H., Gomes, A. R., Lange, A. C., McDonald, B. C., Peischl, J., Petzold, A., Thompson, C. R., and Kiendler-Scharr, A.: The Global Impacts of COVID-19 Lockdowns on Urban Air Quality: A Critical Review and Recommendations, Elem. Sci. Anth., 9, 00176, https://doi.org/10.1525/elementa.2021.00176, 2021.
Goldberg, D. L., Lu, Z., Streets, D. G., de Foy, B., Griffin, D., McLinden, C. A., Lamsal, L. N., Nickolay A. Krotkov, N. A., and Eskes, H.: Enhanced Capabilities of TROPOMI NO2: Estimating NOx from North American Cities and Power Plants, Environ. Sci. Technol., 53, 12594–12601, https://doi.org/10.1021/acs.est.9b04488, 2019.
Goldberg, D. L., Anenberg, S. C., Griffin, D., McLinden, C. A., Lu, Z., and Streets, D. G.: Disentangling the impact of the COVID-19 lockdowns on urban NO2 from natural variability, Geophys. Res. Lett., 47, e2020GL089269, https://doi.org/10.1029/2020GL089269, 2020.
Goodman, A.: De Moura H., and Rebaza C. After 7 weeks of lockdown, Spaniards can finally exercise outdoors – as death toll passes 25,000, https://edition.cnn.com/2020/05/02/europe/spain-lockdown-coronavirus-exercise-intl/index.html, last access: 17 June 2020.
Granier, C., Darras, S., Denier van der Gon, H., Doubalova, J., Elguindi, N., Galle, B., Gauss, M., Guevara, M., Jalkanen, J.-P., Kuenen, J., Liousse, C., Quack, B., Simpson, D., and Sindelarova, K.: The Copernicus Atmosphere Monitoring Service global and regional emissions (April 2019 version), Copernicus Atmosphere Monitoring Service (CAMS) Report, Laboratoire d'Aérologie, Toulouse, France, 54 pp., https://doi.org/10.24380/d0bn-kx16, 2019.
Griffin, D., Mclinden, C., Racine, J., Moran, M., Fioletov, V., Pavlovic, R., Mashayekhi, R. Zhao, X., and Eskes, H.: Assessing the Impact of Corona-Virus-19 on Nitrogen Dioxide Levels over Southern Ontario, Canada, Remote Sens., 12, 4112, https://doi.org/10.3390/rs12244112, 2020.
Guevara, M., Jorba, O., Soret, A., Petetin, H., Bowdalo, D., Serradell, K., Tena, C., Denier van der Gon, H., Kuenen, J., Peuch, V.-H., and Pérez García-Pando, C.: Time-resolved emission reductions for atmospheric chemistry modelling in Europe during the COVID-19 lockdowns, Atmos. Chem. Phys., 21, 773–797, https://doi.org/10.5194/acp-21-773-2021, 2021.
Holloway, T., Levy, H., and Kasibhatla, P.: Global distribution of carbon monoxide, J. Geophys. Res., 105, 12123–12147, https://doi.org/10.1029/1999JD901173, 2000.
Horowitz, J.: Italy Locks Down Much of the Country's North Over the Coronavirus, https://www.nytimes.com/2020/03/07/world/europe/coronavirus-italy.html, last access: 17 June 2020a.
Horowitz, J.: Hope and Worry Mingle as Countries Relax Coronavirus Lockdowns, https://www.nytimes.com/2020/05/04/world/europe/coronavirus-restrictions.html, last access: 17 June 2020b.
Huang, G. and Sun, K.: Non-negligible impacts of clean air regulations on the reduction of tropospheric NO2 over East China during the COVID-19 pandemic observed by OMI and TROPOMI, Sci. Total Environ., 745, 141023, https://doi.org/10.1016/j.scitotenv.2020.141023, 2020.
Ialongo, I., Virta, H., Eskes, H., Hovila, J., and Douros, J.: Comparison of TROPOMI/Sentinel-5 Precursor NO2 observations with ground-based measurements in Helsinki, Atmos. Meas. Tech., 13, 205–218, https://doi.org/10.5194/amt-13-205-2020, 2020.
Jain, S. and Sharma, T.: Social and travel lockdown impact considering Coronavirus disease (COVID-19) on air quality in megacities of India: present benefits, future challenges and way forward, Aerosol Air Qual. Res., 20, 1222–1236, https://doi.org/10.4209/aaqr.2020.04.0171, 2020.
Janssens-Maenhout, G., Crippa, M., Guizzardi, D., Dentener, F., Muntean, M., Pouliot, G., Keating, T., Zhang, Q., Kurokawa, J., Wankmüller, R., Denier van der Gon, H., Kuenen, J. J. P., Klimont, Z., Frost, G., Darras, S., Koffi, B., and Li, M.: HTAP_v2.2: a mosaic of regional and global emission grid maps for 2008 and 2010 to study hemispheric transport of air pollution, Atmos. Chem. Phys., 15, 11411–11432, https://doi.org/10.5194/acp-15-11411-2015, 2015.
Jennings, R.: Philippines allows soft post-lockdown reopening to avert dire economic fall, https://www.voanews.com/east-asia-pacific/philippines, last access: 17 June 2020.
Judd, L. M., Al-Saadi, J. A., Szykman, J. J., Valin, L. C., Janz, S. J., Kowalewski, M. G., Eskes, H. J., Veefkind, J. P., Cede, A., Mueller, M., Gebetsberger, M., Swap, R., Pierce, R. B., Nowlan, C. R., Abad, G. G., Nehrir, A., and Williams, D.: Evaluating Sentinel-5P TROPOMI tropospheric NO2 column densities with airborne and Pandora spectrometers near New York City and Long Island Sound, Atmos. Meas. Tech., 13, 6113–6140, https://doi.org/10.5194/amt-13-6113-2020, 2020.
Kharol, S. K., Fioletov, V., McLinden, C. A., Shephard, M. W., Sioris, C. E., Li, C., and Krotkov, N. A.: Ceramic industry at Morbi as a large source of SO2 emissions in India, Atmos. Environ., 223, 117243, https://doi.org/10.1016/j.atmosenv.2019.117243, 2019.
Koukouli, M.-E., Skoulidou, I., Karavias, A., Parcharidis, I., Balis, D., Manders, A., Segers, A., Eskes, H., and van Geffen, J.: Sudden changes in nitrogen dioxide emissions over Greece due to lockdown after the outbreak of COVID-19, Atmos. Chem. Phys., 21, 1759–1774, https://doi.org/10.5194/acp-21-1759-2021, 2021.
Krol, M., Houweling, S., Bregman, B., van den Broek, M., Segers, A., van Velthoven, P., Peters, W., Dentener, F., and Bergamaschi, P.: The two-way nested global chemistry-transport zoom model TM5: algorithm and applications, Atmos. Chem. Phys., 5, 417–432, https://doi.org/10.5194/acp-5-417-2005, 2005.
Kroll, J. H., Heald, C. L., Cappa, C. D., Farmer, D. K., Fry, J. L., Murphy, J. G., and Steiner, A. L.: The complex chemical effects of COVID-19 shutdowns on air quality, Nat. Chem., 12, 777–779, https://doi.org/10.1038/s41557-020-0535-z, 2020.
Kumari, P. and Toshniwal, D.: Impact of lockdown measures during COVID-19 on air quality – a case study of India, Int. J. Environ. Health Res., 32, 503–510, https://doi.org/10.1080/09603123.2020.1778646, 2020.
Lambert, J.-C., Compernolle, S., Eichmann, K.-U., de Graaf, M., Hubert, D., Keppens, A., Kleipool, Q., Langerock, B., Sha, M.K., Verhoelst, T., Wagner, T., Ahn, C., Argyrouli, A., Balis, D., Chan, K.L., De Smedt, I., Eskes, H., Fjæraa, A.M.., Garane, K., Gleason, J.F., Goutail, F., Granville, J., Hedelt, P., Heue, K.-P., Jaross, G., Koukouli, M.L., Landgraf, J., Lutz, R., Nanda, S., Niemeijer, S., Pazmiño, A., Pinardi, G., Pommereau, J.-P., Richter, A., Rozemeijer, N., Sneep, M., Stein Zweers, D., Theys, N., Tilstra, G., Torres, O., Valks, P., van Geffen, J., Vigouroux, C., Wang, P., and Weber, M.: S5P MPC Routine Operations Consolidated Validation Report series, S5P-MPC-IASB-ROCVR-09.01.01-20201221, 9.01.01, Royal Belgian Institute for Space Aeronomy, Brussels, Belgium, https://mpc-vdaf.tropomi.eu/index.php?option=com_vdaf&view=showReport&format=rawhtml&id=45 (last access: 6 March 2022), 2020.
Landgraf, J., aan de Brugh, J., Scheepmaker, R., Borsdorff, T., Hu, H., Houweling, S., Butz, A., Aben, I., and Hasekamp, O.: Carbon monoxide total column retrievals from TROPOMI shortwave infrared measurements, Atmos. Meas. Tech., 9, 4955–4975, https://doi.org/10.5194/amt-9-4955-2016, 2016.
Landgraf, J., aan de Brugh, J., Scheepmaker, R. A., Borsdorff, T., Houweling, S., and Hasekamp, O. P.: Algorithm Theoretical Baseline Document for Sentinel-5 Precursor: Carbon Monoxide Total Column Retrieval, SRON-S5P-LEV2-RP-002, 1.10, SRON Netherlands Institute for Space Research, Utrecht, The Netherlands, https://sentinels.copernicus.eu/web/sentinel/technical-guides/sentinel-5p/products-algorithms (last access: 6 March 2022), 2018.
Landgraf, J., Borsdorff, T., Langerock, B., and Keppens, A.: S5P Mission Performance Centre Carbon Monoxide [L2__CO____] Readme, S5P-MPC-SRON-PRF-CO, 1.5, SRON Netherlands Institute for Space Research, Utrecht, The Netherlands, https://sentinels.copernicus.eu/web/sentinel/technical-guides/sentinel-5p/products-algorithms (last access: 6 March 2022), 2020.
Lee, C., Martin, R. V., van Donkelaar, A., Lee, H., Dickerson, R. R., Hains, J. C., Krotkov, N., Richter, A., Vinnikov, K., and Schwab, J. J.: SO2 emissions and lifetimes: Estimates from inverse modeling using in situ and global, space-based (SCIAMACHY and OMI) observations, J. Geophys. Res., 116, D06304, https://doi.org/10.1029/2010JD014758, 2011.
Lee, J. D., Drysdale, W. S., Finch, D. P., Wilde, S. E., and Palmer, P. I.: UK surface NO2 levels dropped by 42 % during the COVID-19 lockdown: impact on surface O3, Atmos. Chem. Phys., 20, 15743–15759, https://doi.org/10.5194/acp-20-15743-2020, 2020.
Le Quéré, C., Jackson, R. B., Jones, M. W., Smith, A. J. P., Abernethy, S., Andrew, R. M., De-Gol, A. J., Willis, D. R., Shan, Y., Canadell, J. G., Friedlingstein, P., Creutzig F., and Peters, G. P.: Temporary reduction in daily global CO2 emisisons during the COVID-19 forced confinement, Nat. Clim. Chang., 10, 647–653, https://doi.org/10.1038/s41558-020-0797-x, 2020.
Lerot, C.: TROPOMI glyoxal tropospheric columns, Royal Belgian Institute for Space Aeronomy (BIRA-IASB) [data set], https://doi.org/10.18758/71021069, 2021.
Lerot, C., Stavrakou, T., De Smedt, I., Müller, J.-F., and Van Roozendael, M.: Glyoxal vertical columns from GOME-2 backscattered light measurements and comparisons with a global model, Atmos. Chem. Phys., 10, 12059–12072, https://doi.org/10.5194/acp-10-12059-2010, 2010.
Lerot, C., Stavrakou, T., Van Roozendael, M., Alvarado, L. M. A., and Richter, A.: GLYoxal Retrievals from TROPOMI (GLYRETRO) ATBD, S5p+Innovation – theme 1 (CHOCHO), 5p+I_CHOCHO_BIRA_ATBD, 16 November 2020, https://glyretro.aeronomie.be/ (last access: 6 March 2022), 2020.
Leung, K., Wu, J. Liu, D., and Leung, G. M.: First-wave COVID-19 transmissibility and severity in China outside Hubei after control measures, and second-wave scenario planning: a modelling impact assessment, Lancet, 395, 1382–1393, https://doi.org/10.1016/S0140-6736(20)30746-7, 2020.
Li, C., McLinden, C., Fioletov, V., Krotkov, N., Carn, S., Joiner, J., Streets, D., He, H., Ren, X., Zhanqing Li, Z., and Dickerson, R. R.: India Is Overtaking China as the World's Largest Emitter of Anthropogenic Sulfur Dioxide, Sci. Rep., 7, 14304, https://doi.org/10.1038/s41598-017-14639-8, 2017.
Liu, F., Page, A., Strode, S. A., Yoshida, Y., Choi, S., Zheng, B., Lamsal, L. N., Li, C., Krotkov, N. A., Eskes, H., van der A, R., Veefkind, P., Levelt, P. F., Hauser, O. P., and Joiner, J.: Abrupt decline in tropospheric nitrogen dioxide over China after the outbreak of COVID-19, Sci. Adv., 6, eabc2992, https://doi.org/10.1126/sciadv.abc2992, 2020.
Lorente, A., Boersma, K. F., Eskes, H. J., Veefkind, J. P., van Geffen, J. H. G. M., de Zeeuw, M. B., Denier van der Gon, H. A. C., Beirle, S., and Krol, M. C.: Quantification of nitrogen oxides emissions from build-up of pollution over Paris with TROPOMI, Sci. Rep., 9, 20033, https://doi.org/10.1038/s41598-019-56428-5, 2019.
Loyola, D. G., Gimeno García, S., Lutz, R., Argyrouli, A., Romahn, F., Spurr, R. J. D., Pedergnana, M., Doicu, A., Molina García, V., and Schüssler, O.: The operational cloud retrieval algorithms from TROPOMI on board Sentinel-5 Precursor, Atmos. Meas. Tech., 11, 409–427, https://doi.org/10.5194/amt-11-409-2018, 2018.
Ludewig, A., Kleipool, Q., Bartstra, R., Landzaat, R., Leloux, J., Loots, E., Meijering, P., van der Plas, E., Rozemeijer, N., Vonk, F., and Veefkind, P.: In-flight calibration results of the TROPOMI payload on board the Sentinel-5 Precursor satellite, Atmos. Meas. Tech., 13, 3561–3580, https://doi.org/10.5194/amt-13-3561-2020, 2020.
Mahato, S., Pal, S., and Ghosh, K. G., Effect of lockdown amid COVID-19 pandemic on air quality of the megacity Delhi, India, Sci. Total Environ., 730, 139086, https://doi.org/10.1016/j.scitotenv.2020.139086, 2020.
Makooi, B.: Key points of France's strategy for lifting its nationwide Covid-19 lockdown, https://www.france24.com/en/20200429-key-points-of-france-s-strategy, last access: 17 June 2020.
Masaki, T., Nakamura, S., Newhouse, D.: How is the COVID-19 crisis affecting nitrogen dioxide emissions in Sub-Saharan Africa? Poverty and Equity Notes, No. 21, World Bank, Washington, DC, https://openknowledge.worldbank.org/handle/10986/33801 (last access: 6 March 2022), 2020.
Matthews, A.: Coronavirus: 5 things New Zealand got right, Deutsche Welle, https://p.dw.com/p/3dSVh, last access: 2 July 2020.
Mbah, F.: Businesses reopen as Nigeria eases coronavirus lockdown, https://www.aljazeera.com/news/2020/05/businesses-reopen-nigeria, last access: 17 June 2020.
Menon, P.: `Stay at home' New Zealand PM urges ahead of coronavirus lockdown, https://www.reuters.com/article/us-health-coronavirus-newzealand, last access: 17 June 2020.
Millet, D. B., Jacob, D. J., Boersma, K. F., Fu, T. M., Kurosu, T. P., Chance, K., Heald, C. L., and Guenther, A.: Spatial distribution of isoprene emissions from North America derived from formaldehyde column measurements by the OMI satellite sensor, J. Geophys. Res., 113, D02307, https://doi.org/10.1029/2007jd008950, 2008.
Minder, R. and Peltier, E.: Spain imposes nationwide lockdown to fight coronavirus, https://www.nytimes.com/2020/03/14/world/europe/spain-coronavirus.html, last access: 17 June 2020.
Misculin, N. and Garrison, C.: Argentina extends lockdown in Buenos Aires as coronavirus cases surpass 20,000, https://www.thejakartapost.com/news/2020/06/05/argentina-extends-lockdown, last access: 17 June 2020.
Miyazaki, K., Bowman, K., Sekiya, T., Jiang, Z., Chen, X., Eskes, H., Ru, M., Zhang, Y., and Shindell, D.: Air quality response in China linked to the 2019 novel coronavirus (COVID-19) lockdown, Geophys. Res. Lett., 47, e2020GL089252, https://doi.org/10.1029/2020GL089252, 2020.
Müller, J.-F., Stavrakou, T., Bauwens, M., Compernolle, S., and Peeters, J.: Chemistry and deposition in the Model of Atmospheric composition at Global and Regional scales using Inversion Techniques for Trace gas Emissions (MAGRITTE v1.0). Part B. Dry deposition, Geosci. Model Dev. Discuss. [preprint], https://doi.org/10.5194/gmd-2018-317, 2018.
Müller, J.-F., Stavrakou, T., and Peeters, J.: Chemistry and deposition in the Model of Atmospheric composition at Global and Regional scales using Inversion Techniques for Trace gas Emissions (MAGRITTE v1.1) – Part 1: Chemical mechanism, Geosci. Model Dev., 12, 2307–2356, https://doi.org/10.5194/gmd-12-2307-2019, 2019.
Muñoz Sabater, J.: ERA5-Land monthly averaged data from 1981 to present, Copernicus Climate Change Service (C3S) Climate Data Store (CDS) [data set], https://doi.org/10.24381/cds.68d2bb30, 2019a.
Muñoz Sabater, J.: ERA5-Land hourly averaged data from 1981 to present, Copernicus Climate Change Service (C3S) Climate Data Store (CDS) [data set], https://doi.org/10.24381/cds.e2161bac, 2019b.
New South Wales Public Health: Public Health (COVID-19 Restrictions on Gathering and Movement) Order 2020, https://www.legislation.nsw.gov.au, last access: 2 July 2020.
Odunsi, P.: Africa: COVID-19 deaths hits 37,000, Nigeria on top 5, Daily Post Nigeria, https://dailypost.ng/2020/10/06/africa-covid-19-deaths-hits-37000-nigeria-on-top-5/ (last access: 30 March 2021), 2020.
Onishi, N. and Méheut, C.: Paris, a magnet for the world, becomes a ghost city after a lockdown takes effect, https://www.nytimes.com/2020/03/17/world/europe/paris-coronavirus-lockdown.html, last access: 17 June 2020.
Orjinmo, N.: Coronavirus lockdown: Nigerians cautious as restrictions eased in Lagos and Abuja, https://www.bbc.com/news/world-52526923, last access: 17 June 2020.
Palmer, P. I., Jacob, D. J., Chance, K., Martin, R. V., Spurr, R. J. D., Kurosu, T. P., Bey, I., Yantosca, R., Fiore, A., and Li, Q.: Air mass factor formulation for spectroscopic measurements from satellites: Application to formaldehyde retrievals from the Global Ozone Monitoring Experiment, J. Geophys. Res.-Atmos., 106, 14539–14550, https://doi.org/10.1029/2000JD900772, 2001.
Pasley, J.: Mexico has moved to “Phase 3” – its most serious level of coronavirus alert – and faces a looming outbreak. Here's how it got to this point, https://www.insider.com/photo-mexico-coronavirus-move-to-phase-three-2020-4, last access: 17 June 2020.
Patel, S.: When Is California Reopening? The New York Times https://www.nytimes.com/article/coronavirus-california-reopening-phases.html, last access: 17 June 2020.
POSOCO, Power System Operation Corporation Limited, National Load Despatch Centre: https://posoco.in/covid-19/, last access: 30 March 2021.
Prabhjote, G.: The most congested cities in India low lie vacant midst the nationwide lockdown, Business Insider India, https://www.businessinsider.in/india/news/most-congested-cities (last access: 30 March 2021), 2020.
Qu, Z., Jacob, D. J., Silvern, R. F., Shah, V., Campbell, P. C., Valin, L. C. and Murray, L. T.: US COVID-19 shutdown demonstrates importance of background NO2 in inferring NOx emissions from satellite NO2 observations, Geophys. Res. Lett., 48, e2021GL092783, https://doi.org/10.1029/2021GL092783, 2021.
Raszewski, E. and Garrison, C.: Buenos Aires lockdown extended until June 7 after rise in coronavirus cases, Reuters, https://www.reuters.com/article/us-health-coronavirus-argentina, last access: 17 June 2020.
Romahn, F., Pedergnana, M., Loyola, D., Apituley, A., Sneep, M., Veefkind, J. P., De Smedt, I., and Chan, K. L.: Sentinel-5 precursor/TROPOMI Level 2 Product User Manual Formaldehyde HCHO, S5P-L2-DLR-PUM-400F, 2.01.00, DLR, German Aerospace Center, Oberpfaffenhofen, Germany, https://sentinels.copernicus.eu/web/sentinel/technical-guides/sentinel-5p/products-algorithms (last access: 6 March 2022), 2020.
Saleh, I.: Iraq locks down 6 districts in Baghdad to stem virus, https://www.aa.com.tr/en/latest-on-coronavirus-outbreak/iraq-locks-down-6-districts-in-baghdad-to-stem-virus/1845104, last access: 17 June 2020.
Sekiya, T., Miyazaki, K., Eskes, H., Sudo, K., Takigawa, M., and Kanaya, Y.: A comparison of the impact of TROPOMI and OMI tropospheric NO2 on global chemical data assimilation, Atmos. Meas. Tech., 15, 1703–1728, https://doi.org/10.5194/amt-15-1703-2022, 2022.
Sentinel-5P Pre-Operations Data Hub: https://s5phub.copernicus.eu/, last access: 18 June 2021.
Shi, X. and Brasseur, G. P.: The response in air quality to the reduction of Chinese economic activities during the COVID-19 outbreak, Geophys. Res. Lett., 47, e2020GL088070, https://doi.org/10.1029/2020GL088070, 2020.
Singh, K. D., Goel, V., Kumar, H., and Gettleman, J.: India, Day 1: World's Largest Coronavirus Lockdown Begins, The New York Times, https://www.nytimes.com/2020/03/25/world/asia/india-lockdown-coronavirus.html (last access: 30 March 2021), 2020.
Sonali P.: Australia's biggest state to ease coronavirus lockdown from May 15, https://www.reuters.com/article/us-health-coronavirus-australia, last access: 17 June 2020.
Spurr, R. and Christi, M.: The LIDORT and VLIDORT Linearized Scalar and Vector Discrete Ordinate Radiative Transfer Models: Updates in the Last 10 Years, in: Springer Series in Light Scattering, 1st edn., edited by: Kokhanovsky, A., Springer, Cham, 1–62, https://doi.org/10.1007/978-3-030-03445-0, 2019.
Srikanta, S., Pilla, F., Basu, B., Sarkar Basu, A., Sarkar, K., Chakraborti, S., Kumar Joshi, P., Zhang, Q., Wang, Y., Bhatt, S., Bhatt, A., Jha, S., Keesstra, S., and Roy, P. S.: Examining the effects of forest fire on terrestrial carbon emission and ecosystem production in India using remote sensing approaches, Sci. Tot. Environ., 725, 138331, https://doi.org/10.1016/j.scitotenv.2020.138331, 2020.
Stavrakou, T., Müller, J.-F., De Smedt, I., Van Roozendael, M., Kanakidou, M., Vrekoussis, M., Wittrock, F., Richter, A., and Burrows, J. P.: The continental source of glyoxal estimated by the synergistic use of spaceborne measurements and inverse modelling, Atmos. Chem. Phys., 9, 8431–8446, https://doi.org/10.5194/acp-9-8431-2009, 2009.
Stavrakou, T., Müller, J.-F., Bauwens, M., De Smedt, I., Van Roozendael, M., and Guenther, A. B.: Impact of short-term climate variability on volatile organic compounds emissions assessed using OMI satellite formaldehyde observations. Geophys. Res. Lett., 45, 8681–8689, https://doi.org/10.1029/2018GL078676, 2018.
Stavrakou, T., Müller, J.-F., Bauwens, M., Doumbia, T., Elguindi, N., Darras, S., Granier, C., DeSmedt, I., Lerot, C., Van Roozendael, M., Franco, B., Clarisse, L., Clerbaux, C., Coheur, P.-F., Liu, Y., Wang, T., Shi, X., Gaubert, B., Tilmes, S., and Brasseur, G.: Atmospheric Impacts of COVID-19 on NOx and VOC Levels over China Based on TROPOMI and IASI Satellite Data and Modeling, Atmosphere, 12, 946, https://doi.org/10.3390/atmos12080946, 2021.
Sun, W., Zhu, L., De Smedt, I., Bai, B., Pu, D., Chen, Y., Shu, L., Wang, D., Fu, T.-M., Wang, X., and Yang, X.: Global significant changes in formaldehyde (HCHO) columns observed from space at the early stage of the COVID-19 pandemic, Geophys. Res. Lett., 48, e2020GL091265, https://doi.org/10.1029/2020GL091265, 2021.
Tack, F., Merlaud, A., Iordache, M.-D., Pinardi, G., Dimitropoulou, E., Eskes, H., Bomans, B., Veefkind, P., and Van Roozendael, M.: Assessment of the TROPOMI tropospheric NO2 product based on airborne APEX observations, Atmos. Meas. Tech., 14, 615–646, https://doi.org/10.5194/amt-14-615-2021, 2021.
Tan, P. H., Chou, C., Liang, J. Y., Chou, C. C. K., and Shiu, C. J.: Air pollution “holiday effect” resulting from the Chinese New Year, Atmos. Environ., 43, 2114–2124, https://doi.org/10.1016/j.atmosenv.2009.01.037, 2009.
The Star: Iraq on total lockdown until March 28 over virus fears, https://www.thestar.com.my/news/regional/2020/03/22/iraq-on-total-lockdown-until-march-28-over-virus-fears, last access: 17 June 2020.
Theys, N., Fioletov, V., Li, C., De Smedt, I., Lerot, C., McLinden, C., Krotkov, N., Griffin, D., Clarisse, L., Hedelt, P., Loyola, D., Wagner, T., Kumar, V., Innes, A., Ribas, R., Hendrick, F., Vlietinck, J., Brenot, H., and Van Roozendael, M.: A sulfur dioxide Covariance-Based Retrieval Algorithm (COBRA): application to TROPOMI reveals new emission sources, Atmos. Chem. Phys., 21, 16727–16744, https://doi.org/10.5194/acp-21-16727-2021, 2021.
Uchoa, P.: Brazil coronavirus: `Our biggest problem is fake news', BBC, https://www.bbc.com/news/world-latin-america-52739734, last access: 17 June 2020.
van der A, R. J., Mijling, B., Ding, J., Koukouli, M. E., Liu, F., Li, Q., Mao, H., and Theys, N.: Cleaning up the air: effectiveness of air quality policy for SO2 and NOx emissions in China, Atmos. Chem. Phys., 17, 1775–1789, https://doi.org/10.5194/acp-17-1775-2017, 2017.
van Geffen, J., Boersma, K. F., Eskes, H., Sneep, M., ter Linden, M., Zara, M., and Veefkind, J. P.: S5P TROPOMI NO2 slant column retrieval: method, stability, uncertainties and comparisons with OMI, Atmos. Meas. Tech., 13, 1315–1335, https://doi.org/10.5194/amt-13-1315-2020, 2020.
van Geffen, J. H. G. M., Eskes, H. J., Boersma, K. F., Maasakkers, J. D., and Veefkind, J. P.: TROPOMI ATBD of the total and tropospheric NO2 data products, S5P-KNMI-L2-0005-RP, 1.4.0, Royal Netherlands Meteorological Institute, De Bilt, The Netherlands, https://sentinel.esa.int/documents/247904/2476257/Sentinel-5P-TROPOMI-ATBD-NO2-data-products.pdf/7a4fdde7-516e-48e7-bf44-da60c62b1e4d?version=1.4 (last access: 6 March 2022), 2019.
van Geffen, J. H. G. M., Eskes, H. J., Boersma, K. F., and Veefkind, J. P.: TROPOMI ATBD of the total and tropospheric NO2 data products, S5P-KNMI-L2-0005-RP, 2.2.0, Royal Netherlands Meteorological Institute, De Bilt, The Netherlands, https://sentinels.copernicus.eu/web/sentinel/technical-guides/sentinel-5p/products-algorithms (last access: 8 March 2022), 2021.
Veefkind, J. P., Aben, I., McMullan, K., Forster, H., de Vries, J., Otter, G., Claas, J., Eskes, H. J., de Haan, J. F., Kleipool, Q., van Weele, M., Hasekamp, O., Hoogeveen, R., Landgraf, J., Snel, R., Tol, P., Ingmann, P., Voors., R., Kruizinge, B., Vink, R., Visser, H., and Levelt, P. F.: TROPOMI on the ESA Sentinel-5 Precursor: A GMES mission for global observations of the atmospheric composition for climate, air quality and ozone layer applications, Remote Sens. Environ., 120, 70–83, 2012.
Verhoelst, T., Compernolle, S., Pinardi, G., Lambert, J.-C., Eskes, H. J., Eichmann, K.-U., Fjæraa, A. M., Granville, J., Niemeijer, S., Cede, A., Tiefengraber, M., Hendrick, F., Pazmiño, A., Bais, A., Bazureau, A., Boersma, K. F., Bognar, K., Dehn, A., Donner, S., Elokhov, A., Gebetsberger, M., Goutail, F., Grutter de la Mora, M., Gruzdev, A., Gratsea, M., Hansen, G. H., Irie, H., Jepsen, N., Kanaya, Y., Karagkiozidis, D., Kivi, R., Kreher, K., Levelt, P. F., Liu, C., Müller, M., Navarro Comas, M., Piters, A. J. M., Pommereau, J.-P., Portafaix, T., Prados-Roman, C., Puentedura, O., Querel, R., Remmers, J., Richter, A., Rimmer, J., Rivera Cárdenas, C., Saavedra de Miguel, L., Sinyakov, V. P., Stremme, W., Strong, K., Van Roozendael, M., Veefkind, J. P., Wagner, T., Wittrock, F., Yela González, M., and Zehner, C.: Ground-based validation of the Copernicus Sentinel-5P TROPOMI NO2 measurements with the NDACC ZSL-DOAS, MAX-DOAS and Pandonia global networks, Atmos. Meas. Tech., 14, 481–510, https://doi.org/10.5194/amt-14-481-2021, 2021.
Vigouroux, C., Langerock, B., Bauer Aquino, C. A., Blumenstock, T., Cheng, Z., De Mazière, M., De Smedt, I., Grutter, M., Hannigan, J. W., Jones, N., Kivi, R., Loyola, D., Lutsch, E., Mahieu, E., Makarova, M., Metzger, J.-M., Morino, I., Murata, I., Nagahama, T., Notholt, J., Ortega, I., Palm, M., Pinardi, G., Röhling, A., Smale, D., Stremme, W., Strong, K., Sussmann, R., Té, Y., van Roozendael, M., Wang, P., and Winkler, H.: TROPOMI–Sentinel-5 Precursor formaldehyde validation using an extensive network of ground-based Fourier-transform infrared stations, Atmos. Meas. Tech., 13, 3751–3767, https://doi.org/10.5194/amt-13-3751-2020, 2020.
Wahlquist, C.: Australia's coronavirus lockdown – the first 50 days, https://www.theguardian.com/world/2020/may/02/australias-coronavirus-lockdown-the-first-50-days, last access: 17 June 2020.
Wang, Y., Yuan, Y., Wang, Q., Liu, C. G., Zhi, Q., and Cao, J.: Changes in air quality related to the control of coronavirus in China: Implications for traffic and industrial emissions, Sci. Total Environ., 731, 139133, https://doi.org/10.1016/j.scitotenv.2020.139133, 2020.
Wang, Z., Zheng, F., Zhang, W., and Wang, S.: Analysis of SO2 Pollution Changes of Beijing-Tianjin-Hebei Region over China Based on OMI Observations from 2006 to 2017, Adv. Meteorol., 2018, 8746068, https://doi.org/10.1155/2018/8746068, 2018.
Williams, J. E., Boersma, K. F., Le Sager, P., and Verstraeten, W. W.: The high-resolution version of TM5-MP for optimized satellite retrievals: description and validation, Geosci. Model Dev., 10, 721–750, https://doi.org/10.5194/gmd-10-721-2017, 2017.
Winter, S.: Ramaphosa announces 21 day coronavirus lockdown for South Africa, https://businesstech.co.za/news/government/383927/ramaphosa, last access: 17 June 2020.
Zhang, R., Zhang, Y., Lin, H., Feng, X., Fu, T.-M., and Wang, Y.: NOx Emission Reduction and Recovery during COVID-19 in East China, Atmosphere (Basel), 11, 433, https://doi.org/10.3390/atmos11040433, 2020.
Zhang, Z., Arshad, A., Zhang, C., Hussain, S., and Li, W.: Unprecedented Temporary Reduction in Global Air Pollution Associated with COVID-19 Forced Confinement: A Continental and City Scale Analysis, Remote Sens., 12, 2420, https://doi.org/10.3390/rs12152420, 2020.
Zhao, N., G. Wang, G. Li, J. Lang and H. Zhang: Air pollution episodes during the COVID-19 outbreak in the Beijing–Tianjin–Hebei region of China: An insight into the transport pathways and source distribution, Environ. Pollut., 267, 115617, https://doi.org/10.1016/j.envpol.2020.115617, 2020.
Zhao, Y., Zhang, K., Xu, X., Shen, H., Zhu, X., Zhang, Y., Hu, Y., and Shen, G.: Substantial Changes in Nitrogen Dioxide and Ozone after Excluding Meteorological Impacts during the COVID-19 Outbreak in Mainland China, Environ. Sci. Technol. Lett., 7, 402–408, https://doi.org/10.1021/acs.estlett.0c00304, 2020.
Zheng, B., Tong, D., Li, M., Liu, F., Hong, C., Geng, G., Li, H., Li, X., Peng, L., Qi, J., Yan, L., Zhang, Y., Zhao, H., Zheng, Y., He, K., and Zhang, Q.: Trends in China's anthropogenic emissions since 2010 as the consequence of clean air actions, Atmos. Chem. Phys., 18, 14095–14111, https://doi.org/10.5194/acp-18-14095-2018, 2018a.
Zheng, B., Chevallier, F., Ciais, P., Yin, Y., Deeter, M. N., Worden, H. M., Wang, Y., Zhang, Q., and He, K.: Rapid decline in carbon monoxide emissions and export from East Asia between years 2005 and 2016, Environ. Res. Lett., 13, 044007, https://doi.org/10.1088/1748-9326/aab2b3, 2018b.
Zhu, L., Mickley, L. J., Jacob, D. J., Marais, E. A., Sheng, J., Hu, L., Abad, G. G., and Chance, K.: Long-term (2005–2014) trends in formaldehyde (HCHO) columns across North Americas seen by the OMI satellite instrument: Evidence of changing emissions of volatile organic compounds, Geophys. Res. Lett., 44, 7079–7086, https://doi.org/10.1002/2017GL073859, 2017.
- Abstract
- Introduction
- Methods and data
- Global observations of nitrogen dioxide
- Regional observations for China
- Regional Observations for India
- Conclusions
- Appendix A
- Appendix B
- Appendix C
- Appendix D
- Data availability
- Author contributions
- Competing interests
- Disclaimer
- Acknowledgements
- Financial support
- Review statement
- References