the Creative Commons Attribution 4.0 License.
the Creative Commons Attribution 4.0 License.
 | 10 Aug 2022
Exploring relations between cloud morphology, cloud phase, and cloud radiative properties in Southern Ocean's stratocumulus clouds
Jessica Danker
Odran Sourdeval
Isabel L. McCoy
Robert Wood
Anna Possner
Marine stratocumuli are the most dominant cloud type by area coverage in the Southern Ocean (SO). They can be divided into different self-organized cellular morphological regimes known as open and closed mesoscale-cellular convective (MCC) clouds. Open and closed cells are the two most frequent types of organizational regimes in the SO. Using the liDAR-raDAR (DARDAR) version 2 retrievals, we quantify 59 % of all MCC clouds in this region as mixed-phase clouds (MPCs) during a 4-year time period from 2007 to 2010. The net radiative effect of SO MCC clouds is governed by changes in cloud albedo. Both cloud morphology and phase have previously been shown to impact cloud albedo individually, but their interactions and their combined impact on cloud albedo remain unclear.
Here, we investigate the relationships between cloud phase, organizational patterns, and their differences regarding their cloud radiative properties in the SO. The mixed-phase fraction, which is defined as the number of MPCs divided by the sum of MPC and supercooled liquid cloud (SLC) pixels, of all MCC clouds at a given cloud-top temperature (CTT) varies considerably between austral summer and winter. We further find that seasonal changes in cloud phase at a given CTT across all latitudes are largely independent of cloud morphology and are thus seemingly constrained by other external factors. Overall, our results show a stronger dependence of cloud phase on cloud-top height (CTH) than CTT for clouds below 2.5 km in altitude.
Preconditioning through ice-phase processes in MPCs has been observed to accelerate individual closed-to-open cell transitions in extratropical stratocumuli. The hypothesis of preconditioning has been further substantiated in large-eddy simulations of open and closed MPCs. In this study, we do not find preconditioning to primarily impact climatological cloud morphology statistics in the SO. Meanwhile, in-cloud albedo analysis reveals stronger changes in open and closed cell albedo in SLCs than in MPCs. In particular, few optically thick (cloud optical thickness >10) open cell stratocumuli are characterized as ice-free SLCs. These differences in in-cloud albedo are found to alter the cloud radiative effect in the SO by 21 to 39 W m−2 depending on season and cloud phase.
- Article
(4210 KB) - Full-text XML
-
Supplement
(5487 KB) - BibTeX
- EndNote


In the Southern Ocean (SO), low-level marine stratiform clouds cover between 40 % to 60 % of the ocean surface (Wood, 2015), and due to their high albedo they play a key role in the radiative balance of the Earth (Randall et al., 1984; Ramanathan et al., 1989; Hartmann et al., 1992; Chen et al., 2000). Especially at high latitudes, many marine stratocumuli occur as mixed-phase clouds (MPCs). In contrast to pure liquid clouds, MPCs contain a mixture of supercooled liquid and ice. The phase partitioning between liquid and ice in stratocumuli strongly impacts the cloud radiative properties (Sun and Shine, 1994; Matus and L'Ecuyer, 2017; Korolev et al., 2017). Due to the complex microphysics in MPCs, our understanding of the impact of phase partitioning on the radiative properties of these low-level clouds remains limited (McCoy et al., 2015; Tan and Storelvmo, 2019). Furthermore, the cloud-phase feedback remains poorly represented in models, particularly in the SO (Bony et al., 2006; Zelinka et al., 2012, 2013), which represents a critical region to compute climate sensitivity (Gettelman et al., 2019; Zelinka et al., 2020). Given the extensive coverage of MPCs in the SO and their impacts on cloud albedo, it is especially important to observe, understand, and quantify the cloud radiative properties of MPCs in the SO.
Stratocumuli are divided into different self-organized morphological regimes referred to as open and closed mesoscale-cellular convective (MCC) clouds which are associated with different cloud fractions (Atkinson and Zhang, 1996; Wood and Hartmann, 2006). In the SO, open and closed cells are the two most frequent types of MCC clouds (Muhlbauer et al., 2014). Especially in austral winter, open MCC clouds reach their highest frequency of occurrence whereas closed MCC clouds occur more often in summer. Due to their organizational differences, the cloud fraction of closed MCC clouds is on average about 30 % higher than for open MCC clouds (Wood and Hartmann, 2006) and thus closed MCC clouds reflect more incoming short-wave radiation. Moreover, McCoy et al. (2017) showed that even for the same cloud fraction, closed MCC clouds have a higher cloud albedo than open MCC clouds. Therefore, it is important to understand the processes which are related to the occurrence of the two types of MCC clouds in low-level clouds, and their transition to quantify their radiative effects on Earth's climate. One process controlling the shift from closed to open cell convection is the formation of precipitation (Feingold et al., 2010) through a decoupling of the boundary layer induced by precipitation (Abel et al., 2017). Further, Yamaguchi and Feingold (2015) find that not only the formation of precipitation but also its spatial extent is essential for the transition of the MCC clouds regimes. Even large-scale meteorological events like marine cold-air outbreaks, which are often found in the SO (Fletcher et al., 2016a), can impact the occurrence of MCC clouds. McCoy et al. (2017) show that open MCC clouds preferentially form during marine cold-air outbreaks.
The potential link between cloud phase and cloud-field organization in mixed-phase stratocumuli was first explored by Abel et al. (2017), Eirund et al. (2019a), and Tornow et al. (2021). Abel et al. (2017) analyze aircraft observations in the North Atlantic and find that the transition from mixed-phase closed to open MCC clouds is accompanied by a shift from supercooled dominated MPCs to more glaciated MPCs. They further show that the key factor for the onset of closed-to-open cell transition is precipitation. Tornow et al. (2021) address the question of which ice processes are relevant for precipitation during the transition. They introduce the notion of preconditioning whereby efficient riming-related processes lead to more favorable conditions for cloud breakup and accelerated the transition of an overcast stratocumulus deck into a broken cloud field. In a case study of Arctic stratocumulus, Eirund et al. (2019a) demonstrate that mixed-phase open MCC clouds have a larger cell size than pure liquid open cells.
All three studies utilize field observations of particular situations together with numerical models, allowing them to disentangle the potential impact of different processes in greater detail. Yet, it remains to be seen whether preconditioning due to ice-phase processes occurs often and widely enough to impact statistics of cloud morphology and cloud albedo.
In this study, we investigate the connections between cloud phase, cloud organization, and cloud albedo in the SO. In order to investigate these connections for a wide range of cases, we use active satellite data of the Afternoon Constellation (A-Train) from 2007 to 2010. The cloud phase is analyzed by using a vertically integrated cloud-phase classification which we describe in Sect. 2.2. Moreover, we focus on the seasonal changes during austral winter (June–August, JJA) and summer (December–February, DJF) because these seasons have the highest frequency of occurrence of open and closed MCC clouds, respectively. In Sect. 3.1, we analyze the quality of our cloud-phase classification and investigate the link between cloud phase, season, and cloud morphology. In Sect. 3.2, we analyze the connections between freezing behavior and cloud phase under different seasonal or morphological conditions. We examine the dependence of cloud-top temperature (CTT) and cloud-top height (CTH) in open MCC clouds, closed MCC clouds, and low-level clouds. Finally, we address the question of how cloud phase and cloud morphology impact cloud albedo (Sect. 3.3).
2.1 DARDAR and MODIS
The raDAR-liDAR (DARDAR) v2 data product (Delanoë and Hogan, 2010; Ceccaldi et al., 2013) combines data from the Cloud-Aerosol Lidar and Infrared Pathfinder Satellite Observations (CALIPSO) and CloudSat satellites. The two products are collocated onto the CloudSat footprints (∼ 1.1 km). The advantage of combining lidar and radar measurements is that due to their different wavelengths, they detect different parts of the hydrometer spectrum. While lidar is sensitive to small particles and thus small liquid droplets, radar is dominated by larger particles and thus mainly ice particles. In this study, DARDAR v2 is used. This product significantly reduces the overestimation of supercooled pixels in the lowest part of the troposphere compared to DARDAR v1 (Ceccaldi et al., 2013). We analyze data covering the time period from 2007 to 2010 and focus on the SO (40 to 65∘ S). While Huang et al. (2021b) report large differences in cloud-phase detection between various satellite products, which struggle specifically with MPCs, they use the DARDAR v1 which is known to overestimate supercooled liquid. In contrast, DARDAR v2 is validated with several ground-based measurements in the Antarctic by Listowski et al. (2019), who also show that DARDAR v2 has the ability to capture the seasonal cycle of supercooled liquid cloud (SLC) fraction. Nevertheless, MPCs with very low ice crystal number concentrations, which are common in the SO, might still be misidentified as supercooled liquid. Further, we chose the DARDAR product as it merges information from two active instruments and thus provides a vertically resolved cloud phase. This is in contrast to passive satellites that only resolve cloud phase at cloud top. The DARDAR cloud classification additionally requires a temperature profile in the radar mask and the strong lidar backscatter layers ( m−1 sr−1) of the DARDAR classification algorithm. For further details on the DARDAR algorithm see Ceccaldi et al. (2013). The temperature and other thermodynamic variables like sea surface temperature (SST) and surface wind speeds are collocated on the CloudSat track by the European Center for Medium-Range Weather Forecasts (ECMWF)-AUX. Moreover, in this study, we combine the DARDAR v2 product with the Moderate Resolution Imaging Spectroradiometer (MODIS) cloud product (MYD06_L2) Collection 6 (C6) version from the Aqua satellite (Platnick et al., 2015). The liquid water path (LWP) and the cloud optical thickness (COT) are provided by MODIS. Further, we derive the in-cloud albedo (Albcld) from the MODIS COT to remain consistent with DARDAR's horizontal pixel resolution of 1.1 km. Following Berner et al. (2015) based on Platnick and Twomey (1994), we use the equation:
where COT is indicated as τ and the asymmetry parameter is g = 0.85 which assumes small water droplets. McFarquhar and Cober (2004) find that MPCs peak at g = 0.85 and liquid clouds at g = 0.87. Further, Gayet et al. (2002) show that in MPCs the asymmetry parameter ranges from 0.82 to 0.85 (i.e., similar to values in liquid clouds). They find higher values of g are typically found in liquid clouds with high liquid water content whereas lower values of g (0.73–0.80) are found in ice clouds. This corresponds to findings by Shcherbakov et al. (2005) and Xu et al. (2022) who demonstrate that the asymmetry parameter is g = 0.77 in cirrus clouds in the Southern Hemisphere. As differences between liquid clouds and MPCs are similar, the asymmetry parameter g = 0.85 is used for both liquid and MPCs.
2.2 Vertically integrated cloud phase
To analyze the cloud phase, we use the DARDAR cloud classification, which provides a vertically resolved cloud phase with a 60 m resolution from surface to 25.08 km. This vertically resolved cloud phase is based on a lidar and radar mask provided by the DARDAR algorithm (for details see Table 1 of Ceccaldi et al., 2013). Therefore, when the lidar signal is fully attenuated, the DARDAR classification can only determine the layer to be ice cloud, warm rain, or cold rain. The DARDAR classification has 17 different categories which are displayed in the example tracks of DARDAR in Fig. 1a and S4. In this study, the following categories of DARDAR are grouped into four categories: (1) Ice (ice clouds, spherical or 2D ice, and highly concentrated ice), (2) Sup (supercooled water and multiple scattering due to supercooled water), (3) Mix (supercooled + ice), and (4) Liq liquid warm. To reduce the vertical cloud phase into a vertically integrated cloud phase, we first identify the highest and lowest cloud levels which are categorized as Sup, Mix, or Liq. The height of the highest cloud level is defined as the CTH and the lowest as the liquid cloud-base height (CBH). As a result, we exclude pure ice clouds. Further, we exclude pure ice clouds because the MCC algorithm is based on the LWP (see Sect. 2.3) . Since we are only interested in low-level clouds, any data point with CTH above 3 km is excluded from this analysis. The surface cluttering of radar can cause noise up to 2 km which can not be clearly distinguished from the signal, especially at heights below 720 m, and thus clouds are missed (Marchand et al., 2008). Even though some studies (Liu et al., 2012; Fletcher et al., 2016b) consider anything roughly below 1 km as ground clutter, Mioche et al. (2015) show that in comparison with ground-based observation the cloud fraction of DARDAR is 10 % lower from 500 to 1000 m, while in the range from 0 to 500 m it is 25 % lower. Thus, in this study, we consider 720 m as the threshold for surface clutter, similar to other studies (Kay and Gettelman, 2009; Huang et al., 2017; Noh et al., 2019; Listowski et al., 2019). In order to correctly identify the cloud phase, however, we require one level below the liquid CBH. Thus, we restrict our analysis to clouds with a liquid CBH at 780 m or above. Moreover, we remove any multi-layer clouds, defined here as clouds with three or more consecutive vertical levels marked as clear or fill values. As the constructed vertical resolution of DARDAR is 60 m, three levels equal a distance of 240 m. This is also the oversampled vertical resolution of CloudSat (effective vertical resolution is 480 m). Thus, this distance ensures that multi-layer clouds are two separated clouds with a sufficiently large separation.
In order to assign one cloud phase to a certain data point in DARDAR, we need to reduce the DARDAR cloud classification in the vertical dimension. Therefore, all data points are classified into MPCs, liquid clouds, or clear, depending on their vertical phase distribution (Fig. 1b). Here, we only analyze pixels. Liquid clouds are considered to be clouds that only consist of Liq, Sup, or Sup above Liq (Sup → Liq). For MPCs, we consider five different types: only Mix, Mix above Ice (Mix → Ice), Sup above Ice (Sup → Ice), any combination of Sup and Mix (Sup ↔ Mix), and any combination of Sup and Mix above Ice (Sup ↔ Mix → Ice).
Typically, the lidar signal in our cloudy pixels fully attenuates within 300 m (five vertical levels) (interquartile range = 360–240 m), and thus provides information beyond the cloud-top phase. As mentioned above, the radar mask of the DARDAR classification requires the ECMWF wet bulb temperature to distinguish between the ice (≤ 0 ∘C), and liquid (> 0 ∘C) or rain (> 0 ∘C) phase. Therefore, this could lead to uncertainty in the cloud-phase classification close to 0 ∘C, especially if the lidar signal is fully attenuated. As this affects cloud-phase classification at temperatures close to 0 ∘C, this should not lead to a bias in the overall cloud-phase distinction. Furthermore, for temperatures below 0 ∘C, the radar classification cannot distinguish between supercooled drizzle and ice. In the SO in particular, supercooled drizzle is observed in stratocumulus clouds at temperatures near −10 ∘C (Mace and Protat, 2018). Furthermore, Silber et al. (2019) show that at the observation station McMurdo in Antarctica, supercooled drizzle can persist at temperatures below −25 ∘C for several hours. While it might be possible that the Mix classification of DARDAR itself is affected as this category is supercooled liquid from lidar and ice from radar, we find it unlikely that multiple layers of Mix could be affected since the lidar signal would fully attenuate in the presence of drizzle and the vertical lidar resolution of CALIPSO is 30 m. As most MPCs that contain Mix have mixed layers with a thickness of roughly 480 m (eight vertical levels in DARDAR) (see Figs. 1a and S4), the MPCs with identified Mix levels from the radar retrieval are unlikely to be pure drizzle. However, the misclassification of supercooled drizzle as Ice could lead to false identification in MPCs when the lidar signal is fully attenuated, especially in the cloud category Sup → Ice, as the Ice in these clouds could be supercooled drizzle. Supercooled drizzle is reported to be misclassified as ice by several studies (Cober and Isaac, 2012; Zhang et al., 2017, 2018; Villanueva et al., 2021), particularly at temperatures above −10 ∘C.
To further test the uncertainties of misclassified supercooled drizzle, we checked how our results are changed if only clouds with an effective radius of 0 µm < Re < 14 µm at cloud top are investigated. Thus, precipitating clouds should be excluded as Re > 14 µm at cloud top initiates drizzle (Han et al., 1995; Rangno and Hobbs, 2005; Rosenfeld et al., 2012; Freud and Rosenfeld, 2012). However, we only find slight changes with this threshold (compare Fig. 3 with Fig. S2). Further, since MODIS is not able to calculate Re in more than 50 % of the identified MPCs (Fig. S1), and since we would also exclude correctly identified precipitating MPCs, the threshold of Re is not used as a constraint in this study.
The ECMWF CTT is defined as the temperature from ECMWF at CTH. As shown in four examples in Fig. S5, our data set, which is combined with MODIS, also provides the CTT from MODIS. However, we decide to use the ECMWF CTT for two reasons: (1) because it will be more consistent with the DARDAR classification methodology which is also based on the ECMWF temperature and further because CTH between DARDAR and MODIS varies, and (2) because the MODIS CTT exhibits unrealistically large and abrupt changes of more than 10 ∘C within a distance of 2 km (Fig. S5). From a brief visual inspection, it seems to be related to jumps in MODIS CTH which are not detected by the active satellites. Furthermore, we find that the MODIS CTH is often higher than that of DARDAR.
2.3 MCC classification
The MCC regime identifications are developed by applying the supervised neural network algorithm designed in Wood and Hartmann (2006) to C6.1 of the MODIS Aqua LWP swath data. The algorithm uses the power density function and power spectrum of LWP to determine whether swath sub-scenes (256 km × 256 km areas) fall into one of three categories: open MCC, closed MCC, or cellular but disorganized. See Eastman et al. (2021) for more information on the C6.1 MCC identifications. To collocate the MCC data set with the CloudSat track, the haversine distance for all DARDAR data points to the middle of each MCC scene is calculated. The MCC regime of the nearest MCC scene within a radius of 128 km is set for each DARDAR data point.
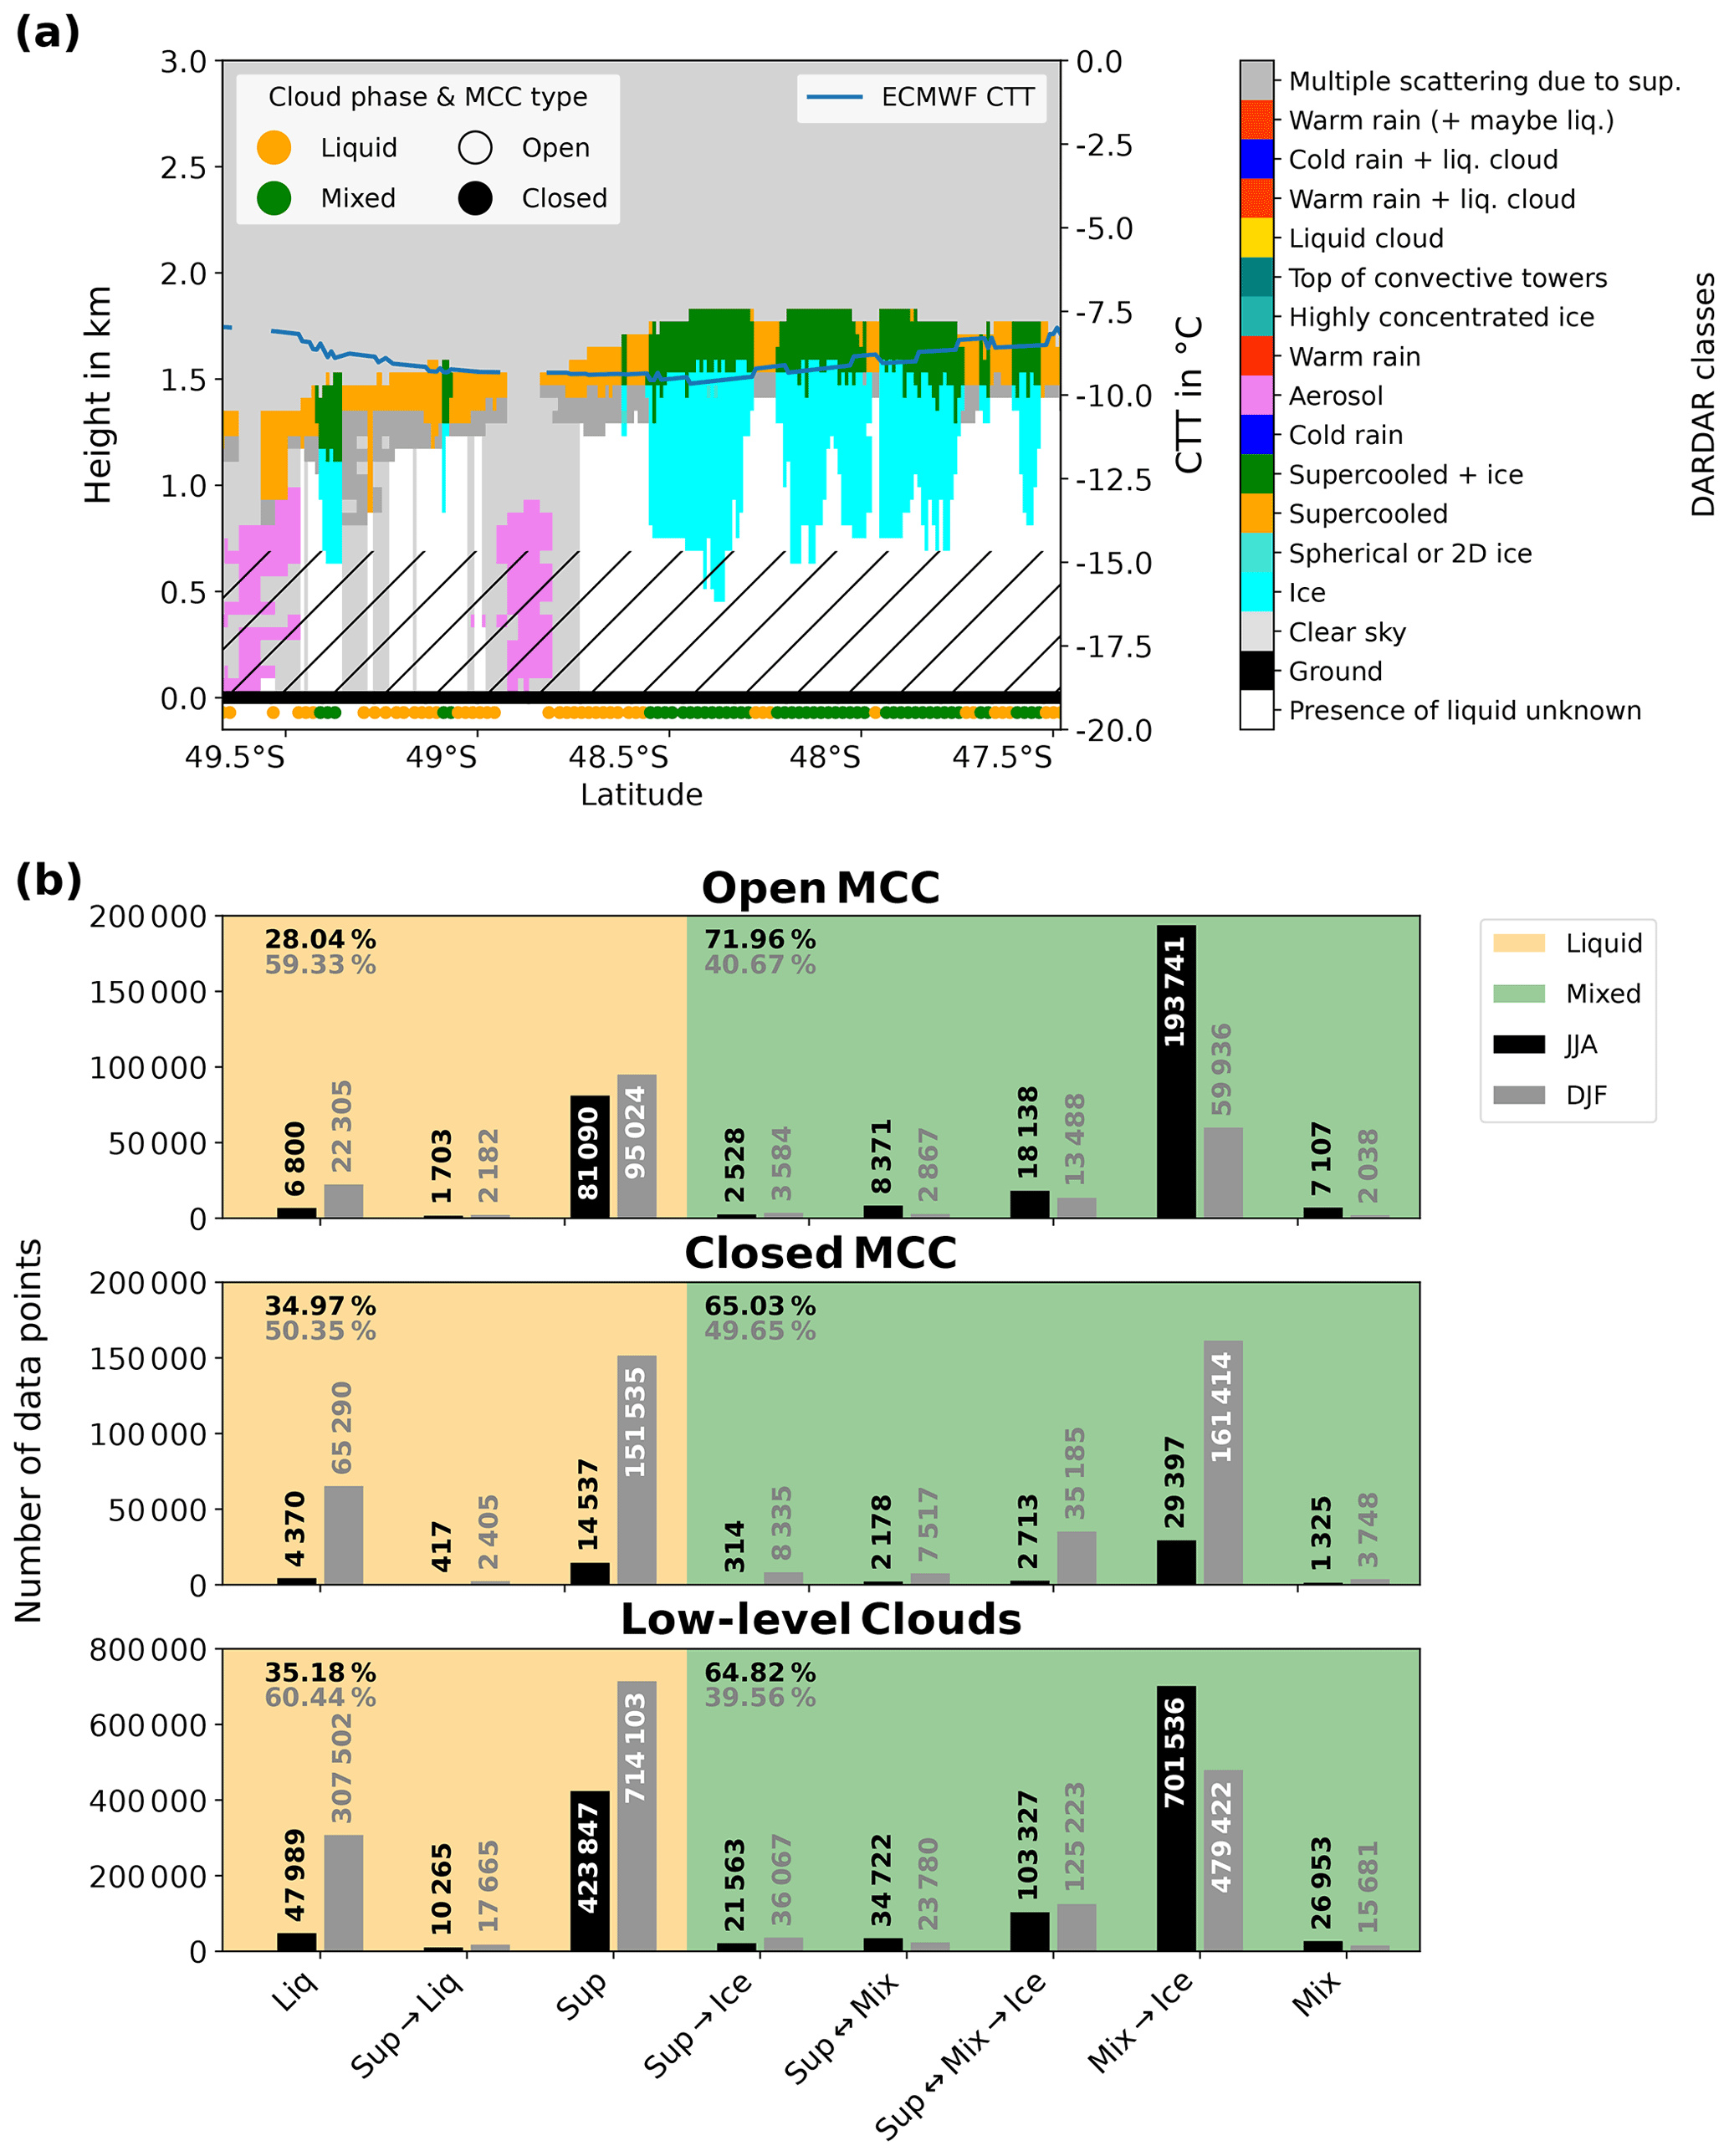
Figure 1(a) Example track of the DARDAR categorization on 1 December 2007. The hatched area displays levels below 720 m. The colored circles below the ground show our vertically integrated cloud-phase classification and the MCC type for every second data point. (b) Histogram of data points of vertically integrated cloud-phase subcategories divided into liquid clouds (orange) and MPCs (green) for JJA (black) and DJF (gray) from 2007–2010. Overall percentage of liquid clouds and MPCs is indicated in each panel separately for JJA (black) and DJF (gray). The layer on top of the next is indicated by “→” and interchangeable layers are indicated by “↔”.
3.1 Stratocumulus climatology
Cloud morphology and reflectivity are vertically integrated quantities of a 2D cloud field. In order to explore the links between morphology, phase, and their combined potential relation to cloud albedo, a vertically integrated categorization for cloud phase was built (Fig. 1) as described in Sect. 2.2. Here, we address the quality and limits of our vertically integrated cloud phase and their seasonal differences. Further, the possible connections between cloud phase and organization are investigated.
According to our cloud-phase classifications, most MPCs are characterized by a Mix cloud layer with ice-phase precipitation below cloud base in the SO, whereas commonly in the SO, many MPCs are described as consisting of a supercooled liquid top with ice precipitation below in satellites studies (e.g., Hu et al., 2010; Morrison et al., 2011; Huang et al., 2012; Ahn et al., 2018; Mace et al., 2021) and also by some ground-based and in situ measurements (e.g., Shupe et al., 2008; Niu et al., 2008; D'Alessandro et al., 2021; McFarquhar et al., 2021). Note that spaceborne studies can be based either on passive instruments which typically only cover the cloud-top phase (Morrison et al., 2011) or on active instruments like lidar or radar (Hu et al., 2010; Huang et al., 2012; Ahn et al., 2018; Mace et al., 2021) which can penetrate layers below cloud top. Recently, the comparison of active satellites from CALIPSO or CloudSat with ground-based or in situ measurements shows that their products underestimate the occurrence of MPCs in the SO (Ahn et al., 2018; Mace et al., 2021). This is further supported by many field studies that observe the presence of ice in the supercooled top layer, even at relatively high CTT (> −5 ∘C) in MPCs (e.g., Huang et al., 2017; Ahn et al., 2017; Lang et al., 2021; Zaremba et al., 2021). The previous version of DARDAR (v1) shows a tendency to detect too many liquid or supercooled liquid pixels in the lower troposphere (Ceccaldi et al., 2013). As the study by Huang et al. (2012) uses the DARDAR v1 product, they find more supercooled liquid-topped MPCs which is likely due to the bias in the DARDAR v1 cloud classification algorithm.
While most of our MPCs (more than 95 %) contain a Mix layer that is determined by both radar (ice) and lidar (supercooled liquid), we also include Sup over Ice clouds in our MPC classification. This category is the most uncertain because the phase distinction between ice and rain is solely based on the wet bulb temperature (frozen < 0 ∘C) once the lidar has saturated and only radar retrieval is available (Delanoë and Hogan, 2008; Ceccaldi et al., 2013). Thus, these clouds could also be pure SLCs with or without freezing rain below cloud base (see Sect. 2.2). The impact of this possible misclassification only marginally affects our MPC classification, as most MPCs contain a Mix cloud layer and further excluding them did not substantially alter our results.
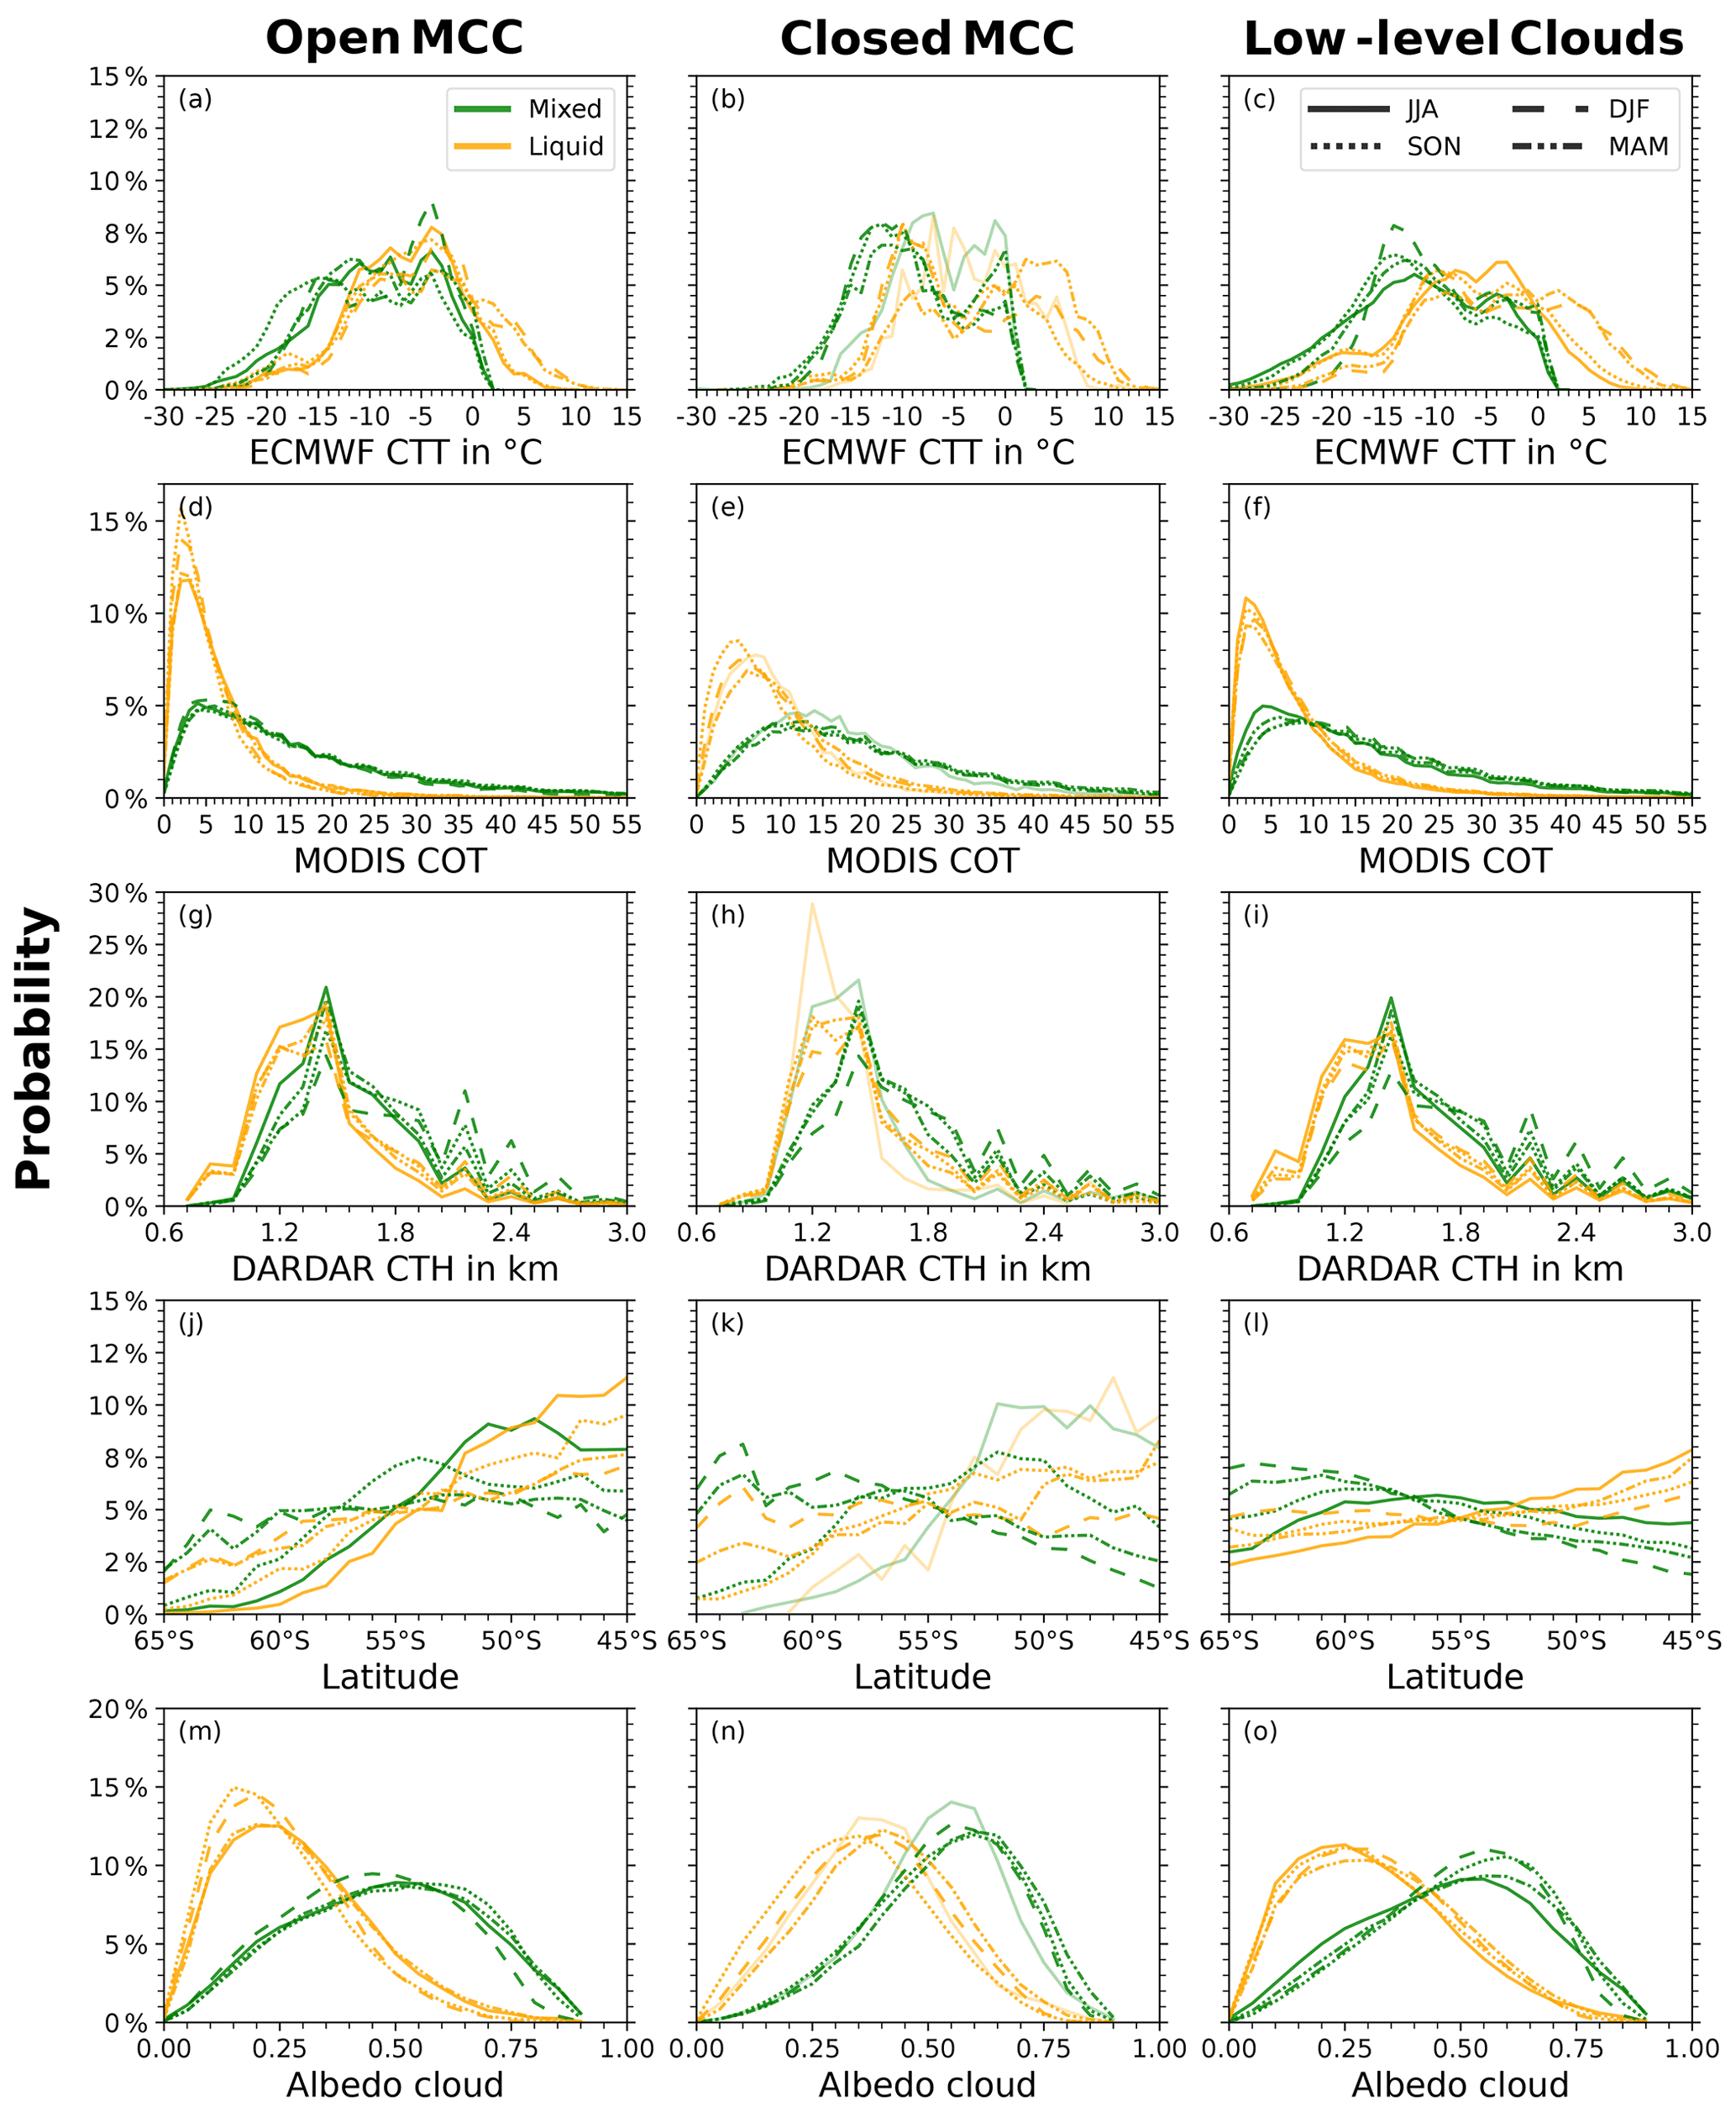
Figure 2Seasonal probability density functions (PDFs) of (a–c) CTT, (d–f) COT, (g–i) CTH, (j–l) latitude, and (m–o) cloud albedo for (left) open MCC, (middle) closed MCC, and (right) low-level clouds with bin width of 1 ∘C, 1, 120 m, 1∘, and 0.05, respectively. The PDFs are normalized for each cloud regime type, phase and season individually. In JJA only 5.1 % of the annual closed MCC clouds occur, and therefore closed MCC clouds in JJA are indicated by more transparent color shading.
Of our low-level liquid clouds, about 90 % in austral winter and 60 % in summer are supercooled at cloud top and almost all of them (99 %) belong to the Sup category, and thus remain supercooled at cloud base in the SO. We identify almost no low-level liquid clouds that show DARDAR rain categories below cloud base (∼ 0.5 %). However, the DARDAR algorithm was not primarily designed to detect precipitation and since the CloudSat radar is contaminated by surface clutter, only heavy and moderate drizzle can be detected at heights below roughly 720 and 860 m, respectively (Marchand et al., 2008). Thus, for many low-level liquid clouds which have a CTH of around 1.2 km (Fig. 2 g–h), light drizzle rates at cloud base could have been missed at lidar saturation which explains the drizzle rates that are too low. If we define precipitating clouds as clouds with an effective radius of Re > 14 µm, then roughly 10 % and 3 % of low-level liquid clouds are precipitating in winter and summer, respectively (Fig. S1a and c). These values are in agreement with Mülmenstädt et al. (2015), who show that the rain probability of liquid clouds at all levels is roughly 10 % at 45∘ S and 3 % at 60∘ S. Though they use DARDAR v1 to identify the cloud phase, they use the 2C-PRECIP-COLUMN product based on retrievals from CloudSat to calculate rain probability. Further, this latitudinal gradient in precipitation is also reported by Mace et al. (2021), who investigate MPCs with satellite and ground-based measurements. They also show that about 33 % of MPCs in the SO produce supercooled precipitation. We find similar values of 30 % (winter) and 40 % (summer) of MPCs that have Re > 14 µm (Fig. S1a and c). Additionally, we find that on average, low-level liquid clouds are 57 % optically thinner than their mixed-phase counterparts calculated independent of season, and thus are more unlikely to contain sufficient water content to generate precipitation. Since most liquid clouds are optically thin and not precipitating, especially in summer, this could either hint towards a mixed-phase detection bias in DARDAR (which we find unlikely as discussed above) or suggest that most optically thicker SLCs generate ice and become MPCs. Interestingly, liquid (and supercooled liquid) closed MCC clouds are optically thicker than open and low-level clouds. This could indicate a potential link between cloud phase and cloud morphology, however, as discussed below, we find no further evidence for this link.
To further investigate the quality of the cloud-phase classification, we also examine the CTT range. Figure 2a–c display the probability density functions (PDFs) of CTT, which are normalized individually for each cloud phase and season. The normalization is also performed separately within all panels. In low-level clouds, the CTT range spans from −30 to 15 ∘C in liquid clouds and from −30 to 3 ∘C in MPCs in the SO (Fig. 2a–c). We note that the reason for the occurrence of MPCs above 0 ∘C is related to the fact that in the radar mask of the DARDAR v2 algorithm, the wet-bulb temperature of 0 ∘C is used as a threshold (Delanoë and Hogan, 2010; Ceccaldi et al., 2013). Seasonal changes in the CTT range are mainly found in the maximum temperature of liquid clouds above 0 ∘C. These temperature ranges of MPCs and liquid clouds are in agreement with other satellite studies of the SO (Morrison et al., 2011; Mason et al., 2014). The low-level MPCs occur most often at around −15 ∘C. This peak corresponds to the temperature of the growth habit of dendritic ice crystals and secondary ice processes from ice–ice collisional breakup (Riley and Mapes, 2009; Mignani et al., 2019).
Overall, we observe a seasonal shift from predominantly MPCs (∼ 65 %) during austral winter to predominantly liquid clouds (∼ 60 %) during austral summer (Fig. 1). Listowski et al. (2019) also use the DARDAR v2 product and exhibit in their Fig. 8 that during both austral winter and summer, low-level liquid clouds occur more often than MPCs in the SO. However, in their analysis they include low-level clouds in the range of surface cluttering which leads to limitations in identifying ice at those heights, and thus could lead to a bias towards liquid clouds. If we visually confine the analysis of Listowski et al. (2019) to heights above 780 m in austral winter, the occurrence of MPCs is more pronounced. Thus, our findings are consistent with theirs if clouds with higher uncertainty in cloud-phase distinction are excluded.
In addition to the seasonal cycle in the cloud phase, we observe a seasonal cycle in the MCC regime. As previous studies show, the predominant MCC regime shifts from open cell MCC clouds during austral winter to closed cell MCC clouds during summer (Muhlbauer et al., 2014; McCoy et al., 2017). Open cell MCC clouds are found to be relatively homogeneously across the year with the lowest rate of occurrence in austral summer (16 %) and the highest rate of occurrence in winter (25.4 %). Meanwhile, closed cell MCC clouds display a strong seasonal shift. McCoy et al. (2017) explained this seasonal shift in MCC occurrence with the varying strength and frequency of occurrence of marine cold-air outbreaks. Merely 5.1 % of all closed cell MCC clouds are found in austral winter while 40.5 % of all closed cell MCC clouds occur in summer. This results in fewer than 100 clouds per 1 ∘C CTT bin in some bins during austral winter. Thus, if the austral winter closed MCC clouds are further subdivided by other variables e.g., CTT, CTH, or Lat, their climatology might not yield sufficient data points for a reliable statistical analysis, indicated by more transparent colors in that panel or season in our figures (Figs. 2 b, e, h, k, n, 3, 4, and 5).
In general, both MCC regimes exhibit a similar CTT distribution (Fig. 2a and b). Mixed-phase MCC clouds feature one peak at around −4 ∘C in all seasons, especially strong during austral summer, and a second peak at roughly −15 ∘C which is more pronounced in closed cells. The first peak falls in the temperature range (−3 to −8 ∘C) of secondary ice production by the Hallet–Mossop process (Hallett and Mossop, 1974). While the second peak at −15 ∘C is found in many ice formation studies (Magono, 1962; Takahashi et al., 1995; Libbrecht, 2005; Mignani et al., 2019; Sullivan et al., 2018; Silber et al., 2021b), multiple ice processes can occur at this temperature range. This second peak will be discussed extensively in Sect. 3.2. We note that in MCC clouds the CTT range only extends down from about −20 to −25 ∘C which is likely caused by the condition of the MCC algorithm that cloud tops need to be within 30 ∘C of the surface temperature (McCoy et al., 2017). Further, we only identify small cloud-phase seasonal changes in open and closed MCC clouds compared to the overall low-level cloud statistic (Fig. 2c). During austral winter we see slightly more open MPCs than low-level MPCs, and during austral summer more closed MPCs.
We observe that the seasonal decrease in cloud occurrence south of 60∘ S is stronger in MPCs than in liquid clouds (Fig. 2l). This is consistent with Listowski et al. (2019), who also find that the occurrence of MPCs is reduced to a larger degree than that of liquid clouds. This behavior is likely related to seasonal differences in sea-ice extent (not shown). This connection between the sea-ice edge and low-level cloud fraction is also found in other studies (Taylor et al., 2015; Wall et al., 2017; Morrison et al., 2018). Further, the latitudinal difference in cloud organization shows that the decrease of cloud occurrence in both MPCs and liquid clouds is more substantial in the open-cell regime than in low-level clouds (Fig. 2j). This might also be impacted by the sea-ice extent as open MCC clouds are correlated with marine cold-air outbreaks (McCoy et al., 2017) which shift equatorward during austral winter along with the sea-ice edge. During austral winter we observe a detection limit in the MCC regimes south of 60∘ S, as the algorithm is based on the passive MODIS Aqua satellite instrument which depends on solar insolation for measurements. However, we do not find it likely that this limit impacts our hypothesis since the reduction of cloud occurrence at latitudes closer to the pole also appears during austral spring which is not impacted by this detection limit.
Overall, we are confident that our cloud-phase classification of MPCs contains ice, therefore we can trust our phase classification. Further, the climatology of stratocumuli in the SO as characterized by DARDAR v2 did not display any evidence that organization and cloud phase are interlinked in the full climatology, although we observe that closed cells remain in the SLC regime at higher COT than observed for open cell and low-level clouds.
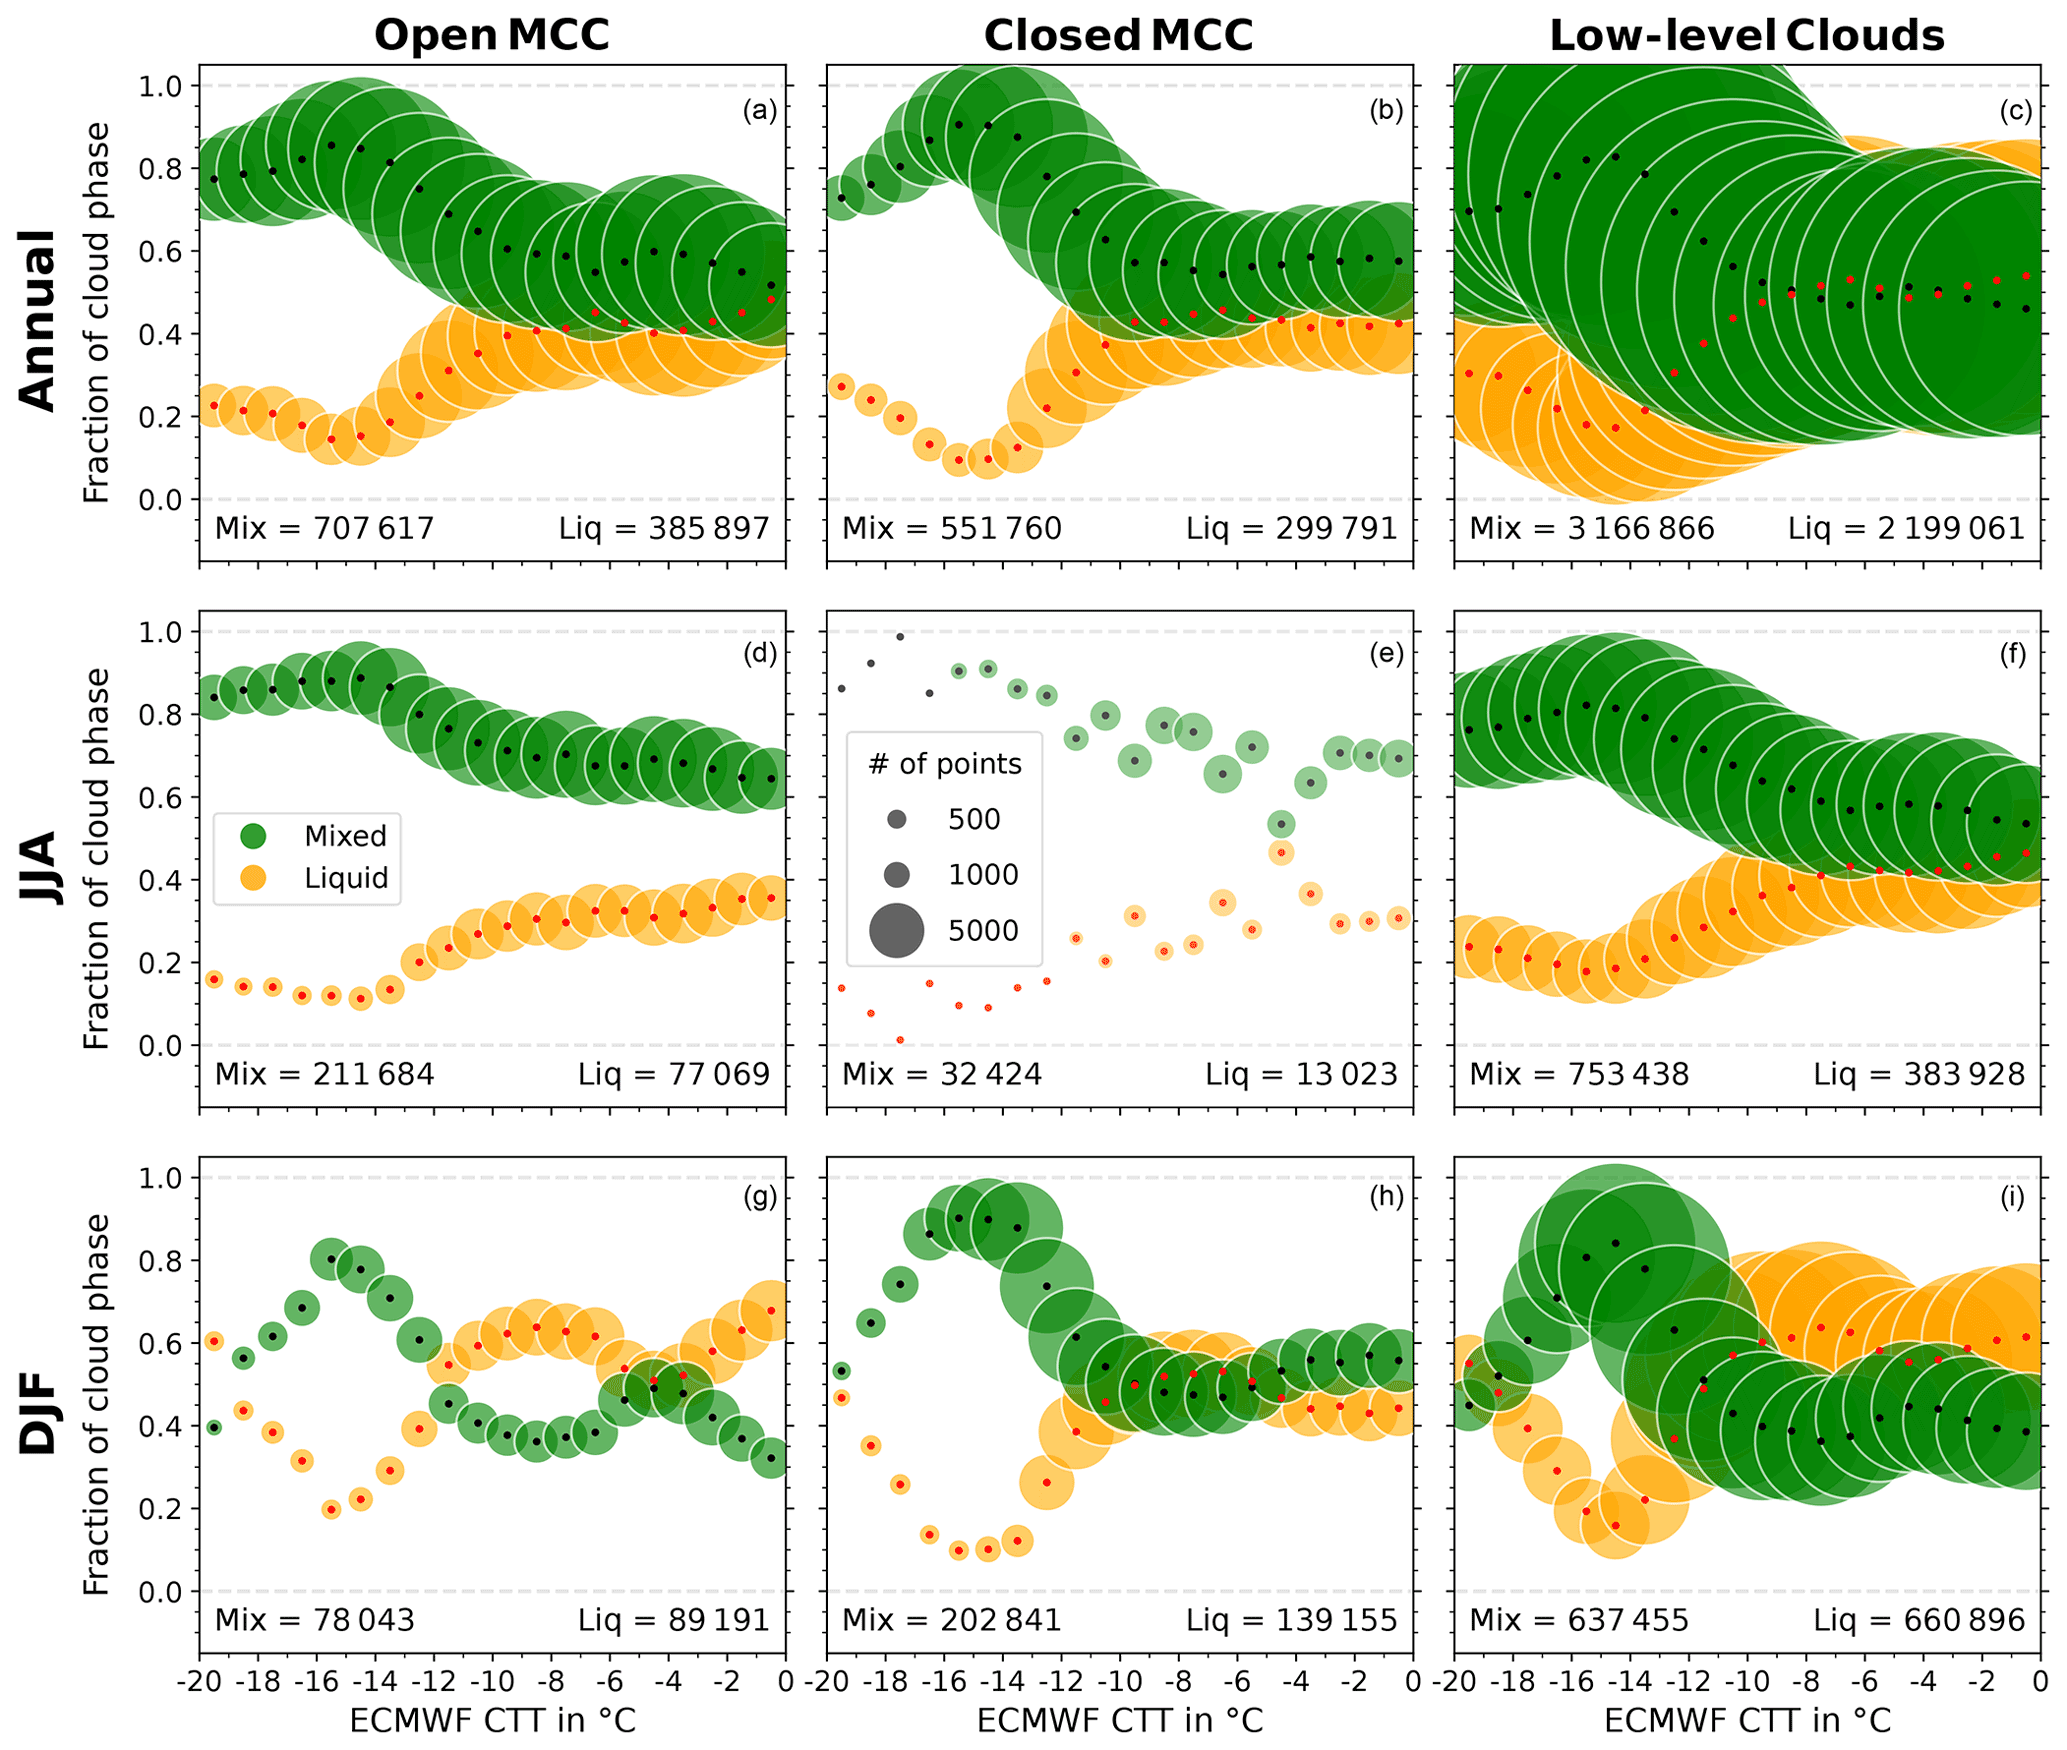
Figure 3Supercooled liquid and mixed fraction binned by CTT from −20 to 0 ∘C with a bin width of 1 ∘C (2007–2010) for (a–c) all seasons, (d–f) austral winter, and (g–i) austral summer in (a, d, g) open MCC, (b, e, h) closed MCC, and (c, f, i) low-level clouds. Since only 5.1 % of the annual closed MCC clouds occur in JJA, the panel is displayed in more transparent color shading.
3.2 Link of freezing behavior and cloud phase
In this section, we analyze whether different predictors of ice occurrence in stratocumuli display a varied behavior in differently organized clouds. From these analyses, we can determine whether there are statistical relationships that suggest that individual freezing processes vary in their effectiveness in clouds characterized by different cloud dynamics.
Here, we analyze the cloud-phase fraction between MPCs and SLCs. Their cloud-phase fractions (mixed fraction and supercooled liquid fraction) are defined as the number of MPC or SLC pixels divided by their sum. The cloud-phase dependence on CTT has already been studied by several other publications to find a relationship between ice formation and CTT (e.g., Bühl et al., 2013; Zhang et al., 2014, 2015; Silber et al., 2021a, b). Therefore, we restrict our analysis for the rest of this study to a CTT range from −20 to 0 ∘C. We choose this temperature range as most clouds in the open and closed MCC regime have CTTs above −20 ∘C. This restriction does not affect the overall distribution of MPCs and liquid clouds, except for the fact that we remove all pure liquid clouds (Fig. S1). Therefore, this analysis is restricted to MPCs and clouds containing a supercooled liquid layer or only supercooled liquid, referred to as SLCs.
Overall, the mixed fraction is much higher in austral winter at the same CTT than in summer for all three investigated cloud regimes (Fig. 3). This seasonal increase in mixed fraction during austral winter could either be caused dynamically or due to increased ice-nucleating particle (INP) availability at colder temperatures. An increase in surface fluxes or higher surface wind speeds in austral winter could indicate a dynamic reason. However, we did not find substantial seasonal changes in either SST or surface wind speed (Table 1). As described in Sect. 3.1, we find an equatorward shift of MPCs during austral winter (Fig. 2, Table 1). However, we find that the mixed fraction at the same CTT is independent of latitude (Fig. 4). Further, we find that the same CTTs are reached at lower CTHs in austral winter than in summer (Figs. S3 and S4). Thus, we hypothesize that the vertical distribution of INPs might influence the seasonal difference in mixed fractions. McCluskey et al. (2019) investigate the simulated vertical INP distribution based on observational data from the Clouds, Aerosols, Precipitation, Radiation, and atmospherIc Composition Over the southeRN ocean campaign (CAPRICORN) and show that, independent of the season, the INP concentration in the SO is higher closer to the surface because the main source of INPs is sea spray aerosols (Burrows et al., 2013; DeMott et al., 2016; Vergara-Temprado et al., 2017; Huang et al., 2021a). Further, Fig. 4 of McCluskey et al. (2019) shows that the INP concentration is slightly lower (∼ 35 % at the surface, ∼ 55 % at around 3 km) at all heights in austral winter than in summer. Nevertheless, we find a higher mixed fraction in MCC and all low clouds for CTTs above −12 ∘C at CTHs between 1.4 and 2.3 km, which decreases with higher CTHs (Fig. S4). Surprisingly, this behavior is not observed during austral summer. Therefore, we suggest that the increase in mixed fraction in austral winter is related to the higher mixed fraction at CTHs between 1.4 and 2.3 km. However, the cause of this effect remains unclear as higher INP concentration closer to the surface is also found in austral summer (McCluskey et al., 2019) and does not show a higher mixed fraction at lower CTHs.
In austral summer, the mixed fraction remains below 0.5 for temperatures higher than −12 ∘C, with a secondary peak at around −5 ∘C in open MCC and all low-level clouds. Surprisingly, this peak is not observed in closed MCC clouds. This could potentially be related to a detection bias close to 0 ∘C, as the mixed fraction at temperatures above −10 ∘C is lower for clouds with 0 µm < Re < 14 µm (Fig. S2). However, even for clouds with 0 µm < Re < 14 µm, this secondary peak is barely detectable and much weaker than in open MCC and all low-level clouds. This secondary peak in open MCC and all low-level clouds in the mixed fraction occurs at temperatures at which the secondary ice production by the Hallet–Mossop process is especially active (Hallett and Mossop, 1974). A recent study by Silber et al. (2021b) in the Arctic also shows that the liquid water occurrence in clouds declines at roughly −6 and −15 ∘C. They conclude that this is caused by a more efficient vapor growth of ice at these temperatures. Moreover, their second minimum at −15 ∘C corresponds to the strong increase in the mixed fraction from −12 to −16 ∘C that we find for all cloud regimes in austral summer and the annual mean. This increase occurs across all latitudes in the SO (Fig. 4) and is also seen in austral winter, although the increase is not as pronounced due to the overall higher mixed fraction in winter. This peak in ice formation at roughly −15 ∘C is found in several studies (Magono, 1962; Takahashi et al., 1995; Libbrecht, 2005; Mignani et al., 2019; Sullivan et al., 2018; Silber et al., 2021b), although there are different reasons for this increase in the number of ice crystals. Takahashi et al. (1995) find that ice–ice collisional breakup (secondary ice formation) favors this temperature range at roughly −15 ∘C. Further, Mignani et al. (2019) investigate whether an ice crystal that grows at temperatures between −12 and −17 ∘C forms because of primary or secondary ice formation. They find that only every eighth ice crystal contains an INP, and thus secondary ice formation is more important at this temperature range. Another possible way of ice formation at this temperature range would be droplet shattering. However, a modeling study by Sullivan et al. (2018) shows that droplet shattering seems to play only a minor role for clouds with a cloud-base temperature below 12 ∘C (285 K) since the droplets cannot grow to a sufficient size to shatter. As our data set does not include INP information, we cannot determine which ice processes are causing the mixed fraction at −15 ∘C to increase.
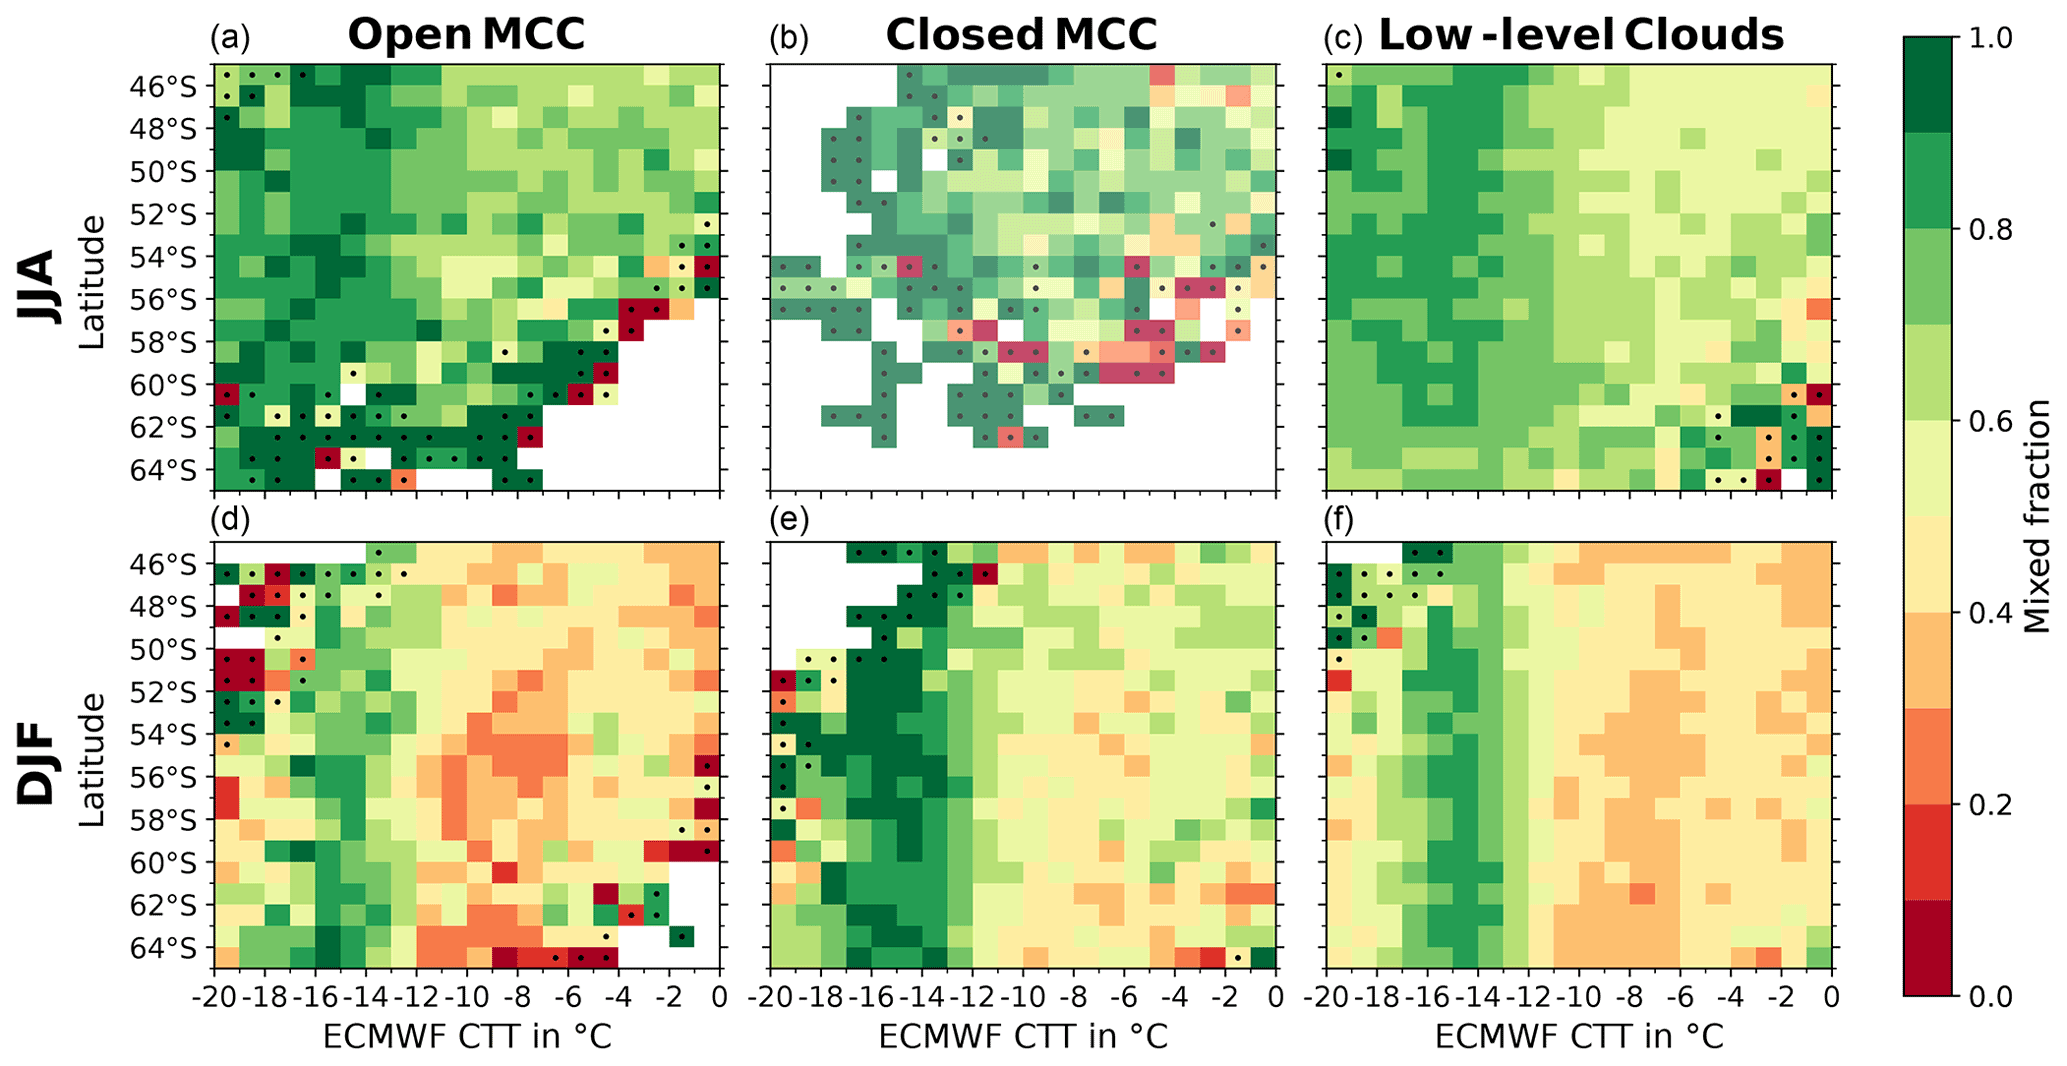
Figure 42D histograms of mixed fraction against CTT and latitude for (a, d) open MCC, (b, e) closed MCC, and (c, f) low-level clouds in austral (a–c) winter and (d–f) summer. Dotted bins indicate bins with less than 50 data points. Since only 5.1 % of the annual closed MCC clouds occur in JJA, the panel is displayed in more transparent color shading.
At temperatures below −16 ∘C, there is a strong decrease in mixed fraction in all cloud regimes during austral summer that is less pronounced in the annual mean and austral winter. We suggest that the cause for the reduction in mixed fraction is due to a rapid glaciation of MPCs at these temperatures due to updraft or moisture limitation. A strong increase in fully glaciated clouds at these temperatures is found by D'Alessandro et al. (2021), who base their study on data from the Southern Ocean Clouds, Radiation, Aerosol Transport Experimental Study (SOCRATES) and cover the time period from 15 January to 28 February 2018. Figure 4 of D'Alessandro et al. (2021) shows that at roughly −17 ∘C the relative frequency of occurrence of MPCs and SLCs decreases along with temperature, whereas the frequency of ice clouds increases rapidly at this temperature. Further, a direct comparison of SOCRATES flight observations from D'Alessandro et al. (2021) with our mixed fraction in Fig. S7 shows a similar trend across the CTT range in low-level clouds during January and February, although our mixed fraction shows higher values than the in-cloud flight measurements. Thus, this supports the rapid glaciation of MPCs at temperatures below −16 ∘C as soon as ice is formed via the Wegener–Bergeron–Findeisen process. D'Alessandro et al. (2021) suggest that this is caused by the activation of INPs at these temperatures. On the other hand, we find it unlikely that CTH-dependent INP limitation is the primary cause for the decrease in mixed fraction below −16 ∘C at high CTHs because it seems to be unaffected by CTH (Fig. S4). Our analysis shows that the mixed fraction during austral winter is not decreasing as strongly as in summer. Since a temperature-dependent activation of INP should not change with season, this cannot fully explain the seasonal differences we observe. Therefore, we do not think this is a result of different INP activations within these clouds, but we propose that the supercooled liquid water is depleted due to an increased decoupling of the marine boundary layer.
Table 1Geometric mean and standard deviation factor of different cloud properties during austral winter and summer in the CTT range from −20 to 0 ∘C. The mean values are calculated separately for open MCC, closed MCC, and low-level clouds which are further subdivided into MPCs and SLCs. [The geometric standard deviation factor is shown in brackets and should be interpreted as a range from “geomean/geostd” to “geomean*geostd”].

In agreement with the findings of Sect. 3.1, the mixed fraction of closed MCC clouds is higher than that of open MCC clouds. Abel et al. (2017) show that transitions between closed and open cells in the Northern Hemisphere extratropics may be driven by precipitation as opposed to a pure boundary layer deepening. This idea is further supported by findings from Tornow et al. (2021), who introduce the notion of preconditioning by ice-phase processes, which accelerate the precipitation-driven transition. Early onset of precipitation by riming processes and subsequent sublimation trigger an earlier boundary layer decoupling and preconditions the boundary layer for an earlier transition. If preconditioning would be a dominant process in stabilizing the sub-cloud layer and forcing closed-to-open transitions, one would expect this to manifest in phase statistics across the two morphological regimes. However, mixed fraction curves (Fig. 3) and phase statistics show little changes with respect to cloud morphology. Furthermore, any differences detected are small in comparison to seasonal changes in cloud phase, which are driven by other factors than mesoscale organization. Thus, a prevalence of open MCC clouds towards MPCs, which would be consistent with accelerated transitions from closed-to-open MCC clouds through precipitation, is not found.
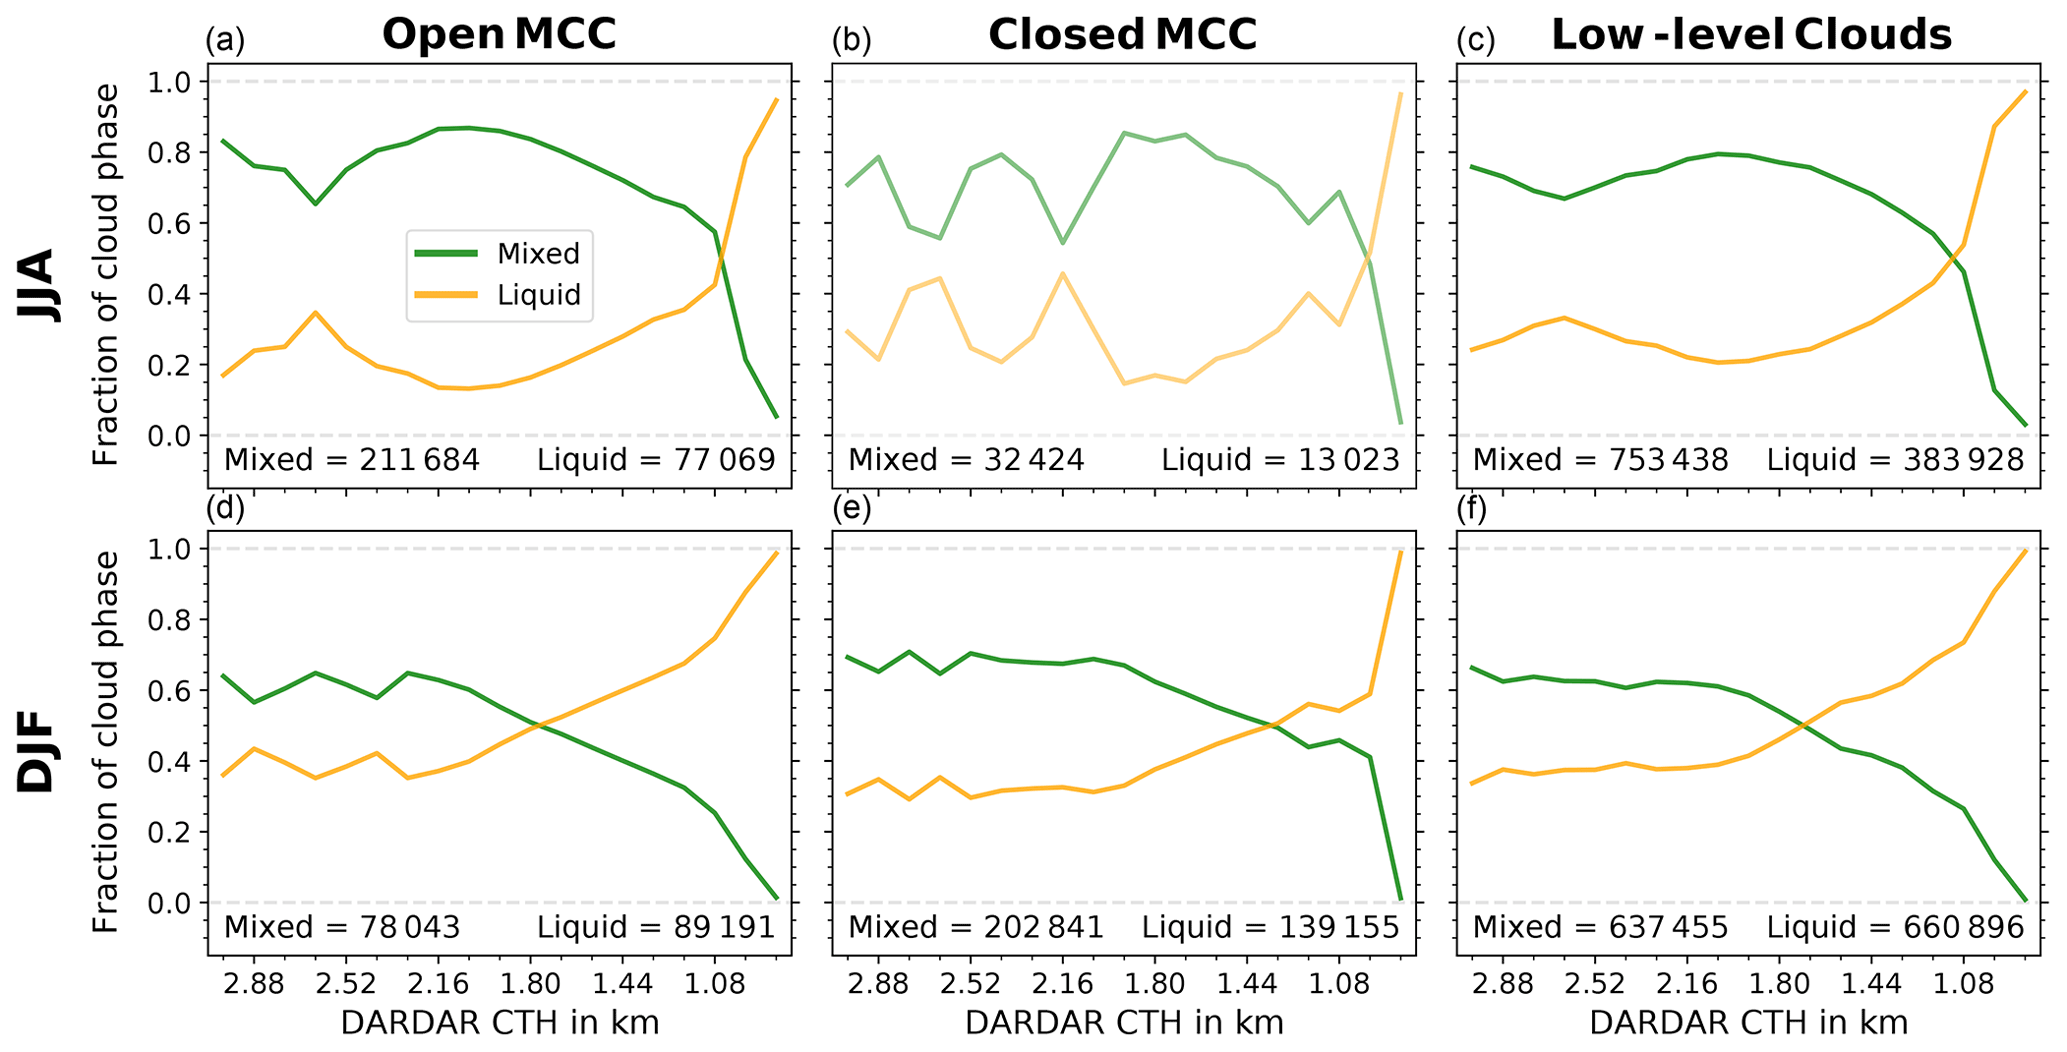
Figure 5Supercooled liquid and mixed fraction binned by CTH from 0.78 to 3 km with a bin width of 0.12 km (2007–2010) during austral (a–c) winter and (d–f) summer for (a, d) open MCC, (b, e) closed MCC, and (c, f) low-level clouds. Since only 5.1 % of the annual closed MCC clouds occur in JJA, the panel is displayed in more transparent color shading.
We also investigate the dependence of mixed-phase occurrence on CTH. Typically, the cloud depth is a better indicator for thermodynamic or dynamic changes in the boundary layer or radiative changes in stratocumulus clouds than the CTH (Wood et al., 2008; Bretherton, 2015). However, even though we derive a liquid CBH to reduce the contamination of surface clutter from the radar, this CBH is highly biased in the distance from CTH because the lidar signal will be fully attenuated in clouds with a COT greater than 3.5 (Delanoë and Hogan, 2008). Thus, the geometrical cloud depth would also be biased as most clouds have a COT greater than 3.5 (Fig. 2d–f). Nevertheless, the CTH might still give some insight into surface forcing and the mixing strength in the boundary layer (Bretherton et al., 2010).
In general, we observe that the mixed fraction increases with CTH from roughly 0 to around 0.6 to 0.8 in all cloud regimes and during both austral winter and summer (Fig. 5). We find seasonal differences in the height at which the mixed fraction surpasses the supercooled liquid fraction. This height is lower during austral winter. As clouds with CTHs below 1 km can only have a small vertical extent, this could potentially lead to a bias towards SLC occurrence at CTHs below 1 km because thicker clouds tend to form ice as discussed in Sect. 3.1. However, this is the same for all seasons and cloud morphologies. Therefore, differences across seasons and between open and closed cells can still be interpreted. Furthermore, we show that MPCs appear at higher CTHs than SLCs in all cloud regimes (Table 1). This is in agreement with a field campaign study in the Arctic that shows that MPCs tend to have higher CTHs than SLCs (Achtert et al., 2020). The mean CTHs between open and closed MCC clouds are similar during austral summer, whereas during austral winter, at least for MPCs, we see higher CTHs in open cells. Many studies show that there are CTH differences between the two morphological regimes with higher CTHs in open MCC clouds (Muhlbauer et al., 2014; Glassmeier and Feingold, 2017; Jensen et al., 2021). A study using ground-based and satellite observations in the eastern North Atlantic shows that closed MCC clouds have a lower mean CTH (Jensen et al., 2021). Moreover, Glassmeier and Feingold (2017) demonstrate in a large-eddy simulation that open cells favor deeper boundary layer heights and thus also higher CTHs. In global data, Muhlbauer et al. (2014) reveal that the mean CTH in open MCC clouds is about 100 m higher than in closed cells, which is similar to what we see in MPCs during austral winter. However, they also investigate the mean CTH in SO which did not show a substantial mean CTH difference between open and closed cells.
Deeper boundary layers associated with higher CTHs are often decoupled and favor conditional instabilities associated with stronger vertical updrafts, which in turn favor ice growth and potentially ice formation through secondary ice processes. This is shown by a SOCRATES study from Wang et al. (2020), who investigate generating cells in the SO and show that within these generating cells, ice particles occur more often and are also larger than outside. Thus, this favors ice precipitation inside the updraft cores. Further, they still find substantial amounts of ice outside the generating cells, suggesting that turbulent mixing in the boundary layer is important for reducing differences between the inside and outside of updrafts. The stronger precipitation within updrafts is also confirmed by large-eddy simulations (e.g., Keeler et al., 2016; Zhou et al., 2018; Young et al., 2018; Eirund et al., 2019b). Additionally, the updraft strength can vary, depending on the organizational regime. Wood et al. (2011) analyze the updraft strength in MCC regimes in a case study over the Southeast Pacific and show that while open cells can reach higher updraft velocities, closed cells also exhibit moderate updrafts. Apart from the updrafts, the CTH and MPC occurrence also depends on the sources of mixing in the stratocumulus-topped boundary layer. Therefore, we test for indicators of surface-generated turbulence such as SST and ΔT (difference between SST and 2 m air temperature). However, neither variable displayed the expected trend (not shown). Thus, if there is a correlation between ice occurrence and vertical acceleration, it does not seem to be driven by surface fluxes (Fig. S6). We cannot evaluate the importance of cloud-top-generated turbulence and cloud-scale overturning circulations for CTHs in SO stratocumuli due to data limitations. However, Lang et al. (2022) show that cloud-top-generated mixing, especially in closed MCC, is affecting the frequency of occurrence during the diurnal cycle. Further, they find that wind shear due to the relatively large climatological near-surface winds in the SO may also be a stronger generator of boundary layer turbulence than in other regions. Overall, this could suggest that the mechanisms of mixing (turbulence and circulation) may play a larger role in CTH than previously thought (McCoy et al., 2017).
In summary, our analysis shows that, across regimes of varied subsidence, clouds that form in likely decoupled layers requiring moderate updraft cloud cores to be maintained, are more likely to sustain ice formation in mixed-phase stratocumuli. Our analysis of the different freezing behaviors across cloud morphologies further supports our climatological findings which show that the sustained ice formation in MPC stratocumuli does not primarily depend on cloud morphology, but is constrained by other environmental factors.
3.3 Relationship between cloud phase, cloud morphology, and cloud albedo
Here, we examine how cloud phase and cloud morphology may change the cloud albedo in the SO. The cloud albedo physically depends on LWP and cloud droplet number concentration (in liquid clouds). Variations of cloud phase, cloud fraction, and different organizational regimes can alter the LWP and the cloud droplet number concentration and hence, impact cloud albedo and COT. For the same total water content, liquid clouds typically have a higher cloud albedo than ice clouds, because liquid water droplets are smaller than ice crystals, and thus reflect more incoming solar radiation due to their greater surface area. Thus, the cloud albedo in MPCs varies, depending on the phase partitioning of supercooled liquid and ice (McCoy et al., 2014a, b). Further, any optically thick cloud (COT > 10) typically contains ice, which suggests that clouds with a substantial LWP can sustain ice formation. Consistently, we find that the LWP and COT of MPCs are much higher than those of SLCs, independent of organizational regime and season (Table 1). This is in agreement with other studies, which also show that supercooled liquid layers in MPCs are much thicker than in pure (supercooled) liquid clouds (Shupe et al., 2006; Achtert et al., 2020). During austral winter, both mixed-phase MCC clouds have a similar LWP, whereas during austral summer, open MPCs have a lower LWP than mixed-phase closed cells. We should note that the MODIS LWP algorithm used here does not distinguish between MPCs and liquid clouds, and retrieves the LWP as based on a liquid cloud. Therefore, the LWP in MPCs likely overestimates the true LWP. This can lead to an overestimated LWP of about 15 % for stratiform MPCs (Khanal and Wang, 2018).
Besides the cloud phase, cloud fraction and cloud morphology also influence the cloud albedo. Loeb et al. (2007) determine that the variability of all-sky albedo from the Clouds and the Earth's Radiant Energy System (CERES) is dominantly controlled by variations in cloud fraction. The cloud fraction of closed MCC regimes is typically higher than in open MCC regimes (Muhlbauer et al., 2014). Moreover, McCoy et al. (2017) investigate differences in the cloud fraction albedo relationship between open and closed MCC clouds, and show that in general, closed MCC clouds have a higher albedo. Additionally, they exhibit that even for the same cloud fraction, the cloud albedo of closed MCC clouds is about 0.05 higher on average than the albedo of open MCC clouds. Our analysis of in-cloud albedo confirms their findings that closed cells are more reflective than open cells (Table 1). In addition, we see that in-cloud albedo differences between closed and open cells are even stronger in SLCs (JJA: 0.09, DJF: 0.13) compared to MPCs (JJA: 0.07, DJF: 0.10). This is caused by stronger differences between optically thin (COT < 10) open and closed cells in SLCs compared to MPCs. While roughly 80 % of the SLCs are optically thin in open cells, in closed cells about 45 % have COT values larger than 10. Differences in in-cloud albedo ranging between 0.07 to 0.13 correspond to a cloud-radiative effect of 21 to 39 W m−2 when assuming typical solar insolation of 300 W m−2 in the SO. Thus, a reduction in ice-phase occurrence in a warming climate is likely to impact open cell clouds more strongly than closed cell clouds. Changes in clouds with larger optical depth have a weaker impact on cloud scene albedo. Further, we find a considerable seasonal change in in-cloud albedo in open cells, which is not observed in closed cells. This is even stronger in open MPCs than in SLCs. This seasonal decrease of the in-cloud albedo in open clouds is correlated with a strong decrease in LWP from austral winter to summer.
To date, only a few studies have investigated the potential link between cloud organization and cloud phase in stratocumuli (Abel et al., 2017; Eirund et al., 2019a; Tornow et al., 2021). All of them are based on field campaigns in the Northern Hemisphere which observe particular cases and extensively analyze their processes with numerical models. Thus, in this study, we explore whether this link between cloud phase and morphology can also be found in SO cloud statistics obtained from DARDAR.
An advantage of using remote-sensing data is that they cover a broad variety of cases and have almost global coverage. The spatial coverage of passive satellites would be even greater than that of active satellites. However, the cloud phase in passive instruments can only be evaluated at cloud top and often show a supercooled layer there (e.g., Hu et al., 2010). Thus, passive satellite retrievals potentially miss many MPCs which form ice below the detected supercooled layer. To partially circumvent this issue, we use active instruments to determine the cloud phase. An important part of this study is to test the quality of our cloud classification. In agreement with previous studies, our vertically integrated cloud-phase classification based on the DARDAR v2 cloud classification seems to provide a good representation of MPCs in the SO as compared to previous assessments (Huang et al., 2017; Ahn et al., 2017; Lang et al., 2021; Zaremba et al., 2021). The greatest uncertainty in MPC classification is introduced by the Sup over Ice subcategory, as ice and rain are merely classified based on temperature once the lidar signal is fully attenuated. As a result, some of these clouds could be SLCs with supercooled rain below the cloud base, instead of ice. However, as most MPCs classified in this study include a Mix layer in their vertical composition, which can only be determined if both lidar and radar retrievals are available simultaneously, the majority (> 95 %) of all classified MPCs are not subject to this potential misclassification. Nevertheless, our cloud statistics may not be representative of all clouds, since many shallow clouds form with cloud tops below 780 m, especially during austral winter. Due to the rapid saturation of lidar within the liquid layer and surface clutter issues with radar, a phase classification of these very low clouds based on remote sensing is not possible. However, when imposing this restriction the seasonal cycle of MCC regimes is similar to that of the full SO climatology (Muhlbauer et al., 2014; McCoy et al., 2017), and thus absence of the very low clouds (< 780 m) should not influence our conclusions regarding the link between cloud phase and organization.
We find that all optically thick low-level clouds tend to generate ice formation, as all detected liquid clouds and SLCs are mostly (> 80 %) optically thin (COT < 10). We therefore hypothesize that any optically thicker supercooled cloud provides a favorable environment for ice occurrences leading to a phase conversion from SLC to MPC. Although we do not find any evidence for a potential link between cloud phase and cloud morphology in the full climatology, we observe that closed cells remain in the SLC regime at higher COT than observed for open cell and low-level clouds.
The observed relationship between phase occurrences and CTT suggests that while CTT may be a strong functional relationship for the nucleation rate of INPs and thus the formation of new primary ice crystals, it does not display a strong relationship with cloud phase overall. Mignani et al. (2019) show that secondary ice processes are likely the key players in MPCs at a temperature range from −12 to −17 ∘C compared to primary ice formation and droplet shattering. This is further supported by Huang et al. (2021b), who use SOCRATES observations to show that secondary ice processes are important for the ice formation in SLCs. However, depositional growth of ice crystals also accelerates within this regime. A final conclusion regarding the process responsible for the increase in the occurence of MPCs at this temperature regime could not be drawn based on this data set alone, and requires further investigation.
A further comparison of SOCRATES flight observations from D'Alessandro et al. (2021) with our mixed fraction shows a similar distribution across the CTT range in low-level clouds during January and February. However, our mixed fraction shows higher values than the in-cloud flight measurements (Fig. S7). A reason for the observed differences may be that the mixed phase is underestimated due to a detection limit of small ice particles (< 50 µm) by the instruments as discussed by D'Alessandro et al. (2021). Furthermore, their cloud phase is sampled every second, which translates to a spatial resolution of roughly 150 m, depending on the velocity of the aircraft. In comparison, our phase classification has a 1.1 km resolution, thus, about seven of their cloud-phase samples would be observed as one phase in our classification. This could potentially explain the higher number of mixed-phase cases in this study. D'Alessandro et al. (2021) also show that mixed-phase transects which consist of 20 cloud-phase samples are likely more heterogeneous than other phase transects. Thus, phase classifications may well be scale-dependent and subject to detection thresholds, which have to be kept in mind when comparing different data sets or evaluating model statistics.
The open-to-closed fraction for liquid clouds (JJA: 4.54, DJF: 0.51) and SLCs (JJA: 4.40, DJF: 0.57) is similar in the main SO cloud band (50–60∘ S). Therefore, this further supports the notion that seasonal differences in cloud-phase statistics outweigh any differences found across cloud morphology. Following the hypothesis of preconditioning introduced by Abel et al. (2017) and Tornow et al. (2021), where accelerated transitions from closed-to-open cells are observed in clouds that formed ice as opposed to SLCs, one may expect to find open MCC clouds to occur more often as MPCs than closed cells. However, we cannot observe a higher mixed fraction in the open MCC regime as compared to closed MCC clouds. Therefore, while preconditioning may impact regional-scale transitions under specific environmental conditions, it seems to be only a secondary driver in morphological transitions of marine stratocumuli. Nevertheless, we cannot reliably determine the ice–water ratio in our MPCs from spaceborne remote sensing, and thus might include MPCs with a very low ice ratio. Eirund et al. (2019a) show that only for a ratio for LWP : IWP (ice water path) of 1:2, the morphological structures of the simulated open cell clouds are impacted by ice formation.
For clouds with cloud tops below 2.5 km, we find a dependence of the mixed fraction on CTH. This suggests that deeper, more decoupled boundary layers, where the stratocumulus deck is maintained by detraining cloud cores characterized by larger updrafts, favor ice formation at supercooled temperatures. At the same time, we did not find the mixed fraction to correlate with surface fluxes, which would support the above hypothesis linking the occurrence of convective cloud structures and larger updraft speeds to the increased likelihood of ice formation. Furthermore, the above hypothesis is consistent with modeling studies that show higher ice occurrence in the updrafts of these clouds (Lee et al., 2021; Yang et al., 2013; Roesler et al., 2017; Young et al., 2018; Eirund et al., 2019b).
The investigation of the link between cloud phase and in-cloud albedo confirms previous results showing that MPCs typically have a higher cloud albedo than liquid clouds (McCoy et al., 2014a, b; Shupe et al., 2006; Achtert et al., 2020). Moreover, the relationship between in-cloud albedo and cloud morphology reveals substantial differences between open and closed cells (0.04 to 0.13), consistent with the higher albedo of closed MCC clouds shown by McCoy et al. (2017). These differences in the in-cloud albedo can drive changes in the cloud radiative effect of about 12 to 39 W m−2, depending on season and cloud phase in the SO. We additionally examine the cloud-phase differences within the morphological regimes and show that changes in in-cloud albedo across organizational regimes are more pronounced in SLCs than in MPCs.
In summary, our results show that seasonal differences in cloud phase for a given CTT are stronger in SO stratocumuli than organizational changes in cloud phase. Both cloud morphology and cloud phase seem to be primarily constrained by other environmental factors and not by each other. Moreover, this work highlights the importance of improving our understanding of cloud phase and organizational transitions to enhance predictions of cloud albedo in the SO.
The DARDAR-MASK v2.23 products are available on the AERIS/ICARE Data Center (https://www.icare.univ-lille.fr/, last access: 2 December 2020, Ceccaldi et al., 2013). MODIS cloud retrievals (MYD06_L2.6) are also obtained from AERIS/ICARE Data Center (Platnick et al., 2015).
The supplement related to this article is available online at: https://doi.org/10.5194/acp-22-10247-2022-supplement.
JD performed the data analysis and wrote the article with the support of AP. AP established the initial ideas of this study and contributed to its design. OS provided and collocated the remote-sensing retrievals of MODIS on the CALIPSO track. ILM and RW provided the mesoscale-cellular convective (MCC) classification. All authors contributed to the discussion of the results and editing of the manuscript.
The contact author has declared that none of the authors has any competing interests.
Publisher’s note: Copernicus Publications remains neutral with regard to jurisdictional claims in published maps and institutional affiliations.
We thank Gerald Mace and the two anonymous reviewers for their constructive feedback, which greatly improved the quality of this article. Furthermore, we thank the AERIS/ICARE Data and Services Center for providing access to the data used in this study, as well as the CloudSat, CALIPSO and MODIS projects by NASA, who provided the original data.
The research from Jessica Danker and Anna Possner has been supported by the Federal Ministry of Education and Research (BMBF) “Make our Planet Great Again –
German Research Initiative” (grant no. 57429624) implemented
by the German Academic Exchange Service (DAAD). Research by Isabel L. McCoy is supported by the NOAA Climate and Global Change Postdoctoral Fellowship Program, administered by UCAR's Cooperative Programs for the Advancement of Earth System Science (CPAESS) under award no. NA18NWS4620043B.
This open-access publication was funded by the Goethe University Frankfurt.
This paper was edited by Matthias Tesche and reviewed by Gerald Mace and two anonymous referees.
Abel, S. J., Boutle, I. A., Waite, K., Fox, S., Brown, P. R. A., Cotton, R., Lloyd, G., Choularton, T. W., and Bower, K. N.: The Role of Precipitation in Controlling the Transition from Stratocumulus to Cumulus Clouds in a Northern Hemisphere Cold-Air Outbreak, J. Atmos. Sci., 74, 2293–2314, https://doi.org/10.1175/jas-d-16-0362.1, 2017. a, b, c, d, e, f
Achtert, P., Oconnor, E. J., Brooks, I. M., Sotiropoulou, G., Shupe, M. D., Pospichal, B., Brooks, B. J., and Tjernström, M.: Properties of Arctic liquid and mixed-phase clouds from shipborne Cloudnet observations during ACSE 2014, Atmos. Chem. Phys., 20, 14983–15002, https://doi.org/10.5194/acp-20-14983-2020, 2020. a, b, c
Ahn, E., Huang, Y., Chubb, T. H., Baumgardner, D., Isaac, P., de Hoog, M., Siems, S. T., and Manton, M. J.: In situ observations of wintertime low-altitude clouds over the Southern Ocean, Q. J. Roy. Meteorol. Soc., 143, 1381–1394, https://doi.org/10.1002/qj.3011, 2017. a, b
Ahn, E., Huang, Y., Siems, S. T., and Manton, M. J.: A Comparison of Cloud Microphysical Properties Derived From MODIS and CALIPSO With In Situ Measurements Over the Wintertime Southern Ocean, J. Geophys. Res.-Atmos., 123, 120–11, https://doi.org/10.1029/2018JD028535, 2018. a, b, c
Atkinson, B. W. and Zhang, J. W.: Mesoscale shallow convection in the atmosphere, Rev. Geophys., 34, 403–431, https://doi.org/10.1029/96RG02623, 1996. a
Berner, A. H., Bretherton, C. S., and Wood, R.: Large eddy simulation of ship tracks in the collapsed marine boundary layer: A case study from the Monterey area ship track experiment, Atmos. Chem. Phys., 15, 5851–5871, https://doi.org/10.5194/acp-15-5851-2015, 2015. a
Bony, S., Colman, R., Kattsov, V. M., Allan, R. P., Bretherton, C. S., Dufresne, J. L., Hall, A., Hallegatte, S., Holland, M. M., Ingram, W., Randall, D. A., Soden, B. J., Tselioudis, G., and Webb, M. J.: How well do we understand and evaluate climate change feedback processes?, J. Clim., 19, 3445–3482, https://doi.org/10.1175/JCLI3819.1, 2006. a
Bretherton, C. S.: Insights into low-latitude cloud feedbacks from high-resolution models, Philos. T. R. Soc. A, 373, 20140415, https://doi.org/10.1098/rsta.2014.0415, 2015. a
Bretherton, C. S., Uchida, J., and Blossey, P. N.: Slow Manifolds and Multiple Equilibria in Stratocumulus-Capped Boundary Layers, J. Adv. Model. Earth Syst., 2, 14, https://doi.org/10.3894/james.2010.2.14, 2010. a
Bühl, J., Ansmann, A., Seifert, P., Baars, H., and Engelmann, R.: Toward a quantitative characterization of heterogeneous ice formation with lidar/radar: Comparison of CALIPSO/CloudSat with ground-based observations, Geophys. Res. Lett., 40, 4404–4408, https://doi.org/10.1002/grl.50792, 2013. a
Burrows, S. M., Hoose, C., Pöschl, U., and Lawrence, M. G.: Ice nuclei in marine air: Biogenic particles or dust?, Atmos. Chem. Phys., 13, 245–267, https://doi.org/10.5194/acp-13-245-2013, 2013. a
Ceccaldi, M., Delanoë, J., Hogan, R. J., Pounder, N. L., Protat, A., and Pelon, J.: From CloudSat-CALIPSO to EarthCare: Evolution of the DARDAR cloud classification and its comparison to airborne radar-lidar observations, J. Geophys. Res.-Atmos., 118, 7962–7981, https://doi.org/10.1002/jgrd.50579, 2013 (data available at: http://www.icare.univ-lille.fr/, last access: 2 December 2020). a, b, c, d, e, f, g, h
Chen, T., Rossow, W. B., and Zhang, Y.: Radiative Effects of Cloud-Type Variations, J. Clim., 13, 264–286, 2000. a
Cober, S. G. and Isaac, G. A.: Characterization of aircraft icing environments with Supercooled Large Drops for application to commercial aircraft certification, J. Appl. Meteorol. Clim., 51, 265–284, https://doi.org/10.1175/JAMC-D-11-022.1, 2012. a
Delanoë, J. and Hogan, R. J.: A variational scheme for retrieving ice cloud properties from combined radar, lidar, and infrared radiometer, J. Geophys. Res.-Atmos., 113, 1–21, https://doi.org/10.1029/2007JD009000, 2008. a, b
Delanoë, J. and Hogan, R. J.: Combined CloudSat-CALIPSO-MODIS retrievals of the properties of ice clouds, J. Geophys. Res. Atmos., 115, D4, https://doi.org/10.1029/2009JD012346, 2010. a, b
DeMott, P. J., Hill, T. C., McCluskey, C. S., Prather, K. A., Collins, D. B., Sullivan, R. C., Ruppel, M. J., Mason, R. H., Irish, V. E., Lee, T., Hwang, C. Y., Rhee, T. S., Snider, J. R., McMeeking, G. R., Dhaniyala, S., Lewis, E. R., Wentzell, J. J., Abbatt, J., Lee, C., Sultana, C. M., Ault, A. P., Axson, J. L., Martinez, M. D., Venero, I., Santos-Figueroa, G., Stokes, M. D., Deane, G. B., Mayol-Bracero, O. L., Grassian, V. H., Bertram, T. H., Bertram, A. K., Moffett, B. F., and Franc, G. D.: Sea spray aerosol as a unique source of ice nucleating particles, P. Natl. Acad. Sci. USA, 113, 5797–5803, https://doi.org/10.1073/pnas.1514034112, 2016. a
D'Alessandro, J. J., McFarquhar, G. M., Wu, W., Stith, J. L., Jensen, J. B., and Rauber, R. M.: Characterizing the occurrence and spatial heterogeneity of liquid, ice and mixed phase low‐level clouds over the Southern Ocean using in situ observations acquired during SOCRATES, J. Geophys. Res.-Atmos., 126, 11, https://doi.org/10.1029/2020jd034482, 2021. a, b, c, d, e, f, g, h
Eastman, R., McCoy, I. L., and Wood, R.: Environmental and internal controls on Lagrangian transitions from closed cell mesoscale cellular convection over subtropical oceans, J. Atmos. Sci., 78, 2367–2383, https://doi.org/10.1175/JAS-D-20-0277.1, 2021. a
Eirund, G. K., Lohmann, U., and Possner, A.: Cloud Ice Processes Enhance Spatial Scales of Organization in Arctic Stratocumulus, Geophys. Res. Lett., 46, 14109–14117, https://doi.org/10.1029/2019GL084959, 2019a. a, b, c, d
Eirund, G. K., Possner, A., and Lohmann, U.: Response of Arctic mixed-phase clouds to aerosol perturbations under different surface forcings, Atmos. Chem. Phys., 19, 9847–9864, https://doi.org/10.5194/acp-19-9847-2019, 2019b. a, b
Feingold, G., Koren, I., Wang, H., Xue, H., and Brewer, W. A.: Precipitation-generated oscillations in open cellular cloud fields, Nature, 466, 849–852, https://doi.org/10.1038/nature09314, 2010. a
Fletcher, J., Mason, S., and Jakob, C.: The Climatology, Meteorology, and Boundary Layer Structure of Marine Cold Air Outbreaks in Both Hemispheres*, J. Clim., 29, 1999–2014, https://doi.org/10.1175/JCLI-D-15-0268.1, 2016a. a
Fletcher, J. K., Mason, S., and Jakob, C.: A climatology of clouds in marine cold air outbreaks in both hemispheres, J. Clim., 29, 6677–6692, https://doi.org/10.1175/JCLI-D-15-0783.1, 2016b. a
Freud, E. and Rosenfeld, D.: Linear relation between convective cloud drop number concentration and depth for rain initiation, J. Geophys. Res.-Atmos., 117, D2, https://doi.org/10.1029/2011JD016457, 2012. a
Gayet, J. F., Asano, S., Yamazaki, A., Uchiyama, A., Sinyuk, A., Jourdan, O., and Auriol, F.: Two case studies of winter continental-type water and mixed-phase stratocumuli over the sea 1. Microphysical and optical properties, J. Geophys. Res.-Atmos., 107, 11-1–11-15, https://doi.org/10.1029/2001JD001106, 2002. a
Gettelman, A., Hannay, C., Bacmeister, J. T., Neale, R. B., Pendergrass, A. G., Danabasoglu, G., Lamarque, J. F., Fasullo, J. T., Bailey, D. A., Lawrence, D. M., and Mills, M. J.: High Climate Sensitivity in the Community Earth System Model Version 2 (CESM2), Geophys. Res. Lett., 46, 8329–8337, https://doi.org/10.1029/2019GL083978, 2019. a
Glassmeier, F. and Feingold, G.: Network approach to patterns in stratocumulus clouds, P. Natl. Acad. Sci. USA, 114, 10578–10583, https://doi.org/10.1073/pnas.1706495114, 2017. a, b
Hallett, J. and Mossop, S. C.: Production of secondary ice particles during the riming process, Nature, 249, 26–28, https://doi.org/10.1038/249026a0, 1974. a, b
Han, Q., Welch, R., Chou, J., Rossow, W., and White, A.: Validation of Satellite Retrievals of Cloud Microphysics and Liquid Water Path Using Observations from FIRE, J. Atmos. Sci., 52, 4183–4195, https://doi.org/10.1175/1520-0469(1995)052<4183:VOSROC>2.0.CO;2, 1995. a
Hartmann, D. L., Ockert-Bell, M. E., and Michelsen, M. L.: The Effect of cloud type on earths energy budget: Global Analysis, J. Clim., 5, 1281–1304, https://doi.org/10.1175/1520-0442(1992)005<1281:TEOCTO>2.0.CO;2, 1992. a
Hu, Y., Rodier, S., Xu, K.-m., Sun, W., Huang, J., Lin, B., Zhai, P., and Josset, D.: Occurrence, liquid water content, and fraction of supercooled water clouds from combined CALIOP/IIR/MODIS measurements, J. Geophys. Res., 115, D00H34, https://doi.org/10.1029/2009JD012384, 2010. a, b, c
Huang, S., Hu, W., Chen, J., Wu, Z., Zhang, D., and Fu, P.: Overview of biological ice nucleating particles in the atmosphere, Environ. Int., 146, 106197, https://doi.org/10.1016/j.envint.2020.106197, 2021a. a
Huang, Y., Siems, S. T., Manton, M. J., Protat, A., and Delanoë, J.: A study on the low-altitude clouds over the Southern Ocean using the DARDAR-MASK, J. Geophys. Res.-Atmos., 117, 1–15, https://doi.org/10.1029/2012JD017800, 2012. a, b, c
Huang, Y., Chubb, T. H., Baumgardner, D., DeHoog, M., Siems, S. T., and Manton, M. J.: Evidence for secondary ice production in Southern Ocean open cellular convection, Q. J. Roy. Meteorol. Soc., 143, 1685–1703, https://doi.org/10.1002/qj.3041, 2017. a, b, c
Huang, Y., Siems, S. T., and Manton, M. J.: Wintertime In Situ Cloud Microphysical Properties of Mixed-Phase Clouds Over the Southern Ocean, J. Geophys. Res.-Atmos., 126, 11, https://doi.org/10.1029/2021JD034832, 2021b. a, b
Jensen, M. P., Ghate, V. P., Wang, D., Apoznanski, D. K., Bartholomew, M. J., Giangrande, S. E., Johnson, K. L., and Thieman, M. M.: Contrasting characteristics of open- and closed-cellular stratocumulus cloud in the eastern North Atlantic, Atmos. Chem. Phys., 21, 14557–14571, https://doi.org/10.5194/acp-21-14557-2021, 2021. a, b
Kay, J. E. and Gettelman, A.: Cloud influence on and response to seasonal Arctic sea ice loss, J. Geophys. Res.-Atmos., 114, D18, https://doi.org/10.1029/2009JD011773, 2009. a
Keeler, J. M., Jewett, B. F., Rauber, R. M., McFarquhar, G. M., Rasmussen, R. M., Xue, L., Liu, C., and Thompson, G.: Dynamics of cloud-top generating cells in winter cyclones, Part I: Idealized simulations in the context of field observations, J. Atmos. Sci., 73, 1507–1527, https://doi.org/10.1175/JAS-D-15-0126.1, 2016. a
Khanal, S. and Wang, Z.: Uncertainties in MODIS-Based Cloud Liquid Water Path Retrievals at High Latitudes Due to Mixed-Phase Clouds and Cloud Top Height Inhomogeneity, J. Geophys. Res.-Atmos., 123, 154–11, https://doi.org/10.1029/2018JD028558, 2018. a
Korolev, A. V., McFarquhar, G. M., Field, P. R., Franklin, C. N., Lawson, P., Wang, Z., Williams, E., Abel, S. J., Axisa, D., Borrmann, S., Crosier, J., Fugal, J., Krämer, M., Lohmann, U., Schlenczek, O., Schnaiter, M., and Wendisch, M.: Mixed-Phase Clouds: Progress and Challenges, Meteorol. Monogr., 58, 1–5, https://doi.org/10.1175/amsmonographs-d-17-0001.1, 2017. a
Lang, F., Huang, Y., Protat, A., Truong, S. C. H., Siems, S. T., and Manton, M. J.: Shallow Convection and Precipitation over the Southern Ocean: A Case Study during the CAPRICORN 2016 Field Campaign, J. Geophys. Res.-Atmos., 126, 9, https://doi.org/10.1029/2020JD034088, 2021. a, b
Lang, F., Ackermann, L., Huang, Y., Truong, S. C. H., Siems, S. T., and Manton, M. J.: A climatology of open and closed mesoscale cellular convection over the Southern Ocean derived from Himawari-8 observations, Atmos. Chem. Phys., 22, 2135–2152, https://doi.org/10.5194/acp-22-2135-2022, 2022. a
Lee, S. S., Ha, K.-J., Manoj, M. G., Kamruzzaman, M., Kim, H., Utsumi, N., Zheng, Y., Kim, B.-G., Jung, C. H., Um, J., Guo, J., Choi, K. O., and Kim, G.-U.: Midlatitude mixed-phase stratocumulus clouds and their interactions with aerosols: how ice processes affect microphysical, dynamic, and thermodynamic development in those clouds and interactions?, Atmos. Chem. Phys., 21, 16843–16868, https://doi.org/10.5194/acp-21-16843-2021, 2021. a
Libbrecht, K. G.: The physics of snow crystals, Reports Prog. Phys., 68, 855–895, https://doi.org/10.1088/0034-4885/68/4/R03, 2005. a, b
Listowski, C., Delanoë, J., Kirchgaessner, A., Lachlan-Cope, T., and King, J.: Antarctic clouds, supercooled liquid water and mixed phase, investigated with DARDAR: Geographical and seasonal variations, Atmos. Chem. Phys., 19, 6771–6808, https://doi.org/10.5194/acp-19-6771-2019, 2019. a, b, c, d, e
Liu, Y., Key, J. R., Ackerman, S. A., Mace, G. G., and Zhang, Q.: Arctic cloud macrophysical characteristics from CloudSat and CALIPSO, Remote Sens. Environ., 124, 159–173, https://doi.org/10.1016/j.rse.2012.05.006, 2012. a
Loeb, N. G., Wielicki, B. A., Rose, F. G., and Doelling, D. R.: Variability in global top-of-atmosphere shortwave radiation between 2000 and 2005, Geophys. Res. Lett., 34, 3, https://doi.org/10.1029/2006GL028196, 2007. a
Mace, G. G. and Protat, A.: Clouds over the Southern Ocean as observed from the R/V investigator during CAPRICORN, Part I: Cloud occurrence and phase partitioning, J. Appl. Meteorol. Clim., 57, 1783–1803, https://doi.org/10.1175/JAMC-D-17-0194.1, 2018. a
Mace, G. G., Protat, A., and Benson, S.: Mixed‐Phase Clouds Over the Southern Ocean as Observed From Satellite and Surface Based Lidar and Radar, J. Geophys. Res.-Atmos., 126, 16, https://doi.org/10.1029/2021JD034569, 2021. a, b, c, d
Magono, C.: The Temperature Conditions for the Growth of Natural and Artificial Snow Crystals, J. Meteorol. Soc. Jpn., 40, 185–192, https://doi.org/10.2151/jmsj1923.40.4_185, 1962. a, b
Marchand, R., Mace, G. G., Ackerman, T., and Stephens, G. L.: Hydrometeor detection using Cloudsat – An earth-orbiting 94-GHz cloud radar, J. Atmos. Ocean. Technol., 25, 519–533, https://doi.org/10.1175/2007JTECHA1006.1, 2008. a, b
Mason, S., Jakob, C., Protat, A., and Delanoë, J.: Characterizing observed midtopped cloud regimes associated with Southern Ocean shortwave radiation biases, J. Clim., 27, 6189–6203, https://doi.org/10.1175/JCLI-D-14-00139.1, 2014. a
Matus, A. V. and L'Ecuyer, T. S.: The role of cloud phase in Earth’s radiation budget, J. Geophys. Res., 122, 2559–2578, https://doi.org/10.1002/2016JD025951, 2017. a
McCluskey, C. S., DeMott, P. J., Ma, P. L., and Burrows, S. M.: Numerical Representations of Marine Ice-Nucleating Particles in Remote Marine Environments Evaluated Against Observations, Geophys. Res. Lett., 46, 7838–7847, https://doi.org/10.1029/2018GL081861, 2019. a, b, c
McCoy, D. T., Hartmann, D. L., and Grosvenor, D. P.: Observed Southern Ocean cloud properties and shortwave reflection, Part I: Calculation of SW flux from observed cloud properties, J. Clim., 27, 8836–8857, https://doi.org/10.1175/JCLI-D-14-00287.1, 2014a. a, b
McCoy, D. T., Hartmann, D. L., and Grosvenor, D. P.: Observed Southern Ocean cloud properties and shortwave reflection, Part II: Phase changes and low cloud feedback, J. Clim., 27, 8858–8868, https://doi.org/10.1175/JCLI-D-14-00288.1, 2014b. a, b
McCoy, D. T., Hartmann, D. L., Zelinka, M. D., Ceppi, P., and Grosvenor, D. P.: Mixed-phase cloud physics and Southern Ocean cloud feedback in climate models, J. Geophys. Res., 120, 9539–9554, https://doi.org/10.1002/2015JD023603, 2015. a
McCoy, I. L., Wood, R., and Fletcher, J. K.: Identifying Meteorological Controls on Open and Closed Mesoscale Cellular Convection Associated with Marine Cold Air Outbreaks, J. Geophys. Res.-Atmos., 122, 11678–11702, https://doi.org/10.1002/2017JD027031, 2017. a, b, c, d, e, f, g, h, i, j
McFarquhar, G. M. and Cober, S. G.: Single-scattering properties of mixed-phase Arctic clouds at solar wavelengths: Impacts on radiative transfer, J. Clim., 17, 3799–3813, https://doi.org/10.1175/1520-0442(2004)017<3799:SPOMAC>2.0.CO;2, 2004. a
McFarquhar, G. M., Bretherton, C. S., Marchand, R., Protat, A., DeMott, P. J., Alexander, S. P., Roberts, G. C., Twohy, C. H., Toohey, D. W., Siems, S. T., Huang, Y., Wood, R., Rauber, R. M., Lasher-Trapp, S., Jensen, J. B., Stith, J. L., Mace, G. G., Um, J., Järvinen, E., Schnaiter, M., Gettelman, A., Sanchez, K. J., McCluskey, C. S., Russell, L. M., McCoy, I. L., Atlas, R. L., Bardeen, C. G., Moore, K. A., Hill, T. C., Humphries, R. S., Keywood, M. D., Ristovski, Z., Cravigan, L., Schofield, R., Fairall, C., Mallet, M. D., Kreidenweis, S. M., Rainwater, B., D’Alessandro, J. J., Wang, Y., Wu, W., Saliba, G., Levin, E. J. T., Ding, S., Lang, F., Truong, S. C. H., Wolff, C., Haggerty, J., Harvey, M. J., Klekociuk, A. R., and McDonald, A.: Observations of Clouds, Aerosols, Precipitation, and Surface Radiation over the Southern Ocean: An Overview of CAPRICORN, MARCUS, MICRE, and SOCRATES, Bull. Am. Meteorol. Soc., 102, E894–E928, https://doi.org/10.1175/BAMS-D-20-0132.1, 2021. a
Mignani, C., Creamean, J. M., Zimmermann, L., Alewell, C., and Conen, F.: New type of evidence for secondary ice formation at around −15 ∘C in mixed-phase clouds, Atmos. Chem. Phys., 19, 877–886, https://doi.org/10.5194/acp-19-877-2019, 2019. a, b, c, d, e
Mioche, G., Jourdan, O., Ceccaldi, M., and Delanoë, J.: Variability of mixed-phase clouds in the Arctic with a focus on the Svalbard region: A study based on spaceborne active remote sensing, Atmos. Chem. Phys., 15, 2445–2461, https://doi.org/10.5194/acp-15-2445-2015, 2015. a
Morrison, A. E., Siems, S. T., and Manton, M. J.: A three-year climatology of cloud-top phase over the Southern Ocean and North Pacific, J. Clim., 24, 2405–2418, https://doi.org/10.1175/2010JCLI3842.1, 2011. a, b, c
Morrison, A. L., Kay, J. E., Chepfer, H., Guzman, R., and Yettella, V.: Isolating the Liquid Cloud Response to Recent Arctic Sea Ice Variability Using Spaceborne Lidar Observations, J. Geophys. Res.-Atmos., 123, 473–490, https://doi.org/10.1002/2017JD027248, 2018. a
Muhlbauer, A., McCoy, I. L., and Wood, R.: Climatology of stratocumulus cloud morphologies: microphysical properties and radiative effects, Atmos. Chem. Phys., 14, 6695–6716, https://doi.org/10.5194/acp-14-6695-2014, 2014. a, b, c, d, e, f
Mülmenstädt, J., Sourdeval, O., Delanoë, J., and Quaas, J.: Frequency of occurrence of rain from liquid-, mixed-, and ice-phase clouds derived from A-Train satellite retrievals, Geophys. Res. Lett., 42, 6502–6509, https://doi.org/10.1002/2015GL064604, 2015. a
Niu, J., Carey, L. D., Yang, P., and Vonder Haar, T. H.: Optical properties of a vertically inhomogeneous mid-latitude mid-level mixed-phase altocumulus in the infrared region, Atmos. Res., 88, 234–242, https://doi.org/10.1016/j.atmosres.2007.11.020, 2008. a
Noh, Y.-J., Miller, S. D., Heidinger, A. K., Mace, G. G., Protat, A., and Alexander, S. P.: Satellite-Based Detection of Daytime Supercooled Liquid-Topped Mixed-Phase Clouds Over the Southern Ocean Using the Advanced Himawari Imager, J. Geophys. Res.-Atmos., 124, 2677–2701, https://doi.org/10.1029/2018JD029524, 2019. a
Platnick, S. and Twomey, S.: Determining the Susceptibility of Cloud Albedo to Changes in Droplet Concentration with the Advanced Very High Resolution Radiometer, J. Appl. Meteorol., 33, 334–347, https://doi.org/10.1175/1520-0450(1994)033<0334:DTSOCA>2.0.CO;2, 1994. a
Platnick, S., Hubanks, P. A., Meyer, K. G., and King, M. D.: MODIS Atmosphere L3 Monthly Product, NASA MODIS Adaptive Processing System, Goddard Space Flight Center [data set], USA, https://doi.org/10.5067/MODIS/MOD08_M3.006, 2015. a, b
Ramanathan, V., Cess, D., Harrison, E. F., Minnis, P., Barkstrom, B. R., Ahmad, E., and Hartmann, D. L.: Cloud-radiative forcing and climate: Results from the earth radiation budget experiment, Science, 243, 57–63, https://doi.org/10.1126/science.243.4887.57, 1989. a
Randall, D. A., Coakley, J. A., Fairall, C. W., Kropfli, R. A., and Lenschow, D. H.: Outlook for Research on Subtropical, Am. Meteorol. Soc., 65, 1290–1301, 1984. a
Rangno, A. L. and Hobbs, P. V.: Microstructures and precipitation development in cumulus and small cumulonimbus clouds over the warm pool of the tropical Pacific Ocean, Q. J. Roy. Meteorol. Soc., 131, 639–673, https://doi.org/10.1256/qj.04.13, 2005. a
Riley, E. M. and Mapes, B. E.: Unexpected peak near −15 ∘C in CloudSat echo top climatology, Geophys. Res. Lett., 36, 9, https://doi.org/10.1029/2009GL037558, 2009. a
Roesler, E. L., Posselt, D. J., and Rood, R. B.: Using large eddy simulations to reveal the size, strength, and phase of updraft and downdraft cores of an Arctic mixed-phase stratocumulus cloud, J. Geophys. Res., 122, 4378–4400, https://doi.org/10.1002/2016JD026055, 2017. a
Rosenfeld, D., Wang, H., and Rasch, P. J.: The roles of cloud drop effective radius and LWP in determining rain properties in marine stratocumulus, Geophys. Res. Lett., 39, 13, https://doi.org/10.1029/2012GL052028, 2012. a
Shcherbakov, V., Gayet, J. F., Jourdan, O., Minikin, A., Ström, J., and Petzold, A.: Assessment of cirrus cloud optical and microphysical data reliability by applying statistical procedures, J. Atmos. Ocean. Technol., 22, 409–420, https://doi.org/10.1175/JTECH1710.1, 2005. a
Shupe, M. D., Matrosov, S. Y., and Uttal, T.: Arctic mixed-phase cloud properties derived from surface-based sensors at SHEBA, J. Atmos. Sci., 63, 697–711, https://doi.org/10.1175/JAS3659.1, 2006. a, b
Shupe, M. D., Daniel, J. S., de Boer, G., Eloranta, E. W., Kollias, P., Long, C. N., Luke, E. P., Turner, D. D., and Verlinde, J.: A focus on mixed-phase clouds, Bull. Am. Meteorol. Soc., 89, 1549–1562, https://doi.org/10.1175/2008BAMS2378.1, 2008. a
Silber, I., Fridlind, A. M., Verlinde, J., Ackerman, A. S., Chen, Y. S., Bromwich, D. H., Wang, S. H., Cadeddu, M., and Eloranta, E. W.: Persistent Supercooled Drizzle at Temperatures Below −25 ∘C Observed at McMurdo Station, Antarctica, J. Geophys. Res.-Atmos., 124, 10878–10895, https://doi.org/10.1029/2019JD030882, 2019. a
Silber, I., Fridlind, A. M., Verlinde, J., Ackerman, A. S., Cesana, G. V., and Knopf, D. A.: The prevalence of precipitation from polar supercooled clouds, Atmos. Chem. Phys., 21, 3949–3971, https://doi.org/10.5194/acp-21-3949-2021, 2021a. a
Silber, I., McGlynn, P. S., Harrington, J. Y., and Verlinde, J.: Habit-Dependent Vapor Growth Modulates Arctic Supercooled Water Occurrence, Geophys. Res. Lett., 48, 10, https://doi.org/10.1029/2021GL092767, 2021b. a, b, c, d
Sullivan, S. C., Hoose, C., Kiselev, A., Leisner, T., and Nenes, A.: Initiation of secondary ice production in clouds, Atmos. Chem. Phys., 18, 1593–1610, https://doi.org/10.5194/acp-18-1593-2018, 2018. a, b, c
Sun, Z. and Shine, K. P.: Studies of the radiative properties of ice and mixed-phase clouds, Q. J. Roy. Meteorol. Soc., 120, 111–137, https://doi.org/10.1002/qj.49712051508, 1994. a
Takahashi, T., Nagao, Y., and Kushiyama, Y.: Possible High Ice Particle Produtcion during Graupel-Graupel Collisions, Am. Meteorol. Soc., 52, 4523–4527, https://doi.org/10.1175/1520-0469(1995)052<4523:PHIPPD>2.0.CO;2, 1995. a, b, c
Tan, I. and Storelvmo, T.: Evidence of Strong Contributions From Mixed-Phase Clouds to Arctic Climate Change, Geophys. Res. Lett., 46, 2894–2902, https://doi.org/10.1029/2018GL081871, 2019. a
Taylor, P. C., Kato, S., Xu, K. M., and Cai, M.: Covariance between Arctic sea ice and clouds within atmospheric state regimes at the satellite footprint level, J. Geophys. Res., 120, 12656–12678, https://doi.org/10.1002/2015JD023520, 2015. a
Tornow, F., Ackerman, A. S., and Fridlind, A. M.: Preconditioning of overcast-to-broken cloud transitions by riming in marine cold air outbreaks, Atmos. Chem. Phys., 21, 12049–12067, https://doi.org/10.5194/acp-21-12049-2021, 2021. a, b, c, d, e
Vergara-Temprado, J., Murray, B. J., Wilson, T. W., O'Sullivan, D., Browse, J., Pringle, K. J., Ardon-Dryer, K., Bertram, A. K., Burrows, S. M., Ceburnis, D., Demott, P. J., Mason, R. H., O'Dowd, C. D., Rinaldi, M., and Carslaw, K. S.: Contribution of feldspar and marine organic aerosols to global ice nucleating particle concentrations, Atmos. Chem. Phys., 17, 3637–3658, https://doi.org/10.5194/acp-17-3637-2017, 2017. a
Villanueva, D., Senf, F., and Tegen, I.: Hemispheric and Seasonal Contrast in Cloud Thermodynamic Phase From A-Train Spaceborne Instruments, J. Geophys. Res.-Atmos., 126, 1–12, https://doi.org/10.1029/2020JD034322, 2021. a
Wall, C. J., Kohyama, T., and Hartmann, D. L.: Low-cloud, boundary layer, and sea ice interactions over the Southern Ocean during winter, J. Clim., 30, 4857–4871, https://doi.org/10.1175/JCLI-D-16-0483.1, 2017. a
Wang, Y., McFarquhar, G. M., Rauber, R. M., Zhao, C., Wu, W., Finlon, J. A., Stechman, D. M., Stith, J., Jensen, J. B., Schnaiter, M., Järvinen, E., Waitz, F., Vivekanandan, J., Dixon, M., Rainwater, B., and Toohey, D. W.: Microphysical Properties of Generating Cells Over the Southern Ocean: Results From SOCRATES, J. Geophys. Res.-Atmos., 125, 13, https://doi.org/10.1029/2019JD032237, 2020. a
Wood, R.: Clouds and Fog: Stratus and Stratocumulus, Vol. 2, Elsevier, 2nd Edn., https://doi.org/10.1016/B978-0-12-382225-3.00396-0, 2015. a
Wood, R. and Hartmann, D. L.: Spatial variability of liquid water path in marine low cloud: The importance of mesoscale cellular convection, J. Clim., 19, 1748–1764, https://doi.org/10.1175/JCLI3702.1, 2006. a, b, c
Wood, R., Comstock, K. K., Bretherton, C. S., Cornish, C., Tomlinson, J., Collins, D. R., and Fairall, C. W.: Open cellular structure in marine stratocumulus sheets, J. Geophys. Res., 113, 1–16, https://doi.org/10.1029/2007JD009371, 2008. a
Wood, R., Bretherton, C. S., Leon, D. C., Clarke, A. D., Zuidema, P., Allen, G., and Coe, H.: An aircraft case study of the spatial transition from closed to open mesoscale cellular convection over the Southeast Pacific, Atmos. Chem. Phys., 11, 2341–2370, https://doi.org/10.5194/acp-11-2341-2011, 2011. a
Xu, G., Schnaiter, M., and Järvinen, E.: Accurate Retrieval of Asymmetry Parameter for Large and Complex Ice Crystals From In-Situ Polar Nephelometer Measurements, J. Geophys. Res.-Atmos., 127, 1–19, https://doi.org/10.1029/2021JD036071, 2022. a
Yamaguchi, T. and Feingold, G.: On the relationship between open cellular convective cloud patterns and the spatial distribution of precipitation, Atmos. Chem. Phys., 15, 1237–1251, https://doi.org/10.5194/acp-15-1237-2015, 2015. a
Yang, F., Ovchinnikov, M., and Shaw, R. A.: Minimalist model of ice microphysics in mixed-phase stratiform clouds, Geophys. Res. Lett., 40, 3756–3760, https://doi.org/10.1002/GRL.50700, 2013. a
Young, G., Connolly, P. J., Dearden, C., and Choularton, T. W.: Relating large-scale subsidence to convection development in Arctic mixed-phase marine stratocumulus, Atmos. Chem. Phys., 18, 1475–1494, https://doi.org/10.5194/acp-18-1475-2018, 2018. a, b
Zaremba, T. J., Rauber, R. M., McFarquhar, G. M., DeMott, P. J., D'Alessandro, J. J., and Wu, W.: Ice in Southern Ocean Clouds With Cloud Top Temperatures Exceeding −5 ∘C, J. Geophys. Res.-Atmos., 126, 1–13, https://doi.org/10.1029/2021JD034574, 2021. a, b
Zelinka, M. D., Klein, S. A., and Hartmann, D. L.: Computing and partitioning cloud feedbacks using cloud property histograms. Part II: Attribution to changes in cloud amount, altitude, and optical depth, J. Clim., 25, 3736–3754, https://doi.org/10.1175/JCLI-D-11-00249.1, 2012. a
Zelinka, M. D., Klein, S. A., Taylor, K. E., Andrews, T., Webb, M. J., Gregory, J. M., and Forster, P. M.: Contributions of different cloud types to feedbacks and rapid adjustments in CMIP5, J. Clim., 26, 5007–5027, https://doi.org/10.1175/JCLI-D-12-00555.1, 2013. a
Zelinka, M. D., Myers, T. A., McCoy, D. T., Po-Chedley, S., Caldwell, P. M., Ceppi, P., Klein, S. A., and Taylor, K. E.: Causes of Higher Climate Sensitivity in CMIP6 Models, Geophys. Res. Lett., 47, 1, https://doi.org/10.1029/2019GL085782, 2020. a
Zhang, D., Luo, T., Liu, D., and Wang, Z.: Spatial scales of altocumulus clouds observed with collocated CALIPSO and CloudSat measurements, Atmos. Res., 148, 58–69, https://doi.org/10.1016/j.atmosres.2014.05.023, 2014. a
Zhang, D., Liu, D., Luo, T., Wang, Z., and Yin, Y.: Aerosol impacts on cloud thermodynamic phase change over East Asia observed with CALIPSO and CloudSat measurements, J. Geophys. Res.-Atmos., 120, 1490–1501, https://doi.org/10.1002/2014JD022630, 2015. a
Zhang, D., Wang, Z., Luo, T., Yin, Y., and Flynn, C.: The occurrence of ice production in slightly supercooled Arctic stratiform clouds as observed by ground-based remote sensors at the ARM NSA site, J. Geophys. Res., 122, 2867–2877, https://doi.org/10.1002/2016JD026226, 2017. a
Zhang, D., Wang, Z., Kollias, P., Vogelmann, A. M., Yang, K., and Luo, T.: Ice particle production in mid-level stratiform mixed-phase clouds observed with collocated A-Train measurements, Atmos. Chem. Phys., 18, 4317–4327, https://doi.org/10.5194/acp-18-4317-2018, 2018. a
Zhou, X., Ackerman, A. S., Fridlind, A. M., and Kollias, P.: Simulation of mesoscale cellular convection in marine stratocumulus, Part I: Drizzling conditions, J. Atmos. Sci., 75, 257–274, https://doi.org/10.1175/JAS-D-17-0070.1, 2018. a