the Creative Commons Attribution 4.0 License.
the Creative Commons Attribution 4.0 License.
 | 21 Jan 2022
Measurement report: Long-term variations in surface NOx and SO2 mixing ratios from 2006 to 2016 at a background site in the Yangtze River Delta region, China
Qingqing Yin
Qianli Ma
Xiaobin Xu
Jie Yao
China has been experiencing rapid changes in emissions of air pollutants in recent decades. Increased emissions of primary particulates and reactive gases caused severe haze in several polluted regions including the Yangtze River Delta (YRD). Measures implemented in recent years for improving air quality have reduced the emissions of NOx, SO2, etc. The emission changes in these gases are reflected by tropospheric columns from satellite observations and surface measurements of surface concentrations from urban sites. However, little is known about the long-term variations in regional background NOx and SO2. In this study, we present NOx and SO2 measurements from the Lin'an station (LAN; 30∘18' N, 119∘44′ E; 138.6 m a.s.l.), one of the Global Atmosphere Watch (GAW) stations in China. We characterize the seasonal and diurnal variations and study the long-term trends of NOx and SO2 mixing ratios observed at LAN from 2006 to 2016. We also interpret the observed variations and trends in terms of changes in meteorological conditions as well as emission of these gases. The overall average mixing ratios of NOx (NO2) and SO2 during 2006–2016 were 13.6 ± 1.2 ppb (12.5 ± 4.6) and 7.0 ± 4.2 ppb, respectively. The averaged seasonal variations showed maximum values of NOx and SO2 in December (23.5 ± 4.4 ppb) and January (11.9 ± 6.2 ppb), respectively, and minimum values of 7.1 ± 0.8 and 2.8 ± 2.3 ppb (both in July), respectively. The average diurnal variation characteristics of NOx and SO2 differed considerably from each other, though the daily average mixing ratios of both gases were significantly correlated (R2=0.29, P<0.001). The annual average mixing ratio of NOx increased during 2006–2011 and then decreased significantly at 0.78 ppb/yr (−5.16 %/yr, P<0.01). The annual 95th and 5th percentiles of hourly NOx mixing ratios showed upward trends until 2012 and 2014, respectively, before a clear decline. The annual average mixing ratio of SO2 decreased significantly at 0.99 ppb/yr (−8.27 %/yr, P<0.01) from 2006–2016. The annual 95th and 5th percentiles of hourly SO2 mixing ratios all exhibited significant (P<0.001) downward trends at 3.18 and 0.19 ppb/yr, respectively. Changes in the total NOx and SO2 emissions as well as the industrial emissions in the YRD region were significantly correlated with the changes in annual NOx and SO2 mixing ratios. The significant decreases in NOx from 2011 to 2016 and SO2 from 2006 to 2016 highlight the effectiveness of relevant control measures on the reduction in NOx and SO2 emissions in the YRD region. A decrease in annual SO2 NOx ratio was found, suggesting a better efficacy in the emission reduction in SO2 than NOx. We found gradual changes in average diurnal patterns of NOx and SO2, which could be attributed to increasing contributions of vehicle emissions to NOx and weakening impacts of large sources on the SO2 concentration. This study reaffirms China's success in controlling both NOx and SO2 in the YRD but indicates at the same time a necessity to strengthen the NOx emission control.
- Article
(6678 KB) - Full-text XML
-
Supplement
(533 KB) - BibTeX
- EndNote


China's economy has experienced decades of rapid development, resulting in considerable pollutant emissions from coal combustion and motor vehicles, which affect ambient air quality and human health (Kan et al., 2009, 2012; Liang et al., 2019). NOx and SO2 are two major gaseous pollutants that are essential precursors to secondary aerosol formation and acidification (Li et al., 2020). Therefore, the changes in NOx and SO2 emissions have been receiving increasing attention in China (Zhao et al., 2013, 2018). To improve air quality, the Chinese government has promulgated a series of policies and regulations on SO2 and NOx control, especially since 2006 and 2011, respectively (Zheng et al., 2015).
Long-term observations of NOx and SO2 are critical not only for the integrated assessment of air quality and atmosphere–biosphere interactions (Swartz et al., 2020a), but also for the analysis of their reduction effects on PM2.5, nitrate, sulfate and near-surface O3, providing a basis for further improvement of atmospheric protection policies (Yu et al., 2019). At a regional scale, long-term, reliable NOx and SO2 observations can also provide data to enable the scientific community to predict the future state of the atmosphere and assess environmental policies, serving to reduce environmental risks and enhance climate, weather and air quality prediction capabilities (World Meteorological Organization, 2017). Numerous studies have evaluated the effectiveness of NOx and SO2 control in China from a long-term perspective by using emission inventories, satellite retrieval data and ground-monitoring data. For example, Sun et al. (2018) used a unified source emission inventory approach to quantify the historical emission trends of SO2 and NOx in China from 1949 to 2015; the results indicated that these pollutants reached an inflection point in 2006 and 2011, respectively. Source emission inventories by Kurokawa and Ohara (2020) revealed similar patterns. During the period from January 2005 to December 2015, the column concentration of NO2 from Ozone Monitoring Instrument (OMI) satellite retrievals indicated an increasing trend in most of China until a gradual or slight decrease in 2011 or 2012 (Cui et al., 2016). Zhao et al. (2019) used ground-based NO2 observations to assess the effectiveness of pollution control policies in a south-western city cluster and revealed fluctuations in NO2 mixing ratios from 2008 to 2013, followed by an irregular declining trend after 2013. All these studies reported that NOx and SO2 mixing ratios have been effectively controlled in China despite the increasing economic development over the past decades.
The Yangtze River Delta (YRD) region is located in the central-eastern region of China, which has the largest economic output in China and has the sixth-largest urban agglomeration in the world. The region covers an area of 359 100 km2 and has a population of 224 million, accounting for 16.08 % of the country's population (Fang et al., 2020). Because of increases in population, urbanization and industrialization in recent decades, the air pollution in the YRD has exhibited complex and regional characteristics (Li et al., 2019; Wang et al., 2019), and the YRD has become one of the most polluted regions in the world (Xie, 2017b), with NOx and SO2 being the main factors that influence air quality in the region (Yang and Luo, 2019). Xu et al. (2008) compared observational data in 2005–2006 with those 10 years earlier and concluded that as early as the mid-1990s, SO2 and NOx mixing ratios had already become considerably high at the background station in the YRD; since then, anthropogenic emissions have caused a substantial increase in the NOx concentration, making NOx another major pollutant in addition to SO2. The implementation of pollution control policies and continual innovation in SO2 pollution control technology have mitigated SO2 pollution in the YRD, resulting in a consistent decrease in SO2 mixing ratios (Qi et al., 2012); however, NOx mixing ratios remain high (Shi et al., 2018).
In this paper, we present 11 years of (2006–2016) surface NOx and SO2 observation data from the Lin'an regional atmospheric background station. We analysed the long-term variations in NOx and SO2 and their influencing factors in the YRD background area to (1) assess the effectiveness of pollution control in the area and (2) provide a scientific basis and reference for future pollution control strategies.
2.1 Site information
The Lin'an regional atmospheric background monitoring station (30∘18′ N, 119∘44′ E; 138.6 m a.s.l.; referred to as LAN) is located in Lin'an District, Hangzhou, Zhejiang Province (Fig. 1) and is one of the regional atmospheric background stations operated by the China Meteorological Administration; it is also a World Meteorological Organization (WMO) Global Atmospheric Watch (GAW) member station. LAN is located on an isolated hilltop, surrounded by hilly and mountainous terrain, with no large villages within a 3 km radius. It is within the region of subtropical monsoon climate, with the most dominant wind direction from the north-east and the secondary from the south-west. The seasonal variations in meteorological elements, namely atmospheric pressure (P), temperature (T), wind speed (WS), relative humidity (RH), and rose maps of wind speed (WS) and wind direction frequency (WF), are presented in Fig. 2.
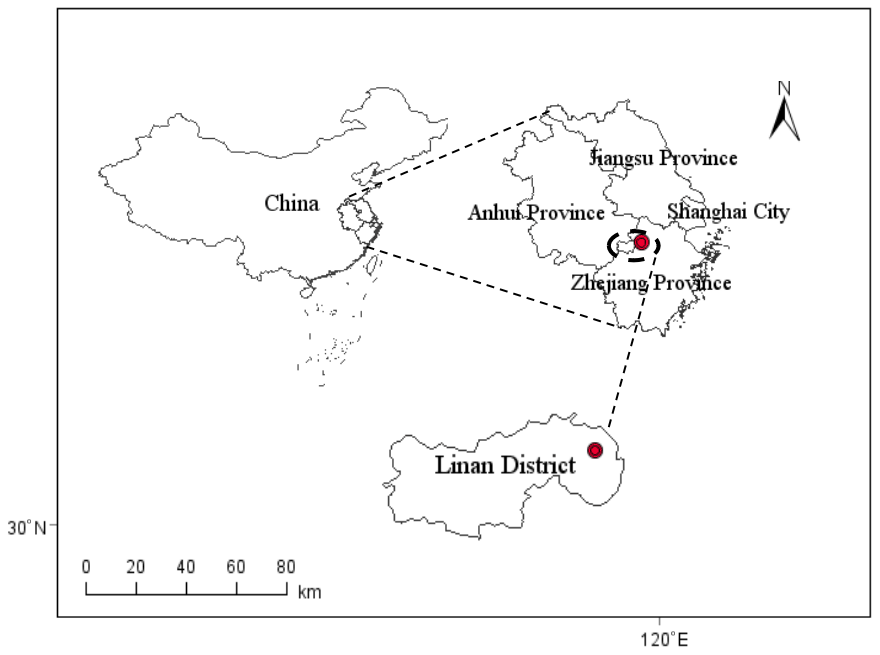
Figure 1Geographical location of LAN.
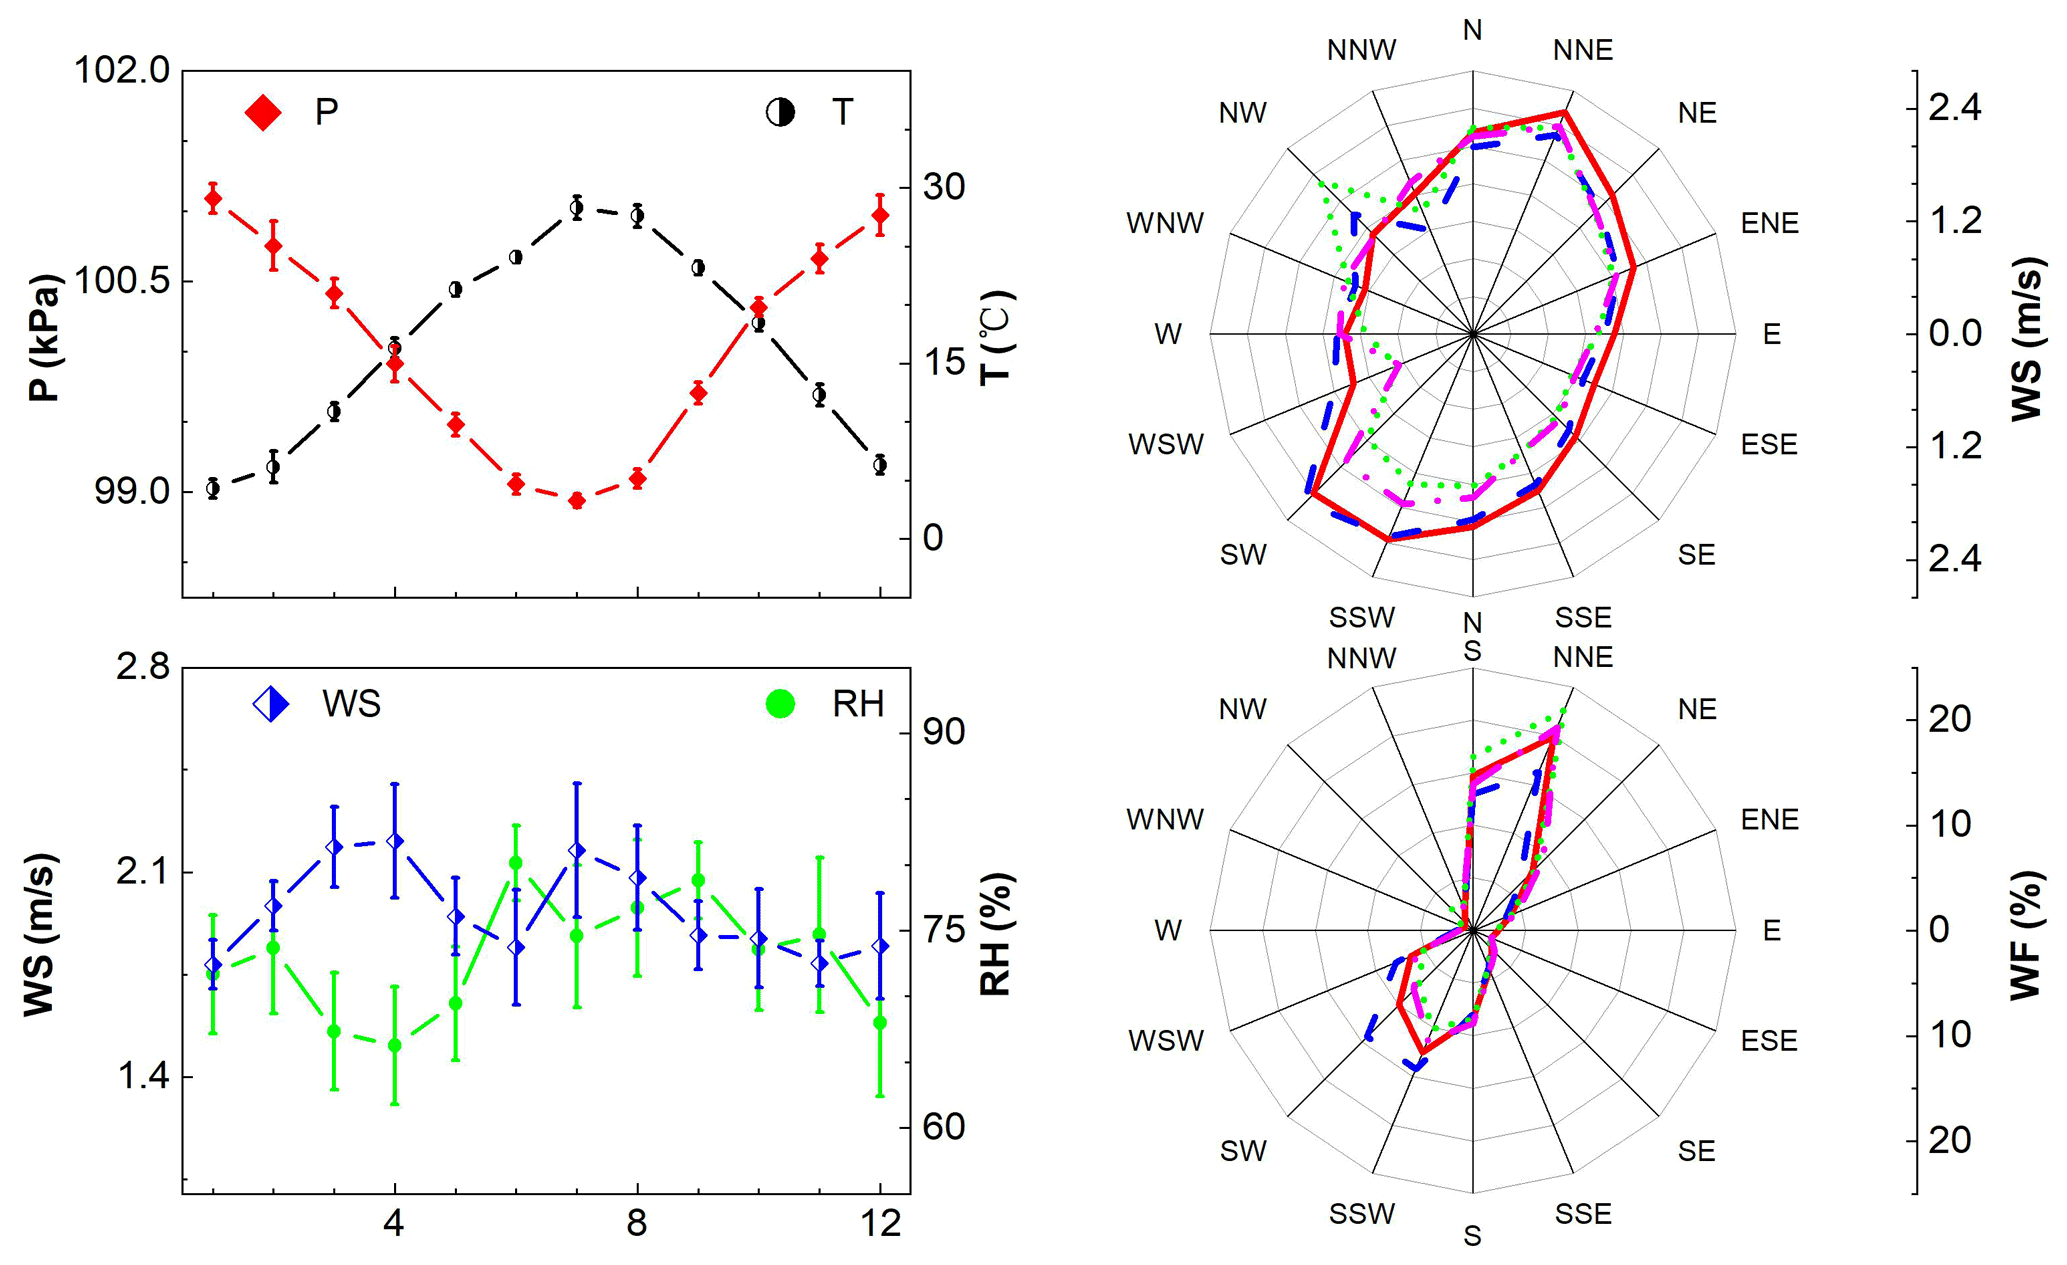
Figure 2Average seasonal variations in air pressure (P), temperature (T), wind speed (WS), relative humidity (RH), and rose maps of wind speed (WS) and wind direction frequency (WF) at LAN during 2006–2016. In the rose maps of WS and WF, solid red represents spring, dashed blue for summer, green dots for autumn and dot-dashed magenta for winter.
2.2 Observations and quality control methods
At the LAN station, observations of O3, NOx, SO2 and CO are performed by an integrated observation and quality control system combining O3, NOx, SO2 and CO analysers as well as calibration equipment and ancillary materials, such as standard gases and zero air supply (Lin et al., 2009). NOx and SO2 were measured using a Model 42C-TL trace-level chemiluminescent analyser and a Model 43C-TL trace-level pulsed fluorescence analyser (Thermo Fishier Scientific, MA, USA), respectively. In the Model 42C-TL trace-level chemiluminescent analyser, NO2 is converted to NO by a molybdenum NO2-to-NO converter heated to about 325∘. The converter efficiency was checked annually using gas-phase titration (GPT). If the converter efficiency is less than 96 %, replace the converter. Data are recorded as 5 min averages. The meteorological parameters (WS, wind direction, T and RH) for a given period were obtained from the routine meteorological observations at the station. The main objective of operational observations of reactive gases at regional background stations is to obtain accurate trends in the measured reactive gases, for which reliable and comparable data are essential. Therefore, strict quality control measures were implemented during the observation process (Lin et al., 2019). The quality control measures mainly included the following: (1) daily zero and span checks (automatic); (2) monthly multi-point calibrations (≥5 points, including zero); (3) comparisons of reference SO2 N2 and NO N2 gas mixtures to the standards of the National Institute of Standards and Technology before and after their usage (periodically) to ensure data traceability; (4) instrument self-diagnosis, manual testing, checking and maintenance (US EPA, 2017); and (5) data correction according to the quality control results, especially the results of zero and span checks and multipoint calibrations.
From 1 January 2006 to 31 December 2016, a total of 93 759 and 90 453 valid hourly average data points were obtained for NOx and SO2, respectively. Missing data totalled 2673 h and 5979 h for NOx and SO2, respectively. The missing NOx data were mainly for the period from 2 to 13 February 2007 and from 24 July to 8 October 2012. The missing SO2 data were mainly for the period from 23 September to 21 December 2013, from 8 to 26 May 2014 and from 17 October 2014 to 24 January 2015.
2.3 Data processing methods
-
The daily means of NOx and SO2 were calculated using the hourly average data, and only daily mean data calculated from at least 18-hourly data were used as valid daily means. The monthly means of NOx and SO2 were calculated from the valid daily average data and considered valid if they were based on at least 21 valid daily averages (or at least 17 valid daily averages in February). Annual means were calculated on the basis of the complete monthly mean data each year. If a month's mean data were unavailable, we used an interpolating value from the corresponding monthly means in different years during the observation. In China, spring is from March to May, summer is from June to August, autumn is from September to November, and winter is from December to February.
-
Monthly satellite-based NO2 OMI data were provided by Lin's research group at Peking University; the data were retrieved using an optimized inversion algorithm (Lin et al., 2014, 2015; Liu et al., 2019). A grid range of 27.125–35.875∘ N and 115.125–122.875∘ E was selected to cover the entire YRD region.
2.4 Concentration-weighted trajectory method
We used the concentration-weighted trajectory (CWT) method to identify potential source areas (PSAs) of NOx and SO2 because this method can effectively distinguish the relative strength of potential sources (Xin et al., 2016). In the CWT method, the study area is divided into i×j small grids with equal size, and each grid (i, j) is assigned a weighted concentration according to the following equation:
where k denotes the indicator of a trajectory, m denotes the total number of trajectories, Ck denotes the concentration observed when trajectory k arrives, and τijk is the residence time of trajectory k in the ijth grid cell. To reduce errors in the more distant grids, an empirical weighting factor Wij is introduced (Deng et al., 2020), with the following equation:
where D denotes the number of days included, t denotes the number of trajectories per day, n denotes the trajectory endpoints of each trajectory, and i×j denotes the total number of grids.
We used a hybrid single-particle Lagrangian integrated trajectory model (Hysplit4.9) from the National Oceanic and Atmospheric Administration, USA, to calculate the 24 h backward trajectories at 10 m above ground level over LAN during 2006–2016; the NCEP–NCAR reanalysis meteorological data set (https://ready.arl.noaa.gov/archives.php, last access: 14 October 2020) was used to calculate the trajectories and atmospheric mixed-layer heights. The computed backward trajectories were subsequently processed using the TrajSat plug-in for CWT in MeteoInfo software (Wang, 2014), covering the region located within 20–40∘ N and 110–130∘ E and with a grid size resolution of .
3.1 Observational levels and comparison with other sites
The hourly average SO2 mixing ratios ranged from 0.1 to 128.6 ppb, which were all below the GB3095-2012 secondary standard limit for SO2 (190 ppb). The hourly average NOx mixing ratios at LAN ranged from 0.4 to 165.6 ppb, with NO2 mixing ratios ranging from 0.2 to 106.8 ppb. Only 3 h data exceeded the secondary standard limit value for NO2 (106 ppb) as stated in the national ambient air quality standard (GB3095-2012). It should be mentioned that the measurement of NO2 was via conversion to NO by a molybdenum NO2-to-NO converter heated to about 325 ∘C, which was known to suffer from the interference of other NOy compounds such as PAN and HNO3 (Steinbacher et al., 2007; Jung et al., 2017). This implies that the measured NO2 mixing ratios were higher than actual values. However, it is impossible to quantify the overestimated parts due to the lack of other information. The interference might be enhanced with the increasing ratios of PAN to NOx (PAN NOx). Qiu et al. (2020) reported an increasing PAN NOx from 2011 to 2018 at a background site in the North China Plain, but it is not clear if there was a similar increase in PAN NOx in the YRD. During the transport of air masses to the background site, HNO3 should be reduced by deposition or partitioning in the particulate phase and intercepted by filters before NOx was measured. Since NOz (NOy–NOx) was produced by NOx oxidation, the overestimation of NOx by partial conversion of NOz, in turn, might be a positive offset in the difference between the measured mixing ratios and the emission of NOx when discussing their long-term trends.
Table 1 presents annual statistics of the NO2, NOx and SO2 mixing ratios observed at LAN between 2006 and 2016. The overall average mixing ratios with ± 1 standard deviation of for NOx (NO2) and SO2 from 2006 to 2016 were 13.6 ± 1.2 (12.5 ± 4.6 ppb) and 7.0 ± 4.2 ppb, respectively, with the highest NOx (NO2) value being observed in 2012 and the highest SO2 in 2006. NO2 was the dominant form of NOx, accounting for 82.2 % of NOx (according to the slope value from the reduced major axis regression on hourly average NO2 and NOx data). The average NO2 mixing ratio was 12.5 ± 4.6 ppb, which was below the primary annual limit of 21.2 ppb in GB3095-2012. Some information on NO2(NO) can be seen in the Supplement (Table S1). The average SO2 mixing ratio from 2006 to 2016 is close to the primary annual limit of 7.6 ppb in GB3095-2012. However, the annual average SO2 mixing ratios (10.6–14.6 ppb) from 2006 to 2008 were much higher than the limit of the primary standard though lower than the limit of the secondary standard (22.8 ppb).
Table 1Statistics of NOx and SO2 levels from 2006 to 2016 at LAN.
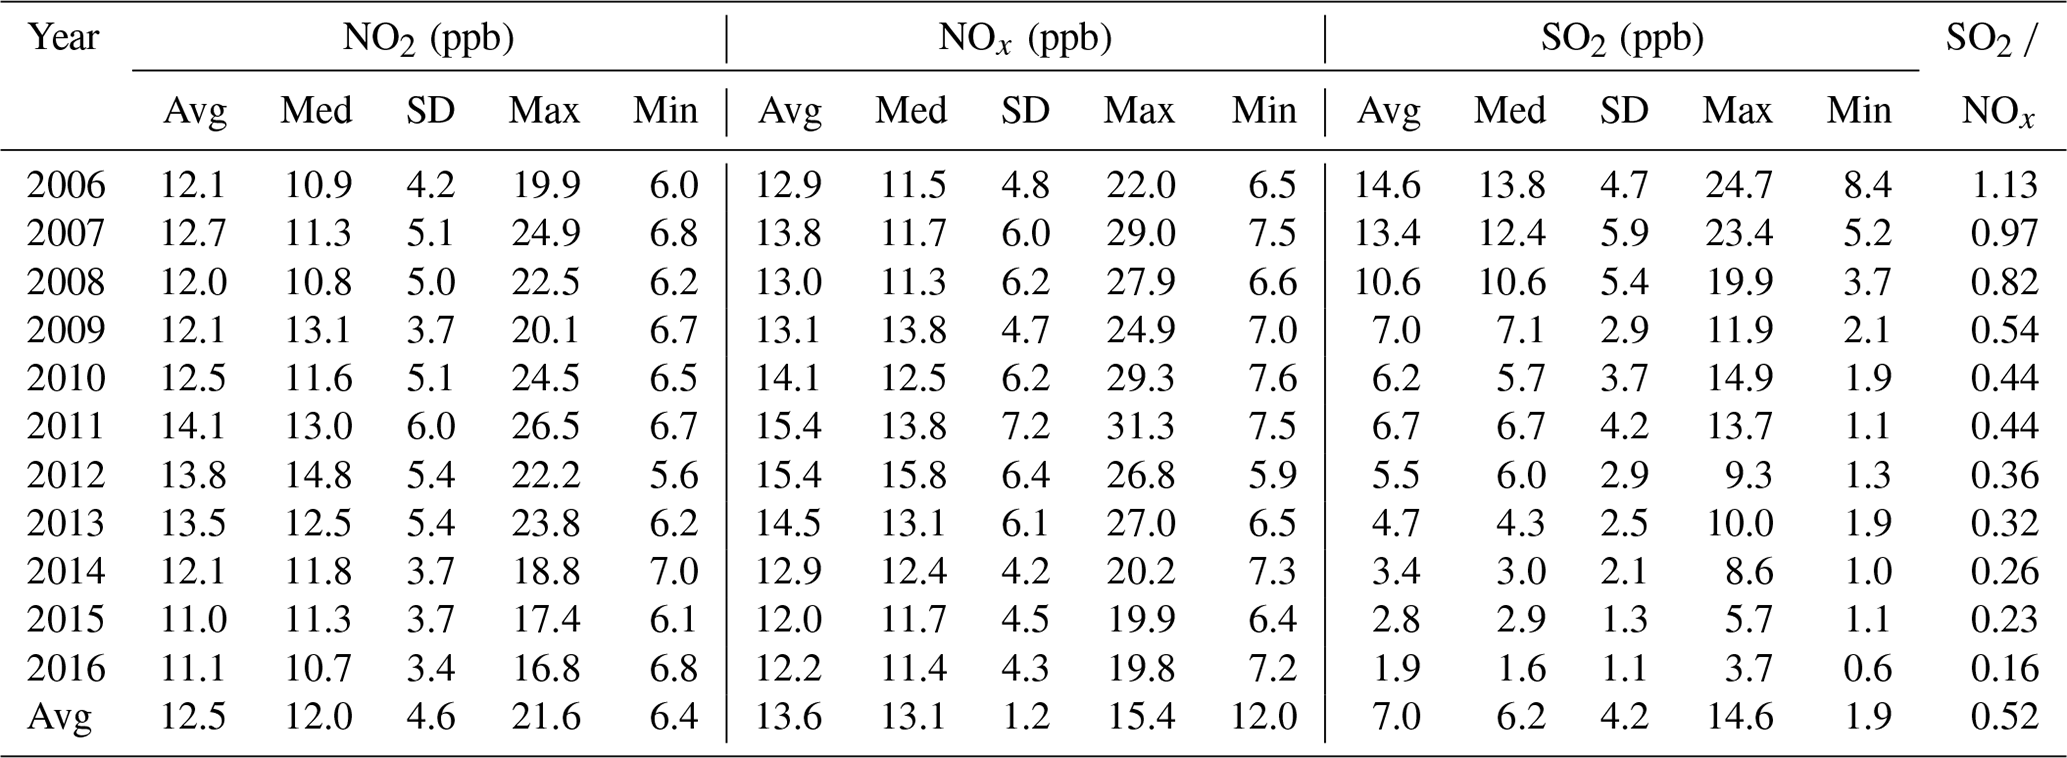
Avg: average; Med: median; SD: standard deviation; Max: maximum; Min: minimum.
Table 2 compares the levels of NOx and SO2 mixing ratios at LAN with those corresponding SO2 NOx ratios at other background stations in seven geographic regions of China: North, East, South, Northeast, Northwest, Southwest and Central China. The NOx mixing ratio at LAN was slightly higher than that at Shangdianzi (12.7 ± 11.8 ppb) in North China; equal to that at Dinghushan (13.6 ppb) in southern China; and much higher than those at Wuyishan (2.70 ppb) in East China, Fukang (8.3 ppb) in Northwest China, Changbai Mountain (4.7 ppb) in Northeast China, Jinsha (5.6 ± 5.5 ppb) in Central China and south-western Mount Gongga (0.90 ppb). These results indicate that LAN recorded the highest level of NOx among the regional atmospheric background stations in China, which could be attributed to the developed economy of the YRD region. The SO2 mixing ratio at LAN was close to that at Shangdianzi (7.6 ± 10.2 ppb) in North China; higher than that at Dinghu Mountain (6.5 ppb) in South China; and much higher than those at Wuyishan (1.48 ppb) in East China, Changbai Mountain (2.1 ppb) in Northeast China, Fukang (2.2 ppb) in Northwest China, Mount Gongga in Southwest China (0.19 ppb) and Jinsha (2.8 ± 5.5 ppb) in Central China. The regional difference in NOx and SO2 was closely related to the diverse levels of economic development in China's regions because it was broadly characterized by a higher level in the eastern than in central and western regions. The SO2 NOx ratio at LAN was at a high level in China, which reflects the different energy structures to some extent.
Table 2NOx and SO2 mixing ratios observed at various atmospheric background stations.
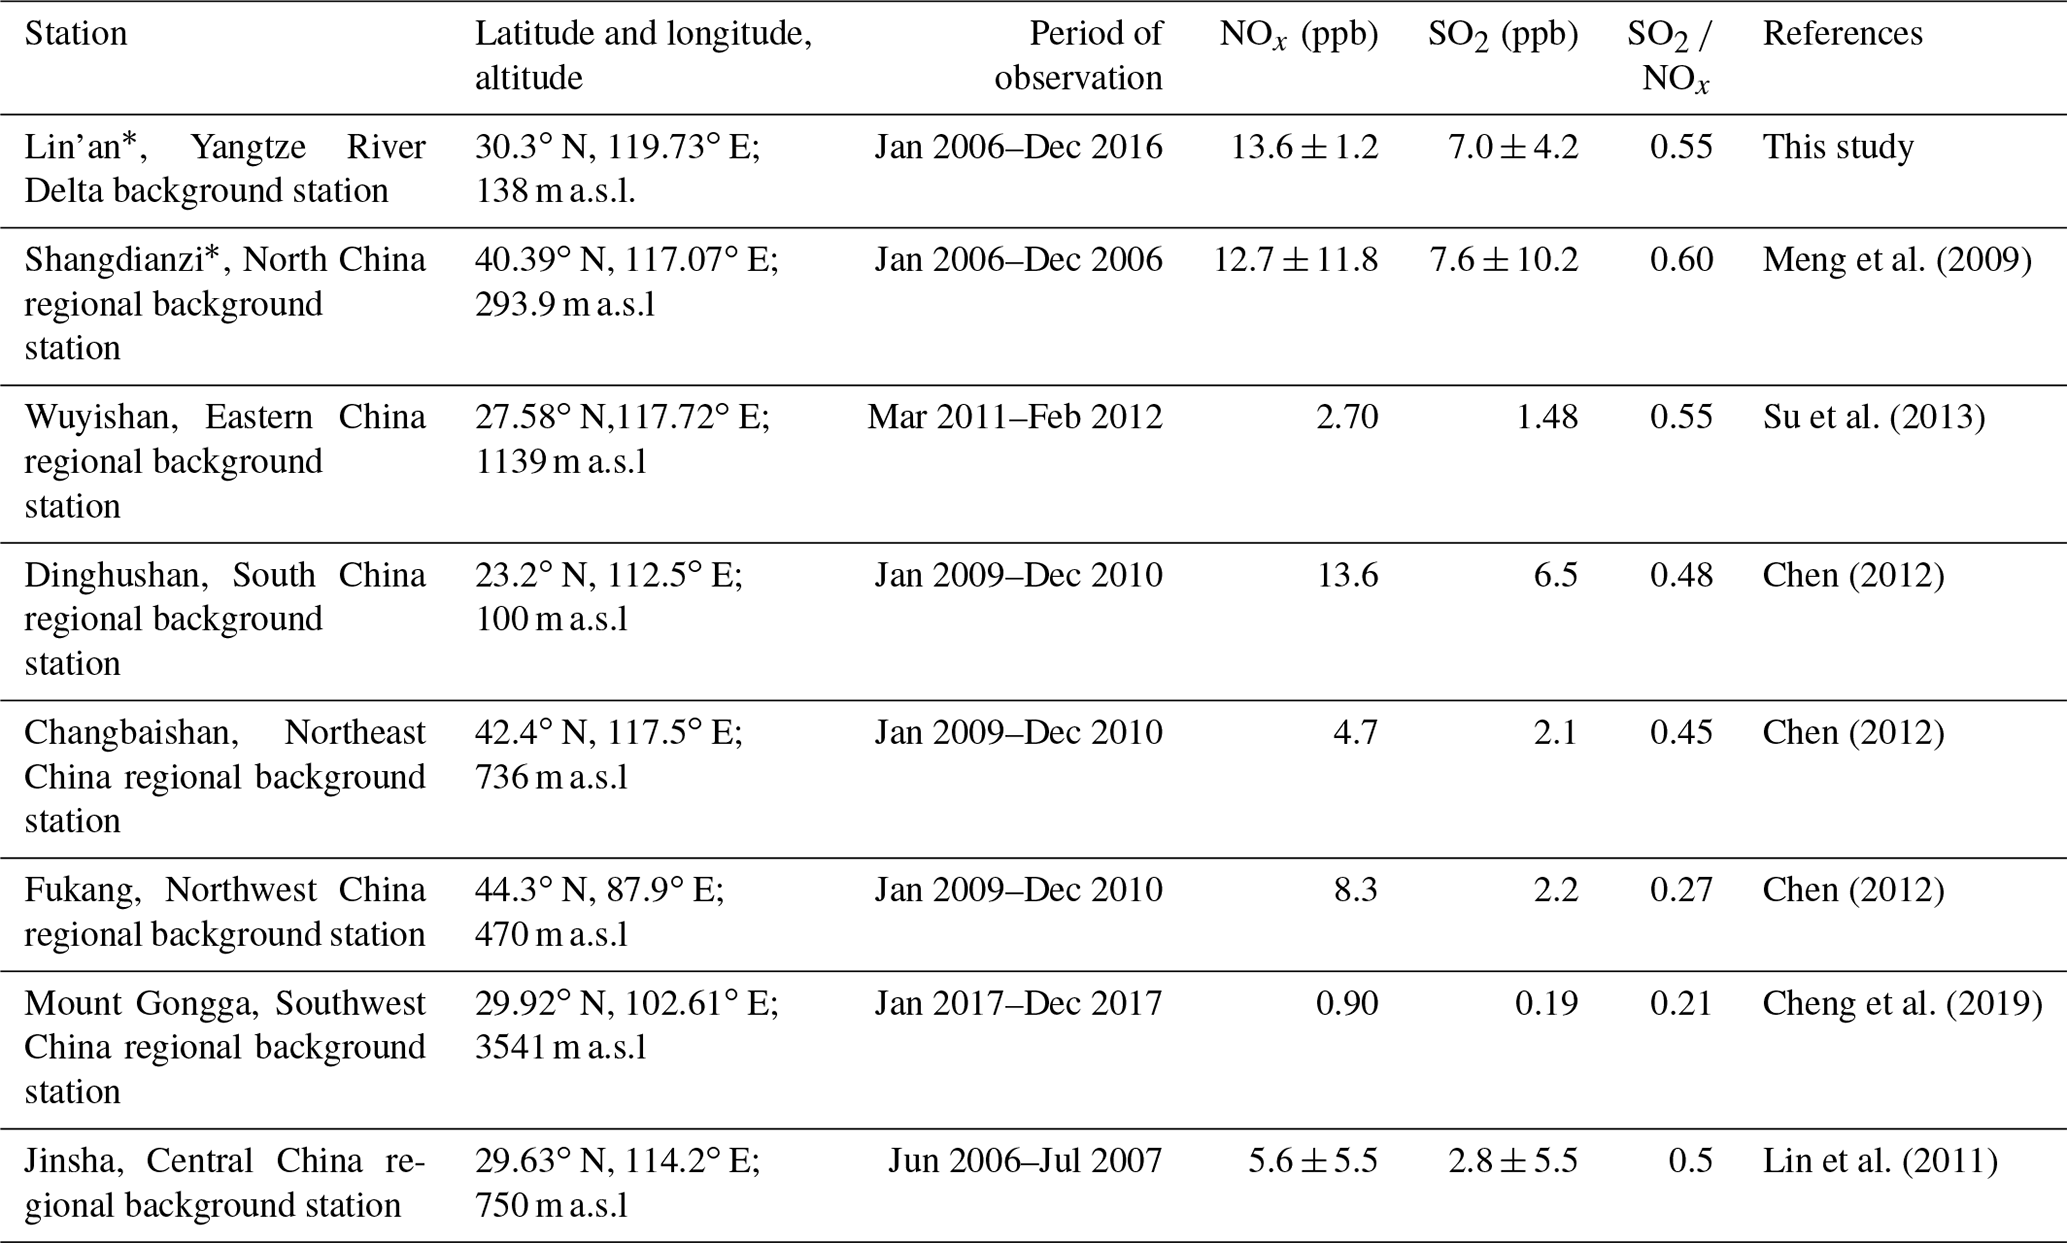
* Site is also one of the World Meteorological Organization (WMO) Global Atmosphere Watch (GAW/WMO) atmospheric background stations. All data above are converted to NO by a molybdenum NO2-to-NO converter heated to about 325 ∘C.
3.2 Seasonal variations
Figure 3 illustrates the average seasonal variations in NOx and SO2 mixing ratios at LAN. The maximum monthly average mixing ratios of NOx and SO2 were observed in December and January, at 23.5 ± 4.4 and 11.9 ± 6.2 ppb, respectively. The minimum values both occurred in July, at 7.1 ± 0.8 and 2.8 ± 2.3 ppb, respectively. The average monthly variations in NOx exhibited significant correlations with the monthly NO2 satellite data (R2=0.82, P<0.001). Seasonal variation patterns of NOx and SO2 look alike, showing a concave shape with its minimum in summer. The highest mixing ratios occurred in winter (NOx: 19.5 ppb; SO2: 10.1 ppb), followed by spring (NOx: 13.4 ppb; SO2: 7.8 ppb), autumn (NOx: 13.6 ppb; SO2: 6.7 ppb) and summer (NOx: 8.1 ppb; SO2: 3.3 ppb). The monthly average mixing ratios of both NOx and SO2 showed a dip in February – a phenomenon also observed in NOx and SO2 (Wang et al., 2016; Xue et al., 2020) and NO and SO in PM2.5 in Shanghai (Duan et al., 2020). The source emission inventory data indicated that NOx and SO2 emissions from industry, transportation and coal-fired power plants were all lower in February than in January and March throughout China (Li et al., 2017), which may be related to decreased emissions due to lower economic activity during the Chinese Spring Festival. In addition, the higher RH in February (Fig. 2) might have led to higher NOx and SO2 removal rates.
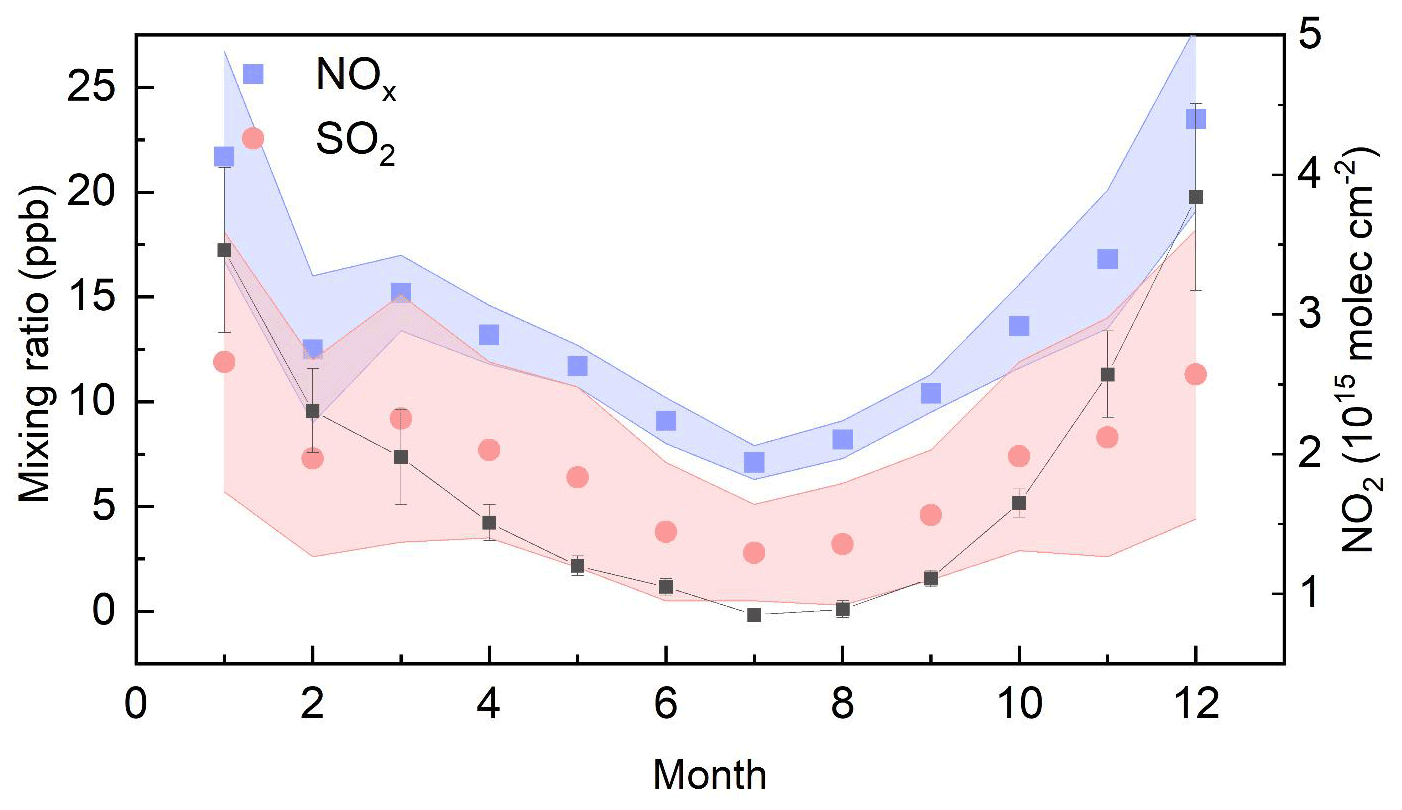
Figure 3Monthly average NOx and SO2 mixing ratios at LAN (left axis) and monthly tropospheric vertical column density of NO2 (right axis) over 27.125–35.875∘ N, 115.125–122.875∘ E in the YRD during 2006–2016.
3.3 Diurnal variations
Figure 4 shows the annual and seasonal average diurnal variations in NOx and SO2 at LAN from 2006 to 2016, along with the annual average diurnal variations in NOx and SO2 at some other sites in the YRD. The overall diurnal profile of NOx displayed a double-peak and double-valley pattern (Fig. 4a). The valley values occurred at 05:00–06:00 and 13:00 (all times in the text are UTC+8), with mixing ratios of 12.3 and 10.0 ppb, respectively, and the peak values occurred at 09:00 and 19:00, with mixing ratios of 13.1 and 14.4 ppb, respectively. Surrounding areas – such as Chongming, Pudong (Xue et al., 2020) and Xujiahui (Gao et al., 2017) in Shanghai; Hangzhou (Zhou et al., 2020) in Zhejiang Province; and Nanjing (Wang et al., 2017) in Jiangsu Province – also exhibited a double-peak and double-valley type of average diurnal variation in NOx (Fig. 4a), indicating a regional NOx pollution characteristic. However, at most atmospheric background stations, the average diurnal variations in NOx exhibited a single-peak and single-valley pattern, such as those at Xinglong in North China (Yang et al., 2012), Tianhu in the Pearl River Delta (Shen et al., 2019), Dae Hung District in Seoul (South Korea) (Pandey et al., 2008) and Mount Cimone in Italy (Cristofanelli et al., 2016), suggesting a more complex anthropogenic influence in the YRD region. In summer, the seasonal average diurnal variation in NOx showed a morning peak at 08:00, 1 to 2 h earlier than in other seasons (Fig. 4c).
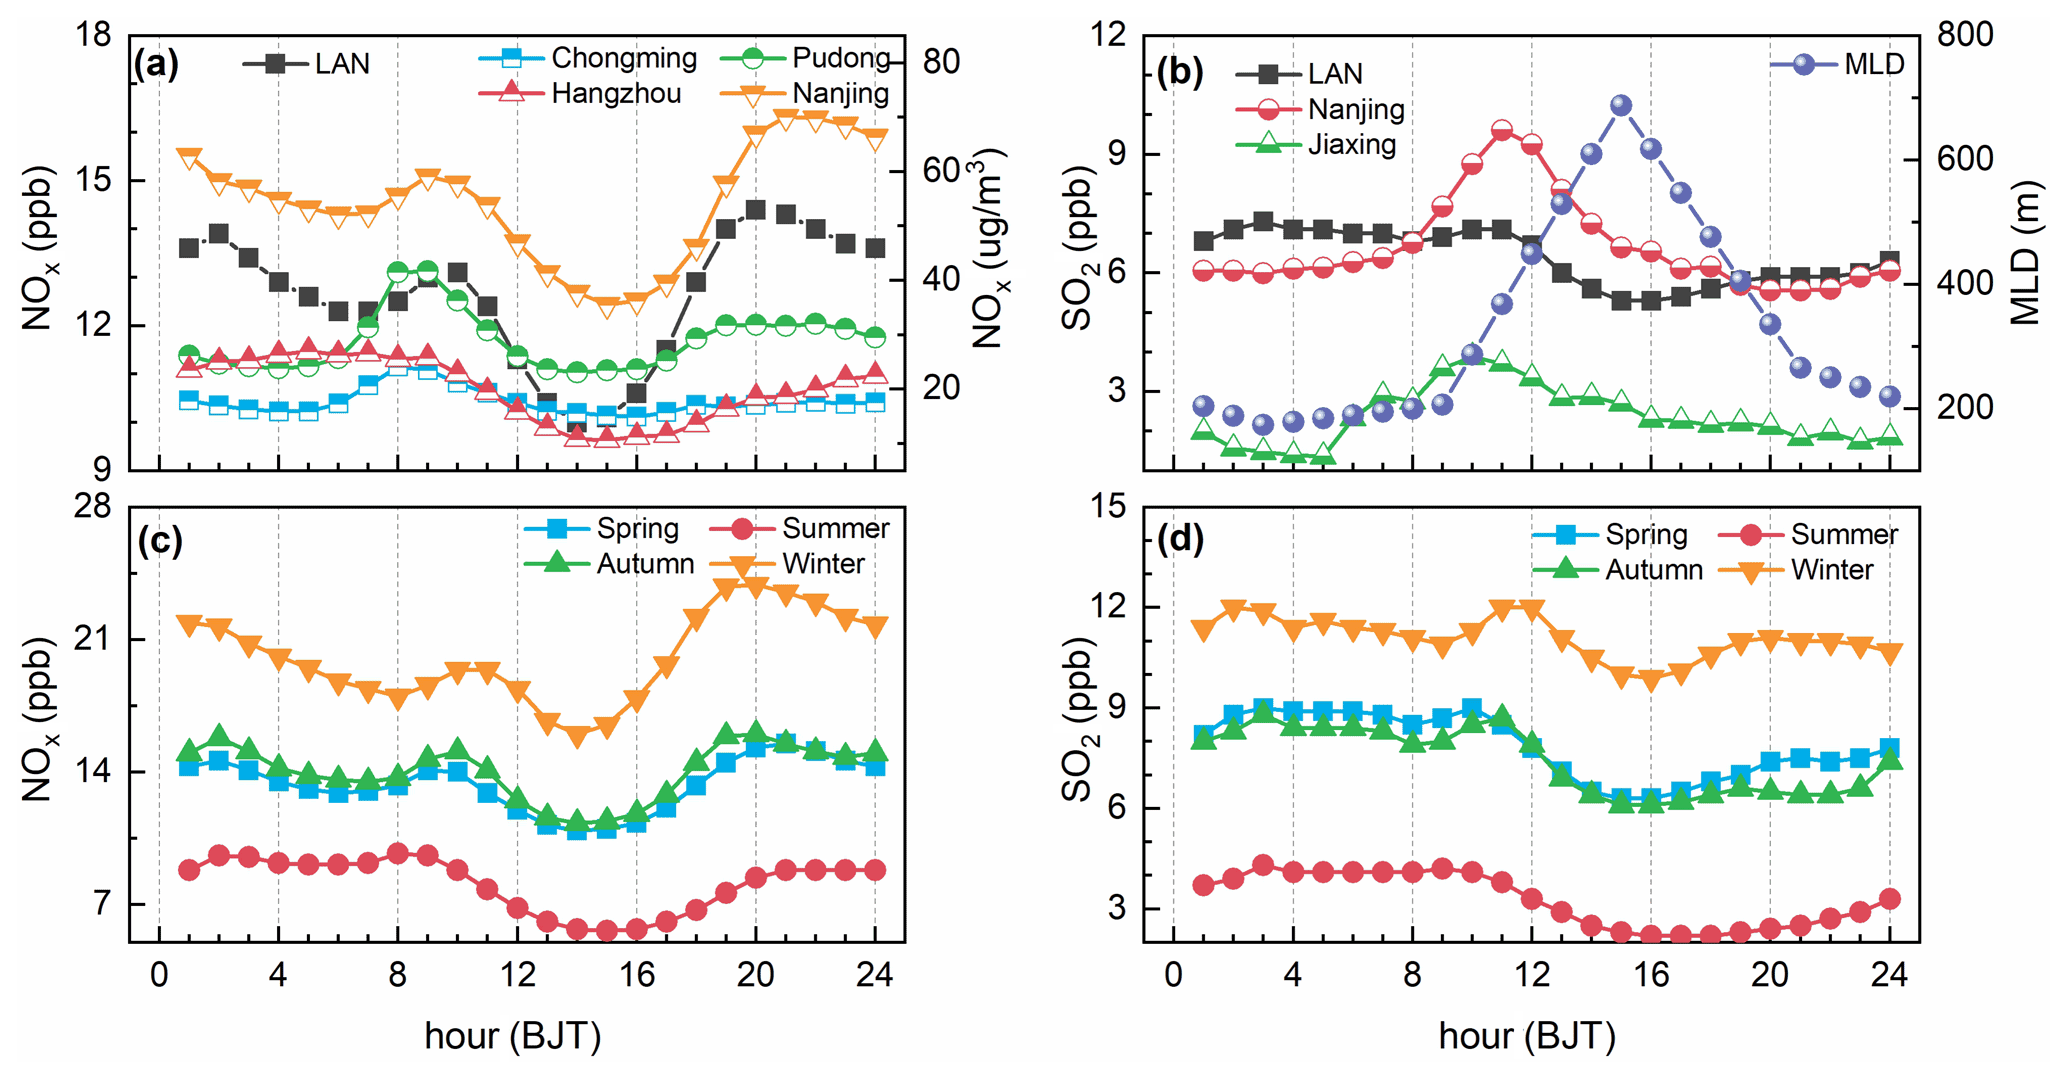
Figure 4Annual average diurnal variations in NOx (a, left axis) and in SO2 (b, left axis) at LAN and its surrounding cities (a, NOx, right axis; b, SO2, left axis); seasonal average diurnal variations in NOx (c, left axis) and SO2 (d, left axis) at LAN. The average diurnal mixed-layer depth (MLD; right axis) is also plotted in panel (b).
SO2 at LAN showed relatively small average diurnal variation (Fig. 4b), with higher mixing ratios from midnight to noontime and lower ones during later afternoon and evening. The average diurnal amplitude of SO2 at LAN was much smaller than those found in Nanjing and Jiaxing. The seasonal average diurnal profiles of SO2 at LAN were similar to the annual average one except for that in winter, which had a peak around noon (Fig. 4d).
The diurnal variation in pollutants emitted at ground level is closely related to the intensity of emissions, atmospheric transport, diurnal development in boundary layer height and atmospheric photochemical reactions (Resmi et al., 2020). The mixed-layer depth (MLD) was much lower at night than during the daytime, as shown in Fig. 4b. Low MLDs at night are not conducive to pollutant dispersion, whereas high MLDs during the daytime are conducive to pollutant dispersion. This day–night difference in the MLD is one of the factors causing lower levels of SO2 and NOx during afternoon hours. Photochemistry during the daytime also contributes to rapid chemical transformation of SO2 and NOx, which results in low NOx and SO2 mixing ratios in the afternoon. Overall, the morning peak of NOx was lower than the evening peak; the morning peak of SO2 was higher than the evening subpeak; and the morning peak of SO2 was not as protruding as and occurred slightly later than that of NOx, reflecting the differences in their sources. The morning peak of NOx may be influenced by vehicle emissions during the morning rush hour, and the early peak of SO2 may be more influenced by vertical changes during the developing mixed-layer depth (Qi et al., 2012). The evening peaks of NOx and SO2 were relatively similar because both were closely related to the MLD decrease and for NOx likely also vehicle emissions during the evening rush hour.
3.4 Influence of meteorological factors
Changes in meteorological factors have considerable effects on the levels of air pollutants. In this section, we investigate the influences of meteorological factors on the variations in NOx and SO2 mixing ratios through statistical plots showing relationships between pollutant concentrations and meteorological factors as well as correlation analysis. The variation characteristics of hourly average mixing ratios of NOx and SO2 along with meteorological parameters are presented in Fig. 5. The data are grouped into three subsets corresponding to time periods I (2006–2009), II (2010–2013) and III (2014–2016).
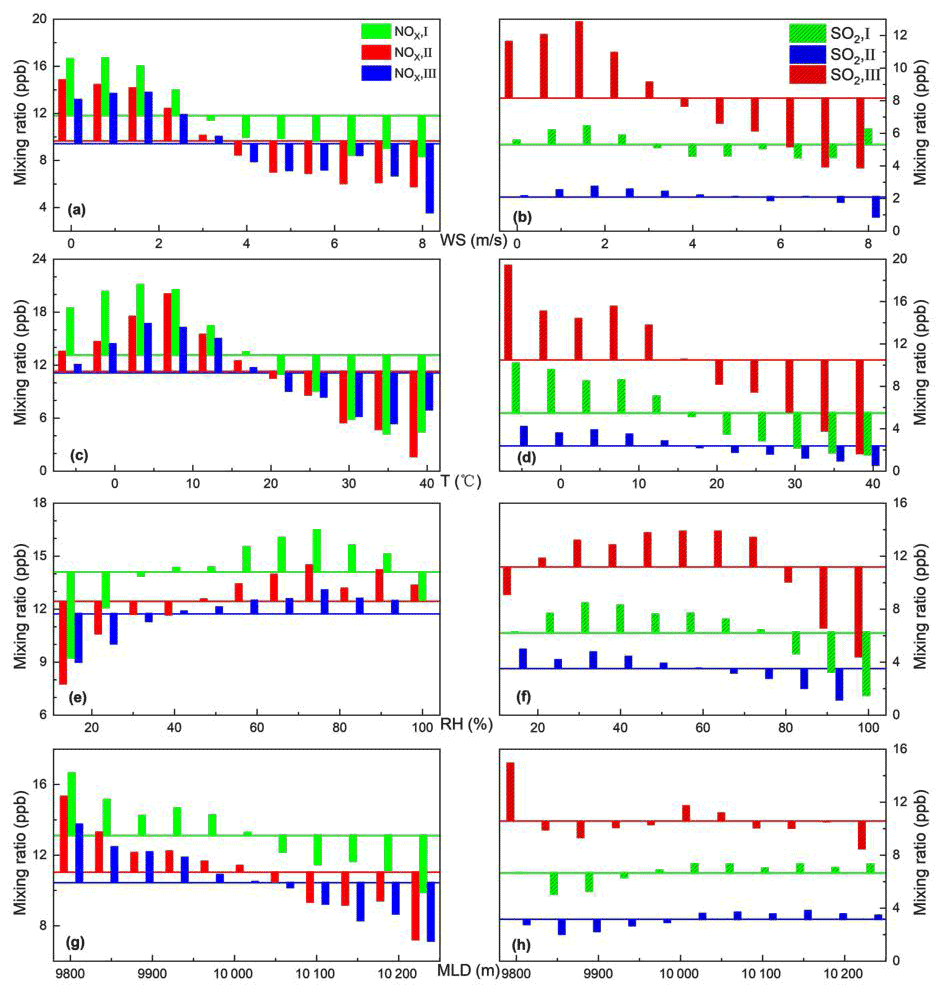
Figure 5Variation characteristics of NOx and SO2 with wind speed (WS; a and b), temperature (T; c and d), relative humidity (RH; e and f) and the mixed-layer depth (MLD; g and h) at LAN during period I (2006–2009), period II (2010–2013) and period III (2014–2016). The horizontal lines in the graph indicate the average values of NOx and SO2 for each period. Columns indicate changes relative to the corresponding mean values.
The variation characteristics of NOx and SO2 with WS (Fig. 5a, b) were consistent during period I, showing decreases in NOx and SO2 with increasing WS. Higher WS facilitated the dilution of NOx and SO2 and vice versa. However, the situation for SO2 was different during period II and III, when the SO2 level was stable with the change in WS. The correlation of T between the two pollutants varied considerably, with the SO2 mixing ratios decreasing nearly monotonically with increasing T (Fig. 5d), whereas NOx increased with increasing T in the low temperature range and decreased with increasing T in the high temperature range (Fig. 5c). Figure 5c indicates a positive correlation between NOx and T in winter and negative correlations in other seasons, but the positive correlation in winter is weak and insignificant (Table 3). Pandey et al. (2008) reported that low T might facilitate the increase in NOx emissions from motor vehicle exhaust. The variations in NOx and SO2 with RH (Fig. 5e, f) exhibit a convex pattern, and the former patterns in three different periods are very consistent, but the latter ones are not at low RH. The correlation between SO2 and RH was stronger than that of NOx and RH (Table 3). The variation characteristics of NOx and SO2 mixing ratios with the MLD exhibited diverse patterns (Fig. 5g, h). The mixing ratio of NOx decreased with increasing MLD. However, the SO2 levels during period II and III remained nearly stable in the whole MLD range, and a slight decline in SO2 with increasing MLD was only observed during period I. The difference in NOx and SO2 mixing ratios with the MLD implies that the NOx sources mostly impacting the LAN site should be mainly in the near-surface layer, such as emissions from motor vehicles and small burners, whereas SO2 may originate from the vertical exchange of elevated sources transported in the higher altitude layer (200–1300 m).
Table 3Pearson correlations among NOx, SO2 and meteorological elements (daily average values).
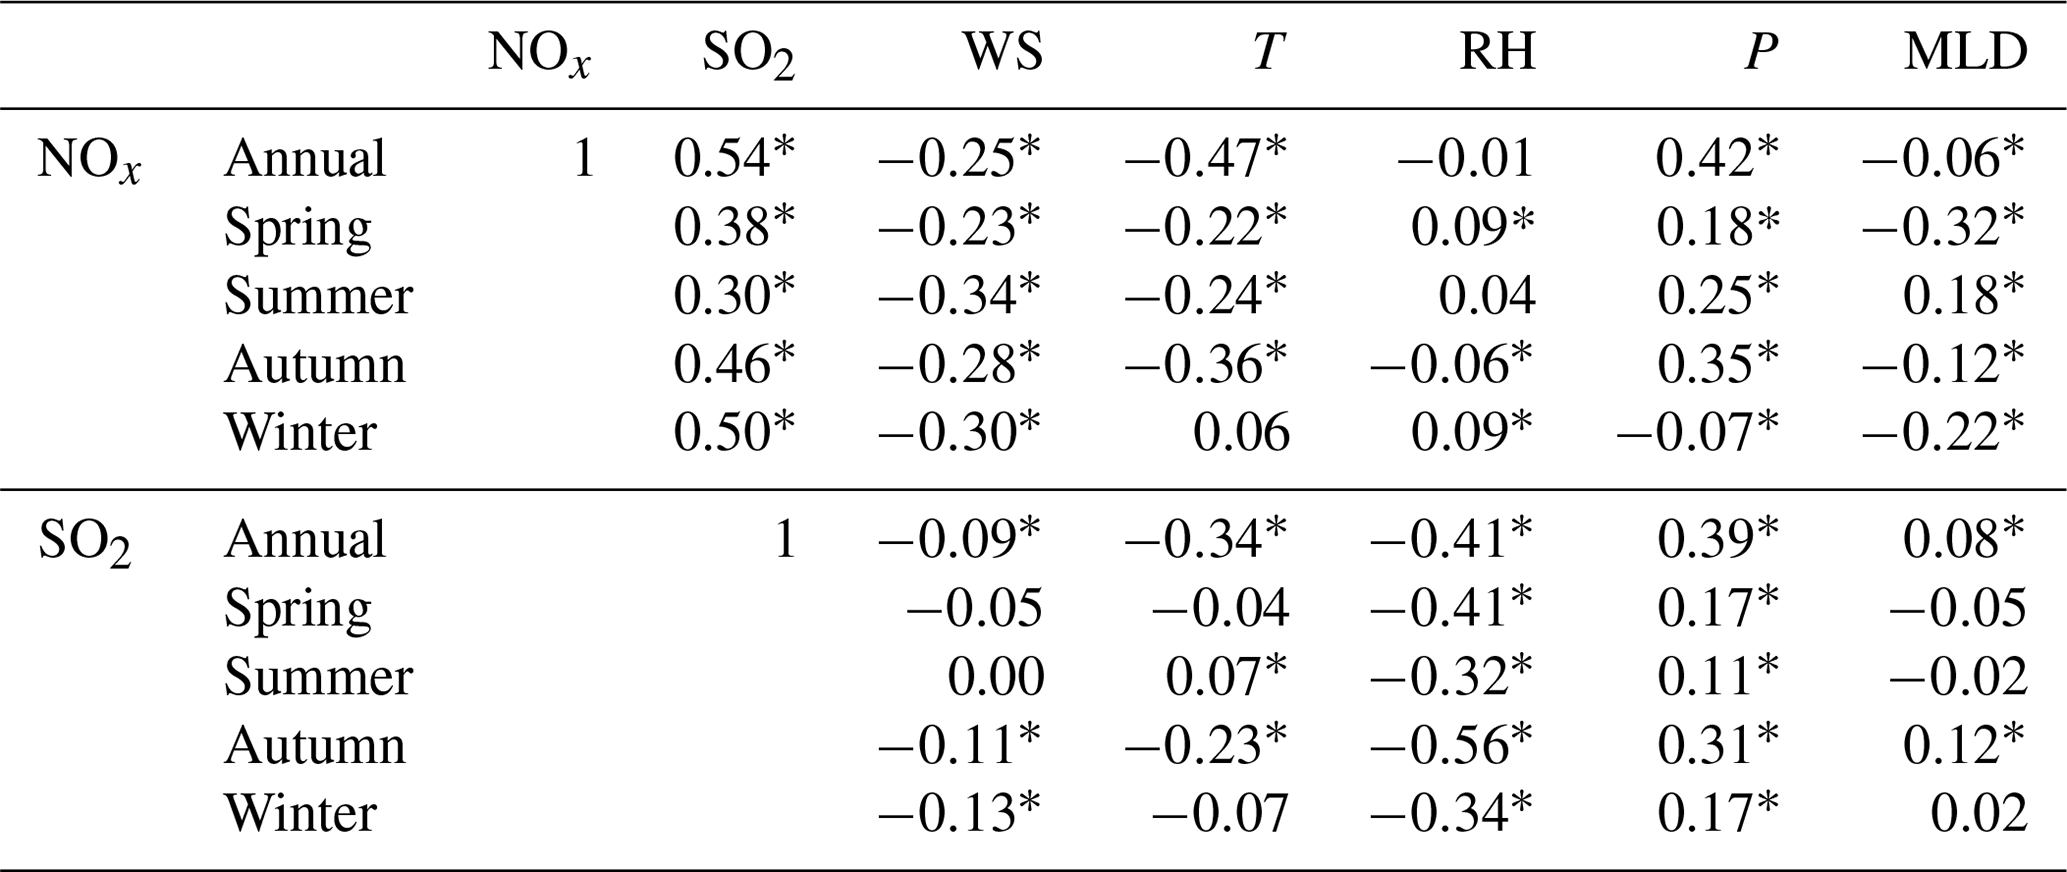
Two-tailed significance test was used. * Significant at 0.05 level of correlation.
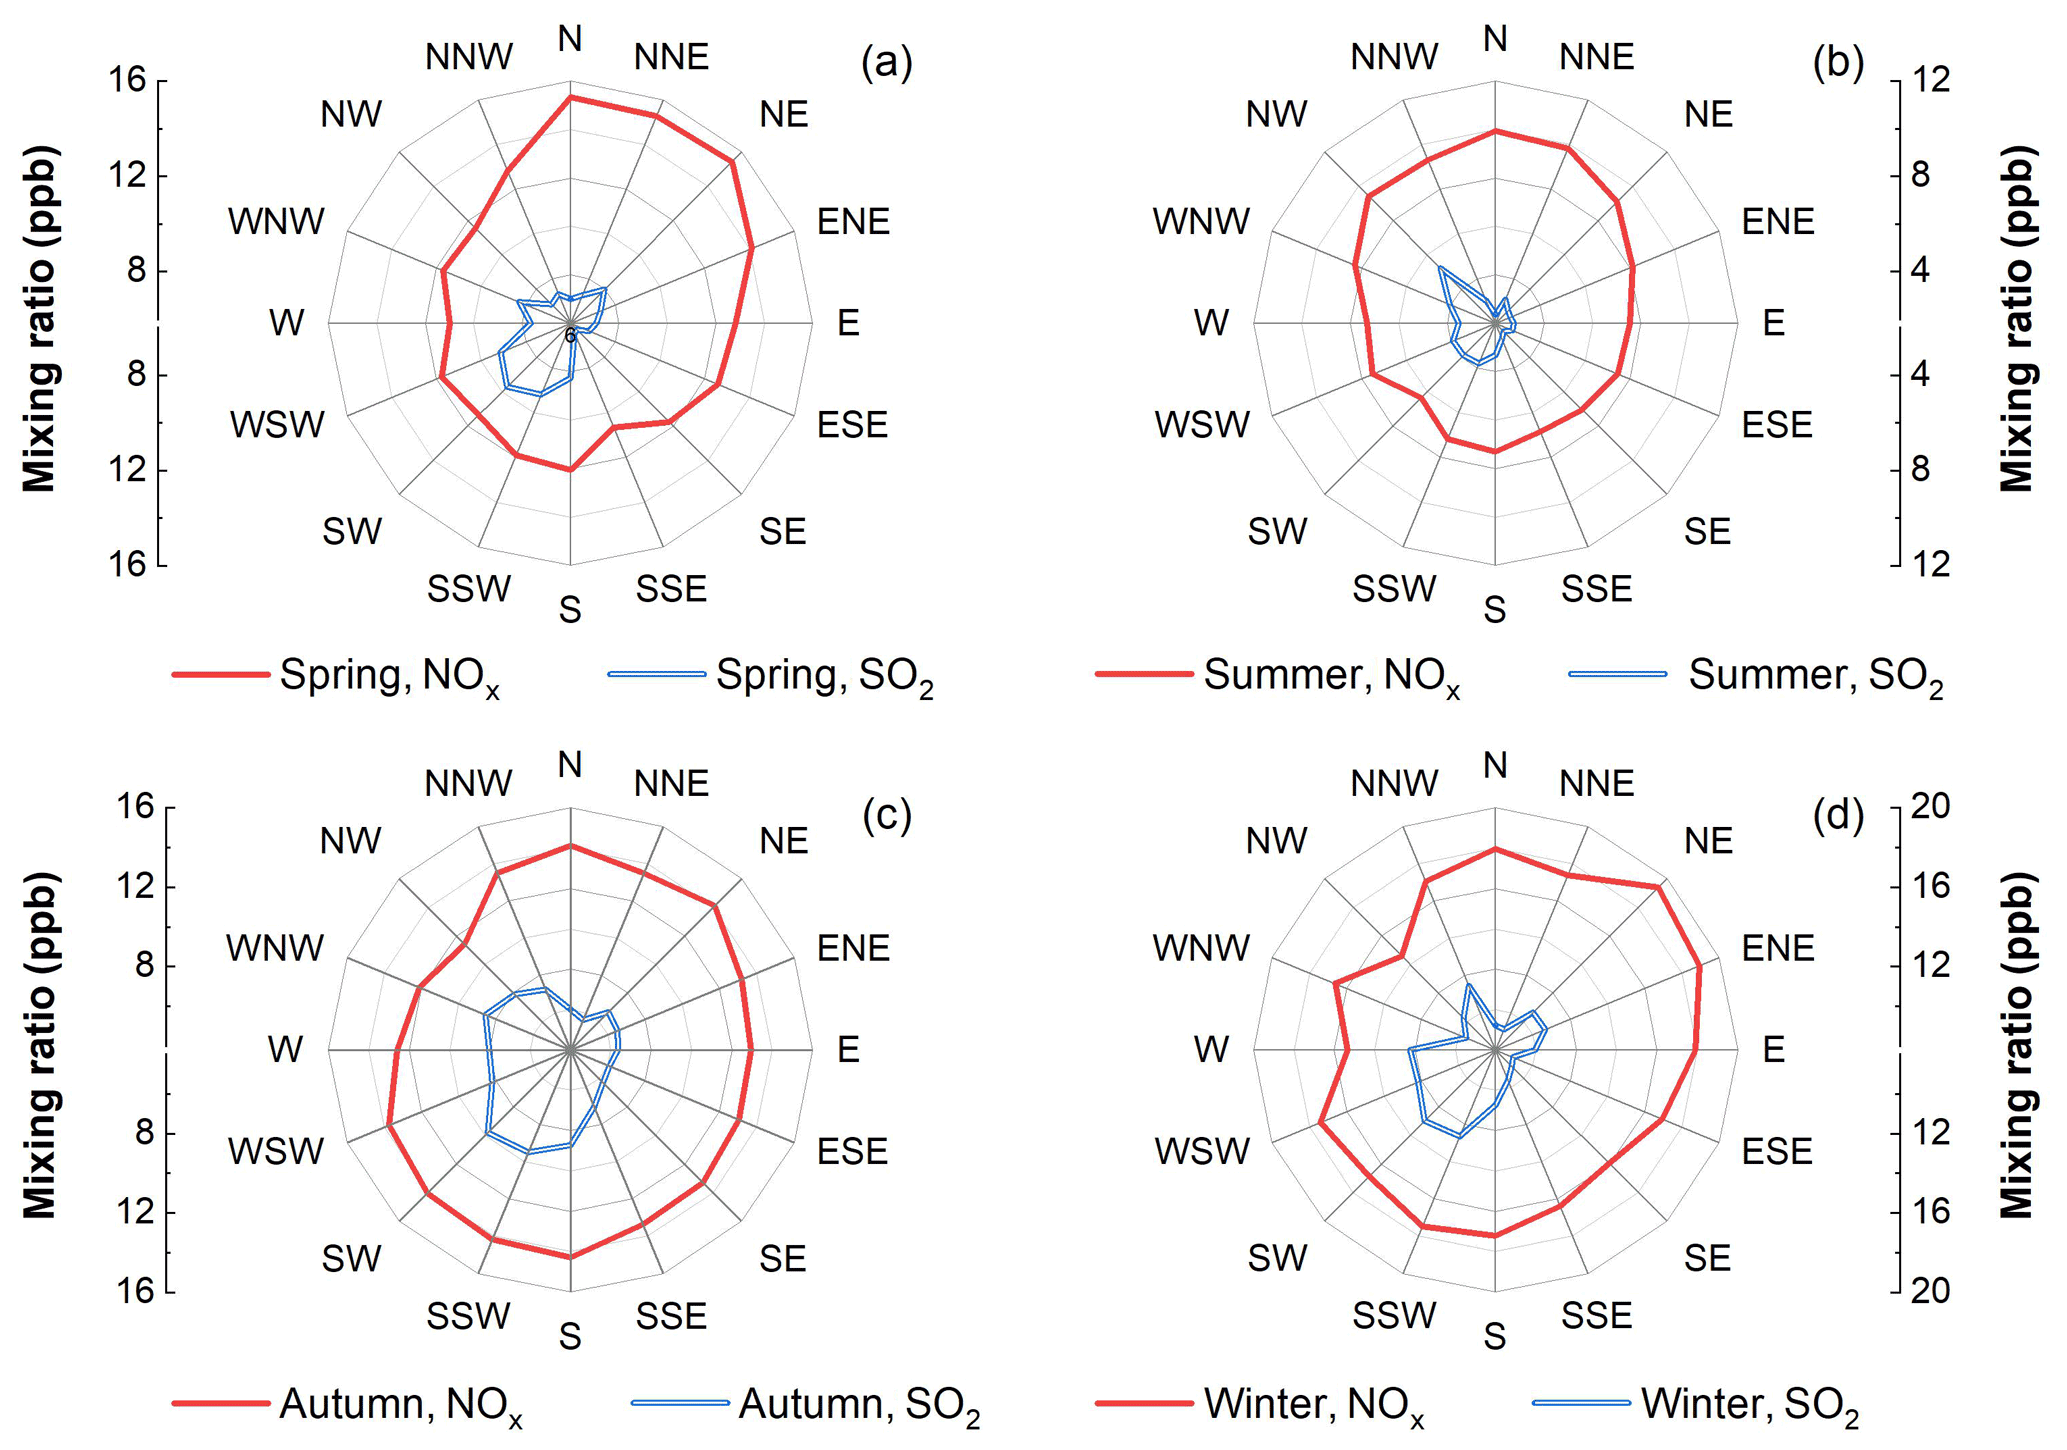
Figure 6 displays the rose diagrams of NOx and SO2 mixing ratios in different seasons. There are some seasonal differences in the dependence of NOx and SO2 on wind direction. In summer, the high mixing ratios of NOx and SO2 were mainly from the NW–NNE and SSW–NW sectors, respectively (Fig. 6b). In other seasons, relatively high NOx and SO2 values were mainly from the N–ENE and S–WSW directions, respectively, under the influences of the dominant and subdominant wind directions (Fig. 2b, d). Overall, NOx and SO2 observed at LAN originated mainly from the NW–ENE and SSW–NW sectors, respectively. However, this result provides only little information about the actual geographic distributions of major NOx and SO2 sources influencing LAN. Therefore, we used the CWT method to identify the PSAs for NOx and SO2. Figure 7 presents the areas from which NOx and SO2 observed at LAN originated. Although the PSAs covered the entire YRD, the PSAs for the highest NOx and SO2 levels appeared mainly in the eastern coastal region, which is closely related to the booming local economy. More obvious provincial differences were observed in a higher PSA for NOx than that for SO2. Temporally, the high PSA (>10 ppb) of NOx and SO2 was most extensive in winter, followed by spring and autumn, with the least extensive PSA in summer. The NOx PSAs over coastal areas were more extensive than those for SO2 in each season. The YRD is one of the five major port clusters in China; thus, this region's ship emissions might be a major cause of this difference (Fan et al., 2016; Wan et al., 2020). The CWT analysis indicated that SO2 was mainly influenced by industrial emissions from inland areas, whereas NOx was mainly influenced by both inland and marine traffic.
3.5 Long-term variations in NOx and SO2 mixing ratios
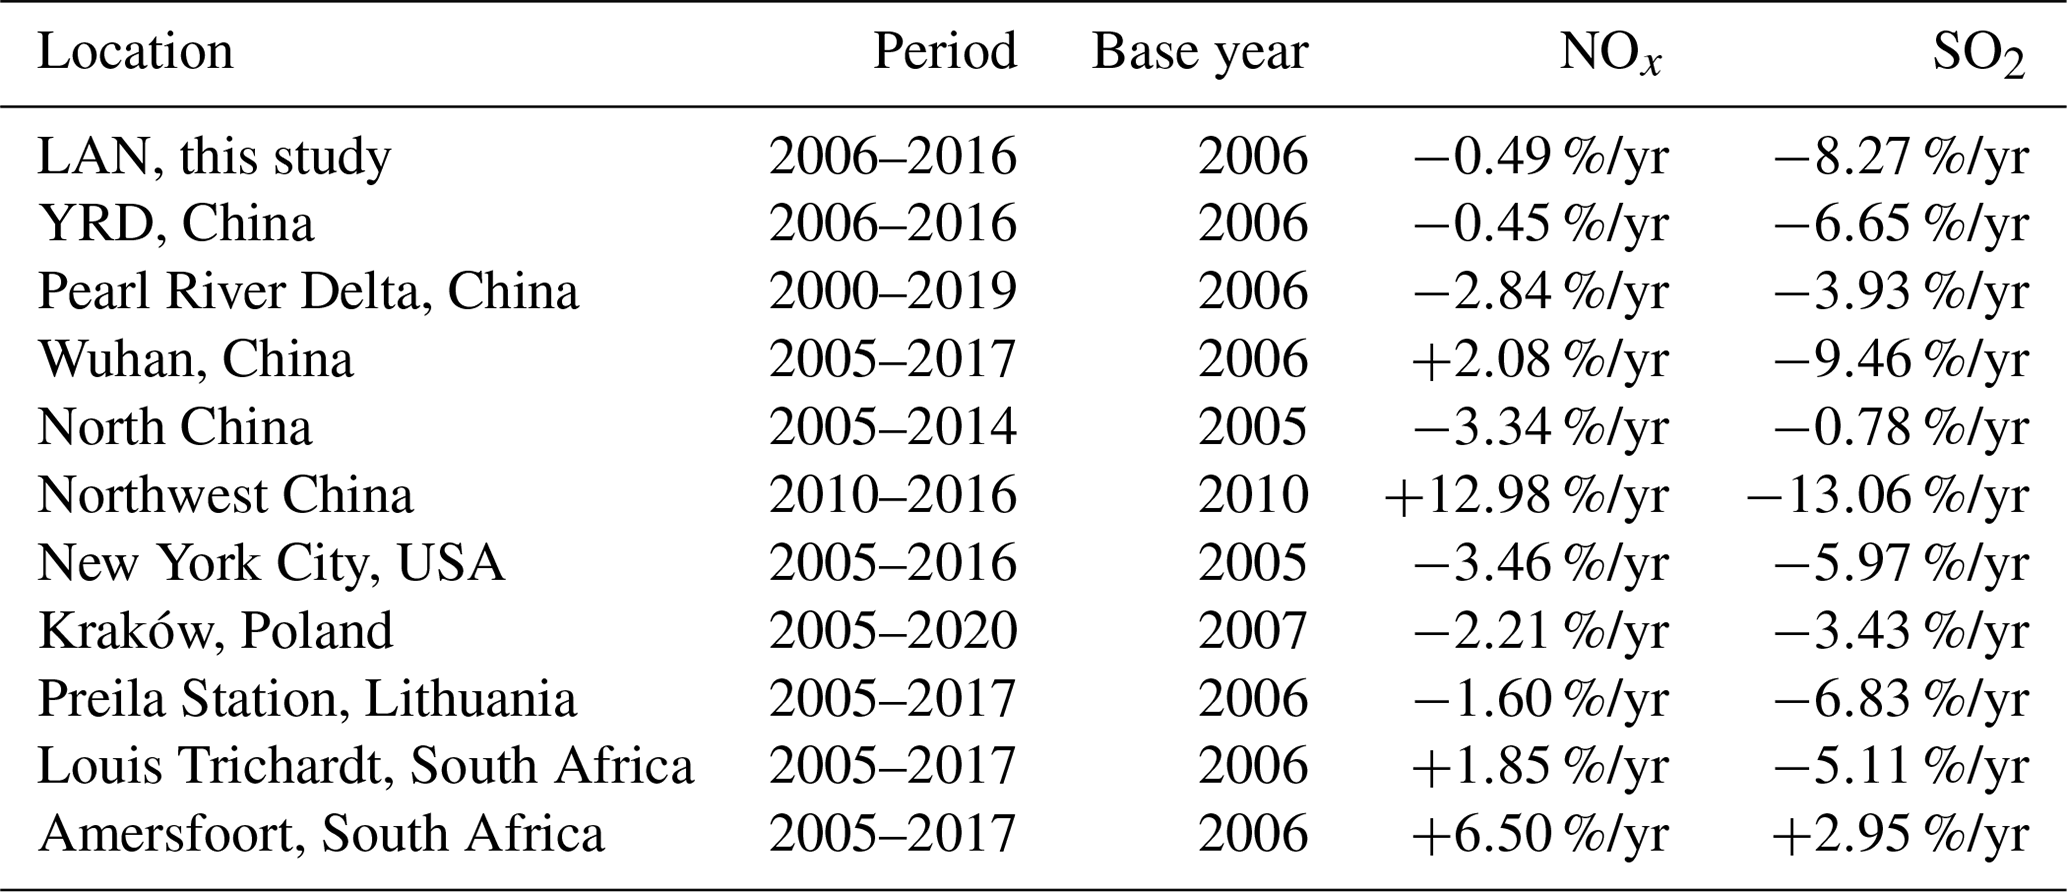
Figure 8 displays the variations in the annual and seasonal average NOx and SO2 mixing ratios observed at LAN during 2006–2016, together with estimated annual emissions in the YRD. The annual average of NOx showed an increase followed by a decrease, while that of SO2 experienced a nearly monotonic decrease. The annual NOx mixing ratio revealed an increase, with a rate of +0.31 ppb/yr (R2=0.28, P=0.16), during 2006–2011 and a significant decreasing trend, with a rate of −0.78 ppb/yr or −5.16 %/yr (R2=0.85, P<0.01), during 2011–2016 (Fig. 8a). The decreasing rate was less than that found in urban Shanghai (−2.1 ppb/yr; Gao et al., 2017). Selecting 2006 as the base year, we compared the annual percentage change in NOx at LAN (−0.49 %/yr) during 2006–2016 with those of other regions over the same period. The Ecological and Environmental Status Bulletin (Department of Ecology and Environment of Shanghai city, 2021a–j; Department of Ecology and Environment of Zhejiang Province, 2021a–k; Department of Ecology and Environment of Jiangsu Province, 2021a–k) reported a similar change of −0.45 %/yr in the YRD region (without data for Anhui Province), reflecting the suitable regional representativeness of LAN. The annual percentage decrease in NOx at LAN and in the YRD was much smaller than those in many regions – for example, the Pearl River Delta in China (−2.84 %/yr; Yan et al., 2020), Kraków in Poland (−2.21 %/yr; Agnieszka and Gruszecka-Kosowska, 2020), at Preila Station in Lithuania (−1.60 %/yr; Davuliene et al., 2021) and in New York City in the United States (−3.46 %/yr; Squizzato et al., 2018) – but more favourable than those in some other regions, such as Wuhan in China (+2.08 %/yr; Li et al., 2020) and Amersfoort (+6.50 %/yr) and Louis Trichardt in South Africa (+1.85 %/yr; Swartz et al., 2020b). Compared with other background regions in China, the annual change in NOx at LAN was less favourable than that in North China (−3.34 %/yr) with a base year of 2005 (Bai et al., 2015) and more favourable than that in Northwest China (+12.98 %/yr) with a base year of 2010 (Li et al., 2019).
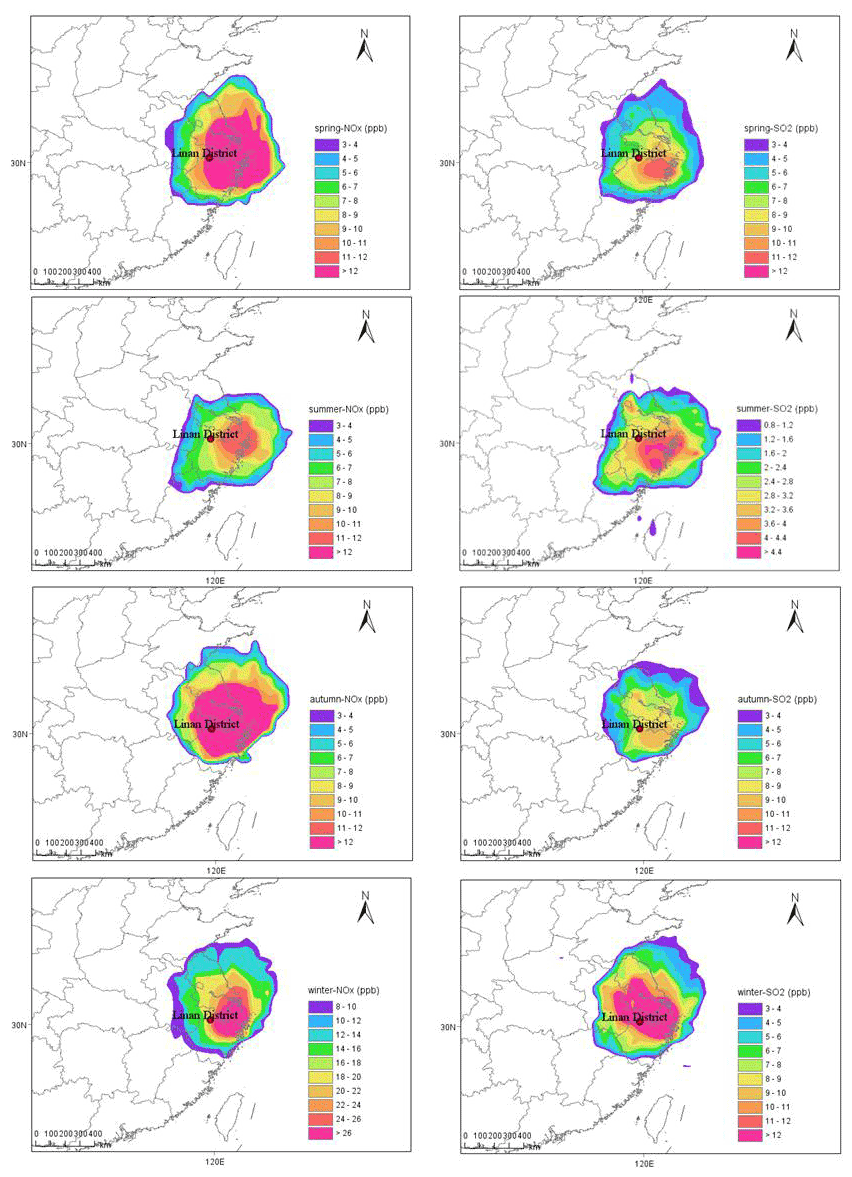
Figure 7Potential source analysis of NOx and SO2 in different seasons at LAN according to concentration-weighted trajectory analysis.
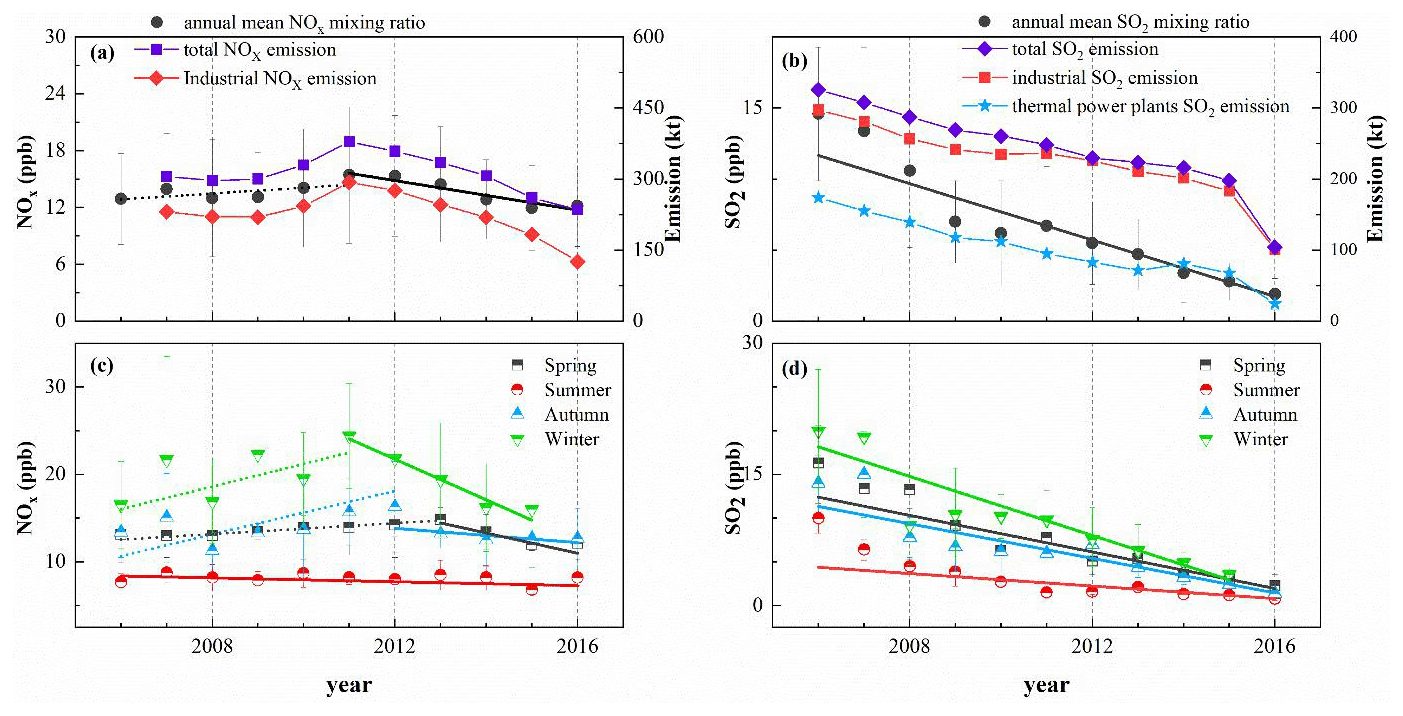
Figure 8Annual mean NOx mixing ratio at LAN (left axis) compared with total NOx emission and industrial NOx emission in the YRD (a, right axis); annual mean SO2 mixing ratio at LAN (left axis) compared with total SO2 emission, industrial SO2 emission and thermal power plant SO2 emission in the YRD (b, right axis); seasonal average annual variation in NOx (c); SO2 (d) at LAN.
Figure 8 also presents the NOx emission data from the China Ecological Environment Bulletin in different years. The change in the annual average NOx mixing ratio was highly correlated with the total NOx emissions (R2=0.92, P<0.001) and total industrial emissions (R2=0.94, P<0.001) in the YRD region. The peak surface NOx mixing ratio was observed in 2011. Since China began to control and reduce NOx emissions as part of the 12th Five-Year Plan (2011–2015) and promulgated the strict Air Pollution Prevention and Control Action Plan in 2013, many flue gas denitrification systems have been installed in coal-fired power plants and heavy industry operations (Zhao et al., 2019), resulting in a decrease in annual NOx emission since 2011. As seen in Fig. 8a, the total and the industrial NOx emission showed increasing trends with 5.84 %/yr (R2=0.91, P=0.011) and 6.3 %/yr (R2=0.91, P=0.006), respectively, from 2007–2011 and −7.63 %/yr (R2=0.91, P=0.003) and −8.30 %/yr (R2=0.84, P=0.011), respectively, from 2011–2016. The seasonal long-term trends of NOx always resembled the annual trend. While seasonal NOx mixing ratios in winter, autumn and spring increased before 2011 and then decreased, just like the annual NOx mixing ratio did, the seasonal NOx mixing ratio in summer exhibited a nearly monotonic decreases from 2006 to 2016 at 0.11 ppb/yr (R2=0.20, P=0.09) (Fig. 8c). Regarding the seasonal linear fitting trends, the highest increasing and declining trends were observed in winter (+1.29 ppb/yr, R2=0.52, P=0.06; −2.33 ppb/yr, R2=0.94, P<0.01), followed by autumn (+1.24 ppb/yr, R2=0.65, P=0.02; −0.41 ppb/yr, R2=0.12, P=0.30) and spring (+0.31 ppb/yr, R2=0.93, P<0.001; −1.16 ppb/yr, R2=0.76, P=0.09). We found a significant correlation (P<0.05) between surface NO2 mixing ratio and OMI NO2 vertical column density over the YRD (Fig. S3b). To better compare the changes in the two over the same period, we have fitted a linear fit to the data from 2006 to 2011 and from 2011 to 2016, respectively (Fig. S3a). The surface and the OMI NO2 increased at 2.23 %/yr (R2=0.264, P=0.17) and 5.87 %/yr (R2=0.855, P<0.01) (based on 2006), respectively, during the up period and decreased at −4.98 %/yr (R2=0.823, P<0.01) and −4.22 %/yr (R2=0.897, P<0.01), respectively, during the declining period.
Annual mean SO2 mixing ratios revealed a significant decreasing trend (−0.99 ppb/yr, R2=0.92, P<0.001) during 2006–2016 (Fig. 8b). The annual decreasing rate of SO2 at LAN (−8.27 %/yr) was more rapid than those in the whole YRD (−6.65 %/yr), in the background area in North China (−0.78 %/yr; Bai et al., 2015) and in Northwest China (−5.4 %/yr; Li et al., 2019). Different from NOx, the annual average of SO2 at LAN decreased more rapidly than in most of the aforementioned regions (Table 4), which demonstrates the effectiveness of the policies in controlling SO2 emission during the observation period in the YRD.
Table 4Annual percentage changes in NOx and SO2 in various regions.
The change in the annual SO2 mixing ratio was closely correlated with changes in thermal power plant SO2 industrial emission (R2=0.89, P<0.001), industrial SO2 emission (R2=0.76, P<0.001) and total SO2 emission (R2=0.78, P<0.001) in the YRD (Fig. 8b). In 2011, the SO2 mixing ratio rebounded slightly, with an increase of 9 % compared with the value in 2010. This seemed to be consistent with the variation in industrial SO2 emission. The weakening impact of the global financial crisis and the recovery of industry in the YRD region may explain this slight rebound in SO2 emissions (Xie, 2017b). Seasonally, the SO2 mixing ratio exhibited the strongest decreasing trend (−1.69 ppb/yr, R2=0.90, P<0.001) in winter, followed by spring (−1.05 ppb/yr, R2=0.97, P<0.001) and autumn (−0.99 ppb/yr, R2=0.93, P<0.001), with the smallest decreasing trend observed in summer (−0.35 ppb/yr, R2=0.61, P<0.001).
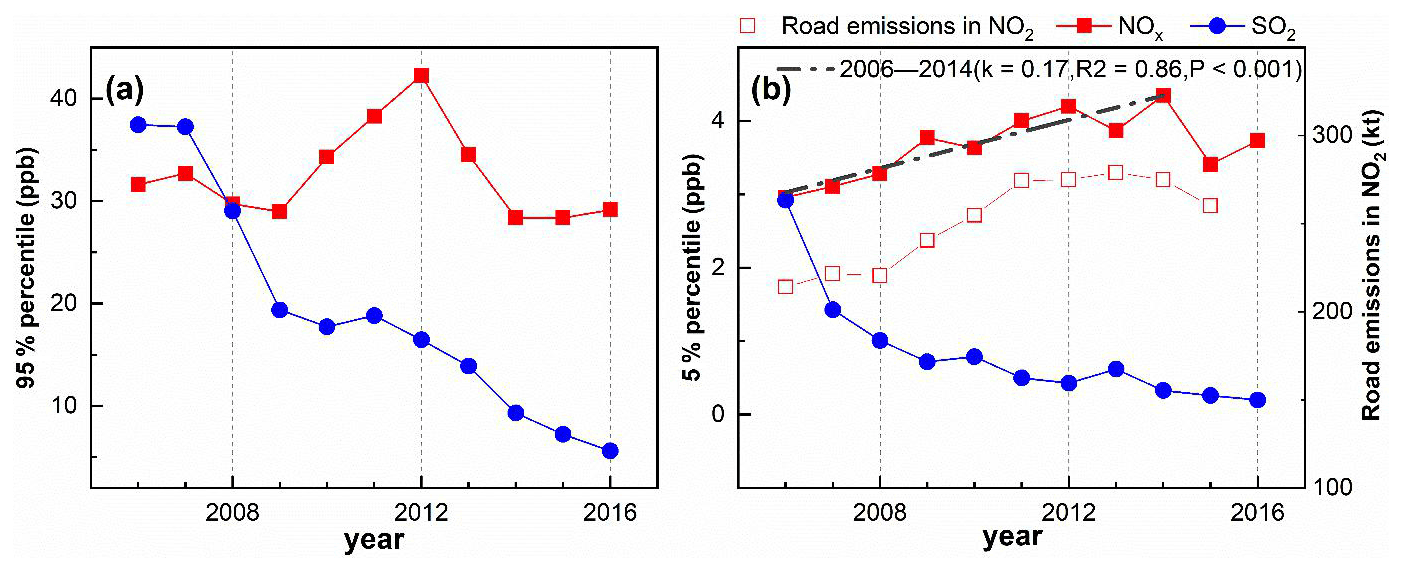
Figure 9Annual variations in the 95th percentile concentration (a) and the 5th percentile concentration (b) of NOx and SO2 at LAN; data of NO2 road emissions in the YRD are obtained from the REASv3.2 data sets in the Regional Emission Inventory in Asia (Kurokawa and Ohara, 2020).
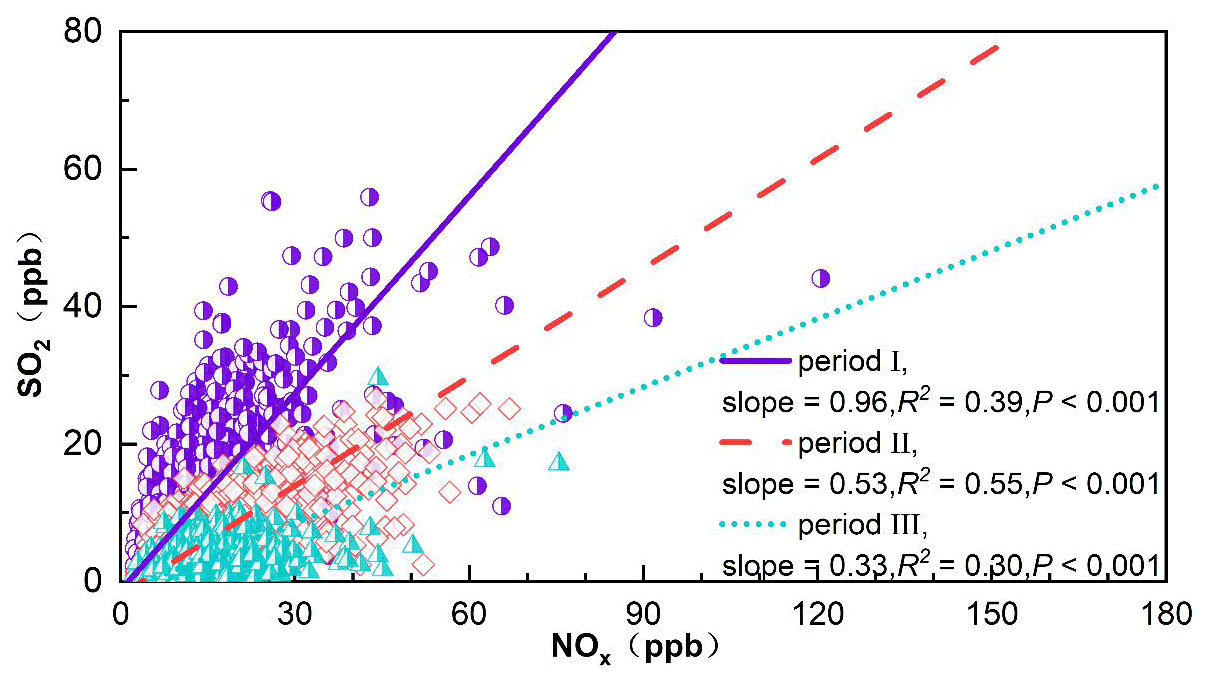
Figure 10Reduced major axis regressions on the scatter plots of daily average SO2 and NOx mixing ratios during three periods at LAN.
In the annual statistics, the 95th and 5th percentile of the pollutants' concentrations can be regarded as influenced by polluted and clean air masses, respectively. The annual trends of the 95th percentile of NOx and SO2 (Fig. 9a) exhibited similar patterns to the corresponding trends in annual average mixing ratios (Fig. 8a, b), but the peak of the 95th percentile of NOx occurred in 2012 instead of in 2011. Hao and Song (2018) noted that the NOx emissions from vehicles peaked in Hangzhou and Ningbo in 2012, which may explain the peak of the 95th percentile occurring later than that in the annual data. Moreover, the 95th percentile of the SO2 mixing ratio decreased at a remarkable rate (−8.9 ppb/yr) from 2007 to 2009, which is approximately 2.8 times as strong as the overall rate of decrease during the 11-year period (−3.2 ppb/yr). Substantial decreases were also found in the 95th percentiles of the CO mixing ratio (Chen et al., 2020) and the NOx mixing ratio from 2007 to 2009 at LAN. It is highly possible that this phenomenon was caused by reduced industrial productions and related emissions following the 2008 global financial crisis. As displayed in Fig. 9b, the level of NOx in cleaner air mass arriving at LAN exhibited an increasing trend, with a rate of +0.17 ppb/yr, from 2006 to 2014 (R2=0.86, P<0.001) and then declined after 2014. This is inconsistent with the trend of the 95th percentile of the NOx mixing ratio, suggesting that the polluted and relative clean air masses arriving at LAN were impacted by different emission sources of NOx. Interestingly, the 5th percentile of the NOx level was significantly correlated (R2=0.74, P<0.001) with the road emissions of NO2 in the YRD (Kurokawa and Ohara, 2020), suggesting that the lower end of NOx mixing ratios was mainly determined by long-range transported background air containing NOx from road emissions, while the high end was mainly associated with emissions from industrial production as well as power generation. The level of SO2 in cleaner air masses exhibited a decreasing trend at a rate of −0.2 ppb/yr (R2=0.61, P<0.01).
Figure 10 displays the scatter plot of the daily average SO2 and NOx mixing ratio during period I, II and III at LAN. Reduced major axis regressions were performed on three data subsets. The daily mean mixing ratios of NOx were significantly (R2=0.29, P<0.001) and positively correlated with those of SO2. The ratios of SO2 to NOx (SO2 NOx) were 0.96, 0.53 and 0.33 (slopes in the regression lines) during period I, II and III, respectively. The decreasing SO2 NOx suggests that SO2 emissions were more efficiently reduced than NOx emissions. Such a change in emission ratio not only affected ambient SO2 NOx but also the ratios of sulfatenitrate in PM2.5 in Shanghai from 2009 to 2012 (Zhao et al., 2015) and SO NO in rainwater in Hangzhou (Yang, 2018; Xu et al., 2019). These results indicate that NOx has been gaining a more important role in the processes of precipitation acidification and secondary inorganic aerosol formation in the YRD region. Therefore, NOx emission reduction should be further strengthened in subsequent air pollution control measures and legislation in the YRD region.
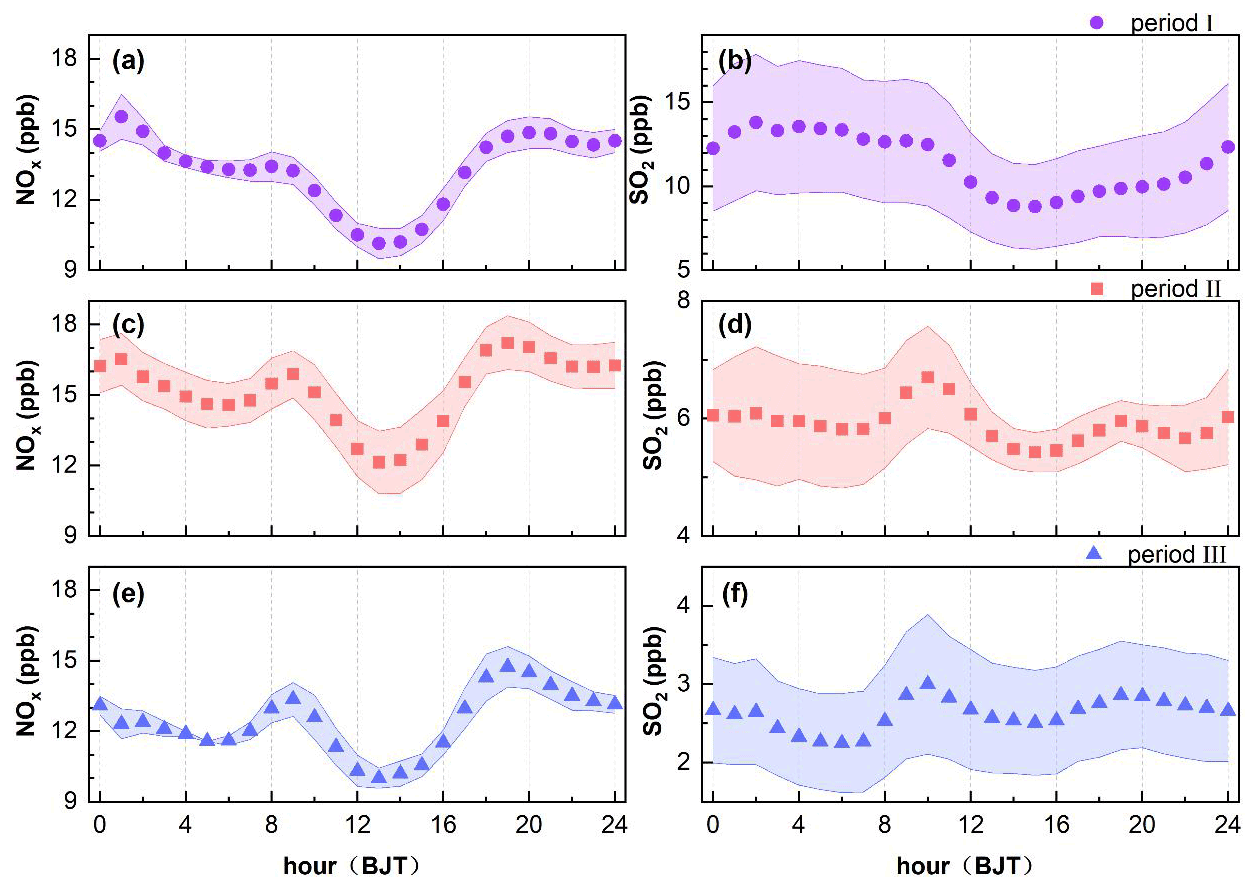
Figure 11Average diurnal variations in NOx (a, c, e) and in SO2 (b, d, f) during period I (2006–2009), period II (2010–2013) and period III (2014–2016) at LAN.
Figure 11 reveals the average diurnal variations in NOx and SO2 during the period I, II and III. During these three periods, the average diurnal curves in NOx exhibited a valley around 13:00, with minimum values of 7.5, 11.2 and 9.2 ppb, respectively. The morning and evening NOx peaks, which occurred at 09:00 and 19:00, respectively, became increasingly distinct over time (Fig. 11a, c, e). The morning and evening peak NOx values were 9.8 and 10.9 ppb during period I, 14.6 and 15.8 ppb during period II, and 12.3 and 13.6 ppb during period III. The gradual protruding of the morning and evening peaks should be mainly caused by increasing vehicle emissions during the morning and evening rush hours. According to the 2010 Annual Report on China's Motor Vehicle Pollution Prevention and Control, the state introduced a series of policies to promote automobile and motorbike ownership in response to the international financial crisis and to ensure economic growth; these policies effectively stimulated the automobile market (Mi and Qin, 2011; Hao and Song, 2018) and led to an increase in vehicle emissions and atmospheric oxidation in the YRD region (Yu et al., 2019). Thus, the NOx mixing ratios around the morning and evening peaks were much higher than those at night during period II (Fig. 11e), which differs much from the pattern during period I (Fig. 11a). The disappearance of the small peak around 01:00 at night during 2012–2016 may be related to the introduction of stricter air pollution control policies for factories that emit at night. Small peaks in NOx and SO2 occurred between 01:00 and 02:00, which might be related to nighttime emissions from unscrupulous enterprises (Fan et al., 2016) or more production activities with lower electricity prices after midnight in response to the financial pressure of the 2008 economic crisis and the corresponding increase in electricity prices for industrial users (Sun et al., 2018). In spite of these two reasons, however, it is really hard to tell exactly why these small peaks dominate after midnight.
The average diurnal variation curve of SO2 at LAN during period I (Fig. 11b) is of the single-valley type, with an average valley mixing ratio of 6.5 ppb. After 2010, the peak shape changed from the single-valley type to the double-peak and double-valley type (Fig. 11d, f). The valleys of SO2 during period II occurred at 06:00 and 15:00, with average mixing ratios of 5.2 and 4.7 ppb, and the peaks occurred at 10:00 and 19:00, with average mixing ratios of 5.9 and 5.3 ppb, respectively. The NOx and SO2 evening peaks occurred at the same time (19:00), but the SO2 morning peak time was 1 h later than the NOx morning peak (09:00), indicating that the NOx and SO2 morning peaks were influenced by different sources, whereas the evening peaks were from similar sources. The formation of the SO2 morning peak may be mainly related to the vertical exchange during the development of the atmospheric boundary layer and the air in the upper layer with a higher SO2 mixing ratio than that at the surface draining down. The formation of the evening peaks of NOx and SO2 may be mainly related to the increase in motor vehicle and residential sources emissions, which are stronger in the rush and cooking hours, and those of SO2 may be probably more due to the reduction in power plant emissions. Compared with those during period II, the SO2 mixing ratios at the morning and evening peaks in period III were approximately 3 ppb lower, suggesting that the large emitters that release SO2 all the time were emitting less and less.
In this study, we characterized the seasonal and diurnal variations and analysed the long-term trends in NOx and SO2 mixing ratios in the YRD background area during the period of 2006–2016. We also tried to understand the variations and trends in terms of the changes in emissions and meteorological conditions. The hourly average mixing ratios of NOx (NO2) and SO2 at the LAN background station varied in the ranges of 0.4–165.6 (0.2–106.8) and 0.1–128.6 ppb, respectively. The levels of NOx and SO2 were highest in winter, followed by spring and autumn, and lowest in summer. Although a significant correlation was observed between the daily average mixing ratios of NOx and SO2 (R2=0.29, P<0.001), their average diurnal variation characteristics differed from each other, with morning peaks in SO2 occurring later than in NOx.
The annual average mixing ratio of NOx (NO2) fluctuated upwards between 2006 and 2011 (+0.31 ppb/yr, P=0.16) (+0.27 ppb/yr, P=0.17), with a mean value of 13.8 ppb, and then began to decrease significantly from 2011 to 2016 (−0.78 ppb/yr, P<0.01) (−0.70 ppb/yr, P<0.01), with a mean value of 13.7 ppb (12.5 ppb). The annual average mixing ratio of NOx was significantly correlated with the industrial (R2=0.81, P<0.001, 2006–2016) and total (R2=0.88, P<0.001, 2006–2016) NOx emissions in the YRD; so were NOx mixing ratios in LAN with OMI NO2 column density over YRD (Fig. S3b, R2=0.61, P<0.01). The annual 95th percentile of NOx mixing ratios followed a similar trend as the annual average, whereas the 5th percentile levels fluctuated upwards at +0.17 ppb/yr from 2006 to 2014, reflecting the increasing regional background level of NOx in the YRD during those years, which was related to the continued increase in vehicle numbers in the YRD. The annual average mixing ratio of SO2 exhibited a rapid and significant decreasing trend (−0.99 ppb/yr, P<0.001) and was closely correlated to total SO2 emission (R2=0.78, P<0.001), total SO2 industrial emission (R2=0.76, P<0.001) and total thermal power plant SO2 industrial emission (R2=0.89, P<0.001) in the YRD. The reduced emissions resulted from the strong and effective introduction of national control policies. The yearly decrease in SO2 NOx ratios suggests a more effective reduction in SO2 than in NOx. Thus, NOx emission control needs to be further strengthened in the future.
We found gradual changes in diurnal patterns of both gases. After 2010, both NOx and SO2 showed diurnal patterns with two peaks and two valleys. The morning peak of NOx occurred at approximately 09:00, earlier than that of SO2 (10:00), and the evening peak occurred at the same time as SO2 (19:00). The morning and evening peaks of both gases protruded gradually. This phenomenon can hardly be attributed to changes in meteorological conditions (such as the MLD). We believe that changes in major sources of NOx and SO2 should be the cause, with increasing NOx emission from vehicles resulting in higher NOx peaks during rush hours and reduced SO2 emissions from power plants and other large point sources making the SO2 peaks relatively protruding.
The observation data used in this study can be accessed via https://doi.org/10.7910/DVN/DQTBT0 (Yin et al., 2021).
The supplement related to this article is available online at: https://doi.org/10.5194/acp-22-1015-2022-supplement.
QY wrote the paper; WL and XX developed the idea, formulated the research goals and edited the paper. QM and JY carried out the measurement of NOx and SO2 and analysed the meteorological data.
The contact author has declared that neither they nor their co-authors have any competing interests.
Publisher's note: Copernicus Publications remains neutral with regard to jurisdictional claims in published maps and institutional affiliations.
This study was funded by the National Natural Science Foundation of China (grant nos. 91744206 and 21876214).
This research has been supported by the National Natural Science Foundation of China (grant nos. 91744206 and 21876214).
This paper was edited by Steven Brown and reviewed by two anonymous referees.
Agnieszka, P. T. and Gruszecka-Kosowska: The Condition of Air Pollution in Kraków, Poland, in 2005–2020, with Health Risk Assessment, Int. J. Env. Res. Pub. He., 17, E6063, https://doi.org/10.3390/ijerph17176063, 2020.
Bai, J., Wu, J., Chai, W., Wang, P., and Wang, G.: Long-Term Variation of Trace Gases and Particulate Matter at an Atmospheric Background Station in North China, Front. Earth Sci., 248–263, https://doi.org/10.12677/ag.2015.53025, 2015.
Chen, L.: Measure and Study on the Atmospheric Pollutants in Three Typical Regional Background Stations of China, M.S. thesis, Lanzhou University, China, 69 pp., 2012.
Cheng, L., Ji, D., He, J., Li, L., Du, L., Cui, Y., Zhang, H., Zhou, L., Li, Z., and Zhou, Y.: Characteristics of air pollutants and greenhouse gases at a regional background station in Southwestern China, Aerosol. Air. Qual. Res, 19, 1007–1023, https://doi.org/10.4209/aaqr.2018.11.0397, 2019.
Chen, Y., Ma, Q., Lin, W., Xu, X., Yao, J., and Gao, W.: Measurement report: Long-term variations in carbon monoxide at a background station in China's Yangtze River Delta region, Atmos. Chem. Phys., 20, 15969–15982, https://doi.org/10.5194/acp-20-15969-2020, 2020.
Cristofanelli, P., Landi, T. C., Calzolari, F., Duchi, R., Marinoni, A., Rinaldi, M., and Bonasoni, P.: Summer atmospheric composition over the Mediterranean basin: Investigation on transport processes and pollutant export to the free troposphere by observations at the WMO/GAW Mt. Cimone global station (Italy, 2165 m a.s.l.), Atmos. Environ., 141, 139–152, https://doi.org/10.1016/j.atmosenv.2016.06.048, 2016.
Cui, Y., Lin, J., Song, C., Liu, M., Yan, Y., Xu, Y., and Huang, B.: Rapid growth in nitrogen dioxide pollution over Western China, 2005–2013, Atmos. Chem. Phys., 16, 6207–6221, https://doi.org/10.5194/acp-16-6207-2016, 2016.
Davuliene, L., Jasineviciene, D., Garbariene, I., Andriejauskiene, J., Ulevicius, V., and Bycenkiene, S.: Long-term air pollution trend analysis in the South-eastern Baltic region, 1981–2017, Atmos. Res., 247, 105191, https://doi.org/10.1016/j.atmosres.2020.105191, 2021.
Deng, J., Guo, H., Zhang, H., Zhu, J., Wang, X., and Fu, P.: Source apportionment of black carbon aerosols from light absorption observation and source-oriented modeling: an implication in a coastal city in China, Atmos. Chem. Phys., 20, 14419–14435, https://doi.org/10.5194/acp-20-14419-2020, 2020.
Department of Ecology and Environment of Zhejiang Province, Bulletin on the ecological environment of Zhejiang Province in 2006, available at: http://sthjt.zj.gov.cn/art/2007/6/5/art_1201912_13471624.html, last access: 24 June 2021a.
Department of Ecology and Environment of Zhejiang Province, Bulletin on the ecological environment of Zhejiang Province in 2007, available at: http://sthjt.zj.gov.cn/art/2008/6/5/art_1201912_13471634.html, last access: 24 June 2021b.
Department of Ecology and Environment of Zhejiang Province, Bulletin on the ecological environment of Zhejiang Province in 2008, available at: http://sthjt.zj.gov.cn/art/2009/6/5/art_1201912_13471647.html, last access: 24 June 2021c.
Department of Ecology and Environment of Zhejiang Province, Bulletin on the ecological environment of Zhejiang Province in 2009, available at: http://sthjt.zj.gov.cn/art/2010/6/5/art_1201912_13471671.html, last access: 24 June 2021d.
Department of Ecology and Environment of Zhejiang Province, Bulletin on the ecological environment of Zhejiang Province in 2010, available at: http://sthjt.zj.gov.cn/art/2011/6/3/art_1201912_13471687.html, last access: 24 June 2021e.
Department of Ecology and Environment of Zhejiang Province, Bulletin on the ecological environment of Zhejiang Province in 2011, available at: http://sthjt.zj.gov.cn/art/2012/6/4/art_1201912_15028444.html, last access: 24 June 2021f.
Department of Ecology and Environment of Zhejiang Province, Bulletin on the ecological environment of Zhejiang Province in 2012, available at: http://sthjt.zj.gov.cn/art/2013/6/5/art_1201912_15028442.html, last access: 24 June 2021g.
Department of Ecology and Environment of Zhejiang Province, Bulletin on the ecological environment of Zhejiang Province in 2013, available at: http://sthjt.zj.gov.cn/art/2014/6/4/art_1201912_13471699.html, last access: 24 June 2021h.
Department of Ecology and Environment of Zhejiang Province, Bulletin on the ecological environment of Zhejiang Province in 2014, available at: http://sthjt.zj.gov.cn/art/2015/6/3/art_1201912_13471712.html, last access: 24 June 2021i.
Department of Ecology and Environment of Zhejiang Province, Bulletin on the ecological environment of Zhejiang Province in 2015, available at: http://sthjt.zj.gov.cn/art/2016/6/2/art_1201912_13471725.html, last access: 24 June 2021j.
Department of Ecology and Environment of Zhejiang Province, Bulletin on the ecological environment of Zhejiang Province in 2016, available at: http://sthjt.zj.gov.cn/art/2017/6/2/art_1201912_13471748.html, last access: 24 June 2021k.
Department of Ecology and Environment of Jiangsu Province, Bulletin on the ecological environment of Jiangsu Province in 2006, available at: http://hbt.jiangsu.gov.cn/art/2007/3/28/art_1649_3939925.html, last access: 24 June 2021a.
Department of Ecology and Environment of Jiangsu Province, Bulletin on the ecological environment of Jiangsu Province in 2007, available at: http://hbt.jiangsu.gov.cn/art/2008/3/28/art_1649_3939926.html, last access: 24 June 2021b.
Department of Ecology and Environment of Jiangsu Province, Bulletin on the ecological environment of Jiangsu Province in 2008, available at: http://hbt.jiangsu.gov.cn/art/2009/6/5/art_1649_3939927.html, last access: 24 June 2021c.
Department of Ecology and Environment of Jiangsu Province, Bulletin on the ecological environment of Jiangsu Province in 2009, available at: http://hbt.jiangsu.gov.cn/art/2010/6/22/art_1649_3939928.html, last access: 24 June 2021d.
Department of Ecology and Environment of Jiangsu Province, Bulletin on the ecological environment of Jiangsu Province in 2010, available at: http://hbt.jiangsu.gov.cn:8080/art/2011/6/2/art_1677_4232467.html, last access: 24 June 2021e.
Department of Ecology and Environment of Jiangsu Province, Bulletin on the ecological environment of Jiangsu Province in 2011, available at: http://www.jiangsu.gov.cn/art/2012/5/30/art_46750_2680095.html, last access: 24 June 2021f.
Department of Ecology and Environment of Jiangsu Province, Bulletin on the ecological environment of Jiangsu Province in 2012, available at: http://hbt.jiangsu.gov.cn/art/2013/6/5/art_1649_3939931.html, last access: 24 June 2021g.
Department of Ecology and Environment of Jiangsu Province, Bulletin on the ecological environment of Jiangsu Province in 2013, available at: https://news.bjx.com.cn/html/20140604/515937.shtml, last access: 24 June 2021h.
Department of Ecology and Environment of Jiangsu Province, Bulletin on the ecological environment of Jiangsu Province in 2014, available at: https://huanbao.bjx.com.cn/news/20150604/626623.shtml, last access: 24 June 2021i.
Department of Ecology and Environment of Jiangsu Province, Bulletin on the ecological environment of Jiangsu Province in 2015, available at: http://www.jiangsu.gov.cn/art/2016/6/24/art_46580_2555980.html, last access: 24 June 2021j.
Department of Ecology and Environment of Jiangsu Province, Bulletin on the ecological environment of Jiangsu Province in 2016, available at: http://hbt.jiangsu.gov.cn/art/2017/4/15/art_1649_3939935.html, last access: 24 June 2021k.
Department of Ecology and Environment of Shanghai city, Bulletin on the ecological environment of Shanghai city in 2006, available at: https://link.sthj.sh.gov.cn/file/2006bulletin/contents.htm, last access: 24 June 2021a.
Department of Ecology and Environment of Shanghai city, Bulletin on the ecological environment of Shanghai city in 2007, available at: https://link.sthj.sh.gov.cn/file/2007bulletin/index.htm, last access: 24 June 2021b.
Department of Ecology and Environment of Shanghai city, Bulletin on the ecological environment of Shanghai city in 2008, available at: https://link.sthj.sh.gov.cn/file/2008bulletin/index.html, last access: 24 June 2021c.
Department of Ecology and Environment of Shanghai city, Bulletin on the ecological environment of Shanghai city in 2009, available at: https://link.sthj.sh.gov.cn/file/2009bulletin/index.html, last access: 24 June 2021d.
Department of Ecology and Environment of Shanghai city, Bulletin on the ecological environment of Shanghai city in 2010, available at: https://link.sthj.sh.gov.cn/file/2010bulletin/ch/cont.html, last access: 24 June 2021e.
Department of Ecology and Environment of Shanghai city, Bulletin on the ecological environment of Shanghai city in 2011, available at: https://link.sthj.sh.gov.cn/file/2011bulletin/index.html, last access: 24 June 2021f.
Department of Ecology and Environment of Shanghai city, Bulletin on the ecological environment of Shanghai city in 2013, available at: https://link.sthj.sh.gov.cn/file/2014bulletin/index.html, last access: 24 June 2021g.
Department of Ecology and Environment of Shanghai city, Bulletin on the ecological environment of Shanghai city in 2014, available at: https://sthj.sh.gov.cn/assets/html/117972-02.pdf, last access: 24 June 2021h.
Department of Ecology and Environment of Shanghai city, Bulletin on the ecological environment of Shanghai city in 2015, available at: https://sthj.sh.gov.cn/hbzhywpt1143/hbzhywpt1144/20160329/0024-141845.html, last access: 24 June 2021i.
Department of Ecology and Environment of Shanghai city, Bulletin on the ecological environment of Shanghai city in 2016, available at: https://sthj.sh.gov.cn/hbzhywpt1143/hbzhywpt1144/20170601/0024-141846.html, last access: 24 June 2021j.
Duan, L., Yan, L., and Xiu, G.: Online Measurement of PM2.5 at an Air Monitoring Supersite in Yangtze River Delta: Temporal Variation and Source Identification, Atmosphere, 11, 789, https://doi.org/10.3390/atmos11080789, 2020.
Fan, Q., Zhang, Y., Ma, W., Ma, H., Feng, J., Yu, Q., Yang, X., Ng, S. K. W., Fu, Q., and Chen, L.: Spatial and Seasonal Dynamics of Ship Emissions over the Yangtze River Delta and East China Sea and Their Potential Environmental Influence, Env. Sci. Technol., 50, 1322–1329, https://doi.org/10.1021/acs.est.5b03965, 2016.
Fang, G., Wang, Q., and Tian, L.: Green development of Yangtze River Delta in China under Population-Resources-Environment-Development-Satisfaction perspective, Sci. Tot. Env., 727, 138710, https://doi.org/10.1016/j.scitotenv.2020.138710, 2020.
Gao, W., Tie, X., Xu, J., Huang, R., Mao, X., Zhou, G. C., and Chang, L.: Long-term trend of O3 in a mega City (Shanghai), China: Characteristics, causes, and interactions with precursors, Sci. Tot. Env., 603–604, 425–433, https://doi.org/10.1016/j.scitotenv.2017.06.099, 2017.
Ge, Y. F., Shi, X. W., Ma, Y., Zhang, W. Q., Ren, X. R., Zheng, J., and Zhang, Y. C.: Seasonality of nitrous acid near an industry zone in the Yangtze River Delta region of China: Formation mechanisms and contribution to the atmospheric oxidation capacity, Atmos. Environ., 254, 118420, https://doi.org/10.1016/j.atmosenv.2021.118420, 2021.
Hao, Y. and Song, X.: Research on trends and spatial distribution of vehicular emissions and its control measure assessment in the Yangtze River Delta, China, for 1999–2015, Env. Sci. Pollut. R., 25, 36503–36517, https://doi.org/10.1007/s11356-018-3476-y, 2018.
Jung, J., Lee, J., Kim, B., and Oh, S.: Seasonal variations in the NO2 artifact from chemiluminescence measurements with a molybdenum converter at a suburban site in Korea (downwind of the Asian continental outflow) during 2015–2016, Atmos. Environ., 165, 290–300, https://doi.org/10.1016/j.atmosenv.2017.07.010, 2017.
Kan, H., Chen, R., and Tong, S.: Ambient air pollution, climate change, and population health in China, Environ. Int., 42, 10–19, https://doi.org/10.1016/j.envint.2011.03.003, 2012.
Kan, H., Chen, B., and Hong, C.: Health Impact of Outdoor Air Pollution in China: Current Knowledge and Future Research Needs, Environ. Health. Persp., 117, A187, https://doi.org/10.1289/ehp.12737, 2009.
Kurokawa, J. and Ohara, T.: Long-term historical trends in air pollutant emissions in Asia: Regional Emission inventory in ASia (REAS) version 3, Atmos. Chem. Phys., 20, 12761–12793, https://doi.org/10.5194/acp-20-12761-2020, 2020.
Li, L., Zhao, Q., Zhang, J., Li, H., Liu, Q., Li, C., Chen, F., Qiao, Y., and Han, J.: Bottom-up emission inventories of multiple air pollutants from open straw burning: A case study of Jiangsu province, Eastern China(Article), Atmos. Pollut. Res., 10, 501–507, https://doi.org/10.1016/j.apr.2018.09.011, 2019.
Li, M., Zhang, Q., Kurokawa, J.-I., Woo, J.-H., He, K., Lu, Z., Ohara, T., Song, Y., Streets, D. G., Carmichael, G. R., Cheng, Y., Hong, C., Huo, H., Jiang, X., Kang, S., Liu, F., Su, H., and Zheng, B.: MIX: a mosaic Asian anthropogenic emission inventory under the international collaboration framework of the MICS-Asia and HTAP, Atmos. Chem. Phys., 17, 935–963, https://doi.org/10.5194/acp-17-935-2017, 2017.
Li, M., Fang, W., Li, J., and Yang, F.: The overall variation characteristics of Akedala atmospheric background station of pollutants, Env. Ecol., 1, 80–84, 2019.
Li, R., Mei, X., Chen, L., Wang, L., Wang, Z., and Jing, Y.: Long-Term (2005–2017) View of Atmospheric Pollutants in Central China Using Multiple Satellite Observations, Remote Sens.-Basel, 12, 1041, https://doi.org/10.3390/rs12061041, 2020.
Liang, D., Wang, Y.-q., Wang, Y.-j., and Ma, C.: National air pollution distribution in China and related geographic, gaseous pollutant, and socio-economic factors, Env. Pollut., 250, 998–1009, https://doi.org/10.1016/j.envpol.2019.03.075, 2019.
Lin, W., Xu, X., Yu, D., Dai, X., Zhang, Z., Meng, Z., and Wang, Y.: Quality Control for Reactive Gases Observation at Longfengshan Regional Atmospheric Background Monitoring Station, Meteo. Mon., 35, 93–100, 2009.
Lin, W., Xu, X., Sun, J., Li, Y., and Meng, Z.: Characteristics of gaseous pollutants at Jinsha, a remote mountain site in Central China, Sci. China, 41, 136–144, https://doi.org/10.1360/032010-521, 2011.
Lin, J.-T., Martin, R. V., Boersma, K. F., Sneep, M., Stammes, P., Spurr, R., Wang, P., Van Roozendael, M., Clémer, K., and Irie, H.: Retrieving tropospheric nitrogen dioxide from the Ozone Monitoring Instrument: effects of aerosols, surface reflectance anisotropy, and vertical profile of nitrogen dioxide, Atmos. Chem. Phys., 14, 1441–1461, https://doi.org/10.5194/acp-14-1441-2014, 2014.
Lin, J.-T., Liu, M.-Y., Xin, J.-Y., Boersma, K. F., Spurr, R., Martin, R., and Zhang, Q.: Influence of aerosols and surface reflectance on satellite NO2 retrieval: seasonal and spatial characteristics and implications for NOx emission constraints, Atmos. Chem. Phys., 15, 11217–11241, https://doi.org/10.5194/acp-15-11217-2015, 2015.
Lin, W., Ma, Z., Pu, W., Gao, W., Ma, Q., and Yu, D.: Quality Control Methods for Atmospheric Composition Observations – Reactive Gases, in: Meteorological industry standards in the People's Republic of China, China Meteorological Press, QX/T 510-2019, 2019.
Liu, M., Lin, J., Boersma, K. F., Pinardi, G., Wang, Y., Chimot, J., Wagner, T., Xie, P., Eskes, H., Van Roozendael, M., Hendrick, F., Wang, P., Wang, T., Yan, Y., Chen, L., and Ni, R.: Improved aerosol correction for OMI tropospheric NO2 retrieval over East Asia: constraint from CALIOP aerosol vertical profile, Atmos. Meas. Tech., 12, 1–21, https://doi.org/10.5194/amt-12-1-2019, 2019.
Meng, Z. Y., Xu, X. B., Yan, P., Ding, G. A., Tang, J., Lin, W. L., Xu, X. D., and Wang, S. F.: Characteristics of trace gaseous pollutants at a regional background station in Northern China, Atmos. Chem. Phys., 9, 927–936, https://doi.org/10.5194/acp-9-927-2009, 2009.
Mi, C. and Qin, X.: Annual Report on Motor Vehicle Pollution Prevention and Control in China (2010), People's Republic of China Yearbook Editorial Department, China, 2011.
Pandey, S. K., Kim, K.-H., Chung, S. Y., Cho, S. J., Kim, M. Y., and Shon, Z.-H.: Long-term study of NOx behavior at urban roadside and background locations in Seoul, Korea, Atmos. Environ., 42, 607–622, https://doi.org/10.1016/j.atmosenv.2007.10.015, 2008.
Qi, H., Lin, W., Xu, X., Yu, X., and Ma, Q.: Significant downward trend of SO2 observed from 2005 to 2010 at a background station in the Yangtze Delta region, China, Science China Chemistry, 55, 1451–1458, https://doi.org/10.1007/s11426-012-4524-y, 2012.
Qiu, Y. L., Ma, Z. Q., Lin, W. L., Quan, W. J., Pu, W. W., Li, Y. R., Zhou, L. Y., and Shi, Q. F.: A study of peroxyacetyl nitrate at a rural site in Beijing based on continuous observations from 2015 to 2019 and the WRF-Chem model, Front. Environ. Sci. Eng., 14, 180–190, https://doi.org/10.1007/s11783-020-1250-0, 2020.
Resmi, C., Nishanth, T., Satheesh Kumar, M., Balachandramohan, M., and Valsaraj, K.: Long-Term Variations of Air Quality Influenced by Surface Ozone in a Coastal Site in India: Association with Synoptic Meteorological Conditions with Model Simulations, Atmosphere, 11, 193, https://doi.org/10.3390/atmos11020193, 2020.
Shen, J., He, L., Chen, P., Xie, M., Jiang, M., Chen, D., and Zhou, G.: Characteristics of Ozone Concentration Variation in the Northern Background Site of the Pearl River Delta, Eco. Environ. Sci., 28, 2006–2011, https://doi.org/10.16258/j.cnki.1674-5906.2019.10.010, 2019.
Shi, Y., Zhu, S., Li, L., Chen, Y., An, J., and Fu, Z.: Historical trends and spatial distributions of major air pollutants in the Yangtze River Delta, J. Lanzhou Univ. (Natural Sci.), 54, 184–191, https://doi.org/10.13885/j.issn.0455-2059.2018.02.007, 2018.
Squizzato, S., Masiol, M., Rich, D. Q., and Hopke, P. K.: PM2.5 and gaseous pollutants in New York State during 2005–2016: spatial variability, temporal trends, and economic influences, Atoms. Environ., 183, 209–224, https://doi.org/10.1016/j.atmosenv.2018.03.045, 2018.
Steinbacher, M., Zellweger, C., Schwarzenbach, B., Bugmann, S., Buchmann, B., Ordóñez, C., Prevot, A. S. H., and Hueglin, C.: Nitrogen oxide measurements at rural sites in Switzerland: Bias of conventional measurement techniques, J. Geophys. Res.-Atmos., 112, D11307, https://doi.org/10.1029/2006JD007971, 2007.
Su, B., Liu, X., and Tao, J.: Background characteristics of SO2, NOx and CO in forest and alpine background areas of eastern China, Environ. Monit. China, 6, 15–21, 2013.
Sun, W., Shao, M., Granier, C., Liu, Y., Ye, C., and Zheng, J.: Long-Term Trends of Anthropogenic SO2, NOx, CO, and NMVOCs Emissions in China(Article), Earths Future, 6, 1112–1133, https://doi.org/10.1029/2018ef000822, 2018.
Swartz, J. S., Van Zyl, P. G., Beukes, J. P., Labuschagne, C., Brunke, E.-G., Portafaix, T., Galy-Lacaux, C., and Pienaar, J. J.: Twenty-one years of passive sampling monitoring of SO2, NO2 and O3 at the Cape Point GAW station, South Africa, Atmos. Environ., 222, 117128, https://doi.org/10.1016/j.atmosenv.2019.117128, 2020a.
Swartz, J.-S., van Zyl, P. G., Beukes, J. P., Galy-Lacaux, C., Ramandh, A., and Pienaar, J. J.: Measurement report: Statistical modelling of long-term trends of atmospheric inorganic gaseous species within proximity of the pollution hotspot in South Africa, Atmos. Chem. Phys., 20, 10637–10665, https://doi.org/10.5194/acp-20-10637-2020, 2020b.
Tong, S., Hou, S., Zhang, Y., Chu, B. W., Liu, Y. C., He, H., Zhao, P. S., and Ge, M. F.: Comparisons of measured nitrous acid (HONO) concentrations in a pollution period at urban and suburban Beijing, in autumn of 2014, Sci. China Chem., 58, 1393–1402, https://doi.org/10.1007/s11426-015-5454-2, 2015.
US EPA: Quality Assurance Handbook for Air Pollution Measurement Systems, Volume II, Ambient Air Quality Monitoring Program, EPA-454/B-17-001, available at: https://nepis.epa.gov/Exe/ZyPDF.cgi/P100R631.PDF?Dockey=P100R631.PDF (last access: 16 January 2022), 2017.
Wan, Z., Ji, S., Liu, Y., Zhang, Q., Chen, J., and Wang, Q.: Shipping emission inventories in China's Bohai Bay, Yangtze River Delta, and Pearl River Delta in 2018, Mar. Pollution. Bulletin., 151, 110882, https://doi.org/10.1016/j.marpolbul.2019.110882, 2020.
Wang, H. L., Qiao, L. P., Lou, S. R., Zhou, M., Ding, A. J., Huang, H. Y., Chen, J. M., Wang, Q., Tao, S. K., Chen, C. H., Li, L., and Huang, C.: Chemical composition of PM2.5 and meteorological impact among three years in urban Shanghai, China, J. Clean. Prod., 112, 1302–1311, https://doi.org/10.1016/j.jclepro.2015.04.099, 2016.
Wang, N., Lyu, X., Deng, X., Huang, X., Jiang, F., and Ding, A.: Aggravating O3 pollution due to NOx emission control in eastern China, Sci. Total. Environ., 677, 732–744, https://doi.org/10.1016/j.scitotenv.2019.04.388, 2019.
Wang, T., He, H., Xia, Z., Wu, M., and Zhang, Q.: Pollution characteristics of SO2, NO2, CO and O3 in Nanjing in 2015, Chinese J. Environ. Engi., 11, 4155–4161, 2017.
Wang, Y. Q.: MeteoInfo: GIS software for meteorological data visualization and analysis, Meteorol. Appl., 21, 360–368, https://doi.org/10.1002/met.13, 2014.
World Meteorological Organization: WMO Global Atmosphere Watch (GAW) Implementation Plan: 2016–2023, WMO, CH-1211 Geneva 2, Switzerland, Open File Rep. 228, 84 pp., 2017.
Xie, Z.: Global Financial Crisis Making a V-Shaped Fluctuation in NO2 Pollution over the Yangtze River Delta, J. Meteorol. Res., 31, 438–447, https://doi.org/10.1007/s13351-017-6053-2, 2017b.
Xin, Y. J., Wang, G. C., and Chen, L.: Identification of Long-Range Transport Pathways and Potential Sources of PM10 in Tibetan Plateau Uplift Area: Case Study of Xining, China in 2014, Aerosol. Air. Qual. Res., 16, 1044–1054, https://doi.org/10.4209/aaqr.2015.05.0296, 2016
Xu, X., Lin, W., Yan, P., Zhang, Z., and Yu, X.: Long-term Changes of Acidic Gases in China's Yangtze Delta and Northeast Plain Regions During 1994–2006, Adv. Clim. Change. Res., 4, 195–201, 2008.
Xu, X., Yang, B., Shi, S., Wang, X., and He, H.: Analysis on the Current Situation of Acid Rain Pollution in Lin'an District of Hangzhou City, J. Anhui. Agricul. Sci., 47, 86–89, https://doi.org/10.3969/j.issn.0517-6611.2019.09.025, 2019.
Xue, R., Wang, S. L., Danran, Zou, Z., Chan, K. L., Valks, P., Saiz-Lopez, Alfonso, and Zhou, B.: Spatio-temporal variations in NO2 and SO2 over Shanghai and Chongming Eco-Island measured by Ozone Monitoring Instrument (OMI) during 2008–2017, J. Clean. Prod., 258, 120563, https://doi.org/10.1016/j.jclepro.2020.120563, 2020.
Yan, F., Chen, W., Jia, S., Zhong, B., Yang, L., Mao, J., Chang, M., Shao, M., Yuan, B., Situ, S., Wang, X., and Wang, D. C. X.: Stabilization for the secondary species contribution to PM2.5 in the Pearl River Delta (PRD) over the past decade, China: A meta-analysis, Atoms. Environ., 242, 117817, https://doi.org/10.1016/j.atmosenv.2020.117817, 2020.
Yang, B. and Luo, R.: Research progress of air pollution in Yangtze River Delta, Environ. Ecol., 1, 74–78, 2019.
Yang, J., Xin, J., Ji, D., and Zhu, B.: Variation Analysis of Background Atmospheric Pollutants in North China During the Summer of 2008 to 2011, Environ. Sci., 11, 3693–3704, 2012.
Yang, Q.: Characteristics and Causes of Acid Rain Changes in Xiaoshan District, 2008–2017, Overs. Dig., 18, 91–94, 2018.
Yin, Q., Ma, Q., Lin, W., Xu, X., and Yao, J.: Replication Data for: Measurement report: Long-term variations in surface NOX and SO2 mixing ratios from 2006 to 2016 at a background site in the Yangtze River Delta region, China, V1, Harvard Dataverse [data set], https://doi.org/10.7910/DVN/DQTBT0, 2021.
Yu, Y., Wang, Z., Cui, X., Chen, F., and Xu, H.: Effects of Emission Reductions of Key Sources on the PM2.5 Concentrations in the Yangtze River Delta, Environ. Sci., 40, 11–23, https://doi.org/10.13227/j.hjkx.201804105, 2019.
Zhao, B., Wang, S., Wang, J., Fu, J. S., Liu, T., Xu, J., Fu, X., and Hao, J.: Impact of national NOx and SO2 control policies on particulate matter pollution in China, Atmos. Env., 77, 453–463, https://doi.org/10.1016/j.atmosenv.2013.05.012, 2013.
Zhao, M., Qiao, T., Huang, Z., Zhu, M., Xu, W., Xiu, G., Tao, J., and Lee, S.: Comparison of ionic and carbonaceous compositions of PM2.5 in 2009 and 2012 in Shanghai, China, Sci. Tot. Env., 536, 695–703, doi.org/10.1016/j.scitotenv.2015.07.100, 2015.
Zhao, P., Tuygun, G. T., Li, B., Liu, J., Yuan, L., Luo, Y., Xiao, H., and Zhou, Y.: The effect of environmental regulations on air quality: A long-term trend analysis of SO2 and NO2 in the largest urban agglomeration in Southwest China, Atmos. Pollut. Res., 10, 2030–2039, https://doi.org/10.1016/j.apr.2019.09.011, 2019.
Zhao, S., Liu, S., Hou, X., Cheng, F., Wu, X., Dong, S., and Beazley, R.: Temporal dynamics of SO2 and NOx pollution and contributions of driving forces in urban areas in China, Environ. Pollut., 242, 239–248, https://doi.org/10.1016/j.envpol.2018.06.085, 2018.
Zheng, S., Yi, H., and Li, H.: The impacts of provincial energy and environmental policies on air pollution control in China, Renew. Sust. Energ. Rev., 49, 386–394, https://doi.org/10.1016/j.rser.2015.04.088, 2015.
Zhou, D., Tian, X., Cai, Z., Wang, X., Li, Y., Liu, Y., and Jiang, F.: Evaluation of Ozone Change and Control Effects in Yangtze River Delta Region During G20 Submit, Environ. Monit. in China, 36, 41–49, https://doi.org/10.19316/j.issn.1002-6002.2020.02.06, 2020.