the Creative Commons Attribution 4.0 License.
the Creative Commons Attribution 4.0 License.
 | 04 Aug 2022
Secondary aerosol formation in marine Arctic environments: a model measurement comparison at Ny-Ålesund
Carlton Xavier
Metin Baykara
Robin Wollesen de Jonge
Barbara Altstädter
Petri Clusius
Ville Vakkari
Roseline Thakur
Lisa Beck
Silvia Becagli
Mirko Severi
Rita Traversi
Radovan Krejci
Peter Tunved
Mauro Mazzola
Birgit Wehner
Mikko Sipilä
Markku Kulmala
Michael Boy
Pontus Roldin
In this study, we modeled the aerosol particle formation along air mass trajectories arriving at the remote Arctic research stations Gruvebadet (67 m a.s.l.) and Zeppelin (474 m a.s.l.), Ny-Ålesund, during May 2018. The aim of this study was to improve our understanding of processes governing secondary aerosol formation in remote Arctic marine environments. We run the Lagrangian chemistry transport model ADCHEM, along air mass trajectories generated with FLEXPART v10.4. The air masses arriving at Ny-Ålesund spent most of their time over the open ice-free ocean. In order to capture the secondary aerosol formation from the DMS emitted by phytoplankton from the ocean surface, we implemented a recently developed comprehensive DMS and halogen multi-phase oxidation chemistry scheme, coupled with the widely used Master Chemical Mechanism (MCM).
The modeled median particle number size distributions are in close agreement with the observations in the marine-influenced boundary layer near-sea-surface Gruvebadet site. However, while the model reproduces the accumulation mode particle number concentrations at Zeppelin, it overestimates the Aitken mode particle number concentrations by a factor of ∼5.5. We attribute this to the deficiency of the model to capture the complex orographic effects on the boundary layer dynamics at Ny-Ålesund. However, the model reproduces the average vertical particle number concentration profiles within the boundary layer (0–600 m a.s.l.) above Gruvebadet, as measured with condensation particle counters (CPCs) on board an unmanned aircraft system (UAS).
The model successfully reproduces the observed Hoppel minima, often seen in particle number size distributions at Ny-Ålesund. The model also supports the previous experimental findings that ion-mediated H2SO4–NH3 nucleation can explain the observed new particle formation in the marine Arctic boundary layer in the vicinity of Ny-Ålesund. Precursors resulting from gas- and aqueous-phase DMS chemistry contribute to the subsequent growth of the secondary aerosols. The growth of particles is primarily driven via H2SO4 condensation and formation of methane sulfonic acid (MSA) through the aqueous-phase ozonolysis of methane sulfinic acid (MSIA) in cloud and deliquescent droplets.
- Article
(3678 KB) - Full-text XML
-
Supplement
(2721 KB) - BibTeX
- EndNote


Earth's radiation budget is influenced both directly and indirectly by aerosols, which scatter and absorb the incoming short-wave radiation (direct effect) and serve as cloud condensation nuclei (CCN, indirect effect), affecting both short- and long-wave radiation (Gantt et al., 2014; Oshima et al., 2020; Park et al., 2017; Scott et al., 2014). The Arctic environments are susceptible to perturbations in the radiation balance, with some estimates suggesting that, compared to the global average, the Arctic is warming at 3 times the rate, a phenomenon termed Arctic amplification (AMAP, 2011, 2017, 2021; Lenssen et al., 2019; Tunved et al., 2013). The warming of the Arctic polar environment has accelerated sea ice loss, leading to a rapid decline in the extent and duration of snow cover and an increase in permafrost thaw (AMAP, 2011, 2017; Bengtsson et al., 2013).
The Arctic aerosol number concentration shows a pronounced seasonal variation, where the late winter and early spring period is characterized by elevated accumulation mode aerosol concentrations, accompanied by trace gases (mostly anthropogenic with long-range-transported trace elements such as sulfates, soot, and peroxy acyl nitrates (PANs)). This annually recurring phenomenon in late winter and spring is termed the Arctic haze (Barrie, 1986; Lupi et al., 2016; Tunved et al., 2013). This contrasts with the summer period, when the atmospheric new particle formation is observed at Arctic sites, most likely due to low background aerosol concentrations and increased photo-chemistry and biological activity (Engvall et al., 2008; Heintzenberg et al., 2017; Tunved et al., 2013).
The climate-change-driven Arctic sea ice loss has a profound impact on natural aerosol production. Arrigo and van Dijken (2015) found that decreasing and thinning of sea ice increased the rates of phytoplankton net primary production by ∼20 % between the years 1998 and 2009. This can lead to an increase in the emissions of primary biogenic precursors such as dimethyl sulfide (DMS), nitrogen volatiles (e.g., alkyl-amines) (Dall'Osto et al., 2017a, b), and biological iodine species (Cuevas et al., 2018). DMS is emitted into the atmosphere via air–sea gas exchanges (Park et al., 2017; Uhlig et al., 2019) and accounts for ∼80 % of global natural sulfur emissions (Kettle and Andreae, 2000; Uhlig et al., 2019). Methane sulfonic acid (MSA) and sulfuric acid (H2SO4) are formed via DMS gas-phase oxidation by OH and halogen species (Cl, Br) (Hoffmann et al., 2016; Kim et al., 2021; Wollesen de Jonge et al., 2021). MSA and H2SO4, together with ammonia (NH3) or amines, act as precursors contributing to new particle formation (NPF) and subsequently to CCN production, influencing cloud formation and radiative balance (Berndt et al., 2020; Dall'Osto et al., 2017a; Hoffmann et al., 2016; Kim et al., 2021; Jang et al., 2021; Park et al., 2021). NH3 plays a major role in particle formation through stabilization of sulfuric acid clusters (Beck et al., 2021; Jokinen et al., 2018; Olenius et al., 2013). Depending on local parameters such as ocean pH, salinity, and temperature, global oceans can act as either a source or sink of NH3 (Paulot et al., 2015). Apart from participating in cluster formation, NH3 influences the pH of marine aerosols by neutralizing the acid (H2SO4 and MSA) in the particles (Paulot et al., 2015). Though a few potential sources of NH3 are known, for example coastal seabird colonies, pockets of open water, and melting sea ice in summertime Arctic, the magnitude of the emissions remains uncertain (Dall'Osto et al., 2019; Riddick et al., 2012; Wentworth et al., 2016).
DMS oxidation chemistry has been under focus, but uncertainties in climate predictions persist since the chemical transport models (CTMs) and global climate models (GCMs) employ fixed MSA and SO2 yields from gas-phase oxidation of DMS to calculate aerosol formation (Hertel et al., 1994; Hoffmann et al., 2016; Kloster et al., 2006; Wollesen de Jonge et al., 2021). Including a detailed multi-phase (aqueous-phase chemistry coupled with gas-phase chemistry) DMS chemistry in numerical models can overcome these uncertainties (Barnes et al., 2006; Campolongo et al., 1999). Reaction intermediates such as dimethyl sulfoxide (DMSO), dimethyl sulfone (DMSO2), and methane sulfinic acid (MSIA) are water-soluble, and experiments have shown that neglecting aqueous-phase chemistry leads to either an under-estimation of modeled MSA (Campolongo et al., 1999) or an over-estimation of gaseous SO2 compared to measured values (Hoffmann et al., 2016). For example, the temperature-dependent ratio of MSA-to-non-sea-salt SO (nss-SO) is often used to estimate the contribution of DMS to sulfate budget (Ayers et al., 1999; Barnes et al., 2006). Campolongo et al. (1999) showed that modeling studies which included a multi-phase DMS chemistry can bridge the gap between temperature-dependent observations and modeled MSA nss-SO. Incorporating reactive halogen species over marine environments is crucial in determining the DMS oxidation pathways to either SO2 or MSA, the aging of marine aerosols, and the radiative properties of marine clouds (Hoffmann et al., 2016). Modeling studies have shown that Cl− and BrO− radicals in the gas phase act as important DMS sinks (Chen et al., 2018; Wollesen de Jonge et al., 2021), further underlining the role of halogen–DMS chemistry in the marine boundary layer.
Recent DMS + OH oxidation experiments performed in the AURA chamber at Aarhus University show that MSA dominates the secondary aerosol mass formation (Rosati et al., 2021). Aerosol dynamics model simulations which intended to replicate the observations during these AURA experiments, using the DMS gas-phase chemistry scheme from the Master Chemical Mechanism, MCMv3.3.1 (Jenkin et al., 1997, 2015; Saunders et al., 2003), substantially underestimate the particle mass and number concentrations and the ratio (Rosati et al., 2021; Wollesen de Jonge, 2021). Based on these findings, Wollesen de Jonge et al. (2021) developed a new DMS multi-phase chemistry scheme based on MCM v3.3.1, CAPRAM DMS module 1.0 (DM1.0) (Hoffmann et al., 2016), a subset of the multi-phase halogen chemistry mechanism CAPRAM Halogen Module 2.0 (HM2.0) (Bräuer et al., 2013), and new reactions leading to the formation of hydroperoxymethyl thioformate (HPMTF). With the new DMS multi-phase chemistry mechanism, the aerosol dynamics model could capture the observed particle number concentrations and secondary PM MSA and SO during DMS oxidation experiments performed at both dry and humid conditions at 0 and 20 ∘C in the AURA chamber. For more details on the DMS, halogen, and multi-phase chemistry scheme used in ADCHEM, the reader is referred to the article and Supplement of Wollesen de Jonge et al. (2021).
The aim of this work is to understand the processes and DMS oxidation products governing the formation and growth of the secondary aerosol in the pristine remote marine Arctic region. To facilitate this, we have implemented the abovementioned DMS multi-phase chemistry mechanism into ADCHEM (see Methods section) and modeled the aerosol formation along air mass trajectories arriving at Ny-Ålesund. We compared the model results with observations from Zeppelin (78∘56′ N, 11∘53′ E, 474 m a.s.l.) and Gruvebadet (78∘92′ N, 11∘90′ E, 67 m a.s.l.). These two sites represent remote marine Arctic conditions. Gruvebadet represents ground-level concentrations as it is well within the boundary layer (BL). Zeppelin on the other hand, is most often above the BL in winter months and sometimes below the BL during spring and summer months (Traversi et al., 2020). This implies that Zeppelin is more influenced by long-range transport and Gruvebadet by more local effects (Traversi et al., 2020). This demonstrates the complexity involved in capturing the atmospheric mixing and secondary aerosol concentrations at Ny-Ålesund. The reason is that Svalbard has an orographically complex terrain comprising of mountains, glaciers, fjords, and flat lands that introduce various micro-meteorological phenomena (Rader et al., 2021; Schemann and Ebell, 2020).
Using the combined multi-phase DMS chemistry mechanism by Wollesen de Jonge et al. (2021), MCMv3.3.1, and the monoterpene peroxy radical autoxidation mechanism (PRAM, Roldin et al., 2019; Xavier et al., 2019), we simulated aerosol particle formation within the marine boundary layer (MBL) upwind and at Ny-Ålesund between 1–25 May 2018, using the Aerosol Dynamics, gas- and particle-phase CHEMistry and radiative transfer model (ADCHEM; Öström et al., 2017; Roldin et al., 2011, 2019). We ran ADCHEM as a Lagrangian model along the air mass trajectories arriving at Zeppelin every 3 h during the selected period (in total 200 trajectory simulations). FLEXPART v10.4 was used to calculate the air mass trajectories and potential emission sensitivity fields (Pisso et al., 2019; Stohl et al., 2005). The simulation results for the vertical distribution of newly formed aerosol (particle diameters <12 nm) were validated against concurrent measurement data available from the ALADINA (Application of Light-Weight Aircraft for Detecting in situ Aerosol) campaign, wherein an UAS was used to investigate horizontal and vertical distribution of aerosol profiles in the marine boundary layer (ABL) (Lampert et al., 2020). Additionally, modeled particle number size distributions and PM10 chemical compositions were compared to the available measured particle number size distributions and PM10 filter samples at both Gruvebadet and Zeppelin measurement stations.
2.1 Air mass trajectories and potential emission sensitivity fields
We employed the Lagrangian particle dispersion model FLEXible PARTicle (FLEXPARTv10.4) to assess the emission sensitivities or “footprints” of air masses arriving at Zeppelin during the simulation period. FLEXPART is a stochastic model used to compute dispersion of hypothetical particles, based on mean, turbulent, and diffusive flows which can be run backwards in time to estimate air mass history at a site (Pisso et al., 2019). European Center for Medium-Range Weather Forecasts (ECMWF) ERA5 reanalysis meteorology with 137 height levels 1 h temporal and 0.5∘ × 0.5∘ spatial resolution was used as an input to FLEXPART (Hersbach et al., 2018a, b). The air mass history was simulated 7 d backwards in time and arriving at Zeppelin (474 m a.s.l.) every 3 h (at 00:00, 03:00, 06:00, 09:00, 12:00, 15:00, 15:00, and 21:00 UTC) for the entire simulation period (1–25 May 2018).
FLEXPART-calculated normalized emission sensitivity fields were combined with oceanic emissions (DMS, dibromomethane, tribromomethane, iodomethane), NH3 from seabird colonies, and anthropogenic emissions (NH3, SO2, CO, NOx) derived from global inventories (see Sect. 2.2). This was done to obtain representative emissions that consider the complete emission source regions along the trajectories, upwind of the measurement station. Additional meteorological parameters such as temperature, pressure, sea surface temperature, specific humidity, and cloud liquid water content from the ERA5 reanalysis dataset were extracted along the trajectories and provided as inputs to ADCHEM.
2.2 Gas and primary particle emissions
Emissions of gas-phase biogenic volatile organic compounds (VOCs) α-pinene, β-pinene Δ3-carene, limonene, isoprene, and β-caryophyllene were modeled with a one-dimensional version of MEGAN v2.04 (Model of Emissions of Gases and Aerosols from Nature 2.04) (Guenther et al., 2006). Gas-phase emissions of marine halogens such as tribromomethane (CHBr3), dibromomethane (CH2Br2), and iodomethane (CH3I) were retrieved from CAMS-OCE global oceanic emissions (CAMS-GLOB-OCE), which are available as daily means with a spatial resolution of 0.5∘ × 0.5∘ (Granier et al., 2019; Ziska et al., 2013). CAMS-GLOB-OCE also provides gas-phase DMS emissions with the same temporal and spatial resolution (Granier et al., 2019) calculated with the air–sea flux parameterization and emission fluxes described in Lana et al. (2011) and Nightingale et al. (2000). NH3 emissions from seabird colonies were acquired from a global emission inventory (Riddick et al., 2012). To account for additional NH3 fluxes from the open ocean, we used an estimated sea surface equilibrium NH3(g) saturation concentration of 0.5 nmol m−3 (12.2 ppt at standard temperature and pressure (STP)), which approximately corresponds to a surface ocean ammonium concentration of 0.125 mmol m−3 (or ∼3 ppb, calculated based on Eqs. 3 and 4 from Wentworth et al., 2016) at a sea surface temperature of +2 ∘C. The sea surface temperature for the study period varied between −2–23 ∘C along the trajectories. The estimated surface ocean ammonium concentrations are in close agreement with the concentration estimated by the global ocean biogeochemical model COBALT (Stock et al., 2014) in the North Atlantic Ocean, but up to a factor of ∼5 higher than the concentrations simulated with other ocean biogeochemical models and/or model setups (Paulot et al., 2015). Therefore, we performed model sensitivity runs with a sea surface equilibrium NH3(g) concentration of 0.1 and 1 nmol m−3. The NH3(g) equilibrium saturation concentrations represent the ambient surface gas-phase concentration at which the air–sea flux changes direction, with a net downward flux from air to sea if the ambient NH3(g) exceeds the equilibrium gas concentrations and vice versa (Wentworth et al., 2016). For the anthropogenic trace gas and primary particle emissions, we used the CAMS-GLOB-ANT v2.1 inventory, with a spatial resolution of 0.1∘ × 0.1∘ (Granier et al., 2019).
In this work, we used the sea surface temperature (SST) and wind-speed-dependent sea spray aerosol (SSA) emission parameterization by Sofiev et al. (2011) (further referred to as Sofiev11). Sofiev11 used a modified source function based on the parameterization of Monahan et al. (1986), experiments by Mårtensson et al. (2003), and SEAS campaign by Clarke et al. (2006). The modified source function in Sofiev11 provides extrapolated SSA emissions between size ranges of 10 nm–10 µm, with appropriate correction functions employed for SST deviating from 298.15 K (Sofiev et al., 2011). Sofiev11 SSA parameterization shows that with increasing temperatures, emission flux for larger particles increases while the emission fluxes for smaller particles decreases (Barthel et al., 2019; Sofiev et al., 2011). We performed sensitivity tests using the temperature- and wind-speed-dependent SSA parameterization by Salter et al. (2015) (further referred to as Salter15). Both Salter15 and Sofiev11 are valid between 10 nm–10 µm. Model simulation comparisons between Sofiev11 and Salter15 have shown that the SSA parameterization from Sofiev11 has a stronger temperature dependence and higher particle number concentration emissions in the Aitken mode but results in lower PM10 emissions at temperatures below 25 ∘C (Barthel et al., 2019).
2.3 ADCHEM
For this study, ADCHEM was employed as a one-dimensional column model with 40 logarithmically vertical layers, extending up to ∼2600 m. The model time step used for simulations was 30 s. The vertical atmospheric turbulent diffusion was solved using a modified Grisogono turbulent diffusivity scheme (Jeričević et al., 2010; Öström et al., 2017; Roldin et al., 2019). The ADCHEM aerosol module includes new particle formation, Brownian coagulation, condensation and evaporation of particles, and finally the dry and wet deposition of both particles and gases. The particle number size distributions were represented using 100 size bins ranging from 1.07 nm to 10 µm dry diameter. Clouds were assumed to be present in the model grid cells when the bulk liquid water content (LWC, extracted along the trajectory from ERA5 datasets) was greater than 0.01 g m−3. As a default, we used a constant cloud supersaturation (S) of 0.25 %, and the particles were activated into cloud droplets if the calculated water vapor supersaturation above the particle surface (Sc, calculated using Köhler theory) was smaller than S. For sulfate-dominated aerosol particles this corresponds to a minimum dry particle activation diameter of ∼80 nm (see Fig. S10). During the cloud processing, each activated cloud droplet was assumed to take up an equal amount of liquid water corresponding to the total bulk LWC divided by the calculated number concentration of activated cloud droplets. The gas–liquid droplet mass transfer and dissolution of 50 species in total, including HCl, HNO3, H2SO4, NH3, HIO3, H2O2, O3, OH, BrO, NO3, DMSO, MSIA, MSA, and HPMTF, and their irreversible reactions in the interstitial and activated cloud droplets are treated by the multi-phase chemistry mechanism (see Wollesen de Jonge et al. (2021) for details). The kinetic pre-processor (KPP) (Damian et al., 2002) was used to generate the multi-phase chemistry mechanism used in this study.
Recent observations of NPF at Ny-Ålesund have confirmed the importance of ion-mediated H2SO4–NH3 nucleation in spring with MSA and H2SO4 condensation contributing to the subsequent growth of particles (Beck et al., 2021; Lee et al., 2020). In this work, the Atmosphere Cluster Dynamics Code (ACDC) (McGrath et al., 2012; Olenius et al., 2013) was coupled with ADCHEM (Roldin et al., 2019). ACDC was used to model NPF, which involved H2SO4 clustering with NH3 via both neutral and ion-induced pathways with an ionization rate of 1.7 cm−3 s−1. ACDC was used to solve the evolution of molecular H2SO4–NH3 clusters by considering the loss of clusters by collisions, evaporation, or coagulation scavenging onto larger aerosol particles. At each time step, the flux of clusters (up to ∼5 H2SO4 and 5 NH3 each) growing out of the ACDC molecule-cluster domain represents the NPF rate. These newly formed clusters are assigned to the corresponding smallest particle size bin at 1.07 nm in diameter in ADCHEM, which then simulates the condensational growth of particles and losses due to evaporation, coagulation, and wet and dry deposition.
For all simulations, we used model output from the closest height levels that can represent Gruvebadet (model height of 73.5 m a.s.l.) and Zeppelin (model height of 486.0 m a.s.l.).
Sensitivity tests
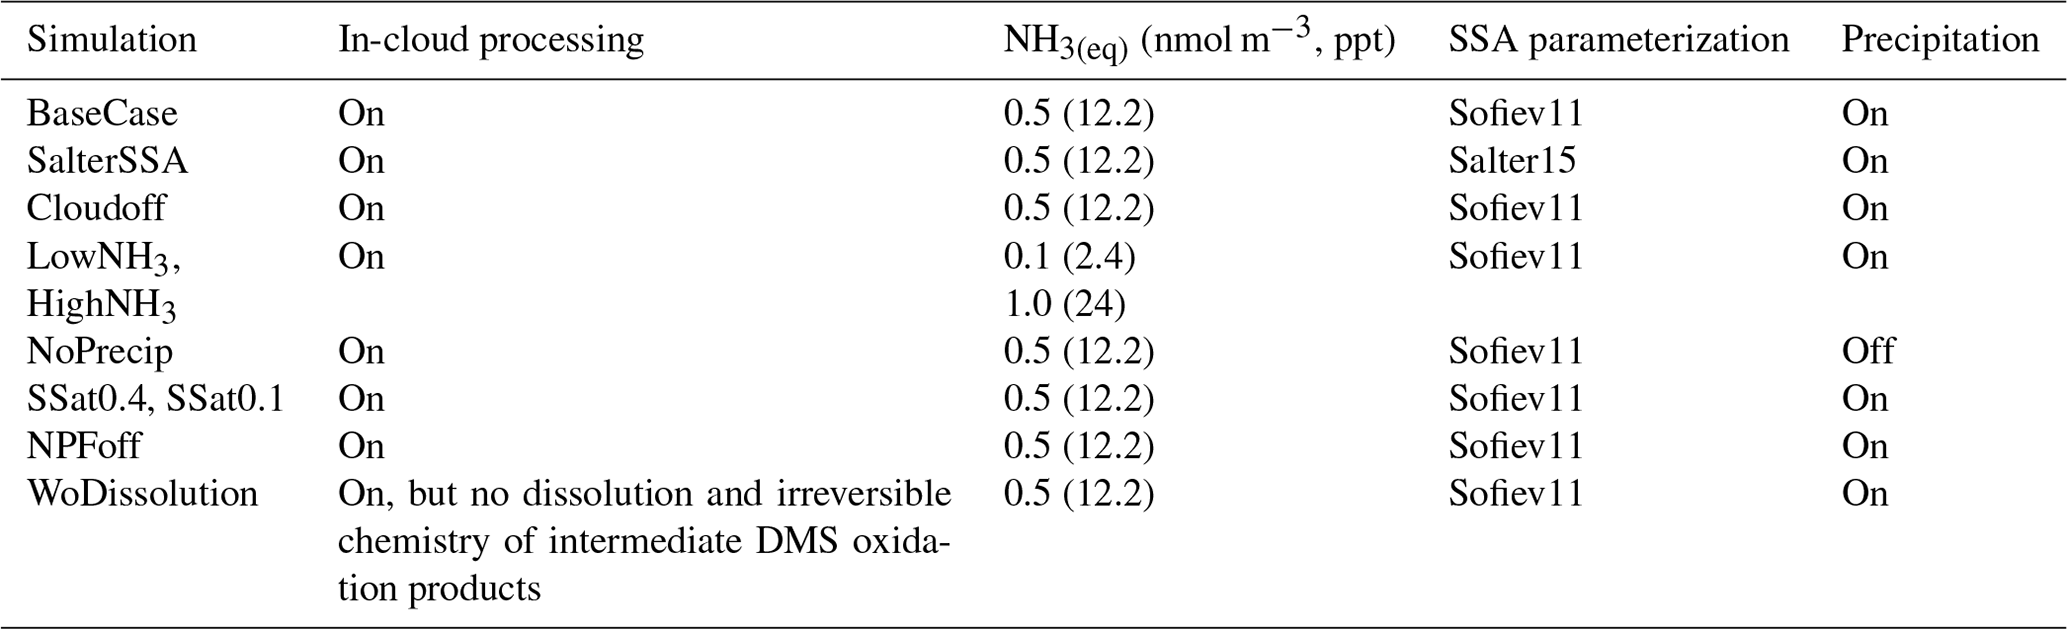
Alongside the main ADCHEM simulations, BaseCase, we performed nine complementary scenario runs to assess the impact of different processes on the modeled aerosol concentrations. We performed simulations without aerosol in-cloud processing (Cloudoff) to check the impact of in-cloud processing on the growth of aerosols. We investigated the effect of higher PM10 particle emissions on the chemical composition of secondary aerosols, using the sea spray emission parameterization based on Salter et al. (2015) (SalterSSA). Simulations were conducted to assess the impact of lower and higher ammonia sources over the open ocean (LowNH3, HighNH3). A sensitivity test without precipitation (NoPrecip) was performed to test the influence of precipitation on number concentration and particle composition. Since cloud supersaturation is critical to the activation of particles and is highly uncertain, we performed two simulations with low and high cloud supersaturation (S=0.1 %, Ssat=0.1 and S=0.4 %, Ssat=0.4) to test its impact on the modeled particle distributions. This corresponds to minimum dry particle activation diameters of ∼150 and ∼60 nm, respectively, for sulfate-rich aerosol particles (see Fig. S10). We performed a simulation without new particle formation (NPFoff) and finally one simulation without the dissolution and irreversible aqueous chemistry of the intermediate DMS oxidation products, SO2 and halogens (woDissolution), implying that MSA, H2SO4, and HIO3 are only formed in the gas phase. Table 1 summarizes the setup for different model sensitivity tests.
Table 1Model sensitivity tests performed alongside the main BaseCase simulations to test the effect of different parameters on secondary aerosol formation. These sensitivity tests focus on the role of in-cloud processing and aqueous-phase chemistry, the NH3 emissions from open ocean, SSA parameterization, and cloud supersaturation. The sea surface equilibrium NH3(g) concentrations in parts per trillion are provided in the brackets.
2.4 Measurements
We utilized comprehensive measurements from the Ny-Ålesund research station sites, Zeppelin observatory (Platt et al., 2022), and Gruvebadet during the period of 1–25 May 2018. Since 2017, the atmospheric observatory at Gruvebadet, which is located about 700 m southwest of Ny-Ålesund village at almost sea level (67 m.s.l.), hosted the Neutral cluster and Air Ion Spectrometer (NAIS, Manninen et al., 2010; Mirme and Mirme, 2013) for semi-permanent measurements. Here we use NAIS-measured number size distribution of naturally charged (ions) in diameter size ranges between 0.8–40 nm and neutral particles in the size range of 2.5–42 nm, with a temporal resolution of 2 s.
During the measurement period, a scanning mobility particle sizer (SMPS) was operated to measure particle number size distribution in the diameter size range of 10–470 nm at Zeppelin. Concurrent SMPS data (TSI 3034, 54 channels) with diameter size ranging from 10 to 470 nm from Gruvebadet were also available (Dall'Osto et al., 2019; Moroni et al., 2020), thus enabling us to compare the modeled particle number size distribution with the measured size distributions at both measurement stations. Daily-resolution continuous aerosol samples with PM10 cutoff were collected at Gruvebadet using a Tecore Skypost low-volume sampler (Amore et al., 2022). The detection limit for Na+ was 0.0001 and 0.0002 µg m−3 for Cl−, NH, and SO. Since the field blank medians at Gruvebadet were less than 1 % of sampled values, the field blanks were not subtracted from the sampled values (Amore et al., 2022).
Vertical particle number concentration profiles were obtained using UAS ALADINA (Bärfuss et al., 2018; Lampert et al., 2020), which was operated during the simulation period. ALADINA was operated up to a height of 850 m a.s.l. and thus can be used for a potential closure between the two different research sites of Gruvebadet and Zeppelin. ALADINA is equipped with two condensation particle counters (CPCs model 3007, TSI Inc., St. Paul, MN, USA), measuring in the size ranges of 3 nm–2 µm (CPC1) and ∼12 nm–2 µm (CPC2) (Lampert et al., 2020; Petäjä et al., 2020). The difference between CPC1 and CPC2 provides an estimate of particle number concentrations in the size of 3–12 nm (N3−12), which was used as an indicator of NPF. Alongside the CPCs, a host of other instruments measuring meteorological parameters were operated in unison, the description of which can be found in Bärfuss et al. (2018) and Lampert et al. (2020).
Evaluating temporal aspects of model performance
The modeled PM10 inorganic chemical composition was evaluated against the measured PM10 inorganic chemical composition using statistical estimates such as normalized mean bias (NMB), Pearson correlation coefficient (r), root-mean-squared error (RMSE), and fraction of predictions within a factor of 2 of the observed values (FAC2). These tests were used to evaluate modeled values (Mi) against observation values (Oi) at both the measurement sites.
Pearson correlation coefficient was calculated using the formula
where σO and σM are standard deviations of the observed and modeled values, respectively.
Normalized mean bias (NMB) indicates if the predictions are over- or underestimating the observed values, with the factor representing the under- or overestimation. NMB was calculated using Eq. (2):
Root-mean-squared error (RMSE) was calculated using Eq. (3):
FAC2 is a robust metric defined as the percentage of predictions that are within a factor of 2 of the observed values (Eq. 4):
In the following sections, we analyze and evaluate the model results against comprehensive measurements in Ny-Ålesund. In Sect. 3.1, we focus on the particle number size distributions at both sites, followed by gas-phase concentrations and PM10 inorganic chemical composition (Sect. 3.2) and the vertical nano-particle concentration profiles (Sect. 3.3). Finally, in Sect. 3.4, we analyze the results from the model sensitivity tests.
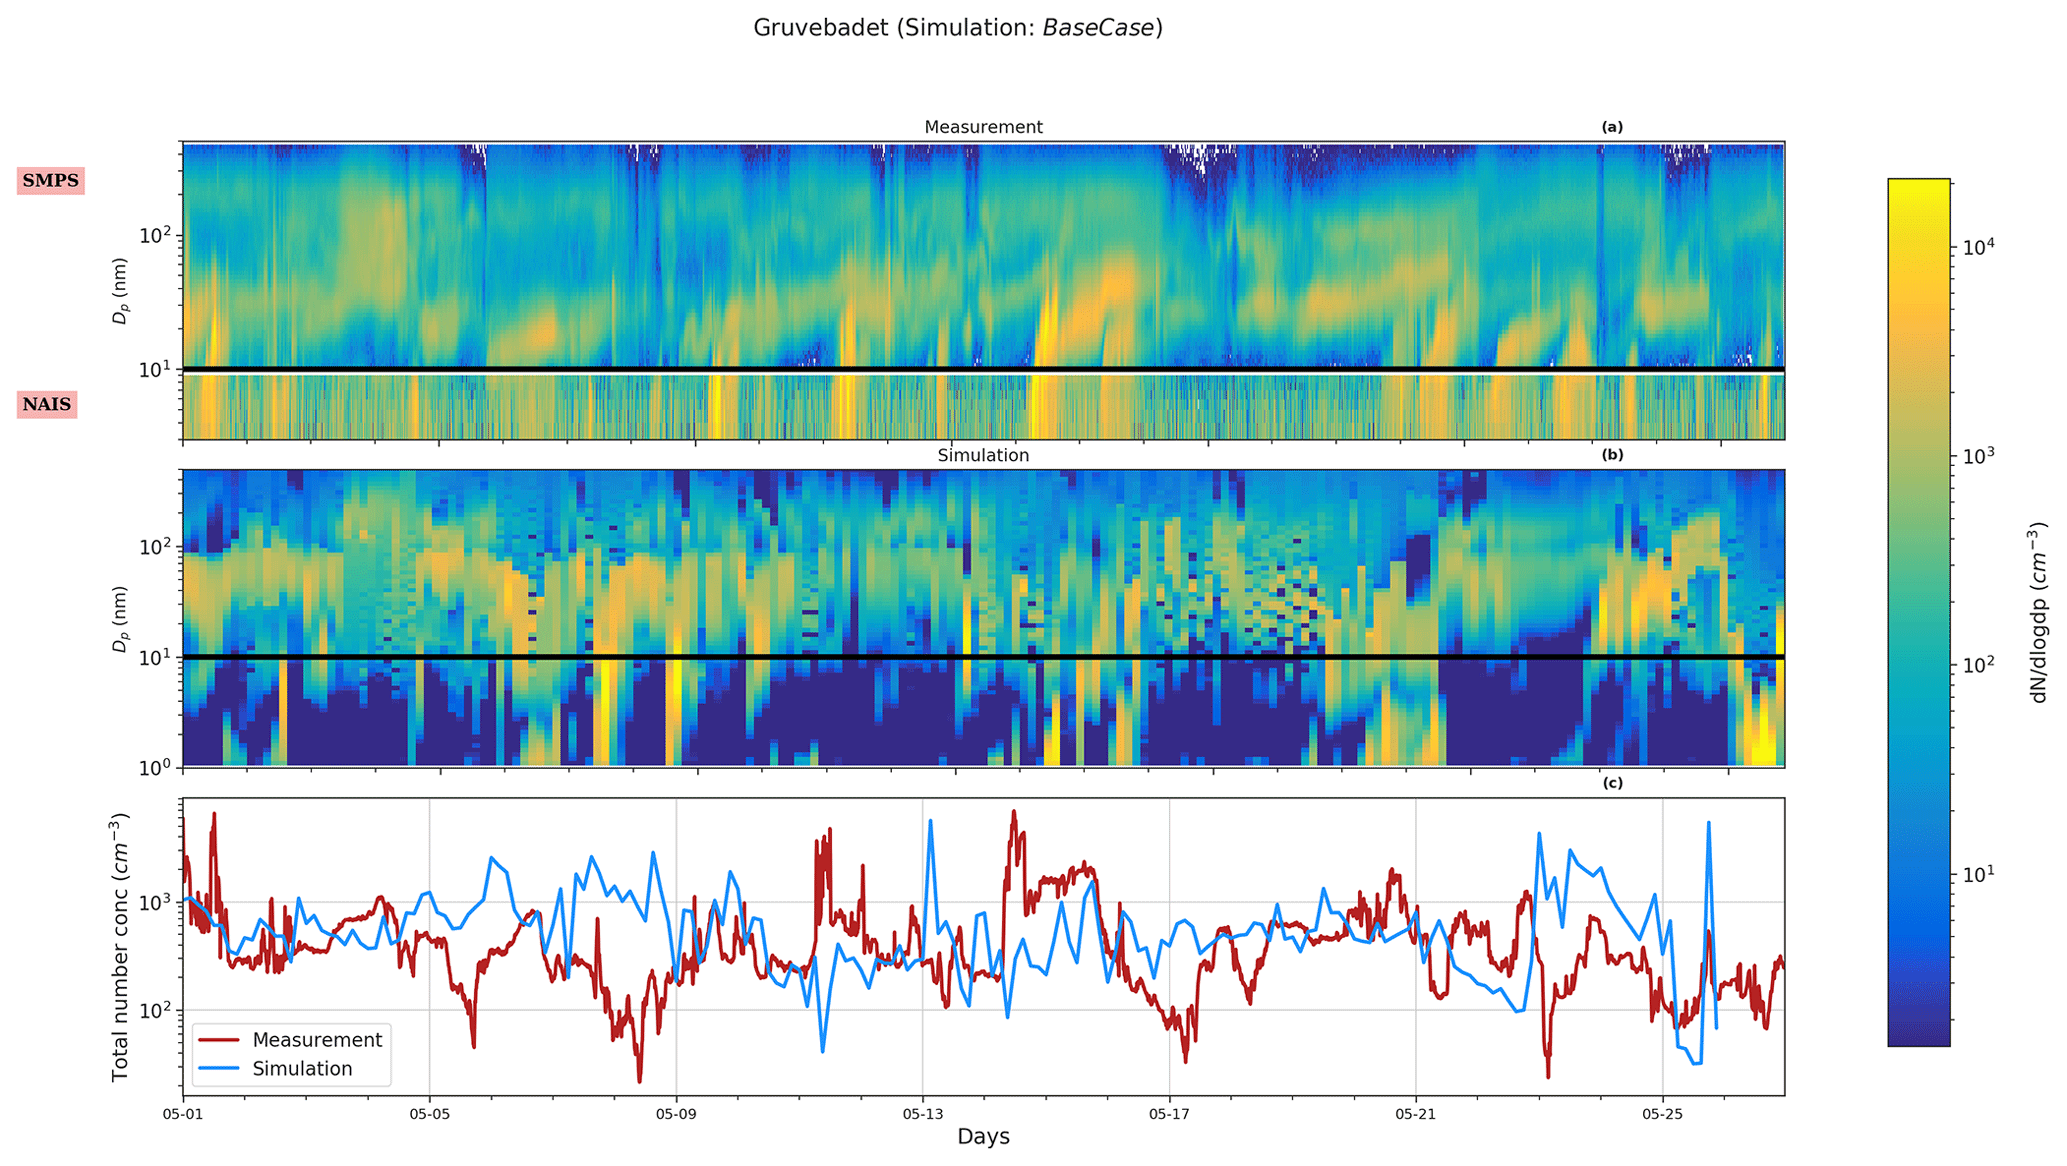
Figure 1Particle number size distribution at Gruvebadet for BaseCase. Panel (a) shows the measurement data for the period 1–25 May from SMPS (10–470 nm) and NAIS (2.5–10 nm), panel (b) provides the modeled particle size distribution, and panel (c) shows the total measured and simulated number concentrations. The black line at 10 nm denotes the boundary above which SMPS data start and NAIS data end. The abscissa indicates the time for the entire simulated duration. The ordinate in Fig. 1 for both panels (a) and (b) indicates the particle diameter (Dp, nm).
3.1 Particle number size distributions
Figure 1a and b show the observed and predicted particle number size distributions at Gruvebadet for the BaseCase simulation. Figure 1a includes SMPS observations starting from 10 to 470 nm and NAIS observations for neutral particles in the range 2.5–10 nm (boundary marked by the black line) since NAIS data below 2.5 nm cannot be relied upon, owing to the presence of corona-generated ions (Jayaratne et al., 2017; Manninen et al., 2011, 2016).
In the BaseCase simulations the model captures particle formation on 2 May followed by an increasing number of Aitken and accumulation mode particles during the days of 3–4 May, which is the result of more polluted air masses arriving at Ny-Ålesund from the European continent (Fig. S1 in the Supplement). Similarly, the model reproduces the particle formation on 20 May, specifically in the size range 2–8 nm, but overestimates the Aitken mode and accumulation mode particle concentration on 21 May. However, the model tends to underestimate the nucleation mode particle number concentrations between 10–25 nm (N10−25 nm) around noon and overestimate the concentrations during the morning and evening (Fig. S2a). The model and measurements show an apparent time delay in the formation of new particles larger than 10 nm. While the measurements show a peak at 11:00 CEST (for all times throughout) the simulated N10−25 nm shows a maximum at 03:00 and 18:00. The modeled N10−25 nm maximum around 18:00 is likely a result of the formation of new particles around noon, which grow to >10 nm in diameter during the afternoon and evening by condensation of H2SO4. The predicted Aitken (N25−100 nm) and accumulation mode particle concentrations (N>100 nm) which form a few days upwind of the station are overall in good agreement with the measurements, which show a minor diurnal trend (Fig. 2b and c). The measurements indicate that at Gruvebadet N10−25 nm contributes the most significant fraction of measured total number concentrations with 45.3 %, while N25−100 nm and N100−470 nm contribute 30.5 % and 23.94 %, respectively. However, the simulations predict a greater contribution of Aitken mode (∼53.85 %) to total number concentration, with N10−25 nm and N100−470 nm accounting for ∼36.58 % and 9.57 %, respectively (Fig. S2).
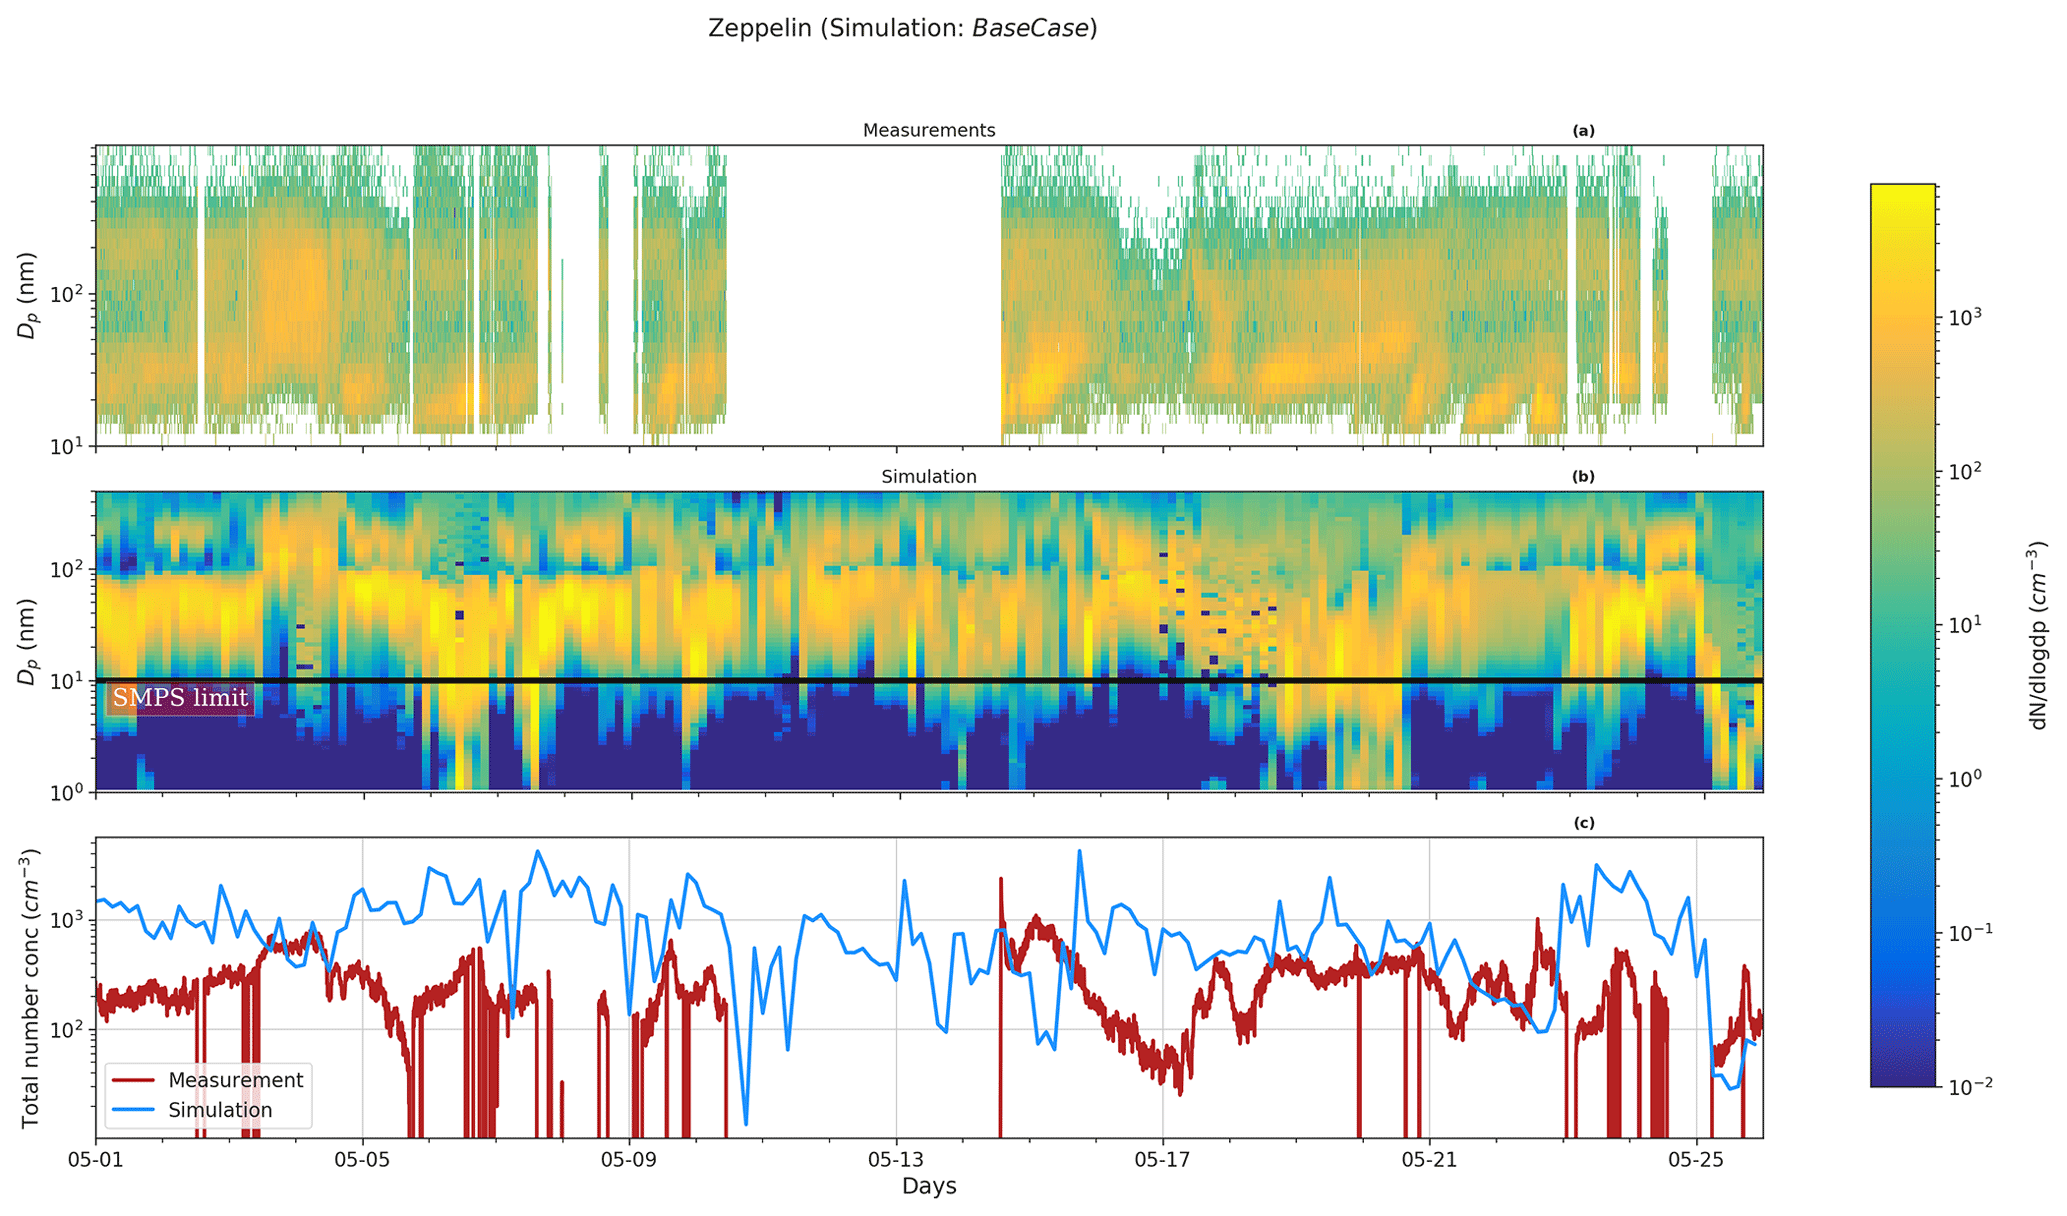
Figure 2Particle size distribution at Zeppelin. Panel (a) shows the measurement data for the period 1–25 May from the SMPS, panel (b) provides the simulated particle size distribution, and panel (c) shows the total measured and simulated number concentrations for the BaseCase simulations. The abscissa and ordinates are similar to Fig. 1.
Figure 2 shows the measured size distribution in panel (a) and simulated size distribution in panel (b) for Zeppelin. At Zeppelin, the model overestimates the number concentration in nucleation and Aitken modes (also see Fig. S3). The particle number size distribution measurements at Zeppelin indicate that the relative contribution of the three modes (nucleation, Aitken, and accumulation) varies to some extent when compared to Gruvebadet. Measurements show that at Zeppelin N10−25 nm contributes ∼33.46 %, N25−100 nm 46.43 %, and N>100 nm 20.11 % to the total particle number concentrations. The model predicts a lower relative contribution of N10−25 nm (26.94 %) and a greater contribution of N25−100 nm (63.44 %) to the total simulated particle number concentrations. The diurnal trends at Zeppelin agree well with earlier measurements conducted at Zeppelin in spring by Ström et al. (2009). Additionally, the measured diurnal pattern at Zeppelin varies in comparison to Gruvebadet. At Zeppelin, the N10−25 nm concentrations peak in the afternoon and evening. The modeled N10−25 nm shows only a weak diurnal trend. It should be noted that the measurements show a time delay of around 3 h in the peak N10−25 nm concentrations at the two sites (Figs. S2 and S3). This is possibly a result of vertical mixing and dilution effects modulating the observed particle number concentrations at sites situated at different altitudes, similar to observations made at Zeppelin and Corbel by Ström et al. (2009).
ADCHEM considers the formation of new particles via both the ion-mediated and neutral H2SO4–NH3 clustering pathways. Beck et al. (2021) observed a dominant contribution of negatively charged H2SO4–NH3 clusters to secondary particle formation in May 2017 at Ny-Ålesund, with HIO3 playing a small role in the initial particle formation. However, the discrepancy in the modeled and observed diurnal trends of N10−25 nm could indicate that there are other sources or vapors that might potentially contribute to the particle formation. Other possible NPF mechanisms may involve amines (Olenius et al., 2013) and pure biogenic highly oxidized molecules (HOMs) (neutral and ion induced) nucleation (Kirkby et al., 2016). We speculate that the exclusion of these other mechanisms (HIO3, H2SO4 amines, and HOM-driven particle formation) might result in the discrepancies in the modeled and observed diurnal particle number concentration trends. HIO3-induced particle formation could, for example, play an important role if the air masses upwind of Ny-Ålesund traverse the sea-ice-covered regions (Baccarini et al., 2020; Beck et al., 2021).
Figure 3 presents the median particle number size distribution for the BaseCase simulation at both Zeppelin and Gruvebadet, with the respective 25th and 75th percentiles, for the entire selected period. At Gruvebadet, the modeled and measured median particle number size distributions are in reasonable agreement for both Aitken and accumulation modes. However, the model overpredicts the median Aitken mode concentrations at Zeppelin by a factor of ∼5.5. The modeled Aitken mode peak at both measurement sites is ∼ 50 nm, while the measured Aitken mode peak is ∼30 nm. Though the modeled accumulation mode peak is at a larger size (∼150 nm), compared to the measured accumulation mode peak (∼110 nm), the predicted value is slightly lower than the monthly averaged accumulation mode peak location measured at Zeppelin in earlier studies (∼160–170 nm, Dall'Osto et al., 2019).
The discrepancy between the modeled and measured particle concentrations at Zeppelin can be caused by the underlying complexity of modeling the boundary layer dynamics at an elevated site, such as Zeppelin. The vertical mixing of aerosols along the up-slope or down-slope of a mountain site is difficult, if not impossible, for a one-dimensional column model, since it is unable to capture the topographical influence on locally varying wind speeds or latent and sensible heat fluxes (Mikkola, 2020; Wainwright et al., 2012).

Figure 3Median particle number size distribution at Gruvebadet and Zeppelin for both modeled (BaseCase simulations) and measured values. The shaded areas indicate the 25th and 75th percentiles for both model and measured median particle number size distribution. At Zeppelin, the simulated median size distribution is calculated for periods only when SMPS data were available.
Another detectable feature in the median particle number size distribution is the diameter of the Hoppel minimum (Hoppel et al., 1985, 1986) and the role of in-cloud processing in forming this minimum. A Hoppel minimum is often observed in marine air masses (Fossum et al., 2018; Tunved et al., 2013; Zheng et al., 2018) and is attributed to in-cloud processing of aerosols, with chemical processing (e.g., sulfate production via oxidation of dissolved SO2) (Feingold and Kreidenweis, 2000; Hoppel et al., 1986) and coalescence of droplets playing a key role (Flossmann and Wobrock, 2019; Hoppel et al., 1986; Hoppel and Frick, 1990; Noble and Hudson, 2013). It has been estimated that, on average, aerosols take part in about 10 non-precipitating cloud cycles before they are removed from the atmosphere by wet scavenging (Hoose et al., 2008; Hoppel et al., 1986; Rosenfeld et al., 2014). These non-precipitating cloud cycles facilitate the formation of hygroscopic accumulation mode particles, with low critical supersaturation (Sc) that readily activates to cloud droplets during subsequent cloud cycles, thus growing to larger sizes. This is because the activated particles undergo chemical processing, gas-to-particle conversions, coalescence, and coagulation with other interstitial particles. Upon evaporation of water, the emerging dry particles have a larger size and lower Sc, leading to a minimum being formed between the un-activated and activated cloud droplets (Herenz et al., 2018; Hudson et al., 2015; Noble and Hudson, 2013). The diameter at which the Hoppel minimum is observed varies depending on the cloud supersaturation and particle composition (Hoppel et al., 1986; Hudson et al., 2015), with Hoppel minimum sizes observed in ranges from 60 nm at Zeppelin Ny-Ålesund to around 90 nm at Tuktoyaktuk, Canada (Herenz et al., 2018; Tunved et al., 2013).
The median particle number size distribution in Fig. 3 shows that at both stations the measured Hoppel minima is around ∼60 nm, while the simulated Hoppel minima are around the size of ∼100 nm at both sites. This difference in location of Hoppel minima can be attributed to the assumed value of S=0.25 % in the model. The value of S used in the model lies in the range of typical marine stratocumulus clouds, which can vary between 0.1 %–1 % (Fossum et al., 2018; Quinn et al., 2017). With S=0.25 % the sulfate-dominating particles in the Arctic marine boundary layer will be activated into cloud droplets if their diameter is greater than ∼85 nm in diameter (Fig. S10).
3.2 Gas- and particle-phase chemical composition of important precursors
Figure 4 shows the range of simulated gas-phase concentrations of DMS oxidation products H2SO4, MSA, and HIO3 for the entire period at height levels representing Gruvebadet. The mean measurement values (red dots) represent gas-phase concentrations for the same species from an earlier 2017 May campaign performed at Gruvebadet by Beck et al. (2021). Measurements of H2SO4 at Gruvebadet from May 2017 indicate monthly mean concentrations around ∼106 molec. cm−3 (Beck et al., 2021). The modeled H2SO4 concentrations at Gruvebadet are 3×10⁶ molec. cm−3, implying a reasonably good model performance in predicting gaseous precursor concentrations. The simulated gas concentrations of MSA (105–108 molec. cm−3) also agree well with the measurements made at Gruvebadet in May 2017 by Beck et al. (2021), wherein they measured daily averages of MSA gas concentrations on the order of 107 molec. cm−3. The low modeled values of MSA and DMSO gas-phase concentrations at the height representing Zeppelin (see Fig. S4, e.g., between 15–17 May) coincide with the period where the planetary boundary layer height (PBLH) is below the altitude of Zeppelin station (see Fig. S5). Overall, we can conclude that the modeled precursor gas concentrations at the two measurement sites are, in general, in good agreement with earlier measurements at the two sites.
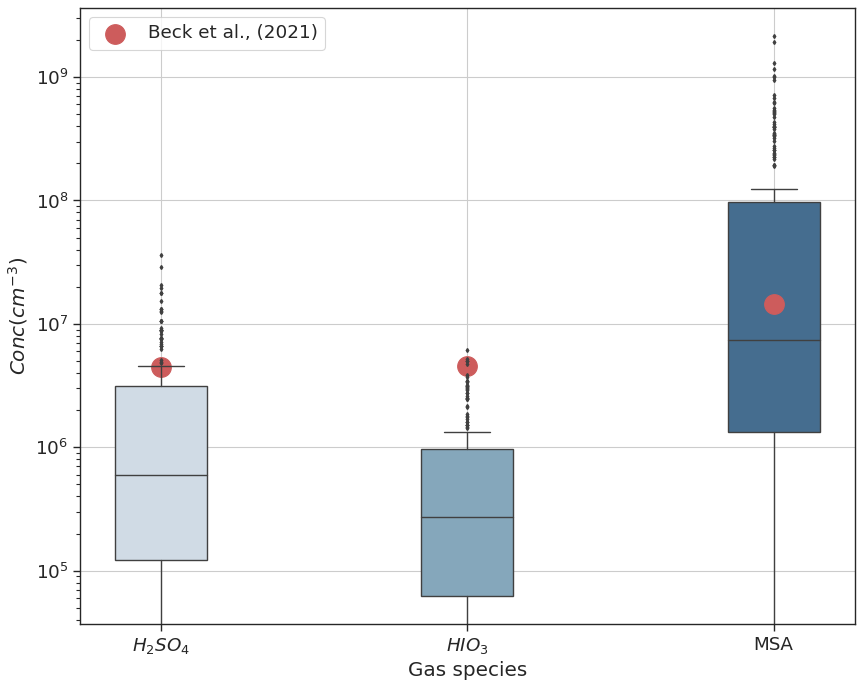
Figure 4Gas-phase concentrations at Gruvebadet for the BaseCase simulations. The red dots indicate the mean measured values from an earlier 2017 May campaign conducted at Gruvebadet by Beck et al. (2021).
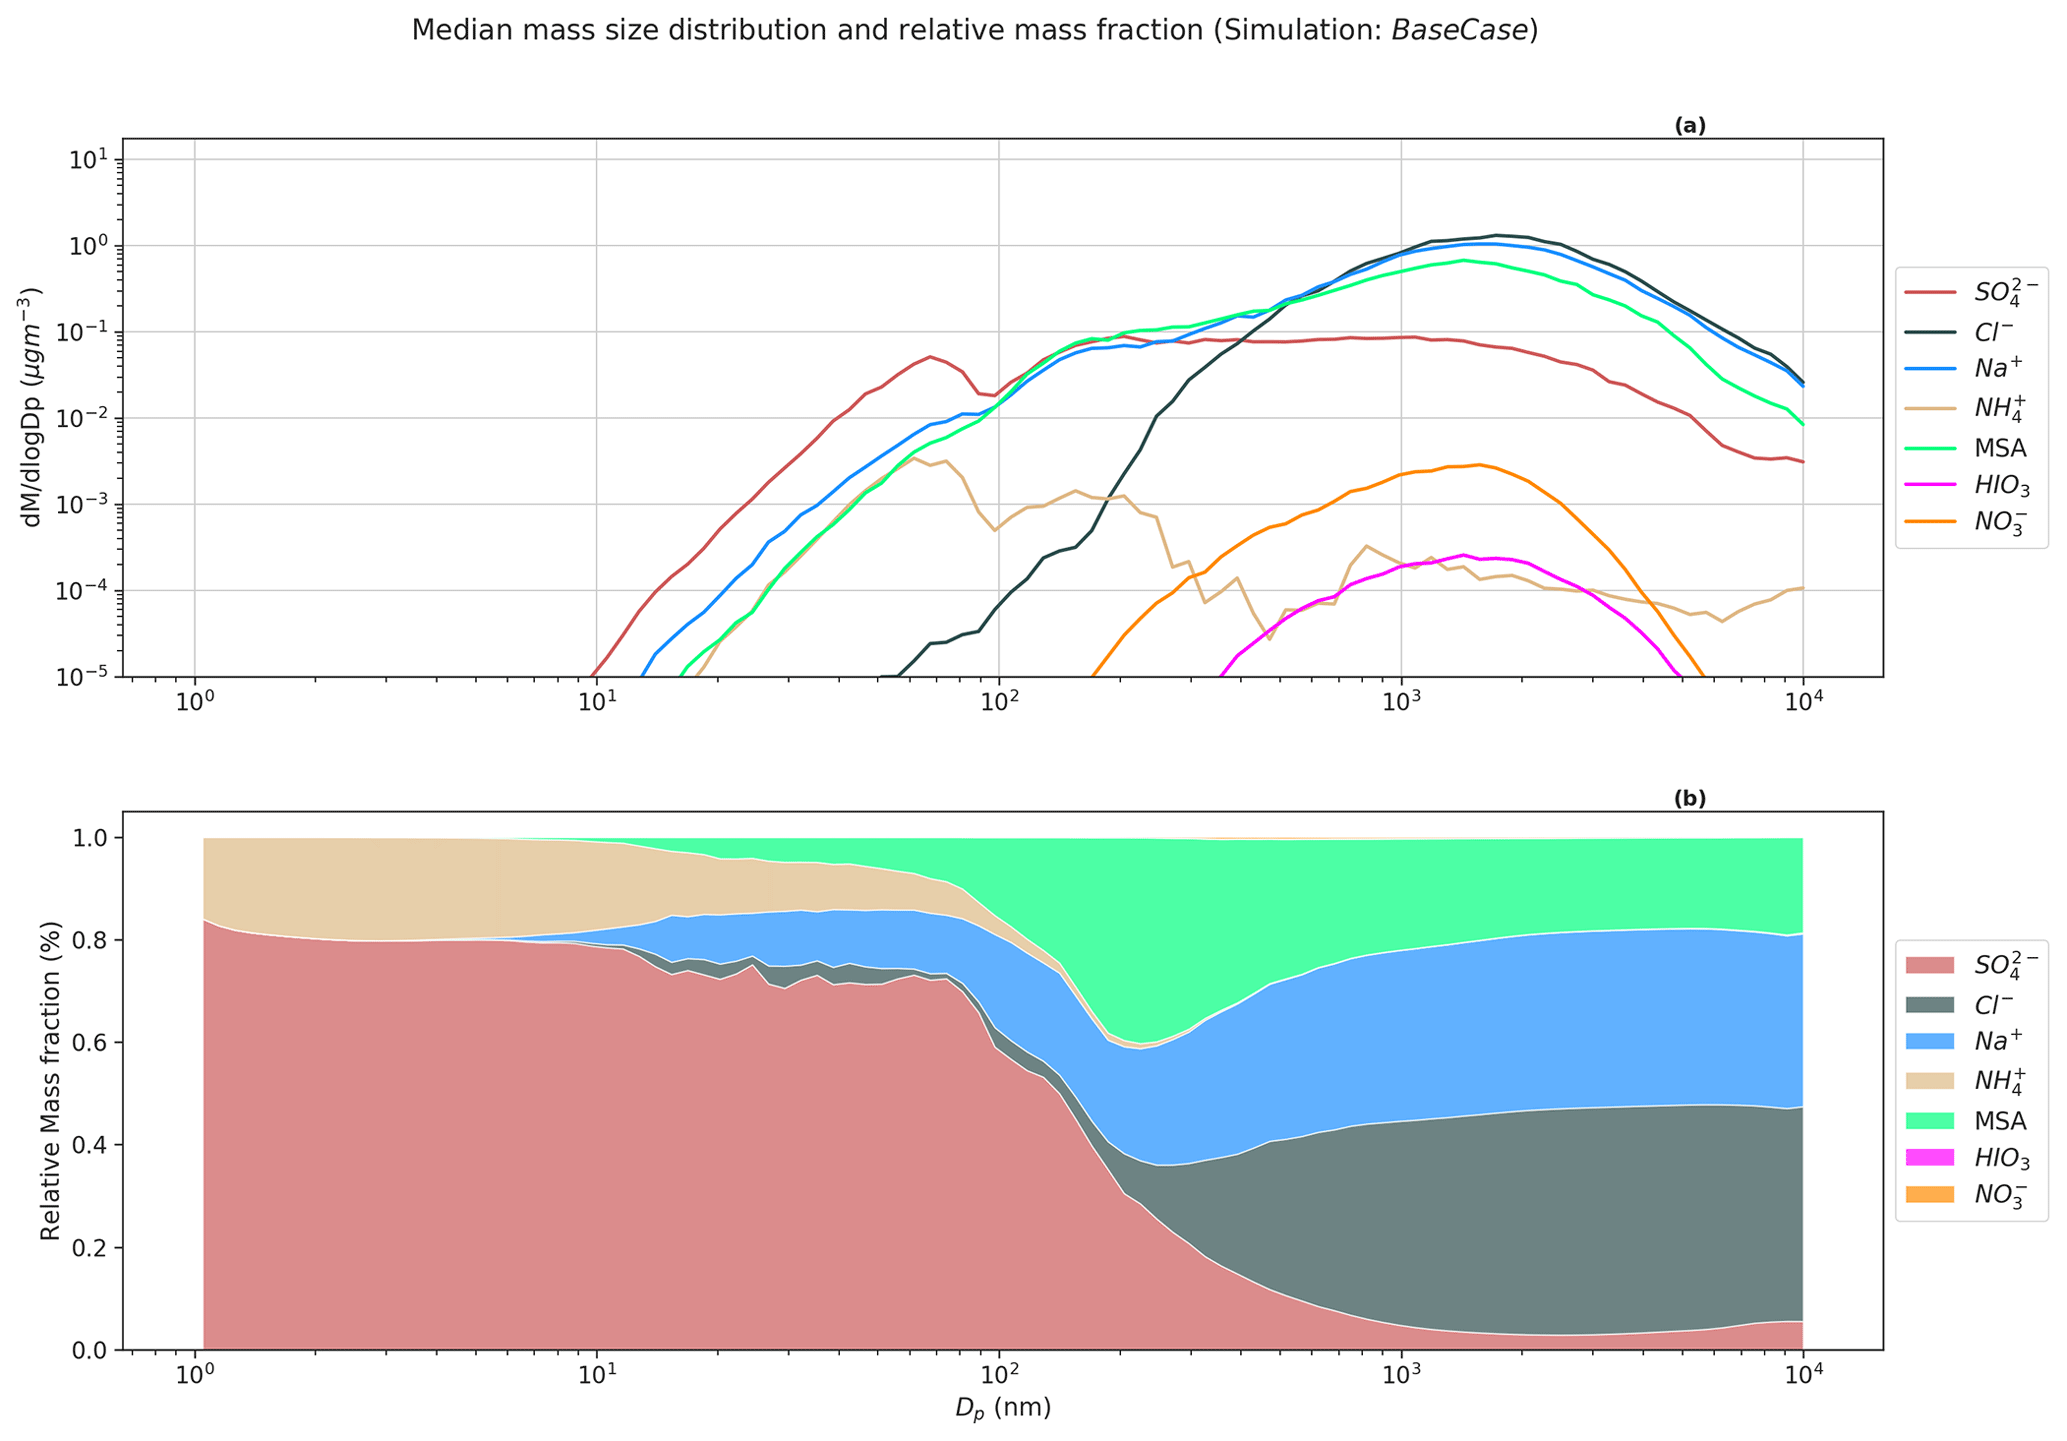
Figure 5Simulated median mass size distribution for BaseCase simulations. The upper panel (a) shows the median mass size distribution for compounds Cl−, Na+, MSA, SO, NH, HIO3, and NO for the entire size distribution ranging from 1.07 nm–10 µm. The lower panel (b) shows the relative mass fractions or contribution of compounds Cl−, Na+, MSA, SO, NH, HIO3, and NO to total non-refractory PM at different sizes.
Figure 5a shows the simulated median mass size distribution of compounds Cl−, Na+, MSA, SO, NH, and NO for the BaseCase runs in the lowest model layer. Figure 5a indicates that the nucleation mode particles are composed mainly of SO and NH, while MSA, Cl−, and Na+ dominate PM for larger particles. The observed and modeled high MSA(g) concentrations in comparison to H2SO4(g) at Ny-Ålesund is not reflected in the respective vapor contribution to the nano-particle growth. This is because, in contrast to H2SO4, MSA is not a non-volatile condensable compound. The gas-to-particle partitioning of MSA requires co-condensation and dissolution of (NH3) (Hodshire et al., 2019) or the existence of cations such as Na+, which decreases the particle acidity ([H+]). Figure 5b shows the relative mass fraction of the abovementioned compounds to PM at different sizes. SO and NH dominate the mass for particles in the nucleation and Aitken modes. SO contributes ∼74 % and ∼71 % to nucleation and Aitken mode PM, with its contribution decreasing for accumulation (100 nm–1 µm) and coarse (>1 µm) mode PM (∼6 % and 3.36 %, respectively) (Table S1). NH contribution follows a similar trend, as SO, with 12.34 % and 6.95 % contribution to nucleation and Aitken mode PM, but is insignificant for accumulation and coarse mode PM (Table S1). The loss of primary sea spray aerosols due to wet scavenging promoted the growth of secondary aerosol particles in the nucleation and Aitken modes by NH and SO as seen in Fig. 5b. Na+ (∼32.9 %), Cl− (∼39.5 %), and MSA (20.45 %) are the dominant contributors to accumulation and coarse mode PM. In the BaseCase simulations, gas-phase SO2 dissolves in the cloud droplets and is oxidized by H2O2 into SO (Wollesen de Jonge et al., 2021). Previous modeling studies have shown that a very small fraction of MSA is formed in the gas phase. Instead, most MSA is formed via ozonolysis of MSIA in the aqueous phase (Hoffmann et al., 2016; Wollesen de Jonge et al., 2021). It should be noted that HIO3 and NO have an insignificant contribution to total PM10, amounting to ∼0.05 % and 0.17 %, respectively.
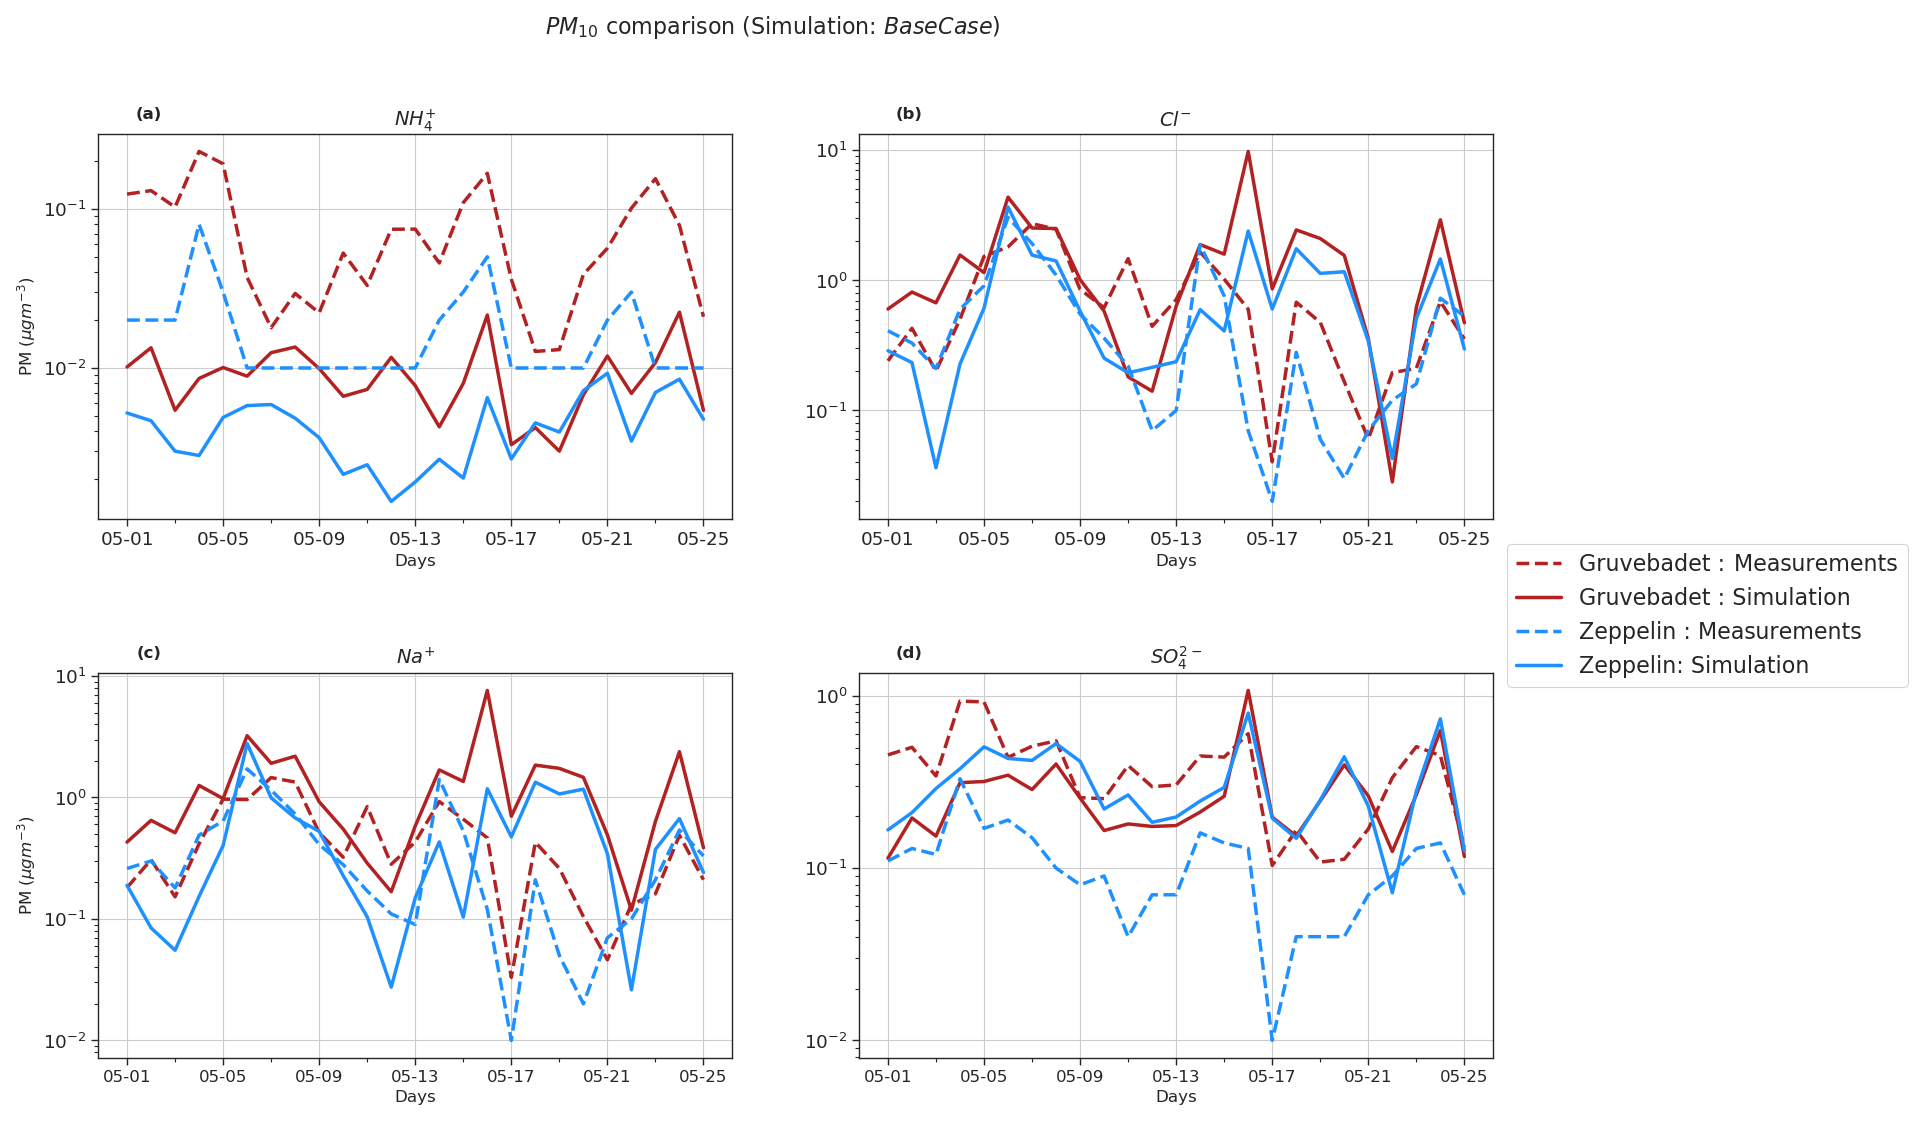
Figure 6PM10 comparison of BaseCase simulations with daily filter samples from Gruvebadet and Zeppelin for the entire modeled period. Panel (a) shows PM10 NH, (b) shows PM10 Cl−, (c) shows PM10 Na+, and (d) shows PM10 SO filter samples. The dotted lines in each panel indicate measurement values, and the solid line denotes simulated values. The ordinate is plotted at log scale to better visualize the low values.
Figure 6 compares the daily PM10 filter measurements to the modeled values at both measurement stations. The model prediction of PM10 Cl−, Na+, SO, and NH was evaluated using statistical metrics such as NMB, FAC2, correlation coefficient (r), and RMSE (Table 3). Though the model does well in simulating the trends of PM10 SO, Na+, and Cl− at Zeppelin (r values of 0.35, 0.51, and 0.6, respectively), it is unable to predict the NH trends accurately ().
Pearson correlation (r values) at Gruvebadet is in the range of 0.29–0.34 for PM10 NH, SO, Na+, and Cl−, implying that the model trends are reasonably consistent with the measured trends. However, at Gruvebadet the NMB values for PM10 NH and SO are underpredicted (NMB and −0.28, respectively), while PM10 Na+ and Cl− show a large overprediction (1.81 and 1.05) in the modeled values. In contrast, at Zeppelin, the modeled PM SO is overestimated (NMB = 1.96). Likewise, large RMSE and negligible FAC2 values, for PM10 Na+ and Cl−, imply discrepancies between the predicted and measured values, indicating that the model is overestimating PM10 SO, Na+, and Cl− at Gruvebadet and PM10 SO at Zeppelin. In summary, the model tends to overpredict PM10 Na+, Cl−, and SO concentrations but, on the other hand, does reasonably well in predicting the daily measured trends. Additionally, the modeled PM10 molar ratio at Gruvebadet and Zeppelin is ∼0.79 and ∼0.95, respectively. This is much higher than the observed PM10 molar ratio at both sites (∼0.39). One likely reason for this is the overestimated sea spray aerosol emissions. The PM10 molar ratios give a measure of the acidic nature of aerosol, since increased condensation of strong acid MSA and H2SO4 increases acidity of aerosols, thereby causing loss of Cl− (dechlorination) as HCl (Ayers et al., 1999; Frey et al., 2020). Thus, increased availability of H2SO4 and MSA in the particle phase in Aitken mode particles results in acid-induced Cl− loss from sea spray particles.
Table 2Evaluation of modeled PM10 values at both sites of Gruvebadet (G) and Zeppelin (Z) for the four particle-phase species Cl−, Na+, SO, and NH.
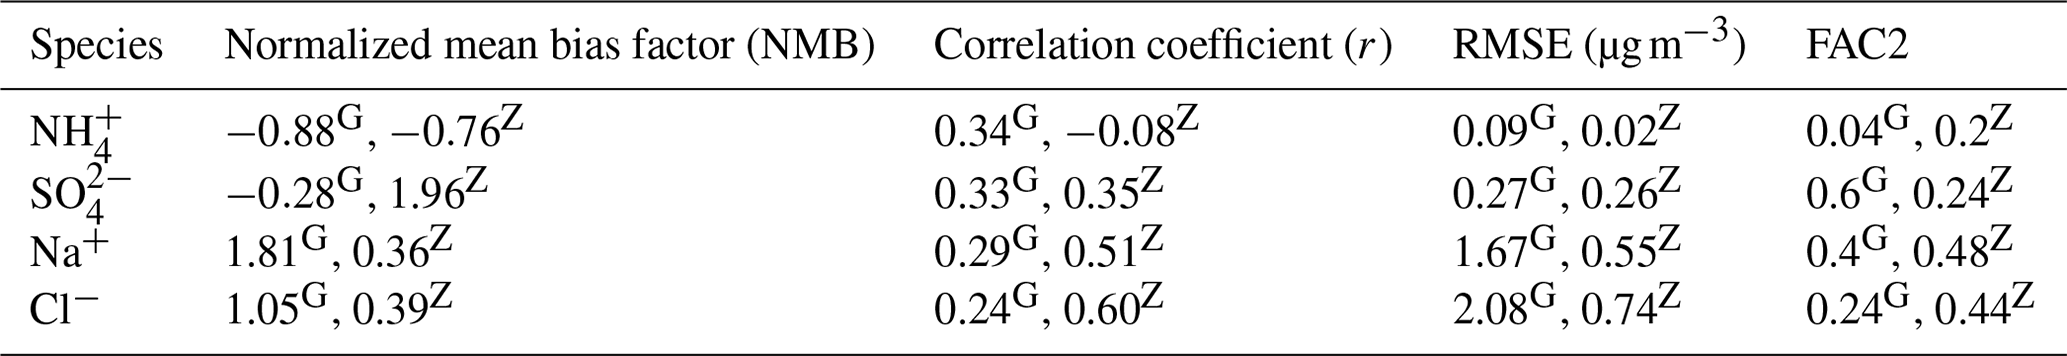
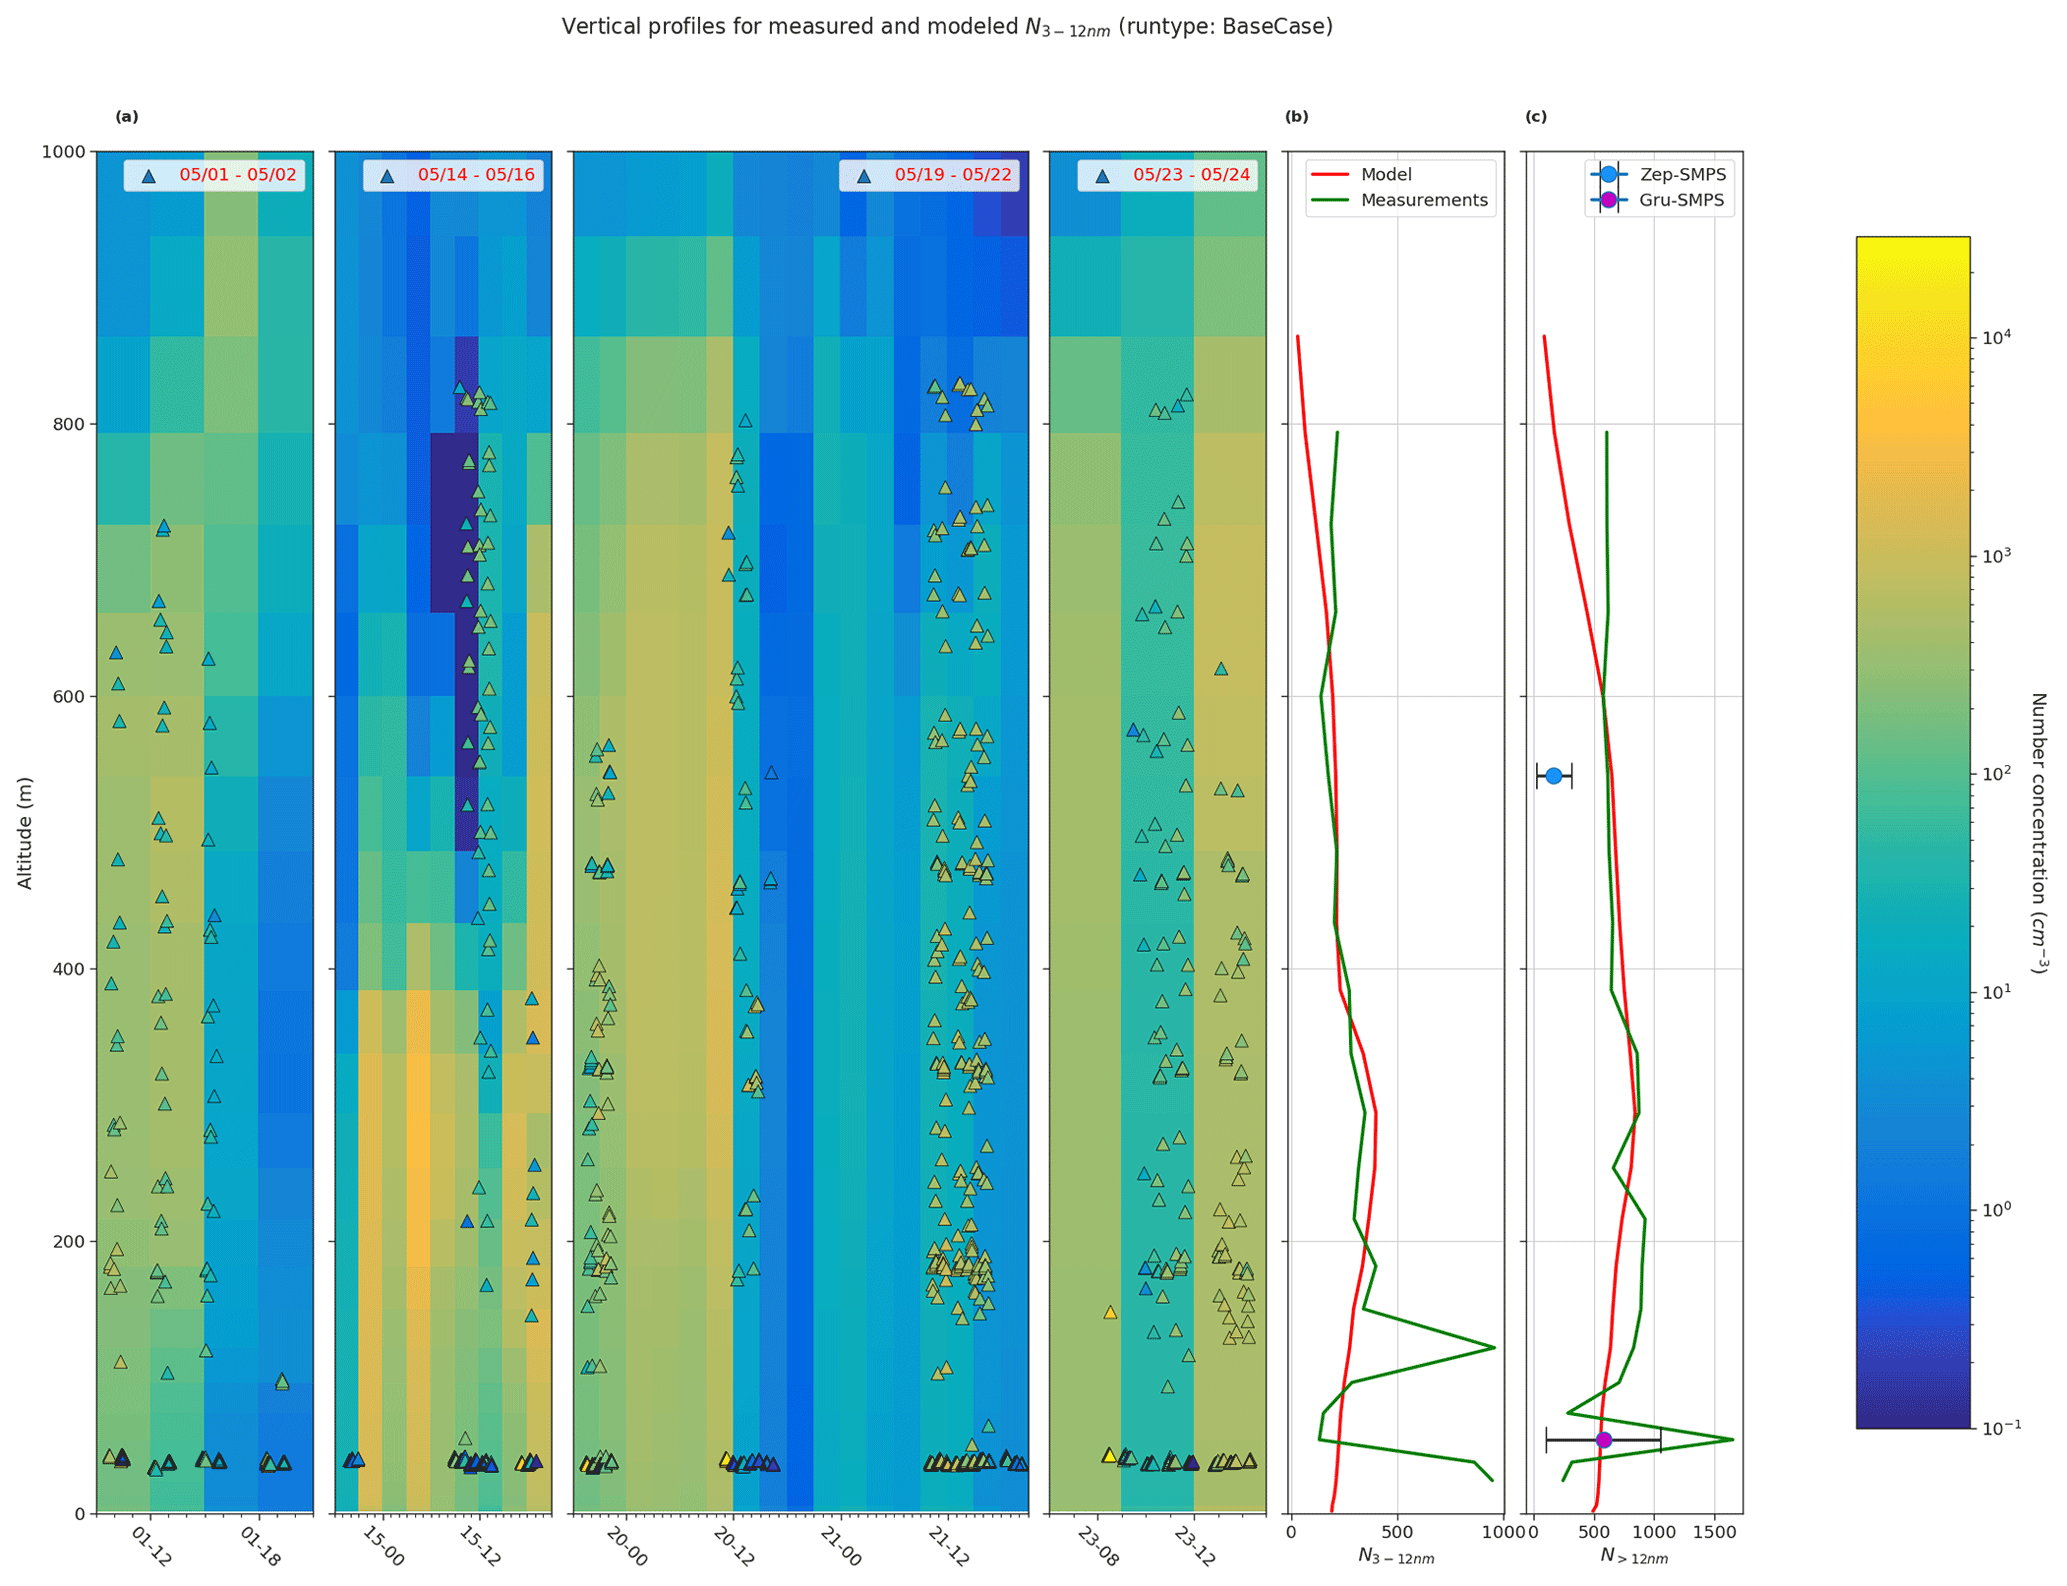
Figure 7Comparison of vertical profiles of measured particle number concentration and BaseCase simulation. Panel (a) shows measured particle number concentration between 3–12 nm (N3−12 nm, triangles), from CPC on board the UAS during the four periods 1–2 May, 14–16 May, 19–22 May, and 23–24 May (in legend) overlaid onto the simulated N3−12 nm for the same periods. Panel (b) shows the simulated and measured mean N3−12 nm, and panel (c) shows the N>12 nm for the selected period. Additionally, panel (c) also shows the mean SMPS particle concentrations at both Gruvebadet and Zeppelin. The horizontal bars for the mean SMPS values represent the standard deviation.
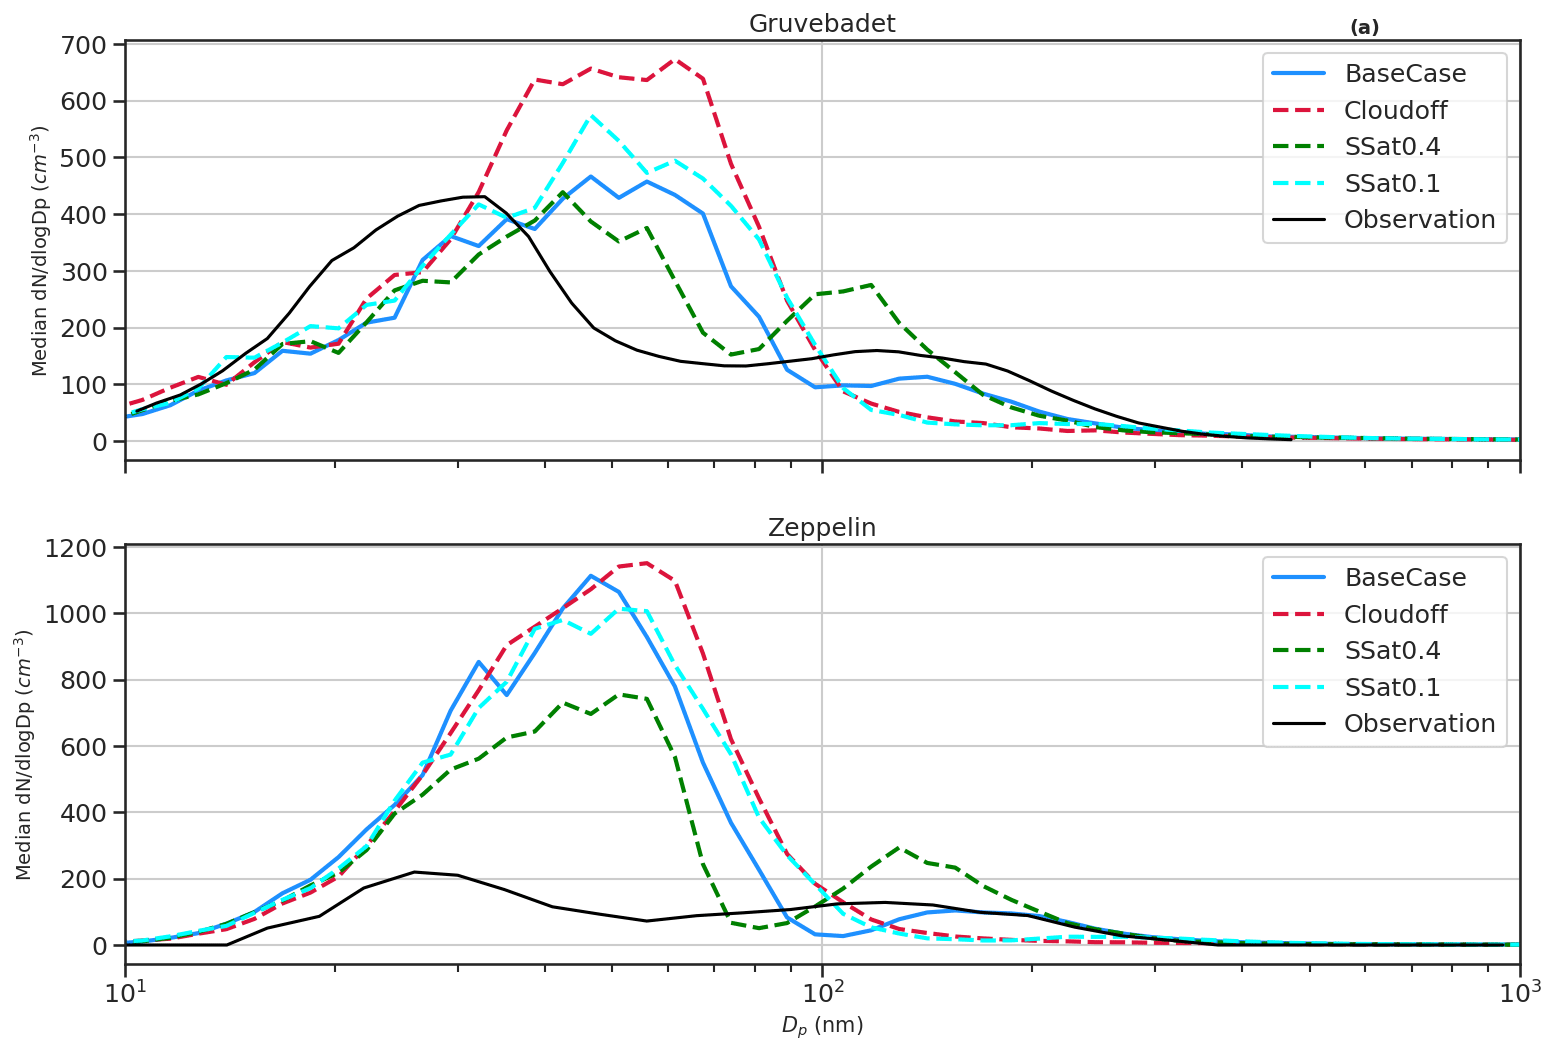
Figure 8Median size distribution at Gruvebadet (a) and Zeppelin (b) for all the sensitivity tests Cloudoff, Ssat=0.4, and Ssat=0.1 (colored dashed lines) including BaseCase (blue solid line) and observations (black solid line).
3.3 Vertical profiles of ultra-fine particle
Figure 7a shows the measured vertical N3−12 nm concentrations from CPC on board the UAS for four measurement periods overlaid onto simulated vertical profiles. Figure 7b and c show the mean vertical profiles for N3−12 nm and N>12 nm for both the BaseCase simulation and UAS measurements for the entire selected period. The model underestimates the measured N3−12 nm and N>12 nm vertical particle number concentrations below 200 m a.s.l. The NMB for N3−12 nm and N>12 nm is −0.28 and −0.14, respectively, implying that the model underestimates the particle number concentrations. Both the modeled and measured mean particle number concentrations for N3−12 nm and N>12 nm are in good agreement between the heights of 200–600 m a.s.l. The lower calculated concentrations of modeled mean particle number concentrations above 600 m a.s.l. are most likely affected by higher turbulence in the transition zone from the boundary layer to the free troposphere, which might cause a large mixing of aerosol particles. It should be noted that, at Gruvebadet, the mean SMPS particle number concentrations are in good agreement with the modeled particle number concentrations. However, at the altitude of the Zeppelin station, both the model and UAS measurements of N>12 nm are substantially higher (factor of 4) than the mean particle number concentrations measured with the SMPS at Zeppelin. This finding further strengthens the conclusion that the complex orography at Ny-Ålesund highly affects the variability in the vertical scale, which may cause this discrepancy in the observed and modeled particle number concentrations at Zeppelin (see Sect. 3.1). The UAS measurements were carried out at the airport on Ny-Ålesund (and the UAS was flown around Ny-Ålesund) where the boundary layer measurements, like the model, most likely resemble the general Arctic marine boundary layer conditions. Figure S9 shows the influence of different sensitivity simulations on the modeled vertical particle number concentrations. The large spread in the modeled vertical particle number concentrations in Fig. S9 highlights the importance of constraining uncertain parameters such as cloud supersaturation and NH3 gas emissions, to better simulate secondary aerosol formation in marine polar regions.
3.4 Sensitivity tests
In this section, we will discuss the results from the sensitivity tests that we performed to complement the main BaseCase simulations. The settings of different sensitivity tests are described in Table 1.
Median particle size distribution for sensitivity tests
The sensitivity study Cloudoff was performed to test how in-cloud processing affects the formation of larger particles, especially the accumulation mode (Fig. 8). In the Cloudoff test, in-cloud processing was switched off in the model, and the RH was set to just below supersaturation (99.9999 %) in the model grid cell where clouds (RH = 100.5 %) exist in the BaseCase runs. The aim of the Cloudoff simulation was to investigate if the model can capture the observed accumulation mode without aerosol cloud processing. It is clear from Fig. 8a and b that in Cloudoff simulations, the median size distribution lacks the accumulation mode and Hoppel minima and has a higher Aitken mode particle concentration compared to either BaseCase or the measured median size distribution. This further emphasizes the importance of in-cloud processing in activation of particles to CCN sizes and their growth to larger sizes. However, it should be noted that other processes such as Brownian scavenging by larger cloud droplets could result in the shift in particles from the Aitken mode to accumulation mode (as seen in median measured size distribution, Fig. 8, Noble and Hudson, 2019). Another noteworthy point in Cloudoff simulations is the larger number concentration of particles <10 nm compared to other cases. One plausible reason is the lack of activated cloud droplets, since the large surface areas of activated droplets are efficient at Brownian scavenging of smaller particles (Hudson et al., 2015). Likewise, the median particle number size distribution from the sensitivity tests with lower cloud supersaturation (S) of 0.1 % Ssat=0.1 reduces the accumulation mode particles, since there are fewer particles with Sc<S available for activation. Increasing S to 0.4 % increases accumulation mode particles, since more particles with Sc<S are activated to cloud droplets (Aitken mode concentration decreases with respect to BaseCase simulations, since more smaller particles are activated into cloud droplets). Therefore, simulated results show that increasing the cloud supersaturation results in a higher number of smaller particles being activated into cloud droplets and shifts the simulated Hoppel minima close to the measured sizes. Figure S6 shows median particle size distribution for all sensitivity tests.
The SalterSSA sensitivity test underestimates both the Aitken and accumulation mode concentrations at Gruvebadet (Fig. S5). The Salter sea spray parameterization produces ∼2 magnitudes fewer Aitken mode particles compared to Sofiev et al. (2011), while the coarse mode particle emissions using SalterSSA parameterization are higher than Sofiev et al. (2011). This can cause MSA, H2SO4, and NH3 to partition onto coarse mode particles rather than contributing to NPF and growth of the nucleation and Aitken mode particles, which substantially lowers the Aitken and accumulation mode number concentrations. The NPFoff simulation from Fig. S6 shows lower Aitken mode concentrations, implying that the main contributor to Aitken mode particle number concentrations is the secondary aerosols rather than the primary sea-salt particles.
Another parameter of uncertainty is the concentration of NH3 in the marine atmosphere. The LowNH3 simulations, as expected, result in lower Aitken mode particles, whereas HighNH3 simulations show an overprediction of Aitken mode concentrations (Fig. S6). This underlines the necessity of constraining ocean and marine emissions of NH3 to better predict the aerosol particle formation in marine polar environments.
Particle-phase comparison for sensitivity tests
Figure 9 shows the contribution of constituent compounds to PM at different particle sizes with respect to the BaseCase simulation. The overall mean contribution of SO and MSA to total PM10 decreased by ∼8 % and 11 %, respectively, in Cloudoff runs compared to the BaseCase simulations. It is expected that in non-cloud conditions there is a reduction in SO and MSA PM contribution because of the reduced partitioning of gaseous SO2 to the cloud droplets (for PM SO formation) and inhibition of MSIA ozonolysis in the cloud droplets (leading to PM MSA formation) (Chen et al., 2018; Hoffmann et al., 2016; Wollesen de Jonge et al., 2021). This is observed for accumulation mode particles between size ranges of 100 nm to1 µm, which is characterized by lower SO and MSA PM. On the other hand, PM SO and MSA increase for coarse mode particles (>1 µm). Without cloud droplet activation the deliquescent sea spray coarse mode particles become a major liquid water reservoir where MSIA and to a lesser extent SO2 are dissolved and oxidized into MSA and SO, which partly explains the increase in PM MSA and SO for sizes >1 µm. The results from the Cloudoff simulation agree with the findings from Wollesen de Jonge et al. (2021), who found that MSA was almost exclusively formed in the aqueous phase via MSIA ozonolysis in cloud droplets and deliquescent particles during and in between in-cloud periods. PM SO in Cloudoff runs is mainly driven via condensation of H2SO4, since an increase in SO2 gas-phase concentrations (∼42 % with respect to BaseCase) promoted gas-phase H2SO4 production (increase of ∼44 % with respect to BaseCase), and therefore H2SO4-derived PM SO.
In the woDissolution simulation, all the PM MSA and SO are a result of the condensation of MSA(g) and H2SO4(g), since irreversible aqueous-phase chemistry is switched off. The overall contribution of PM SO to the total PM10 increases by ∼12 % relative to the BaseCase run, while on the other hand, the contribution of PM MSA decreases by ∼87 % (relative to BaseCase). The lower PM10 MSA in the woDissolution simulation emphasizes the importance of aqueous-phase formation of MSA to the growth of particles. The effect of precipitation on modeled PM (NoPrecip) indicates an increase in PM Na+ and Cl− of ∼112 % and 119 %, respectively, compared to BaseCase (Fig. S8). This is because of the decrease in the wet deposition of aerosol and sea spray particles by rain events and below-cloud scavenging. The consequence of neglecting precipitation results in increased condensation sink for H2SO4 and NH3 (increase of 62 % and 22 % in PM SO and NH, respectively), but since sea spray aerosols are not scavenged by the wet removal process, the overall fractional contribution to PM by SO, NH, and MSA is lower relative to BaseCase runs.
SalterSSA simulation results in higher PM Cl− and Na+ (470 % and 371 % increase, respectively) compared to BaseCase runs. This is because the Salter15 SSA parameterization produces larger mass emission fluxes in size ranges >1 µm compared to the Sofiev11 SSA parameterization (Barthel et al., 2019). Additionally, there is an increase of ∼19 % in PM MSA, largely due to formation of MSA in larger deliquescent coarse mode particles.
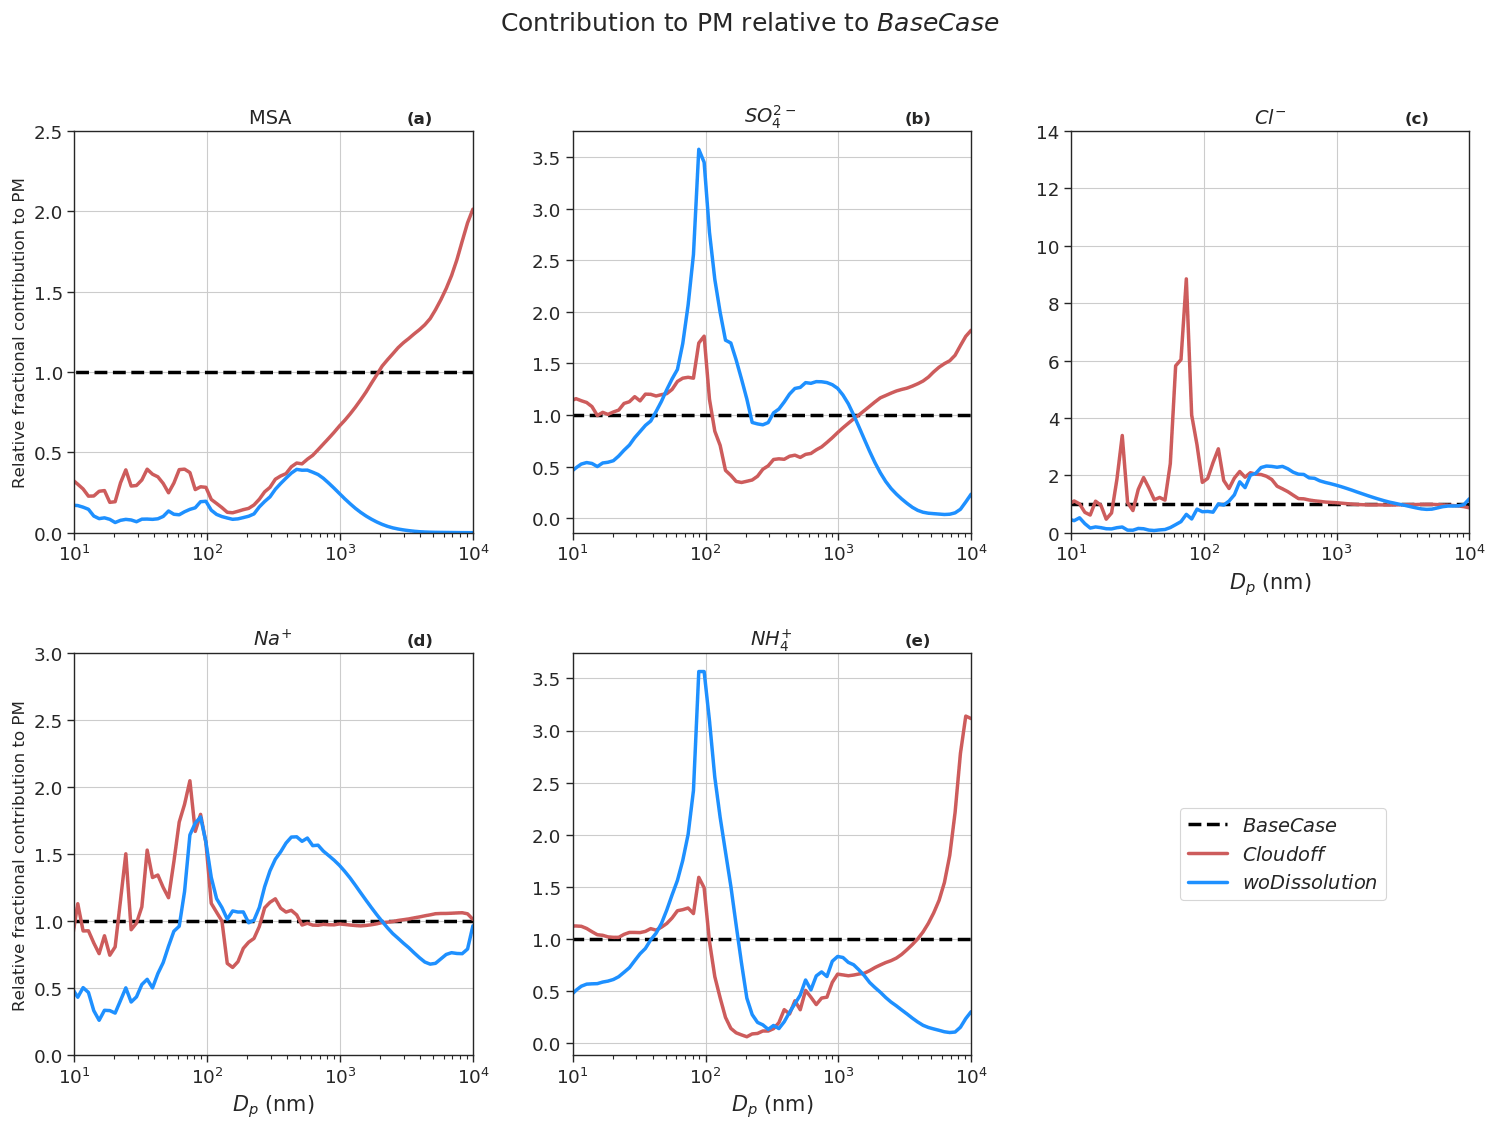
Figure 9Contribution of constituent compounds, namely MSA (a), SO (b), Cl− (c), Na+ (d), and NH (e) to PM with respect to BaseCase (the black dotted line).
In this work, we attempt to simulate secondary aerosol formation at the remote Arctic sites of Gruvebadet and Zeppelin, Ny-Ålesund, during the period of 1–25 May 2018. We used the one-dimensional column model ADCHEM which was run along FLEXPART-generated Lagrangian trajectories. Since the air masses spend most of their time over the open ocean upwind of Ny-Ålesund, we use a comprehensive multi-phase DMS chemistry scheme coupled with MCMv3.3.1 and PRAM.
In the model, new particles are formed via ion-mediated H2SO4–NH3 nucleation, with the initial particle growth mainly driven by condensation of H2SO4, while the secondary PM10 MSA and SO contribution was mainly formed by oxidation of MSIA and SO2 in the aqueous phase. At Gruvebadet, the modeled median particle number size distribution agrees reasonably well with the measurements; however, at Zeppelin, the simulated Aitken mode median concentration is overestimated by a factor of 5.5. This relatively large discrepancy in modeled and measured particle size distributions at Zeppelin, and likewise the large difference between the measured particle number size distributions at Gruvebadet and Zeppelin, can to a large extent be explained by the orographic effects at Zeppelin, which distort the atmospheric boundary layer dynamics. Thus, while the model generally is able to capture the particle number size distribution dynamics in the marine boundary layer, as measured at the near-sea-level Gruvebadet site, it generally cannot capture the observations at the mountain station of Zeppelin, which often lies above the boundary layer and may experience free-tropospheric conditions. This is also supported by the fact that N>12 nm concentrations measured with the UAS above Ny-Ålesund airport agree well with the modeled particle number concentrations, at the same altitude as Zeppelin. However, both the model and UAS N>12 nm concentrations are a factor of 4 higher than the N>12 nm observation at Zeppelin.
Both the measured and modeled particle size distributions, at both stations, show a distinct Hoppel minimum, which can be explained by in-cloud processing. Model sensitivity runs with varying cloud supersaturation indicate that a cloud supersaturation of 0.4 % or higher is required for the model to capture the observed Hoppel minima. Furthermore, model sensitivity runs show that the Aitken mode particle number concentrations are dominated by contribution of secondary aerosols rather than primary emissions. The modeled PM10 Cl− and Na+ is positively correlated when compared to PM10 filter samples. The main driver for secondary aerosol particle growth is the formation of MSA via aqueous-phase ozonolysis of the DMS oxidation product MSIA. This demonstrates the importance of multi-phase DMS chemistry in capturing the size-resolved secondary aerosol growth in marine polar regions.
The sensitivity studies indicate that it is important to limit the uncertainties in parameters such as cloud supersaturation and NH3 emissions over open oceans to get a better constraint on secondary aerosol formation and its subsequent climatic effects. This work was a first attempt to simulate new particle and secondary aerosol formation in marine polar regions using a process-based chemistry transport model that includes a comprehensive multi-phase DMS and halogen chemistry mechanism, detailed gas-molecular cluster, and aerosol dynamics. In future studies, we aim to implement ADCHEM for extended studies in polar marine and remote continental regions where different atmospheric constituents such as HIO3, terpenes, and amines drive secondary aerosol formation.
All source codes, including the complete ADCHEM model version and plotting programs used to conduct the analysis presented in this paper, can be obtained by contacting the corresponding authors Carlton Xavier and Pontus Roldin. The measurement and simulated data used in this study are available upon request by contacting the corresponding author Carlton Xavier.
The supplement related to this article is available online at: https://doi.org/10.5194/acp-22-10023-2022-supplement.
CX, PR, MBo, BA, and BW planned and designed the study. PR, RWdJ, and CX developed and set up the ADCHEM model. CX, MB, and VV performed the FLEXPART model simulations. RK, PT, MM, BA, BW, RTh, and RTr provided the measurement data. Resources were provided by PR and MBo. CX, PR, and MBo wrote the original draft, which included visualizations made by CX and PR. All other authors discussed the results and contributed to the final paper.
At least one of the (co-)authors is a member of the editorial board of Atmospheric Chemistry and Physics. The peer-review process was guided by an independent editor, and the authors also have no other competing interests to declare.
Publisher's note: Copernicus Publications remains neutral with regard to jurisdictional claims in published maps and institutional affiliations.
This article is part of the special issue “Pan-Eurasian Experiment (PEEX) – Part II”. It is not associated with a conference.
The ALADINA study was funded by the German Research Foundation under grants LA 2907/5-3 and WI 1449/22-3. Mikko Sipilä acknowledges the Academy of Finland (296628) and the European Research Council (ERC) under the European Union's Horizon 2020 research and innovation program (GASPARCON, grant agreement no. 714621). The presented research has also been funded by the Academy of Finland (Center of Excellence in Atmospheric Sciences) grant no. 4100200.
The authors would like to thank Tinja Olenius from the Swedish Meteorological and Hydrological Institute (SMHI) for help with the implementation of ACDC in ADCHEM. We would also like to acknowledge the invaluable contribution of computational resources from CSC-IT Center for Science, Finland. The authors would like to thank Noora Hyytinen from the University of Oulu and University of Eastern Finland for providing the Henry law coefficient and dissolution constants that were used in the multi-phase chemistry.
Observations at Zeppelin station were supported by the Swedish Environmental Protection Agency (Naturvårdsverket) and by the “Arctic Climate Across Scales (ACAS)” project funded by the Knut and Alice Wallenberg Foundation and by project IWCAA funded by the agency FORMAS. The authors would like to also thank the Norwegian Polar Institute (NPI) for their support.
This project has received funding from the Swedish Research Council (Formas (project no.
2018-01745-COBACCA) and VR (project no. 2019-05006)) and the Crafoord
foundation (project no. 20210969). The presented research has been also been funded by
the Academy of Finland (Center of Excellence in Atmospheric Sciences) (grant no. 4100200).
Open-access funding was provided by the Helsinki University Library.
This paper was edited by Dominick Spracklen and reviewed by two anonymous referees.
AMAP: Snow, Water, Ice and Permafrost in the Arctic (SWIPA): Climate Change and the Cryosphere. Arctic Monitoring and Assessment Programme (AMAP), Oslo, Norway. xii + 538 pp., 2011.
AMAP: AMAP, 2017. Snow, Water, Ice and Permafrost in the Arctic (SWIPA) 2017, Arctic Monitoring and Assessment Programme (AMAP), Oslo, Norway. xiv + 269 pp., https://www.amap.no/documents/doc/snow-water-ice-and-permafrost-in-the-arctic-swipa-2017/1610 (last access: 9 July 2021), 2017.
AMAP: AMAP Arctic Climate Change Update 2021: Key Trends and Impacts, 16 pp., https://www.amap.no/documents/download/6759/inline (last access: 20 May 2022), 2021.
Amore, A., Giardi, F., Becagli, S., Caiazzo, L., Mazzola, M., Severi, M., and Traversi, R.: Source apportionment of sulphate in the High Arctic by a 10 yr-long record from Gruvebadet Observatory (Ny-Ålesund, Svalbard Islands), Atmos. Environ., 270, 118890, https://doi.org/10.1016/j.atmosenv.2021.118890, 2022.
Arrigo, K. R. and van Dijken, G. L.: Continued increases in Arctic Ocean primary production, Prog. Oceanogr., 136, 60–70, https://doi.org/10.1016/j.pocean.2015.05.002, 2015.
Ayers, G. P., Gillett, R. W., Cainey, J. M., and Dick, A. L.: Chloride and bromide loss from sea-salt particles in Southern Ocean air, J. Atmos. Chem., 33, 299–319, https://doi.org/10.1023/A:1006120205159, 1999.
Baccarini, A., Karlsson, L., Dommen, J., Duplessis, P., Vüllers, J., Brooks, I. M., Saiz-Lopez, A., Salter, M., Tjernström, M., Baltensperger, U., Zieger, P., and Schmale, J.: Frequent new particle formation over the high Arctic pack ice by enhanced iodine emissions, Nat. Commun., 11, 1–11, https://doi.org/10.1038/s41467-020-18551-0, 2020.
Bärfuss, K., Pätzold, F., Altstädter, B., Kathe, E., Nowak, S., Bretschneider, L., Bestmann, U., and Lampert, A.: New setup of the UAS ALADINA for measuring boundary layer properties, atmospheric particles and solar radiation, Atmosphere-Basel, 9, 28, https://doi.org/10.3390/atmos9010028, 2018.
Barnes, I., Hjorth, J., and Mihalapoulos, N.: Dimethyl sulfide and dimethyl sulfoxide and their oxidation in the atmosphere, Chem. Rev., 106, 940–975, https://doi.org/10.1021/cr020529+, 2006.
Barrie, L. A.: Arctic air pollution: An overview of current knowledge, Atmos. Environ., 20, 643–663, https://doi.org/10.1016/0004-6981(86)90180-0, 1986.
Barthel, S., Tegen, I., and Wolke, R.: Do new sea spray aerosol source functions improve the results of a regional aerosol model?, Atmos. Environ., 198, 265–278, https://doi.org/10.1016/j.atmosenv.2018.10.016, 2019.
Beck, L. J., Sarnela, N., Junninen, H., Hoppe, C. J. M., Garmash, O., Bianchi, F., Riva, M., Rose, C., Peräkylä, O., Wimmer, D., Kausiala, O., Jokinen, T., Ahonen, L., Mikkilä, J., Hakala, J., He, X. C., Kontkanen, J., Wolf, K. K. E., Cappelletti, D., Mazzola, M., Traversi, R., Petroselli, C., Viola, A. P., Vitale, V., Lange, R., Massling, A., Nøjgaard, J. K., Krejci, R., Karlsson, L., Zieger, P., Jang, S., Lee, K., Vakkari, V., Lampilahti, J., Thakur, R. C., Leino, K., Kangasluoma, J., Duplissy, E. M., Siivola, E., Marbouti, M., Tham, Y. J., Saiz-Lopez, A., Petäjä, T., Ehn, M., Worsnop, D. R., Skov, H., Kulmala, M., Kerminen, V. M., and Sipilä, M.: Differing Mechanisms of New Particle Formation at Two Arctic Sites, Geophys. Res. Lett., 48, 1–11, https://doi.org/10.1029/2020GL091334, 2021.
Bengtsson, L., Hodges, K. I., Koumoutsaris, S., Zahn, M., and Berrisford, P.: The changing energy balance of the polar regions in a warmer climate, J. Climate, 26, 3112–3129, https://doi.org/10.1175/JCLI-D-12-00233.1, 2013.
Berndt, T., Chen, J., Møller, K. H., Hyttinen, N., Prisle, N. L., Tilgner, A., Hoffmann, E. H., Herrmann, H., and Kjaergaard, H. G.: SO2 formation and peroxy radical isomerization in the atmospheric reaction of OH radicals with dimethyl disulfide, Chem. Commun., 56, 13634–13637, https://doi.org/10.1039/d0cc05783e, 2020.
Bräuer, P., Tilgner, A., Wolke, R., and Herrmann, H.: Mechanism development and modelling of tropospheric multiphase halogen chemistry: The CAPRAM Halogen Module 2.0 (HM2), J. Atmos. Chem., 70, 19–52, https://doi.org/10.1007/s10874-013-9249-6, 2013.
Campolongo, F., Saltelli, A., Jensen, N. R., Wilson, J., and Hjorth, J.: The role of multiphase chemistry in the oxidation of dimethylsulphide (DMS). A latitude dependent analysis, J. Atmos. Chem., 32, 327–356, https://doi.org/10.1023/A:1006154618511, 1999.
Chen, Q., Sherwen, T., Evans, M., and Alexander, B.: DMS oxidation and sulfur aerosol formation in the marine troposphere: a focus on reactive halogen and multiphase chemistry, Atmos. Chem. Phys., 18, 13617–13637, https://doi.org/10.5194/acp-18-13617-2018, 2018.
Clarke, A. D., Owens, S. R., and Zhou, J.: An ultrafine sea-salt flux from breaking waves: Implications for cloud condensation nuclei in the remote marine atmosphere, J. Geophys. Res.-Atmos., 111, D06202, https://doi.org/10.1029/2005JD006565, 2006.
Cuevas, C. A., Maffezzoli, N., Corella, J. P., Spolaor, A., Vallelonga, P., Kjær, H. A., Simonsen, M., Winstrup, M., Vinther, B., Horvat, C., Fernandez, R. P., Kinnison, D., Lamarque, J. F., Barbante, C., and Saiz-Lopez, A.: Rapid increase in atmospheric iodine levels in the North Atlantic since the mid-20th century, Nat. Commun., 9, 1–6, https://doi.org/10.1038/s41467-018-03756-1, 2018.
Dall'Osto, M., Beddows, D. C. S., Tunved, P., Krejci, R., Ström, J., Hansson, H. C., Yoon, Y. J., Park, K. T., Becagli, S., Udisti, R., Onasch, T., Ódowd, C. D., Simó, R., and Harrison, R. M.: Arctic sea ice melt leads to atmospheric new particle formation, Sci. Rep.-UK, 7, 1–10, https://doi.org/10.1038/s41598-017-03328-1, 2017a.
Dall'Osto, M., Ovadnevaite, J., Paglione, M., Beddows, D. C. S., Ceburnis, D., Cree, C., Cortés, P., Zamanillo, M., Nunes, S. O., Pérez, G. L., Ortega-Retuerta, E., Emelianov, M., Vaqué, D., Marrasé, C., Estrada, M., Sala, M. M., Vidal, M., Fitzsimons, M. F., Beale, R., Airs, R., Rinaldi, M., Decesari, S., Facchini, M. C., Harrison, R. M., O'Dowd, C., and Simó, R.: Antarctic sea ice region as a source of biogenic organic nitrogen in aerosols, Sci. Rep.-UK, 7, 1–10, https://doi.org/10.1038/s41598-017-06188-x, 2017b.
Dall'Osto, M., Beddows, D. C. S., Tunved, P., Harrison, R. M., Lupi, A., Vitale, V., Becagli, S., Traversi, R., Park, K.-T., Yoon, Y. J., Massling, A., Skov, H., Lange, R., Strom, J., and Krejci, R.: Simultaneous measurements of aerosol size distributions at three sites in the European high Arctic, Atmos. Chem. Phys., 19, 7377–7395, https://doi.org/10.5194/acp-19-7377-2019, 2019.
Damian, V., Sandu, A., Damian, M., Potra, F., and Carmichael, G. R.: The kinetic preprocessor KPP – A software environment for solving chemical kinetics, Comput. Chem. Eng., 26, 1567–1579, https://doi.org/10.1016/S0098-1354(02)00128-X, 2002.
Engvall, A.-C., Krejci, R., Ström, J., Treffeisen, R., Scheele, R., Hermansen, O., and Paatero, J.: Changes in aerosol properties during spring-summer period in the Arctic troposphere, Atmos. Chem. Phys., 8, 445–462, https://doi.org/10.5194/acp-8-445-2008, 2008.
Feingold, G. and Kreidenweis, S.: Does cloud processing of aerosol enhance droplet concentrations?, J. Geophys. Res.-Atmos., 105, 24351–24361, https://doi.org/10.1029/2000JD900369, 2000.
Flossmann, A. I. and Wobrock, W.: Cloud processing of aerosol particles in marine stratocumulus clouds, Atmosphere-Basel, 10, 520, https://doi.org/10.3390/atmos10090520, 2019.
Fossum, K. N., Ovadnevaite, J., Ceburnis, D., Dall'Osto, M., Marullo, S., Bellacicco, M., Simó, R., Liu, D., Flynn, M., Zuend, A., and O'Dowd, C.: Summertime Primary and Secondary Contributions to Southern Ocean Cloud Condensation Nuclei, Sci. Rep.-UK, 8, 1–14, https://doi.org/10.1038/s41598-018-32047-4, 2018.
Frey, M. M., Norris, S. J., Brooks, I. M., Anderson, P. S., Nishimura, K., Yang, X., Jones, A. E., Nerentorp Mastromonaco, M. G., Jones, D. H., and Wolff, E. W.: First direct observation of sea salt aerosol production from blowing snow above sea ice, Atmos. Chem. Phys., 20, 2549–2578, https://doi.org/10.5194/acp-20-2549-2020, 2020.
Gantt, B., He, J., Zhang, X., Zhang, Y., and Nenes, A.: Incorporation of advanced aerosol activation treatments into CESM/CAM5: model evaluation and impacts on aerosol indirect effects, Atmos. Chem. Phys., 14, 7485–7497, https://doi.org/10.5194/acp-14-7485-2014, 2014.
Granier, C., Darras, S., Gon, H. D. van der, Jana, D., Elguindi, N., Bo, G., Michael, G., Marc, G., Jalkanen, J.-P., Kuenen, J., Liousse, C., Quack, B., Simpson, D., and Sindelarova, K.: The Copernicus Atmosphere Monitoring Service global and regional emissions (April 2019 version), https://hal.archives-ouvertes.fr/hal-02322431 (last access: 10 April 2021), 2019.
Guenther, A., Karl, T., Harley, P., Wiedinmyer, C., Palmer, P. I., and Geron, C.: Estimates of global terrestrial isoprene emissions using MEGAN (Model of Emissions of Gases and Aerosols from Nature), Atmos. Chem. Phys., 6, 3181–3210, https://doi.org/10.5194/acp-6-3181-2006, 2006.
Heintzenberg, J., Tunved, P., Galí, M., and Leck, C.: New particle formation in the Svalbard region 2006–2015, Atmos. Chem. Phys., 17, 6153–6175, https://doi.org/10.5194/acp-17-6153-2017, 2017.
Herenz, P., Wex, H., Henning, S., Kristensen, T. B., Rubach, F., Roth, A., Borrmann, S., Bozem, H., Schulz, H., and Stratmann, F.: Measurements of aerosol and CCN properties in the Mackenzie River delta (Canadian Arctic) during spring–summer transition in May 2014, Atmos. Chem. Phys., 18, 4477–4496, https://doi.org/10.5194/acp-18-4477-2018, 2018.
Hersbach, H., Bell, B., Berrisford, P., Biavati, G., Horányi, A., Muñoz Sabater, J., Nicolas, J., Peubey, C., Radu, R., Rozum, I., Schepers, D., Simmons, A., Soci, C., Dee, D., Thépaut, J.-N.: ERA5 hourly data on single levels from 1959 to present, Copernicus Climate Change Service (C3S) Climate Data Store (CDS) [data set], https://doi.org/10.24381/cds.adbb2d47, 2018a.
Hersbach, H., Bell, B., Berrisford, P., Biavati, G., Horányi, A., Muñoz Sabater, J., Nicolas, J., Peubey, C., Radu, R., Rozum, I., Schepers, D., Simmons, A., Soci, C., Dee, D., Thépaut, J.-N.: ERA5 hourly data on pressure levels from 1959 to present, Copernicus Climate Change Service (C3S) Climate Data Store (CDS) [data set], https://doi.org/10.24381/cds.bd0915c6, 2018b.
Hertel, O., Christensen, J., and Hov, Ø.: Modelling of the end products of the chemical decomposition of DMS in the marine boundary layer, Atmos. Environ., 28, 2431–2449, https://doi.org/10.1016/1352-2310(94)90395-6, 1994.
Hodshire, A. L., Campuzano-Jost, P., Kodros, J. K., Croft, B., Nault, B. A., Schroder, J. C., Jimenez, J. L., and Pierce, J. R.: The potential role of methanesulfonic acid (MSA) in aerosol formation and growth and the associated radiative forcings, Atmos. Chem. Phys., 19, 3137–3160, https://doi.org/10.5194/acp-19-3137-2019, 2019.
Hoffmann, E. H., Tilgner, A., Schrödner, R., Bräuer, P., Wolke, R., and Herrmann, H.: An advanced modeling study on the impacts and atmospheric implications of multiphase dimethyl sulfide chemistry, P. Natl. Acad. Sci. USA, 113, 11776–11781, https://doi.org/10.1073/pnas.1606320113, 2016.
Hoose, C., Lohmann, U., Bennartz, R., Croft, B., and Lesins, G.: Global simulations of aerosol processing in clouds, Atmos. Chem. Phys., 8, 6939–6963, https://doi.org/10.5194/acp-8-6939-2008, 2008.
Hoppel, W. A. and Frick, G. M.: Submicron aerosol size distributions measured over the tropical and South Pacific, Atmos. Environ. Part A, 24, 645–659, https://doi.org/10.1016/0960-1686(90)90020-N, 1990.
Hoppel, W. A., Fitzgerald, J. W., and Larson, R. E.: Aerosol size distributions in air masses advecting off the east coast of the United States., J. Geophys. Res., 90, 2365–2379, https://doi.org/10.1029/JD090iD01p02365, 1985.
Hoppel, W. A., Frick, G. M., and Larson, R. E.: Effect of nonprecipitating clouds on the aerosol size distribution in the marine boundary layer, Geophys. Res. Lett., 13, 125–128, 1986.
Hudson, J. G., Noble, S., and Tabor, S.: Cloud supersaturations from CCN spectra Hoppel minima, J. Geophys. Res., 120, 3436–3452, https://doi.org/10.1002/2014JD022669, 2015.
Jang, S., Park, K.-T., Lee, K., Yoon, Y. J., Kim, K., Chung, H. Y., Jang, E., Becagli, S., Lee, B. Y., Traversi, R., Eleftheriadis, K., Krejci, R., and Hermansen, O.: Large seasonal and interannual variations of biogenic sulfur compounds in the Arctic atmosphere (Svalbard; 78.9∘ N, 11.9∘ E), Atmos. Chem. Phys., 21, 9761–9777, https://doi.org/10.5194/acp-21-9761-2021, 2021.
Jayaratne, R., Pushpawela, B., He, C., Li, H., Gao, J., Chai, F., and Morawska, L.: Observations of particles at their formation sizes in Beijing, China, Atmos. Chem. Phys., 17, 8825–8835, https://doi.org/10.5194/acp-17-8825-2017, 2017.
Jenkin, M. E., Saunders, S. M., and Pilling, M. J.: The tropospheric degradation of volatile organic compounds: A protocol for mechanism development, Atmos. Environ., 31, 81–104, https://doi.org/10.1016/S1352-2310(96)00105-7, 1997.
Jenkin, M. E., Young, J. C., and Rickard, A. R.: The MCM v3.3.1 degradation scheme for isoprene, Atmos. Chem. Phys., 15, 11433–11459, https://doi.org/10.5194/acp-15-11433-2015, 2015.
Jericevic, A., Kraljevic, L., Grisogono, B., Fagerli, H., and Vecenaj, Ž.: Parameterization of vertical diffusion and the atmospheric boundary layer height determination in the EMEP model, Atmos. Chem. Phys., 10, 341–364, https://doi.org/10.5194/acp-10-341-2010, 2010.
Jokinen, T., Sipilä, M., Kontkanen, J., Vakkari, V., Tisler, P., Duplissy, E. M., Junninen, H., Kangasluoma, J., Manninen, H. E., Petäjä, T., Kulmala, M., Worsnop, D. R., Kirkby, J., Virkkula, A., and Kerminen, V. M.: Ion-induced sulfuric acid–ammonia nucleation drives particle formation in coastal Antarctica, Sci. Adv., 4, 1–7, https://doi.org/10.1126/sciadv.aat9744, 2018.
Kettle, A. J. and Andreae, M. O.: Flux of dimethylsulfide from the oceans: A comparison of updated data sets and flux models, J. Geophys. Res.-Atmos., 105, 26793–26808, https://doi.org/10.1029/2000JD900252, 2000.
Kim, I., Zhang, M., Kim, K., and Park, K.: First high-frequency underway observation of dms distribution in the southern ocean during austral autumn, Atmosphere-Basel, 12, 1–10, https://doi.org/10.3390/atmos12010122, 2021.
Kirkby, J., Duplissy, J., Sengupta, K., Frege, C., Gordon, H., Williamson, C., Heinritzi, M., Simon, M., Yan, C., Almeida, J., Trostl, J., Nieminen, T., Ortega, I. K., Wagner, R., Adamov, A., Amorim, A., Bernhammer, A. K., Bianchi, F., Breitenlechner, M., Brilke, S., Chen, X., Craven, J., Dias, A., Ehrhart, S., Flagan, R. C., Franchin, A., Fuchs, C., Guida, R., Hakala, J., Hoyle, C. R., Jokinen, T., Junninen, H., Kangasluoma, J., Kim, J., Krapf, M., Kurten, A., Laaksonen, A., Lehtipalo, K., Makhmutov, V., Mathot, S., Molteni, U., Onnela, A., Perakyla, O., Piel, F., Petaja, T., Praplan, A. P., Pringle, K., Rap, A., Richards, N. A. D., Riipinen, I., Rissanen, M. P., Rondo, L., Sarnela, N., Schobesberger, S., Scott, C. E., Seinfeld, J. H., Sipila, M., Steiner, G., Stozhkov, Y., Stratmann, F., Tomé, A., Virtanen, A., Vogel, A. L., Wagner, A. C., Wagner, P. E., Weingartner, E., Wimmer, D., Winkler, P. M., Ye, P., Zhang, X., Hansel, A., Dommen, J., Donahue, N. M., Worsnop, D. R., Baltensperger, U., Kulmala, M., Carslaw, K. S., and Curtius, J.: Ion-induced nucleation of pure biogenic particles, Nature, 533, 521–526, https://doi.org/10.1038/nature17953, 2016.
Kloster, S., Feichter, J., Maier-Reimer, E., Six, K. D., Stier, P., and Wetzel, P.: DMS cycle in the marine ocean-atmosphere system – a global model study, Biogeosciences, 3, 29–51, https://doi.org/10.5194/bg-3-29-2006, 2006.
Lampert, A., Altstädter, B., Bärfuss, K., Bretschneider, L., Sandgaard, J., Michaelis, J., Lobitz, L., Asmussen, M., Damm, E., Käthner, R., Krüger, T., Lüpkes, C., Nowak, S., Peuker, A., Rausch, T., Reiser, F., Scholtz, A., Sotomayor-Zakharov, D., Gaus, D., Bansmer, S., Wehner, B., and Pätzold, F.: Unmanned aerial systems for investigating the polar atmospheric boundary layer-technical challenges and examples of applications, Atmosphere-Basel, 11, 416, https://doi.org/10.3390/ATMOS11040416, 2020.
Lana, A., Bell, T. G., Simó, R., Vallina, S. M., Ballabrera-Poy, J., Kettle, A. J., Dachs, J., Bopp, L., Saltzman, E. S., Stefels, J., Johnson, J. E., and Liss, P. S.: An updated climatology of surface dimethlysulfide concentrations and emission fluxes in the global ocean, Global Biogeochem. Cycles, 25, 1–17, https://doi.org/10.1029/2010GB003850, 2011.
Lee, H., Lee, K., Lunder, C. R., Krejci, R., Aas, W., Park, J., Park, K.-T., Lee, B. Y., Yoon, Y. J., and Park, K.: Atmospheric new particle formation characteristics in the Arctic as measured at Mount Zeppelin, Svalbard, from 2016 to 2018, Atmos. Chem. Phys., 20, 13425–13441, https://doi.org/10.5194/acp-20-13425-2020, 2020.
Lenssen, N. J. L., Schmidt, G. A., Hansen, J. E., Menne, M. J., Persin, A., Ruedy, R., and Zyss, D.: Improvements in the GISTEMP Uncertainty Model, J. Geophys. Res.-Atmos., 124, 6307–6326, https://doi.org/10.1029/2018JD029522, 2019.
Lupi, A., Busetto, M., Becagli, S., Giardi, F., Lanconelli, C., Mazzola, M., Udisti, R., Hansson, H. C., Henning, T., Petkov, B., Ström, J., Krejci, R., Tunved, P., Pietro, V. A., and Vitale, V.: Multi-seasonal ultrafine aerosol particle number concentration measurements at the Gruvebadet observatory, Ny-Ålesund, Svalbard Islands, Rend. Lincei, 27, 59–71, https://doi.org/10.1007/s12210-016-0532-8, 2016.
Manninen, H. E., Nieminen, T., Asmi, E., Gagné, S., Häkkinen, S., Lehtipalo, K., Aalto, P., Vana, M., Mirme, A., Mirme, S., Hõrrak, U., Plass-Dülmer, C., Stange, G., Kiss, G., Hoffer, A., Törő, N., Moerman, M., Henzing, B., de Leeuw, G., Brinkenberg, M., Kouvarakis, G. N., Bougiatioti, A., Mihalopoulos, N., O'Dowd, C., Ceburnis, D., Arneth, A., Svenningsson, B., Swietlicki, E., Tarozzi, L., Decesari, S., Facchini, M. C., Birmili, W., Sonntag, A., Wiedensohler, A., Boulon, J., Sellegri, K., Laj, P., Gysel, M., Bukowiecki, N., Weingartner, E., Wehrle, G., Laaksonen, A., Hamed, A., Joutsensaari, J., Petäjä, T., Kerminen, V.-M., and Kulmala, M.: EUCAARI ion spectrometer measurements at 12 European sites – analysis of new particle formation events, Atmos. Chem. Phys., 10, 7907–7927, https://doi.org/10.5194/acp-10-7907-2010, 2010.
Manninen, H. E., Franchin, A., Schobesberger, S., Hirsikko, A., Hakala, J., Skromulis, A., Kangasluoma, J., Ehn, M., Junninen, H., Mirme, A., Mirme, S., Sipilä, M., Petäjä, T., Worsnop, D. R., and Kulmala, M.: Characterisation of corona-generated ions used in a Neutral cluster and Air Ion Spectrometer (NAIS), Atmos. Meas. Tech., 4, 2767–2776, https://doi.org/10.5194/amt-4-2767-2011, 2011.
Manninen, H. E., Mirme, S., Mirme, A., Petäjä, T., and Kulmala, M.: How to reliably detect molecular clusters and nucleation mode particles with Neutral cluster and Air Ion Spectrometer (NAIS), Atmos. Meas. Tech., 9, 3577–3605, https://doi.org/10.5194/amt-9-3577-2016, 2016.
Mårtensson, E. M., Nilsson, E. D., de Leeuw, G., Cohen, L. H., and Hansson, H.-C.: Laboratory simulations and parameterization of the primary marine aerosol production, J. Geophys. Res.-Atmos., 108, https://doi.org/10.1029/2002JD002263, 2003.
McGrath, M. J., Olenius, T., Ortega, I. K., Loukonen, V., Paasonen, P., Kurtén, T., Kulmala, M., and Vehkamäki, H.: Atmospheric Cluster Dynamics Code: a flexible method for solution of the birth-death equations, Atmos. Chem. Phys., 12, 2345–2355, https://doi.org/10.5194/acp-12-2345-2012, 2012.
Mikkola, J.: Slope and valley winds in the Himalayas as simulated by the Weather Research and Forecasting model, master thesis, 42 pp., http://hdl.handle.net/10138/322406 (last access: 2 March 2022), 2020.
Mirme, S. and Mirme, A.: The mathematical principles and design of the NAIS – a spectrometer for the measurement of cluster ion and nanometer aerosol size distributions, Atmos. Meas. Tech., 6, 1061–1071, https://doi.org/10.5194/amt-6-1061-2013, 2013.
Monahan, E. C., Spiel, D. E., and Davidson, K. L.: A Model of Marine Aerosol Generation Via Whitecaps and Wave Disruption, in: Oceanic Whitecaps: And Their Role in Air-Sea Exchange Processes, edited by: Monahan, E. C. and Mac Niocaill, G., Springer Netherlands, Dordrecht, 167–174, https://doi.org/10.1007/978-94-009-4668-2_16, 1986.
Moroni, B., Ritter, C., Crocchianti, S., Markowicz, K., Mazzola, M., Becagli, S., Traversi, R., Krejci, R., Tunved, P., and Cappelletti, D.: Individual Particle Characteristics, Optical Properties and Evolution of an Extreme Long-Range Transported Biomass Burning Event in the European Arctic (Ny-Ålesund, Svalbard Islands), J. Geophys. Res.-Atmos., 125, 1–17, https://doi.org/10.1029/2019JD031535, 2020.
Nightingale, P. D., Liss, P. S., and Schlosser, P.: Measurements of air-sea gas transfer during an open ocean algal bloom, Geophys. Res. Lett., 27, 2117–2120, https://doi.org/10.1029/2000GL011541, 2000.
Noble, S. and Hudson, J. G.: Cloud supersaturations and Hoppel minima, AIP Conf. Proc., 1527, 706–709, https://doi.org/10.1063/1.4803368, 2013.
Noble, S. R. and Hudson, J. G.: Effects of Continental Clouds on Surface Aitken and Accumulation Modes, J. Geophys. Res.-Atmos., 124, 5479–5502, https://doi.org/10.1029/2019JD030297, 2019.
Olenius, T., Kupiainen-Määttä, O., Ortega, I. K., Kurtén, T., and Vehkamäki, H.: Free energy barrier in the growth of sulfuric acid-ammonia and sulfuric acid-dimethylamine clusters, J. Chem. Phys., 139, 084312, https://doi.org/10.1063/1.4819024, 2013.
Oshima, N., Yukimoto, S., Deushi, M., Koshiro, T., Kawai, H., Tanaka, T. Y., and Yoshida, K.: Global and Arctic effective radiative forcing of anthropogenic gases and aerosols in MRI-ESM2.0, Prog. Earth Planet. Sci., 7, 38, https://doi.org/10.1186/s40645-020-00348-w, 2020.
Öström, E., Putian, Z., Schurgers, G., Mishurov, M., Kivekäs, N., Lihavainen, H., Ehn, M., Rissanen, M. P., Kurtén, T., Boy, M., Swietlicki, E., and Roldin, P.: Modeling the role of highly oxidized multifunctional organic molecules for the growth of new particles over the boreal forest region, Atmos. Chem. Phys., 17, 8887–8901, https://doi.org/10.5194/acp-17-8887-2017, 2017.
Park, K.-T., Jang, S., Lee, K., Yoon, Y. J., Kim, M.-S., Park, K., Cho, H.-J., Kang, J.-H., Udisti, R., Lee, B.-Y., and Shin, K.-H.: Observational evidence for the formation of DMS-derived aerosols during Arctic phytoplankton blooms, Atmos. Chem. Phys., 17, 9665–9675, https://doi.org/10.5194/acp-17-9665-2017, 2017.
Park, K. T., Yoon, Y. J., Lee, K., Tunved, P., Krejci, R., Ström, J., Jang, E., Kang, H. J., Jang, S., Park, J., Lee, B. Y., Traversi, R., Becagli, S., and Hermansen, O.: Dimethyl Sulfide-Induced Increase in Cloud Condensation Nuclei in the Arctic Atmosphere, Global Biogeochem. Cycles, 35, 1–15, https://doi.org/10.1029/2021GB006969, 2021.
Paulot, F., Jacob, D. J., Johnson, M. T., Bell, T. G., Baker, A. R., Keene, W. C., Lima, I. D., Doney, S. C., and Stock, C. A.: Global oceanic emission of ammonia: Constraints from seawater and atmospheric observations, Global Biogeochem. Cycles, 29, 1165–1178, https://doi.org/10.1002/2015GB005106, 2015.
Petäjä, T., Duplissy, E.-M., Tabakova, K., Schmale, J., Altstädter, B., Ancellet, G., Arshinov, M., Balin, Y., Baltensperger, U., Bange, J., Beamish, A., Belan, B., Berchet, A., Bossi, R., Cairns, W. R. L., Ebinghaus, R., El Haddad, I., Ferreira-Araujo, B., Franck, A., Huang, L., Hyvärinen, A., Humbert, A., Kalogridis, A.-C., Konstantinov, P., Lampert, A., MacLeod, M., Magand, O., Mahura, A., Marelle, L., Masloboev, V., Moisseev, D., Moschos, V., Neckel, N., Onishi, T., Osterwalder, S., Ovaska, A., Paasonen, P., Panchenko, M., Pankratov, F., Pernov, J. B., Platis, A., Popovicheva, O., Raut, J.-C., Riandet, A., Sachs, T., Salvatori, R., Salzano, R., Schröder, L., Schön, M., Shevchenko, V., Skov, H., Sonke, J. E., Spolaor, A., Stathopoulos, V. K., Strahlendorff, M., Thomas, J. L., Vitale, V., Vratolis, S., Barbante, C., Chabrillat, S., Dommergue, A., Eleftheriadis, K., Heilimo, J., Law, K. S., Massling, A., Noe, S. M., Paris, J.-D., Prévôt, A. S. H., Riipinen, I., Wehner, B., Xie, Z., and Lappalainen, H. K.: Overview: Integrative and Comprehensive Understanding on Polar Environments (iCUPE) – concept and initial results, Atmos. Chem. Phys., 20, 8551–8592, https://doi.org/10.5194/acp-20-8551-2020, 2020.
Pisso, I., Sollum, E., Grythe, H., Kristiansen, N. I., Cassiani, M., Eckhardt, S., Arnold, D., Morton, D., Thompson, R. L., Groot Zwaaftink, C. D., Evangeliou, N., Sodemann, H., Haimberger, L., Henne, S., Brunner, D., Burkhart, J. F., Fouilloux, A., Brioude, J., Philipp, A., Seibert, P., and Stohl, A.: The Lagrangian particle dispersion model FLEXPART version 10.4, Geosci. Model Dev., 12, 4955–4997, https://doi.org/10.5194/gmd-12-4955-2019, 2019.
Platt, S. M., Hov, Ø., Berg, T., Breivik, K., Eckhardt, S., Eleftheriadis, K., Evangeliou, N., Fiebig, M., Fisher, R., Hansen, G., Hansson, H.-C., Heintzenberg, J., Hermansen, O., Heslin-Rees, D., Holmén, K., Hudson, S., Kallenborn, R., Krejci, R., Krognes, T., Larssen, S., Lowry, D., Lund Myhre, C., Lunder, C., Nisbet, E., Nizzetto, P. B., Park, K.-T., Pedersen, C. A., Aspmo Pfaffhuber, K., Röckmann, T., Schmidbauer, N., Solberg, S., Stohl, A., Ström, J., Svendby, T., Tunved, P., Tørnkvist, K., van der Veen, C., Vratolis, S., Yoon, Y. J., Yttri, K. E., Zieger, P., Aas, W., and Tørseth, K.: Atmospheric composition in the European Arctic and 30 years of the Zeppelin Observatory, Ny-Ålesund, Atmos. Chem. Phys., 22, 3321–3369, https://doi.org/10.5194/acp-22-3321-2022, 2022.
Quinn, P. K., Coffman, D. J., Johnson, J. E., Upchurch, L. M., and Bates, T. S.: Small fraction of marine cloud condensation nuclei made up of sea spray aerosol, Nat. Geosci., 10, 674–679, https://doi.org/10.1038/ngeo3003, 2017.
Rader, F., Traversi, R., Severi, M., Becagli, S., Müller, K.-J., Nakoudi, K., and Ritter, C.: Overview of Aerosol Properties in the European Arctic in Spring 2019 Based on In Situ Measurements and Lidar Data, Atmosphere-Basel, 12, 271, https://doi.org/10.3390/atmos12020271, 2021.
Riddick, S. N., Dragosits, U., Blackall, T. D., Daunt, F., Wanless, S., and Sutton, M. A.: The global distribution of ammonia emissions from seabird colonies, Atmos. Environ., 55, 319–327, https://doi.org/10.1016/j.atmosenv.2012.02.052, 2012.
Roldin, P., Swietlicki, E., Schurgers, G., Arneth, A., Lehtinen, K. E. J., Boy, M., and Kulmala, M.: Development and evaluation of the aerosol dynamics and gas phase chemistry model ADCHEM, Atmos. Chem. Phys., 11, 5867–5896, https://doi.org/10.5194/acp-11-5867-2011, 2011.
Roldin, P., Ehn, M., Kurtén, T., Olenius, T., Rissanen, M. P., Sarnela, N., Elm, J., Rantala, P., Hao, L., Hyttinen, N., Heikkinen, L., Worsnop, D. R., Pichelstorfer, L., Xavier, C., Clusius, P., Öström, E., Petäjä, T., Kulmala, M., Vehkamäki, H., Virtanen, A., Riipinen, I., and Boy, M.: The role of highly oxygenated organic molecules in the Boreal aerosol-cloud-climate system, Nat. Commun., 10, 4370, https://doi.org/10.1038/s41467-019-12338-8, 2019.
Rosati, B., Christiansen, S., Wollesen de Jonge, R., Roldin, P., Jensen, M. M., Wang, K., Moosakutty, S. P., Thomsen, D., Salomonsen, C., Hyttinen, N., Elm, J., Feilberg, A., Glasius, M., and Bilde, M.: New Particle Formation and Growth from Dimethyl Sulfide Oxidation by Hydroxyl Radicals, ACS Earth Sp. Chem., 5, 801–811, https://doi.org/10.1021/acsearthspacechem.0c00333, 2021.
Rosenfeld, D., Andreae, M. O., Asmi, A., Chin, M., de Leeuw, G., Donovan, D. P., Kahn, R., Kinne, S., Kivekäs, N., Kulmala, M., Lau, W., Schmidt, K. S., Suni, T., Wagner, T., Wild, M., and Quaas, J.: Global observations of aerosol-cloud-precipitation-climate interactions, Rev. Geophys., 52, 750–808, https://doi.org/10.1002/2013RG000441, 2014.
Salter, M. E., Zieger, P., Acosta Navarro, J. C., Grythe, H., Kirkevåg, A., Rosati, B., Riipinen, I., and Nilsson, E. D.: An empirically derived inorganic sea spray source function incorporating sea surface temperature, Atmos. Chem. Phys., 15, 11047–11066, https://doi.org/10.5194/acp-15-11047-2015, 2015.
Saunders, S. M., Jenkin, M. E., Derwent, R. G., and Pilling, M. J.: Protocol for the development of the Master Chemical Mechanism, MCM v3 (Part A): tropospheric degradation of non-aromatic volatile organic compounds, Atmos. Chem. Phys., 3, 161–180, https://doi.org/10.5194/acp-3-161-2003, 2003.
Schemann, V. and Ebell, K.: Simulation of mixed-phase clouds with the ICON large-eddy model in the complex Arctic environment around Ny-Ålesund, Atmos. Chem. Phys., 20, 475–485, https://doi.org/10.5194/acp-20-475-2020, 2020.
Scott, C. E., Rap, A., Spracklen, D. V., Forster, P. M., Carslaw, K. S., Mann, G. W., Pringle, K. J., Kivekäs, N., Kulmala, M., Lihavainen, H., and Tunved, P.: The direct and indirect radiative effects of biogenic secondary organic aerosol, Atmos. Chem. Phys., 14, 447–470, https://doi.org/10.5194/acp-14-447-2014, 2014.
Sofiev, M., Soares, J., Prank, M., De Leeuw, G., and Kukkonen, J.: A regional-to-global model of emission and transport of sea salt particles in the atmosphere, J. Geophys. Res.-Atmos., 116, https://doi.org/10.1029/2010JD014713, 2011.
Stock, C. A., Dunne, J. P., and John, J. G.: Global-scale carbon and energy flows through the marine planktonic food web: An analysis with a coupled physical–biological model, Prog. Oceanogr., 120, 1–28, https://doi.org/10.1016/j.pocean.2013.07.001, 2014.
Stohl, A., Forster, C., Frank, A., Seibert, P., and Wotawa, G.: Technical note: The Lagrangian particle dispersion model FLEXPART version 6.2, Atmos. Chem. Phys., 5, 2461–2474, https://doi.org/10.5194/acp-5-2461-2005, 2005.
Ström, J., Engvall, A. C., Delbart, F., Krejci, R., and Treffeisen, R.: On small particles in the Arctic summer boundary layer: Observations at two different heights near Ny-Ålesund, Svalbard, Tellus B, 61, 473–482, https://doi.org/10.1111/j.1600-0889.2008.00412.x, 2009.
Traversi, R., Becagli, S., Severi, M., Caiazzo, L., Mazzola, M., Lupi, A., Fiebig, M., Hermansen, O., Krejci, R., and Unit, A. S.: Arctic haze in a climate changing world: the 2010–2020 trend (HAZECLIC) 4, in: SESS report 2020 – The State of Environmental Science in Svalbard – an annual report, Svalbard Integrated Arctic Earth Observing System, 104–117, https://doi.org/10.5281/zenodo.4293826, 2020.
Tunved, P., Ström, J., and Krejci, R.: Arctic aerosol life cycle: linking aerosol size distributions observed between 2000 and 2010 with air mass transport and precipitation at Zeppelin station, Ny-Ålesund, Svalbard, Atmos. Chem. Phys., 13, 3643–3660, https://doi.org/10.5194/acp-13-3643-2013, 2013.
Uhlig, C., Damm, E., Peeken, I., Krumpen, T., Rabe, B., Korhonen, M., and Ludwichowski, K. U.: Sea ice and water mass influence dimethylsulfide concentrations in the central arctic ocean, Front. Earth Sci., 7, 1–15, https://doi.org/10.3389/feart.2019.00179, 2019.
Wainwright, C. D., Pierce, J. R., Liggio, J., Strawbridge, K. B., Macdonald, A. M., and Leaitch, R. W.: The effect of model spatial resolution on Secondary Organic Aerosol predictions: a case study at Whistler, BC, Canada, Atmos. Chem. Phys., 12, 10911–10923, https://doi.org/10.5194/acp-12-10911-2012, 2012.
Wentworth, G. R., Murphy, J. G., Croft, B., Martin, R. V., Pierce, J. R., Côté, J.-S., Courchesne, I., Tremblay, J.-É., Gagnon, J., Thomas, J. L., Sharma, S., Toom-Sauntry, D., Chivulescu, A., Levasseur, M., and Abbatt, J. P. D.: Ammonia in the summertime Arctic marine boundary layer: sources, sinks, and implications, Atmos. Chem. Phys., 16, 1937–1953, https://doi.org/10.5194/acp-16-1937-2016, 2016.
Wollesen de Jonge, R., Elm, J., Rosati, B., Christiansen, S., Hyttinen, N., Lüdemann, D., Bilde, M., and Roldin, P.: Secondary aerosol formation from dimethyl sulfide – improved mechanistic understanding based on smog chamber experiments and modelling, Atmos. Chem. Phys., 21, 9955–9976, https://doi.org/10.5194/acp-21-9955-2021, 2021.
Wollesen de Jonge, R., Elm, J., Rosati, B., Christiansen, S., Hyttinen, N., Lüdemann, D., Bilde, M., and Roldin, P.: Secondary aerosol formation from dimethyl sulfide – improved mechanistic understanding based on smog chamber experiments and modelling, Atmos. Chem. Phys., 21, 9955–9976, https://doi.org/10.5194/acp-21-9955-2021, 2021.
Xavier, C., Rusanen, A., Zhou, P., Dean, C., Pichelstorfer, L., Roldin, P., and Boy, M.: Aerosol mass yields of selected biogenic volatile organic compounds – a theoretical study with nearly explicit gas-phase chemistry, Atmos. Chem. Phys., 19, 13741–13758, https://doi.org/10.5194/acp-19-13741-2019, 2019.
Zheng, G., Wang, Y., Aiken, A. C., Gallo, F., Jensen, M. P., Kollias, P., Kuang, C., Luke, E., Springston, S., Uin, J., Wood, R., and Wang, J.: Marine boundary layer aerosol in the eastern North Atlantic: seasonal variations and key controlling processes, Atmos. Chem. Phys., 18, 17615–17635, https://doi.org/10.5194/acp-18-17615-2018, 2018.
Ziska, F., Quack, B., Abrahamsson, K., Archer, S. D., Atlas, E., Bell, T., Butler, J. H., Carpenter, L. J., Jones, C. E., Harris, N. R. P., Hepach, H., Heumann, K. G., Hughes, C., Kuss, J., Krüger, K., Liss, P., Moore, R. M., Orlikowska, A., Raimund, S., Reeves, C. E., Reifenhäuser, W., Robinson, A. D., Schall, C., Tanhua, T., Tegtmeier, S., Turner, S., Wang, L., Wallace, D., Williams, J., Yamamoto, H., Yvon-Lewis, S., and Yokouchi, Y.: Global sea-to-air flux climatology for bromoform, dibromomethane and methyl iodide, Atmos. Chem. Phys., 13, 8915–8934, https://doi.org/10.5194/acp-13-8915-2013, 2013.