the Creative Commons Attribution 4.0 License.
the Creative Commons Attribution 4.0 License.
 | 06 Jul 2021
Impact of aerosol–radiation interaction on new particle formation
Gang Zhao
Yishu Zhu
Zhijun Wu
Taomou Zong
Jingchuan Chen
Tianyi Tan
Haichao Wang
Xin Fang
Keding Lu
Chunsheng Zhao
New particle formation (NPF) is thought to contribute half of the global cloud condensation nuclei. A better understanding of the NPF at different altitudes can help assess the impact of NPF on cloud formation and corresponding physical properties. However, NPF is not sufficiently understood in the upper mixing layer because previous studies mainly focused on ground-level measurements. In this study, the developments of aerosol size distribution at different altitudes are characterized based on the field measurement conducted in January 2019 in Beijing, China. We find that the partition of nucleation-mode particles in the upper mixing layer is larger than that at the ground, which implies that the nucleation processing is more likely to happen in the upper mixing layer than that at the ground. Results of the radiative transfer model show that the photolysis rates of the nitrogen dioxide and ozone increase with altitude within the mixing layer, which leads to a higher concentration of sulfuric acid in the upper mixing layer than that at the ground. Therefore, the nucleation processing in the upper mixing layer should be stronger than that at the ground, which is consistent with our measurement results. Our study emphasizes the influence of aerosol–radiation interaction on the NPF. These results have the potential to improve our understanding of the source of cloud condensation nuclei on a global scale due to the impacts of aerosol–radiation interaction.
- Article
(743 KB) - Full-text XML
-
Supplement
(1037 KB) - BibTeX
- EndNote


Atmospheric particles influence the earth's energy balance by directly interacting with the solar radiation and indirectly being activated as cloud condensation nucleation (CCN) (Ghan and Schwartz, 2007). New particle formation (NPF) in the atmosphere and the coagulation herein may enable particles to grow larger than 60 nm, at which point aerosols can exert radiative effects on the solar radiation and act as CCN (Williamson et al., 2019; Shang et al., 2021). Some researchers find that the NPF is responsible for around half of the global CCN (Merikanto et al., 2009; Du et al., 2017; Kulmala et al., 2014). However, there is still considerable uncertainty about the magnitude that the NPF attributes to CCN (Kulmala et al., 2004; Merikanto et al., 2009; Zhang et al., 2012). A better understanding of the NPF at different altitudes can help assess the impact of NPF on cloud formation and corresponding radiative effects. However, the underlying mechanism of NPF at different altitudes has not been well studied yet.
Nucleation requires sufficient amounts of precursor gases (Kulmala et al., 2004). Sulfuric acid (H2SO4) is thought to be the most important precursor for NPF events (Weber et al., 1997, 1996, 2001; Stolzenburg et al., 2005; Kulmala et al., 2013). Knowledge of the profile of H2SO4 number concentrations ([H2SO4]) can help understand the NPF mechanism, while the profile of the sulfuric acid is not well known due to the limitation of measurements.
The content of H2SO4 in a pseudo-steady state can be estimated by the number concentration of hydroxyl radical [OH], sulfur dioxide [SO2], and aerosol condensation sink (CS) (Kulmala et al., 2001; Shang et al., 2021). The [OH] is related to solar ultraviolet radiation (Rohrer and Berresheim, 2006). Previous studies found that the profile of photolysis radiation varies significantly for different aerosol vertical distributions and that the ultraviolet radiation is highly related to the aerosol optical properties (Tao et al., 2014). Therefore, the ambient aerosol–radiation interaction may exert a significant influence on the NPF by determining the [OH] vertical profile. However, the influence of ultraviolet radiation on the NPF is not well understood.
In the past few decades, extensive measurements have been conducted at ground level to characterize the ambient aerosol particle number size distribution (PNSD) and then NPF events (Bullard et al., 2017; Du et al., 2018; Peng et al., 2017; Malinina et al., 2018). Some studies suggest that the nucleation of fine particles can be altitude-dependent (Shang et al., 2018). High concentrations of nucleation-mode particles were found in the upper parts of the mixing layer (Schobesberger et al., 2013). It is observed that the particle growth rate in the upper mixing layer is larger than that on the ground (Du et al., 2017). Measurements from the tethered balloon also show that a large partition of 11–16 nm particles was generated from the top region of the mixing layer and was then rapidly mixed down throughout the mixing layer (Chen et al., 2018; Platis et al., 2016). Aircraft measurements (Wang et al., 2016; Zhao et al., 2020) also found that the free troposphere favors the NPF. Most of these studies, to the best of our best knowledge, focus on the concentration of precursor gases but not on the aerosol–radiation interaction.
In this study, we first demonstrate that the NPF is more likely to happen in the upper mixing layer than in the near-ground surface layer based on field measurement of the aerosol PNSD profiles. We find that the tendency of NPF is well related to ultraviolet radiation, implying that the aerosol–radiation interaction is an important factor that influences the NPF.
2.1 Field measurement
The field measurements were carried from 17 to 19 January 2019 at the Institute of Atmospheric Physics (IAP), Chinese Academy of Sciences (39∘18′ N, 116∘22′ E), an urban site in Beijing, China. Details of the measurement site can be found in H. Wang et al. (2018), Chen et al. (2015), and Q. Wang et al. (2018). Vertical measurements were conducted from the tower-based platform, with a maximum height of 350 m, on the IAP campus. All of the instruments were installed on a moving cabin of the tower, which moves up and down at altitudes between 0 and 240 m. The cabin moved around 10 m every minute in altitude. Aerosol PNSD in the size range between 10 and 700 nm was measured using a scanning mobility particle size (SMPS; TSI Inc. 3010) every 5 min. Aerosol scattering coefficient (σsca) at the wavelengths of 450, 525, and 635 nm were measured by an Aurora 3000 nephelometer (Müller et al., 2011) with a time resolution of 1 min. The nitrogen dioxide (NO2) was measured every minute based on its absorbance at 405 nm with a low-power lightweight instrument (model 405 nm, 2B Technology, USA). The nitrogen monoxide (NO) was measured by adding an excess of ozone with another power lightweight instrument (model 106-L, 2B Technology, USA) with a time resolution of 1 min. The wind speed, wind direction, ambient relative humidity, and temperature were measured by a small auto meteorology station. This instrument can record the atmosphere pressure, which was used to retrieve the altitude information. All of the data were averaged with a time resolution of 5 min.
2.2 Lognormal fit of PSND
For each of the measured PSNDs, it is fitted by three lognormal distribution modes by
where Ni, σg,i, and Dpi are the number concentration, geometric standard deviation, and geometric mean diameter of mode i, respectively. Two examples of fitting the measured PNSD are shown in Fig. S1. The three modes with geometric diameter ranges of 10–25, 25–100, and 100–700 nm correspond to the nucleation mode, Aitken mode, and accumulation mode, respectively. The nucleation particles mainly result from the nucleation process, and the Aitken-mode particles are from primary sources, such as traffic sources (Shang et al., 2018). The accumulation-mode particles are correlated with secondary formation, which mainly represents the ambient pollution conditions (Wu et al., 2008).
2.3 Mie model
The Mie scattering model (Bohren and Huffman, 2007) is used to estimate the aerosol optical properties. When running the Mie model, aerosol PNSD, aerosol black carbon mass size distribution, and refractive index are essential. The measured mean black carbon mass size distribution from Zhao et al. (2019) is adopted in this study, which is measured around 3 km away from this site. The refractive index of the non-black carbon and black carbon aerosol components is 1.64+0i, which is the measured mean aerosol refractive index measured at Beijing (paper in preparation), and 1.96+0.66i (Zhao et al., 2017), respectively. The aerosol hygroscopic growth is not considered here because the ambient relative humidity during the measurement was all the way lower than 30 % as shown in Fig. 1b. With the measured different aerosol PNSD and above-mentioned information, we can calculate the corresponding aerosol optical properties, which contain the aerosol σsca, aerosol single scattering albedo (SSA), and asymmetry factor (g).
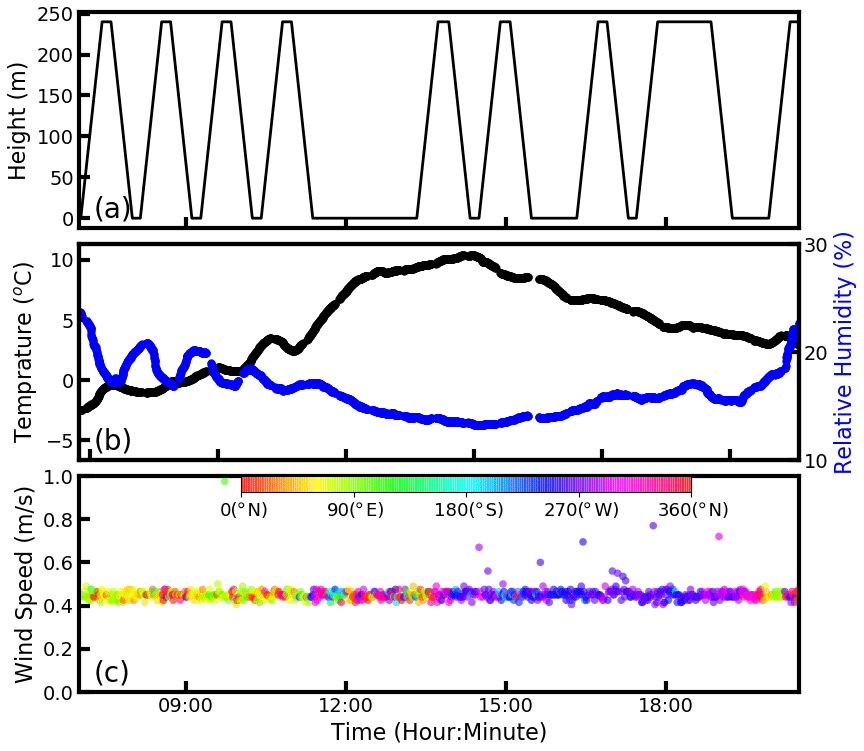
Figure 1Time series of the (a) measurement altitude, (b) temperature (black line) and relative humidity (blue line), and (c) wind speed and wind direction.
2.4 Tropospheric Ultraviolet-Visible radiation model
The Tropospheric Ultraviolet-Visible radiation (TUV) model, developed by Madronich and Flocke (1997), is an advanced transfer model with an eight-stream, discrete ordinate solver. This model can calculate the spectral irradiance, spectral actinic flux, and photo-dissociation frequencies in the wavelength range between 121 and 735 nm. In this study, the photolysis frequency of the nitrogen dioxide (J(NO2)) and ozone (J(O1D)) was used for further study. Inputs of the TUV model are the aerosol optical depth and single scattering albedo (Tao et al., 2014). The cloud aerosol optical depth is set to be zero in this study. The output of the TUV model includes the profiles of J(NO2) and J(O1D).
In the TUV model, the inputs of the aerosol optical properties are the aerosol optical depths at the wavelength of 550 nm and the column-averaged SSA. The profiles of the σsca are calculated assuming that the aerosol σsca is proportional to those measured by Elterman et al. (1968). The g values are set to be fixed as 0.61. Some changes were made in the source code of the TUV model. In our model, the author-defined aerosol σsca profiles, SSA profiles, and g profiles can be used as the input of the model. Therefore, the J(NO2) and J(O1D) profiles with different aerosol optical profiles (including aerosol σsca, SSA, and g) can be estimated.
2.5 Influence of photolysis ratio on the [H2SO4]
The content of H2SO4 in a pseudo-steady state can be calculated (Kulmala et al., 2001) with
where [OH] and [SO2] are the number concentrations of hydroxyl radical and sulfur dioxide, respectively; CS is the condensation sink, which quantifies the limitation of NPF from existing particles. It is calculated as (Maso et al., 2005)
where Ni is the particle concentration in size Dp,i. The D is the diffusion coefficient of the H2SO4, and the βm is the transition regime correction factor. Based on the work of Ehhalt and Rohrer (2000), the [OH] can be calculated by
with α, β, a, b, c, and d equaling 0.83, 0.19, 4.1×10⁹, 140, 0.41, and 1.7, respectively.
3.1 Aerosol PNSD at different altitudes and times
The measured aerosol PNSD profiles in the time range between 07:00 and 18:50 LT on 18 January were used for analysis, which contained eight different upward and downward movements of the cabin, respectively. Figure 1a gives detailed time–altitude information of each measurement. All of the time mentioned in the research corresponds to the local time zone.
On 18 January, the measured ambient temperature and relative humidity ranges were −3–10 ∘C and 13 %–24 %, respectively, which implied that the ambient air in the winter of Beijing is dry and cold. Aerosol hygroscopic growth was thus not considered in this study. The wind speeds during the measurement were lower than 1 m s−1, and thus the measurement results of aerosol microphysical properties were hardly influenced by transport.
During the measurement, the σsca varied between 0 and 400 M m−1. It ranged between 100 and 200 M m−1 on 18 January. We compared the measured σsca using the nephelometer and calculated σsca using the Mie scattering model and measured PNSD. The measured and calculated σsca show good consistency, with slopevalu es of 1.00, 0.95, and 0.89 for wavelengths of 450, 525, and 635 nm, respectively, as shown in Fig. S2. The calculated σsca values are slightly smaller than that of the measured ones because the measured aerosol PNSD only covers the aerosol diameter between 10 and 700 nm, while the measured σsca represents the optical properties of the whole population. The squares of the correlation coefficients are 0.97, 0.97, and 0.97 for the above-mentioned different wavelengths. Our results demonstrate that the measured ambient aerosol PNSDs are reliable for further analysis.
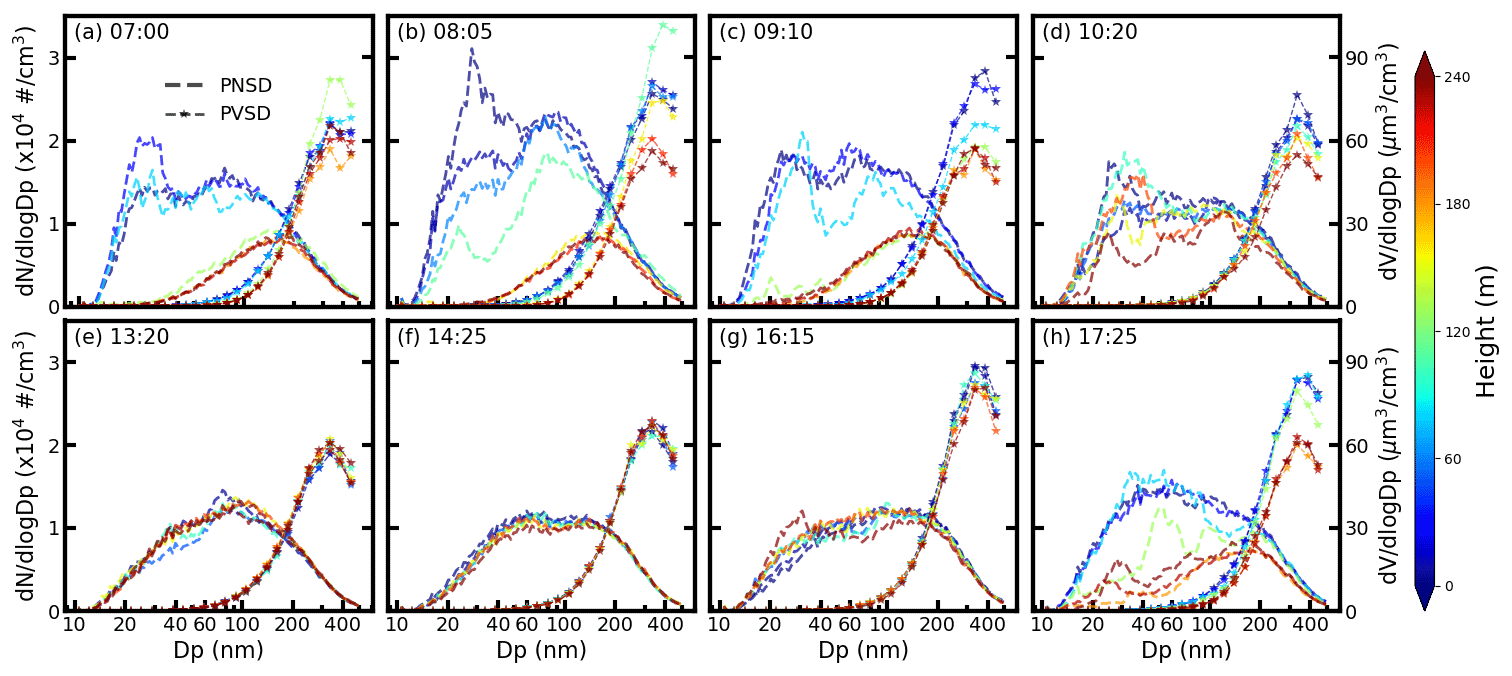
Figure 2The measured aerosol PSND (dashed line) and the PVSD (dashed line with star) at (a) 07:00, (b) 08:05, (c) 09:50, (d) 10:20, (e) 13:20, (f) 14:25, (g) 16:15, and (h) 17:25. The filled colors represent the corresponding measurement altitude above the ground.
The measured aerosol PNSD varied significantly for different altitudes and times. PNSD profiles in Fig. 2 corresponded to these periods when the cabin moved upward. The corresponding downward PNSD profiles are shown in Fig. S2. In the early morning, the PNSD on the ground surface is substantially different for different altitudes. Particle number concentration on the ground surface can reach 1.5×104 cm−3, and the number concentrations peaked at less than 100 nm. It was only 8×103 cm−3, with a peaking aerosol diameter at around 200 nm at a higher altitude of around 200 m. The solar radiation in the morning was very weak; therefore, the turbulence mixing of the aerosol among different altitudes was very weak. The initial emission from the ground surface cannot be mixed up to higher locations, and thus the aerosol number concentrations at the surface were larger than that at a higher level as shown in Fig. 2a.
With the increment of solar radiation and ambient temperature, the turbulence mixing of ambient particles became stronger. The aerosol PNSD at the surface decreased with time because the near-ground particles were mixed up to a higher location as shown in Fig. 2b and c. However, the aerosol PNSD at higher altitude increased with time due to the upcoming mixed aerosol particles from lower altitude. Therefore, the difference between the aerosol PNSD at different altitudes became smaller with the development of the mixing layer as shown in Fig. 2b, c, and d. These particles were still not well mixed in the range between 0 and 240 m until 10:20.
In the afternoon, the mixing layer was well mixed with the increment of solar radiation and ambient temperature. The aerosol PNSD and PVSD were almost uniformly distributed as shown in Fig. 2e and f. However, the turbulence was relatively weak after 15:00 as the measured PNSD and PVSD on the ground surface were slightly larger than that of a higher place. After 16:00, the turbulence was weaker because a larger difference between the PNSD at the ground surface and the higher level existed. The ambient particles were hardly mixed after the sunset. The measured aerosol PNSD profiles showed almost the same properties as that in the morning, with more aerosol particles located on the ground surface from emissions.
Overall, the measured PNSD profiles were highly related to the intensity of turbulence. When the turbulence was weak, the PNSD at the surface was different from that of upper levels because the initially emitted particles cannot be mixed up to a higher location. The PNSD tended to be uniformly distributed when the turbulence within the mixing layer was strong.
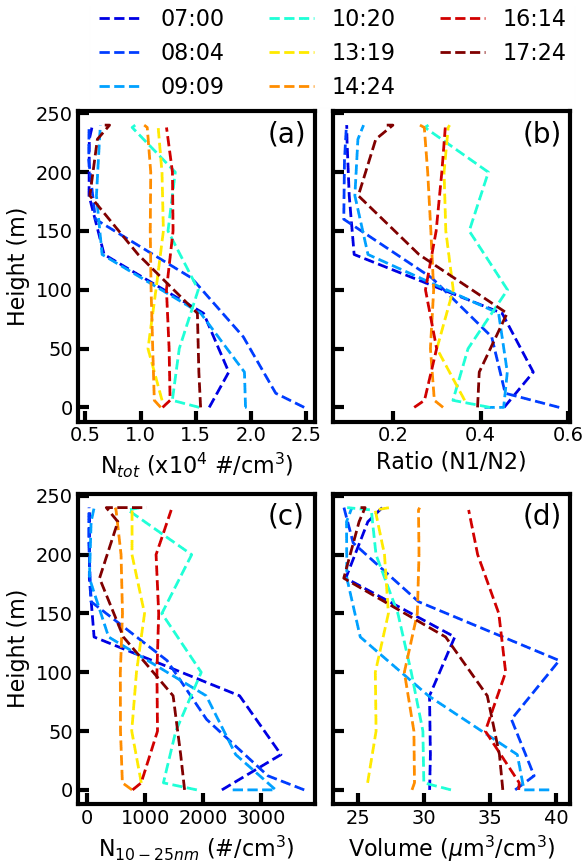
Figure 3The measured (a) aerosol number concentrations, (b) number ratio of the nucleation-mode aerosol number concentrations to Aitken-mode aerosol number concentrations, (c) aerosol number concentrations for 10–25 nm, and (d) measured aerosol volume concentrations at different altitudes. The filled colors of different lines denote the different measurement time.
3.2 Nucleation process in the upper mixing layer
We calculated aerosol total number concentration for each measured PNSD (Ntot), and the profiles of Ntot are shown in Fig. 3a. All of the profiles in Fig. 3 corresponded to these cases when the cabin is moving up. The Ntot profiles varied significantly with the development of the mixing layer. In the morning, the Ntot in the surface (larger than 2×104 cm−3) was larger than that at a higher level (lower than 1×104 cm−3) because the turbulence is so weak that the initially emitted particles on the surface cannot be transported to the upper level. In the afternoon around 14:00 and 16:00, the aerosol was well mixed in the mixing layer and Ntot was almost uniform, with around 1.2×10⁴ per cubic centimeter. Afterward, the turbulence was weaker than that in the early afternoon, and again the emitted aerosols cannot reach the higher level. The profile of Ntot in the morning was similar to that in the late afternoon and night.
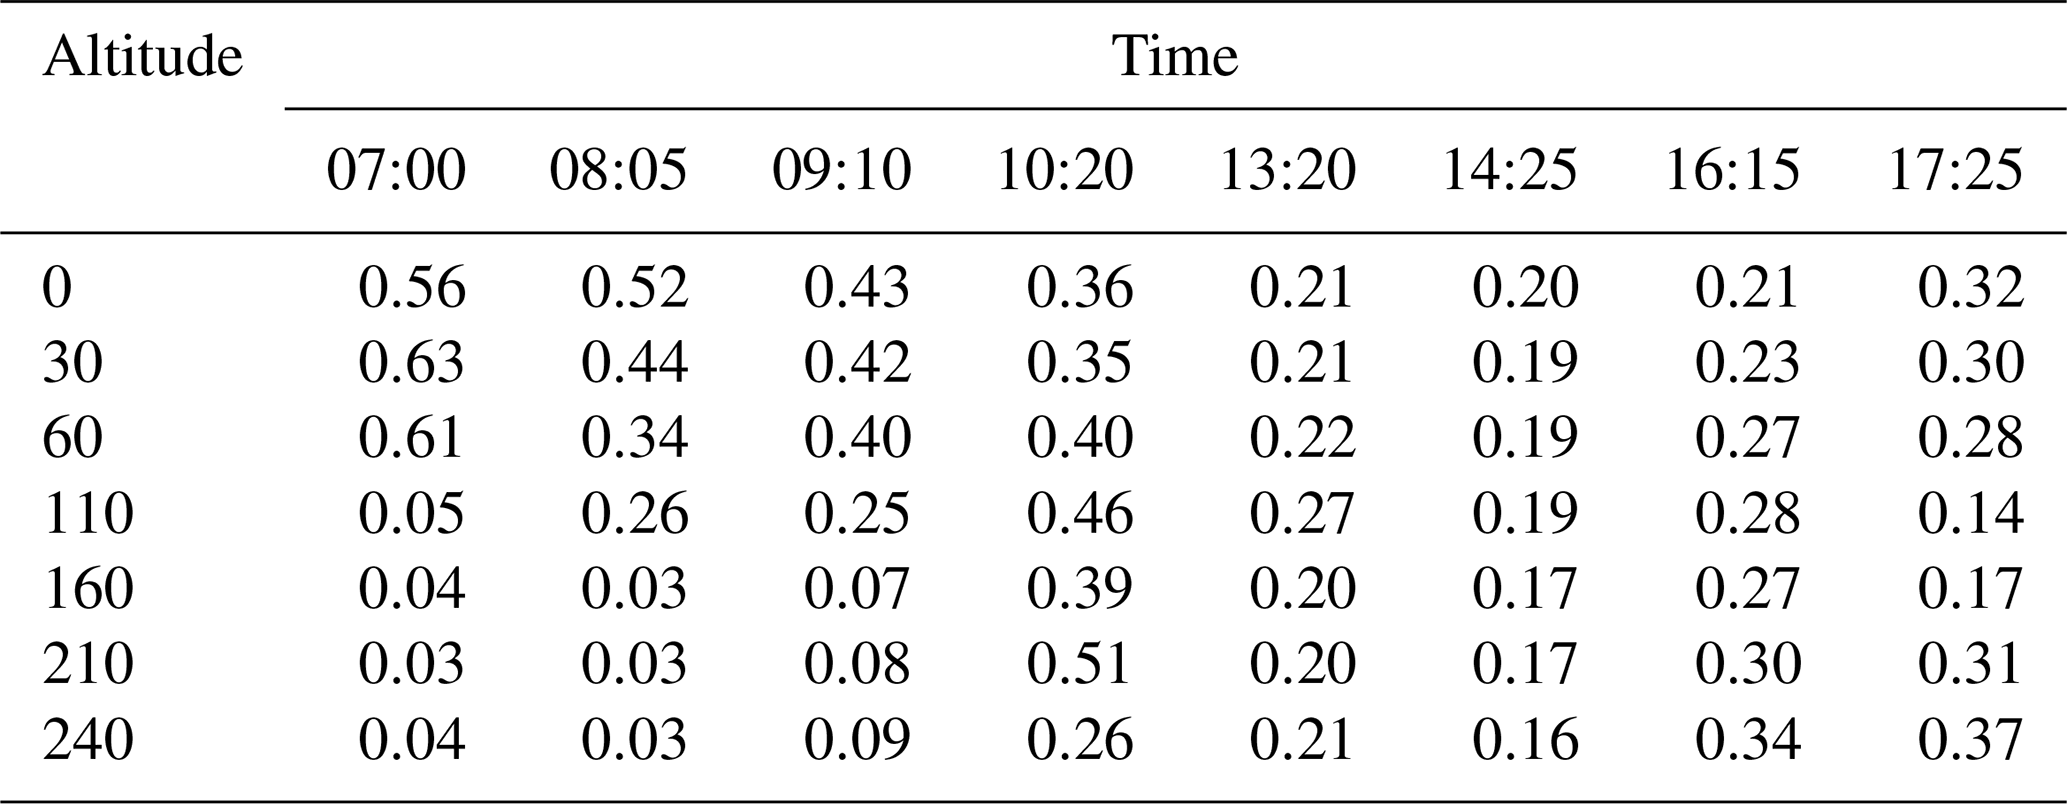
The number ratio profiles of nucleation mode to Aitken mode () for different times are shown in Fig. 3b and summarized in Table 1. In the morning of 07:00, the ratio decreased from around 0.6 to 0.04 when the cabin moved up from 0 to 240 m. The ratio on the ground surface decreased over time because the temperature and turbulence increased when it came to 08:00–10:00 in the morning. However, the turbulence was not strong enough to mix all of the particles to upper levels to 240 nm. The ratio still decreased with altitude. In the afternoon, the mixing layer developed well, and the ratios between 13:20 and 14:25 were almost uniformly distributed at different altitudes. However, we found that the ratio increased with altitude from 0.21 to 0.34 when it came to 16:15, which implied that more nucleation-mode particles were formed in the upper level in the mixing layer. The increment of the ratio was hardly influenced by transport because the wind speed during the measurement was all the time lower than 1 m s−1 as shown in Fig. 1b.
To better configure the variations of PNSD, we calculated the aerosol number concentrations with the diameter between 10 and 25 nm (N10−25 nm). The N10−25 nm profiles in Fig. 3c show almost the same trends with the number ratio of N1 to N2. In the morning and late afternoon, the N10−25 nm decreased with the altitude. The N10−25 nm in the early afternoon were uniformly distributed due to the strong mixing in the mixing layer. When it came to 16:15, the N10−25 nm at different altitudes was larger than that in the early afternoon. Most importantly, N10−25 nm increases with altitude. The aerosol total volume at 16:15 does not increase with altitude because the nucleation-produced particles are so small that they contribute negligibly to the aerosol total volume.
Based on the discussion above, we found that the total aerosol number concentrations increased slightly with altitude at 16:15. The number ratio of N1 to N2 and the N10−25 nm increased with altitude. The total volumes of the aerosol particles were almost the same at different altitudes. The variation of PNSD was hardly influenced by transport. Therefore, we concluded that the nucleation process was more likely to happen in the upper level of the mixing layer than the ground surface. This phenomenon was not observed in the early afternoon because the turbulence in the early afternoon is so strong that the aerosol particles are well mixed in the mixing layer.
Many previous studies have reported the NPF events in the upper mixing layer. The study in Platis et al. (2016) reported that the NPF originated at elevated altitude and then was mixed down to the ground in Germany. The higher nucleation-mode particle number concentrations were observed in the top region of the mixing layer and were then rapidly mixed throughout the mixing layer in South America (Chen et al., 2018). Qi et al. (2019) also found the NPF at the top of the mixing layer based on tethered airship measurements in eastern China. The NPF events were also observed at different altitudes in the North China Plain (Zhu et al., 2019).

Figure 4The measured (a) NOx and (b) CS at different altitudes. The filled colors of different lines denote the different measurement times.
3.3 Influence of aerosol–radiation interaction on NPF
Based on Eq. (2), the nucleation rate mainly depends on [OH], [SO2], and CS. The [SO2] is not available at this measurement. However, we measured the [NOx], which is the sum of NO and NO2. Both the [NOx] and [SO2] were mainly from the ground emission. The [SO2] tends to have a longer lifetime than that of [NOx] (Steinfeld, 1998). Thus, the [SO2] tends to be more uniformly distributed within the boundary layer than [NOx] when the turbulence is strong. The [NOx] in the afternoon is almost uniformly distributed as shown in Fig. 4a. Thus, the [SO2] should be uniformly distributed in the afternoon within the mixing layer. The CS profiles, in Fig. 4b, were almost uniformly distributed in the afternoon. Therefore, the [OH] is the only main factor that may result in different characteristics of NPF at different altitudes. From Eq. (4), the vertical distribution of J(O1D) and J(NO2) had a significant influence on [OH] and further influences the NPF. However, the J(O1D) and J(NO2) were not measured. The TUV model was employed to estimate the J(O1D) and J(NO2) for different aerosol profiles.
The input of the TUV needs the aerosol optical properties in the altitude range between 0 and 20 km. The parameterization of aerosol number concentration profiles by Liu et al. (2009) with aircraft measurement in Beijing is used in this study. Liu et al. (2009) found that number concentration constant within the mixing layer, linearly decreasing within the transition layer and exponentially decreasing above the transition layer when the particles within the boundary are well mixed. The normalized aerosol PNSD (PNSD divided by total aerosol number concentration) was assumed to be the same at different altitudes. The BC to total aerosol mass concentration ratio was also assumed to be the same at different altitudes (Ferrero et al., 2011). The σsca, SSA, and g profiles can be calculated by Mie theory under these assumptions (Zhao et al., 2017, 2018).
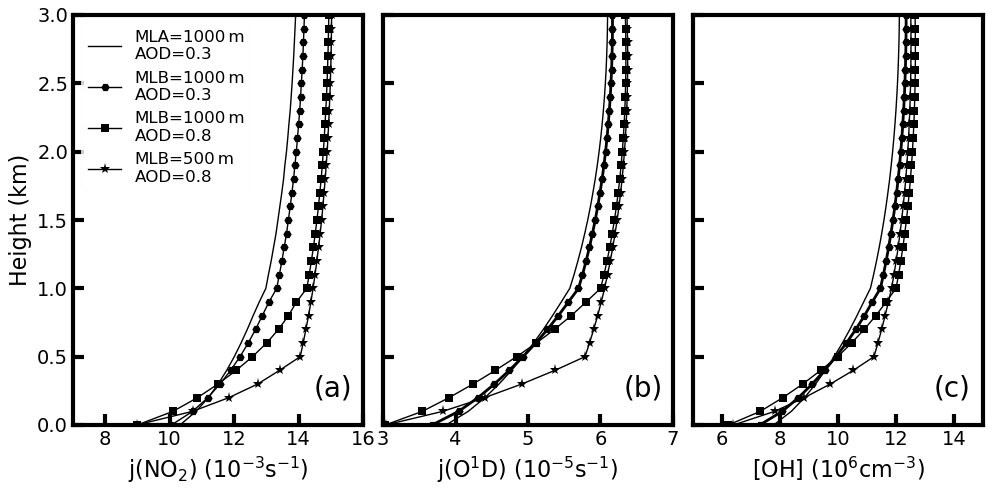
Figure 5The estimated (a) j(NO2), (b) j(O1D), and (c) OH concentrations for different aerosol profiles. The (1) solid line, (2) solid line marked with hexagons, (3) solid line marked with squares, and (4) solid line marked with stars represent the aerosol distribution of B1, B2, B3, and B4, respectively.
The lines with squares in Fig. 5a and b provide the calculated photolysis rates of J(O1D) and J(NO2) with a mixing layer altitude of 1000 m. Results show that both the J(O1D) and J(NO2) increase with altitude within the mixing layer. The J(O1D) increases from to s−1, and J(NO2) increases from to s−1 in the mixing layer. The corresponding [OH] increased from 6.2×10⁶ to 11.9×106 cm−3 based on Eq. (4). Thus, the [OH] at the top of the mixing layer is 2 times that on the ground surface due to the variation in photolysis rate. Our estimated [OH] at the surface is consistent with the previously estimated relationships between the [OH] and J(O1D) (Rohrer and Berresheim, 2006).
Table 2Details of the aerosol optical profiles and estimated photolysis values.
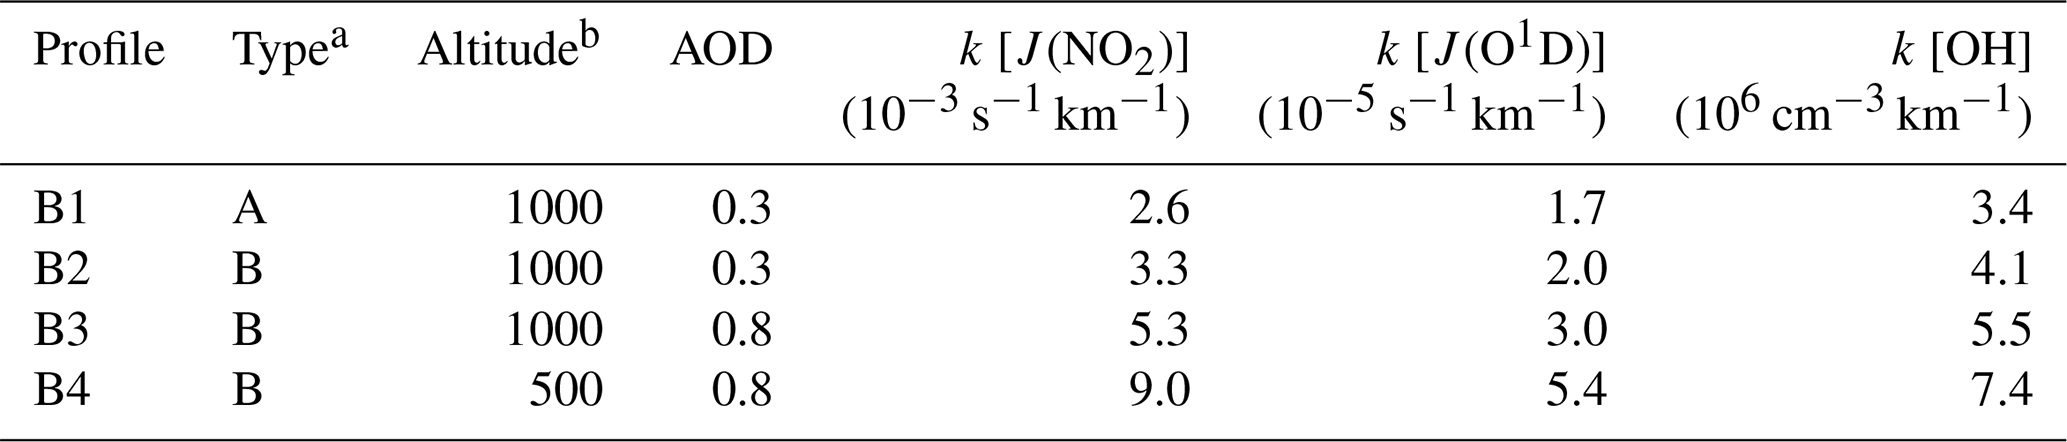
a Boundary layer type. b Boundary layer altitude.
Overall, the aerosol profiles tend to be uniformly distributed within the mixing layer due to the strong turbulence in the afternoon. The corresponding estimated J(O1D) and J(NO2) values increase with altitude, which leads to higher [OH] at the top of the mixing layer than that at the ground. Therefore, the [H2SO4] should increase with altitude based on Eq. (2). There should be more nucleation processing at the top of the mixing layer than that at the ground, which is consistent with our field measurement.
3.4 Impact of mixing layer development on the photolysis rates
For a better understanding of the aerosol–radiation interaction on NPF, we estimated the photolysis rates under different aerosol vertical profiles. Based on the work of Liu et al. (2009), two typical types of aerosol profiles exist under different mixing layers as shown in Fig. S4. For the first type of mixing layer, aerosols were not well mixed within the mixing layer, and the aerosol number concentrations decrease with altitude exponentially (type A). Another type of mixing layer has aerosol number concentration constant in the mixing layer and then decreasing with altitude above the boundary (type B). For type B, we estimated the corresponding photolysis rate for different mixing layer heights between 500 and 1000 m, which covers the mean mixing layer altitude in the North China Plain (Zhu et al., 2018). The different aerosol optical depth (AOD), which ranges between 0.3 and 2, is used for different pollution conditions.
Four different aerosol profiles are used in this study. Details of the four different aerosol profiles are summarized in Table 2. The first one corresponds to aerosol mixing layer type A, with an exact boundary altitude of 1000 m and AOD of 0.3 (B1). The second aerosol profile has the same boundary altitude of 1000 m and AOD of 0.3, but the mixing layer type is changed to B (B2). The third aerosol profile also corresponds to mixing layer type B and a mixing layer altitude of 1000 m, but the AOD is 0.8 (B3). The last one has a mixing layer altitude of 500 m, with an AOD of 0.8 and a mixing layer type of B (B4).
The J(O1D) and J(NO2) profiles under the above-mentioned aerosol profiles are estimated and shown in Fig. 5a and b. For each type, both the J(O1D) and J(NO2) increase with altitude. The increased ratios of the J(O1D) with altitude () are , , , and s−1 km−1 for the aerosol profile of B1, B2, B3, and B4, respectively. The corresponding increase ratios of the J(NO2) with altitude () are , , , and s−1 km−1 for B1, B2, B3, and B4, respectively. The increase ratios of [OH] were estimated to be 3.4×10⁶, 4.1×10⁶, 5.5×10⁶, and 7.4×106 cm−3 km−1 for B1, B2, B3, and B4, respectively (Table 2).
These four profiles represent the typical ambient aerosol profiles in the early morning, late morning, early afternoon, and late afternoon, respectively. In the early morning, the turbulence in the mixing layer is weak and the aerosol within the mixing layer is not well mixed (B1). In the late morning, the aerosol in the boundary is well mixed and uniformly distributed due to the increasing turbulence (B2). The early afternoon (B3) should have higher AOD when compared with that in the late morning due to the formation of the secondary aerosol. However, the mixing layer altitude decreased in the late afternoon (B4) because the turbulence within the mixing layer weakened compared with B3. The ambient aerosol profiles tend to change from B1 to B4 from early morning to late afternoon. The corresponding and increased with the development of the mixing layer. In the late afternoon, the differences of the photolysis rate at the top of the mixing layer and ground are the largest. Furthermore, the turbulence in the mixing layer is weakened, and the nucleation-formed particles cannot be mixed down to the ground. Therefore, one is more likely to observe more nucleation-mode particles at the top of the mixing layer than at the ground in the late afternoon, which is consistent with our measurement.
In this study, we characterized the aerosol PNSD at different times and different altitudes based on field measurements at an urban site in Beijing, China. Our measurements show that the aerosol size distribution profiles varied significantly with the development of the mixing layer.
In the morning, the turbulence in the boundary was weak, and the initially emitted particles cannot be mixed to a higher layer. The corresponding aerosol PNSD at the surface was larger than that at higher locations. At noon, the particles within the boundary were well mixed and tend to be uniformly distributed at different altitudes. In the late afternoon, we found more nucleation-mode particles at a higher altitude than that at the ground. The larger partitions of nucleation-mode particles do not result from transformation. We concluded that the nucleation processing in the upper mixing layer was more likely to happen than that at the ground.
The TUV model was employed to estimate the profiles of photolysis rates for different aerosol profiles. Results showed that both the J(O1D) and J(NO2) values increased with altitude, which led to higher [OH] at the top of the mixing layer than that at the ground. The corresponding [H2SO4] should increase with altitude based on Eq. (2), when the aerosol was well mixed and uniform in the mixing layer. Therefore, more nucleation processing at the top of the mixing layer may happen than that at the ground, which is consistent with our field measurement.
We also estimate the corresponding photolysis rate profile under different boundary structures. The increasing ratio of the photolysis rate with altitude increases with the development of the mixing layer from early morning to late afternoon. In the late afternoon, the difference of the photolysis rate at the upper mixing layer and that at the ground are the largest. At the same time, the turbulence is not so strong that the nucleation-mode particles formed in the upper mixing layer are not able to mix down to the ground. Therefore, it is a favor to observe a higher nucleation-mode particle concentration at the upper mixing layer than that at the ground in the afternoon. Our study reveals that the vertical distribution of ambient aerosols would first influence the vertical profile of the photolysis rate. Then the NPF for different altitudes is tuned due to the different photolysis rates.
The data are available upon request to the corresponding author.
The supplement related to this article is available online at: https://doi.org/10.5194/acp-21-9995-2021-supplement.
GZ and YZ did the analysis and wrote the manuscript. MH, CZ, ZW, XF, and GZ discussed the results. YZ, JC, TZ, TT, KL, and HW conducted the measurements.
The authors declare that they have no conflict of interest.
Publisher's note: Copernicus Publications remains neutral with regard to jurisdictional claims in published maps and institutional affiliations.
This research has been supported by the National Natural Science Foundation of China (grant no. 91844301) and the National Key Research and Development Program of China (grant no. 2016YFC0202000, tasks 3 and 5).
This paper was edited by Aijun Ding and reviewed by two anonymous referees.
Bohren, C. F. and Huffman, D. R.: Absorption and Scattering by a Sphere, in: Absorption and Scattering of Light by Small Particles, Wiley-VCH Verlag GmbH, 82–129, https://doi.org/10.1002/9783527618156, 2007.
Bullard, R. L., Singh, A., Anderson, S. M., Lehmann, C. M. B., and Stanier, C. O.: 10-Month characterization of the aerosol number size distribution and related air quality and meteorology at the Bondville, IL Midwestern background site, Atmos. Environ., 154, 348–361, https://doi.org/10.1016/j.atmosenv.2016.12.055, 2017.
Chen, C., Sun, Y. L., Xu, W. Q., Du, W., Zhou, L. B., Han, T. T., Wang, Q. Q., Fu, P. Q., Wang, Z. F., Gao, Z. Q., Zhang, Q., and Worsnop, D. R.: Characteristics and sources of submicron aerosols above the urban canopy (260 m) in Beijing, China, during the 2014 APEC summit, Atmos. Chem. Phys., 15, 12879–12895, https://doi.org/10.5194/acp-15-12879-2015, 2015.
Chen, H., Hodshire, A. L., Ortega, J., Greenberg, J., McMurry, P. H., Carlton, A. G., Pierce, J. R., Hanson, D. R., and Smith, J. N.: Vertically resolved concentration and liquid water content of atmospheric nanoparticles at the US DOE Southern Great Plains site, Atmos. Chem. Phys., 18, 311–326, https://doi.org/10.5194/acp-18-311-2018, 2018.
Du, P., Gui, H., Zhang, J., Liu, J., Yu, T., Wang, J., Cheng, Y., and Shi, Z.: Number size distribution of atmospheric particles in a suburban Beijing in the summer and winter of 2015, Atmos. Environ., 186, 32–44, https://doi.org/10.1016/j.atmosenv.2018.05.023, 2018.
Du, W., Zhao, J., Wang, Y., Zhang, Y., Wang, Q., Xu, W., Chen, C., Han, T., Zhang, F., Li, Z., Fu, P., Li, J., Wang, Z., and Sun, Y.: Simultaneous measurements of particle number size distributions at ground level and 260 m on a meteorological tower in urban Beijing, China, Atmos. Chem. Phys., 17, 6797–6811, https://doi.org/10.5194/acp-17-6797-2017, 2017.
Ehhalt, D. H. and Rohrer, F.: Dependence of the OH concentration on solar UV, J. Geophys.Res.-Atmos., 105, 3565–3571, https://doi.org/10.1029/1999JD901070, 2000.
Elterman, L., Wexler, R., and Chang, D.: COMPARISON OF AEROSOL MEASUREMENTS OVER NEW MEXICO WITH ATMOSPHERIC FEATURES, J. Opt. Soc. Am., 58, 741–746, 1968.
Ferrero, L., Mocnik, G., Ferrini, B. S., Perrone, M. G., Sangiorgi, G., and Bolzacchini, E.: Vertical profiles of aerosol absorption coefficient from micro-Aethalometer data and Mie calculation over Milan, Sci. Total Environ., 409, 2824–2837, 2011.
Ghan, S. J. and Schwartz, S. E.: Aerosol Properties and Processes: A Path from Field and Laboratory Measurements to Global Climate Models, B. Am. Meteorol. Soc., 88, 1059–1084, https://doi.org/10.1175/bams-88-7-1059, 2007.
Kulmala, M., Maso, M. D., Mäkelä, J. M., Pirjola, L., Väkevä, M., Aalto, P., Miikkulainen, P., Hämeri, K., and O'dowd, C. D.: On the formation, growth and composition of nucleation mode particles, Tellus B, 53, 479–490, 10.3402/tellusb.v53i4.16622, 2001.
Kulmala, M., Vehkamaki, H., Petaja, T., Dal Maso, M., Lauri, A., Kerminen, V. M., Birmili, W., and McMurry, P. H.: Formation and growth rates of ultrafine atmospheric particles: a review of observations, J. Aerosol Sci., 35, 143–176, https://doi.org/10.1016/j.jaerosci.2003.10.003, 2004.
Kulmala, M., Kontkanen, J., Junninen, H., Lehtipalo, K., Manninen, H. E., Nieminen, T., Petaja, T., Sipila, M., Schobesberger, S., Rantala, P., Franchin, A., Jokinen, T., Jarvinen, E., Aijala, M., Kangasluoma, J., Hakala, J., Aalto, P. P., Paasonen, P., Mikkila, J., Vanhanen, J., Aalto, J., Hakola, H., Makkonen, U., Ruuskanen, T., Mauldin III, R. L., Duplissy, J., Vehkamaki, H., Back, J., Kortelainen, A., Riipinen, I., Kurten, T., Johnston, M. V., Smith, J. N., Ehn, M., Mentel, T. F., Lehtinen, K. E. J., Laaksonen, A., Kerminen, V.-M., and Worsnop, D. R.: Direct Observations of Atmospheric Aerosol Nucleation, Science, 339, 943–946, https://doi.org/10.1126/science.1227385, 2013.
Kulmala, M., Petäjä, T., Ehn, M., Thornton, J., Sipilä, M., Worsnop, D. R., and Kerminen, V. M.: Chemistry of Atmospheric Nucleation: On the Recent Advances on Precursor Characterization and Atmospheric Cluster Composition in Connection with Atmospheric New Particle Formation, Annu. Rev. Phys. Chem., 65, 21–37, https://doi.org/10.1146/annurev-physchem-040412-110014, 2014.
Liu, P., Zhao, C., Zhang, Q., Deng, Z., Huang, M., Xincheng, M. A., and Tie, X.: Aircraft study of aerosol vertical distributions over Beijing and their optical properties, Tellus B, 61, 756–767, 2009.
Madronich, S. and Flocke, S.: Theoretical Estimation of Biologically Effective UV Radiation at the Earth's Surface, in: Solar Ultraviolet Radiation, Berlin, Heidelberg, 23–48, 1997.
Malinina, E., Rozanov, A., Rozanov, V., Liebing, P., Bovensmann, H., and Burrows, J. P.: Aerosol particle size distribution in the stratosphere retrieved from SCIAMACHY limb measurements, Atmos. Meas. Tech., 11, 2085–2100, https://doi.org/10.5194/amt-11-2085-2018, 2018.
Maso, M. D., Kulmala, M., Riipinen, I., Wagner, R., Hussein, T., Aalto, P. P., and Lehtinen, K. E. J.: Formation and growth of fresh atmospheric aerosols: eight years of aerosol size distribution data from SMEAR II, Hyytiala, Finland, Boreal Environ. Res., 10, 323–336, 2005.
Merikanto, J., Spracklen, D. V., Mann, G. W., Pickering, S. J., and Carslaw, K. S.: Impact of nucleation on global CCN, Atmos. Chem. Phys., 9, 8601–8616, https://doi.org/10.5194/acp-9-8601-2009, 2009.
Müller, T., Laborde, M., Kassell, G., and Wiedensohler, A.: Design and performance of a three-wavelength LED-based total scatter and backscatter integrating nephelometer, Atmos. Meas. Tech., 4, 1291–1303, https://doi.org/10.5194/amt-4-1291-2011, 2011.
Peng, Y., Liu, X., Dai, J., Wang, Z., Dong, Z., Dong, Y., Chen, C., Li, X., Zhao, N., and Fan, C.: Aerosol size distribution and new particle formation events in the suburb of Xi'an, northwest China, Atmos. Environ., 153, 194–205, https://doi.org/10.1016/j.atmosenv.2017.01.022, 2017.
Platis, A., Altstädter, B., Wehner, B., Wildmann, N., Lampert, A., Hermann, M., Birmili, W., and Bange, J.: An Observational Case Study on the Influence of Atmospheric Boundary-Layer Dynamics on New Particle Formation, Bound.-Lay. Meteorol., 158, 67–92, https://doi.org/10.1007/s10546-015-0084-y, 2016.
Qi, X., Ding, A., Nie, W., Chi, X., Huang, X., Xu, Z., Wang, T., Wang, Z., Wang, J., Sun, P., Zhang, Q., Huo, J., Wang, D., Bian, Q., Zhou, L., Zhang, Q., Ning, Z., Fei, D., Xiu, G., and Fu, Q.: Direct measurement of new particle formation based on tethered airship around the top of the planetary boundary layer in eastern China, Atmos. Environ., 209, 92–101, https://doi.org/10.1016/j.atmosenv.2019.04.024, 2019.
Rohrer, F. and Berresheim, H.: Strong correlation between levels of tropospheric hydroxyl radicals and solar ultraviolet radiation, Nature, 442, 184–187, https://doi.org/10.1038/nature04924, 2006.
Schobesberger, S., Vaananen, R., and Leino, K.: Airborne measurements over the boreal forest of southern Finland during new particle formation events in 2009 and 2010, Boreal Environ. Res., 18, 145–163, 2013.
Shang, D., Hu, M., Zheng, J., Qin, Y., Du, Z., Li, M., Fang, J., Peng, J., Wu, Y., Lu, S., and Guo, S.: Particle number size distribution and new particle formation under the influence of biomass burning at a high altitude background site at Mt. Yulong (3410 m), China, Atmos. Chem. Phys., 18, 15687–15703, https://doi.org/10.5194/acp-18-15687-2018, 2018.
Shang, D., Peng, J., Guo, S., Wu, Z., and Hu, M.: Secondary aerosol formation in winter haze over the Beijing-Tianjin-Hebei Region, China, Front. Environ. Sci. Eng., 15, 34, https://doi.org/10.1007/s11783-020-1326-x, 2021.
Steinfeld, J. I.: Atmospheric Chemistry and Physics: From Air Pollution to Climate Change, Environment: Science and Policy for Sustainable Development, 40, 26–26, https://doi.org/10.1080/00139157.1999.10544295, 1998.
Stolzenburg, M. R., McMurry, P. H., Sakurai, H., Smith, J. N., Mauldin III, R. L., Eisele, F. L., and Clement, C. F.: Growth rates of freshly nucleated atmospheric particles in Atlanta, J. Geophys. Res.-Atmos., 110, D22, https://doi.org/10.1029/2005JD005935, 2005.
Tao, J. C., Zhao, C. S., Ma, N., and Liu, P. F.: The impact of aerosol hygroscopic growth on the single-scattering albedo and its application on the NO2 photolysis rate coefficient, Atmos. Chem. Phys., 14, 12055–12067, https://doi.org/10.5194/acp-14-12055-2014, 2014.
Wang, H., Lu, K., Chen, X., Zhu, Q., Wu, Z., Wu, Y., and Sun, K.: Fast particulate nitrate formation via N2O5 uptake aloft in winter in Beijing, Atmos. Chem. Phys., 18, 10483–10495, https://doi.org/10.5194/acp-18-10483-2018, 2018.
Wang, J., Krejci, R., Giangrande, S., Kuang, C., Barbosa, H. M., Brito, J., Carbone, S., Chi, X., Comstock, J., Ditas, F., Lavric, J., Manninen, H. E., Mei, F., Moran-Zuloaga, D., Pohlker, C., Pohlker, M. L., Saturno, J., Schmid, B., Souza, R. A., Springston, S. R., Tomlinson, J. M., Toto, T., Walter, D., Wimmer, D., Smith, J. N., Kulmala, M., Machado, L. A., Artaxo, P., Andreae, M. O., Petaja, T., and Martin, S. T.: Amazon boundary layer aerosol concentration sustained by vertical transport during rainfall, Nature, 539, 416–419, https://doi.org/10.1038/nature19819, 2016.
Wang, Q., Sun, Y., Xu, W., Du, W., Zhou, L., Tang, G., Chen, C., Cheng, X., Zhao, X., Ji, D., Han, T., Wang, Z., Li, J., and Wang, Z.: Vertically resolved characteristics of air pollution during two severe winter haze episodes in urban Beijing, China, Atmos. Chem. Phys., 18, 2495–2509, https://doi.org/10.5194/acp-18-2495-2018, 2018.
Weber, R. J., Marti, J. J., McMurry, P. H., Eisele, F. L., Tanner, D. J., and Jefferson, A.: MEASURED ATMOSPHERIC NEW PARTICLE FORMATION RATES: IMPLICATIONS FOR NUCLEATION MECHANISMS, Chem. Eng. Commun., 151, 53–64, https://doi.org/10.1080/00986449608936541, 1996.
Weber, R. J., Marti, J. J., McMurry, P. H., Eisele, F. L., Tanner, D. J., and Jefferson, A.: Measurements of new particle formation and ultrafine particle growth rates at a clean continental site, J. Geophys. Res.-Atmos., 102, 4375–4385, https://doi.org/10.1029/96JD03656, 1997.
Weber, R. J., Chen, G., Davis, D. D., Mauldin, R. L., Tanner, D. J., Eisele, F. L., Clarke, A. D., Thornton, D. C., and Bandy, A. R.: Measurements of enhanced H2SO4 and 3–4 nm particles near a frontal cloud during the First Aerosol Characterization Experiment (ACE 1), J. Geophys. Res.-Atmos., 106, 24107–24117, https://doi.org/10.1029/2000jd000109, 2001.
Williamson, C. J., Kupc, A., Axisa, D., Bilsback, K. R., Bui, T., Campuzano-Jost, P., Dollner, M., Froyd, K. D., Hodshire, A. L., Jimenez, J. L., Kodros, J. K., Luo, G., Murphy, D. M., Nault, B. A., Ray, E. A., Weinzierl, B., Wilson, J. C., Yu, F., Yu, P., Pierce, J. R., and Brock, C. A.: A large source of cloud condensation nuclei from new particle formation in the tropics, Nature, 574, 399–403, https://doi.org/10.1038/s41586-019-1638-9, 2019.
Wu, Z., Hu, M., Lin, P., Liu, S., Wehner, B., and Wiedensohler, A.: Particle number size distribution in the urban atmosphere of Beijing, China, Atmos. Environ., 42, 7967–7980, https://doi.org/10.1016/j.atmosenv.2008.06.022, 2008.
Zhang, R. Y., Khalizov, A., Wang, L., Hu, M., and Xu, W.: Nucleation and Growth of Nanoparticles in the Atmosphere, Chem, Rev,, 112, 1957–2011, https://doi.org/10.1021/cr2001756, 2012.
Zhao, B., Shrivastava, M., Donahue, N. M., Gordon, H., Schervish, M., Shilling, J. E., Zaveri, R. A., Wang, J., Andreae, M. O., Zhao, C., Gaudet, B., Liu, Y., Fan, J., and Fast, J. D.: High concentration of ultrafine particles in the Amazon free troposphere produced by organic new particle formation, P. Natl. Acad. Sci., 117, 25344, https://doi.org/10.1073/pnas.2006716117, 2020.
Zhao, G., Zhao, C., Kuang, Y., Tao, J., Tan, W., Bian, Y., Li, J., and Li, C.: Impact of aerosol hygroscopic growth on retrieving aerosol extinction coefficient profiles from elastic-backscatter lidar signals, Atmos. Chem. Phys., 17, 12133–12143, https://doi.org/10.5194/acp-17-12133-2017, 2017.
Zhao, G., Zhao, C., Kuang, Y., Bian, Y., Tao, J., Shen, C., and Yu, Y.: Calculating the aerosol asymmetry factor based on measurements from the humidified nephelometer system, Atmos. Chem. Phys., 18, 9049–9060, https://doi.org/10.5194/acp-18-9049-2018, 2018.
Zhao, G., Tao, J., Kuang, Y., Shen, C., Yu, Y., and Zhao, C.: Role of black carbon mass size distribution in the direct aerosol radiative forcing, Atmos. Chem. Phys., 19, 13175–13188, https://doi.org/10.5194/acp-19-13175-2019, 2019.
Zhu, X., Tang, G., Guo, J., Hu, B., Song, T., Wang, L., Xin, J., Gao, W., Münkel, C., Schäfer, K., Li, X., and Wang, Y.: Mixing layer height on the North China Plain and meteorological evidence of serious air pollution in southern Hebei, Atmos. Chem. Phys., 18, 4897–4910, https://doi.org/10.5194/acp-18-4897-2018, 2018.
Zhu, Y., Wu, Z., Park, Y., Fan, X., Bai, D., Zong, P., Qin, B., Cai, X., and Ahn, K. H.: Measurements of atmospheric aerosol vertical distribution above North China Plain using hexacopter, Sci. Total Environ., 665, 1095–1102, https://doi.org/10.1016/j.scitotenv.2019.02.100, 2019.