the Creative Commons Attribution 4.0 License.
the Creative Commons Attribution 4.0 License.
 | 02 Jul 2021
Measurement report: The influence of traffic and new particle formation on the size distribution of 1–800 nm particles in Helsinki – a street canyon and an urban background station comparison
Magdalena Okuljar
Heino Kuuluvainen
Jenni Kontkanen
Olga Garmash
Miska Olin
Jarkko V. Niemi
Hilkka Timonen
Juha Kangasluoma
Yee Jun Tham
Rima Baalbaki
Mikko Sipilä
Laura Salo
Henna Lintusaari
Harri Portin
Kimmo Teinilä
Minna Aurela
Miikka Dal Maso
Topi Rönkkö
Tuukka Petäjä
Pauli Paasonen
Most of the anthropogenic air pollution sources are located in urban environments. The contribution of these sources to the population of atmospheric particles in the urban environment is poorly known. In this study, we investigated the aerosol particle number concentrations in a diameter range from 1 to 800 nm at a street canyon site and at a background station within 1 km from each other in Helsinki, Finland. We use these number size distribution data together with complementary trace gas data and develop a method to estimate the relative contributions of traffic and atmospheric new particle formation (NPF) to the concentrations of sub-3 nm particles. During the daytime, the particle concentrations were higher at the street canyon site than at the background station in all analyzed modes: sub-3 nm particles, nucleation mode (3–25 nm), Aitken mode (25–100 nm), and accumulation mode (100–800 nm). The population of sub-3 nm and nucleation mode particles was linked to local sources such as traffic, while the accumulation mode particles were more related to non-local sources. Aitken mode particles were dominated by local sources at the street canyon site, while at the background station they were mainly influenced by non-local sources. The results of this study support earlier research showing direct emissions of the sub-3 nm particles from traffic. However, by using our new method, we show that, during NPF events, traffic contribution to the total sub-3 nm particle concentration can be small and during daytime (6:00–20:00) in spring it does not dominate the sub-3 nm particle population at either of the researched sites. In the future, the contribution of traffic to particle number concentrations in different urban environments can be estimated with a similar approach, but determining the relationships between the gas and particle concentrations from observations needs to be conducted with longer data sets from different urban environments.
- Article
(4287 KB) - Full-text XML
-
Supplement
(3188 KB) - BibTeX
- EndNote


Aerosol particles are both directly emitted to the atmosphere (primary particles) and formed from gaseous precursors (secondary particles) (Kulmala and Kerminen, 2008). Secondary particles can form by new particle formation (NPF) via atmospheric photochemical reactions or nucleate in plumes from local sources (Kerminen et al., 2018; Mylläri et al., 2016). Additionally, particles may form while hot vehicle exhaust is cooled and diluted, which is called delayed primary particulate matter formation (Rönkkö and Timonen, 2019). The urban environment contains a mixture of secondary particles, and primary particles emitted from a variety of industrial processes, traffic, power generation, and natural sources (Seinfeld and Pandis, 2019). Aerosol particles influence visibility (Hyslop, 2009), the hydrological cycle (Rosenfeld et al., 2008), and radiation balance (Andreae, 2009; Ramanathan and Feng, 2009). Furthermore, particles can harm human health, impacting respiratory and cardiovascular systems (André, 2014). Models show that outdoor air pollution causes approximately 400 000 premature deaths in Europe annually (Geels et al., 2015; Im et al., 2018), from which around 2000 occur in Finland (Im et al., 2019). However, nanoparticles have different health impacts than larger particles. Urban air pollution contains magnetite nanoparticles, which accumulate in the brain and may cause neurodegenerative diseases (Maher et al., 2016). Nanoparticles with diameters below 3 nm may have significant (so far poorly understood) health effects due to their nose-to-brain transport via the olfactory pathway (Tian et al., 2019). Hence, a better understanding of the concentrations, sources, and health impacts of the nanoparticles will improve the estimates of adverse health effects of urban pollution sources.
In recent years, instrument development has enabled the detection of aerosol particles with diameters between 1 and 3 nm (Vanhanen et al., 2011), which we here refer to as sub-3 nm particles. This had made it possible to study the very beginning of NPF, which starts with the formation of sub-3 nm particles. Regional NPF events, where the growth of the particles to larger sizes can be followed, are favored in specific meteorological conditions, e.g., high solar radiation and low relative humidity, as well as an abundance of low-volatility gaseous precursors (Hussein et al., 2008; Kerminen et al., 2018; Salma et al., 2011; Wonaschütz et al., 2015). One of the known gaseous precursors, which plays an important role in NPF, is sulfuric acid (SA). SA is an oxidation product of sulfur dioxide (SO2), which is primarily emitted from anthropogenic processes related to fuel combustion, e.g., from traffic. Previous studies have shown that in addition to indirect emission of SA, resulting from the oxidation of traffic-emitted SO2 (Olin et al., 2020), SA is also emitted directly from traffic (Arnold et al., 2012; Rönkkö et al., 2013). In many locations, SA concentration is one of the critical factors determining whether an NPF event occurs (Kuang et al., 2008; Ripamonti et al., 2013; Wang et al., 2011).
In addition to NPF, traffic is a significant source of sub-3 nm particles (Hietikko et al., 2018; Rönkkö et al., 2017). The sub-3 nm particles are directly emitted from vehicle exhaust (Rönkkö et al., 2017; Sgro et al., 2012) and brake wear (Nosko et al., 2017) or formed in the exhaust plume from the nucleating gaseous components (Rönkkö and Timonen, 2019). The concentrations from the road emissions decrease fast while moving away from a road due to dispersion (Pirjola et al., 2006). Especially the concentration of the sub-3 nm particles is additionally reduced by condensation and coagulation (Kangasniemi et al., 2019). Rönkkö et al. (2017) showed that the sub-3 nm particles represent 20 %–54 % of the particle population in a “semiurban” roadside environment in Helsinki. Kontkanen et al. (2017) analyzed the sub-3 nm particle concentrations in different environments and concluded that the sub-3 nm particle concentrations are higher in locations influenced by anthropogenic emissions. Hietikko et al. (2018) observed elevated concentrations of sub-3 nm particles at the street canyon in Helsinki during rush hours and when wind was coming from the road, and they concluded that sub-3 nm particles are linked to traffic activity. In addition, they found that high sub-3 nm particle concentrations coincided with high concentrations of larger particles, suggesting the importance of traffic emissions. Traffic emissions do not only contain particles but also SA, volatile organic compounds, and trace gases, such as carbon dioxide (CO2) and nitrogen oxides (NOx), which are commonly used as traffic markers. Generally, the impacts of traffic on urban air quality and on human health is still not well quantified.
Previously, particle size distributions have been measured in different urban environments, such as London (Bousiotis et al., 2019; Harrison et al., 2019; Hofman et al., 2016), Stockholm (Mårtensson et al., 2006), Innsbruck (Deventer et al., 2018), Los Angeles (Zhu et al., 2002), Beijing (Zhou et al., 2020), Shanghai (Xiao et al., 2015), and Helsinki (Hussein et al., 2006; Ripamonti et al., 2013). In the Helsinki area, the focus of the research has been either on NPF events (Hussein et al., 2008, 2009) or the primary particle emissions (Hietikko et al., 2018; Ripamonti et al., 2013; Rönkkö et al., 2017). These approaches leave an open question about the relative contribution of each source to the particle population. To answer this question, we conducted simultaneous measurements at two close-by stations in the Helsinki area: at a street canyon and at a urban background station. For the first time, particle size distributions in a diameter range from 1 to 800 nm as well as the concentrations of precursor gases were simultaneously measured at two nearby stations in Helsinki. In this article, we present the results of these measurements and compare the particle size distributions and their variation at these two stations. Specifically, we develop and apply a new method to determine the relative contributions of NPF and traffic to the sub-3 nm particle population in different urban environments.
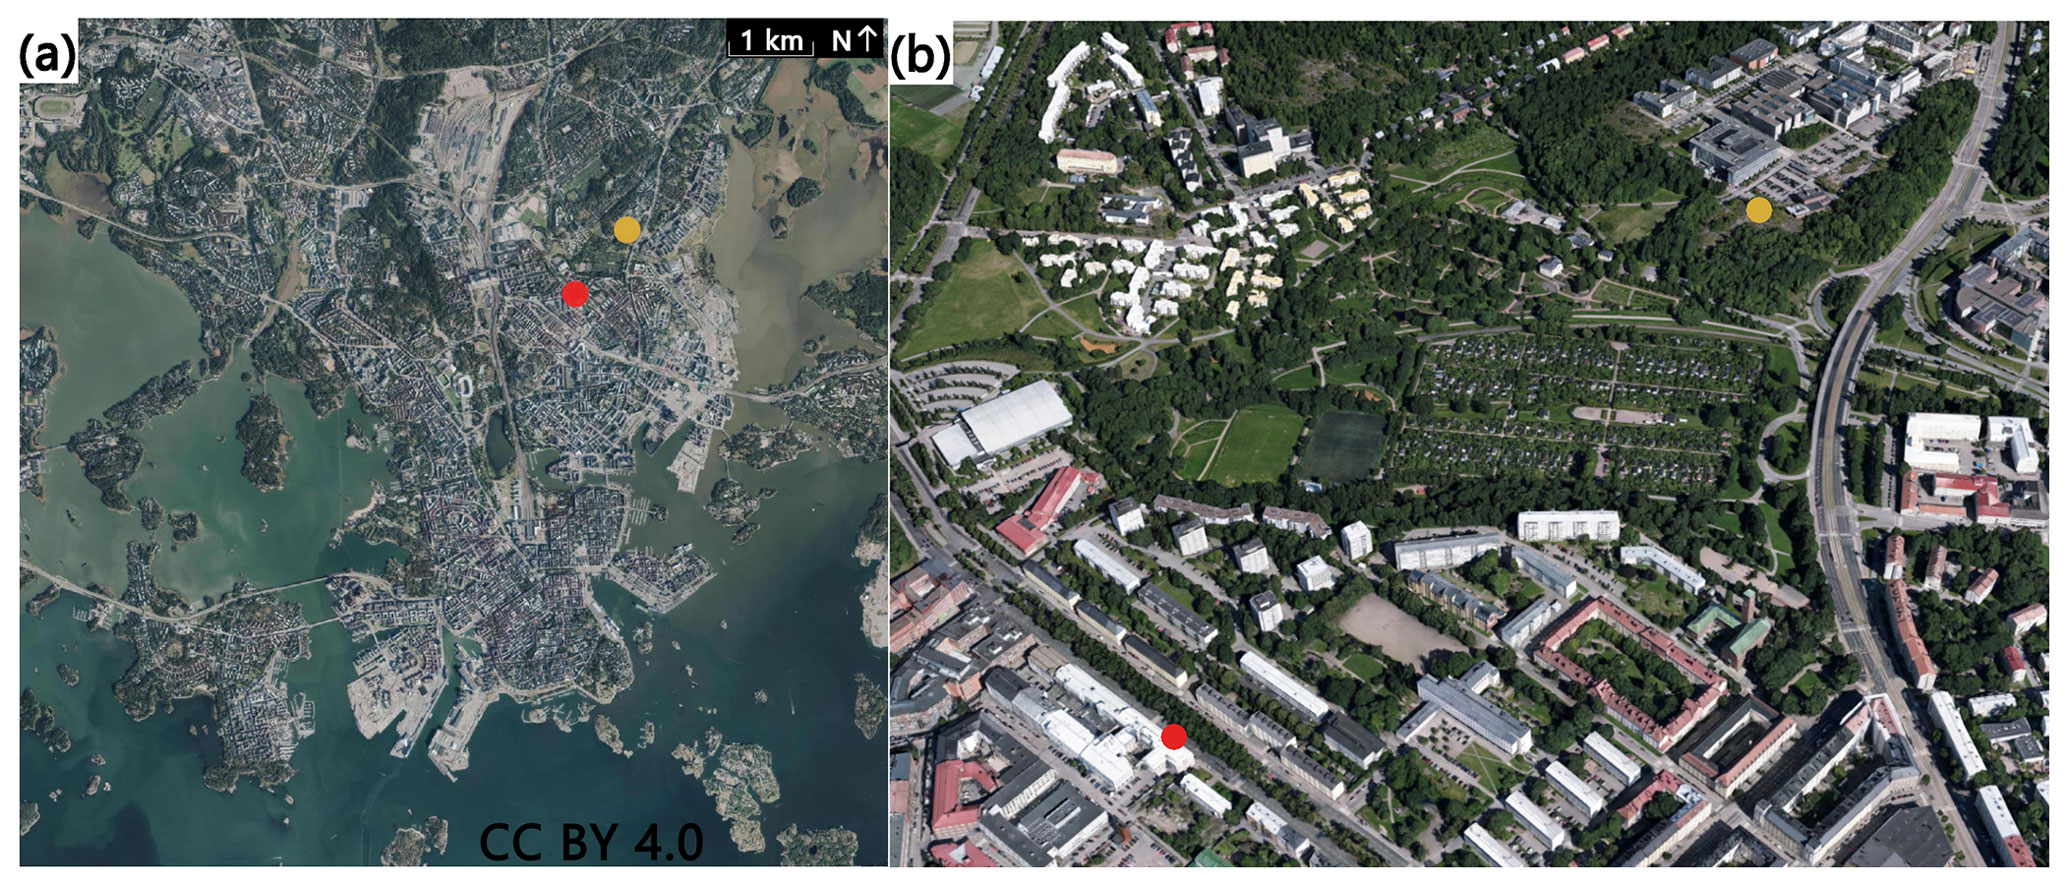
Figure 1Aerial photography (a) and 3D model (b) of stations: street canyon (red) and background (yellow). The photograph and the model were provided by the city of Helsinki map service (CC BY 4.0).
2.1 Measurement stations
We performed measurements at two different stations in Helsinki, Finland, during April–June 2018. The first one is the Helsinki Region Environmental Services (HSY) air quality station, which is placed in a street canyon (approximately 0.5 m from the edge of Mäkelänkatu street), and it represents a busy street environment (with approximately 28 100 vehicles per workday) (Kuuluvainen et al., 2018). The second one, the Station for Measuring Ecosystem-Atmosphere Relations (SMEAR III), is located within 900 m northeast of HSY site, and it is classified as an urban background station (Fig. 1) (Järvi et al., 2009). The sites are separated by buildings, a botanic garden, and a small deciduous forest. The SMEAR III site is located on a hill, approximately 12 m above the nearest busy road (Hämeentie street). The SMEAR III site is separated from Hämeentie by a 150 m band of deciduous forest. Apart from the forest, in the SMEAR III surroundings are also buildings, parking lots, and small vegetation (Järvi et al., 2009). In this article, the measurement stations are called “street canyon” and “background”, respectively.
2.2 Measurement period and comparison of data from sites
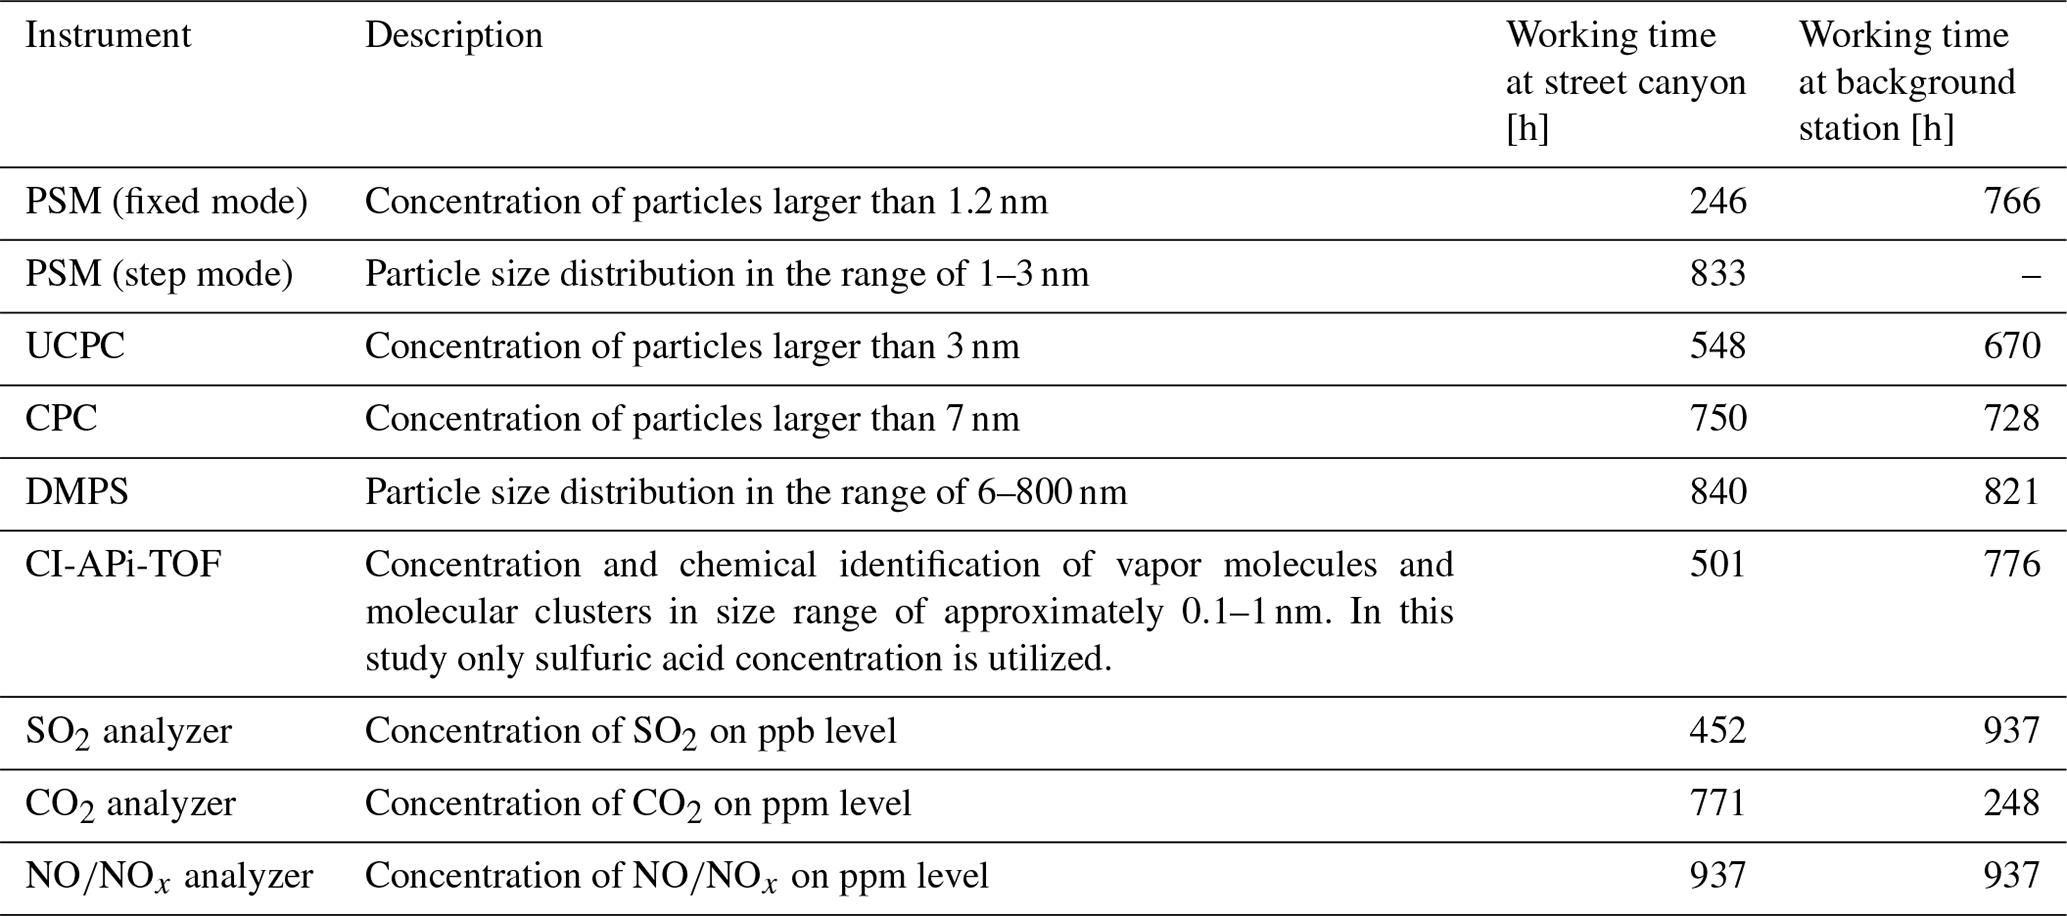
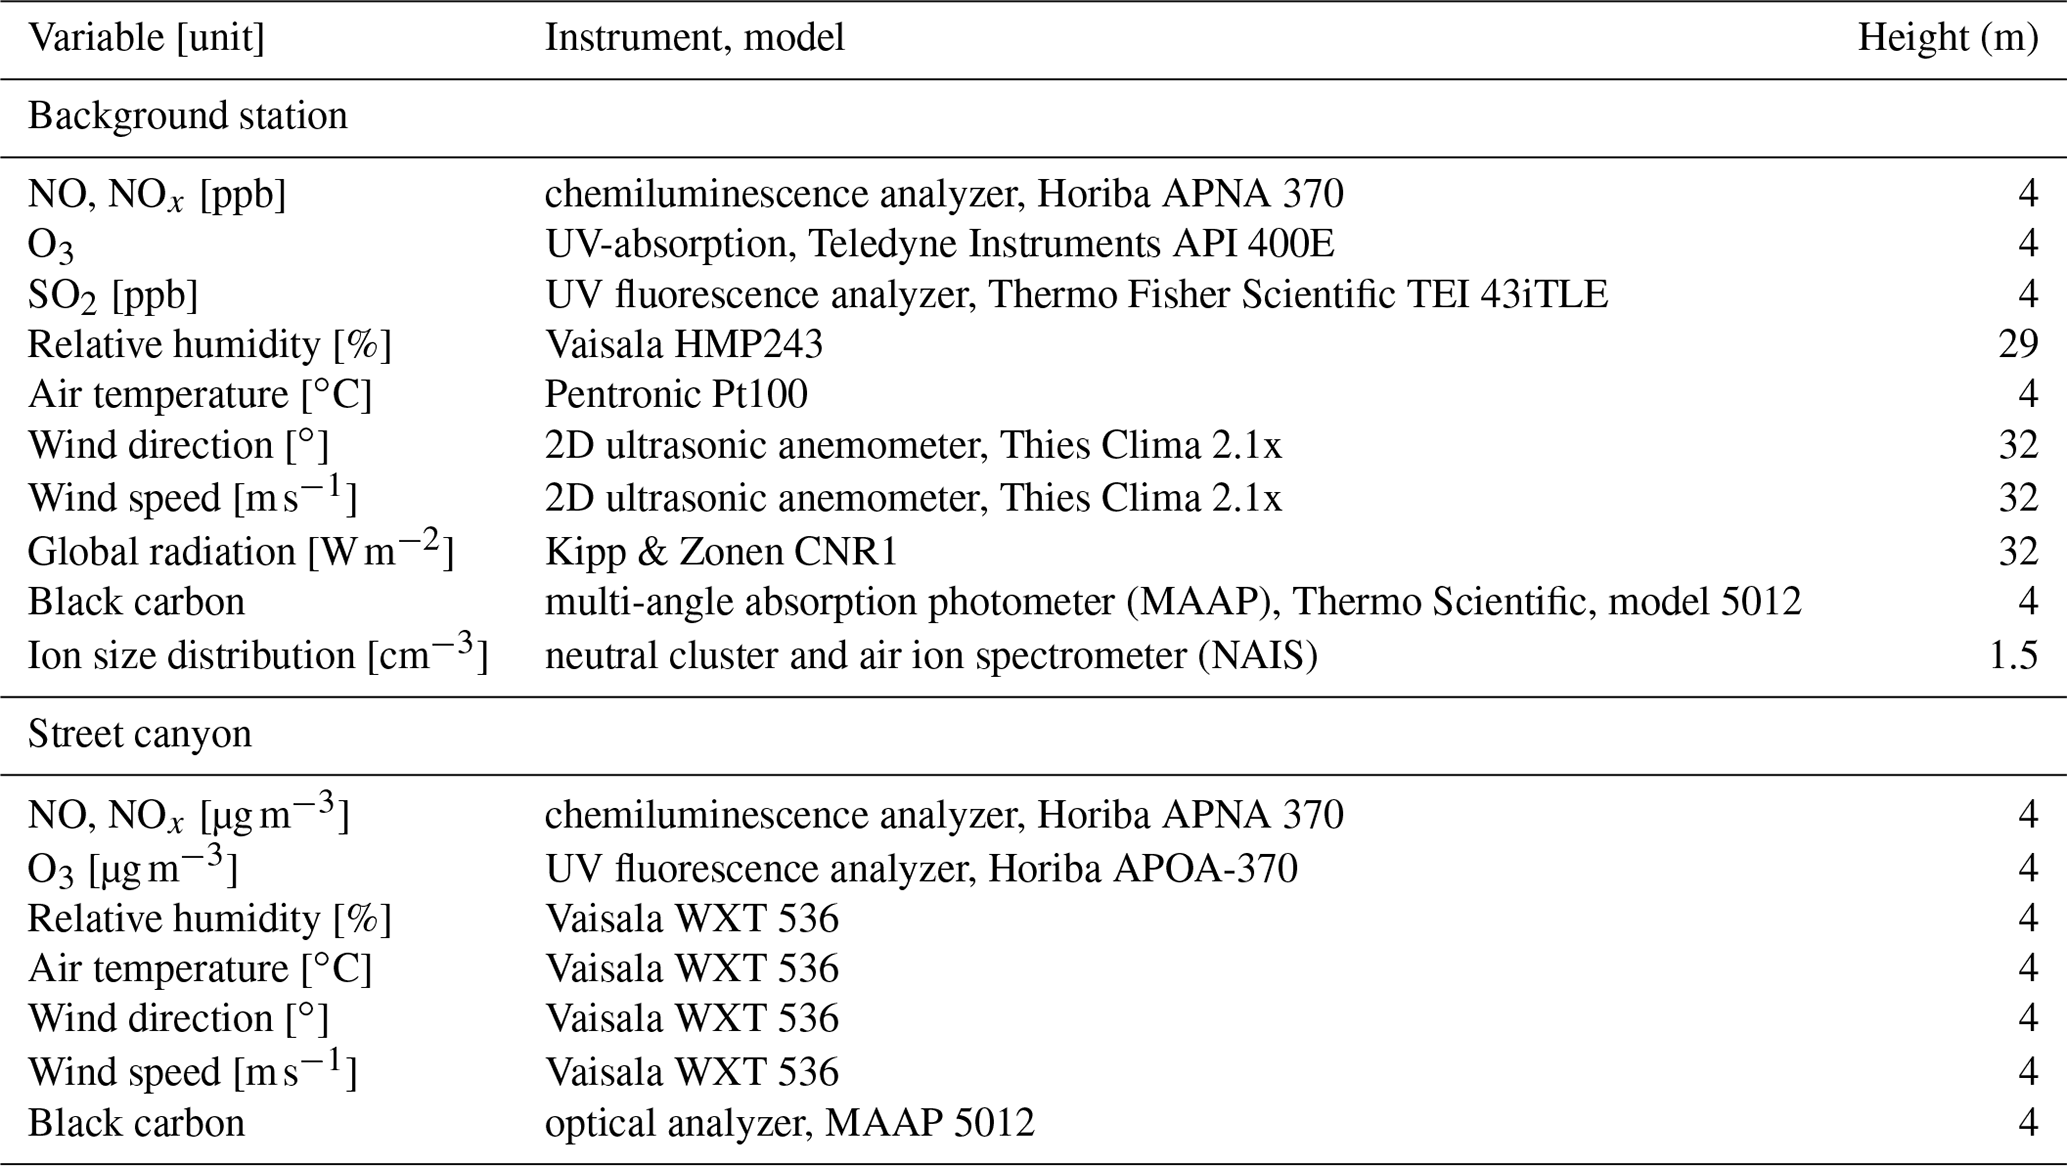
We measured particle number size distribution, trace gases, and SA concentrations at both stations during the period 27 April–5 June 2018. An overview of instruments used during this campaign is presented in Table 1, indicating the total running time at each station. The detailed working time for each instrument is shown in Table A1. Most of the analysis was conducted separately for workdays and days free of work, i.e., weekends and holidays (1 and 10 May 2018), which are for simplicity just referred to as “weekends” in this article. When comparing particle concentrations from the two stations, we analyze times when all the instruments measuring particles were performing at each site. This resulted in 120 and 101 h of measured particle concentration during weekends and workdays, respectively, at the street canyon site. At the background station, it resulted in 217 h of observed particle concentration during weekends and 398 h during workdays. In addition, we present separately a few case studies, where the overlapping data obtained simultaneously from the two stations are analyzed in more detail. Oppositely to the analysis of particle concentrations, sulfuric acid (SA) concentration and condensation sink (CS) were studied only for the overlapping period of SA concentration measurements at the two stations resulting in 167 and 329 h measured during weekends and workdays, respectively.
Table 1Overview of the main instruments used at the street canyon and background station during the campaign.
2.3 Particle size distribution measurement
A wide range of particle size distribution was obtained by combining several instruments: a particle size magnifier (PSM) (Vanhanen et al., 2011), an ultrafine condensation particle counter (UCPC), a condensation particle counter (CPC) (Kangasluoma and Attoui, 2019), and a differential mobility particle sizer (DMPS) (Wiedensohler et al., 2012). The measured size ranges and working hours of these instruments are presented in Table 1. At the street canyon site, particle size distribution was measured at 4 m height, while at the background station it was at 1.5 m.
The PSM technique contains a pre-conditioner, which activates the smallest particles and grows them up to 90 nm, and a CPC (Vanhanen et al., 2011). The minimum size of activated particles depends on the diethylene glycol supersaturation in the pre-conditioner (Lehtipalo et al., 2014). Altering the supersaturation condition allows for varying the minimum size of activated and measured particles between 1 and 3 nm. The PSM can be used to measure particle concentrations in three different modes: fixed, step, and scanning. In the fixed mode, supersaturation and the minimum size of the measured particles are constant. Data obtained by measuring in the fixed mode have a high temporal resolution (1 s); therefore, it is mainly used in a very rapidly changing environment such as a busy street. In the step mode, supersaturation and the lowest size of measured particles oscillate between three set values. This allows for analyzing particle size distribution in the range from 1 to 3 nm. On the other hand, data obtained from step mode measurements have a lower temporal resolution (3 min). Adjusting the time of every supersaturation measurement allows for minimizing the uncertainties related to the rapid changes in the analyzed environment. In the scanning mode, supersaturation gradually changes between two set values. The scanning mode enables choosing the size bins when inverting the raw data to a size distribution. However, the temporal resolution of scanning mode is the lowest of all the modes (4 min). In the scanning mode, we assume that particle concentration stays constant during each scan; thus, this mode cannot be used in a rapidly changing environment. In this study, PSM was operated in fixed and step modes. At both stations, PSMs working in the fixed mode measured concentrations of particles with sizes larger than 1.2 nm.
Condensation particle counters enlarge particles by condensation of supersaturated condensable vapors. Once particles reach a size sufficient for optical detection, they are counted by the optical particle counter. In this study, we use two models of butanol-based CPCs, from which one measures particle concentration of particles with sizes larger than 3 nm, while the other one counts particles with sizes larger than 7 nm. For simplicity, we call them UCPC and CPC, respectively.
The differential mobility particle sizer (DMPS) consists of a differential mobility analyzer (DMA) and a CPC. The DMA classifies charged particles according to their mobility in an electric field. By incrementally stepping the voltage applied to the central rod of the DMA, particles of corresponding mobility can be classified by the DMA and further quantified by the CPC. During an 8 min cycle, the DMPS monitors the size distribution of particles with a diameter between 6 and 800 nm. The size distribution obtained from DMPS measurements was used to study the loss rate of vapors due to condensation on existing particles, i.e., CS (Kulmala et al., 2012). DMPS data from the background station were also utilized to identify NPF events based on the method proposed by Dal Maso et al. (2005).
All instruments were corrected for diffusion losses in their inlets except the UCPC measuring at the background station, in which the core sampling technique (Fu et al., 2019) was used.
Sub-3 nm particle concentration was determined by subtracting concentration measured by the UCPC from concentrations measured by the PSM working at the fixed mode. The nucleation mode (3–25 nm) particle concentration was computed by adding concentration measured by DMPS with diameters of 7–25 nm to the difference of concentration measured by CPC and UCPC. Particle concentrations measured by DMPS with diameters of 25–100 and 100–800 nm were considered the Aitken and accumulation mode concentrations. The size range for the Aitken mode corresponds to the range of mean particle size in the typical soot mode of vehicle exhaust (Rönkkö and Timonen, 2019). At the street canyon site, gaps in the UCPC data were filled with the concentration of particles larger than 3 nm obtained from the PSM measuring in the step mode. At the background station, UCPC data from 29 May to 4 June were corrected by checking that the ratios of concentrations measured with the PSM and UCPC as well as UCPC and CPC agree in the nighttime (see Supplement). All the measured size ranges correspond to the mobility diameter of particles.
2.3.1 Uncertainties of sub-3 nm particles measurement
Measuring the concentration of particles smaller than 3 nm contains noteworthy uncertainties mainly due to the effect of chemical composition and charging state of particles on the cutoff size of PSM.
Particle detection efficiency in butanol counters (Wlasits et al., 2020) and the PSM techniques depend strongly on the chemical composition of measured clusters. Experiments show that the difference between the cutoff diameter in PSM for particles with different chemical compositions can reach up to approximately 1 nm (Jiang et al., 2011; Kangasluoma et al., 2014, 2016). This causes uncertainty of ±0.5 nm for particles with unknown chemical composition. PSM calibrated with particles with the same chemical composition as the measured one would have a negligible offset (Kangasluoma et al., 2015). In the urban environment, the chemical composition of particles is complex and evolving with time; thus, this uncertainty cannot be minimized in this research.
Uncertainty due to the charging state of particles is mainly affected by the discrepancy between the charging state of measured particles and particles used for the calibration. PSMs were calibrated with negatively charged tungsten oxide clusters by the method presented in Kangasluoma et al. (2015). However, the majority of particles measured in the urban environment are likely electrically neutral (Yao et al., 2018). Since neutral particles are activated at a higher supersaturation than charged particles, we probably underestimate the size of measured particles (Kangasluoma et al., 2016, 2017; Winkler et al., 2008). Experiments indicate a 0.1–0.5 nm increase in the activated diameter of neutral particles in PSM in comparison to the charged ones (Kangasluoma et al., 2016, 2017). When the effect of charge on the measured particle population is unknown, increasing the cutoff diameter in PSM by 0.3 nm will reduce the uncertainty of the state of charge to ±0.2 nm (Kangasluoma and Kontkanen, 2017).
Additionally, meteorological conditions such as humidity can affect the cutoff size of PSM and CPC (Kangasluoma et al., 2013; Tauber et al., 2019).
Lastly, the non-ideal efficiency curve, used for determining the cutoff diameter, makes it possible to sample particles smaller than the cutoff size. When the relative contribution of sub-3 nm particles to the total particle population is high, the uncertainties of cutoff diameter or the shape of the efficiency curve can affect the total concentration measured by PSM and CPC (Kangasluoma and Kontkanen, 2017).
2.4 Sulfuric acid measurement
Sulfuric acid (SA) concentration was monitored with a high-resolution chemical ionization atmospheric pressure interface time-of-flight mass spectrometer (CI-APi-TOF) with nitrate () as a reagent ion. The CI-APi-TOF technique contains a chemical ionization (CI) source and an atmospheric pressure interface (APi) coupled with a time-of-flight mass spectrometer (TOF). Chemical ionization is a soft ionization technique in which the reagent ion reacts with analyzed compounds and charges them. is a reagent ion used for the detection of gaseous SA in ambient air (Eisele and Tanner, 1993; Jokinen et al., 2012; Mauldin et al., 1999). or its cluster with nitric acid () reacts via proton transfer reaction with sulfuric acid creating a cluster detectable by the APi-TOF technique (Jokinen et al., 2012). A detailed description of the nitrate-based CI method used as a pre-treatment for the APi-TOF technique is presented by Jokinen et al. (2012). The atmospheric pressure interface guides ionized compounds through three stages of lowering sample pressure to the time-of-flight region. A TOF mass spectrometer separates and detects analyzed compounds by their mass-to-charge ratios. A detailed description of the APi-TOF technique is described by Junninen et al. (2010).
Due to the uncertainty of the rate of the reaction between gaseous sulfuric acid and the nitrate ion, the CI-APi-TOF needs to be calibrated by taking the wall losses of SA inside the instrument and the flow conditions of the ion source into consideration (Kürten et al., 2012; Viggiano et al., 1997). Calibration of CI-APi-TOF was done before the campaign, based on the method proposed by Kürten et al. (2012). The SA concentration was calculated from Eq. (1) (Jokinen et al., 2012).
where [SA] is SA concentration, C is the calibration coefficient, and CRM is a count rate of an ion with a mass M in atomic mass unit (amu).
The SA zero level concentration, determined by measuring filtered air, was subtracted from the measured concentrations. Uncertainties of the averaged absolute concentration measured by CI-APi-TOF are on the order of 50 %, while the uncertainties of relative changes in the concentration are smaller than 10 % (Ehn et al., 2014); thus, comparing SA concentration values between stations is not as accurate as analyzing time series of SA and other variables.
2.5 Other instrumentation
Nitric oxide (NO), CO2, SO2, and NOx were additionally measured during this campaign (Table 1). To complement these measurements, we used continuous measurements performed at both stations. These include meteorological parameters, ozone (O3) concentration, ion size distribution, and black carbon (BC) concentration. All the instruments used are listed in Table A2.

Figure 2Median particle size distribution (a, c) at the street canyon and (b, d) at the background station. The colors indicate different periods of the day: night (01:00–4:00 LT, black), morning (06:00–09:00 LT, blue), noon (10:00–13:00 LT, green), and afternoon (15:00–18:00, red). The top row presents size distribution measured during weekends (a, b) and the bottom during workdays (c, d). Median size distribution was determined by DMPS (particles with sizes between 6–800 nm) marked with solid lines in the figure, UCPC and CPC (3–7 nm), and PSM and UCPC (1–3 nm) marked with dots. This figure with a linear y axis can be found in Fig. S3.
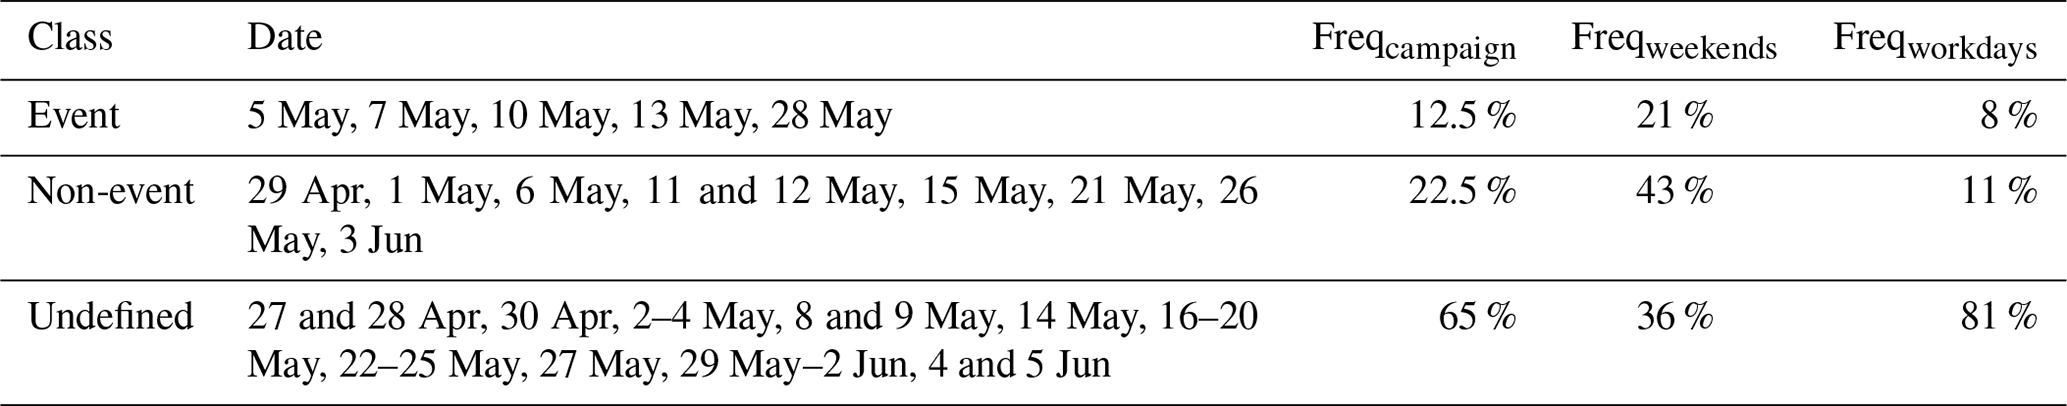
Table 2NPF event classification at the background station for the period 27 April–5 June 2018. Results are presented separately for a full campaign, weekends, and workdays.
2.6 Estimation of the relative contribution of NPF and traffic to sub-3 nm particles
To estimate the influence of traffic and NPF on the sub-3 nm particle population, we analyzed the correlation between sub-3 nm particles and NOx concentrations as well as between sub-3 nm particles and SA concentrations. NOx concentration was used as a traffic marker (Olin et al., 2020), while SA concentration was used as an NPF marker (Sipila et al., 2010). We separately investigated the relation between SA and NOx concentrations in the street canyon, in order to justify the use of SA as a tracer for NPF even though emissions of SA from traffic have previously been reported (Arnold et al., 2012; Olin et al., 2020). Bivariate fittings (Cantrell, 2008; Williamson, 1968; York, 1966) were conducted on the common logarithms of sub-3 nm particles and SA, when NOx concentration was low, to estimate sub-3 nm particle concentration originating from NPF. Correlation between common logarithms of sub-3 nm particles and NOx, when SA concentration was low, was used to estimate sub-3 nm particle concentration originating from traffic. Equations used for calculating sub-3 nm particles emitted by traffic and NPF as well as their relative contributions to the particle population are presented in the appendix (Eqs. A1–A6).
3.1 NPF event classification
The results of the NPF event classification at the background station for the studied period are shown in Table 2. The examples of an event, non-event, and undefined class are shown in Fig. S2. The overall frequency of NPF event days was 12.5 %; 21 % of weekends and 8 % of workdays were classified as events. Due to nucleation mode particles originating from local sources, the majority of days were classified as undefined.
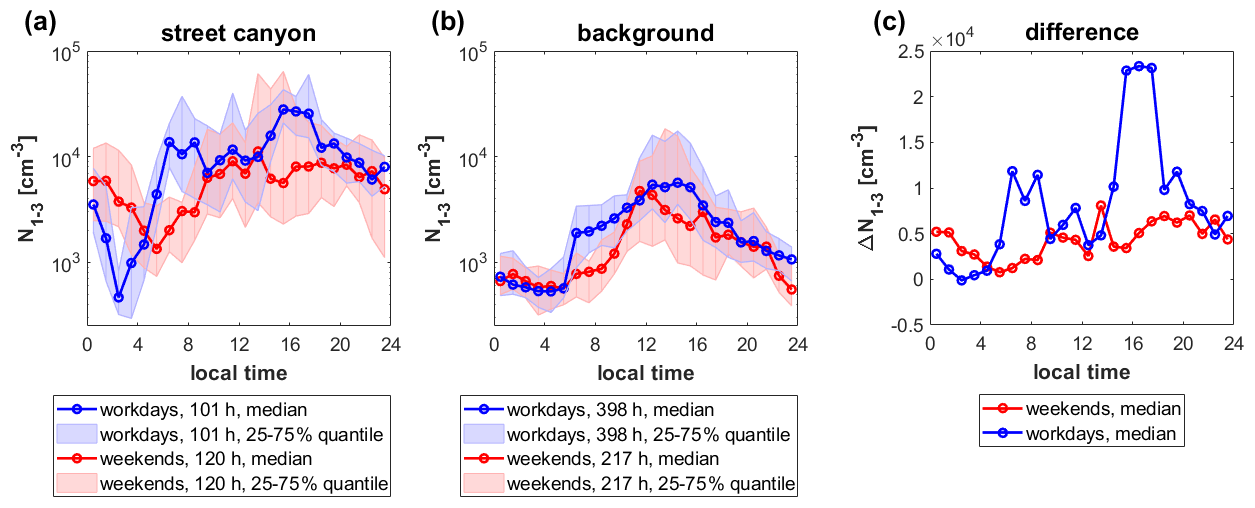
Figure 3The diurnal variation of sub-3 nm particle concentration during weekends (red) and workdays (blue) (a) at the street canyon and (b) at the background station; (c) the difference between median sub-3 nm particle concentration at the street canyon (a) and at the background station (b). The median diurnal variation is shown as a solid line with markers; the 25th and 75th percentile ranges are presented as shaded areas.
3.2 Particle size distributions
Figure 2 presents the median particle size distributions at both stations during workdays and weekends at different times of the day. The shape of the size distributions for Aitken (25–100 nm) and accumulation mode (100–800 nm) particles is quite similar at the two sites in most of the cases, but the concentrations are higher at the street canyon, as discussed later in this section. What stands out is almost constant Aitken mode measured during daytime on workdays at the street canyon site. At the street canyon site, the concentration of particles in the nucleation mode (3–25 nm) has a decreasing trend with an increase of particle size, except for the nighttime on workdays. At the background station, during the night and afternoon, the concentration of particles in nucleation mode increases with increasing particle diameter. Around noon the nucleation mode has a peak above 10 nm, likely linked to NPF events. A sudden change in concentrations of particles with a diameter below and above 7 nm at the background station can be associated with the uncertainty of the different instruments used for measuring particles smaller than 10 nm (Kangasluoma et al., 2020). The shape of the particle size distribution at the background station is somewhat different from the average size distribution measured at the same location in the years 1997–2003 (Hussein et al., 2004). Hussein et al. (2004) found that during spring the size distribution of 8 and 400 nm particles reaches the maximum concentration in the nucleation mode, while in our study concentration of particles within the same size range has a maximum in the Aitken mode. This difference could be explained by a higher contribution of NPF to the average size distribution determined by Hussein et al. (2004). At the street canyon site, the shape of the size distribution of larger than 5 nm particles observed in our study is quite similar to the one measured at the same location in May 2017 (Hietikko et al., 2018). In 2017, the particle concentration was observed to reach a maximum for particles around 5 nm (Hietikko et al., 2018), while in our case the highest concentration during daytime is reached for particles smaller than 3 nm.
Focusing on the smallest particles (Fig. 3), we observe that at the street canyon the median concentration of sub-3 nm particles is up to 2.4×104 cm−3 higher than at the background station (Fig. 3c). The concentration of sub-3 nm particles is higher at the street canyon site regardless the particle loss due to coagulation scavenging being twice as high as at the background station (discussed later in this section). At the street canyon, two traffic-related peaks are observed during the morning (06:00–08:00 LT) and afternoon hours (15:00–17:00 LT) on workdays. These peaks correspond to the increase of NOx concentration at the street canyon site during workdays (Fig. S4a). During weekends, there is no morning peak and the afternoon peak occurs earlier (14:00–17:00 LT). The level and the diurnal variations of sub-3 nm particles at the street canyon are similar to observations at the same site in May 2017 by Hietikko et al. (2018). They found that sub-3 nm particles followed the pattern observed in numbers of vehicles at Mäkelänkatu street. However, in 2017 the morning peak in sub-3 nm particles was shorter, and the afternoon peak started an hour earlier. At the background station, the diurnal variation of sub-3 nm particle concentration has a maximum around noon both during weekends and workdays. Nevertheless, a sharp increase of sub-3 nm particle concentration is observed in the morning (06:00 LT) during workdays. The morning rise of sub-3 nm particle concentration at the background station during workdays corresponds to a peak of NOx concentration (Fig. S4b), which suggests the contribution of traffic emissions. The absence of clearly visible traffic-related peaks at the background station can be caused by the 150 m distance of the site uphill from the nearest road as well as the separation of the road and the station by the forest. The midday maximum of sub-3 nm particle concentration is likely related to NPF. However, Kontkanen et al. (2017) showed that at the background station the starting time of a sub-3 nm particle concentration increase varies hardly throughout the year, meaning that the increase in sub-3 nm particle concentration is independent of sunrise and therefore solar radiation. This suggests that traffic at least partially influences the observed midday peak in sub-3 nm particle concentration at the background station.

Figure 4Diurnal variations of nucleation (3–25 nm), Aitken (25–100 nm), and accumulation (100–800 nm) mode particle concentrations during weekends (red) and workdays (blue) measured at the street canyon (a–c) and background station (d–f) as well as the difference between the street canyon site and the background station concentrations (g–i). The median diurnal variations are shown as solid lines with markers; the 25th and 75th percentile ranges are presented as shaded areas. This figure with a linear y axis can be found in Fig. S5.
The difference between the stations (Fig. 3c) shows that median sub-3 nm particle concentrations during the rush hours in the street canyon site are clearly higher than at the background station throughout, roughly by a factor of 5. However, the concentrations are slightly higher also during nighttime, which shows the influence of the continuous traffic emissions at the street canyon site. One should keep in mind, though, that data presented in Fig. 3 can be affected by the differences in measurement period between the two sites, especially if the fraction of data collected during NPF event is different.
The diurnal variation of nucleation mode particle concentration is similar to that of sub-3 nm particles at both stations (Fig. 4). During workdays, we can see traffic-related peaks, which are less pronounced on weekends. The concentrations of nucleation mode particles in the street canyon are 103–3.9×104 cm−3 higher than at the background station during the daytime. Concentrations of Aitken mode particles at the street canyon site are up to 5×103 cm−3 higher than at the background station on workdays. During nighttime and weekends, concentrations of Aitken mode particles are similar at both stations, which suggests a similar origin of these particles. The diurnal variation of Aitken mode particle concentration at the background station is similar during workdays and weekends, however, during daytime concentrations are higher on workdays. At street canyon during workdays, we can observe traffic-related peaks in Aitken mode particles, which are absent during weekends. Accumulation mode particle concentrations during workdays and weekends are comparable at each of the stations (Fig. S5). During daytime accumulation mode particles reached higher concentrations at the street canyon than at the background station, which causes a difference of roughly a factor of 2 between condensation and coagulation sinks at the sites (Fig. 5). Accumulation mode particle concentration is almost constant during the whole day.

Figure 5The diurnal variation of CS during weekends (red) and workdays (blue) (a) at the street canyon and (b) at the background station. The median diurnal variation is shown as a solid line with markers; the 25th and 75th percentiles are presented as a shaded area.

Figure 6The diurnal variation of sulfuric acid (SA) concentration (a) at the street canyon and (b) at the background station. The median diurnal variation is shown as a solid line with markers; the 25th and 75th percentiles are presented as a shaded area.
Overall, the influence of traffic on the particle population at the street canyon is clearly visible for sub-3 nm, nucleation mode, and Aitken mode particles, while the accumulation mode is only slightly influenced by traffic. The particle concentrations at the background station are also influenced by traffic but not as strongly as at the street canyon station. At the background station, the influence of traffic can be observed only for sub-3 nm and nucleation mode particles. These results suggest that sub-3 nm and nucleation mode particle concentrations in the urban environment are mainly influenced by local sources, while the accumulation mode particle concentrations are mostly dominated by transport from non-local sources. Whether the Aitken mode is primarily dominated by local or non-local sources depends on the analyzed location.
3.3 Sulfuric acid
SA concentration had a clear daytime maximum at both sites (Fig. 6). The only difference in SA concentration between workdays and weekends at each site was observed during midday (13:00–15:00 LT) when SA concentration reached higher values during weekends than weekdays. During weekends, the median SA concentration at the background station had a maximum of 1.1×107 cm−3 while during workdays, it reached only 4.6×106 cm−3. A similar pattern is observed at the street canyon station with the maximum concentrations of 6.9×10⁶ and 3.6×106 cm−3 during weekends and weekdays, respectively. This difference is likely linked to a bigger fraction of NPF events days during analyzed weekends than workdays (Table 2). Daytime median SA concentrations are slightly higher at the background station than at the street canyon (Figs. 6 and S6), which is probably caused by higher CS at the street canyon site (Fig. 5). Nighttime median SA concentrations are as high at the street canyon site as at the background station. SA concentrations at the street canyon site are slightly lower than the concentrations measured 1 year earlier by Olin et al. (2020).

Figure 7Time series of particle size distribution at the background station (b, d) and at street canyon site (a, c) measured by DMPS for periods of 5 May–7 May LT (a, b) and 8 May 09:00 LT–9 May 2018 15:00 LT (c, d).
3.4 Case studies
To understand the behavior of sub-3 nm particles on a shorter timescale, we analyzed two periods when the particle concentration data are available from both sites: Saturday 5 May and Sunday 6 May and Tuesday 8 May 09:00 LT to Wednesday 9 May 2018 15:00 LT. The first investigated case is a weekend starting with an NPF event (Fig. 7a and b). The second case contains typical workdays (Fig. 7c and d), which are classified as undefined days in the NPF event classification. Supporting information about atmospheric conditions, trace gas concentrations, black carbon (BC) concentration, and CS during the analyzed cases are presented in Figs. S7–S9. In both studied cases, sub-3 nm particles and SA concentrations follow each other closely at the background station (Fig. 8). Oppositely, at the street canyon site, there are many traffic-related sub-3 nm particles peaks, which often do not have their counterparts in SA time series. The correlation between sub-3 nm particles and SA is much weaker at the street canyon site than at the background station for both case studies (Fig. S10). This suggests that the majority of SA is not originating from direct emissions from traffic. Our analysis also supports studies showing that sub-3 nm particles are not only formed by clustering of atmospheric vapors, but they are also directly emitted from traffic (Hietikko et al., 2018; Rönkkö et al., 2017; Rönkkö and Timonen, 2019). The pattern of SA time series is similar at both stations, but SA concentrations are lower at the street canyon. The highest sub-3 nm particles and SA concentrations during both cases were measured at each site during the NPF event. The relation between sub-3 nm particles measured at the street canyon and background station during these case studies is presented in Fig. S11. During the NPF event (Fig. 8a and b), sub-3 nm particle concentration at the background station is almost a factor of 2 higher than at the street canyon site. However, nearly simultaneous to the highest peak in sub-3 nm particles and SA concentrations, a peak in particle concentrations across the modes (Fig. 7b) as well as in SO2 concentration (Fig. S7) is observed at the background station. This suggests that the observation is related to a pollution plume (for example a ship or a coal-fired power plant in Helsinki), which happens to be more efficiently transported to the background station than to the street canyon. This illustrates the interplay of various types of sources on the aerosol concentrations, regional NPF events, local traffic sources, and nearby point sources. It should be kept in mind that this case occurs during the weekend when the traffic volumes are lower and daily patterns of traffic rate differ from weekdays; thus, on average the influence of traffic on particle concentrations is expected to be more pronounced.

Figure 8Time series of sub-3 nm particles (black) and SA (red) concentrations at the street canyon (a, c) and at the background station (b, d) during 5 May 00:00 LT–7 May 00:00 LT (a, b) and 8 May 09:00 LT–9 May 2018 15:00 LT (c, d). Vertical blue lines indicate midnight. This figure with a logarithmic y axis can be found in Fig. S12.
3.5 Regression analysis
To investigate in detail the contribution of different sources to the particle population at both sites, we analyzed correlations of different variables with the concentrations of sub-3 nm particles, particles with a diameter between 3 and 7 nm (N3–7), particles with a diameter between 7 and 25 nm (N7–25), and Aitken mode particles (N25–100) (Table 3). Sub-3 nm particle concentration at the background station correlates best with the concentrations of SO2 (R=0.64 on workdays and R=0.46 on weekends) and its oxidation product SA (R=0.66 on workdays and R=0.66 on weekends), which is a common precursor of NPF. SO2 and SA also correlate well with N3–7 at the background station, having slightly lower correlation coefficients compared to sub-3 nm particles. There is no correlation between these variables and N7–25 or N25–100 at the background station. A strong negative correlation () between sub-3 nm particle concentrations and cosines of wind direction at the background station during weekends indicates that, during this time, high concentrations of sub-3 nm particles are coming more likely from south than from north. Sub-3 nm particle concentration at the street canyon correlates best with NO (R=0.65 on workdays and R=0.57 on weekends) and NOx concentrations (R=0.62 on workdays and R=0.54 on weekends). Generally, at the street canyon site, high correlations are observed between particles and species that can be associated with emissions from traffic: BC, NOx, NO, and CO2. During workdays at the street canyon site, the highest correlations for these variables are found for particles with a size between 3 and 7 nm, which corresponds to the nucleation mode peak characteristic of primary emitted particles from traffic (Rönkkö and Timonen, 2019). The correlation between sub-3 nm particles and SA at the street canyon site is also positive and relatively strong but during workdays weaker than at the background station, which is in agreement with results from the case studies. Aitken mode particle concentrations correlate well with BC during weekends at both stations, indicating that these particles have a different combustion or biomass-burning-related origin from traffic. High correlations between N25–100 and CS can be attributed to the fact that Aitken mode particles, especially those with diameters close to 100 nm, have a significant contribution to total aerosol surface area concentration and thus to CS. Overall, the correlation analysis suggests that the particle population at the street canyon site is more influenced by traffic than at the background station. This is discussed more for sub-3 nm particles in the next section.
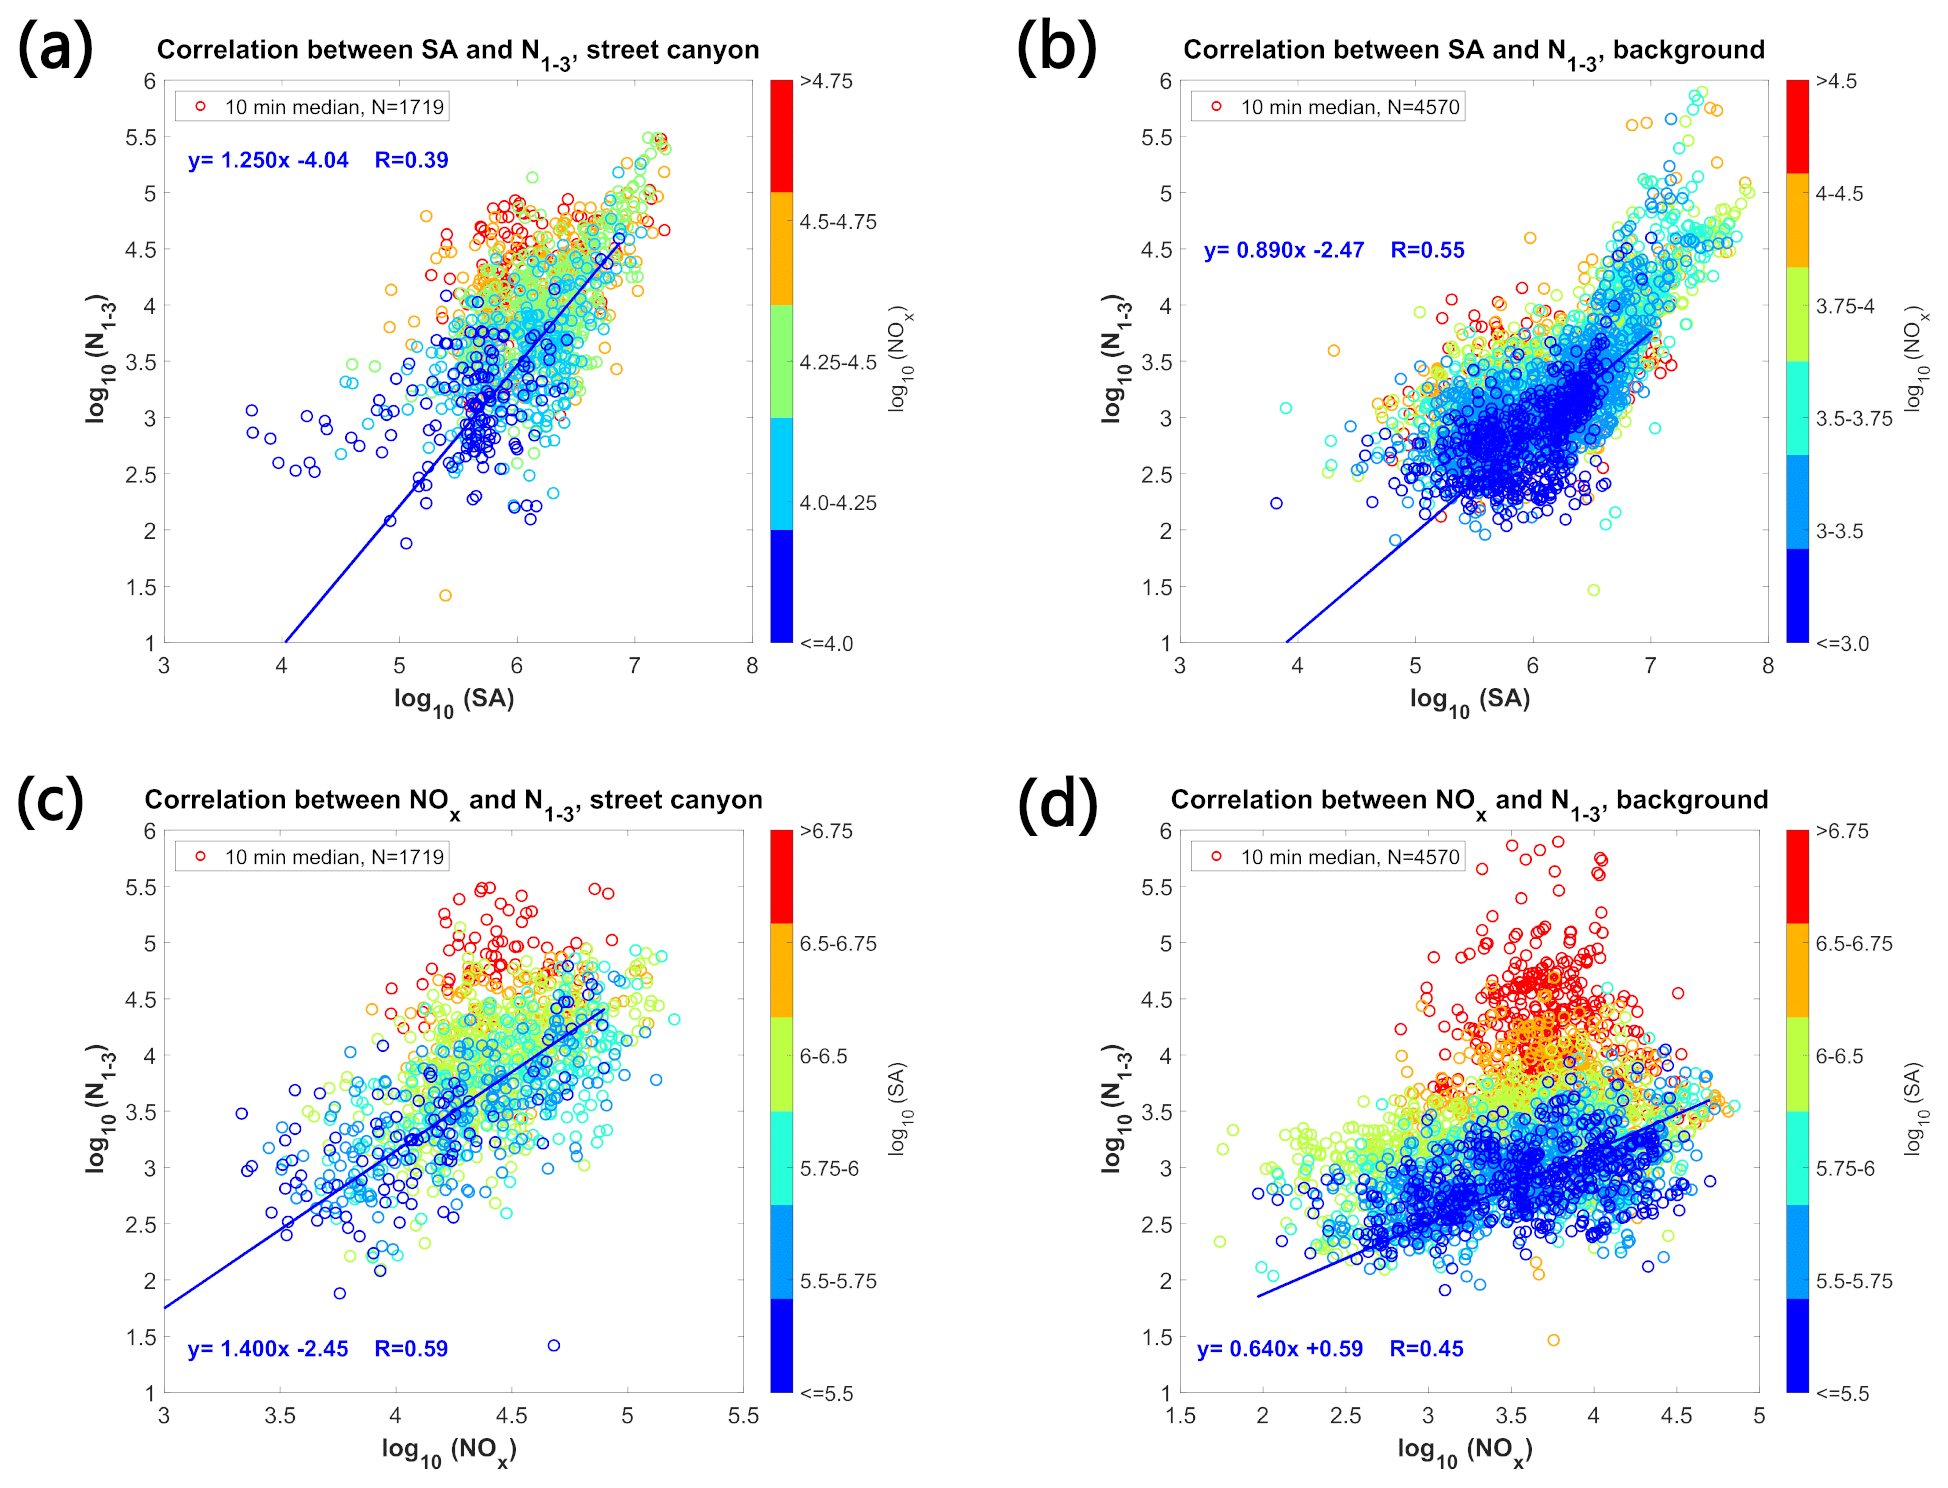
Figure 9Correlation between the logarithm of SA and the logarithm of sub-3 nm particles colored by the logarithm of NOx (a) at the street canyon and (b) at the background station, as well as the correlation between the logarithm of NOx and the logarithm of sub-3 nm particles colored by the logarithm of SA (c) at the street canyon and (d) at the background station. Blue lines represent bivariate fit done to data with the logarithm of NOx smaller than 4 at street canyon site (a) or 3 at background station (b) or data with the logarithm of SA smaller than 5.5 at both stations (c, d). The parameters of the fit are presented as an equation on the plot. Panels (c, d) have different limits of the x scale.
Table 3Correlation between logarithmic values of N1–3, N3–7, N7–25, and N25–100 and logarithmic values of other variables during weekends and workdays at the street canyon and the background station. Correlations with a Pearson's correlation coefficient higher than 0.5 are marked in bold. The sample size for this analysis is presented in Table S1 in the Supplement.
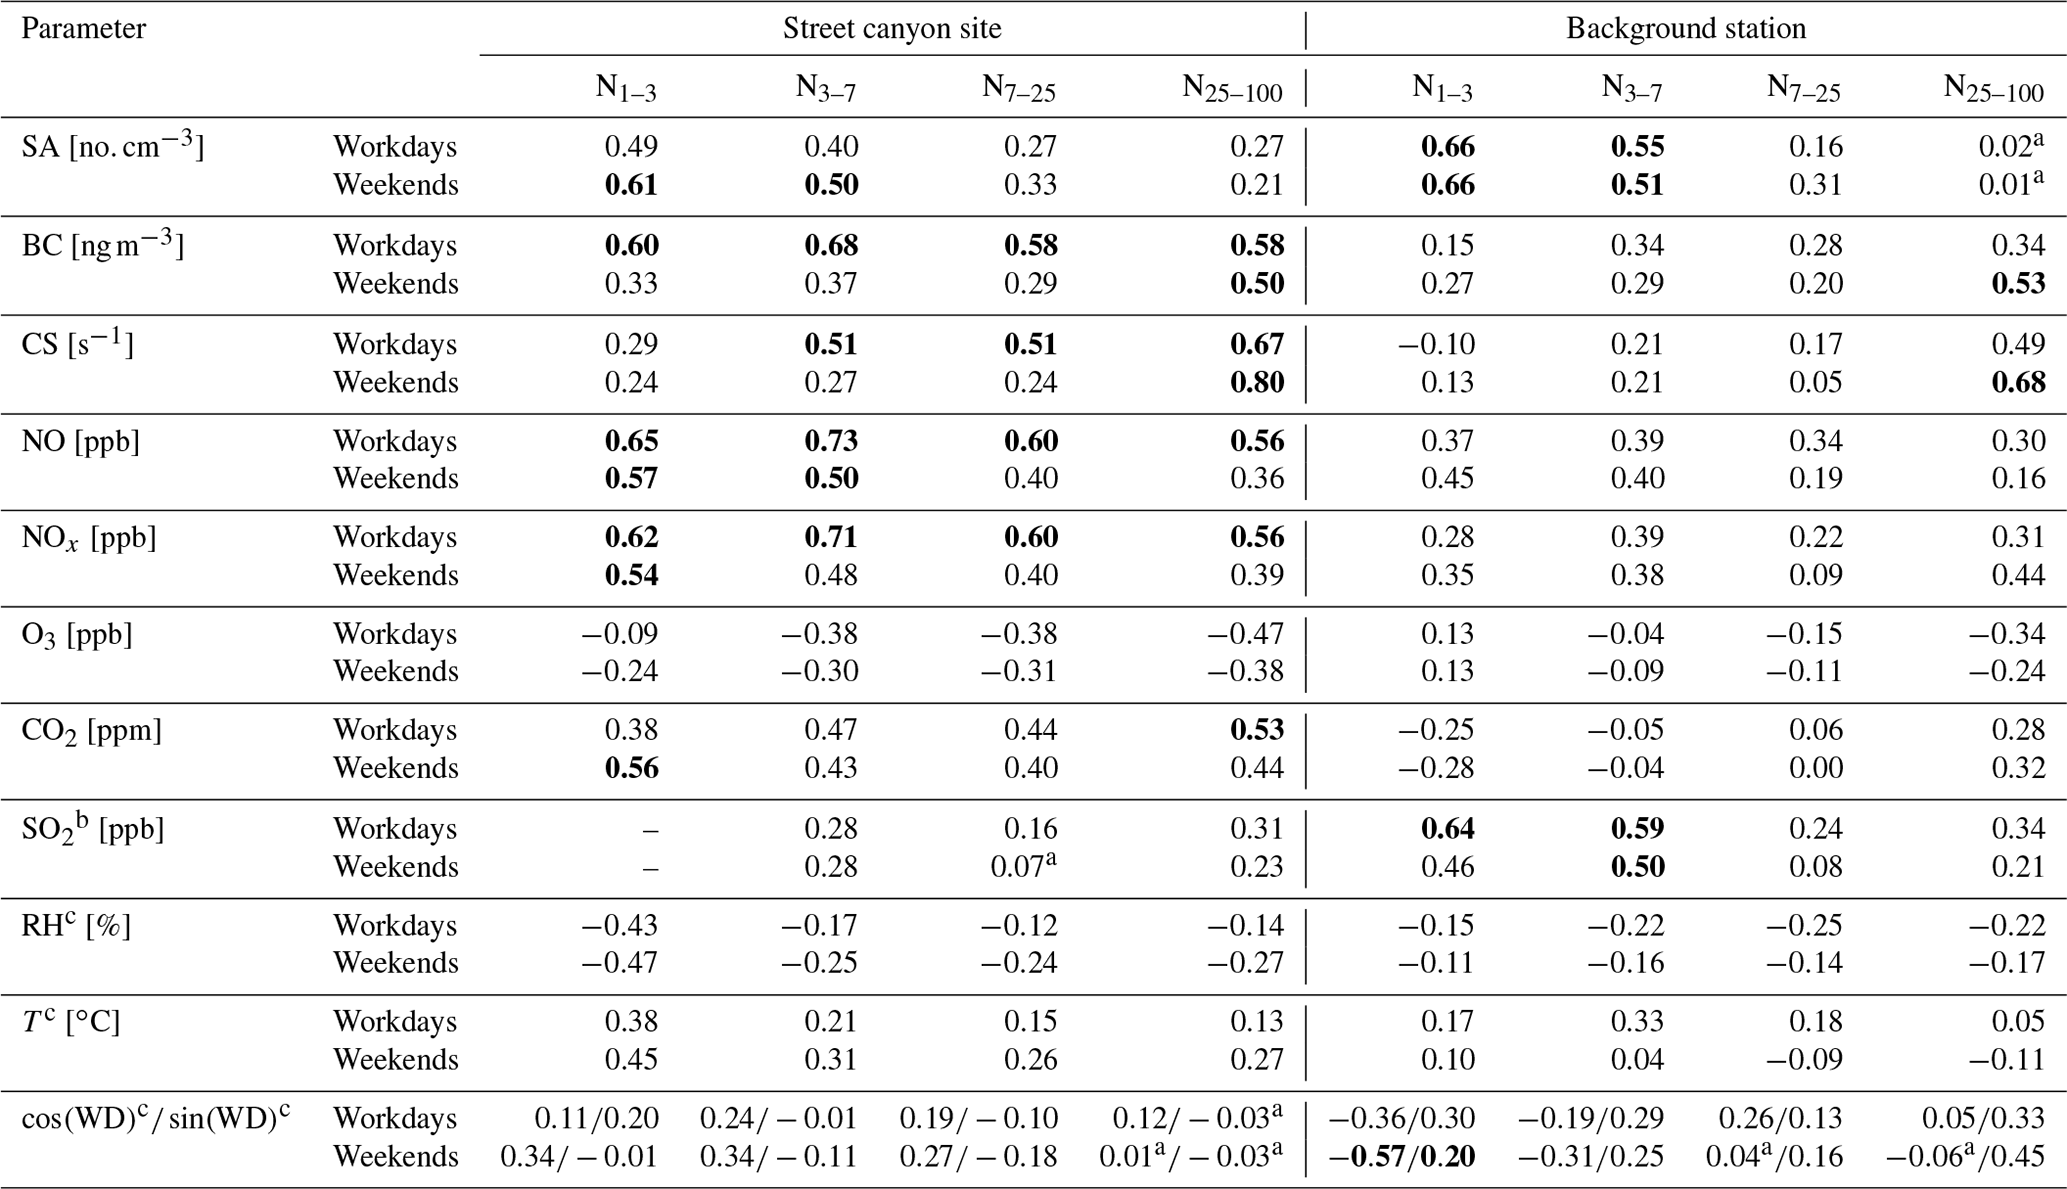
a Correlation not statistically significant at a significance level of α=0.05. b There is no overlap in measurements of SO2 and sub-3 nm particle at the street canyon site. c Correlation calculated for logarithmic values of sub-3 nm particle concentration and standard values of the parameter.
3.6 Estimation of NPF and traffic contribution to sub-3 nm particles
We used the compounds that correlate best with sub-3 nm particles at each site, SA and NOx, as tracers for NPF and traffic emissions, respectively. Using SA concentration as a tracer for NPF is based on the assumption that traffic is not a major source of SA. We justify and discuss this assumption at the end of this section. To quantify the influence of each process on sub-3 nm particle concentrations, we studied the dependency between sub-3 nm particles, SA, and NOx concentrations at both sites (Fig. 9, Table S2). We made bivariate fittings to common logarithms of NOx and sub-3 nm particles when the SA concentration was low; conversely, we analyzed common logarithms of SA and sub-3 nm particles when the NOx concentration was low. The bins were chosen for fitting so that the bin limits at both stations and the sample size in each bin are comparable, and the bin width is either 0.25 or 0.5. The parameters characterizing the chosen bins are presented in Table S2. The slopes of the bivariate fit to sub-3 nm particles and SA data for low NOx concentration are close to 1 at both stations (Fig. 9a and b). At the same time, the slope of the fit to sub-3 nm particles and NOx data for low SA concentration is considerably smaller at the background station (0.64) than at the street canyon site (1.40) (Fig. 9c and d). We investigated possible reasons for this difference such as constant background (local source) of sub-3 nm particles at the background station or losses of sub-3 nm particles due to CS or particle growth. Analysis of the correlation between NOx, SA, and total particle concentration (Fig. S13), as well as the correlations between sub-3 nm particles, NOx, SA, and CS (Figs. S14 and S15), implied that neither particle growth out of the sub-3 nm size range nor varying CS can explain the difference in the slopes between stations. One possible explanation could be a constant production of sub-3 nm particles at the background site, as a result of clustering of low-volatility organic vapors (Rose et al., 2018). Comparing ion concentrations and sub-3 nm particles at the background station indicates that the constant source of ions in the atmosphere cannot explain these high sub-3 nm particle concentrations at the background station (Fig. S16). One should keep in mind that compared ranges of NOx concentrations are different at each station. Additionally, particle evaporation may affect the comparison.
Table 4The percentiles of the relative contributions of traffic and NPF to estimated sub-3 nm particle concentrations at the background station and the street canyon. and [N1–3]SA present relative contribution of sub-3 nm particle concentrations estimated based on NOx and SA concentrations, representing the contributions of traffic and NPF, respectively. Equations used for calculating the relative contribution of each source are presented in the appendix (Eqs. A5 and A6).
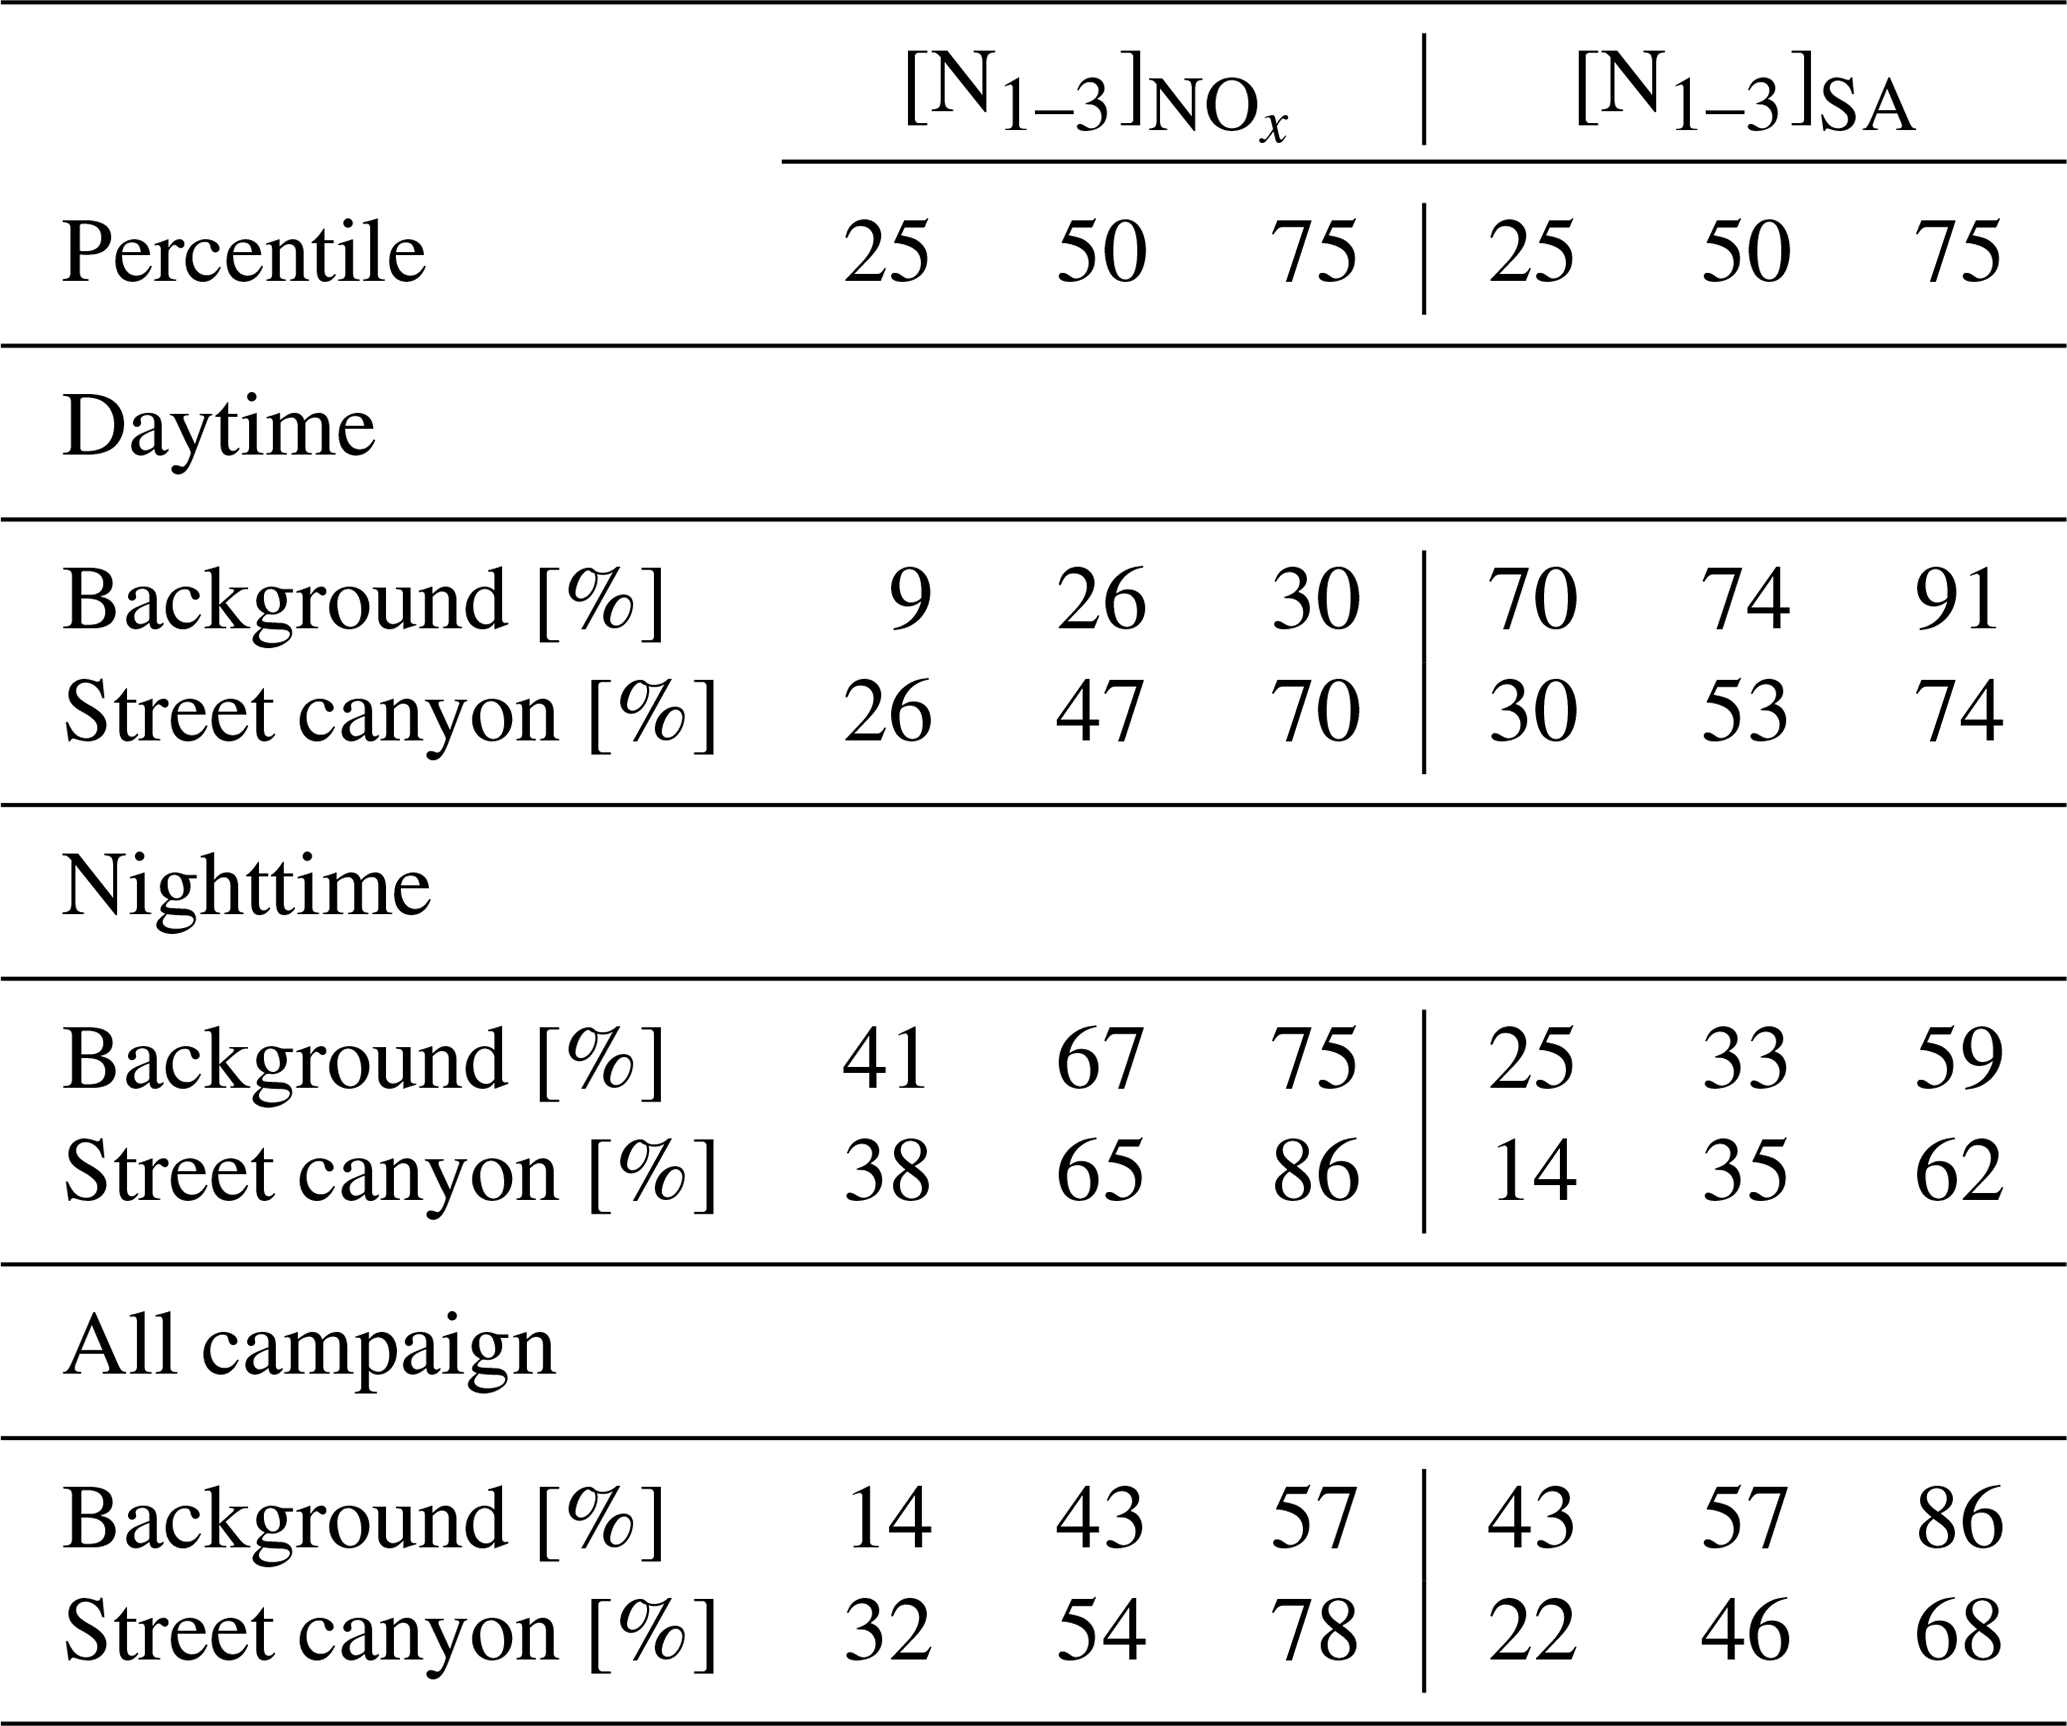
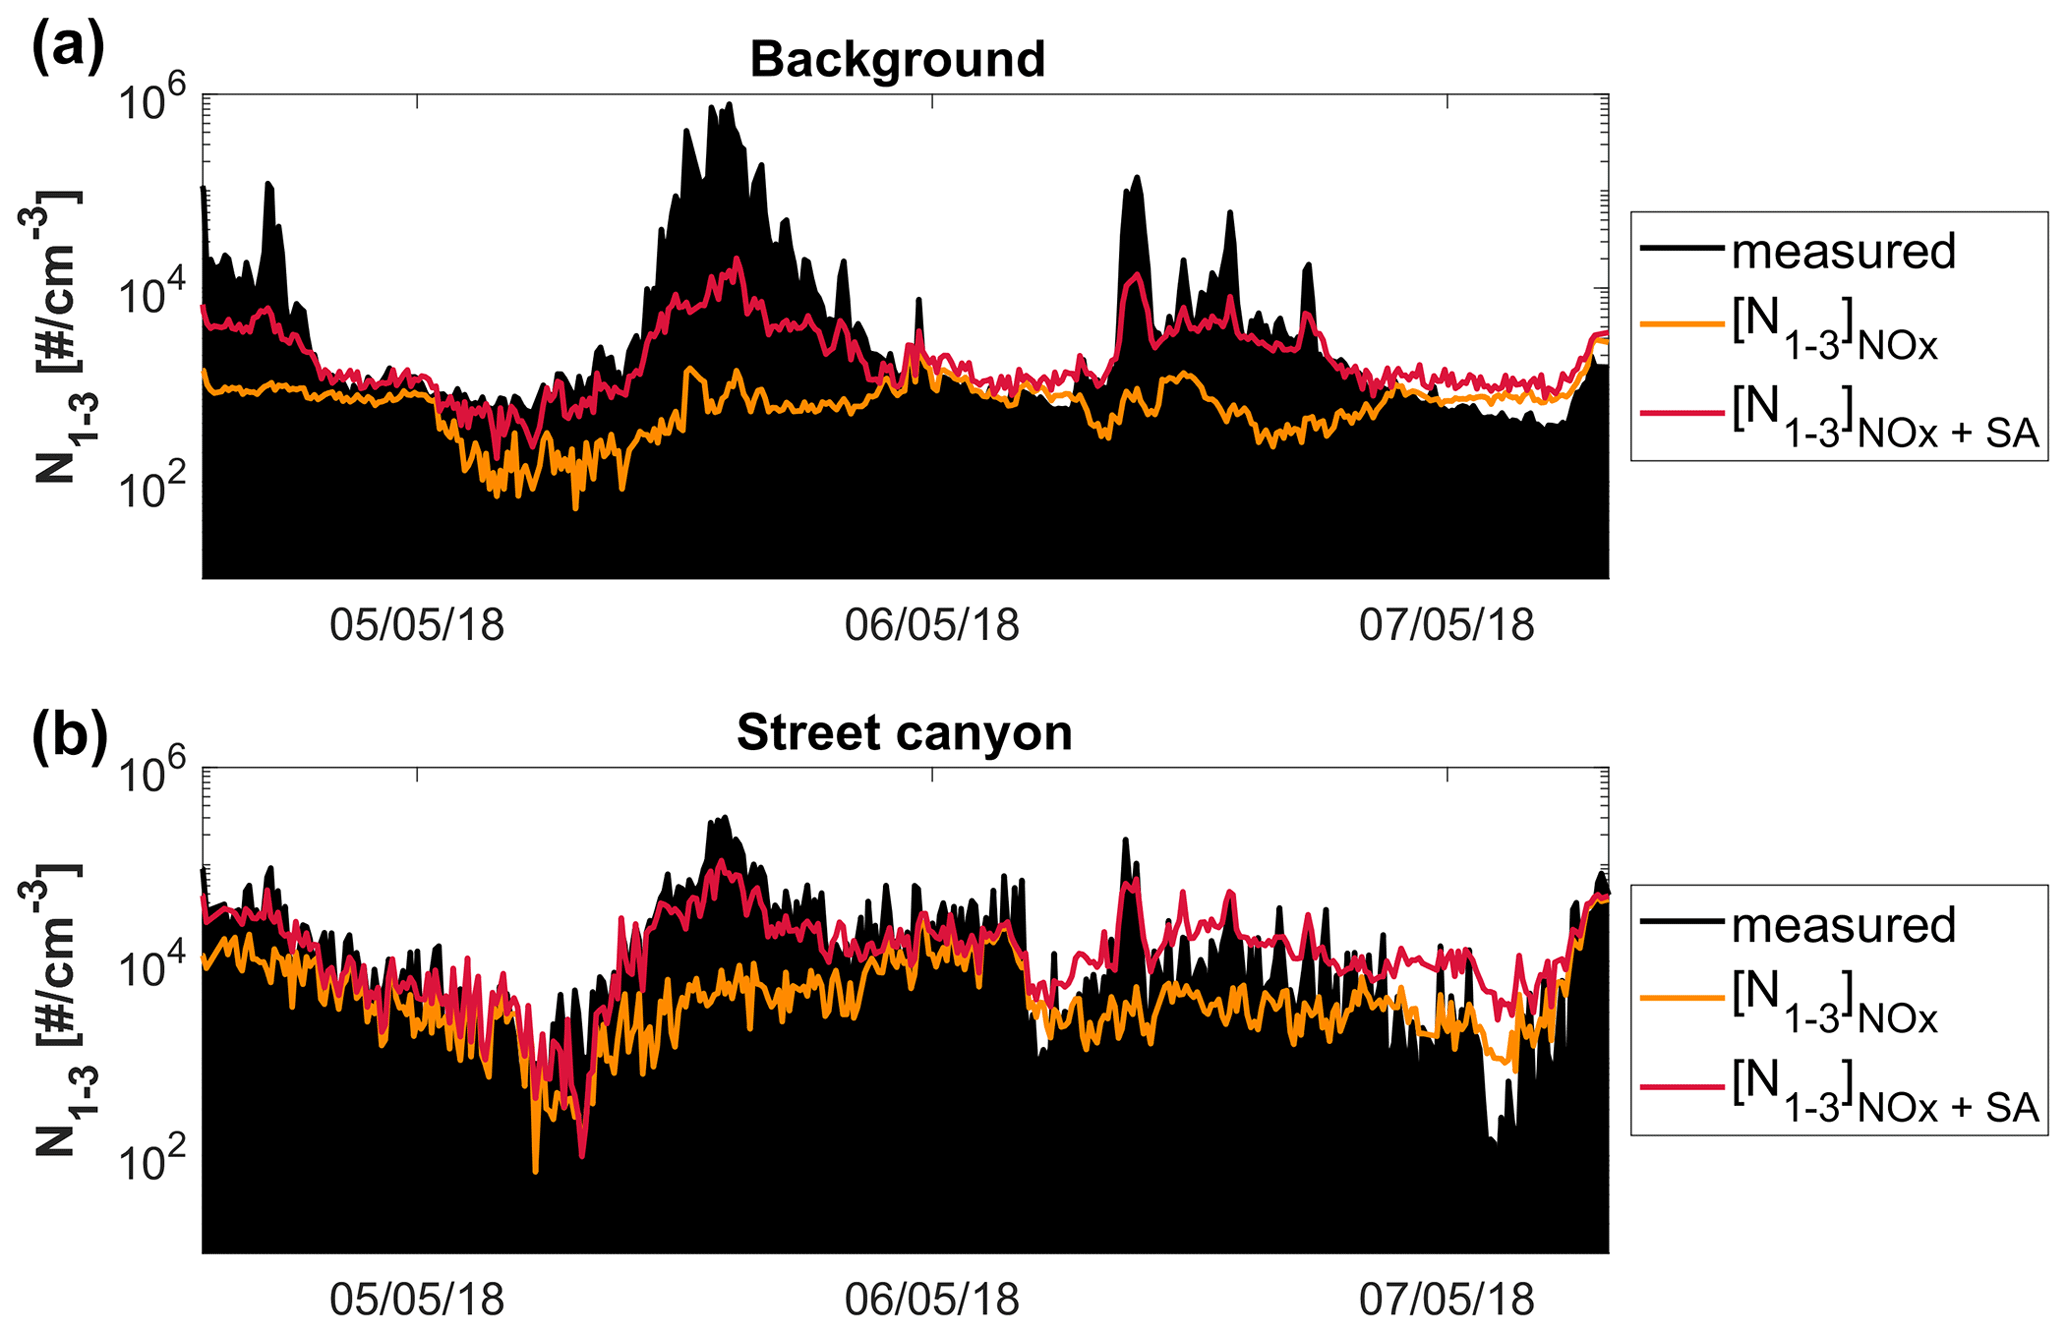
Figure 10The time series of sub-3 nm particle concentration measured during 5 May 00:00 LT–7 May 00:00 LT (black) and estimated based on NOx concentration (orange) and NOx and SA concentrations (red) (a) at the background station and (b) at the street canyon site.
Based on these bivariate fits, we estimated sub-3 nm particle concentration originating from NPF and traffic at the two sites (Table 4). The analysis was done for the time when NOx, SA, and sub-3 nm particle concentrations were measured at each station (Table A1, Fig. S17). The variability of estimated sub-3 nm particle concentration is high; occasionally, estimated concentrations exceed the measured values of sub-3 nm particle, while at other times estimated values are clearly lower than the measured values (Fig. 10). However, our estimation captures the temporal variation of the sub-3 nm particle concentrations adequately. We estimate that during the daytime (06:00–20:00 LT), a similar fraction of sub-3 nm particles originated from traffic (53 %) and NPF (47 %) at the street canyon site. At the background station, the daytime sub-3 nm particle population was dominated by particles originated from NPF (74 %). During the nighttime (20:00–06:00 LT), the influence of both sources on the sub-3 nm particle population was almost equal at the background station. At the street canyon site, sub-3 nm particles originated mainly from traffic (65 %) during the night. Overall, our results are consistent with the fact that the regional NPF process occurs over a large spatial area, while traffic emissions are local.
When discussing the estimated relative contribution of traffic and NPF to the sub-3 nm population, we should keep in mind that the conducted analysis does not consider the origin of SA. Traffic can directly or indirectly emit SA; thus, traffic may influence SA concentration used for estimating sub-3 nm particles formed during NPF. This could cause an underestimation of the relative contribution of traffic to the sub-3 nm population. In order to estimate the significance of this underestimation, we investigated the relations between SA and NOx concentrations and between NOx and N1–3. We found that even in the street canyon site, the variance in NOx concentration explained at maximum only 7 % of the daytime variance in SA concentration (Fig. S18 and Table S3), which justifies the use of SA as NPF tracer. However, Olin et al. (2020) estimated that during typical workday noon in May 2017, 1 year prior to the observations described here, 68 % of SA concentration at the same street canyon site originated from traffic, which is not in line with our observations for May 2018. The reason for this discrepancy is not known. Additionally, Olin et al. (2020) estimated that during May 2017, at typical workday noontime at the same street canyon site, the contribution of traffic to sub-3 nm particles was approximately 85 %, which is clearly higher than our estimate. The difference between our results and the ones presented by Olin et al. (2020) could be partly caused by the difference between the influence of traffic on SA concentration between the two measurement campaigns described above. Additionally, one needs to keep in mind that Olin et al. (2020) calculated the traffic contribution to the sub-3 nm particles for a typical workday, while most of our data (57.8 %) from the street canyon site were collected at the time free from work. Overall, the differences between our results and those by Olin et al. (2020) can indicate that even at the same site and at the same time of the year the emissions and formation of sub-3 nm particles may follow different mechanisms.
Generally, one should note that the estimates presented here are based on only a limited data set; therefore, it is not expected to provide a complete picture of the contributions of NPF and traffic to sub-3 nm particles in Helsinki. The relations between emissions of particles and NOx from traffic and between NPF and SA are expected to vary seasonally or as a function of temperature (Gidhagen et al., 2005; Nieminen et al., 2014); consequently, the parameters derived in this study are not expected to be valid through the year in Helsinki and even less so in other locations. For instance, NPF events are frequently observed in Finland in spring and autumn but very seldom in winter (Hussein et al., 2008), and particle emissions from traffic are expected to be higher during colder temperatures in winter (Gidhagen et al., 2005). In winter, the role of NPF events as a sub-3 nm particle source would probably be much smaller than what we estimated in this study conducted in spring.
In this study, for the first time, the particle size distribution in a diameter range from 1 to 800 nm was analyzed at two close-by stations in Helsinki. We found that the influence of traffic on particle number concentrations at the street canyon is most visible for sub-3 nm, nucleation mode, and Aitken mode particles, while at the background station the influence of traffic is clear only for sub-3 nm and nucleation mode particles. By analyzing correlations between particle concentrations and different trace gases, we conclude that sub-3 nm and nucleation mode particles are influenced by local sources, especially traffic, while accumulation mode particles are dominated by long-range transportation from non-local sources. Whether Aitken mode particles are more influenced by local or non-local sources depends on the location. At the background station, the Aitken mode is largely dominated by non-local sources, while at the street canyon site this mode is influenced by traffic.
We observed a very similar pattern in diurnal variation of SA concentration at both stations. Daytime SA concentrations were slightly higher at the background station, likely due to a lower condensation sink than at the street canyon site. During the nighttime, SA median concentration was similar at both stations.
Furthermore, we analyzed the relation of sub-3 nm particles with trace gases and meteorological variables during the whole measurement campaign. We observed that sub-3 nm particles at the background station are mainly related to SO2 and SA, while the sub-3 nm particle population at the street canyon was primarily associated with compounds linked to traffic emissions (BC, NOx, NO, and CO2) and to a lesser extent with SA. Roughly similar dependencies were obtained for the smallest nucleation mode particles in the diameter range 3–7 nm, but for 7–25 nm and Aitken mode particles the association with SO2 and SA was clearly less pronounced at both sites.
Based on our observations, we developed a new method to estimate the relative contributions of traffic and NPF to sub-3 nm particle concentration at nearby urban sites. We use NOx as a tracer for sub-3 nm particles originating from traffic and SA as a tracer for NPF particles. Our results suggest that NPF had a stronger influence on the sub-3 nm particle population than traffic at the urban background site, especially during the daytime. At the street canyon site, NPF and traffic contributed to sub-3 nm concentrations rather equally. This indicates that traffic is an important source of sub-3 nm particles, but it does not solely dominate the sub-3 nm particle population at either of the studied sites in Helsinki during the daytime in spring. However, in our estimation, we did not account for the origin of NPF precursors. SA and other low-volatility compounds can be emitted by traffic and then participate in the formation of sub-3 nm particles. For our data set, we showed that the SA emissions from traffic are clearly lower to photochemical SA formation, justifying our estimates of distinguishing traffic and NPF particles based on SA and NOx concentrations. This might not be as simple in other cases, since Olin et al. (2020) showed that at the same site in the previous spring, the traffic emissions played a much more significant role in SA concentrations.
Future studies should focus on different low-volatility compounds in an urban environment and investigate their influence on NPF. Additionally, analyzing the relative influence of different processes on the sub-3 nm particle population based on long-term measurements would be beneficial. In the future, the approach to estimate the contribution of NPF and traffic to particle number concentrations based on trace-gas concentration may be applied in other urban environments, which can improve the understanding of the effects of traffic on urban air quality. However, the variables, parameters, and functions describing the traffic and NPF contributions may vary between sites and season, which leaves the determination of more universal functions to be the scope of future studies, with longer time series from different urban areas.

Table A2Overview of additional variables used in this study measured at the background station and the street canyon site.
Calculating the relative contribution of traffic and NPF to sub-3 nm particle population
Based on bivariate fittings on the common logarithms of sub-3 nm particles and SA when NOx concentration was low at the street canyon site (Fig. 9a), we determined Eq. (A1) estimating the concentration of sub-3 nm particles formed during NPF ([N1–3]SA) at the street canyon site. The same analysis conducted for the concentrations at the background station (Fig. 9b) resulted in Eq. (A2). Correlation between common logarithms of sub-3 nm particles and NOx, when SA concentration was low, at the street canyon and background station (Fig. 9c and d) was used to determine Eq. (A3) and A4, respectively. Equations (A3) and (A4) estimate the concentration of sub-3 nm particles emitted from traffic ().
where [N1–3]SA is an estimated concentration of sub-3 nm particles formed during NPF, and [SA] is a SA concentration.
where an estimated concentration of sub-3 nm particles emitted from traffic, and [NOx] is a NOx concentration.
Based on Eqs. (A1)–(A4), the relative contribution of traffic and NPF at each site was computed. To calculate the relative contribution of traffic (), the estimated concentration of sub-3 nm particles emitted by traffic was divided by the sum of estimated concentrations of sub-3 nm particles emitted by traffic and formed during NPF (Eq. A5). Similarly, the relative contribution of NPF () was computed by dividing the estimated concentration of sub-3 nm particles formed during NPF by the sum of estimated concentrations of sub-3 nm particles emitted by traffic and formed during NPF (Eq. A6). The relative contribution of each source was calculated for the street canyon and the background station.
where is a relative contribution of traffic, is an estimated concentration of sub-3 nm particles emitted by traffic, and [N1–3]SA is an estimated concentration of sub-3 nm particles formed during NPF.
where is a relative contribution of NPF, is an estimated concentration of sub-3 nm particles emitted by traffic, and [N1–3]SA is an estimated concentration of sub-3 nm particles formed during NPF.
Data used for this study are available at https://doi.org/10.5281/zenodo.4884875 (Okuljar, 2021). DMPS, BC, O3, and meteorological data measured at the background station are available at the SmartSMEAR data repository (https://avaa.tdata.fi/web/smart, last access: 4 October 2019; Junninen et al., 2009).
The supplement related to this article is available online at: https://doi.org/10.5194/acp-21-9931-2021-supplement.
The main ideas were formulated by TP, PP, JKo, HK, and JVN, and the results were interpreted by MOk, JKo, HK, PP, and TR. HK, MA, KT, HL, and LS prepared the measurement methodology, and OG, HK, MOl, RB, HP, MA, HL, and LS contributed to data collection. MOk, HK, KT, and RB performed the data analysis. Instruments were calibrated by MOl, JKa, YJT, and RB. MS, TP, TR, HT, and JVN coordinated project, while JKo, OG, PP, JKa, and HT supervised it. MS, TP, HT, and TR made a funding acquisition. MOk visualized data and prepared the article with contributions from other authors. All the authors reviewed the article.
The authors declare that they have no conflict of interest.
Publisher's note: Copernicus Publications remains neutral with regard to jurisdictional claims in published maps and institutional affiliations.
This research was supported by the Regional innovations and experimentations funds AIKO (project HAQT, AIKO014), Business Finland (CITYZER project, Tekes nos. 3021/31/2015 and 2883/31/2015), Pegasor Oy and HSY, Academy of Finland (grant nos. 273010, 307331, 310626, 311932, 316114, 318940, 337549, 1325656, and 326437), Healthy Outdoor Premises for Everyone (HOPE), Urban Innovation Actions, Regional development funds, University of Helsinki doctoral programme (ATM-DP) and Faculty of Science 3 year grant (75284132), Tampere University of Technology graduate school (grant no. 326437), and ERA-PLANET project SMURBS (grant agreement 689443) under the EU Horizon 2020 framework.
We would like to thank the people who took care of instruments and measurements at the SMEAR III site (Pekka Rantala, Erkki Siivola, Pasi Aalto, Petri Keronen, Frans Korhonen, Tiia Laurila, Lauriane Quéléver, Tuuli Lehmusjärvi, Deniz Kemppainen) and the HSY Mäkelänkatu site (Anssi Julkunen, Anders Svens, Taneli Mäkelä, Tommi Wallenius, Anu Kousa). In addition, we thank Jiali Shen and Xucheng He for help with the calibration of CI-APi-TOF and Lei Yao for useful discussions.
This research has been supported by the Business Finland (grant nos. 3021/31/2015 and 2883/31/2015), the Academy of Finland (grant nos. 273010, 307331, 310626, 311932, 316114, 318940, 1325656, and 326437), the European Commission, Horizon 2020 framework programme (grant no. ERA-PLANET (689443)), the Helsingin Yliopisto (grant no. 75284132), and the Tampereen Teknillinen Yliopisto (grant no. 326437).
Open-access funding was provided by the Helsinki University Library.
This paper was edited by Thomas Karl and reviewed by two anonymous referees.
André, N.: Air Pollution – Related Illness: Effects of Particles, Science, 308, 804–806, https://doi.org/10.1126/science.1108752, 2014.
Andreae, M. O.: Correlation between cloud condensation nuclei concentration and aerosol optical thickness in remote and polluted regions, Atmos. Chem. Phys., 9, 543–556, https://doi.org/10.5194/acp-9-543-2009, 2009.
Arnold, F., Pirjola, L., Rönkkö, T., Reichl, U., Schlager, H., Lähde, T., Heikkilä, J., and Keskinen, J.: First online measurements of sulfuric acid gas in modern heavy-duty diesel engine exhaust: Implications for nanoparticle formation, Environ. Sci. Technol., 46, 11227–11234, https://doi.org/10.1021/es302432s, 2012.
Bousiotis, D., Dall'Osto, M., Beddows, D. C. S., Pope, F. D., and Harrison, R. M.: Analysis of new particle formation (NPF) events at nearby rural, urban background and urban roadside sites, Atmos. Chem. Phys., 19, 5679–5694, https://doi.org/10.5194/acp-19-5679-2019, 2019.
Cantrell, C. A.: Technical Note: Review of methods for linear least-squares fitting of data and application to atmospheric chemistry problems, Atmos. Chem. Phys., 8, 5477–5487, https://doi.org/10.5194/acp-8-5477-2008, 2008.
Dal Maso, M., Kulmala, M., Riipinen, I., Wagner, R., Hussein, T., Aalto, P. P., and Lehtinen, K. E. J.: Formation and growth of fresh atmospheric aerosols: Eight years of aerosol size distribution data from SMEAR II, Hyytiälä, Finland, Boreal Environ. Res., 10, 323–336, 2005.
Deventer, M. J., von der Heyden, L., Lamprecht, C., Graus, M., Karl, T., and Held, A.: Aerosol particles during the Innsbruck Air Quality Study (INNAQS): Fluxes of nucleation to accumulation mode particles in relation to selective urban tracers, Atmos. Environ., 190, 376–388, https://doi.org/10.1016/j.atmosenv.2018.04.043, 2018.
Ehn, M., Thornton, J. A., Kleist, E., Sipilä, M., Junninen, H., Pullinen, I., Springer, M., Rubach, F., Tillmann, R., Lee, B., Lopez-Hilfiker, F., Andres, S., Acir, I. H., Rissanen, M., Jokinen, T., Schobesberger, S., Kangasluoma, J., Kontkanen, J., Nieminen, T., Kurtén, T., Nielsen, L. B., Jørgensen, S., Kjaergaard, H. G., Canagaratna, M., Maso, M. D., Berndt, T., Petäjä, T., Wahner, A., Kerminen, V. M., Kulmala, M., Worsnop, D. R., Wildt, J., and Mentel, T. F.: A large source of low-volatility secondary organic aerosol, Nature, 506, 476–479, https://doi.org/10.1038/nature13032, 2014.
Eisele, F. L. and Tanner, D. J.: Measurement of the gas phase concentration of H2SO4 and methane sulfonic acid and estimates of H2SO4 production and loss in the atmosphere, J. Geophys. Res., 98, 9001–9010, https://doi.org/10.1029/93JD00031, 1993.
Fu, Y., Xue, M., Cai, R., Kangasluoma, J., and Jiang, J.: Theoretical and experimental analysis of the core sampling method: Reducing diffusional losses in aerosol sampling line, Aerosol Sci. Tech., 53, 793–801, https://doi.org/10.1080/02786826.2019.1608354, 2019.
Geels, C., Andersson, C., Hänninen, O., Lansø, A., Schwarze, P., Skjøth, C., and Brandt, J.: Future Premature Mortality Due to O3, Secondary Inorganic Aerosols and Primary PM in Europe – Sensitivity to Changes in Climate, Anthropogenic Emissions, Population and Building Stock, Int. J. Env. Res. Pub. He., 12, 2837–2869, https://doi.org/10.3390/ijerph120302837, 2015.
Gidhagen, L., Johansson, C., Langner, J., and Foltescu, V. L.: Urban scale modeling of particle number concentration in Stockholm, Atmos. Environ., 39, 1711–1725, https://doi.org/10.1016/j.atmosenv.2004.11.042, 2005.
Harrison, R. M., Beddows, D. C. S., Alam, M. S., Singh, A., Brean, J., Xu, R., Kotthaus, S., and Grimmond, S.: Interpretation of particle number size distributions measured across an urban area during the FASTER campaign, Atmos. Chem. Phys., 19, 39–55, https://doi.org/10.5194/acp-19-39-2019, 2019.
Hietikko, R., Kuuluvainen, H., Harrison, R. M., Portin, H., Timonen, H., Niemi, J. V., and Rönkkö, T.: Diurnal variation of nanocluster aerosol concentrations and emission factors in a street canyon, Atmos. Environ., 189, 98–106, https://doi.org/10.1016/j.atmosenv.2018.06.031, 2018.
Hofman, J., Staelens, J., Cordell, R., Stroobants, C., Zikova, N., Hama, S. M. L., Wyche, K. P., Kos, G. P. A., Van Der Zee, S., Smallbone, K. L., Weijers, E. P., Monks, P. S., and Roekens, E.: Ultrafine particles in four European urban environments: Results from a new continuous long-term monitoring network, Atmos. Environ., 136, 68–81, https://doi.org/10.1016/j.atmosenv.2016.04.010, 2016.
Hussein, T., Puustinen, A., Aalto, P. P., Mäkelä, J. M., Hämeri, K., and Kulmala, M.: Urban aerosol number size distributions, Atmos. Chem. Phys., 4, 391–411, https://doi.org/10.5194/acp-4-391-2004, 2004.
Hussein, T., Karppinen, A., Kukkonen, J., Härkönen, J., Aalto, P. P., Hämeri, K., Kerminen, V. M., and Kulmala, M.: Meteorological dependence of size-fractionated number concentrations of urban aerosol particles, Atmos. Environ., 40, 1427–1440, https://doi.org/10.1016/j.atmosenv.2005.10.061, 2006.
Hussein, T., Martikainen, J., Junninen, H., Sogacheva, L., Wagner, R., Dal Maso, M., Riipinen, I., Aalto, P. P., Kulmala, M., Maso, M. D., Riipinen, I., Aalto, P. P., and Kulmala, M.: Observation of regional new particle formation in the urban atmosphere, Tellus B, 60, 509–521, https://doi.org/10.1111/j.1600-0889.2008.00365.x, 2008.
Hussein, T., Junninen, H., Tunved, P., Kristensson, A., Dal Maso, M., Riipinen, I., Aalto, P. P., Hansson, H.-C., Swietlicki, E., and Kulmala, M.: Time span and spatial scale of regional new particle formation events over Finland and Southern Sweden, Atmos. Chem. Phys., 9, 4699–4716, https://doi.org/10.5194/acp-9-4699-2009, 2009.
Hyslop, N. P.: Impaired visibility: the air pollution people see, Atmos. Environ., 43, 182–195, https://doi.org/10.1016/j.atmosenv.2008.09.067, 2009.
Im, U., Brandt, J., Geels, C., Hansen, K. M., Christensen, J. H., Andersen, M. S., Solazzo, E., Kioutsioukis, I., Alyuz, U., Balzarini, A., Baro, R., Bellasio, R., Bianconi, R., Bieser, J., Colette, A., Curci, G., Farrow, A., Flemming, J., Fraser, A., Jimenez-Guerrero, P., Kitwiroon, N., Liang, C.-K., Nopmongcol, U., Pirovano, G., Pozzoli, L., Prank, M., Rose, R., Sokhi, R., Tuccella, P., Unal, A., Vivanco, M. G., West, J., Yarwood, G., Hogrefe, C., and Galmarini, S.: Assessment and economic valuation of air pollution impacts on human health over Europe and the United States as calculated by a multi-model ensemble in the framework of AQMEII3, Atmos. Chem. Phys., 18, 5967–5989, https://doi.org/10.5194/acp-18-5967-2018, 2018.
Im, U., Christensen, J. H., Nielsen, O.-K., Sand, M., Makkonen, R., Geels, C., Anderson, C., Kukkonen, J., Lopez-Aparicio, S., and Brandt, J.: Contributions of Nordic anthropogenic emissions on air pollution and premature mortality over the Nordic region and the Arctic, Atmos. Chem. Phys., 19, 12975–12992, https://doi.org/10.5194/acp-19-12975-2019, 2019.
Järvi, L., Hannuniemi, H., Hussein, T., Junninen, H., Aalto, P. P., Hillamo, R., Mäkelä, T., Keronen, P., Siivola, E., Vesala, T., and Kulmala, M.: The urban measurement station SMEAR III: Continuous monitoring of air pollution and surface-atmosphere interactions in Helsinki, Finland, Boreal Environ. Res., 14, 86–109, 2009.
Jiang, J., Chen, M., Kuang, C., Attoui, M., and McMurry, P. H.: Electrical Mobility Spectrometer Using a Diethylene Glycol Condensation Particle Counter for Measurement of Aerosol Size Distributions Down to 1 nm, Aerosol Sci. Tech., 45, 510–521, https://doi.org/10.1080/02786826.2010.547538, 2011.
Jokinen, T., Sipilä, M., Junninen, H., Ehn, M., Lönn, G., Hakala, J., Petäjä, T., Mauldin III, R. L., Kulmala, M., and Worsnop, D. R.: Atmospheric sulphuric acid and neutral cluster measurements using CI-APi-TOF, Atmos. Chem. Phys., 12, 4117–4125, https://doi.org/10.5194/acp-12-4117-2012, 2012.
Junninen, H., Lauri, A., Keronen, P., Aalto, P., Hiltunen, V., Hari, P., and Kulmala, M.: Smart-SMEAR: online data exploration and visualization tool for SMEAR stations, Boreal Environ. Res., 14, 447–457, 2009.
Junninen, H., Ehn, M., Petäjä, T., Luosujärvi, L., Kotiaho, T., Kostiainen, R., Rohner, U., Gonin, M., Fuhrer, K., Kulmala, M., and Worsnop, D. R.: A high-resolution mass spectrometer to measure atmospheric ion composition, Atmos. Meas. Tech., 3, 1039–1053, https://doi.org/10.5194/amt-3-1039-2010, 2010.
Kangasluoma, J. and Attoui, M.: Review of sub-3 nm condensation particle counters, calibrations, and cluster generation methods, Aerosol Sci. Tech., 53, 1277–1310, https://doi.org/10.1080/02786826.2019.1654084, 2019.
Kangasluoma, J. and Kontkanen, J.: On the sources of uncertainty in the sub-3 nm particle concentration measurement, J. Aerosol Sci., 112, 34–51, https://doi.org/10.1016/j.jaerosci.2017.07.002, 2017.
Kangasluoma, J., Junninen, H., Lehtipalo, K., Mikkilä, J., Vanhanen, J., Attoui, M., Sipilä, M., Worsnop, D., Kulmala, M., and Petäjä, T.: Remarks on ion generation for CPC detection efficiency studies in sub-3 nm size range, Aerosol Sci. Tech., 47, 556–563, https://doi.org/10.1080/02786826.2013.773393, 2013.
Kangasluoma, J., Kuang, C., Wimmer, D., Rissanen, M. P., Lehtipalo, K., Ehn, M., Worsnop, D. R., Wang, J., Kulmala, M., and Petäjä, T.: Sub-3 nm particle size and composition dependent response of a nano-CPC battery, Atmos. Meas. Tech., 7, 689–700, https://doi.org/10.5194/amt-7-689-2014, 2014.
Kangasluoma, J., Attoui, M., Junninen, H., Lehtipalo, K., Samodurov, A., Korhonen, F., Sarnela, N., Schmidt-Ott, A., Worsnop, D., Kulmala, M., and Petäjä, T.: Sizing of neutral sub 3 nm tungsten oxide clusters using Airmodus Particle Size Magnifier, J. Aerosol Sci., 87, 53–62, https://doi.org/10.1016/j.jaerosci.2015.05.007, 2015.
Kangasluoma, J., Samodurov, A., Attoui, M., Franchin, A., Junninen, H., Korhonen, F., Kurtén, T., Vehkamäki, H., Sipilä, M., Lehtipalo, K., Worsnop, D. R., Petäjä, T., and Kulmala, M.: Heterogeneous Nucleation onto Ions and Neutralized Ions: Insights into Sign-Preference, J. Phys. Chem. C, 120, 7444–7450, https://doi.org/10.1021/acs.jpcc.6b01779, 2016.
Kangasluoma, J., Hering, S., Picard, D., Lewis, G., Enroth, J., Korhonen, F., Kulmala, M., Sellegri, K., Attoui, M., and Petäjä, T.: Characterization of three new condensation particle counters for sub-3 nm particle detection during the Helsinki CPC workshop: the ADI versatile water CPC, TSI 3777 nano enhancer and boosted TSI 3010, Atmos. Meas. Tech., 10, 2271–2281, https://doi.org/10.5194/amt-10-2271-2017, 2017.
Kangasluoma, J., Cai, R., Jiang, J., Deng, C., Stolzenburg, D., Ahonen, L. R., Chan, T., Fu, Y., Kim, C., Laurila, T. M., Zhou, Y., Dada, L., Sulo, J., Flagan, R. C., Kulmala, M., Petäjä, T., and Lehtipalo, K.: Overview of measurements and current instrumentation for 1–10 nm aerosol particle number size distributions, J. Aerosol Sci., 148, 1–29, https://doi.org/10.1016/j.jaerosci.2020.105584, 2020.
Kangasniemi, O., Kuuluvainen, H., Heikkilä, J., Pirjola, L., Niemi, J. V., Timonen, H., Saarikoski, S., Rönkkö, T., Dal Maso, M., and Maso, M. D.: Dispersion of a traffic related nanocluster aerosol near a major road, Atmosphere, 10, 1–19, https://doi.org/10.3390/atmos10060309, 2019.
Kerminen, V.-M., Chen, X., Vakkari, V., Petäjä, T., Kulmala, M., and Bianchi, F.: Atmospheric new particle formation and growth: review of field observations, Environ. Res. Lett., 13, 103003, https://doi.org/10.1088/1748-9326/aadf3c, 2018.
Kontkanen, J., Lehtipalo, K., Ahonen, L., Kangasluoma, J., Manninen, H. E., Hakala, J., Rose, C., Sellegri, K., Xiao, S., Wang, L., Qi, X., Nie, W., Ding, A., Yu, H., Lee, S., Kerminen, V.-M., Petäjä, T., and Kulmala, M.: Measurements of sub-3 nm particles using a particle size magnifier in different environments: from clean mountain top to polluted megacities, Atmos. Chem. Phys., 17, 2163–2187, https://doi.org/10.5194/acp-17-2163-2017, 2017.
Kuang, C., McMurry, P. H., McCormick, A. V., and Eisele, F. L.: Dependence of nucleation rates on sulfuric acid vapor concentration in diverse atmospheric locations, J. Geophys. Res., 113, D10209, https://doi.org/10.1029/2007JD009253, 2008.
Kulmala, M. and Kerminen, V. M.: On the formation and growth of atmospheric nanoparticles, Atmos. Res., 90, 132–150, https://doi.org/10.1016/j.atmosres.2008.01.005, 2008.
Kulmala, M., Petäjä, T., Nieminen, T., Sipilä, M., Manninen, H. E., Lehtipalo, K., Dal Maso, M., Aalto, P. P., Junninen, H., Paasonen, P., Riipinen, I., Lehtinen, K. E. J., Laaksonen, A., and Kerminen, V. M.: Measurement of the nucleation of atmospheric aerosol particles, Nat. Protoc., 7, 1651–1667, https://doi.org/10.1038/nprot.2012.091, 2012.
Kürten, A., Rondo, L., Ehrhart, S., and Curtius, J.: Calibration of a chemical ionization mass spectrometer for the measurement of gaseous sulfuric acid, J. Phys. Chem. A, 116, 6375–6386, https://doi.org/10.1021/jp212123n, 2012.
Kuuluvainen, H., Poikkimäki, M., Järvinen, A., Kuula, J., Irjala, M., Dal Maso, M., Keskinen, J., Timonen, H., Niemi, J. V., and Rönkkö, T.: Vertical profiles of lung deposited surface area concentration of particulate matter measured with a drone in a street canyon, Environ. Pollut., 241, 96–105, https://doi.org/10.1016/j.envpol.2018.04.100, 2018.
Lehtipalo, K., Kontkanen, J., Kangasluoma, J., Franchin, A., Wimmer, D., Schobesberger, S., Junninen, H., Petäjä, T., Sipilä, M., Worsnop, D. R., Kulmala, M., Lehtipalo, K., Mikkilä, J., Vanhanen, J., Leppä, J., and Worsnop, D. R.: Methods for determining particle size distribution and growth rates between 1 and 3 nm using the Particle Size Magnifier, Boreal Environ. Res., 19, 215–236, 2014.
Maher, B. A., Ahmed, I. A. M., Karloukovski, V., MacLaren, D. A., Foulds, P. G., Allsop, D., Mann, D. M. A., Torres-Jardón, R., and Calderon-Garciduenas, L.: Magnetite pollution nanoparticles in the human brain, Proc. Natl. Acad. Sci. USA, 113, 10797–10801, https://doi.org/10.1073/pnas.1605941113, 2016.
Mårtensson, E. M., Nilsson, E. D., Buzorius, G., and Johansson, C.: Eddy covariance measurements and parameterisation of traffic related particle emissions in an urban environment, Atmos. Chem. Phys., 6, 769–785, https://doi.org/10.5194/acp-6-769-2006, 2006.
Mauldin, R. L., Tanner, D. J., Heath, J. A., Huebert, B. J., and Eisele, F. L.: Observations of H2SO4 and MSA during PEM-Tropics-A, J. Geophys. Res. Atmos., 104, 5801–5816, https://doi.org/10.1029/98JD02612, 1999.
Mylläri, F., Asmi, E., Anttila, T., Saukko, E., Vakkari, V., Pirjola, L., Hillamo, R., Laurila, T., Häyrinen, A., Rautiainen, J., Lihavainen, H., O'Connor, E., Niemelä, V., Keskinen, J., Dal Maso, M., and Rönkkö, T.: New particle formation in the fresh flue-gas plume from a coal-fired power plant: effect of flue-gas cleaning, Atmos. Chem. Phys., 16, 7485–7496, https://doi.org/10.5194/acp-16-7485-2016, 2016.
Nieminen, T., Asmi, A., Dal Maso, M., Aalto, P., Keronen, P., Petäjä, T., Kulmala, M., and Kerminen, V.-M.: Trends in atmospheric new-particle formation: 16 years of observations in a boreal-forest environment, Boreal Environ. Res., 19, 191–214, 2014.
Nosko, O., Vanhanen, J., and Olofsson, U.: Emission of 1.3–10 nm airborne particles from brake materials, Aerosol Sci. Tech., 51, 91–96, https://doi.org/10.1080/02786826.2016.1255713, 2017.
Okuljar, M.: Measurement report: The influence of traffic and new particle formation on the size distribution of 1–800 nm particles in Helsinki: a street canyon and an urban background station comparison [Data set], Zenodo, https://doi.org/10.5281/zenodo.4884875, 2021.
Olin, M., Kuuluvainen, H., Aurela, M., Kalliokoski, J., Kuittinen, N., Isotalo, M., Timonen, H. J., Niemi, J. V., Rönkkö, T., and Dal Maso, M.: Traffic-originated nanocluster emission exceeds H2SO4-driven photochemical new particle formation in an urban area, Atmos. Chem. Phys., 20, 1–13, https://doi.org/10.5194/acp-20-1-2020, 2020.
Pirjola, L., Paasonen, P., Pfeiffer, D., Hussein, T., Hämeri, K., Koskentalo, T., Virtanen, A., Rönkkö, T., Keskinen, J., Pakkanen, T. A., and Hillamo, R. E.: Dispersion of particles and trace gases nearby a city highway: Mobile laboratory measurements in Finland, Atmos. Environ., 40, 867–879, https://doi.org/10.1016/j.atmosenv.2005.10.018, 2006.
Ramanathan, V. and Feng, Y.: Air pollution, greenhouse gases and climate change: Global and regional perspectives, Atmos. Environ., 43, 37–50, https://doi.org/10.1016/j.atmosenv.2008.09.063, 2009.
Ripamonti, G., Järvi, L., Mølgaard, B., Hussein, T., Nordbo, A., and Hämeri, K.: The effect of local sources on aerosol particle number size distribution, concentrations and fluxes in Helsinki, Finland, Tellus B, 65, 19786, https://doi.org/10.3402/tellusb.v65i0.19786, 2013.
Rönkkö, T. and Timonen, H.: Overview of Sources and Characteristics of Nanoparticles in Urban Traffic-Influenced Areas, J. Alzheimers Dis., 72, 15–28, https://doi.org/10.3233/JAD-190170, 2019.
Rönkkö, T., Lähde, T., Heikkilä, J., Pirjola, L., Bauschke, U., Arnold, F., Schlager, H., Rothe, D., Yli-Ojanperä, J. and Keskinen, J.: Effects of gaseous sulphuric acid on diesel exhaust nanoparticle formation and characteristics, Environ. Sci. Technol., 47, 11882–11889, https://doi.org/10.1021/es402354y, 2013.
Rönkkö, T., Kuuluvainen, H., Karjalainen, P., Keskinen, J., Hillamo, R., Niemi, J. V., Pirjola, L., Timonen, H. J., Saarikoski, S., Saukko, E., Järvinen, A., Silvennoinen, H., Rostedt, A., Olin, M., Yli-Ojanperä, J., Nousiainen, P., Kousa, A., and Dal Maso, M.: Traffic is a major source of atmospheric nanocluster aerosol, Proc. Natl. Acad. Sci. USA, 114, 7549–7554, https://doi.org/10.1073/pnas.1700830114, 2017.
Rose, C., Zha, Q., Dada, L., Yan, C., Lehtipalo, K., Junninen, H., Mazon, S. B., Jokinen, T., Sarnela, N., Sipilä, M., Petäjä, T., Kerminen, V. M., Bianchi, F., and Kulmala, M.: Observations of biogenic ion-induced cluster formation in the atmosphere, Sci. Adv., 4, 1–11, https://doi.org/10.1126/sciadv.aar5218, 2018.
Rosenfeld, D., Lohmann, U., Raga, G. B., O'Dowd, C. D., Kulmala, M., Fuzzi, S., Reissell, A., and Andreae, M. O.: Flood or drought: How do aerosols affect precipitation?, Science, 321, 1309–1313, https://doi.org/10.1126/science.1160606, 2008.
Salma, I., Borsós, T., Weidinger, T., Aalto, P., Hussein, T., Dal Maso, M., and Kulmala, M.: Production, growth and properties of ultrafine atmospheric aerosol particles in an urban environment, Atmos. Chem. Phys., 11, 1339–1353, https://doi.org/10.5194/acp-11-1339-2011, 2011.
Seinfeld, J. H. and Pandis, S. N.: Atmospheric Chemistry and Physics: From Air Pollution to Climate Change, 3rd Edn., John Wiley & Sons, Inc., Hoboken, New Jersey, ISBN 978-1-118-94740-1, 2019.
Sgro, L. A., Sementa, P., Vaglieco, B. M., Rusciano, G., D'Anna, A., and Minutolo, P.: Investigating the origin of nuclei particles in GDI engine exhausts, Combust. Flame, 159, 1687–1692, https://doi.org/10.1016/j.combustflame.2011.12.013, 2012.
Sipila, M., Berndt, T., Petaja, T., Brus, D., Vanhanen, J., Stratmann, F., Patokoski, J., Mauldin, R. L., Hyvärinen, A. P., Lihavainen, H., and Kulmala, M.: The role of sulfuric acid in atmospheric nucleation, Science, 327, 1243–1246, https://doi.org/10.1126/science.1180315, 2010.
Tauber, C., Brilke, S., Wlasits, P. J., Bauer, P. S., Köberl, G., Steiner, G., and Winkler, P. M.: Humidity effects on the detection of soluble and insoluble nanoparticles in butanol operated condensation particle counters, Atmos. Meas. Tech., 12, 3659–3671, https://doi.org/10.5194/amt-12-3659-2019, 2019.
Tian, L., Shang, Y., Chen, R., Bai, R., Chen, C., Inthavong, K., and Tu, J.: Correlation of regional deposition dosage for inhaled nanoparticles in human and rat olfactory, Part. Fibre Toxicol., 16, 6, https://doi.org/10.1186/s12989-019-0290-8, 2019.
Vanhanen, J., Mikkilä, J., Lehtipalo, K., Sipilä, M., Manninen, H. E., Siivola, E., Petäjä, T., and Kulmala, M.: Particle Size Magnifier for Nano-CN Detection, Aerosol Sci. Tech., 45, 533–542, https://doi.org/10.1080/02786826.2010.547889, 2011.
Viggiano, A. A., Seeley, J. V., Mundis, P. L., Williamson, J. S., and Morris, R. A.: Rate Constants for the Reactions of (X=C, HC, and N) and with H2SO4: Implications for Atmospheric Detection of H2SO4, J. Phys. Chem. A, 101, 8275–8278, https://doi.org/10.1021/jp971768h, 1997.
Wang, Z. B., Hu, M., Yue, D. L., Zheng, J., Zhang, R. Y., Wiedensohler, A., Wu, Z. J., Nieminen, T., and Boy, M.: Evaluation on the role of sulfuric acid in the mechanisms of new particle formation for Beijing case, Atmos. Chem. Phys., 11, 12663–12671, https://doi.org/10.5194/acp-11-12663-2011, 2011.
Wiedensohler, A., Birmili, W., Nowak, A., Sonntag, A., Weinhold, K., Merkel, M., Wehner, B., Tuch, T., Pfeifer, S., Fiebig, M., Fjäraa, A. M., Asmi, E., Sellegri, K., Depuy, R., Venzac, H., Villani, P., Laj, P., Aalto, P., Ogren, J. A., Swietlicki, E., Williams, P., Roldin, P., Quincey, P., Hüglin, C., Fierz-Schmidhauser, R., Gysel, M., Weingartner, E., Riccobono, F., Santos, S., Grüning, C., Faloon, K., Beddows, D., Harrison, R., Monahan, C., Jennings, S. G., O'Dowd, C. D., Marinoni, A., Horn, H.-G., Keck, L., Jiang, J., Scheckman, J., McMurry, P. H., Deng, Z., Zhao, C. S., Moerman, M., Henzing, B., de Leeuw, G., Löschau, G., and Bastian, S.: Mobility particle size spectrometers: harmonization of technical standards and data structure to facilitate high quality long-term observations of atmospheric particle number size distributions, Atmos. Meas. Tech., 5, 657–685, https://doi.org/10.5194/amt-5-657-2012, 2012.
Williamson, J. H.: Least-squares fitting o f a straight line, Can. J. Phys., 46, 1845–1847, https://doi.org/10.1139/p68-523, 1968.
Winkler, P. M., Steiner, G., Vrtala, A., Vehkamäki, H., Noppel, M., Lehtinen, K. E. J., Reischl, G. P., Wagner, P. E., and Kulmala, M.: Heterogeneous nucleation experiments bridging the scale from molecular ion clusters to nanoparticles, Science, 319, 1374–1377, https://doi.org/10.1126/science.1149034, 2008.
Wlasits, P. J., Stolzenburg, D., Tauber, C., Brilke, S., Schmitt, S. H., Winkler, P. M., and Wimmer, D.: Counting on chemistry: laboratory evaluation of seed-material-dependent detection efficiencies of ultrafine condensation particle counters, Atmos. Meas. Tech., 13, 3787–3798, https://doi.org/10.5194/amt-13-3787-2020, 2020.
Wonaschütz, A., Demattio, A., Wagner, R., Burkart, J., Zíková, N., Vodička, P., Ludwig, W., Steiner, G., Schwarz, J., and Hitzenberger, R.: Seasonality of new particle formation in Vienna, Austria – Influence of air mass origin and aerosol chemical composition, Atmos. Environ., 118, 118–126, https://doi.org/10.1016/j.atmosenv.2015.07.035, 2015.
Xiao, S., Wang, M. Y., Yao, L., Kulmala, M., Zhou, B., Yang, X., Chen, J. M., Wang, D. F., Fu, Q. Y., Worsnop, D. R., and Wang, L.: Strong atmospheric new particle formation in winter in urban Shanghai, China, Atmos. Chem. Phys., 15, 1769–1781, https://doi.org/10.5194/acp-15-1769-2015, 2015.
Yao, L., Garmash, O., Bianchi, F., Zheng, J., Yan, C., Kontkanen, J., Junninen, H., Mazon, S. B., Ehn, M., Paasonen, P., Sipilä, M., Wang, M., Wang, X., Xiao, S., Chen, H., Lu, Y., Zhang, B., Wang, D., Fu, Q., Geng, F., Li, L., Wang, H., Qiao, L., Yang, X., Chen, J., Kerminen, V. M., Petäjä, T., Worsnop, D. R., Kulmala, M., and Wang, L.: Atmospheric new particle formation from sulfuric acid and amines in a Chinese megacity, Science, 361, 278–281, https://doi.org/10.1126/science.aao4839, 2018.
York, D.: Least-squares fitting of a straight line, Can. J. Phys., 44, 1079–1086, 1966.
Zhou, Y., Dada, L., Liu, Y., Fu, Y., Kangasluoma, J., Chan, T., Yan, C., Chu, B., Daellenbach, K. R., Bianchi, F., Kokkonen, T. V., Liu, Y., Kujansuu, J., Kerminen, V.-M., Petäjä, T., Wang, L., Jiang, J., and Kulmala, M.: Variation of size-segregated particle number concentrations in wintertime Beijing, Atmos. Chem. Phys., 20, 1201–1216, https://doi.org/10.5194/acp-20-1201-2020, 2020.
Zhu, Y., Hinds, W. C., Kim, S., and Sioutas, C.: Concentration and size distribution of ultrafine particles near a major highway, J. Air Waste Manage., 52, 1032–1042, https://doi.org/10.1080/10473289.2002.10470842, 2002.