the Creative Commons Attribution 4.0 License.
the Creative Commons Attribution 4.0 License.
 | 29 Jun 2021
Observations on hygroscopic growth and phase transitions of mixed 1, 2, 6-hexanetriol ∕ (NH4)2SO4 particles: investigation of the liquid–liquid phase separation (LLPS) dynamic process and mechanism and secondary LLPS during the dehumidification
Shuaishuai Ma
Zhe Chen
Yunhong Zhang
Atmospheric aerosols consisting of organic and inorganic components may undergo liquid–liquid phase separation (LLPS) and liquid–solid phase transitions during ambient relative humidity (RH) fluctuation. However, the knowledge of dynamic phase evolution processes for mixed organic–inorganic particles is scarce. Here we present a universal and visualized observation of LLPS, efflorescence and deliquescence transitions as well as hygroscopic growth of laboratory-generated mixed 1, 2, 6-hexanetriol ammonium sulfate (AS) particles with different organic–inorganic mole ratios (OIR = 1:4, 1:2, 1:1, 2:1 and 4:1) with high time resolution (0.5 s) using an optical microscope operated with a video camera. The optical images suggest that an inner AS solution phase is surrounded by an outer organic-rich phase after LLPS for all mixed particles. The LLPS mechanism for particles with different OIRs is found to be distinct; meanwhile, multiple mechanisms may dominate successively in individual particles with a certain OIR, somewhat inconsistently with previously reported observations. More importantly, another phase separation in the inner AS solution phase, defined as secondary LLPS here, is observed for OIR = 1:1, 1:2 and 1:4 particles. The secondary LLPS may be attributed to the formation of more concentrated AS inclusions in the inner phase and becomes more obvious with decreasing RH and increasing AS mole fraction. Furthermore, the changes in size and number of AS inclusions during LLPS are quantitatively characterized, which further illustrate the equilibrium partitioning process of organic and inorganic components. These experimental results have significant implications for the revelation of complex phase transitions of internally mixed atmospheric particles and evaluation of liquid–liquid and liquid–solid equilibria in thermodynamic models.
- Article
(6558 KB) - Full-text XML
-
Supplement
(16213 KB) - BibTeX
- EndNote


Atmospheric aerosols can undergo hygroscopic growth and phase transitions such as liquid–liquid phase separation (LLPS), efflorescence and deliquescence with ambient relative humidity (RH) changes (Martin, 2000; Zuend et al., 2010; Shiraiwa et al., 2013), which dominate the size, physical state and morphology of particles, further causing a significant effect on scattering and absorption of solar light (Haywood and Boucher, 2000; Yu et al., 2005; Martin et al., 2004), gas-particle partitioning of semivolatile organics (Zuend et al., 2010; Shiraiwa et al., 2013; Krieger et al., 2012), atmospheric heterogeneous chemistry such as N2O5 hydrolysis (Cosman et al., 2008; Thornton and Abbatt, 2005) and non-ideal mixing in PM2.5 (Shiraiwa et al., 2013).
Field and laboratory studies showed that atmospheric particulate matters far away from local sources is basically the internal mixtures of organic and inorganic species (Middlebrook et al., 1998; Murphy et al., 2006; Lee et al., 2002), which is established by gas-phase diffusion (Marcolli et al., 2004) and gas-particle partitioning (Zuend et al., 2010) of semivolatile organic compounds. Organic species can dominate the fine aerosol mass with a mass fraction of 20 %–50 % at continental mid-latitudes (Kanakidou et al., 2005). Sulfate (10 %–67 %) neutralized by ammonium (6.9 %–19 %) can also be measured in various regions (Zhang et al., 2007). Thus, mixed organics and ammonium sulfate (AS) particles can be regarded as model organic–inorganic mixed systems and have been previously chosen in numerous laboratory studies.
Non-ideal thermodynamic behavior between organic and inorganic components in internally mixed particles can induce LLPS into a mainly polar electrolyte-rich phase and a less polar organic-rich phase at phase separation relative humidity (SRH) (Erdakos and Pankow, 2004; Marcolli and Krieger, 2006). Recent studies also show that LLPS can occur in mixed organic systems without inorganic salts, causing more hydrophilic and less hydrophilic phases under high RH conditions (Renbaum-Wolff et al., 2016; Song et al., 2017; Liu et al., 2018). LLPS plays a significant role in morphology, chemical compositions, non-ideal mixing and gas-particle partitioning of atmospheric aerosols (Shiraiwa et al., 2013), as well as in water uptake kinetics (Marcolli and Krieger, 2006; Hodas et al., 2016). Thus far, numerous studies have explored the LLPS that occurs in mixed particles consisting of various organic and inorganic species (Song et al., 2012a, b; Ciobanu et al., 2009; Zhou et al., 2014; Bertram et al., 2011; O'Brien et al., 2015; Zuend and Seinfeld, 2012; Qiu and Molinero, 2015). As reported in the literature, the oxygen to carbon elemental ratio (O:C) of organic species in the atmosphere is in the range of ∼ 0.2 to ∼ 1.0 (Ng et al., 2010; Heald et al., 2010; Zhang et al., 2007). Bertram et al. (2011) have found that LLPS in mixed sulfate–organic particles commonly occurred when the O:C < 0.7 and in some cases might be affected by the mass ratio of organics and sulfate, while for O:C > 0.7, no LLPS was observed. Song et al. (2012a) investigated the LLPS for a series of model systems containing up to 10 organic compounds mixed with sulfate and water. They found that LLPS always occurred in the mixtures with O:C < 0.56 and never occurred for O:C > 0.80; when 0.56 < O:C < 0.80, the occurrence of LLPS depended on the types and compositions of organic functional groups. Hence, the O:C ratio is proved to be an accurate predictor for the presence of LLPS because the O:C represents the polarity of organic components and their miscibility with inorganics and water (Song et al., 2012a). Furthermore, Ciobanu et al. (2009) introduced three different mechanisms for LLPS within PEG-400 AS H2O particles depending on organic–inorganic mole ratios (OIRs), i.e., nucleation and growth (OIR = 8:1 to 2:1), spinodal decomposition (OIR = 1.5:1 to 1:1.5) and growth of a second phase from the particle surface (OIR = 1:2 to 1:8). The spinodal decomposition occurs barrier free in contrast to nucleation and growth, which has to overcome an energy barrier (Shelby, 1997; Papon et al., 1999). For nucleation and growth, subcritical nuclei are formed randomly within the liquid medium and begin to grow continuously once the critical size is attained (Ciobanu et al., 2009). Similarly, Song et al. (2012b) found that LLPS for the C7 dicarboxylic acids AS H2O particles occurred by nucleation and growth, spinodal decomposition and growth of a second phase from the particle surface when sulfate dry mass fractions are < 0.30, 0.30 to 0.60 and 0.6 to 1.0, respectively. However, few studies have focused on the equilibrium partitioning process of organic and inorganic components during LLPS.
In this work, 1, 2, 6-hexanetriol is chosen as a model organic species with O:C < 0.7. Mixed 1, 2, 6-hexanetriol (NH4)2SO4 particles can be regarded as a model system for troposphere aerosols undergoing LLPS during the RH fluctuation. A high time resolution observation on hygroscopic growth and phase transitions of mixed 1, 2, 6-hexanetriol (NH4)2SO4 particles with different OIRs (1:4, 1:2, 1:1, 2:1 and 4:1) is set up using an optical microscope with a video camera. The optical images are captured with a time resolution of 0.5 s to determine the dynamic phase transition processes and measure hygroscopic growth factors (GFs) during an RH cycle. The aims of this work are to: (1) provide insight into the LLPS dynamic process of mixed organic–inorganic particles, (2) quantitatively characterize different LLPS mechanisms for particles with different OIRs, (3) investigate the effect of organics on hygroscopic behaviors of sulfates for LLPS systems and (4) explore the morphological changes and phase evolution processes of mixed particles during an RH cycle.
2.1 Sample preparation
Five mixture solutions with different OIRs (1:4, 1:2, 1:1, 2:1 and 4:1) were prepared by dissolving 1, 2, 6-hexanetriol (99.0 % purity) and AS (99.0 % purity) into ultrapure water (18.2 MΩ cm resistivity). The mixed solutions were aspirated and then discharged by a syringe. Residual solutions in the syringe were pushed rapidly to spray the aerosol droplets onto polytetrafluoroethylene (PTFE) substrates fixed in the bottom of the sample cells in two experimental systems.
2.2 Microscopic observations of single particles
The microscopic observations of single particles were performed by an optical microscope (Nikon Ti-S, 60× objective, 1.0 numerical aperture) coupled with a video camera. A similar experiment setup has been described in detail elsewhere (Ahn et al., 2010; Song et al., 2012b) and thus only a brief description is presented here. A ∼ 14.13 cm3 sample cell was fixed above an inverted video microscope. The PTFE substrate with deposited droplets was placed on a transparent glass slice in the bottom of the sample cell. Another glass slice was fixed on the top of the sample cell to seal it. Mixed dry/wet N2 streams with changing water saturation ratios were passed through the sample cell to adjust the ambient RH. The total flow rate of N2 streams is set up to ∼ 900 sccm to rapidly reach equilibrium between the ambient RH in the sample cell and nitrogen flow RH. A hygrometer (Centertek Center 313) was used at the outlet of sample cell to monitor the RH with an accuracy of ± 2.5 %. The RH was changed continuously at an average rate of 0.06 % RH s−1–0.07 % RH s−1 in the RH range of ∼ 10 %–90 %. The optical images of monitored particles were recorded every 0.5 s with a frequency of 2 frames s−1. The size of particles with different OIRs ranged from 55 to 80 µm at ∼ 90 % RH. All measurements were performed at a room temperature of 298 ± 1 K.
2.3 Raman measurements of single particles
The Raman measurements of mixed particles were achieved using a Renishaw InVia confocal Raman spectrometer with a Leica DMLM microscope (50× objective, 0.75 numerical aperture), which has been described in detail in previous studies (F. Wang et al., 2005; X. W. Wang et al., 2017; Zhou et al., 2014). Briefly, a 514.5 nm laser and a 1800 g mm−1 grating were adopted to acquire the spectra in the range of 200–4000 cm−1 with a resolution of 1 cm−1. As mentioned above, the aerosol droplets were sprayed onto the PTFE substrate in the bottom of the sample cell. Then, the sample cell was sealed by a transparent polyethylene film. Mixed dry/wet N2 streams were used to adjust the ambient RH, which was monitored by a hygrometer (Centertek Center 313). Importantly, the RH was changed stepwise in view of the accumulation time of 30 s for each spectral measurement.
2.4 Determinations of hygroscopic GFs
The recorded images contained the information on the morphology and size of the particles. The changing particle sizes were determined using image analyzing software (ToupView X64) with a fixed pixel and size ratio. The GFs could be determined as
where DRH was the diameter of mixed particles at a given RH and D0 was the diameter of effloresced particles at < 10 % RH.
3.1 Hygroscopic growth and phase transitions of mixed particles with OIR = 1:1
3.1.1 Hygroscopic growth of the OIR = 1:1 particle
Figure 1 shows the changes in GFs and morphology of a ∼ 80 µm droplet (at ∼ 90 % RH) consisting of 1, 2, 6-hexanetriol and AS with OIR = 1:1 during an RH cycle. For the dehumidification process, the droplet is first exposed to a high RH of ∼ 91.1 % with a GF of ∼ 1.50 at the beginning (time t=0). The particle remains as one single liquid phase, as shown in Fig. 1. As RH decreases, LLPS occurs at ∼ 79.3 % RH, detected by the sudden appearance of schlieren (small separated regions), which will be discussed in detail below. After that, two liquid phases are gradually formed, i.e., an inner AS solution phase and an outer organic-rich phase. The water release continues with decreasing RH, showing a continuous reduction in GFs. The core–shell particle undergoes a crystallization transition from ∼ 47.7 % RH to ∼ 47.2 % RH. However, the particle size continues to decrease due to the continuous water release by the outer organic-rich phase consisting mainly of aqueous 1, 2, 6-hexanetriol, which can absorb and release water continuously without any phase transitions during the whole RH cycle, as shown in Fig. S1 in the Supplement. Thus, we can conclude that the nucleation of all the mixed droplets is owed to the crystallization of AS. At very low RH, the smooth surface of the particle becomes irregular. Upon hydration, the outer phase begins to take up water even at very low RH, showing that the GFs increase gradually, similarly to the hygroscopic behavior of pure 1, 2, 6-hexanetriol. At ∼ 80.2 % RH, the GFs begin to increase abruptly, indicating the dissolution of the inner AS crystal, which can also be identified by the images. Indeed, determination of deliquescence relative humidity (DRH) is always prone to uncertainties, not like the SRH and efflorescence relative humidity (ERH), because the occurrence of AS crystal dissolution is not easy to be clearly judged from the images and the turning point of humidification curve, in view of the continuous water uptake by organic coating. At ∼ 83.4 % RH, the particle has been completely deliquesced, showing only one liquid phase. Above this RH, the GFs are slightly lower than those in the dehumidification process, which should agree with the weak volatility of 1, 2, 6-hexanetriol (Lv et al., 2019).
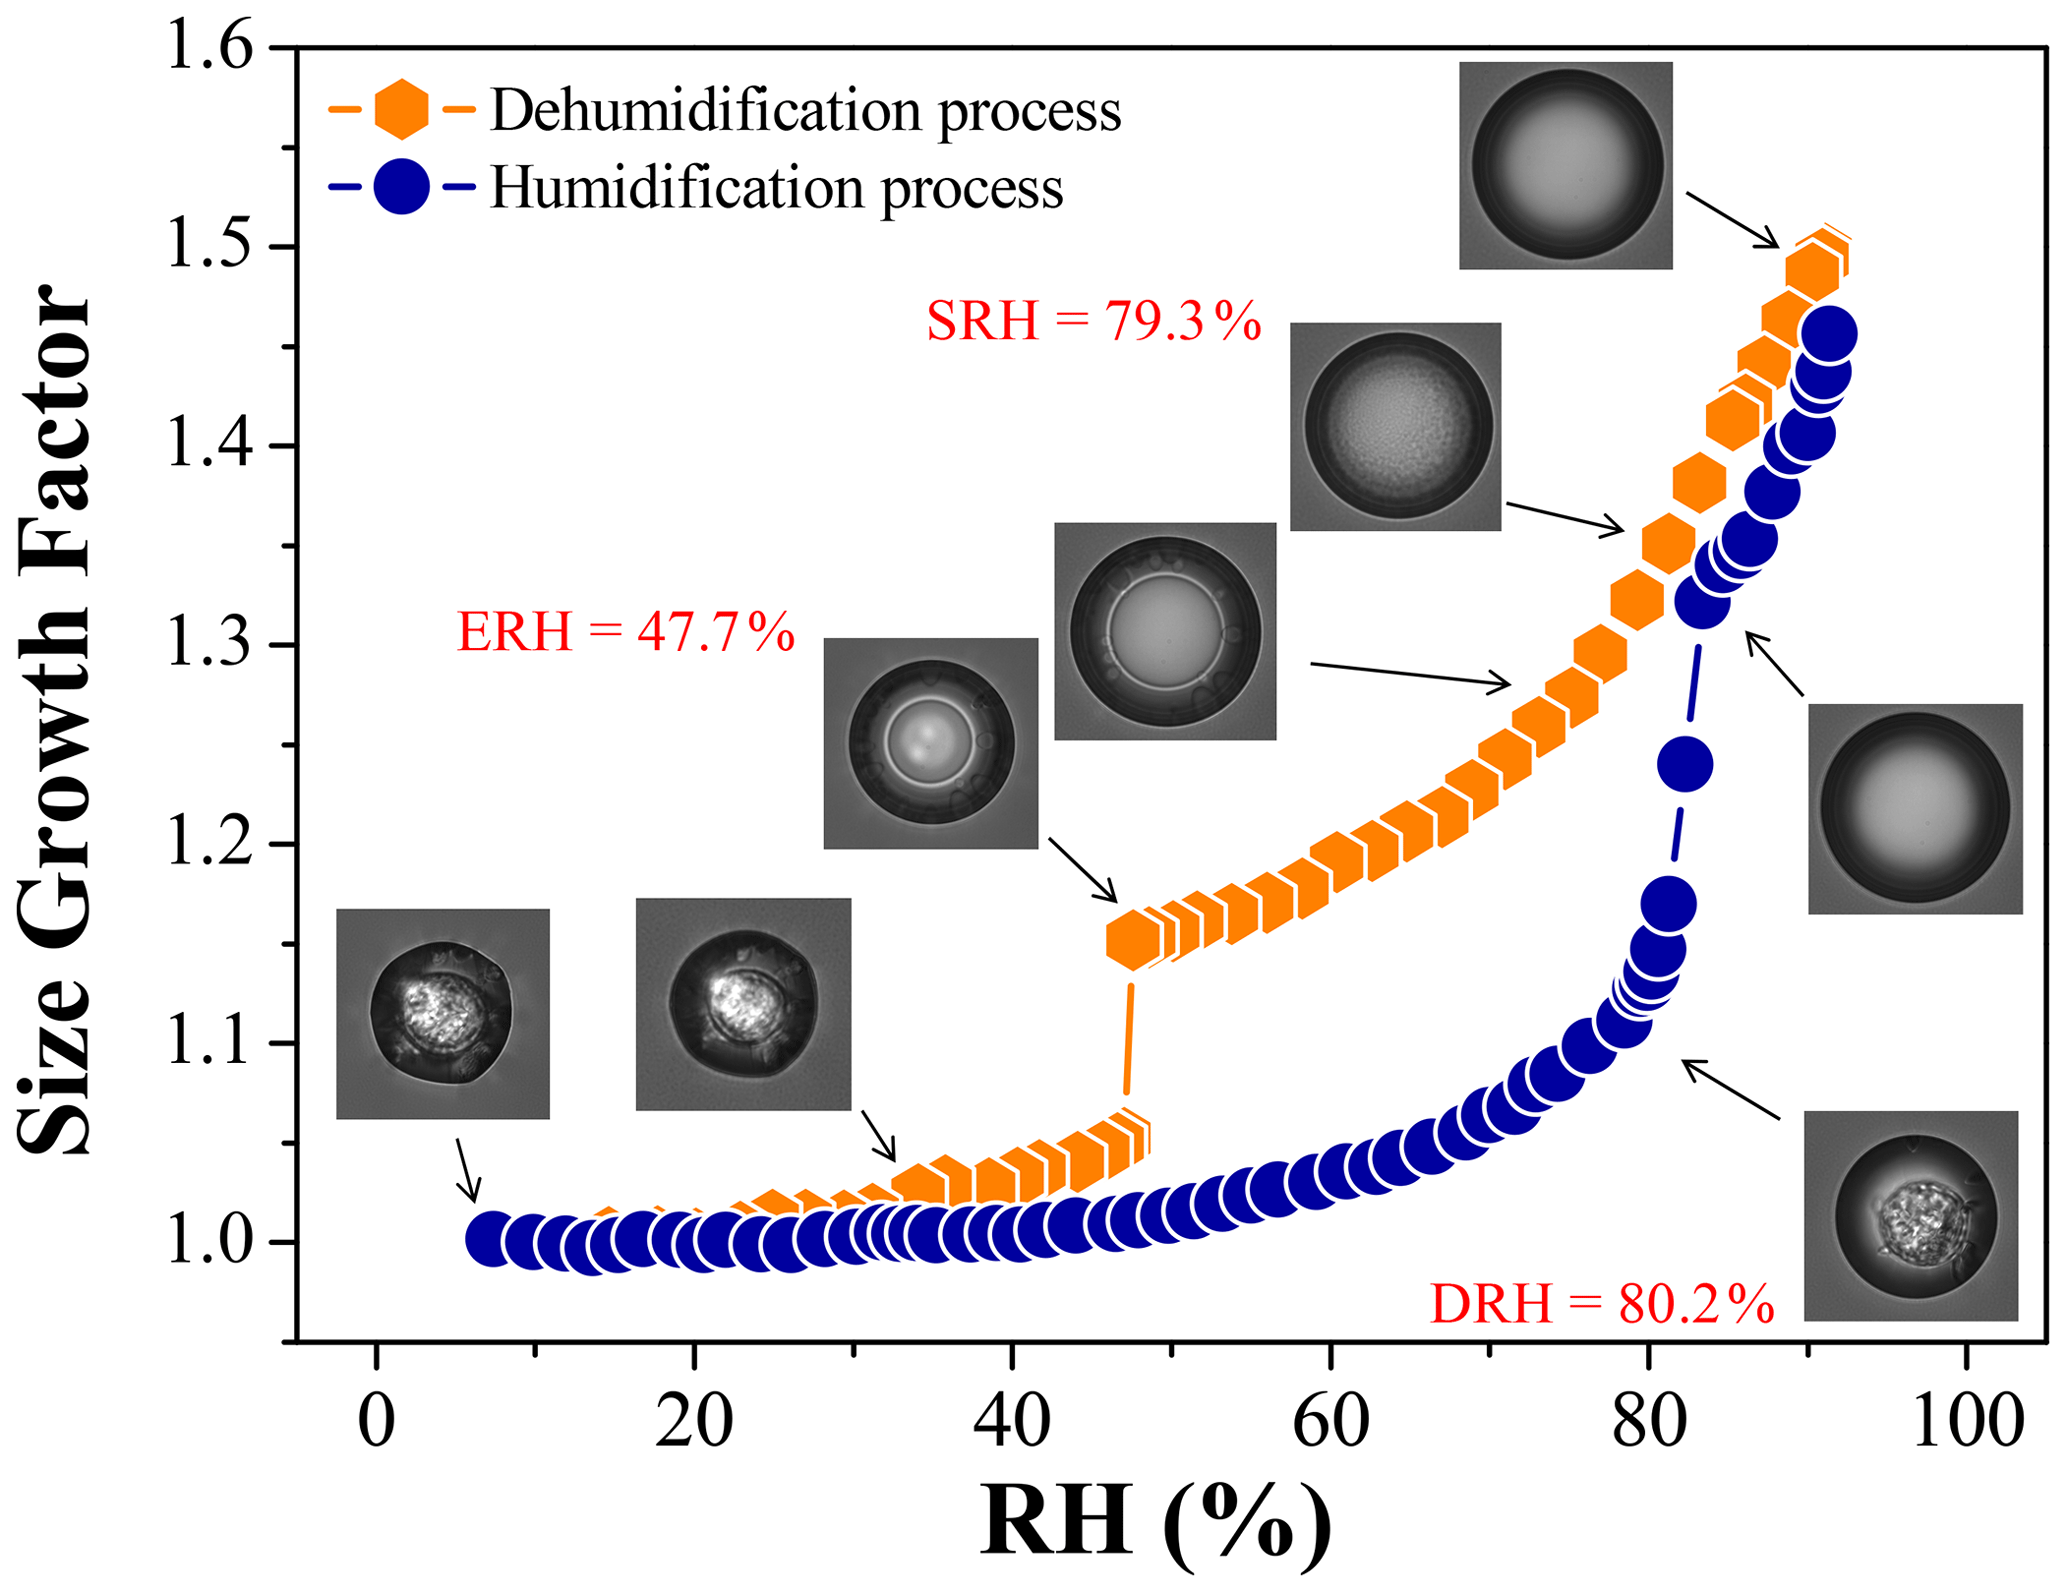
Figure 1Hygroscopic cycle of the mixed 1, 2, 6-hexanetriol AS particle with OIR = 1:1. The panels show the optical images corresponding to the GFs at a particular RH. The SRH, ERH and DRH values are given in red.
In addition, we determine the SRH, ERH and DRH of OIR = 1:1 particles with different particle diameters of 25–87 µm (∼ 90 % RH), as shown in Fig. S2 in the Supplement. The results show that the SRH does not depend on particle sizes. The DRH shows no dependency due to the large particle sizes (Gao et al., 2007; Ebert et al., 2002), considering that the DRH of particles smaller than 60 nm increases with decreasing particle sizes (Hämeri et al., 2001; Russell and Ming, 2002), while the ERH decreases slightly with the particle sizes, consistent with classical nucleation theory and earlier studies (Pant et al., 2004; Gao et al., 2006).
3.1.2 Phase transition observations for the OIR = 1:1 particle
The optical images and corresponding illustrations for the same OIR = 1:1 particle during LLPS, secondary LLPS, efflorescence and deliquescence are depicted in Fig. 2. During LLPS, the particle first exists in homogenous mixed phase at ∼ 79.4 % RH, as shown in the first frame of Fig. 2. Note that both the bright globe in the center and the dark ring at the edge are owed to the optical effect of light scattering (Bertram et al., 2011). When the RH arrives at ∼ 79.3 %, the schlieren over the whole droplet appears suddenly, indicating the onset of LLPS by spinodal decomposition. It is noteworthy that the LLPS mechanism can also be judged from the temporal changes of the number of AS inclusions (Ciobanu et al., 2009; Song et al., 2012b), which will be discussed in detail in Sect. 3.4. Then, the dispersed clusters grow and coalesce, leading to the separated inclusions consisting mainly of AS solution, followed by the coalescence of these inclusions to form an inner AS solution phase at t=275.0 s. The large aggregation coexists with amounts of small AS inclusions, meaning the phase evolution continues until an equilibrium (Ciobanu et al., 2009). From t=275.0 to 307.0 s, the AS inclusions become bigger and merge into uniform AS solution phase. At ∼ 75.2 % RH, the equilibrium partitioning is reached and the morphology containing an inner AS solution phase linked to several inclusions and an outer organic-rich shell is presented. Importantly, a secondary LLPS occurs at ∼ 68.6 % RH, showing a brighter aqueous phase present in the center of inner phase. The new phase is attributed to more concentrated AS inclusions, as confirmed by our Raman spectra in next section, and becomes more visible with decreasing RH. This is because the inner AS-rich phase first contains small amounts of organics; then, the continuous water release causes a gradual increase in sulfate concentration in the inner phase, which ultimately results in the occurrence of secondary LLPS. Based on the phase rule, the degrees of freedom of the mixed system is zero in the case of coexistence of the three liquid phases during secondary LLPS. In the phase diagram of three pairs of partially miscible systems, the concentration of the three phases cannot be changed when the three phases coexist, but the relative content of the three phases can be changed according to the position of the system points in the phase diagram. For clarity, the concentrated AS inclusions are marked with different shades of aqua in the illustrations to indicate the degree of secondary LLPS. At 61.9 % RH, the central AS inclusions can be clearly distinguished. At t=735.0 s, an AS crystal appears at the edge of the droplet, indicating the onset of efflorescence at 47.7 % RH. The following crystallization of the AS phase and inclusions proceed until 47.2 % RH. Upon hydration, the solid AS crystals begin to dissolve at the DRH of ∼ 80.2 % and are deliquesced completely at ∼ 83.4 % RH. Note that the effloresced particle transfers into the homogenous mixed phase without LLPS after deliquescence because the DRH of AS crystals is above the SRH of the mixed particle.
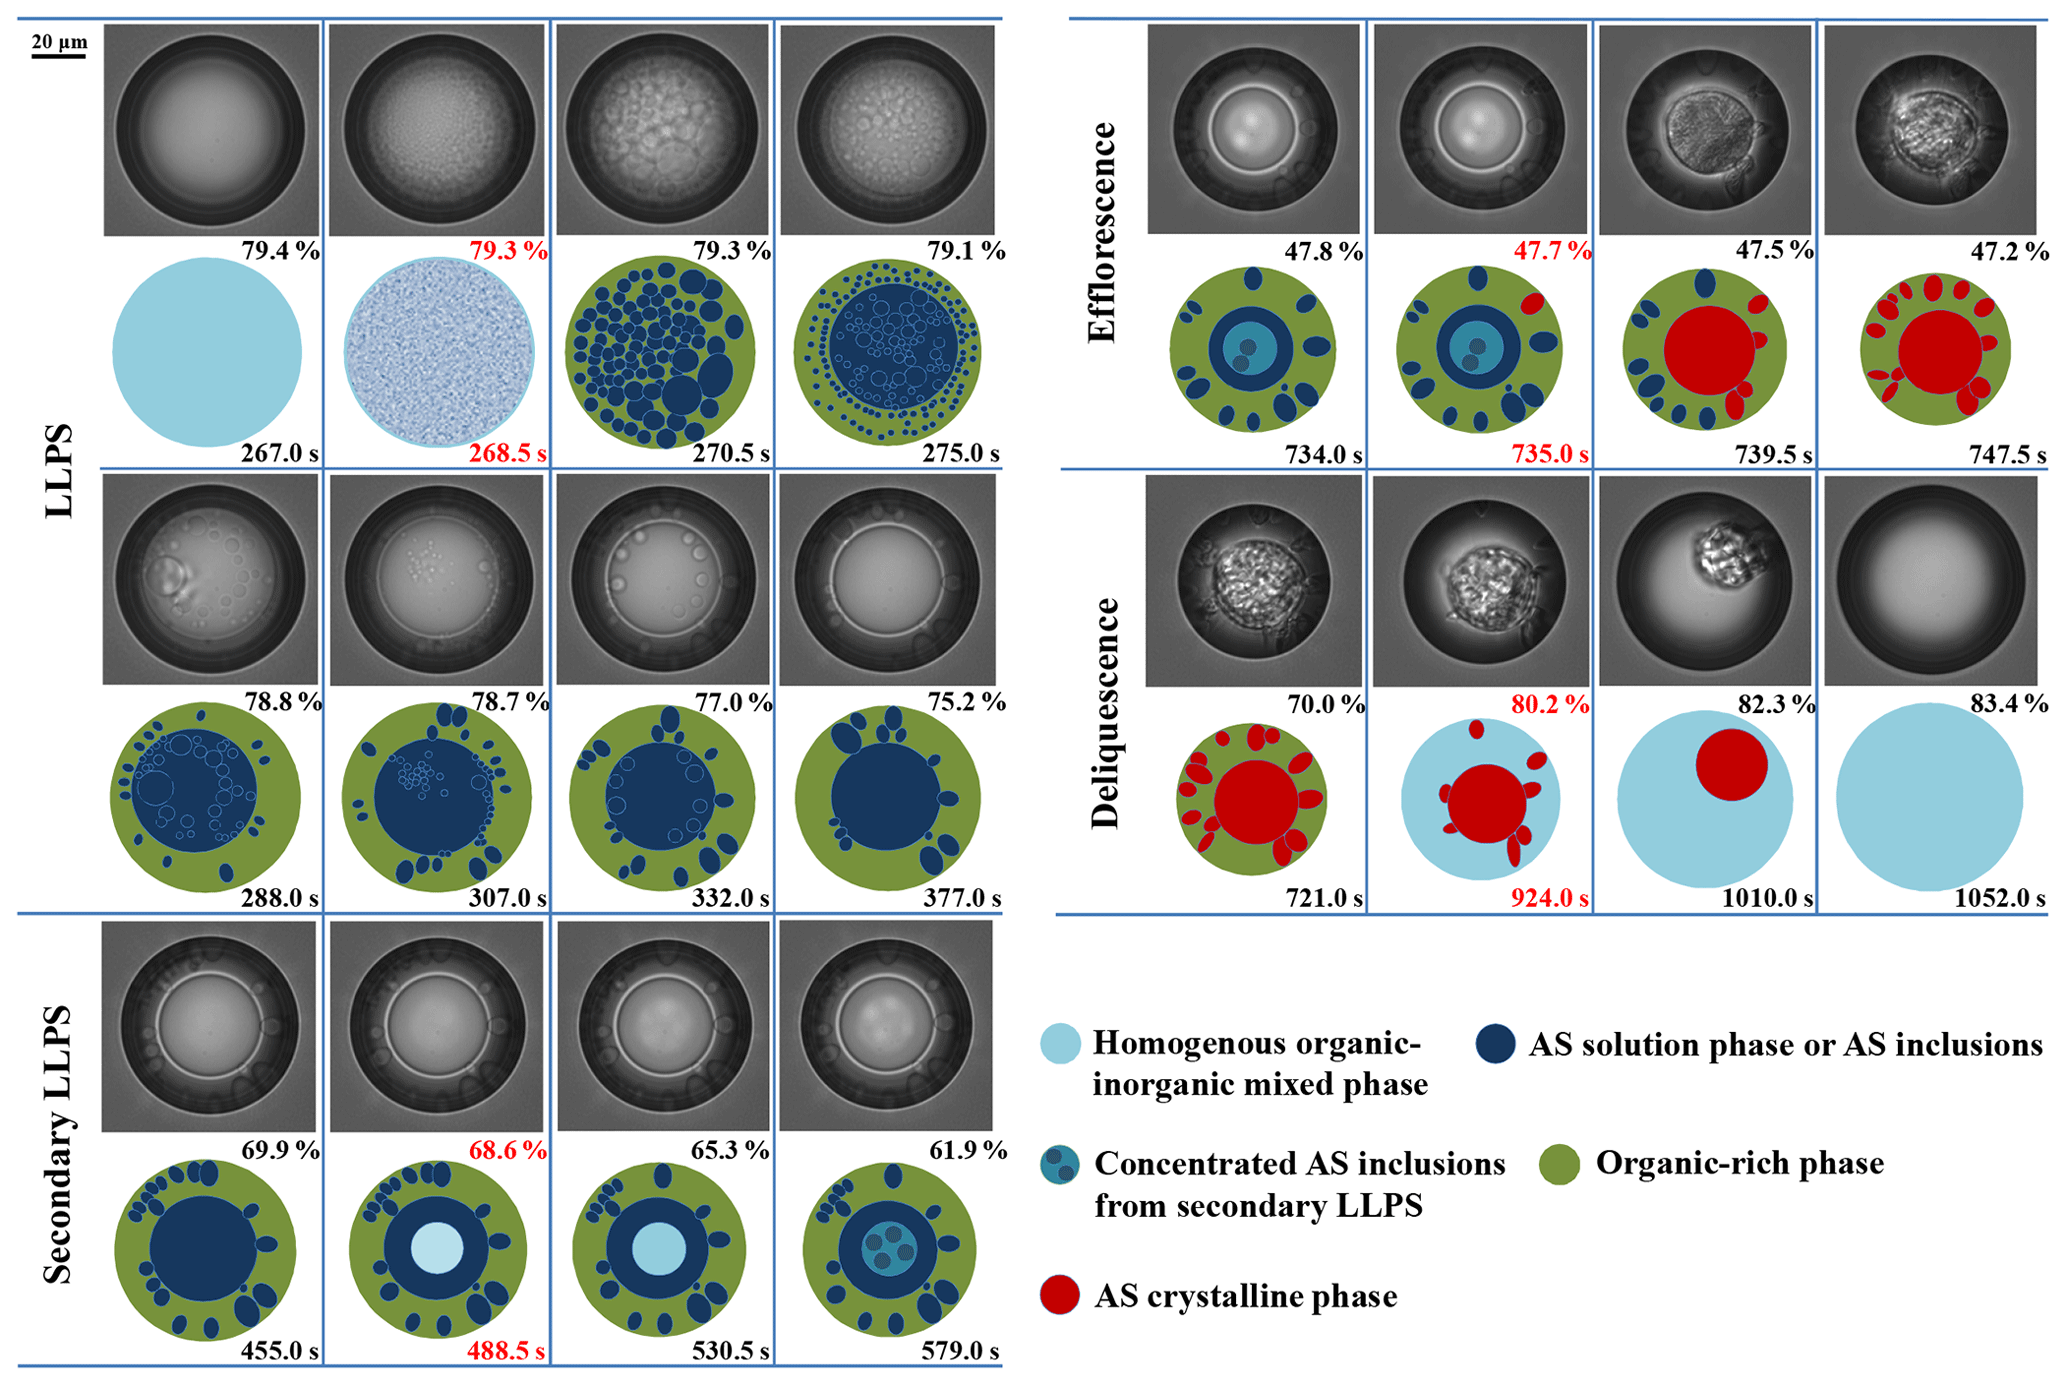
Figure 2Optical images and corresponding illustrations of the mixed 1, 2, 6-hexanetriol AS particle with OIR = 1:1 during LLPS, secondary LLPS, efflorescence and deliquescence. Below the optical images are the illustrations. The corresponding RH and time are given in each frame. The RH and time in red indicate the occurrence of phase transitions.
3.1.3 Raman spectra analysis of the OIR = 1:1 particle
To clearly illustrate the LLPS and secondary LLPS of mixed particles, Raman spectra acquired on the surface and at the center of the OIR = 1:1 particle are collected at constant RH. The dehumidification process is shown in Fig. 3a and humidification process for the effloresced particle is shown in Fig. 3b. Next to the spectra are the high-quality images corresponding to the same RH conditions from video microscopy, not the low-resolution images by the Leica DMLM microscope (Fig. S3 in the Supplement). As seen in Fig. 3, the O–H stretching vibration, ν(O–H), of liquid water is identified at 3170–3715 cm−1. The bands at 980 and 975 cm−1 are assigned to the symmetric stretching vibration of SO, νs(SO, in the solution and crystalline states, respectively. The band of C–H stretching vibration, ν(C–H), of 1, 2, 6-hexanetriol is observed at 2798–2995 cm−1. Based on these, the intensity ratios of the νs(SO band to ν(C–H) band are determined and depicted in Fig. 3c to identify the component distribution of the mixed particle. For the dehumidification process, the particle first exists as only one liquid phase at ∼ 85.3 % RH, confirmed by almost identical intensity ratios of a1, a2 and a3. Then, two separated phases are presented at ∼ 77.0 % RH. It is clear that the intensity ratio at the center increases significantly, and the intensity ratio of a5 is much higher than that of a4 and a6, indicating the morphology of an AS solution phase surrounded by an organic-rich shell. Note that the signatures of both sulfate and organics can be observed in spectra a4–a6, suggesting there is a small amount of AS and 1, 2, 6-hexanetriol present in the organic-rich and sulfate-rich phases, respectively. As the RH decreases to 68.1 % and 58.2 %, the intensity ratio at the center increases to 6.07 and 8.17, respectively, about 2–4 times higher than that of a5, demonstrating the formation of more concentrated AS inclusions in the inner phase. When the RH increases to 76.3 % after the particle is fully effloresced, there is an AS crystalline phase in the center and an organic-rich phase in the shell, as identified by the spectra b1–b3. Notably, the band intensity of C–H in b2 is much higher than that in a5, a7 and a8, implying the presence of 1, 2, 6-hexanetriol in the veins of the AS crystal as discussed below. At 84.5 % RH, the intensity ratios of b4, b5 and b6 are almost the same, indicating the full deliquescence of the particle.
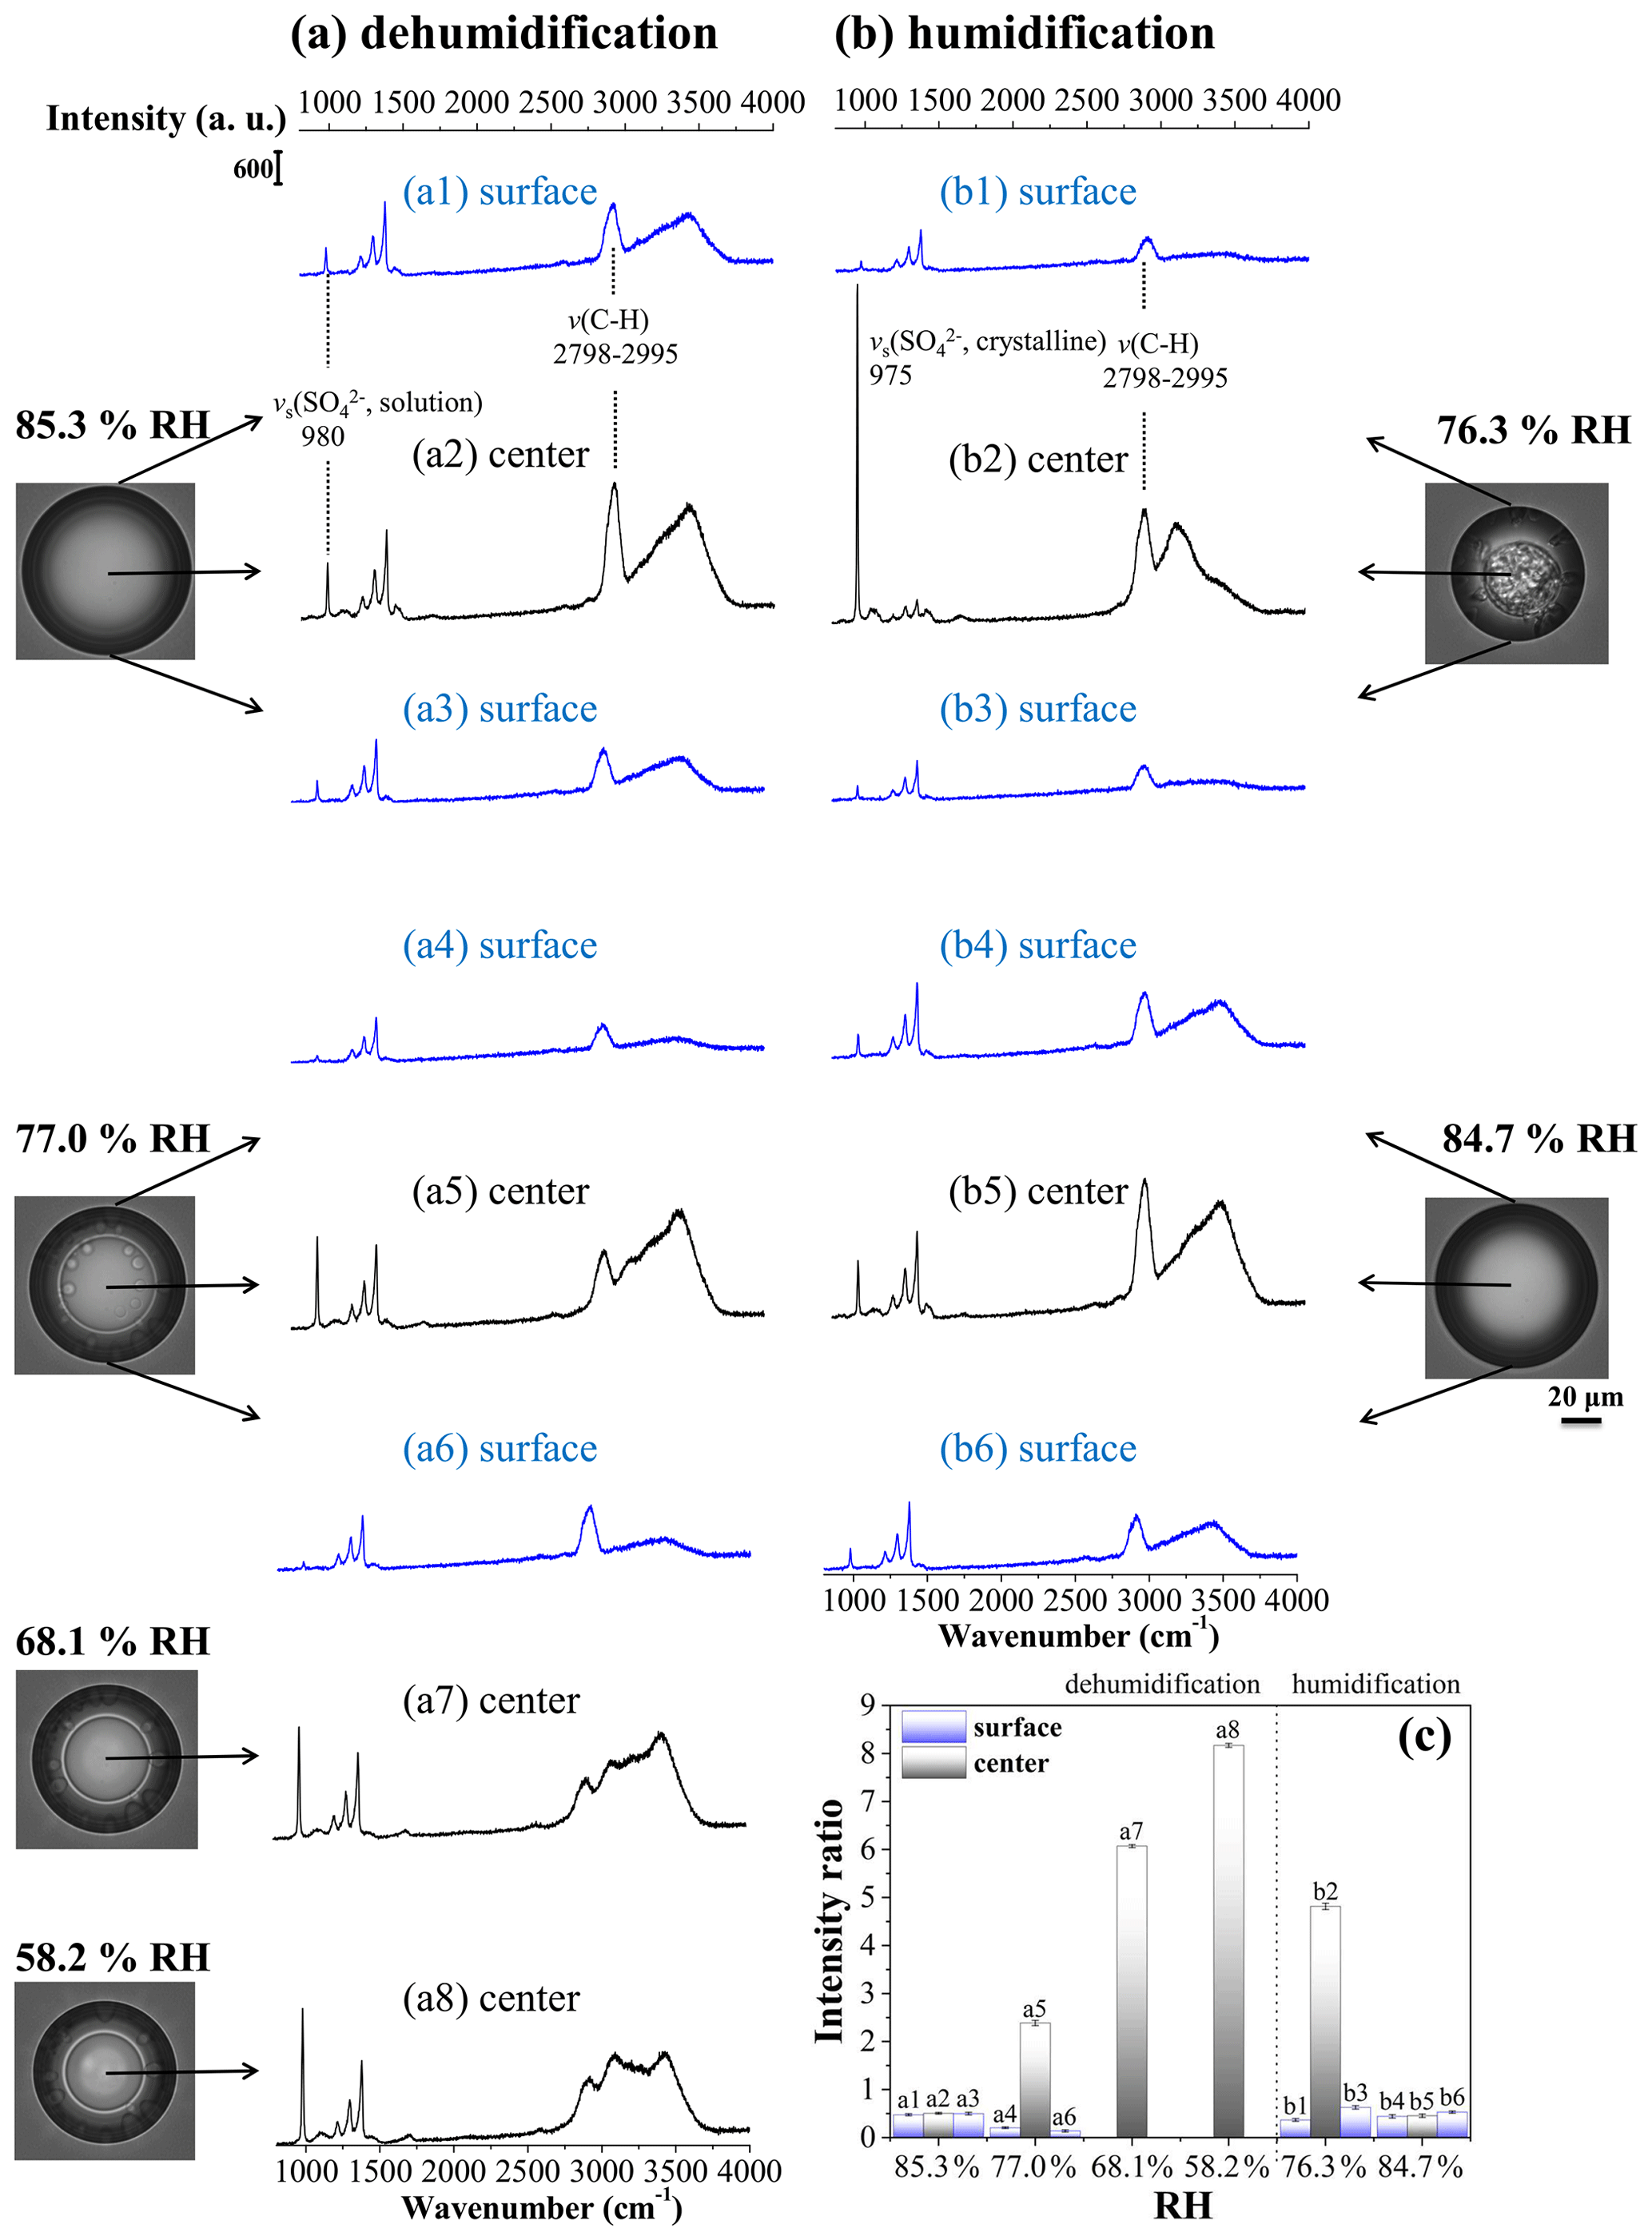
Figure 3Raman spectra acquired on the surface (blue) and at the center (black) of the OIR = 1:1 particle during dehumidification (a) and humidification (b), as well as intensity ratios of νs(SO band to ν(C–H) band among all the spectra (c). Note that the value of b2 in (c) represents the intensity ratio of the stretching vibration bands of crystalline SO to C–H. The corresponding microscopic images are shown near the spectra.
3.2 Hygroscopic growth and phase transitions of mixed particles with OIR = 1:4 and 1:2
3.2.1 Hygroscopic growth of OIR = 1:4 and 1:2 particles
Figure 4a and b display the GF changes and morphological changes in an RH cycle for mixed 1, 2, 6-hexanetriol AS particles with OIR = 1:4 and 1:2, respectively. The hygroscopic growth of the OIR = 1:4 particle follows an entirely different route from the OIR = 1:1 particle. First, the GF decreases in an approximately linear manner upon dehydration until ∼ 46.4 % RH. Then, the onset and end of efflorescence is in a very narrow RH range around 46.4 %, meaning a faster crystal growth due to the weaker transfer limitation of water molecules, in view of the thinner viscous organic-rich shell for the OIR = 1:4 particle. Finally, the particle size remains constant until 84.0 % RH and then increases steeply to the initial size. However, the DRH of the mixed particle is ∼ 80.2 %, as identified by the occurrence of AS crystal dissolution with almost unchanged particle size under ∼ 80.2 % RH shown in the optical images. Coupled with the morphological changes upon crystallization (Fig. S4 in the Supplement), we can conclude that aqueous 1, 2, 6-hexanetriol will enter into the veins of the AS crystal and then be enclosed by a crystalline AS crust; namely, the organics may be trapped within the AS crystalline phase after crystallization(Sjogren et al., 2007; Ciobanu et al., 2009). Likewise, Sjogren et al. (2007) reported that effloresced AS crystals could exist in the veins or could even be enclosed with organics. Ciobanu et al. (2009) introduced that liquid PEG-400 could be trapped by the solid AS for the PEG-400/AS particle with OIR = 1:2. Song et al. (2012b) found that the outer organic-rich phase was sucked into the cavities of the inner AS crystal due to capillary forces. Upon hydration, the GFs after full deliquescence overlap with those in the dehumidification process, suggesting almost no volatilization of 1, 2, 6-hexanetriol due to capture by the AS crystal. For the particle with OIR = 1:2, LLPS occurs at ∼ 73.4 % RH and ends at ∼ 73.2 % RH. After that, the GFs decrease gradually until 41.9 % RH, at which point a rapid reduction in GFs appears. Hence, the ERH is ∼ 41.9 %. Upon hydration, a gradually faster increase in GFs is apparent first, together with the transition of particle morphology from irregular to spherical-like. The dissolution of the inner AS crystal begins at ∼ 77.3 % RH, judged mainly from the optical images.
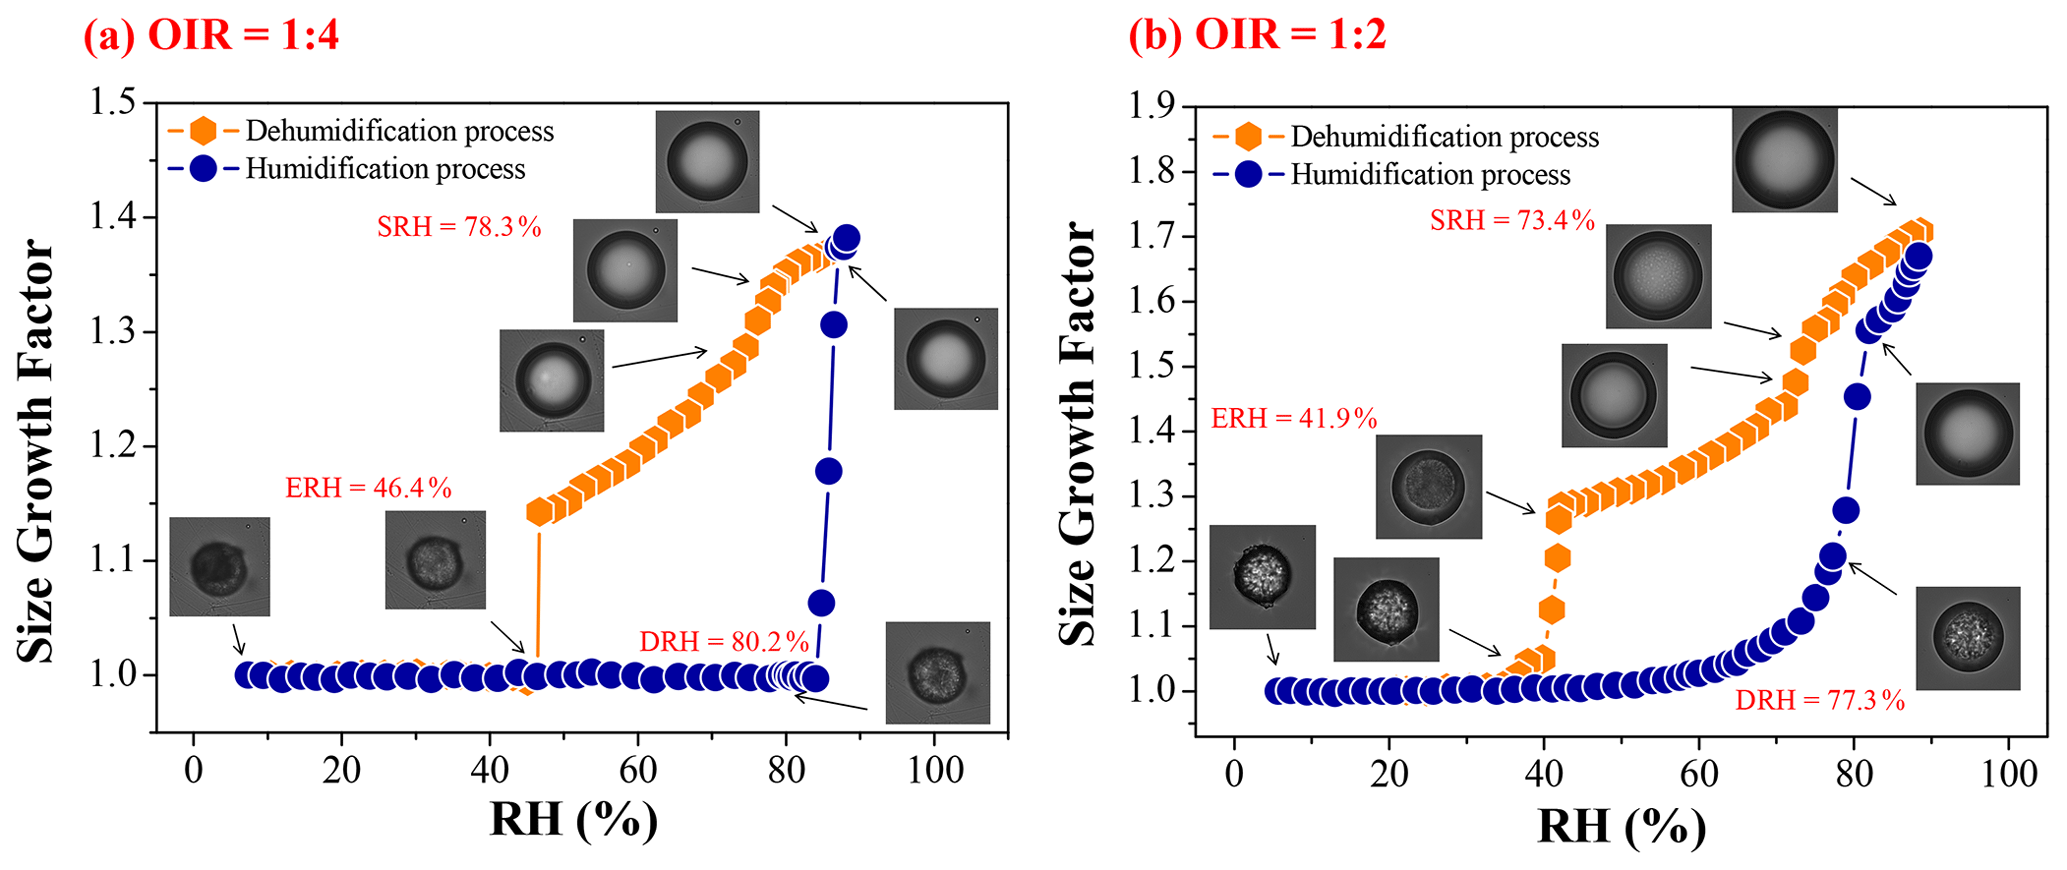
Figure 4Hygroscopic cycles of mixed 1, 2, 6-hexanetriol AS particles with OIR = 1:4 (a) and 1:2 (b). The panels show the optical images corresponding to the GFs at a particular RH. The SRH, ERH and DRH values are given in red.
3.2.2 Phase transition observations for OIR = 1:2 and 1:4 particles
The dynamic processes of LLPS, secondary LLPS and efflorescence for the same OIR = 1:4 and 1:2 particles are shown in Fig. 5. In Fig. 5b, it is clear that LLPS for the OIR = 1:4 particle occurs by growth of a second phase from the particle surface over a wider RH range of 78.3 %–76.3 %. Importantly, the secondary LLPS occurs at ∼ 77.9 % RH, almost the same RH as the appearance of LLPS. Then, the degree of secondary LLPS increases gradually along with the water release from the inner AS solution phase. The size of the concentrated AS-rich phase in the center of the AS solution phase almost attains the size of inner phase at ∼ 50.7 % RH, owing to the very high sulfate fraction. The crystallization occurs at 46.4 % RH. After ∼ 2.0 s, the particle morphology becomes rough, meaning rapid crystal growth and trapping of organics into the cavity of the AS crystal. Then, the crystal growth continues, resulting in the formation of an AS crust (Fig. S4 in the Supplement). For the OIR = 1:2 particle, LLPS occurs at ∼ 73.4 % RH (t=211.0 s), showing that the schlieren appears suddenly. The growth and coalescence of these regions lead to the generation of AS inclusions. The inclusions further merge together and fade away, followed by the growth of a second phase from the rim of the particle starting at ∼ 219.0 s. Hence, LLPS is observed to occur by the first spinodal decomposition and then growth of a second phase from the particle surface. Here, the AS solution phases in different illustrations during LLPS are marked with different shades of blue to indicate the degree of LLPS. Indeed, the growth of a second phase is not always clearly distinguished from the images due to the optical effect, but it is clearly visible in movie S8 in the Supplement (i.e., the LLPS process of the OIR = 1:2 particle). A secondary LLPS occurs at ∼ 69.0 % RH. The number of concentrated AS inclusions increases with decreasing RH, along with the coalescence and growth of inclusions. At ∼ 41.9 % RH, the inner phase turns into crystalline AS phase.
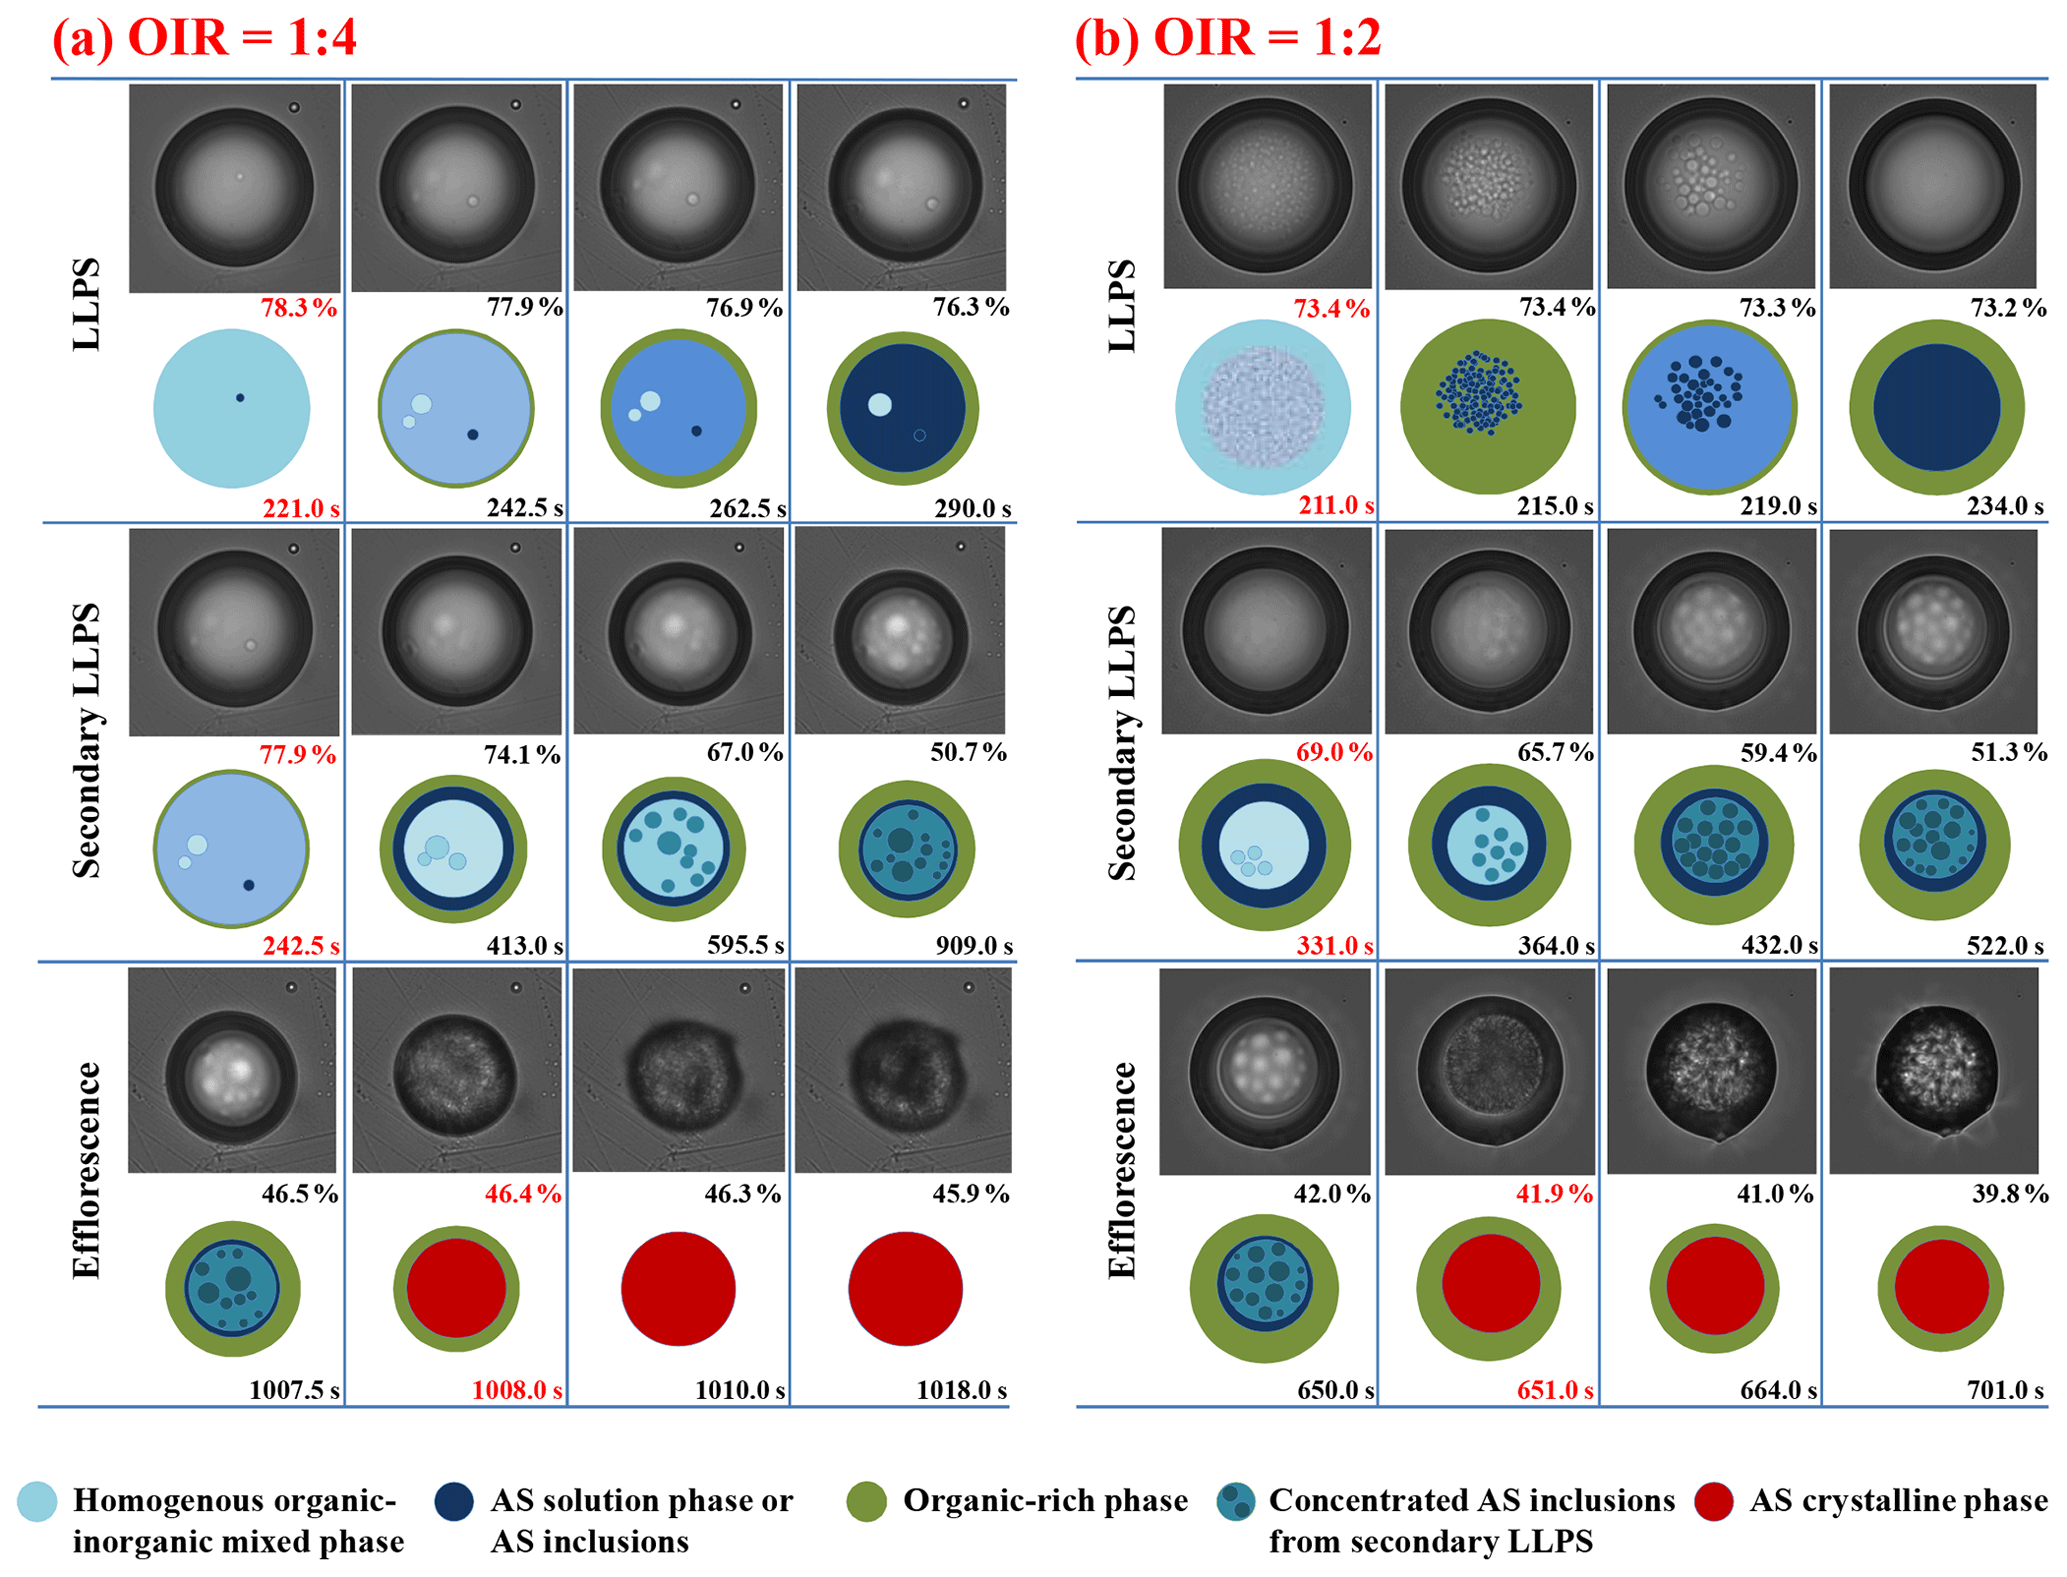
Figure 5Optical images and corresponding illustrations of mixed 1, 2, 6-hexanetriol AS particles with OIR = 1:4 (a) and 1:2 (b) during LLPS, secondary LLPS and efflorescence. Below the optical images are the illustrations. The corresponding RH and time are given in each frame. The RH and time in red indicate the occurrence of phase transitions.
3.3 Hygroscopic growth and phase transitions of mixed particles with OIR = 2:1 and 4:1
3.3.1 Hygroscopic growth of OIR = 2:1 and 4:1 particles
The hygroscopic cycles for mixed particles with OIR = 2:1 and 4:1 are shown in Fig. 6. LLPS occurs at ∼ 73.6 % RH and ∼ 76.6 % RH, respectively. The efflorescence begins at ∼ 43.2 % RH and ∼ 50.6 % RH, respectively. For the humidification process, the OIR = 2:1 particle first absorbs water very slowly at low RH and then the size of particle increases abruptly above ∼ 50 % RH, whereas for the OIR = 4:1 particle, an appreciable size increase occurs even at very low RH (∼ 20 % RH), followed by a considerable and continuous size growth as RH increases, indicating a more similar hygroscopic property to pure 1, 2, 6-hexanetriol. Then, the DRH for the two particles are ∼ 74.9 % and ∼ 75.5 %, respectively, as identified by the occurrence of crystal dissolution from the images.
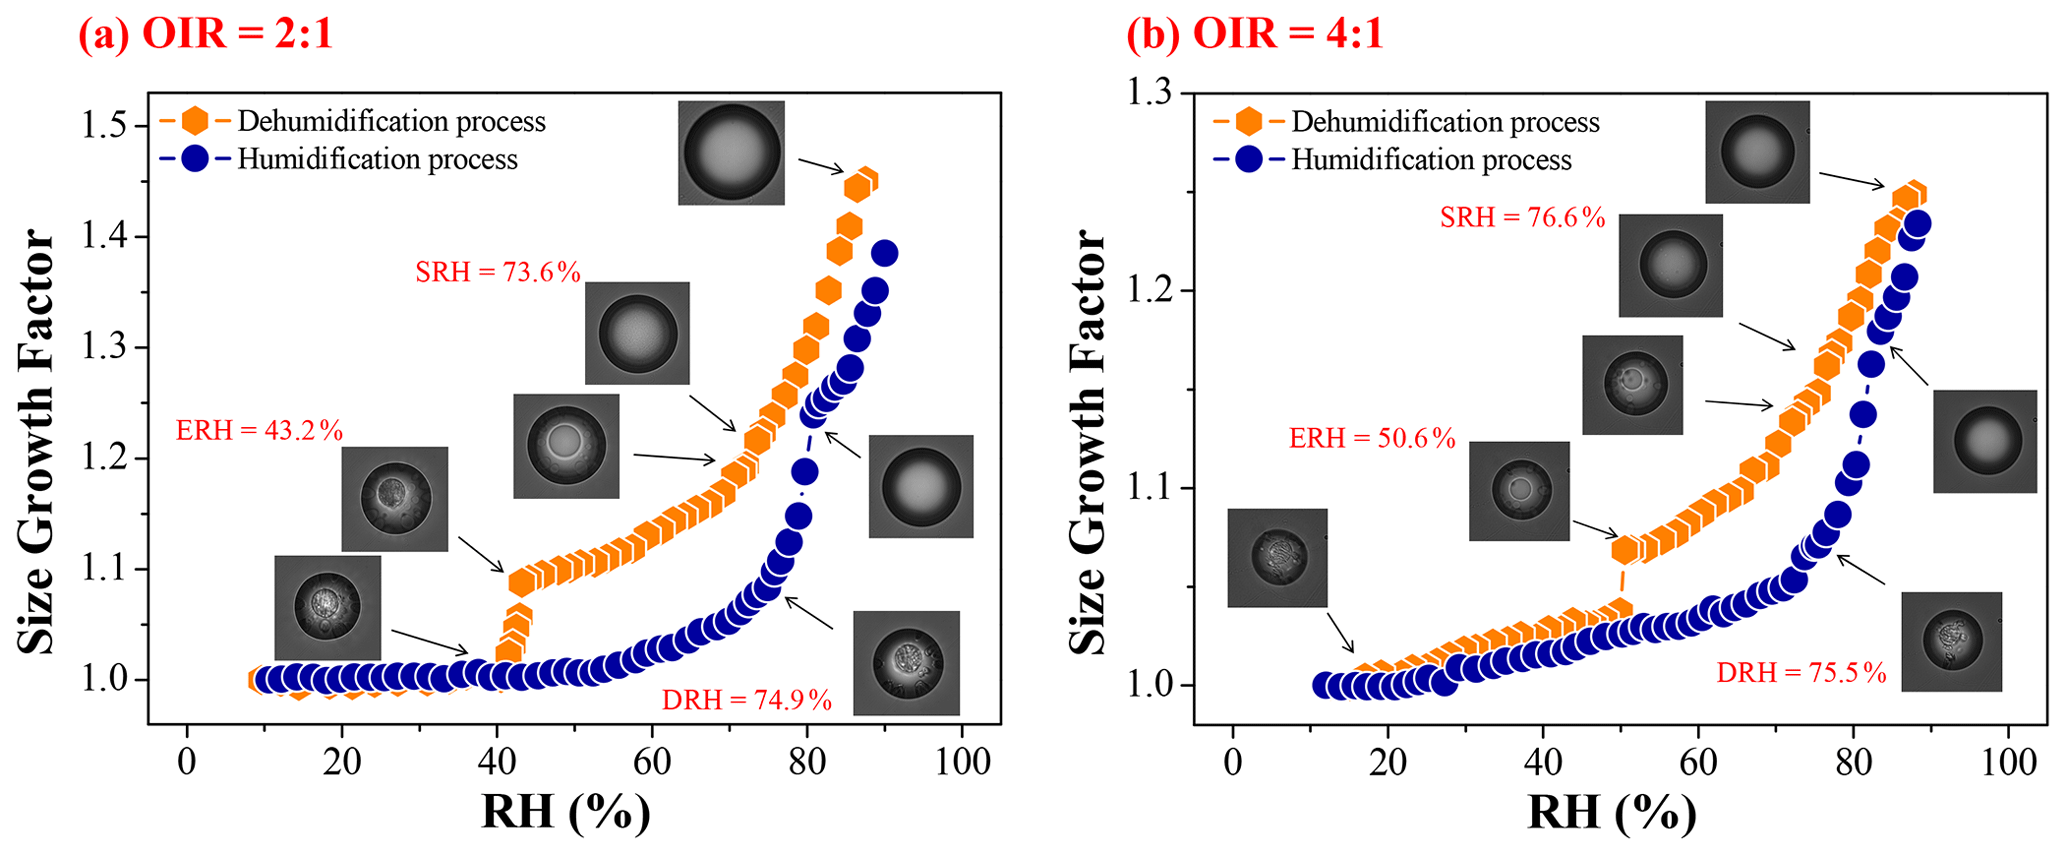
Figure 6Hygroscopic cycles of mixed 1, 2, 6-hexanetriol AS particles with OIR = 2:1 (a) and 4:1 (b). The panels show the optical images corresponding to the GFs at a particular RH. The SRH, ERH and DRH values are given in red.
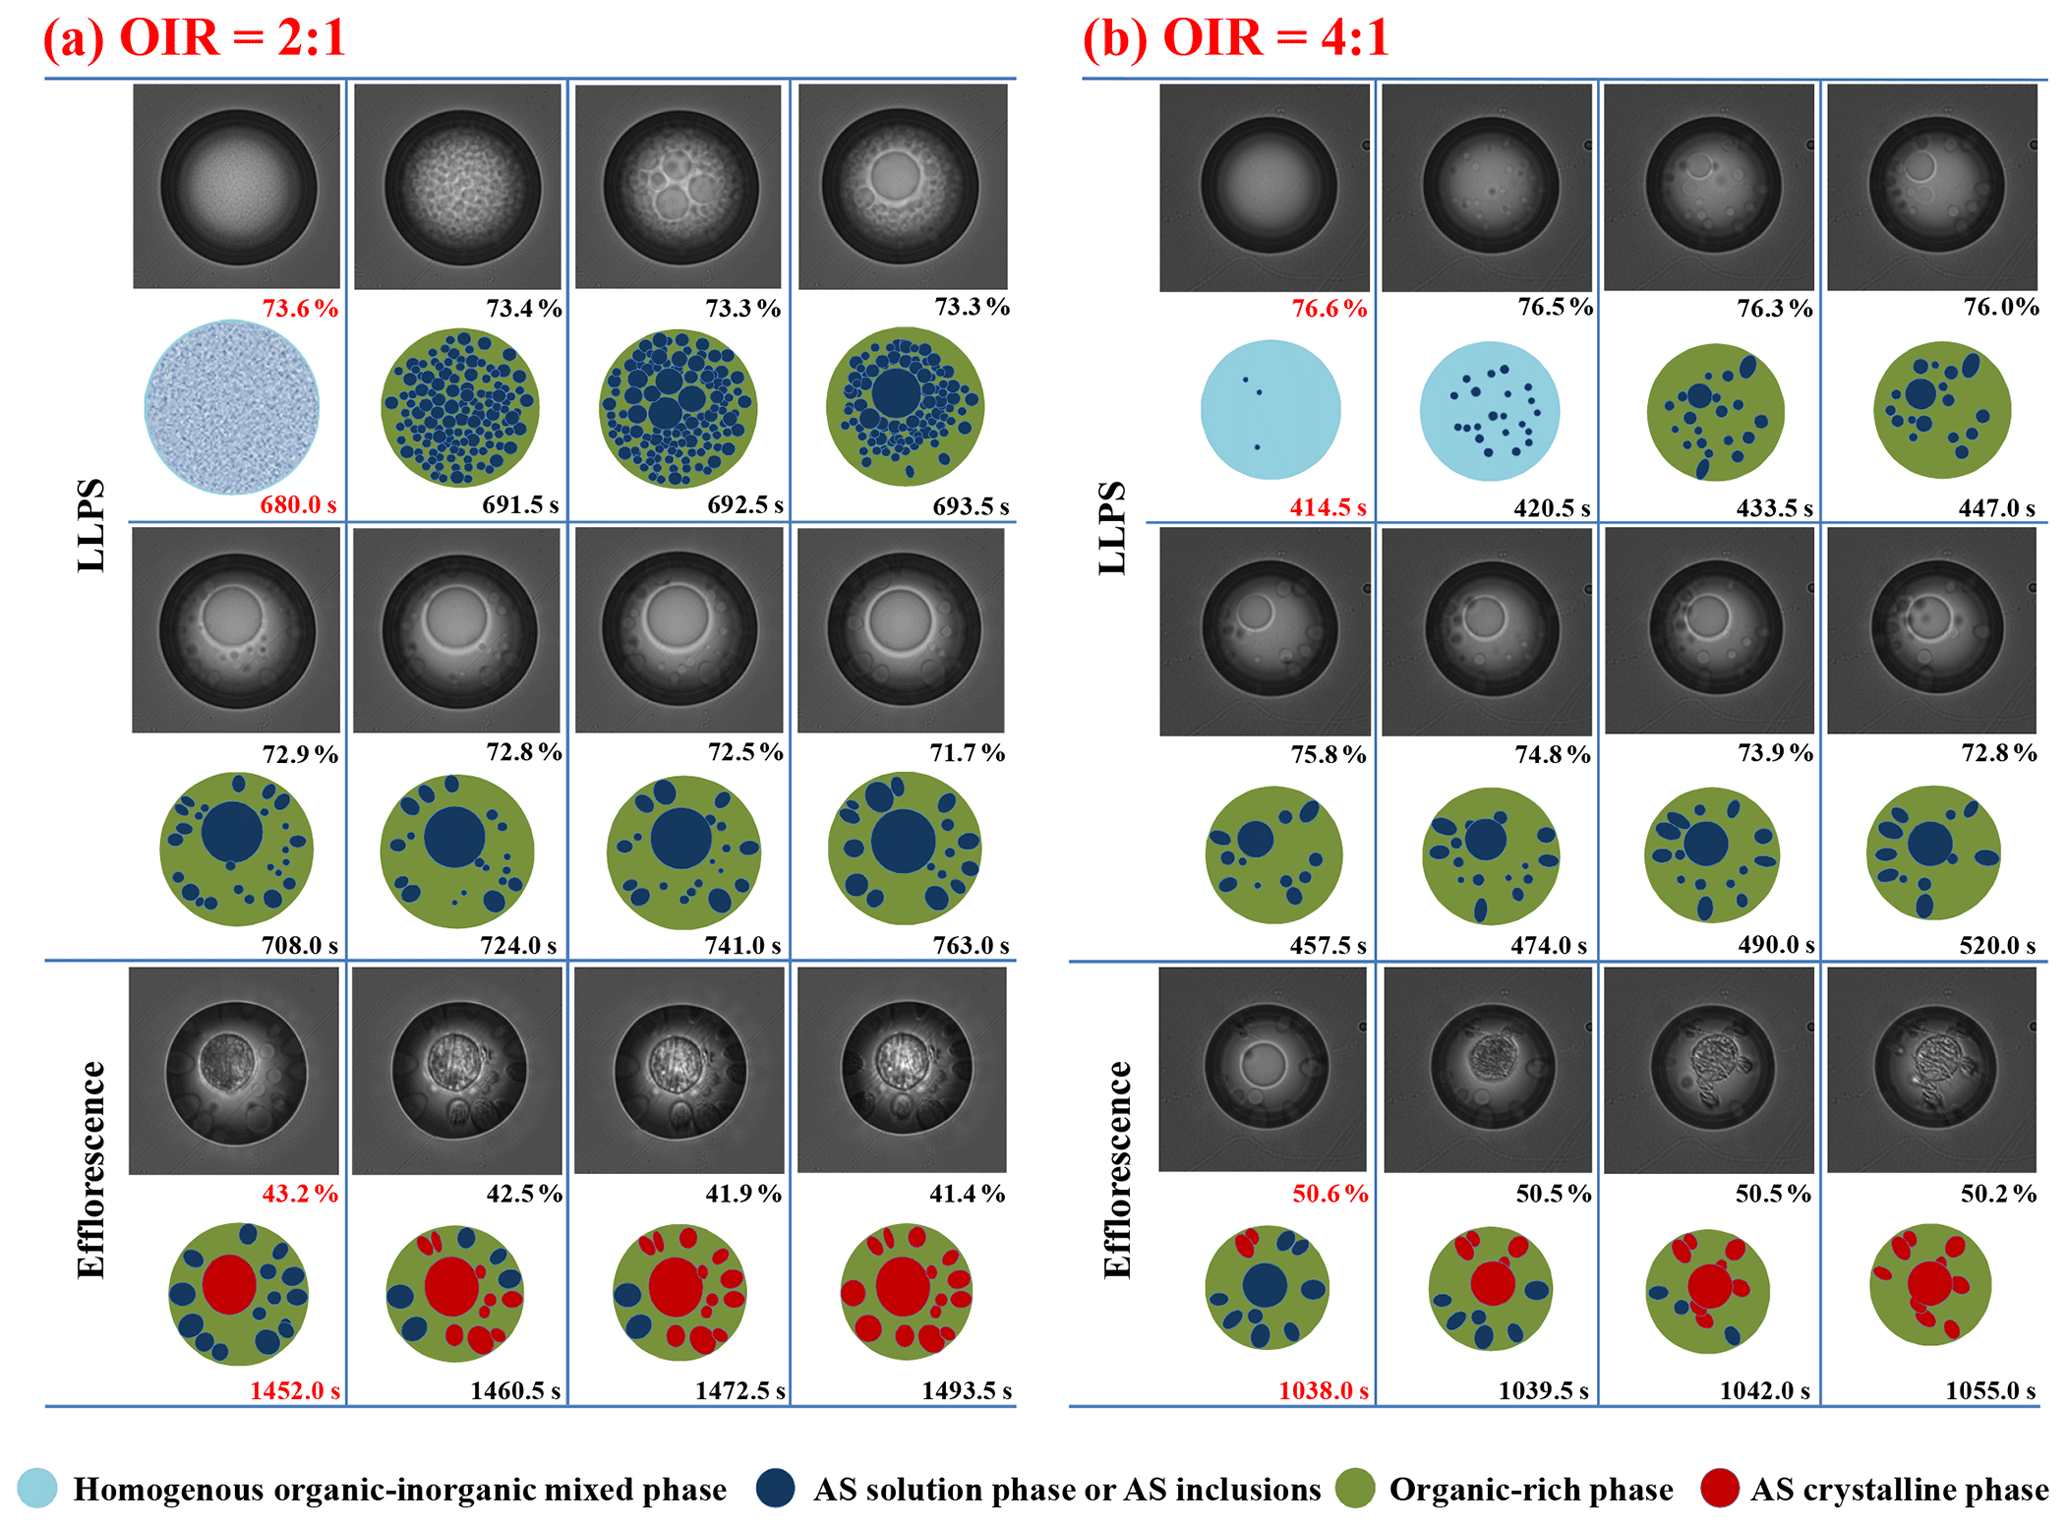
Figure 7Optical images and corresponding illustrations of mixed 1, 2, 6-hexanetriol AS particles with OIR = 2:1 (a) and 4:1 (b) during LLPS and efflorescence. Below the optical images are the illustrations. The corresponding RH and time are given in each frame. The RH and time in red indicate the occurrence of phase transitions.
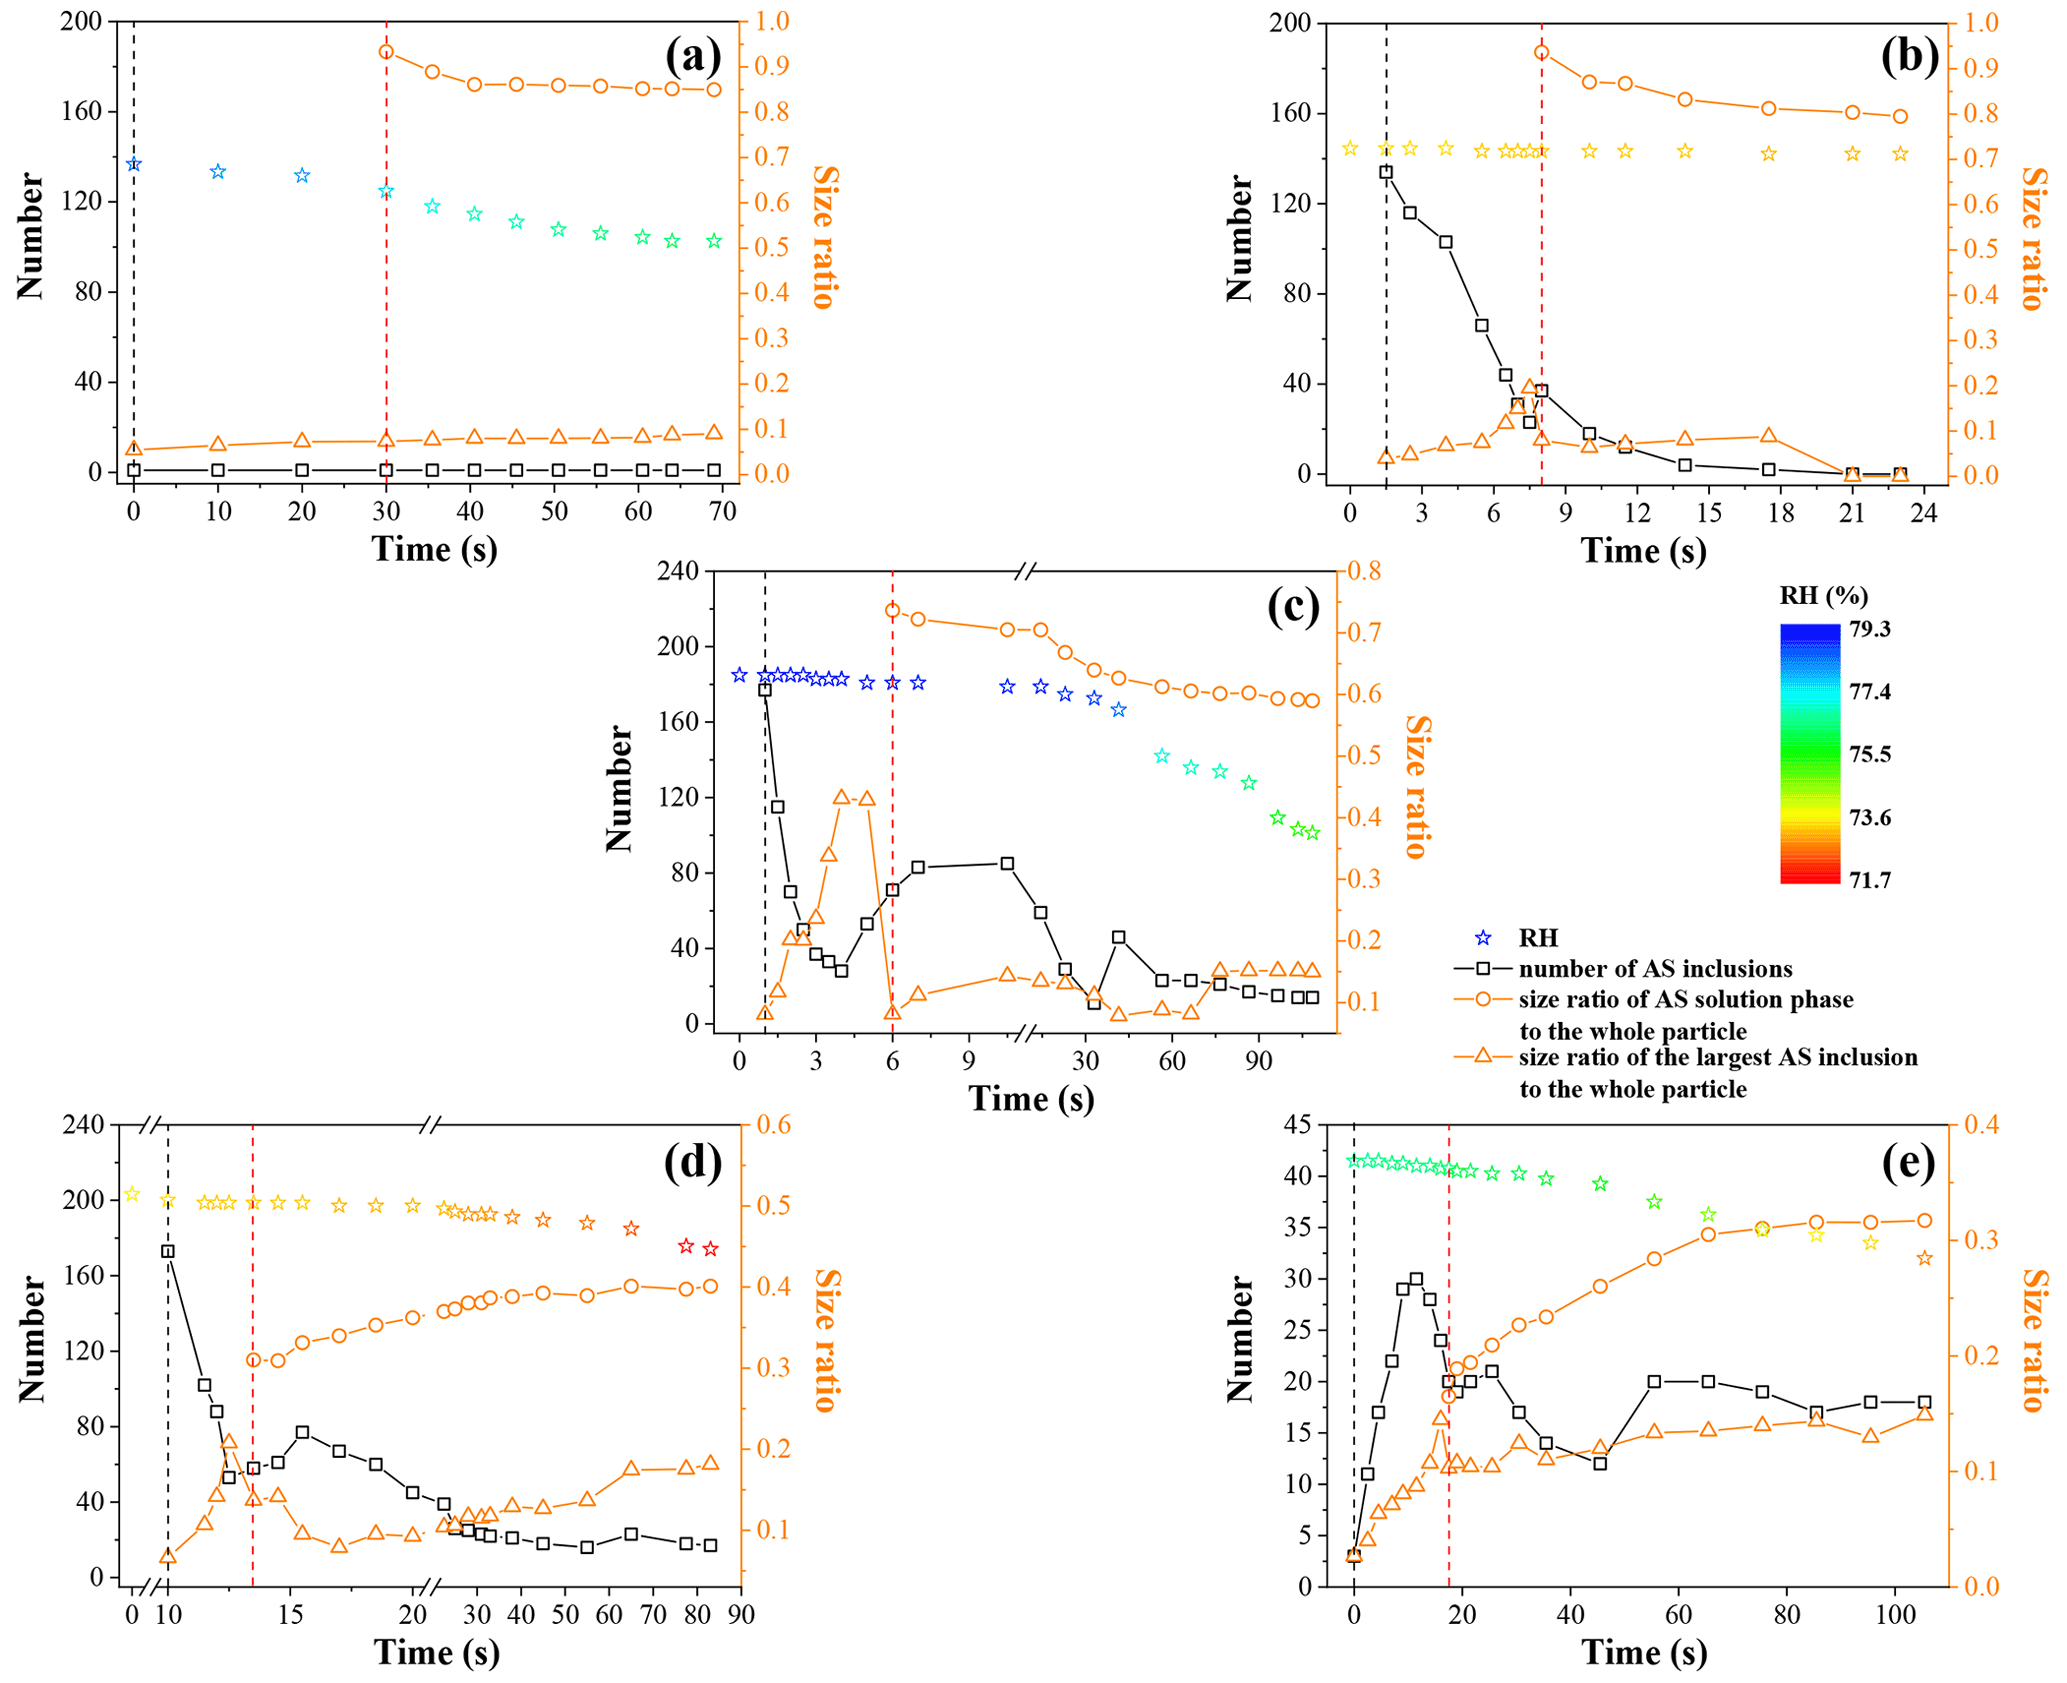
Figure 8Temporal changes in number of AS inclusions, size ratios of AS solution phases and the largest AS inclusions to the whole particles, as well as the corresponding RH during LLPS for mixed 1, 2, 6-hexanetriol AS particles with OIR = 1:4 (a), 1:2 (b), 1:1 (c), 2:1 (d) and 4:1 (e). The black dashed line corresponds to the appearance of AS inclusions. The red dashed line corresponds to the appearance of the AS solution phase.
3.3.2 Phase transition observations for OIR = 2:1 and 4:1 particles
Figure 7 shows the LLPS, secondary LLPS and efflorescence processes of the OIR = 2:1 and 4:1 particles. For the OIR = 2:1 particle, LLPS occurs first by spinodal decomposition at ∼ 73.6 % RH. After that, another LLPS mechanism, nucleation and growth, is exhibited at about 72.9 % RH–71.7 % RH. The ultimate particle morphology from nucleation and growth commonly consists of spherical droplets of the minor phase, i.e., AS inclusions in this case, dispersed in the major phase, i.e., the organic-rich phase (Ciobanu et al., 2009). Crystallization of dispersed AS inclusions starts at ∼ 43.2 % RH and ends at ∼ 41.4 % RH. For the OIR = 4:1 particle, it is clear that the critical AS solution nuclei appear at ∼ 76.6 % RH, which further grow and coalesce into bigger spherical inclusions dispersed in the organic-rich phase until ∼ 72.8 % RH. Crystallization transition of this particle occurs over an RH range of 50.6 %–50.2 %. Furthermore, LLPS dynamic processes are also observed under two faster RH changing conditions, i.e., 0.14 and 2.40 RH s−1 (Fig. S5 in the Supplement). Apparently, the number of formed AS inclusions increases significantly with higher RH changing rates. This is owed to the greater kinetics limitation in the viscous outer organic-rich phase derived from the faster water release, which inhibits the coalescence of AS inclusions, as discussed by Fard et al. (2017).
3.4 Analysis of phase transition RH and LLPS processes
A summary of DRH, SRH and ERH of mixed 1, 2, 6-hexanetriol AS particles with five different OIRs and a comparison with reference data are shown in Fig. S6 and Table S1 in the Supplement. The DRH values are just below the theoretical DRH of pure AS. This is because the AS crystal blends with organics in term of veins, resulting in water partly dissolving AS at RH below the DRH due to capillary forces (Sjogren et al., 2007). The SRH for particles with different OIRs is around 75.0 %, showing no dependency on OIRs. Also, the measured SRH is slightly higher than the measurement results (∼ 71.0 % RH) by Bertram et al. (2011). The ERH of mixed particles is around 45.0 %, which is in the range of the typical ERH for heterogeneous nucleation of AS, i.e., > 40 % RH, as reported by our previous study (Ma et al., 2019). The AS crystallization is not inhibited by the organic coating, owing to the weak water diffusion limitation, consistent with the results from Robinson et al. (2013). Overall, the ERH and DRH of mixed particles are independent of the mole fraction of organics due to the occurrence of LLPS, as discussed by Bertram et al. (2011).
To illustrate the LLPS dynamic process and mechanism for mixed organic–inorganic aerosols, the number of distinguishable AS inclusions, the radius ratio of the largest AS inclusion and the AS solution phase to the whole particle (defined as r1 and r2, respectively), and corresponding RH as a function of time during LLPS (not including secondary LLPS) are depicted in Fig. 8. The occurrence of LLPS is set to t=0. For the OIR = 1:1 particle (Fig. 8c), the AS inclusions appear at about t=1.0 s with a number of ∼ 177 and r1 of ∼ 0.081. Then, the number shows a significant decrease with time, along with the rapid increase in r1 until t=4.0 s, suggesting the coalescence of AS inclusions. At t=6.0 s, the largest AS inclusion with r1 of ∼ 0.428 disappears, followed by the formation of an inner AS solution phase with r2 of ∼ 0.736. The number and r1 change randomly with time after t=4.0 and 6.0 s, respectively, implying that AS inclusions are formed continuously, accompanied by the coalescence and merging into the AS solution phase. The r2 decreases gradually with time, indicating an equilibrium partitioning process between organic-rich and AS-rich phases. After t=90.0 s, the number, r1 and r2 remain almost unchanged, suggesting that an equilibrium arrangement is reached. For the OIR = 1:4 particle (Fig. 8a), there is only one AS inclusion present during LLPS because LLPS occurs mainly by growth of a second phase from the surface of the particle. The AS solution phase appears at t=30.0 s, followed by the continuous decrease in the size ratio. In Fig. 8b, temporal changes in the number, r1 and r2 for the OIR = 1:2 particle show a similar trend to that of the OIR = 1:1 particle in the prior period of LLPS (between the black and red dashed lines), owing to the same mechanism (spinodal decomposition). The number decreases from ∼ 134 to ∼ 23 from 1.5 to 7.5 s; meanwhile, the r1 increases from ∼ 0.040 to ∼ 0.195. At t=8.0 s, the AS solution phase is formed with a size ratio r2 of ∼ 0.937 by another mechanism, i.e., growth of a second phase from the particle surface. After that, the number decreases gradually until t=21.0 s, at which point AS inclusions disappear. Meanwhile, the r2 decreases gradually to ∼ 0.804. For the OIR = 2:1 particle (Fig. 8d), the temporal changes in the prior period of LLPS are similar to that of the OIR = 1:1 and 1:2 particles, owing to the same LLPS mechanism, i.e., spinodal decomposition. The AS solution phase appears at t=13.5 s. Then, r1 increases gradually with time from t=17.0 s, suggesting the growth of AS inclusions due to nucleation and growth. The new AS inclusions merge into the AS solution phase, resulting in the continuous increase in r2. For the OIR = 4:1 particle (Fig. 8e), the number and r1 first increase with time due to the nucleation and growth of AS inclusions. At t = 17.5 s, the AS solution phase is formed with the r2 of ∼ 0.165. Then r2 and r1 increase gradually, similarly to that of the OIR = 2:1 particle.
The hygroscopic growth and phase transitions including LLPS, efflorescence and deliquescence are observed for mixed 1, 2, 6-hexanetriol AS particles with different OIRs by combining microscope techniques and Raman spectra. After LLPS, the core–shell structure of an inner AS solution core surrounded by an outer organic-rich shell is formed. For OIR = 1:2 and 2:1 particles, two different types of LLPS mechanisms dominate successively during LLPS. For OIR = 1:1, 1:2 and 1:4 particles, a secondary LLPS in the inner phase, as a result of more concentrated AS inclusions formation, is exhibited with water release, and it becomes more obvious with decreasing RH and increasing sulfate fractions. These results demonstrate a more complicated organic–inorganic partitioning process during RH fluctuation for mixed particles. Meanwhile, a special particle morphology of organics trapped by an AS crystal crust is observed for the OIR = 1:4 particle. In addition, the quantitative characterization of LLPS dynamic processes further clarifies the different LLPS mechanisms for particles with different OIRs.
The complicated phase changes of atmospheric aerosols have remained largely unclear until now, though they have significant effects on radiative forcing and atmospheric chemistry. Brown et al. (2006) found that the reactive uptake coefficient of N2O5 on the surface of atmospheric particles decreased significantly in the presence of a large amount of organics during the field measurements, which is due to the transfer limitation of N2O5 molecules caused by the formation of organic coatings. This finding was further validated by numerous laboratory observations on the heterogeneous chemistry of N2O5 (Cosman et al., 2008; McNeill et al., 2006, 2007; Badger et al., 2006). Among these, Cosman et al. (2008) found that the inhibition in the N2O5 uptake coefficient was influenced significantly by types of aqueous solution phase, which should be further investigated. Furthermore, the water uptake of organic–inorganic mixtures might be affected by morphology effects resulting from complex phase changes (Marcolli and Krieger, 2006). LLPS might affect the bulk-to-surface partitioning of organics, resulting in a considerable impact on droplet surface tension and further affecting the cloud condensation nuclei (CCN) activity (Hodas et al., 2016). Also, the gas-particle partitioning predictions would be vastly incorrect if LLPS was ignored (Zuend and Seinfeld, 2012). Accordingly, the phase transition behaviors of mixed organic–inorganic particles should be comprehensively investigated to gain insights into the complicated physical and chemical properties of atmospheric aerosols and provide valuable data for model simulations of phase evolution processes and heterogeneous reaction kinetics of environmental particles.
Data are available at https://doi.org/10.5281/zenodo.4863581 (Ma, 2021).
The supplement related to this article is available online at: https://doi.org/10.5194/acp-21-9705-2021-supplement.
SM and YZ designed the experimental plan. SM preformed the measurements. ZC helped with the data analysis. SM and SP wrote the manuscript. All authors discussed and contributed to the manuscript.
The authors declare that they have no conflict of interest.
The authors would like to thank the reviewers for their helpful comments and discussions.
This research has been supported by the National Natural Science Foundation of China (grant nos. 41875144 and 91644101).
This paper was edited by Sachin S. Gunthe and reviewed by two anonymous referees.
Ahn, K.-H., Kim, S.-M., Jung, H.-J., Lee, M.-J., Eom, H.-J., Maskey, S., and Ro, C.-U.: Combined use of optical and electron microscopic techniques for the measurement of hygroscopic property, chemical composition, and morphology of individual aerosol particles, Anal. Chem., 82, 7999–8009, https://doi.org/10.1021/ac101432y, 2010.
Badger, C. L., Griffiths, P. T., George, I., Abbatt, J. P., and Cox, R. A.: Reactive uptake of N2O5 by aerosol particles containing mixtures of humic acid and ammonium sulfate, J. Phys. Chem. A, 110, 6986–6994, https://doi.org/10.1021/jp0562678, 2006.
Bertram, A. K., Martin, S. T., Hanna, S. J., Smith, M. L., Bodsworth, A., Chen, Q., Kuwata, M., Liu, A., You, Y., and Zorn, S. R.: Predicting the relative humidities of liquid-liquid phase separation, efflorescence, and deliquescence of mixed particles of ammonium sulfate, organic material, and water using the organic-to-sulfate mass ratio of the particle and the oxygen-to-carbon elemental ratio of the organic component, Atmos. Chem. Phys., 11, 10995–11006, https://doi.org/10.5194/acp-11-10995-2011, 2011.
Brown, S. S., Ryerson, T. B., Wollny, A. G., Brock, C. A., Peltier, R., Sullivan, A. P., Weber, R. J., Dube, W. P., Trainer, M., Meagher, J. F., Fehsenfeld, F. C., and Ravishankara, A. R.: Variability in nocturnal nitrogen oxide processing and its role in regional air quality, Science, 311, 67–70, https://doi.org/10.1126/science.1120120, 2006.
Ciobanu, V. G., Marcolli, C., Krieger, U. K., Weers, U., and Peter, T.: Liquid-liquid phase separation in mixed organic/inorganic aerosol particles, J. Phys. Chem. A, 113, 10966–10978, https://doi.org/10.1021/jp905054d, 2009.
Cosman, L. M., Knopf, D. A., and Bertram, A. K.: N2O5 reactive uptake on aqueous sulfuric acid solutions coated with branched and straight-chain insoluble organic surfactants, J. Phys. Chem. A, 112, 2386–2396, https://doi.org/10.1021/jp710685r, 2008.
Ebert, M., Inerle-Hof, M., and Weinbruch, S.: Environmental scanning electron microscopy as a new technique to determine the hygroscopic behaviour of individual aerosol particles, Atmos. Environ., 36, 5909–5916, https://doi.org/10.1016/S1352-2310(02)00774-4, 2002.
Erdakos, G. B. and Pankow, J. F.: Gas/particle partitioning of neutral and ionizing compounds to single- and multi-phase aerosol particles, 2. Phase separation in liquid particulate matter containing both polar and low-polarity organic compounds, Atmos. Environ., 38, 1005–1013, https://doi.org/10.1016/j.atmosenv.2003.10.038, 2004.
Fard, M. M., Krieger, U. K., and Peter, T.: Kinetic limitation to inorganic ion diffusivity and to coalescence of inorganic inclusions in viscous liquid-liquid phase-separated particles, J. Phys. Chem. A, 121, 9284–9296, https://doi.org/10.1021/acs.jpca.7b05242, 2017.
Gao, Y., Chen, S. B., and Yu, L. E.: Efflorescence relative humidity for ammonium sulfate particles, J. Phys. Chem. A, 110, 7602–7608, https://doi.org/10.1021/jp057574g, 2006.
Gao, Y., Yu, L. E., and Chen, S. B.: Theoretical investigation of substrate effect on deliquescence relative humidity of NaCl particles, J. Phys. Chem. A, 111, 633–639, https://doi.org/10.1021/jp0654967, 2007.
Hämeri, K., Laaksonen, A., Väkevä, M., and Suni, T.: Hygroscopic growth of ultrafine sodium chloride particles, J. Geophys. Res.-Atmos., 106, 20749–20757, https://doi.org/10.1029/2000jd000200, 2001.
Haywood, J. and Boucher, O.: Estimates of the direct and indirect radiative forcing due to tropospheric aerosols: A review, Rev. Geophys., 38, 513–543, https://doi.org/10.1029/1999RG000078, 2000.
Heald, C. L., Kroll, J. H., Jimenez, J. L., Docherty, K. S., Decarlo, P. F., Aiken, A. C., Chen, Q., Martin, S. T., Farmer, D. K., and Artaxo, P.: A simplified description of the evolution of organic aerosol composition in the atmosphere, Geophys. Res. Lett., 37, L08803, https://doi.org/10.1029/2010GL042737, 2010.
Hodas, N., Zuend, A., Schilling, K., Berkemeier, T., Shiraiwa, M., Flagan, R. C., and Seinfeld, J. H.: Discontinuities in hygroscopic growth below and above water saturation for laboratory surrogates of oligomers in organic atmospheric aerosols, Atmos. Chem. Phys., 16, 12767–12792, https://doi.org/10.5194/acp-16-12767-2016, 2016.
Kanakidou, M., Seinfeld, J. H., Pandis, S. N., Barnes, I., Dentener, F. J., Facchini, M. C., Van Dingenen, R., Ervens, B., Nenes, A., Nielsen, C. J., Swietlicki, E., Putaud, J. P., Balkanski, Y., Fuzzi, S., Horth, J., Moortgat, G. K., Winterhalter, R., Myhre, C. E. L., Tsigaridis, K., Vignati, E., Stephanou, E. G., and Wilson, J.: Organic aerosol and global climate modelling: a review, Atmos. Chem. Phys., 5, 1053–1123, https://doi.org/10.5194/acp-5-1053-2005, 2005.
Krieger, U. K., Marcolli, C., and Reid, J. P.: Exploring the complexity of aerosol particle properties and processes using single particle techniques, Chem. Soc. Rev., 41, 6631–6662, https://doi.org/10.1039/c2cs35082c, 2012.
Lee, S. H., Murphy, D. M., Thomson, D. S., and Middlebrook, A. M.: Chemical components of single particles measured with Particle Analysis by Laser Mass Spectrometry (PALMS) during the Atlanta SuperSite Project: Focus on organic/sulfate, lead, soot, and mineral particles, J. Geophys. Res.-Atmos., 107, 4003, https://doi.org/10.1029/2000JD000011, 2002.
Liu, P. F., Song, M., Zhao, T. N., Gunthe, S. S., Ham, S., He, Y. P., Qin, Y. M., Gong, Z. H., Amorim, J. C., Bertram, A. K., and Martin, S. T.: Resolving the mechanisms of hygroscopic growth and cloud condensation nuclei activity for organic particulate matter, Nat. Commun., 9, 4076, https://doi.org/10.1038/s41467-018-06622-2, 2018.
Lv, X. J., Chen, Z., Ma, J. B., and Zhang, Y. H.: Volatility measurements of 1, 2, 6-hexanetriol in levitated viscous aerosol particles, J. Aerosol Sci., 138, 105449, https://doi.org/10.1016/j.jaerosci.2019.105449, 2019.
Ma, S. S., Yang, W., Zheng, C. M., Pang, S. F., and Zhang, Y. H.: Subsecond measurements on aerosols: From hygroscopic growth factors to efflorescence kinetics, Atmos. Environ., 210, 177–185, https://doi.org/10.1016/j.atmosenv.2019.04.049, 2019.
Ma, S. S., Chen, Z., Pang, S. F., and Zhang, Y. H.: Data of “Observations on hygroscopic growth and phase transitions of 1, 2, 6-hexanetriol/(NH4)2SO4 mixed particles: Investigation of liquid-liquid phase separation (LLPS) dynamic process and mechanism and secondary LLPS during the dehumidification”, Zenodo [Dataset], https://doi.org/10.5281/zenodo.4863581, 2021.
Marcolli, C., Luo, B. P., Peter, T., and Wienhold, F. G.: Internal mixing of the organic aerosol by gas phase diffusion of semivolatile organic compounds, Atmos. Chem. Phys., 4, 2593–2599, https://doi.org/10.5194/acp-4-2593-2004, 2004.
Marcolli, C. and Krieger, U. K.: Phase changes during hygroscopic cycles of mixed organic/inorganic model systems of tropospheric aerosols, J. Phys. Chem. A, 110, 1881–1893, https://doi.org/10.1021/jp0556759, 2006.
Martin, S. T.: Phase transitions of aqueous atmospheric particles, Chem. Rev., 100, 3403–3453, https://doi.org/10.1021/cr990034t, 2000.
Martin, S. T., Hung, H. M., Park, R. J., Jacob, D. J., Spurr, R. J. D., Chance, K. V., and Chin, M.: Effects of the physical state of tropospheric ammonium-sulfate-nitrate particles on global aerosol direct radiative forcing, Atmos. Chem. Phys., 4, 183–214, https://doi.org/10.5194/acp-4-183-2004, 2004.
McNeill, V. F., Patterson, J., Wolfe, G. M., and Thornton, J. A.: The effect of varying levels of surfactant on the reactive uptake of N2O5 to aqueous aerosol, Atmos. Chem. Phys., 6, 1635–1644, https://doi.org/10.5194/acp-6-1635-2006, 2006.
McNeill, V. F., Wolfe, G. M., and Thornton, J. A.: The oxidation of oleate in submicron aqueous salt aerosols: Evidence of a surface process, J. Phys. Chem. A, 111, 1073–1083, https://doi.org/10.1021/jp066233f, 2007.
Middlebrook, A. M., Murphy, D. M., and Thomson, D. S.: Observations of organic material in individual marine particles at Cape Grim during the First Aerosol Characterization Experiment (ACE 1), J. Geophys. Res.-Atmos., 103, 16475, https://doi.org/10.1029/97JD03719, 1998.
Murphy, D. M., Cziczo, D. J., Froyd, K. D., Hudson, P. K., Matthew, B. M., Middlebrook, A. M., Peltier, R. E., Sullivan, A., Thomson, D. S., and Weber, R. J.: Single-particle mass spectrometry of tropospheric aerosol particles, J. Geophys. Res.-Atmos., 111, D23S32, https://doi.org/10.1029/2006JD007340, 2006.
Ng, N. L., Canagaratna, M. R., Zhang, Q., Jimenez, J. L., Tian, J., Ulbrich, I. M., Kroll, J. H., Docherty, K. S., Chhabra, P. S., and Bahreini, R.: Organic aerosol components observed in Northern Hemispheric datasets from Aerosol Mass Spectrometry, Atmos. Chem. Phys., 10, 4625–4641, https://doi.org/10.5194/acp-10-4625-2010, 2010.
O'Brien, R. E., Wang, B. B., Kelly, S. T., Lundt, N., You, Y., Bertram, A. K., Leone, S. R., Laskin, A., and Gilles, M. K.: Liquid-liquid phase separation in aerosol particles: Imaging at the nanometer scale, Environ. Sci. Technol., 49, 4995–5002, https://doi.org/10.1021/acs.est.5b00062, 2015.
Pant, A., Fok, A., Parsons, M. T., Mak, J., and Bertram, A. K.: Deliquescence and crystallization of ammonium sulfate-glutaric acid and sodium chloride-glutaric acid particles, Geophys. Res. Lett., 31, L12111, https://doi.org/10.1029/2004gl020025, 2004.
Papon, P., Leblond, J., and Meijer, P. H. E.: The Physics of phase transitions: Concepts and applications, Springer, Berlin, 1999.
Qiu, Y. Q. and Molinero, V.: Morphology of liquid-liquid phase separated aerosols, J. Am. Chem. Soc., 137, 10642–10651, https://doi.org/10.1021/jacs.5b05579, 2015.
Renbaum-Wolff, L., Song, M., Marcolli, C., Zhang, Y., Liu, P. F., Grayson, J. W., Geiger, F. M., Martin, S. T., and Bertram, A. K.: Observations and implications of liquid–liquid phase separation at high relative humidities in secondary organic material produced by α-pinene ozonolysis without inorganic salts, Atmos. Chem. Phys., 16, 7969–7979, https://doi.org/10.5194/acp-16-7969-2016, 2016.
Robinson, C. B., Schill, G. P., Zarzana, K. J., and Tolbert, M. A.: Impact of organic coating on optical growth of ammonium sulfate particles, Environ. Sci. Technol., 47, 13339–13346, https://doi.org/10.1021/es4023128, 2013.
Russell, L. M. and Ming, Y.: Deliquescence of small particles, J. Chem. Phys., 116, 311–321, https://doi.org/10.1063/1.1420727, 2002.
Shelby, J. E.: Introduction to glass science and technology, The Royal Society of Chemistry, Cambridge, UK, 1997.
Shiraiwa, M., Zuend, A., Bertram, A. K., and Seinfeld, J. H.: Gas-particle partitioning of atmospheric aerosols: interplay of physical state, non-ideal mixing and morphology, Phys. Chem. Chem. Phys., 15, 11441–11453, https://doi.org/10.1039/c3cp51595h, 2013.
Sjogren, S., Gysel, M., Weingartner, E., Baltensperger, U., Cubison, M. J., Coe, H., Zardini, A. A., Marcolli, C., Krieger, U. K., and Peter, T.: Hygroscopic growth and water uptake kinetics of two-phase aerosol particles consisting of ammonium sulfate, adipic and humic acid mixtures, J. Aerosol Sci., 38, 157–171, https://doi.org/10.1016/j.jaerosci.2006.11.005, 2007.
Song, M., Marcolli, C., Krieger, U. K., Zuend, A., and Peter, T.: Liquid-liquid phase separation in aerosol particles: Dependence on O:C, organic functionalities, and compositional complexity, Geophys. Res. Lett., 39, L19801, https://doi.org/10.1029/2012gl052807, 2012a.
Song, M., Marcolli, C., Krieger, U. K., Zuend, A., and Peter, T.: Liquid-liquid phase separation and morphology of internally mixed dicarboxylic acids/ammonium sulfate/water particles, Atmos. Chem. Phys., 12, 2691–2712, https://doi.org/10.5194/acp-12-2691-2012, 2012b.
Song, M., Liu, P. F., Martin, S. T., and Bertram, A. K.: Liquid–liquid phase separation in particles containing secondary organic material free of inorganic salts, Atmos. Chem. Phys., 17, 11261–11271, https://doi.org/10.5194/acp-17-11261-2017, 2017.
Thornton, J. A. and Abbatt, J. P. D.: N2O5 reaction on submicron sea salt aerosol: kinetics, products, and the effect of surface active organics, J. Phys. Chem. A, 109, 10004–10012, https://doi.org/10.1021/jp054183t, 2005.
Wang, F., Zhang, Y. H., Li, S. H., Wang L.Y., and Zhao, L. J.: A strategy for single supersaturated droplet analysis: Confocal Raman investigations on the complicated hygroscopic properties of individual MgSO4 droplets on the quartz substrate, Anal. Chem., 77, 7148–7155, https://doi.org/10.1021/ac050938g, 2005.
Wang, X. W., Jing, B., Tan, F., Ma, J. B., Zhang, Y. H., and Ge, M. F.: Hygroscopic behavior and chemical composition evolution of internally mixed aerosols composed of oxalic acid and ammonium sulfate, Atmos. Chem. Phys., 17, 12797–12812, https://doi.org/10.5194/acp-17-12797-2017, 2017.
Yu, H., Kaufman, Y. J., Chin, M., Feingold, G., Remer, L. A., Anderson, T. L., Balkanski, Y., Bellouin, N., Boucher, O., and Christopher, S.: A review of measurement-based assessments of the aerosol direct radiative effect and forcing, Atmos. Chem. Phys., 6, 613–666, https://doi.org/10.5194/acp-6-613-2006, 2005.
Zhang, Q., Jimenez, J. L., Canagaratna, M. R., Allan, J. D., Coe, H., Ulbrich, I., Alfarra, M. R., Takami, A., Middlebrook, A. M., Sun, Y. L., Dzepina, K., Dunlea, E., Docherty, K., DeCarlo, P. F., Salcedo, D., Onasch, T., Jayne, J. T., Miyoshi, T., Shimono, A., Hatakeyama, S., Takegawa, N., Kondo, Y., Schneider, J., Drewnick, F., Borrmann, S., Weimer, S., Demerjian, K., Williams, P., Bower, K., Bahreini, R., Cottrell, L., Griffin, R. J., Rautiainen, J., Sun, J. Y., Zhang, Y. M., and Worsnop, D. R.: Ubiquity and dominance of oxygenated species in organic aerosols in anthropogenically-influenced Northern Hemisphere midlatitudes, Geophys. Res. Lett., 34, L13801, https://doi.org/10.1029/2007gl029979, 2007.
Zhou, Q., Pang, S. F., Wang, Y., Ma, J. B., and Zhang, Y. H.: Confocal raman studies of the evolution of the physical state of mixed phthalic acid/ammonium sulfate aerosol droplets and the effect of substrates, J. Phys. Chem. B, 118, 6198–6205, https://doi.org/10.1021/jp5004598, 2014.
Zuend, A. and Seinfeld, J. H.: Modeling the gas-particle partitioning of secondary organic aerosol: the importance of liquid-liquid phase separation, Atmos. Chem. Phys., 12, 3857–3882, https://doi.org/10.5194/acp-12-3857-2012, 2012.
Zuend, A., Marcolli, C., Peter, T., and Seinfeld, J. H.: Computation of liquid-liquid equilibria and phase stabilities: implications for RH-dependent gas/particle partitioning of organic-inorganic aerosols, Atmos. Chem. Phys., 10, 7795–7820, https://doi.org/10.5194/acp-10-7795-2010, 2010.