the Creative Commons Attribution 4.0 License.
the Creative Commons Attribution 4.0 License.
 | 23 Jun 2021
Separating emission and meteorological contributions to long-term PM2.5 trends over eastern China during 2000–2018
Qingyang Xiao
Yixuan Zheng
Cuihong Chen
Xiaomeng Huang
Huizheng Che
Xiaoye Zhang
Kebin He
Qiang Zhang
The contribution of meteorology and emissions to long-term PM2.5 trends is critical for air quality management but has not yet been fully analyzed. Here, we used the combination of a machine learning model, statistical method, and chemical transport model to quantify the meteorological impacts on PM2.5 pollution during 2000–2018. Specifically, we first developed a two-stage machine learning PM2.5 prediction model with a synthetic minority oversampling technique to improve the satellite-based PM2.5 estimates over highly polluted days, thus allowing us to better characterize the meteorological effects on haze events. Then we used two methods to examine the meteorological contribution to PM2.5: a generalized additive model (GAM) driven by the satellite-based full-coverage daily PM2.5 retrievals and the Weather Research and Forecasting/Community Multiscale Air Quality (WRF/CMAQ) modeling system. We found good agreements between GAM estimations and the CMAQ model estimations of the meteorological contribution to PM2.5 on a monthly scale (correlation coefficient between 0.53–0.72). Both methods revealed the dominant role of emission changes in the long-term trend of PM2.5 concentration in China during 2000–2018, with notable influence from the meteorological condition. The interannual variabilities in meteorology-associated PM2.5 were dominated by the fall and winter meteorological conditions, when regional stagnant and stable conditions were more likely to happen and when haze events frequently occurred. From 2000 to 2018, the meteorological contribution became more unfavorable to PM2.5 pollution across the North China Plain and central China but were more beneficial to pollution control across the southern part, e.g., the Yangtze River Delta. The meteorology-adjusted PM2.5 over eastern China (denoted East China in figures) peaked in 2006 and 2011, mainly driven by the emission peaks in primary PM2.5 and gas precursors in these years. Although emissions dominated the long-term PM2.5 trends, the meteorology-driven anomalies also contributed −3.9 % to 2.8 % of the annual mean PM2.5 concentrations in eastern China estimated from the GAM. The meteorological contributions were even higher regionally, e.g., −6.3 % to 4.9 % of the annual mean PM2.5 concentrations in the Beijing-Tianjin-Hebei region, −5.1 % to 4.3 % in the Fenwei Plain, −4.8 % to 4.3 % in the Yangtze River Delta, and −25.6 % to 12.3 % in the Pearl River Delta. Considering the remarkable meteorological effects on PM2.5 and the possible worsening trend of meteorological conditions in the northern part of China where air pollution is severe and population is clustered, stricter clean air actions are needed to avoid haze events in the future.
- Article
(11871 KB) - Full-text XML
- BibTeX
- EndNote


Air pollution, especially PM2.5 pollution, has become a serious problem in China in the past decades. Variations in air pollution are primarily driven by two factors: emissions and meteorology. Anthropogenic emissions dominate the long-term trend of air pollution (Q. Zhang et al., 2019; N. Cheng et al., 2019), and meteorological conditions also notably influence the daily, seasonal, interannual, and interdecadal air pollution variations (Zhang et al., 2018; Z. Chen et al., 2020; P. Wang et al., 2019; Zhai et al., 2019). In China, the PM2.5 pollution dropped remarkably since the implementation of strict clean air policies, e.g., “the Air Pollution Prevention and Control Action Plan” (denoted “Action Plan”, 2013–2017; State Council of the People’s Republic of China, 2020a) and the Blue Sky Protection Campaign (2018–2020; State Council of the People’s Republic of China, 2020b). Previous studies reported that the PM2.5 and other air pollutant emissions dropped significantly during this period (Bian et al., 2019; Liu et al., 2015). Previous studies also estimated the contribution of meteorology to the air quality improvement. X. Zhang et al. (2019) reported that about 13 % and 20 % of total PM2.5 decline during 2013–2017 are due to meteorological effects in Beijing-Tianjin-Hebei (BTH) and Yangtze River Delta (YRD), respectively, estimated from the Parameter Linking Aerosol pollution and Meteorological elements (PLAM) (Yang et al., 2009). Q. Zhang et al. (2019) reported that meteorological changes led to a 16 % decrease and a 4 % increase in PM2.5 changes during 2013–2017 in BTH and YRD, estimated from chemical transport model (CTM) simulations. Zhai et al. (2019) reported that after adjustment of meteorological effects, the PM2.5 decline during 2013–2018 was 14 % weaker in BTH and 3 % stronger in YRD, respectively, estimated from a statistical model. Previous studies further analyzed the long-term trend of effects of meteorological systems and climate change on PM2.5 pollution, especially in the context of global warming (Liu et al., 2017; Wang and Chen, 2016; Yi et al., 2019). For example, Feng et al. (2020) reported a trend of negative meteorological effects on air quality improvements in northern China during 1980–2018, but the effects dropped during 2013–2018. Xu et al. (2020) also reported a trend of negative meteorological effects during 2000–2017 in Beijing but an overall trend of beneficial meteorological effects in some provinces in northern China. Distinguishing the contributions of emission and meteorology is critical for the evaluation of clean air policies, projection of the future air quality, and understanding of pollution processes.
Various methods have been reported to separate the contributions of emissions and meteorology (Z. Chen et al., 2020; L. Chen et al., 2020). CTMs simulate the atmospheric processes with emission inventory and meteorology fields as inputs, thus allowing researchers to assess the changes in air pollution attributable to one factor when controlling another factor (P. Wang et al., 2019; Xu et al., 2020; Zheng et al., 2017). CTM simulations have been widely used to separate the contributions of meteorology and anthropogenic emissions to air pollution variations. However, these model simulations require considerable computation resources, and the quality of inputs (e.g., emission inventory and meteorology) affects the quality of simulations. Uncertainties in the historical emission inventory as well as in the simulated meteorological fields affected the modeling results. Researchers' selection of chemical reaction mechanisms as well as parameter optimization could also lead to varying results (Z. Chen et al., 2020). Moreover, due to the interactions between emissions and meteorology, the simulations in the fixed emission scenarios and the fixed meteorology scenarios may not fully reflect real-world conditions.
Other studies have applied statistical methods to assess the meteorology-associated changes in air pollution and to quantify the contribution of emissions. Multiple linear regression (MLR) has been adopted to describe the relationships between meteorology and air pollutant concentrations (N. Cheng et al., 2019; Sá et al., 2015). For example, Zhai et al. (2019) constructed deseasonalized and deseasonalized–detrended time-series data and assessed the meteorological effects by MLR. Since the linear model may not fully characterize the nonlinear associations and interactions between air pollution and meteorology, some studies also employed machine learning algorithms that better describe the complex relationships between meteorology and air pollution (Grange et al., 2018; Vu et al., 2019; Zhang et al., 2020; Qu et al., 2020). As such methods require continuous PM2.5 data as inputs, previous studies relied on PM2.5 ground measurements that were limited to certain locations (e.g., ground monitoring stations) and times (e.g., after 2013 in China). The limited sample size not only affected the model quality by introducing sampling bias but also hampered the analyses on spatial heterogeneity and long-term trend of meteorology contributions across China. The analysis of the complete-coverage long-term trends of meteorology and emission contributions to air pollution is urgently needed to support further evaluation of clean air policies and region-specific air quality management within the context of climate change.
In this study, we aimed to analyze the spatiotemporal trends in meteorology- and emission-associated PM2.5 variations across China during 2000–2018. The meteorological impacts on PM2.5 trends were assessed with data-fusion PM2.5 predictions and chemical transport model simulations, taking advantage of the complete spatiotemporal coverage and long data records of these two datasets. The data-fusion PM2.5 predictions were derived by combining satellite data, chemical transport model simulations, ground measurements, and ancillary data with an optimized two-stage machine learning model that improved the PM2.5 estimates during highly polluted days. Then we assessed the long-term variations in meteorology-associated PM2.5 using a generalized additive model (GAM) that better described the nonlinear associations between PM2.5 and meteorology. We also estimated the meteorological impacts on PM2.5 trends with chemical transport model simulations under different scenarios coupled with a recent emission inventory. We showed that the temporal trends of meteorology-associated PM2.5 estimated from the GAM method and from the chemical transport model were highly consistent. The trend analysis of the meteorology and emission contributions to PM2.5 could support air quality management plans in the future.
This study employed simulations from the Weather Research and Forecasting/Community Multiscale Air Quality (WRF/CMAQ) modeling system as well as gridded PM2.5 predictions fused from multiple data sources to assess the meteorological effects on PM2.5 (Fig. 1). The study domain covers eastern China (east of 105∘ E), and the PM2.5 concentrations during 2000–2018 were analyzed.
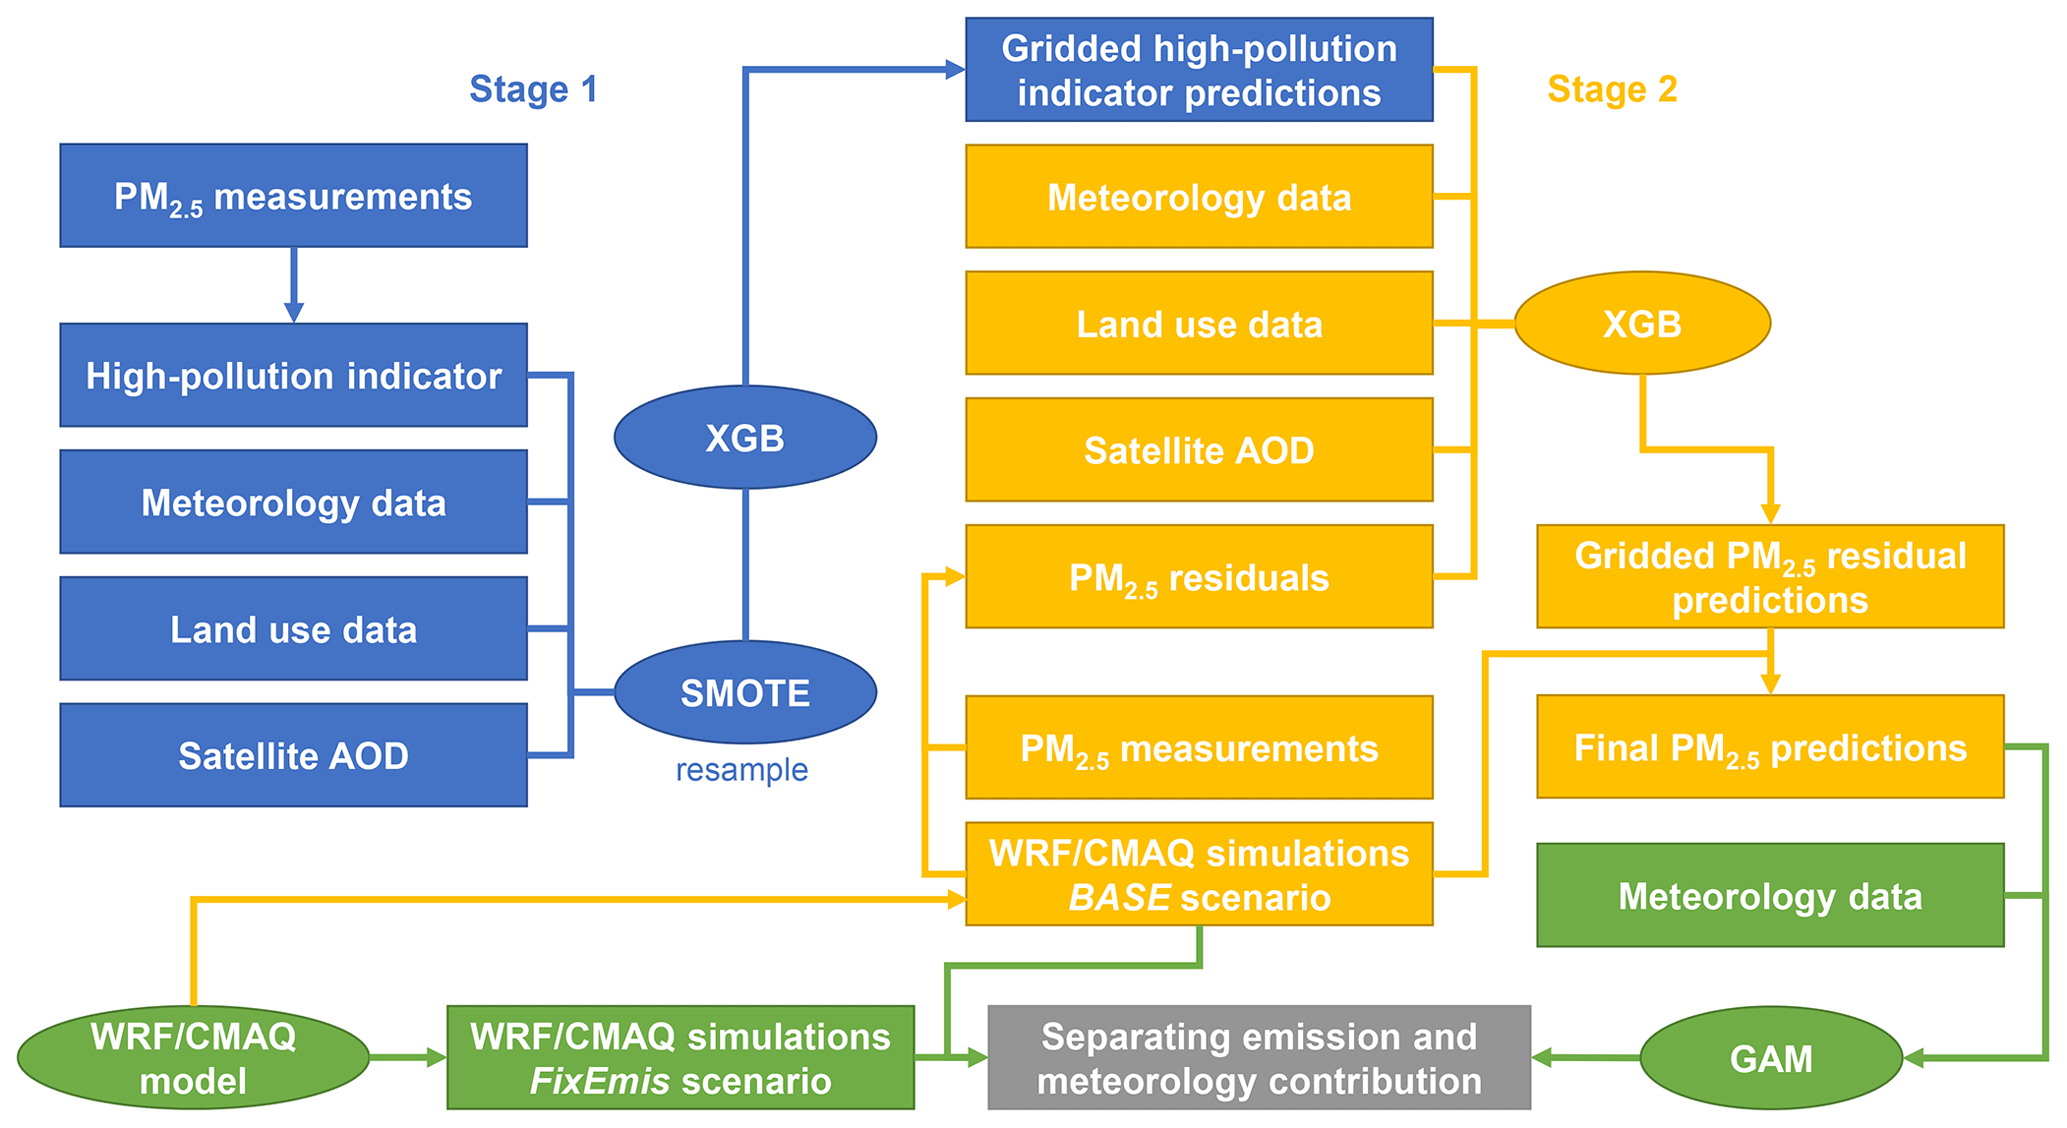
Figure 1Methodology framework of this study. The green process shows the two methods that separate emission and meteorology contributions to PM2.5 in this study. The first method assesses the meteorology-associated PM2.5 from WRF/CMAQ simulations with the fixed emissions at the 2000 level and varying meteorological inputs. The second method assesses the meteorology-associated PM2.5 with satellite-based PM2.5 estimations and a generalized additive model (GAM). The processing of satellite-based PM2.5 estimation includes two stages. In stage 1 (blue), we constructed a measurement-based high-pollution indicator and trained an extreme gradient boosting (XGB) model to predict the high-pollution indicator. In stage 2 (yellow), we trained a XGB model to predict the residuals of WRF/CMAQ simulations with high-pollution indicator as well as satellite AOD, meteorology, and land use data as predictors.
2.1 Satellite-based PM2.5 retrievals
Previously reported satellite-based PM2.5 data tended to underestimate high-pollution events (Xiao et al., 2018; Xue et al., 2019), because these events rarely occurred in the model training dataset and were less characterized by the model. Since high-pollution events were largely affected by meteorological conditions (Zhang et al., 2015; T. Liu et al., 2017), correctly capturing these events was critical for the assessment of meteorological contributions. Thus, we developed a two-stage model to improve the prediction accuracy of PM2.5 estimates, especially over highly polluted days, and obtained a spatiotemporally continuous daily PM2.5 dataset during 2000–2018. The updated near real-time PM2.5 predictions during 2000–current can be downloaded in our Tracking Air Pollution in China (TAP) website (http://tapdata.org/, last access: 17 March 2020).
2.1.1 Data for PM2.5 modeling
We assimilated the daily PM2.5 measurements, WRF/CMAQ simulations, satellite aerosol optical depth (AOD) from Aqua and Terra MODIS Level 2 products (https://ladsweb.modaps.eosdis.nasa.gov/, last access: 7 September 2020), meteorological parameters from the Modern-Era Retrospective analysis for Research and Applications Version 2 (MERRA-2) (Randles et al., 2017; Buchard et al., 2017), elevation data from the Global Digital Elevation Model (GDEM) (https://earthexplorer.usgs.gov/, last access: 15 September 2018), gridded population distributions (Xiao et al., 2021b), and land cover classification data (http://data.ess.tsinghua.edu.cn, last access: 9 April 2020) (Gong et al., 2019a, b) to train the PM2.5 prediction model and predicted PM2.5 concentrations during 2000–2018. The detailed data collection and processing methods are summarized in Appendix A.
2.1.2 The two-stage prediction model
A two-stage prediction model was developed to estimate PM2.5 concentrations over China (Fig. 1). The first-stage model described high-pollution events that were underestimated in previous models, and the second-stage model predicted residuals of CMAQ PM2.5 simulations with the estimated high-pollution indicator from the first-stage model.
Since high-pollution events relatively rarely occur in the model training dataset, models may not appropriately characterize the associations between high PM2.5 concentrations and predictors, leading to underestimation of high-pollution levels (Wei et al., 2020). In this study, we first defined a high-pollution indicator, describing whether the daily PM2.5 observation was higher than the monthly average PM2.5 concentration plus 2 standard deviations at each location. We noticed that only 3.9 % of the daily data were assigned as high-pollution levels. To balance high-pollution samples and normal samples, the synthetic minority oversampling technique (SMOTE) (Torgo, 2010) that improved classifiers' performance in previous studies (Ghorbani and Ghousi, 2020; Saputra and Suharjito, 2019) was applied. The SMOTE algorithm oversampled the high-pollution data (the minority) by artificially generated new synthetic samples along the line between the high-pollution data and their selected nearest neighbors (Chawla et al., 2002, 2003). This method also undersampled the normal data (the majority) to better balance the model training dataset. After SMOTE resampling, high-pollution data accounted for 23 % in the new model training dataset.
The balanced model training dataset was adopted to train the first-stage extreme gradient boosting (XGBoost) model that built the relationship between the high-pollution indicator and all the predictors, excluding CMAQ simulations. The predicted high-pollution indicator from the first-stage model was passed to the second-stage model as a predictor. We adopted the residual between the PM2.5 measurement and the CMAQ PM2.5 simulation as the dependent variable to train the second-stage model, thus enhancing the response of predictors to PM2.5 variations and improving the prediction accuracy.
To fill any missing satellite data, in both the first- and second-stage model, we assigned the availability of satellite retrievals as a dichotomous predictor and constructed it as the cutoff point of the first layer of the decision tree to separate the training data, thus mining the association between the availability of satellite retrievals and the PM2.5 concentration. This method that fills missing PM2.5 predictions with a decision tree outperformed other gap-filling methods in our previous evaluation study (Xiao et al., 2021a). The inclusion of CMAQ simulations also improved the accuracy of the gap-filled results.
The model's hyperparameter optimization and performance evaluation were conducted through fivefold cross-validation (CV), by-year CV, and by-location CV (Appendix A1).
2.2 Assessment of the meteorological effects on PM2.5 using GAM
Following the method described by Zhai et al. (2019), we constructed time-series data to distinguish the long-term, seasonal, and short-term trends of PM2.5 concentrations and meteorological conditions. Then the associations between PM2.5 and meteorology were fitted with a GAM, using daily satellite-based PM2.5 predictions as dependent variable. GAM has been previously used to predict PM2.5 concentrations with meteorology and other predictors (Yanosky et al., 2014; Liu et al., 2009; Xiao et al., 2018). The meteorological predictors in the GAM included 10 m wind speed, 2 m specific humidity, 2 m air temperature, total precipitation, 10 m eastward wind (U wind), 10 m northward wind (V wind), U wind at 500 hPa, V wind at 500 hPa, and planetary boundary layer height. These meteorological parameters have been reported to be strongly associated with PM2.5 concentrations in various regions in China (Z. Chen et al., 2020; Feng et al., 2020) and contributed significantly in previous PM2.5 prediction models (She et al., 2020).
Both the PM2.5 data and the meteorology data followed the same processing protocol. First, we calculated 10 d average data, 50 d average data, and 19-year (2000–2018) average data based on the 50 d average data. We constructed deseasonalized–detrended data by removing the 50 d average data from the 10 d average data. We also constructed deseasonalized data by removing the 19-year average of the 50 d average data from the 10 d average data. Assuming that the associations between PM2.5 and meteorological parameters remained constant, we estimated these associations by a grid-specific seasonal and year-round GAM (Pearce et al., 2011) with the deseasonalized–detrended data. The GAM allows for a nonlinear response of PM2.5 levels to meteorological conditions, thus providing better fits to the training data (Table B1). We also fitted grid-specific seasonal stepwise MLR in a sensitivity analysis to examine whether the selection of model affects the assessment of meteorological effects. Additionally, normalized meteorological parameters were used to fit the linear regression. Hence, the estimated coefficients reflected the relative contribution of each meteorological parameter and supported the spatial analysis of the meteorological effects. Since the seasonal model attained a higher average model R2 than the year-round model did (Table A1), the results obtained with the seasonal model are presented in this study. Thus, the meteorological effects on PM2.5 long-term variations were assessed as the GAM-estimated responses of PM2.5 to variations in the deseasonalized meteorological parameters.
2.3 Assessment of the meteorological effects on PM2.5 using WRF/CMAQ
We also used the WRF/CMAQ model to separate the contribution of emissions and meteorology on PM2.5 trends. The CMAQ model version 5.1 driven by the WRF model version v3.5.1 were used in this study, and the model configurations were following previous studies (Zheng et al., 2017). The initial and boundary conditions for WRF were derived from the National Centers for Environmental Prediction Final Analysis (NCEP-FNL) reanalysis data (National Centers for Environmental Prediction/National Weather Service/NOAA/U.S. Department of Commerce, 2000). The boundary conditions for CMAQ were taken from the global GEOS-Chem (Bey et al., 2001) model simulations. We used CB05 (Yarwood et al., 2005) as the gas-phase mechanism, AERO6 (United States Environmental Protection Agency, 2012) as the aerosol module, and Regional Acid Deposition Model (RADM) as the aqueous-phase chemistry model in CMAQ. The anthropogenic emissions for mainland China were taken from the Multi-resolution Emission Inventory of China (MEIC; http://meicmodel.org/, last access: 17 March 2019) (Zheng et al., 2018; Li et al., 2017a), and emissions beyond mainland China were from the MIX Asian emission inventory (Li et al., 2017b).
Two scenarios were conducted to estimate the meteorological impacts on PM2.5 trends: the BASE scenario and the FixEmis scenario. The BASE scenario was simulated with year-by-year emissions and meteorology during 2000–2018, while the FixEmis scenario was conducted using fixed emissions at the 2000 level and year-by-year meteorological inputs. The simulations of the FixEmis scenario were calibrated by multiplying the ratio between the satellite-based PM2.5 estimates in Sect. 2.1 and the BASE scenario PM2.5 simulations. The meteorological effects on PM2.5 long-term trends were assessed as the 10 d average of daily simulations in the FixEmis scenario minus the 19-year average of FixEmis simulations. The PM2.5 simulations from the BASE scenario also supported the PM2.5 estimates in Sect. 2.1.
The evaluation of meteorological simulations of surface temperature, surface relative humidity, surface wind speed, and surface wind direction from WRF against ground-level observations from the National Climate Data Center (NCDC; ftp://ftp.ncdc.noaa.gov/pub/data/noaa/, last access: 20 November 2019) were summarized in Fig. A1. The WRF model well reproduced the near-surface temperature (r= 0.98, normalized mean bias = −1.9 %) and relative humidity (r= 0.81, normalized mean bias = 5.4 %) but slightly overestimated surface wind speed (r= 0.57, normalized mean bias = 8.0 %). The WRF simulation quality of temperature, relative humidity, and wind direction was consistent across years, but the simulation quality of wind speed showed slightly larger interannual variations. The validation results showed that the WRF simulations were acceptable to support further simulation of PM2.5 concentrations. The evaluation of PM2.5 simulations from CMAQ during the time period when ground measurements are available has been reported in our previous study (Q. Zhang et al., 2019). Compared to the measurements from ground monitoring stations, our model simulations well reproduced the spatial and temporal distributions of PM2.5 across China. Compared to the daily PM2.5 measurements in 74 cities, the CMAQ simulations obtained correlation coefficient R higher than 0.6 in 67 cities. The simulated PM2.5 decrease (30 %) during 2013–2017 over China also well matched the observed PM2.5 decrease (33 %).
3.1 Evaluation of the two-stage PM2.5 prediction model
The SMOTE resampling approach improved the prediction accuracy in the fivefold CV such that the area under the curve (AUC) increased from 90.7 to 98.7 (Fig. A2). The two-stage model predictions in the fivefold CV matched the ground measurements well with an R2 of 0.80 and RMSE of 18.5 µg m−3 (Fig. A2). The prediction accuracies in the by-location CV (R2 of 0.71 and RMSE of 22.1 µg m−3) and by-year CV (R2 of 0.58 and RMSE of 27.5 µg m−3) were lower than that in the fivefold CV, indicating that unobserved temporal and spatial trends contributed to the PM2.5 prediction. The model performance was comparable to that reported in previous studies (Xiao et al., 2018; He and Huang, 2018; Dong et al., 2020).
Specifically, compared to a benchmark model without SMOTE resampling and setting the PM2.5 concentration as the dependent variable, the two-stage model in this study better predicted high-pollution events (Fig. 2). The density distribution of the PM2.5 predictions from the two-stage model was closer to the density distribution of the PM2.5 measurements. The density distribution of the PM2.5 predictions from the benchmark model showed a higher percentage of low PM2.5 concentrations and a lower percentage of high PM2.5 concentrations than those revealed by the density distribution of the measurements. The greater ability of our two-stage model in capturing the daily variations in PM2.5 concentrations could better support our following analysis about meteorological impacts.
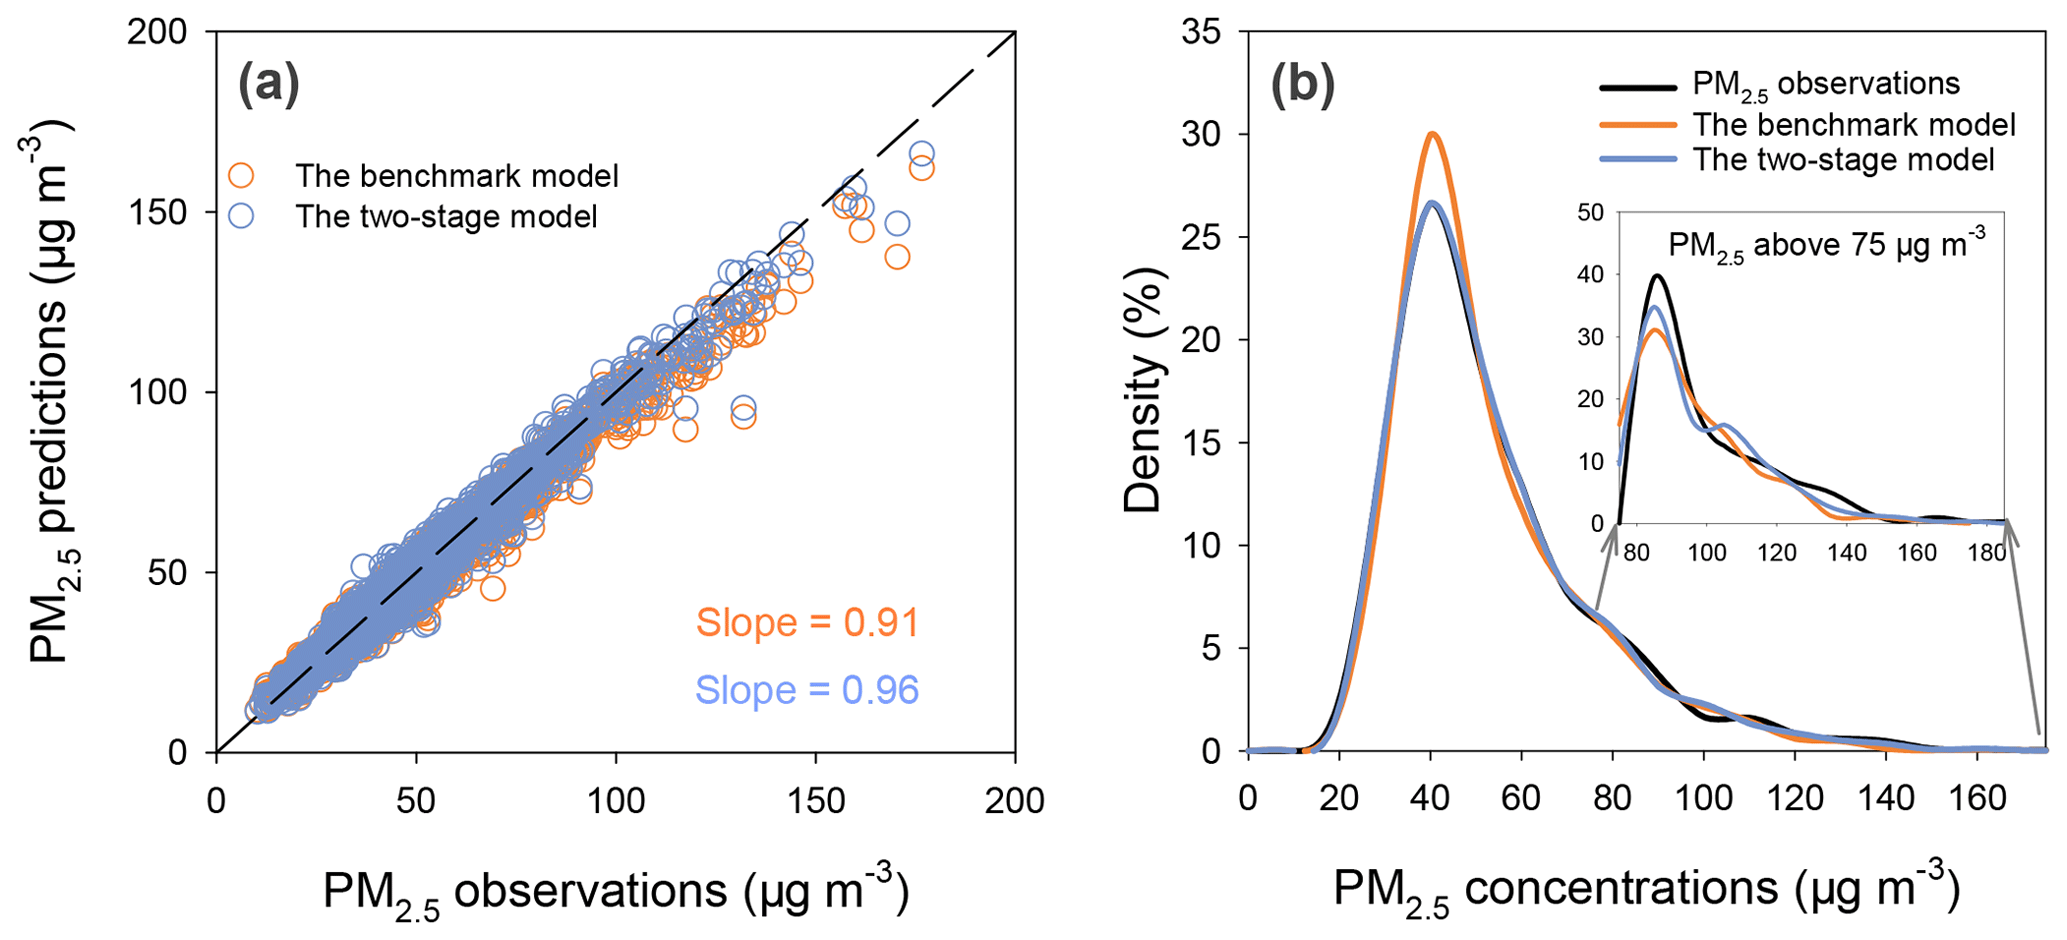
Figure 2Comparisons between the two-stage model and the benchmark model. (a) The scatter plot of the two-stage model predictions and the benchmark model predictions against ground observations in the fivefold cross-validation (CV). (b) Density distributions of the two-stage model predictions, the benchmark model predictions, and the PM2.5 observations in the fivefold CV.
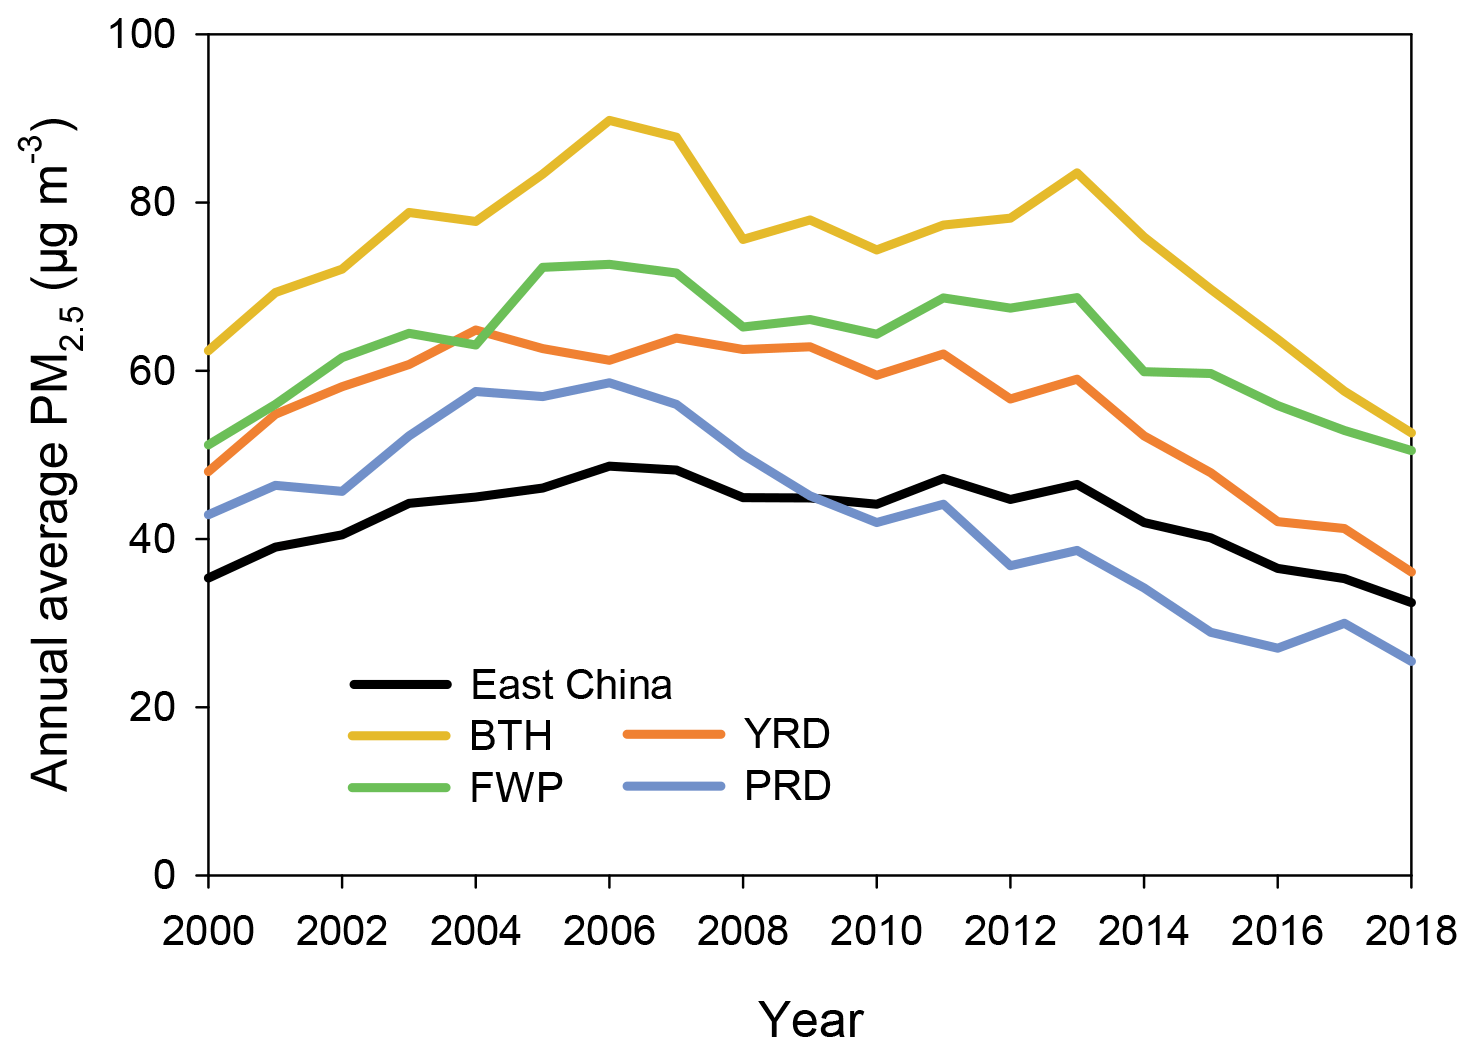
Figure 3Temporal trends of the annual average satellite-based PM2.5 concentrations over eastern China and the key regions during 2000–2018. BTH: Beijing-Tianjin-Hebei; FWP: Fenwei Plain; YRD: Yangtze River Delta; PRD: Pearl River Delta.
Figure 3 shows the PM2.5 trends during 2000–2018 in eastern China, as well as the key regions including BTH, YRD, the Fenwei Plain (FWP), and the Pearl River Delta (PRD). The PM2.5 concentrations continuously increased from 35.4 µg m−3 in 2000 to 48.7 µg m−3 in 2006 over eastern China. It then remained relatively constant from 2007 to 2013 and decreased from 46.5 µg m−3 in 2013 to 32.5 µg m−3 in 2018. BTH and FWP showed consistent temporal trends of PM2.5, with higher pollution levels over BTH. However, the difference in PM2.5 level between BTH and FWP has greatly decreased since 2015 due to the higher rate of PM2.5 decrease in BTH resulting from the stricter emission control policies. The PM2.5 level in the PRD reached its peak in 2006 and decreased thereafter. The observed PM2.5 concentrations in 2018 were 14.0, 30.9, 18.2, 22.9, and 13.2 µg m−3 lower than those in 2013 over eastern China, BTH, FWP, YRD, and PRD, respectively.
3.2 Interannual and seasonal variabilities of meteorology-associated PM2.5
Figure 4 shows the meteorological contribution in monthly average PM2.5 concentrations estimated from the GAM and CMAQ simulations. The temporal trends of meteorology-associated PM2.5 estimated from these two methods were consistent across eastern China and in the key regions, with the correlation coefficients ranging between 0.53 (eastern China) and 0.72 (BTH). For example, the GAM estimated typical favorable meteorological conditions in October 2013, October 2012, and February 2016 in BTH, which are also captured by the CMAQ model. However, the magnitude of the meteorological effects estimated by CMAQ were slightly higher than GAM.
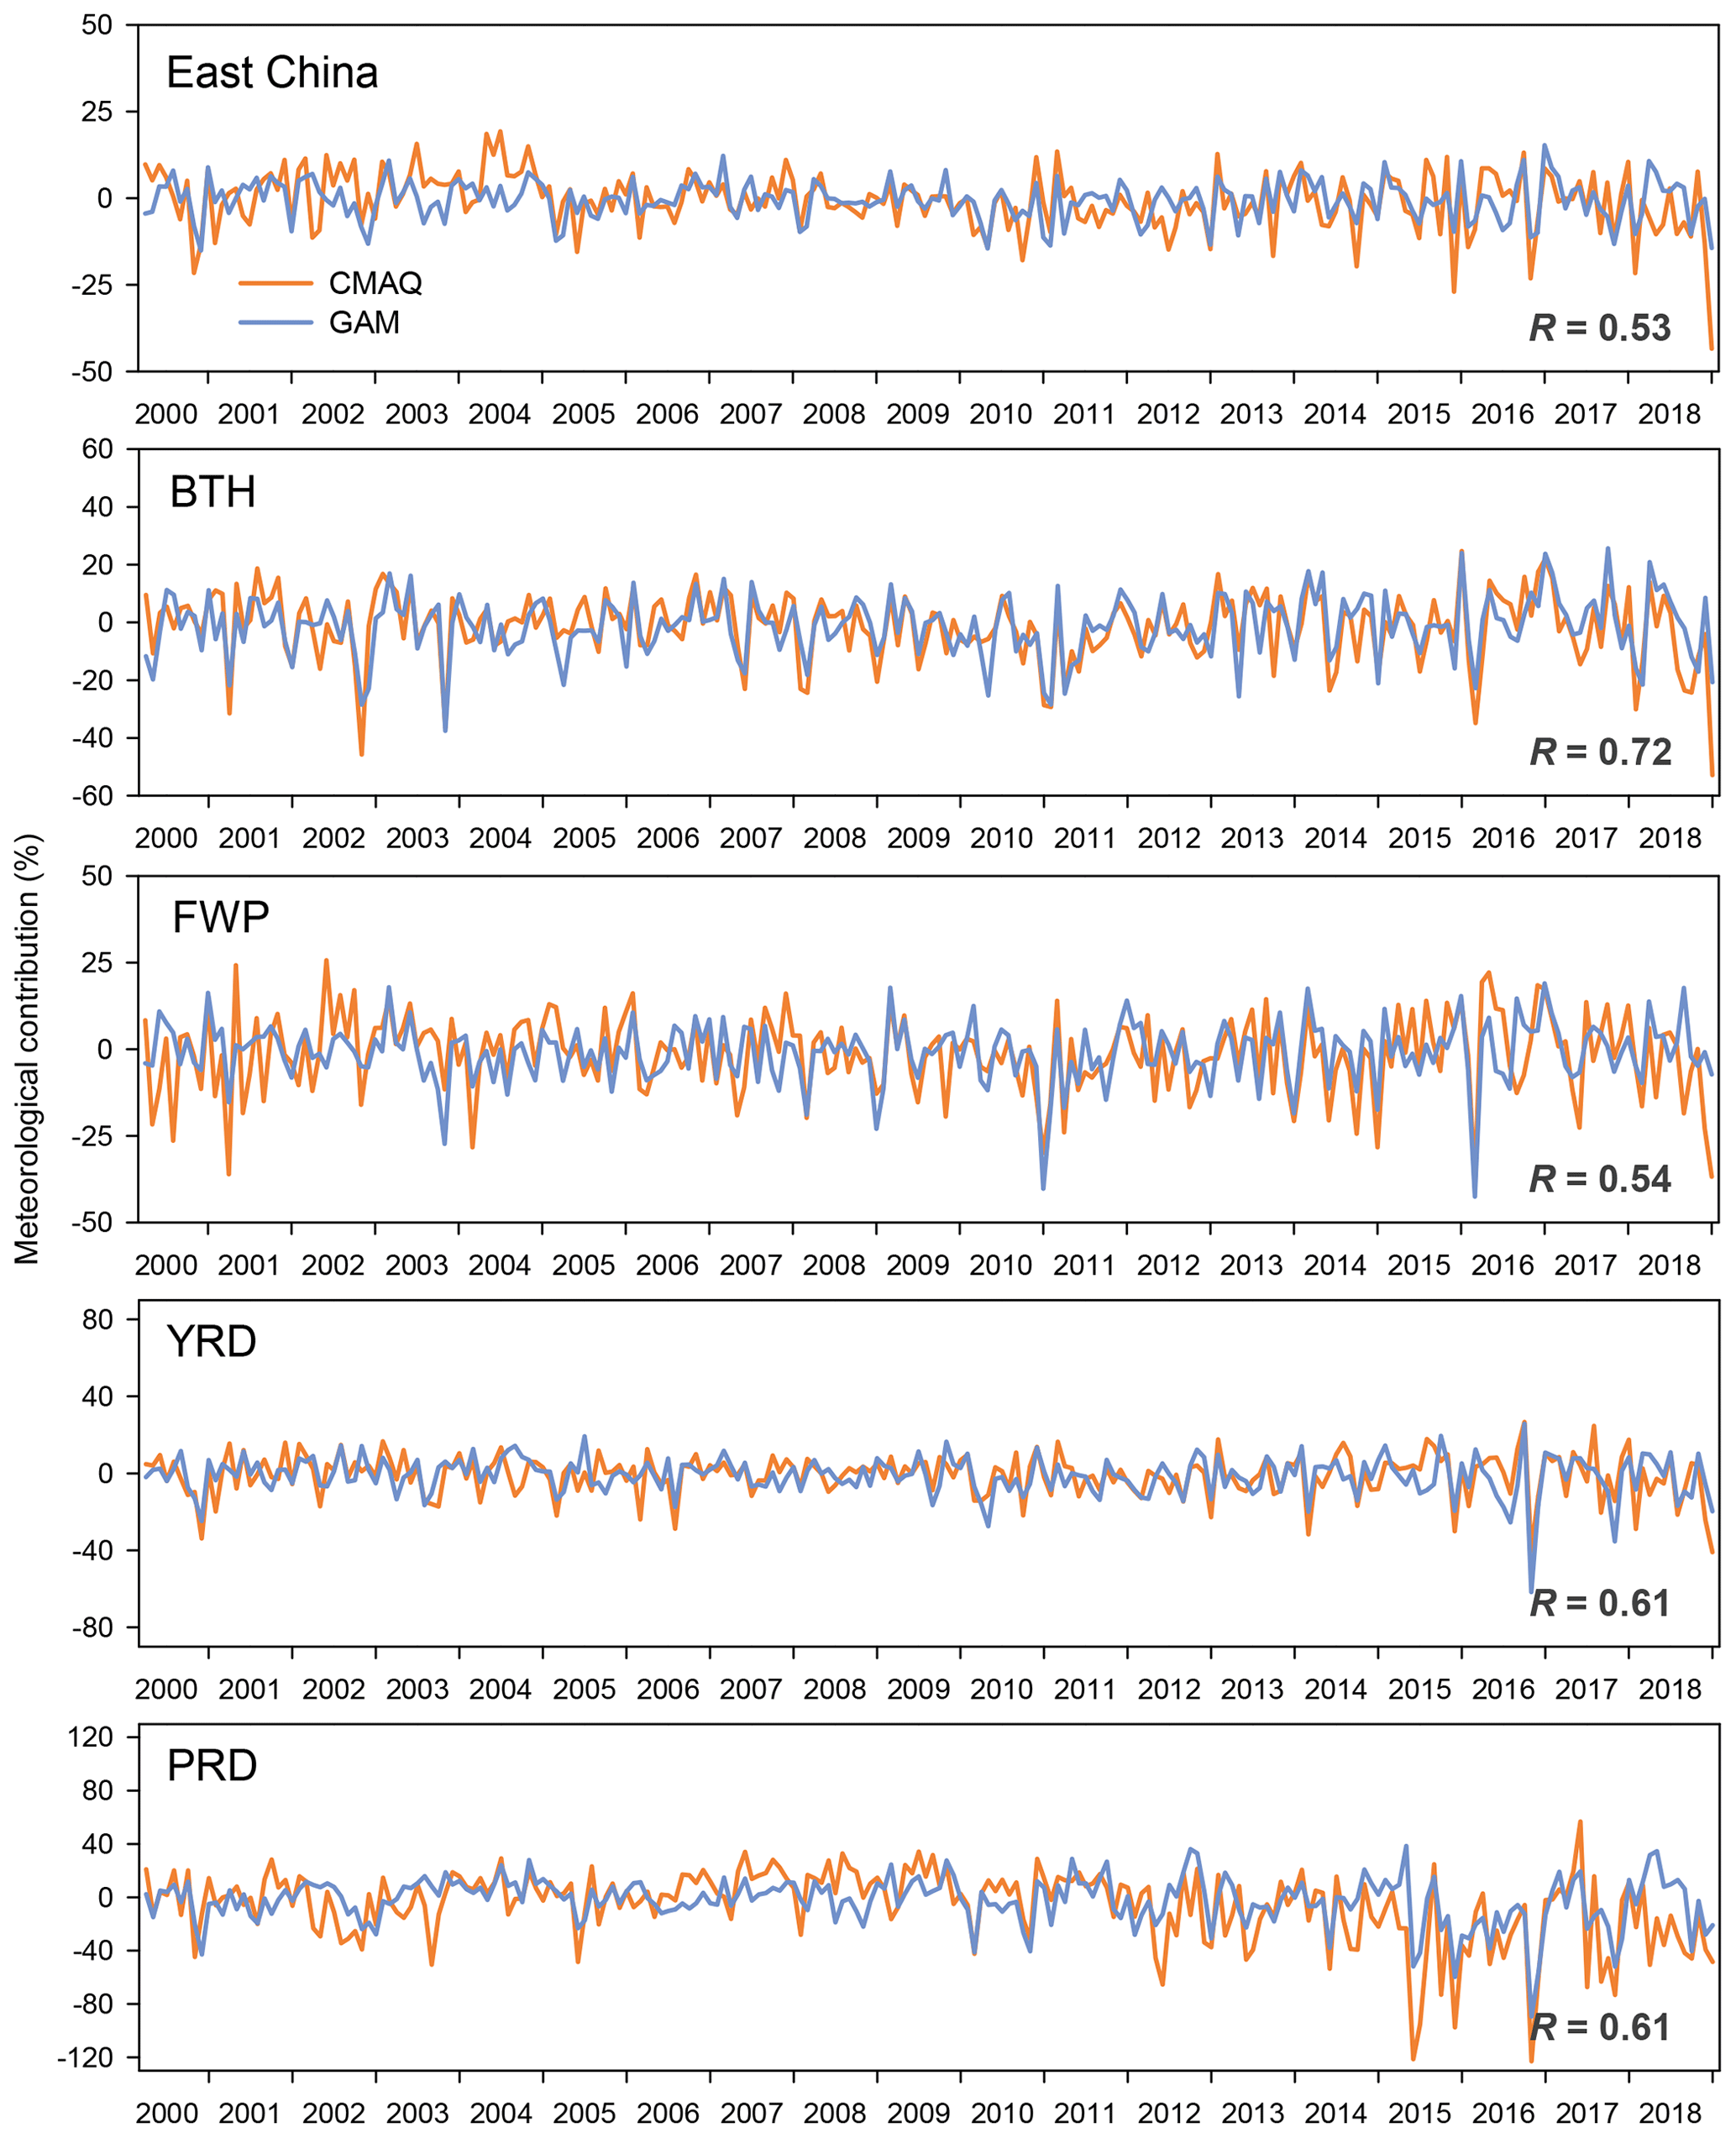
Figure 4Fractional contribution of meteorology to PM2.5 concentrations on the monthly scale during 2000–2018, estimated from CMAQ (the orange line) and GAM (the blue line).
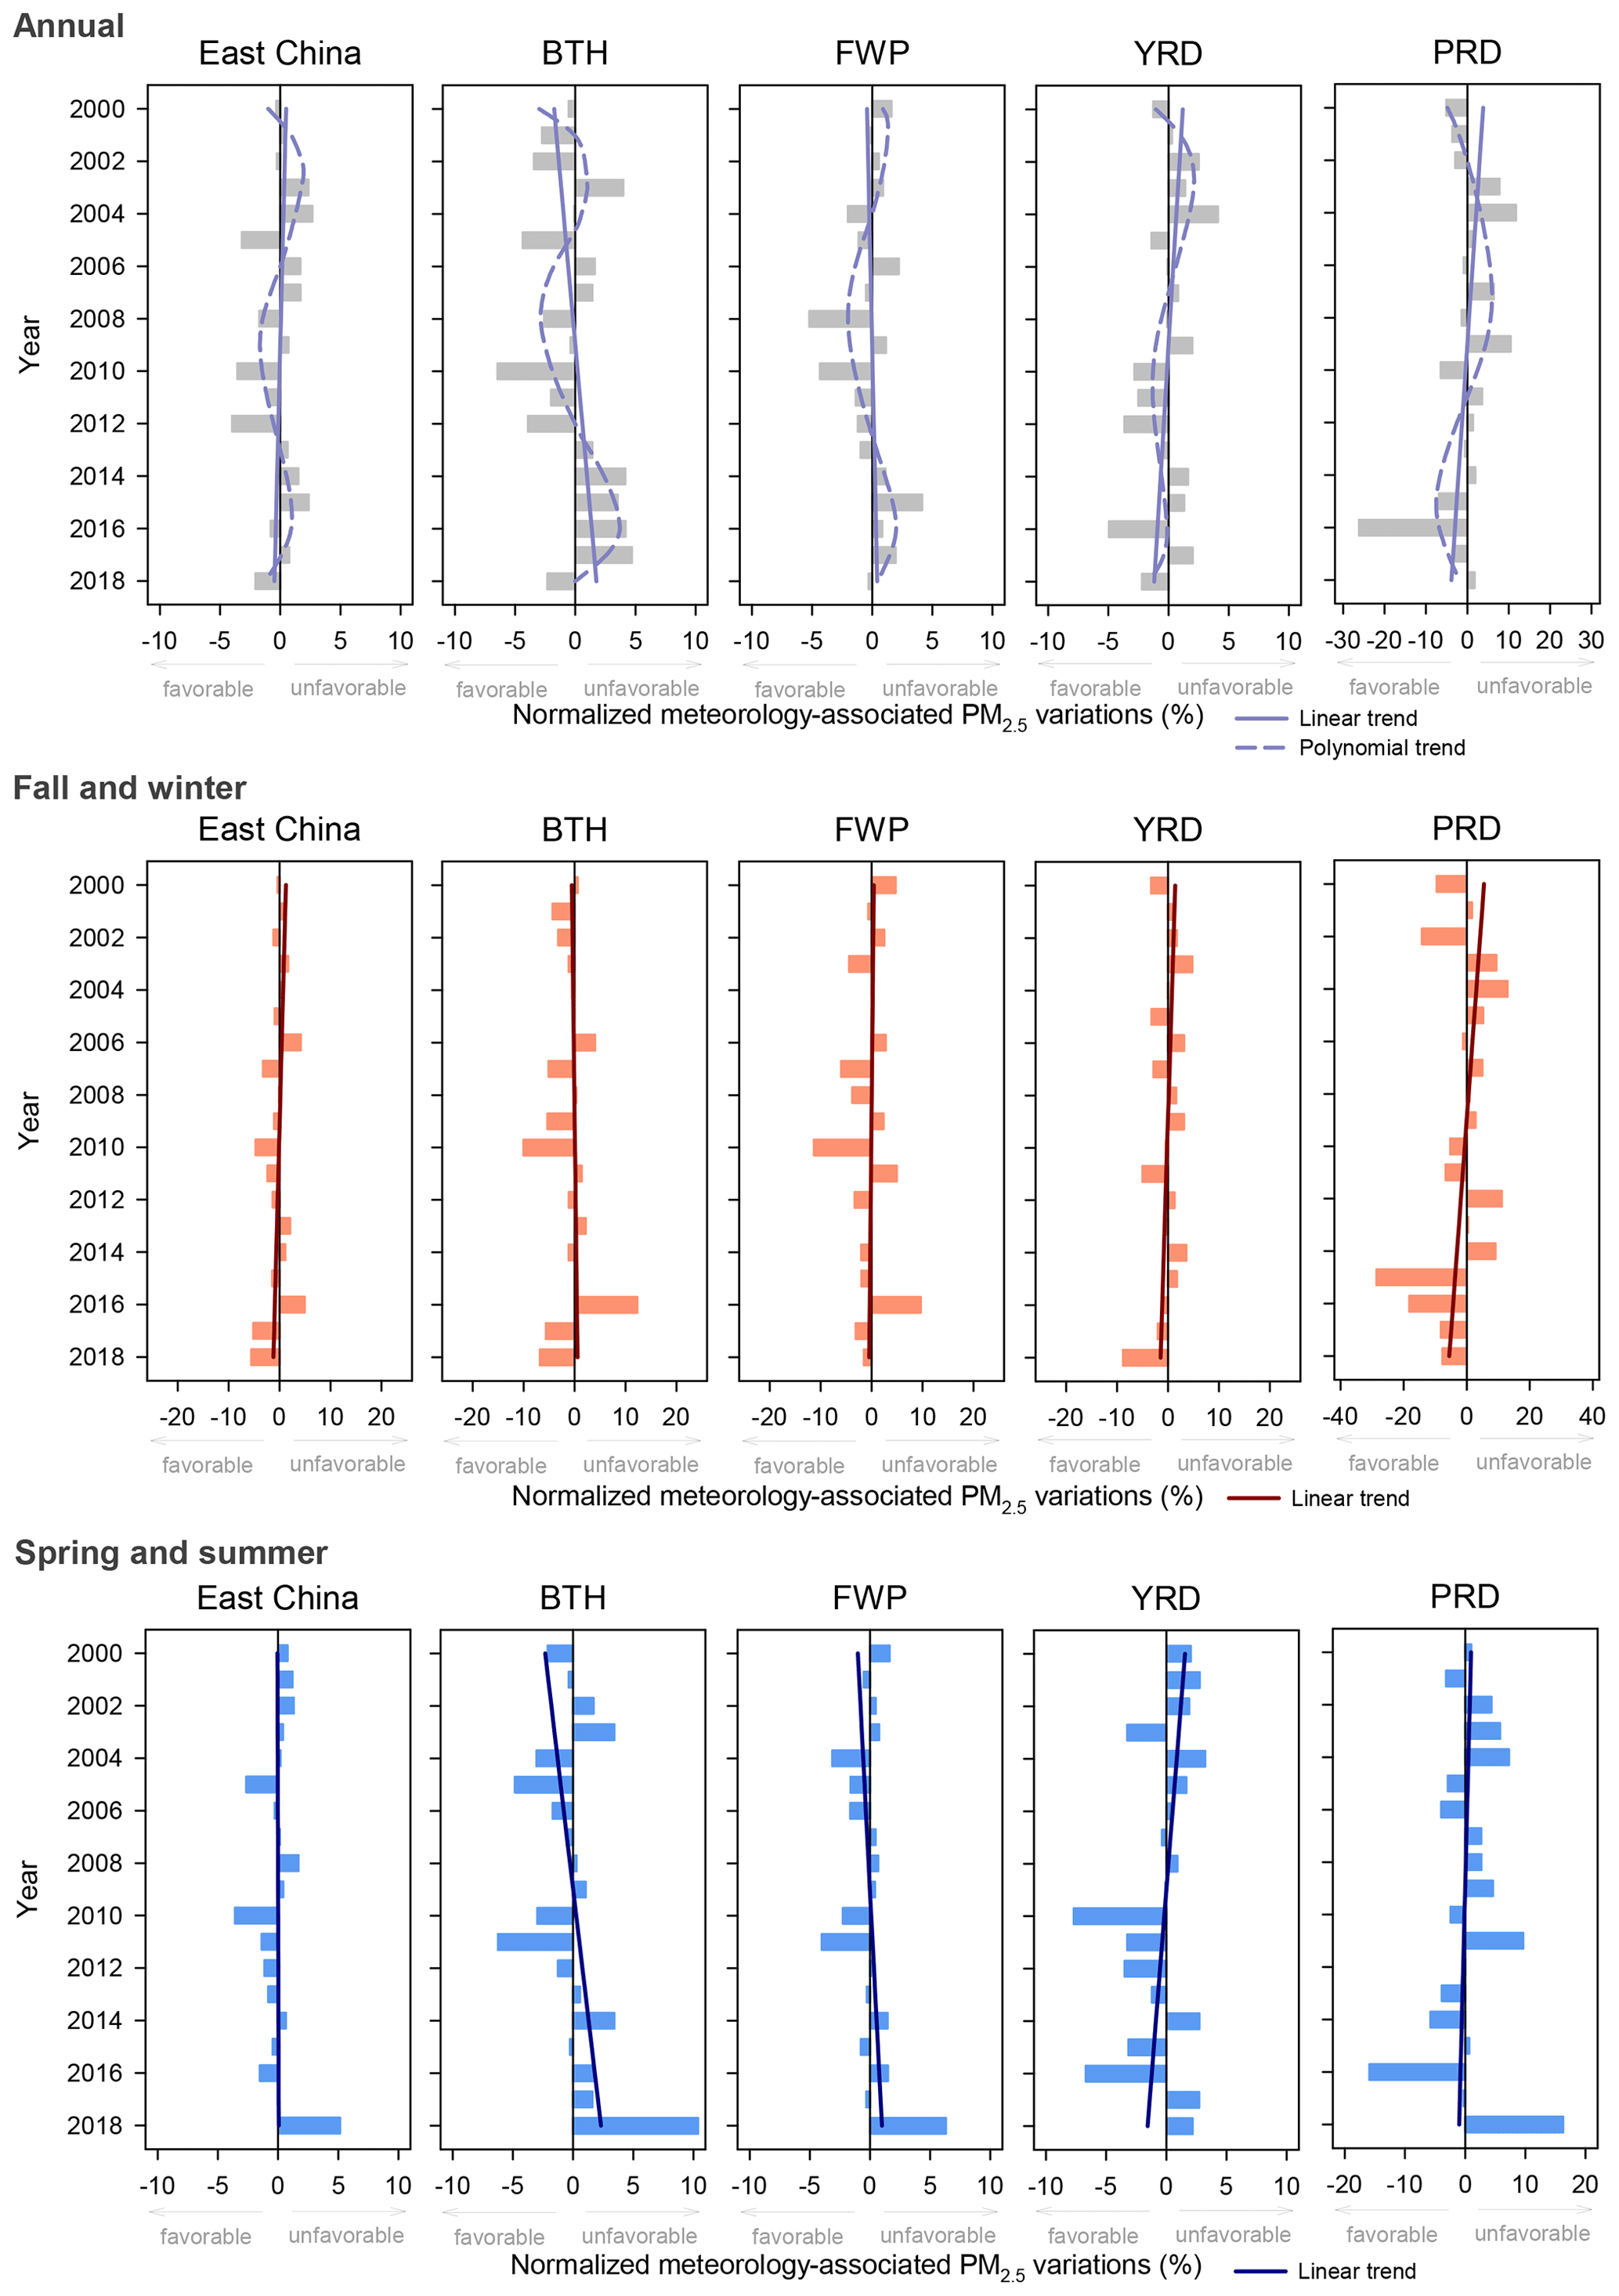
Figure 5The GAM-estimated relative impact of meteorology on annual average PM2.5 (top row), relative impact of meteorology on average PM2.5 in fall–winter (September, October, November, December, January in next year, and February in next year) (middle), and relative impact of meteorology on average PM2.5 in spring–summer (bottom row) with the long-term trends estimated by polynomial and linear regressions over eastern China, BTH, FWP, YRD, and PRD.
Figure 5 shows the GAM estimated temporal trend in meteorology-associated PM2.5 across eastern China. Consistent with the CMAQ estimation (Fig. A3), 2012 is a typical year during which the meteorological conditions were favorable to PM2.5 pollution control over eastern China, with an annual meteorology-associated PM2.5 anomaly of −1.8 µg m−3 (4.07 %) (Fig. 5). Year 2004 is a typical year during which the meteorological conditions were unfavorable to PM2.5 pollution control, with an annual meteorology-associated PM2.5 increase of 1.2 µg m−3 (2.60 %). The meteorological effects changed drastically over a relatively short time period. For example, in 2005, the meteorological conditions were greatly favorable to pollution control, but in the previous and following years, i.e., 2004 and 2006, respectively, the meteorological conditions were greatly unfavorable to pollution control. The long-term trend of the annual meteorology-associated PM2.5 fluctuated about 0 across eastern China, with a decreasing trend (the meteorological conditions improving) from 2003 to 2010 and an increasing trend (the meteorological conditions worsening) from 2010 to 2017 (Figs. 5, A3). The CMAQ simulations estimated the largest unfavorable meteorological contribution in 2018 of 11.0 % and the greatest beneficial meteorological contribution in 2012 of 7.2 % over eastern China.
The interannual variations in the meteorology-associated PM2.5 assessed in this study were consistent with those reported in previous studies (Zhang et al., 2018). For example, Feng et al. (2020) presented the long-term variations in air stagnation in northern China that characterized the circulation and diffusion in the boundary layer with fixed emissions to describe the temporal trend of haze-related weather conditions. The temporal pattern of the air stagnation index from 2000 to 2018 closely resembled the temporal trend of the estimated meteorological-associated PM2.5 in this study. Additionally, we observed unfavorable meteorological conditions in the winters of 2014 and 2016, consistent with the previously reported climate anomalies in these two years (Yin et al., 2017; Yin and Wang, 2017). We also showed that the meteorological conditions in 2014 and 2015 were more unfavorable to PM2.5 pollution control than those in 2013 over eastern China, as previously reported (X. Zhang et al., 2019; P. Wang et al., 2019).
Since haze events that greatly affect public health mainly occur in fall and winter (Zhao et al., 2013), we analyzed the meteorological effects during fall–winter (September, October, November, December, January, and February) and spring–summer. The meteorological conditions in fall–winter dominated the annual meteorological effects on PM2.5. We observed typical unfavorable meteorological conditions in the fall–winter of years 2006 (2.8 µg m−3) and 2016 (2.5 µg m−3). In certain years, e.g., 2018, the spring–summer meteorological conditions were unfavorable to pollution control, but since the fall–winter meteorological conditions were favorable, the annual meteorological effect was beneficial. The significant fall–winter meteorological effects indicated the critical contribution of meteorology to haze event formation. The fall–winter weather conditions in 2017 were substantially better than the fall–winter weather conditions in 2013, leading to a 3.3 µg m−3 decrease in the meteorology-associated PM2.5, thereby contributing to the achievement of pollution control targets of the Action Plan (X. Zhang et al., 2019; Yi et al., 2019). Since the current evaluation of clean air policies focuses on changes in pollution levels over short periods, e.g., 3 or 5 years, policy performance can be largely affected by meteorological changes.
3.3 Spatial heterogeneity in meteorology-associated PM2.5 trends
We also analyzed the variations in the meteorological influence on PM2.5 in several populous urban agglomeration regions of China (Figs. 5, A3). In the BTH region, 2014 was a typically unfavorable year (3.1 µg m−3), and 2010 was a typically favorable year (−4.9 µg m−3). The shape of the long-term trend of the meteorology-associated PM2.5 during wintertime in BTH was consistent with that in previous studies. For example, the 2014 and 2017 winter meteorological conditions were greatly favorable, and the 2016 winter meteorological conditions were considerably unfavorable (Yi et al., 2019; Wang and Zhang, 2020). The meteorological effects showed a regional consistency with varying magnitudes. For example, 2004 was a typical unfavorable year in both the PRD (6.3 µg m−3) and the YRD (2.7 µg m−3), and 2016 was a typical favorable year in both the PRD (−7.3 µg m−3) and the YRD (−2.1 µg m−3). Consistent with previous studies, the PRD revealed the largest meteorological influence on PM2.5 among these regions (Zhai et al., 2019).
We observed notable regional heterogeneity in the long-term trends as well as seasonal trends of the meteorological effects on PM2.5 (Figs. 5, A3). In the northern part of China, especially in the North China Plain and central eastern China, the meteorological conditions worsened and were adverse to pollution control during 2000–2018 (Yin and Wang, 2018; Zhang et al., 2018). Multiple climate systems could be associated with the long-term trend of meteorological effects. For example, greenhouse-gas-induced warming may result in a decrease in light-precipitation days and surface wind speed, which are unfavorable to pollution control (Chen et al., 2019). In the context of global warming, the unfavorable meteorological conditions in the northern part of China could worsen in the future, although previous studies on the projection of the future effects of climate change on air pollution showed inconsistent results. For example, Cai et al. (2017) projected increased frequency and persistence of haze events in Beijing in the future (2050–2099) and Shen et al. (2018) found a statistically insignificant trend of haze index in the future in Beijing. In contrast, in the southern part of China, especially in the YRD and surrounding regions, the estimated meteorological conditions were improving and were beneficial to pollution control (Chen et al., 2019). Further studies are needed to better understand the long-term trend of meteorological and climate effects on air pollution across China. Stricter clean air actions are preferred to avoid haze events in the future, considering the considerable meteorological effects on air pollution.
Regarding the seasonal trend of the meteorological effects, in spring–summer, we observed improving meteorological effects in the southern part of China and worsening meteorological effects in the northern part of China. This spatially heterogeneous trend may result from the strengthening of the East Asian summer monsoon, which enhances the transportation of aerosols from the south to the north of China (Zhu et al., 2012; R. Liu et al., 2017). In fall–winter, the East Asian winter monsoon significantly affects air pollution levels that benefit the air quality in northern China but are unfavorable to air quality in southern China due to the southward transport of pollutant from north to south (Jeong and Park, 2017; Yin et al., 2015). For example, in the years 2004, 2005, 2007, and 2010 with strong East Asian winter monsoon, the BTH and the FWP showed strong favorable meteorology contributions to PM2.5, but the YRD and the PRD showed unfavorable meteorological effects. On the contrary, in the year 2006 with weak East Asian winter monsoon, the BTH and the FWP showed unfavorable meteorological effects (Jeong and Park, 2017).
The large-scale atmospheric circulations in some specific years also showed notably distinct effects on PM2.5 concentrations over the north and south of eastern China, due to the opposite effects on meteorology parameters. For example, in 2015 and 2016 with strong El Niño, the fall–winter meteorology in the northern part of eastern China was significantly unfavorable for pollution control, but in the southern part of eastern China it was considerably favorable. One reason is that the El Niño leads to excessive precipitation over southern China that favors wet deposition but weakened the East Asian winter monsoon and led to southern wind anomaly, weaker surface wind, and high humidity that were favorable to pollution events in the northern region of eastern China (Yin et al., 2015; Yin and Wang, 2016; He et al., 2019; Chang et al., 2016). On the country, during the years with La Niña, e.g., 2007 and 2010, we estimated beneficial winter–fall meteorology in northern regions but unfavorable meteorology in the southern region (X. Cheng et al., 2019).
Consistent with previous studies, we also observed spatially and seasonally varying associations between PM2.5 and meteorological parameters that reflect the varying PM2.5 responses to meteorological changes (Fig. A4). Temperature was positively associated with PM2.5 in spring, summer, and fall across eastern China; however, in winter, the temperature was negatively associated with PM2.5 in northern China (He and Wang, 2017; Qiu et al., 2015) due to the low-temperature-related stable atmosphere and decreased evaporation loss of PM2.5. Humidity yielded positive effects in northern China and negative effects in southern China in all seasons, especially in winter (He et al., 2017; Zhai et al., 2019). The spatial difference in the effects of humidity on PM2.5 may occur due to a threshold of the humidity altering the direction of the humidity influence: from hygroscopic increase to wet deposition. Zhai et al. (2019) also discussed the north–south contrast in the PM2.5–humidity associations and indicated that the positive effects of humidity on PM2.5 in the north were partly attributed to the favorable role of aqueous-phase aerosol chemistry in secondary PM2.5 formation, and the negative PM2.5–humidity associations in the south were partly attributed to the precipitation-related wet deposition. The boundary layer height and precipitation were negatively associated with PM2.5 across eastern China in all seasons, and the effect of precipitation was greater in northern China than that in southern China (Wang and Chen, 2016). Regarding the relative contribution of the different meteorology parameters, we found that over the south coast region, temperature and humidity showed greater effects than the boundary layer height and precipitation did. In winter, humidity, boundary layer height and precipitation were critical for the PM2.5 variations in the middle and northern China. In summer and fall, the temperature and humidity were critical for the PM2.5 variations across southern China. In spring, the temperature showed notable effects in the south coast region, and the precipitation exhibited large effects in the North China Plain. The seasonal variations in meteorological impacts could be due to the interactions between meteorological parameters that showed significant seasonal patterns. Further studies are needed to understand the mechanism of seasonal differences in the meteorology–pollution relationships.
3.4 PM2.5 trends after adjusting the meteorological effects
In eastern China, after adjusting for the meteorological influence, PM2.5 started increasing in 2000 and peaked in 2006 with an increase of 9.6 µg m−3 compared to the 2000 level (Fig. 6). Then, the PM2.5 varied, with the second highest PM2.5 level occurring in 2011 (9.4 µg m−3 higher than the 2000 level). After 2013, with the implementation of aggressive emission control policies, PM2.5 notably decreased, with a 13.1 µg m−3 lower PM2.5 level in 2018 compared to the level in 2013. After adjusting for the meteorological effects, the temporal variations in PM2.5 were consistent with the temporal variations in pollutant emissions retrieved from the MEIC emissions. The emissions of SO2 and PM2.5 peaked in 2006, and the emissions of NOx peaked in 2012.
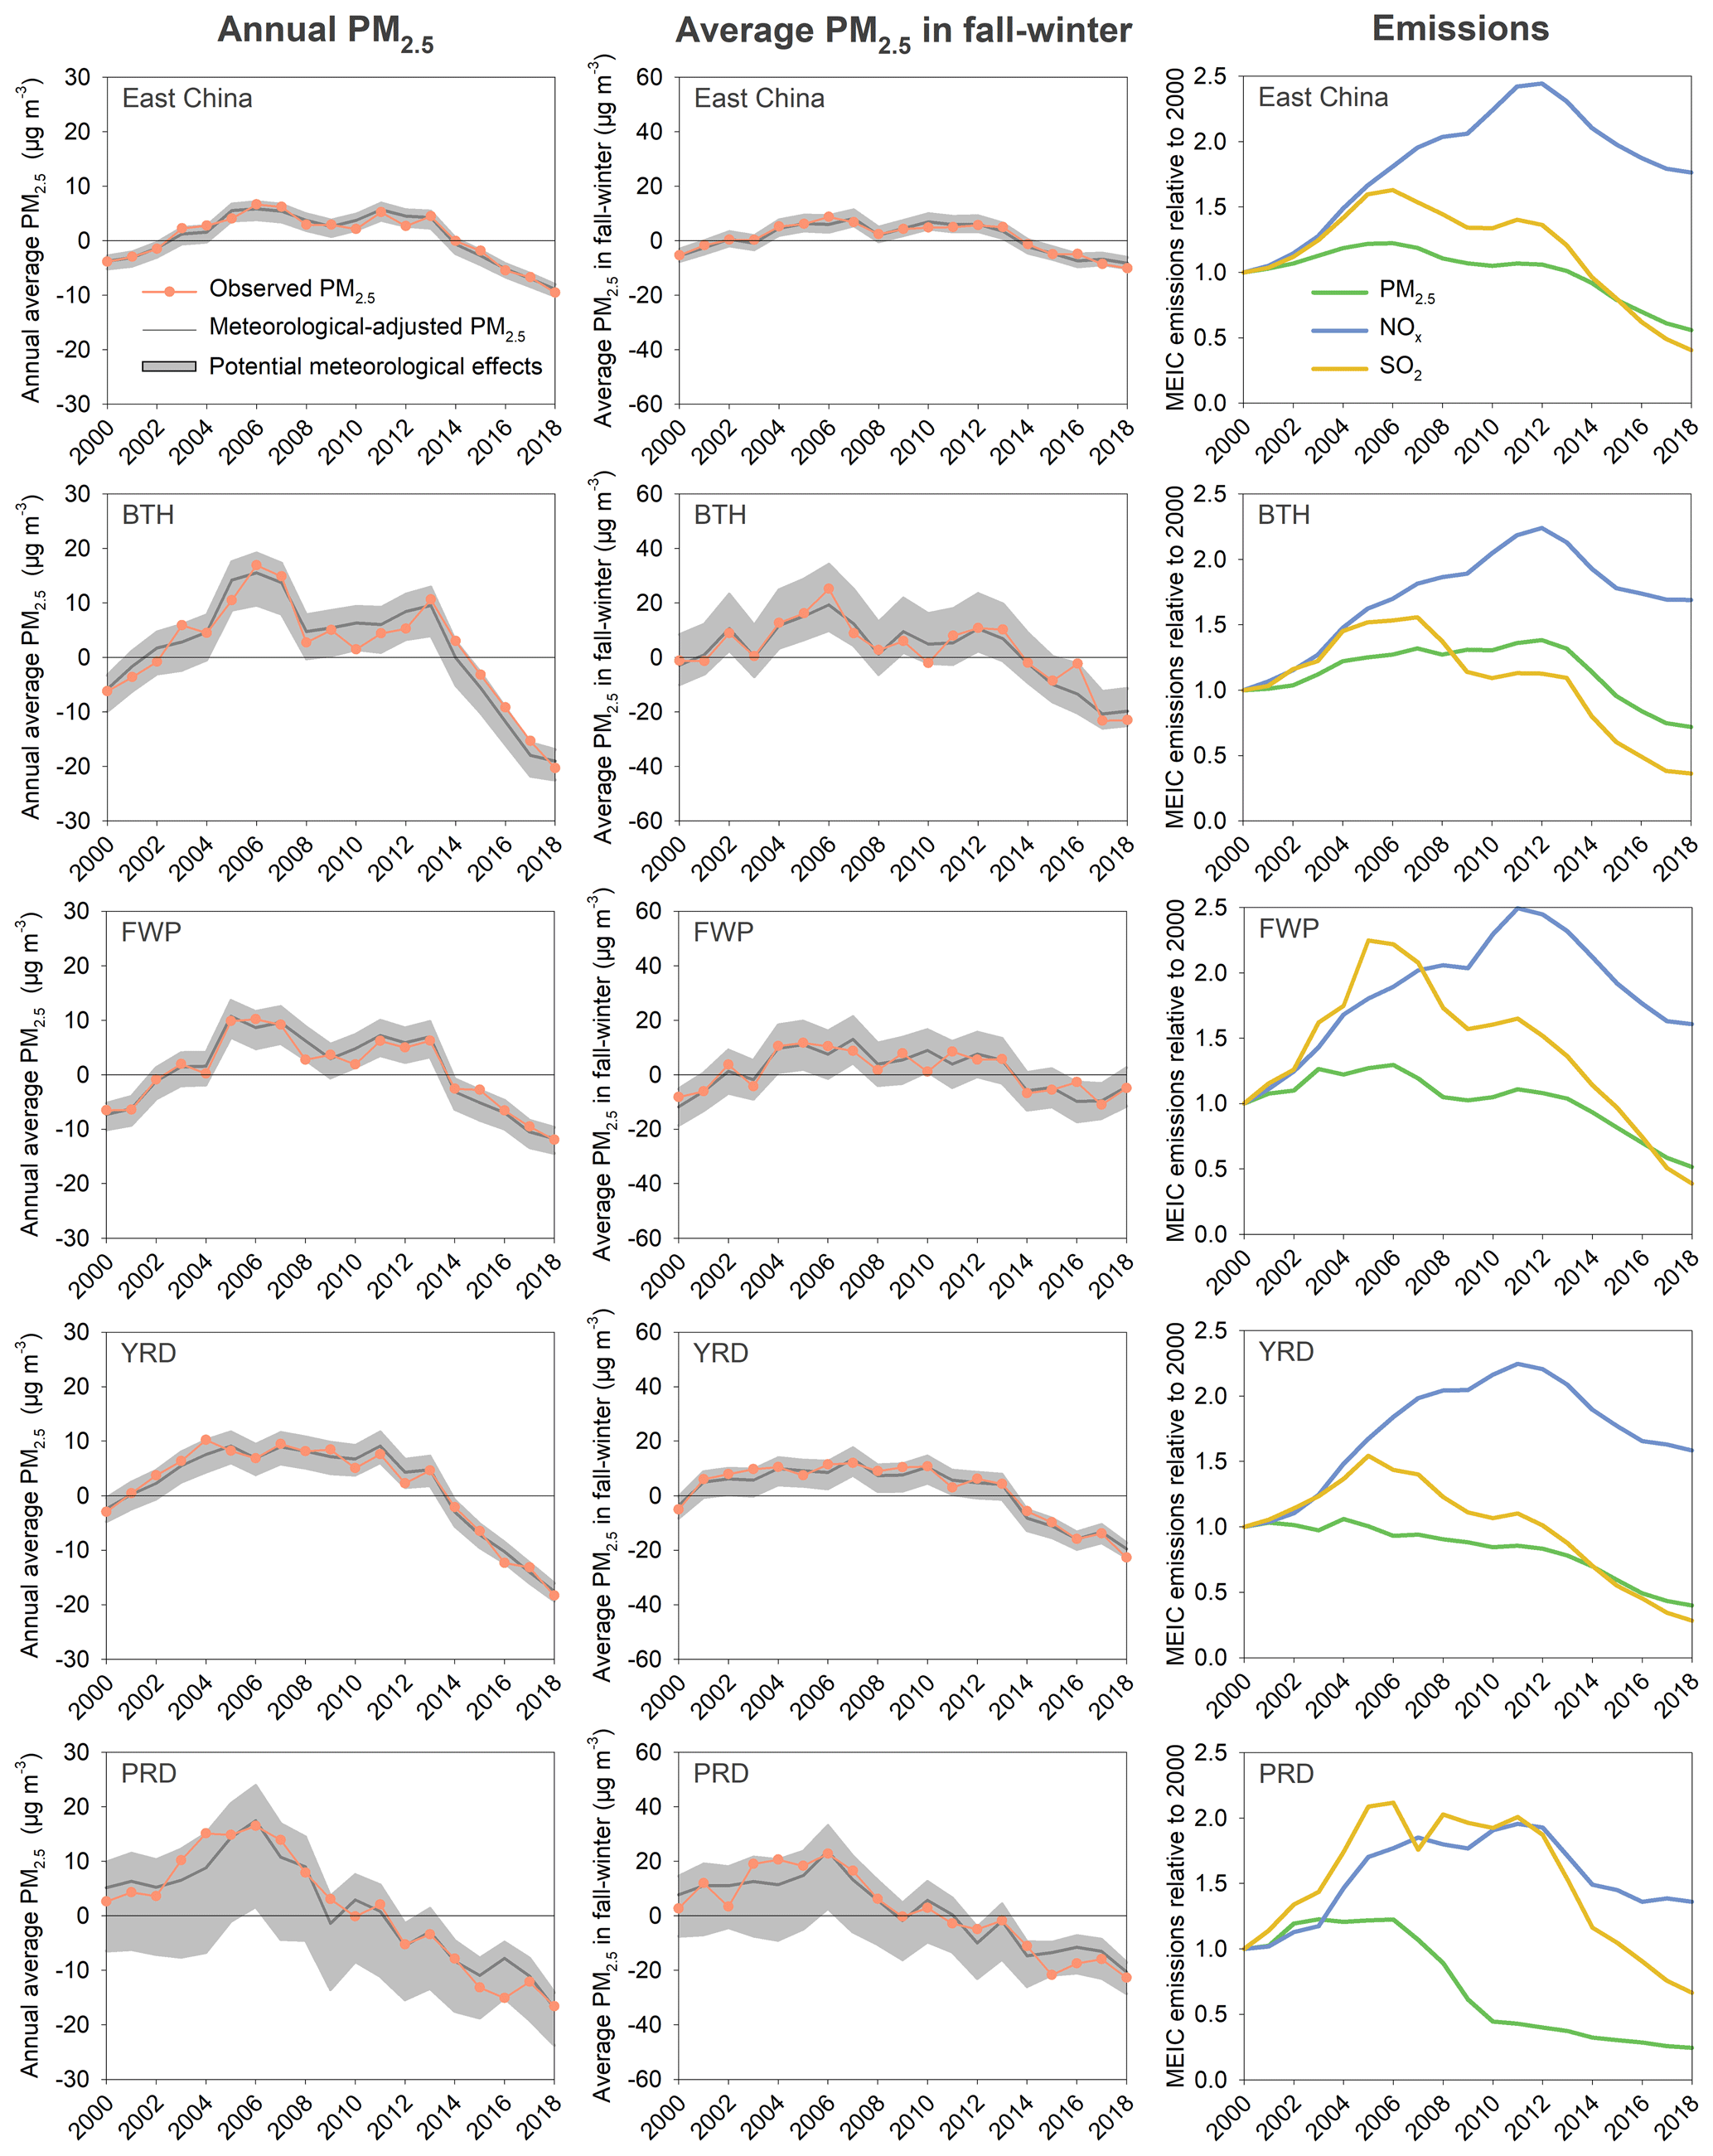
Figure 6Time series of the annual average (left column) and fall–winter average (middle column) PM2.5 concentrations before (the orange line) and after (the gray line) the adjustment of the meteorological effects from 2000 to 2018 using GAM. The gray shadow shows the potential range of the observed PM2.5 due to meteorological effects. The right column shows the MEIC emissions of PM2.5, NOx, and SO2.
In the BTH region, PM2.5 peaked in 2006 and decreased by 10.8 µg m−3 in 2008 due to the emission control policies targeting the air quality during the 2008 Beijing Olympic Games. After 2008, PM2.5 continuously increased and peaked in 2013, at an increased rate of 1.0 µg m−3 per year. Considering the variations in pollutant emissions, the first PM2.5 peak in BTH was primarily driven by SO2 emissions, and the second PM2.5 peak was driven by NO2 and PM2.5 emissions. The PM2.5 decreasing trend after 2013 in BTH was higher than that in the other regions (5.8 µg m−3 per year), mainly driven by the emission reduction in SO2 and PM2.5. The annual average meteorology-adjusted PM2.5 concentration in BTH from 2014 to 2018 was consistent with that in a previous study (Qu et al., 2020). We found that the observed high-pollution events in the fall–winter of years 2006, 2013, and 2016 were partly attributable to unfavorable meteorological conditions that led to a 5.9, 3.4, and 11.1 µg m−3 PM2.5 increase, respectively. Since the meteorology contributed up to 25 % of the observed PM2.5 level in fall–winter, further emission control measures are needed to improve the winter air quality and avoid violations of the air quality standards under unfavorable meteorological conditions. In FWP, the highest PM2.5 level occurred in 2005, and the average decrease rate after 2013 was 2.8 µg m−3 per year. The high pollution in the 2016 fall–winter period attributable to unfavorable meteorological conditions was also observed in FWP, although the meteorological effects in FWP were smaller than those in the BTH region, with up to 10 % of the meteorology contribution in PM2.5 in fall–winter. In the YRD, PM2.5 peaked in 2011 and 2015. The unfavorable meteorological conditions observed in the fall–winter of 2016 did not occur in either the YRD or the PRD, showing a spatial difference in the meteorological system. In the PRD, PM2.5 peaked in 2006 and continuously decreased from 2006 to 2018, at an average decrease rate of 2.8 µg m−3 per year. This decreasing trend was consistent with the trend of the PM2.5 emissions. The temporal variations in NOx and SO2 emissions contributed to the trends in the meteorology-adjusted PM2.5 from 2010–2011.
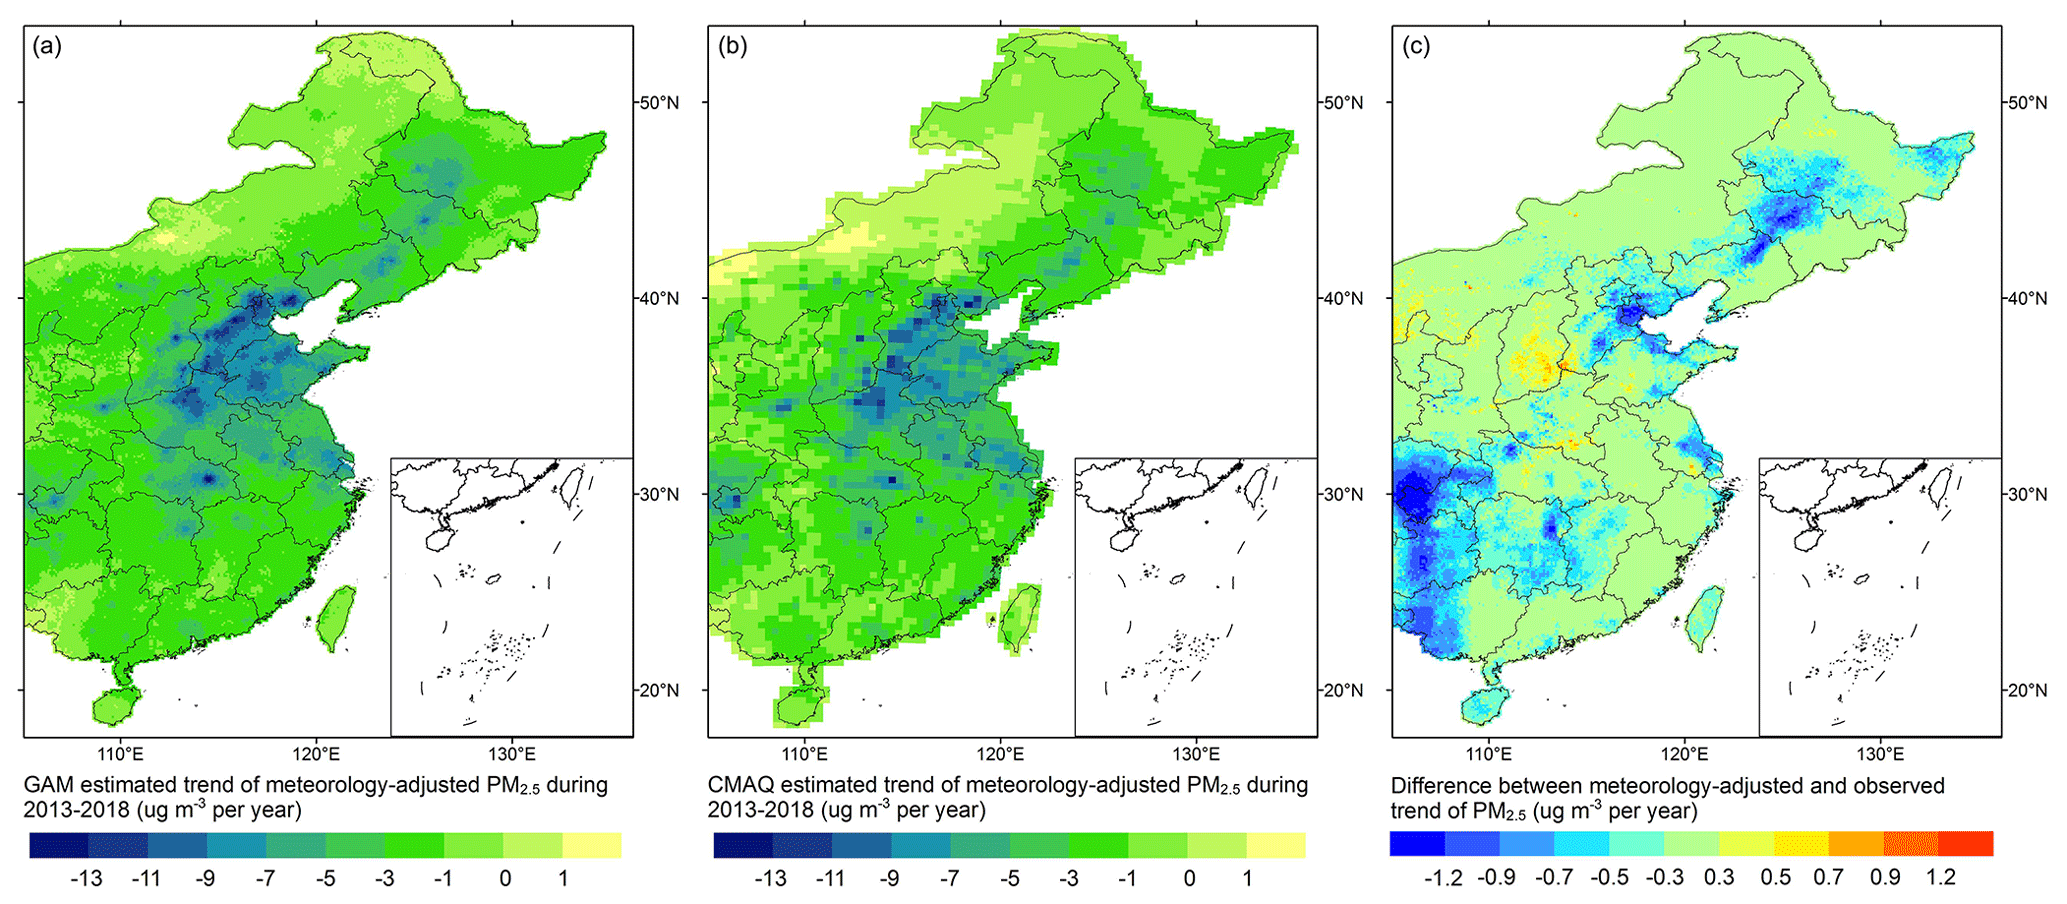
Figure 7(a) Spatial distribution of the PM2.5 decrease rate during 2013–2018 after adjusting for the meteorological effects using GAM. (b) Spatial distribution of the PM2.5 decrease rate during 2013–2018 after adjusting for the meteorological effects using CMAQ. (c) The difference in the PM2.5 decrease rate before and after the adjustment for the meteorological effects using GAM.
It is observed that although emissions dominated the long-term variations in PM2.5, meteorological conditions significantly affected the observed PM2.5 concentration in all key regions, especially in fall and winter. We observed as much as 25.6 %, 6.3 %, 5.1 % and 4.8 % annual average meteorological effects, estimated from GAM, in the PRD, BTH, FWP, and YRD, respectively, during the study period. The meteorological contributions in fall–winter were even higher. The CMAQ simulations estimated as much as 17.5 %, 8.8 %, 26.6 %, and 6.6 % annual average meteorological effects in the PRD, BTH, FWP, and YRD, respectively. From 2015 to 2016, the winter–fall meteorological conditions considerably changed to unfavorable for pollution control in northern China, leading to a 2.8 µg m−3 increase in the winter–fall average PM2.5 concentration across eastern China. BTH and FWP showed 9.8 and 8.1 µg m−3 increases, respectively. Such increases may weaken the effects of emission control policies during this period. In 2018, the PM2.5 concentration in Beijing was reported to be 51 µg m−3. However, if 2018 had been a typical year with unfavorable meteorological conditions, the annual PM2.5 concentration could have reached 54 µg m−3.
The meteorology-adjusted PM2.5 trend from 2013 to 2018 showed varying spatial patterns. The highest decrease occurred in Beijing, Tianjin, south of Hebei, and the capital cities, including Xi'an, Wuhan, Zhengzhou, and Changsha (Fig. 7), indicating the more efficient implementation of clean air policies in these regions. As described above, the effects of meteorology also showed spatial differences. Over the Northeast China Plain, North China Plain, and Sichuan Basin, the adjusted PM2.5 decreasing trend was weaker than the observed trend. Over Shanxi, the intersection of Hubei-Henan-Anhui, and south of Jiangsu, the adjusted PM2.5 decreasing trend was stronger than the observed trend. The interquartile range of the meteorological effects on the PM2.5 trend varied between −17.2 % and 1.8 % across eastern China. From 2013 to 2018, the decreasing trend of the meteorology-adjusted PM2.5 level was weaker than the decreasing trend of the observed PM2.5 level by 8.4 % in eastern China, 7.9 % in the BTH region, 3.3 % in the YRD, and 7.5 % in the PRD, while the adjusted trend was greater than the observed trend by 2.01 % in the FWP.
3.5 Sensitivity analysis
To evaluate whether the selection of statistical models affects the assessed associations between meteorology and PM2.5, we compared the meteorology-associated PM2.5 estimated by GAM and MLR. The estimated meteorology-associated PM2.5 levels from the MLR and GAM matched well, with correlation coefficients larger than 0.98 across eastern China (Fig. A5). Hence, the results of this study are robust and not affected by the selection of PM2.5 meteorology model.
To examine the effects of length of the time window when constructing the deseasonalized PM2.5, we conducted a sensitivity analysis with a 90 d averaging window in the BTH region, and the estimated PM2.5 concentrations after adjusting for meteorological effects were almost identical to the results using a 50 d time window (Fig. A5). Thus, this statistical method was not sensitive to the averaging time window.
Compared to previous studies, we employed the GAM to better describe the nonlinear associations between PM2.5 and meteorology in this study. We observed consistent temporal trends of the meteorological effects and the meteorologically adjusted PM2.5 concentrations compared to previous studies, but the magnitude of the assessed meteorological effects and adjusted PM2.5 concentrations varied. Thus, when comparing the meteorological effects of a specific year, the conclusion may be inconsistent (Xu et al., 2020; Zhai et al., 2019; Q. Zhang et al., 2019; X. Zhang et al., 2019). Assessing the meteorology-associated PM2.5 with different methods may also lead to varying long-term trends (Xu et al., 2020). Several factors may affect the uncertainty of the assessed meteorological contributions in this study. First, as reported by previous studies (Xiao et al., 2018; Xue et al., 2019), the satellite-based PM2.5 prediction model suffered from increasing prediction error when hindcasting historical pollution levels a long time before the model training time period. One reason could be that some unobserved parameters, e.g., PM2.5 composition, modify the associations between PM2.5 and predictors, leading to model overfitting. The satellite-driven PM2.5 prediction model used in this study is a state-of-the-art prediction model with improved prediction accuracy for high-pollution events, but its hindcast prediction quality could be further improved to better describe the historical PM2.5 spatiotemporal distribution. Second, we obtained meteorological information from the MERRA-2 reanalysis dataset with a spatial resolution lower than that of the PM2.5 predictions. This resolution mismatch with smooth spatial variations in the meteorological fields may not fully describe the meteorological effects at the local scale.
In this study, we analyzed the meteorology- and emission-driven variations in the PM2.5 concentration during 2000–2018 across eastern China by the GAM-based method and CMAQ simulations. To support the GAM-based analysis, we combined satellite data, CMAQ simulations, and ground observations to predict complete-coverage PM2.5 concentrations with a two-stage machine learning model that attained improved prediction accuracy of high-pollution events. Both methods showed significant meteorological influences on PM2.5 dominated by the meteorological conditions in fall and winter. The greatly varying meteorological effects on PM2.5 concentration over a relatively short time period may remarkably affect the evaluation of clean air policies during a certain period. We also observed distinct regional differences in the long-term and seasonal trends of the meteorological effects. The meteorology-associated PM2.5 tended to increase in the North China Plain and central China but decreased across southern China, e.g., in the YRD. After adjusting for the meteorological effects, the average PM2.5 concentration decreased by 13.1 µg m−3 from 2013 to 2018 over eastern China, and the BTH region showed the greatest decrease (28.5 µg m−3) among the studied urban agglomeration regions. The decreasing trend of PM2.5 after adjusting for the meteorological effects was 8.4 % weaker than the observed PM2.5 decreasing trend in eastern China, 7.9 % weaker in the BTH region, 3.3 % weaker in the YRD, and 7.5 % weaker in the PRD, while the adjusted trend was 2.0 % greater than the observed trend in the FWP. Considering the remarkable meteorological contributions to PM2.5, further emission reduction measures are required to avoid the occurrence of haze events under unfavorable meteorological conditions.
We collected hourly PM2.5 measurements from 2013 to 2018 from both the Chinese national air quality monitoring network (∼ 1593 stations) and local air quality monitoring stations (∼ 1700 stations) mainly located in eastern China. Continuous identical measurements over at least 3 h were removed due to instrument malfunction. Daily average concentrations were calculated based on at least 12 hourly measurements.
We obtained Aqua and Terra MODIS Collection 6 Level 2 aerosol products at a 0.1∘ resolution from https://ladsweb.modaps.eosdis.nasa.gov/ (last access: 7 September 2020). Since the aerosol optical depth (AOD) retrieved with the Deep Blue (DB) algorithm and the Dart Target (DT) algorithm (Levy et al., 2013; Hsu et al., 2013) exhibit different coverage and retrieval accuracy (Y. Wang et al., 2019), we fitted daily linear regressions to fill the missing retrievals when only DT or DB AOD was presented. Then, we calculated the average of the DT AOD and DB AOD separately for each sensor. Similarly, since the Aqua AOD and Terra AOD are observed at different pass-over times, to improve the data coverage, we fitted daily linear regressions to fill the missing retrievals when only Aqua AOD or Terra AOD was presented. We calculated the average of the Aqua and Terra AODs to characterize the daily aerosol loadings (Jinnagara Puttaswamy et al., 2014).
We also used daily PM2.5 simulations at a spatial resolution of 36 km during 2000–2018 from the WRF/CMAQ model as an important predictor. The inverse distance weighting (IDW) method was applied to interpolate the CMAQ simulations to match the grid of 0.1∘. Detailed description of the WRF/CMAQ simulations can be found in Sect. 2.3.
Meteorological parameters were extracted from the Modern-Era Retrospective analysis for Research and Applications Version 2 (MERRA-2) dataset at a resolution of 0.5∘ latitude × 0.625∘ longitude (Randles et al., 2017). We extracted parameters including surface albedo, cloud area fraction for low clouds, total cloud area fraction, surface net downward longwave flux, surface incoming shortwave flux, surface net downward shortwave flux, total incoming shortwave flux, total net downward shortwave flux, surface pressure, 2 m specific humidity, 2 m air temperature, 2 m dew point temperature, total column ozone, total column odd oxygen, total precipitable ice water, total precipitable liquid water, total precipitable water vapor, 2 m eastward wind (U wind), 2 m northward wind (V wind), 10 m U wind, 10 m wind speed, 10 m V wind, U wind at 500 hPa, U wind at 850 hPa, V wind at 500 hPa, V wind at 850 hPa, total latent energy flux, evaporation from turbulence, planetary boundary layer height, snowfall, and bias-corrected total precipitation. These parameters have been reported to be strongly associated with the PM2.5 concentration in various regions in China (Z. Chen et al., 2020). The inverse distance weighting method was applied to estimate the daily smooth surface of meteorological data and to match with the modeling grid at a 0.1∘ spatial resolution.
Elevation data from the Global Digital Elevation Model version 2 (GDEM; https://earthexplorer.usgs.gov/, last access: 15 September 2018) at a 30 m resolution were averaged to match the modeling grid. We calibrated the gridded population distribution data from the LandScan Global Population Database (https://landscan.ornl.gov/, last access: 10 October 2019), the Gridded Population of the World (GPW; https://beta.sedac.ciesin.columbia.edu/data/set/gpw-v4-population-count, last access: 10 October 2019) dataset, and the WorldPop dataset (https://www.worldpop.org/, last access: 10 October 2019) at the county level with the total population reported in China City Statistical Yearbook. These calibrated gridded population data were fused to better characterize the population distribution across China (Xiao et al., 2021b). The land cover classification data of urban and rural regions at a 30 m resolution for 2000–2017 were downloaded from http://data.ess.tsinghua.edu.cn (last access: 9 February 2019; Gong et al., 2019a, b). The fraction of urban/rural region at the 30 m resolution was averaged according to the modeling grid.
A1 Model performance evaluation
The hyperparameters of XGBoost, including the maximum number of boosting iterations, the learning rate, the maximum depth of a tree, the minimum sum of the instance weight needed in a child, the subsampling ratio of a training instance, and the subsampling ratio of columns when constructing each tree, were optimized by grid search with the fivefold cross-validation (CV) root-mean-square error (RMSE) as a performance evaluation statistic.
The model performance was evaluated through fivefold CV, by-year CV, and by-location CV. The fivefold CV approach randomly selects 20 % of the data for model testing and trains the model with the remaining data. This process is repeated five times, and each record is selected once as testing data. The by-year CV approach validates the model hindcast ability by sequentially selecting 1 year of data for testing and using the remaining yearly data for model training such that each year is selected once for testing. The by-location CV approach validates the model ability for spatial prediction by using the data at 20 % randomly selected locations for testing and uses the remaining data for model training. This process is repeated five times until each location has been selected once for model testing.
Table A1Model fitting average R2 value of the seasonal generalized additive model (GAM), year-round GAM, seasonal stepwise multiple linear regression (MLR), and year-round MLR.
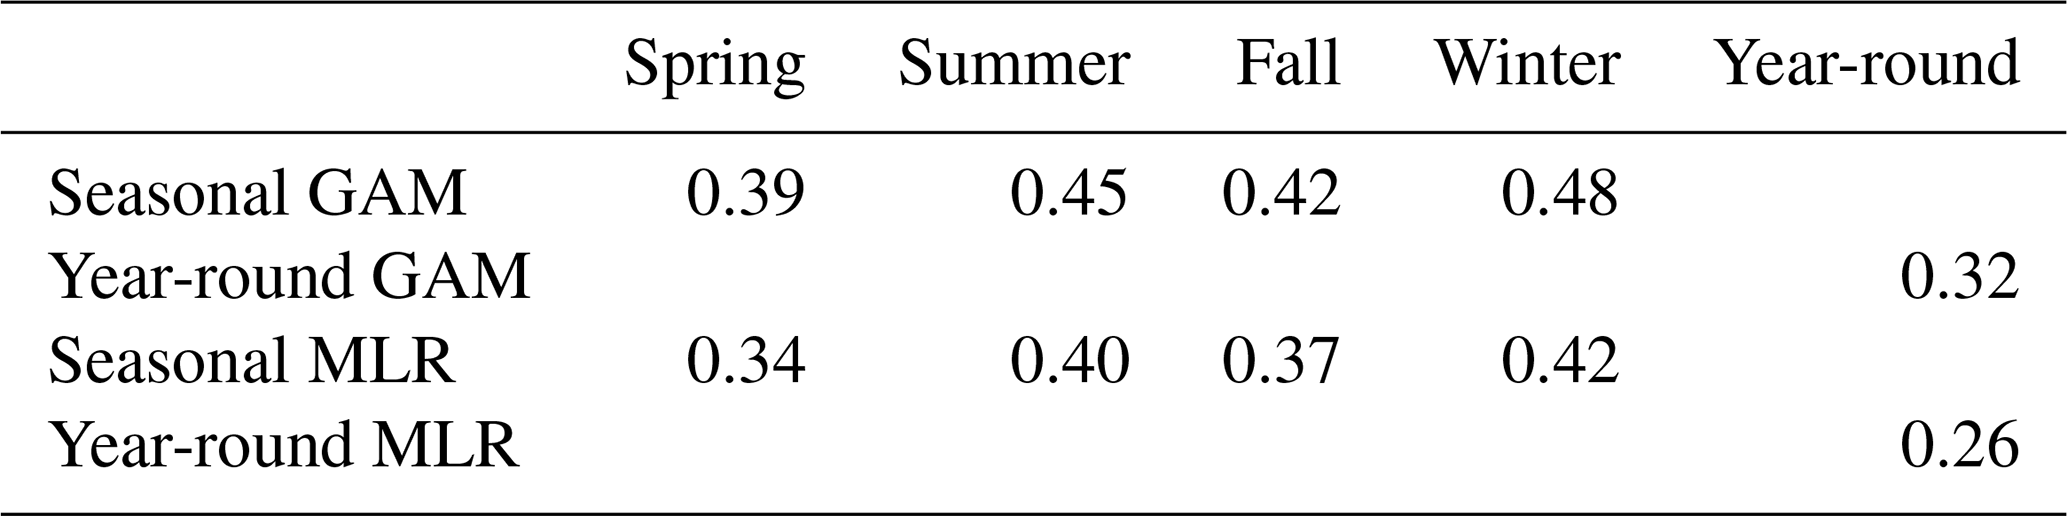
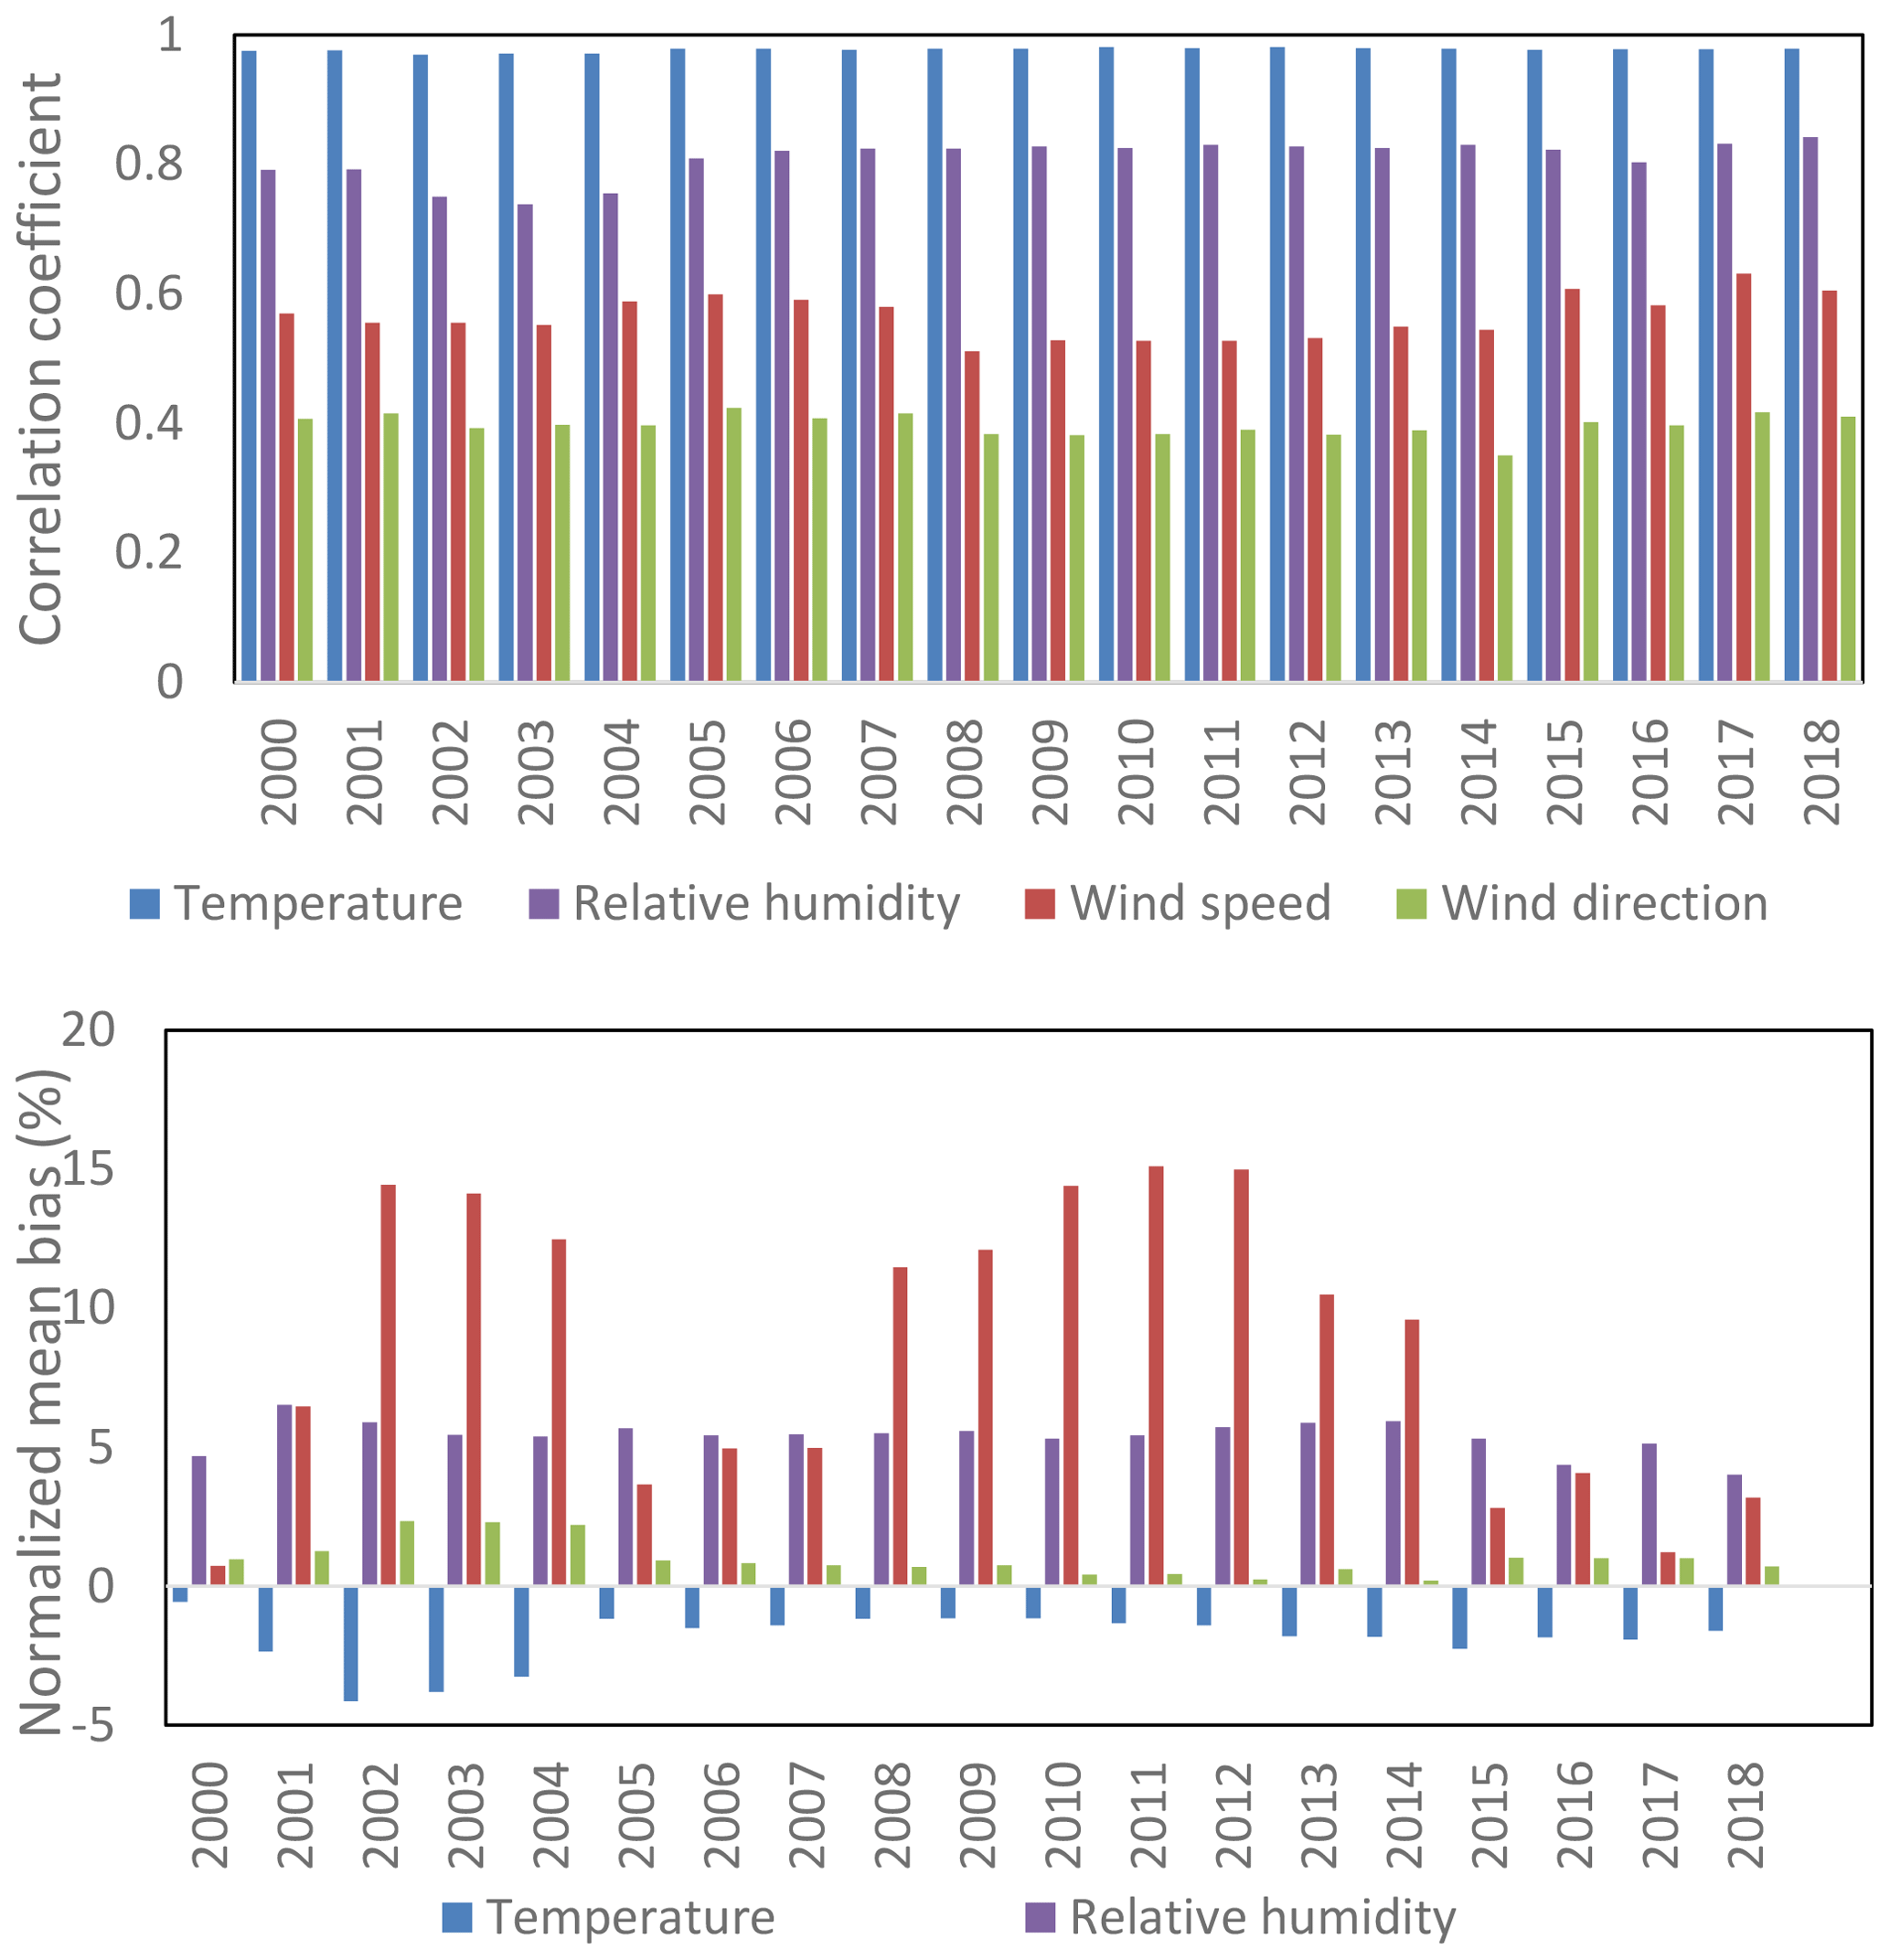
Figure A1Evaluation of the WRF model simulations. The correlation coefficient and normalized mean bias were calculated by comparing WRF simulations with ground observations from the National Climate Data Center.
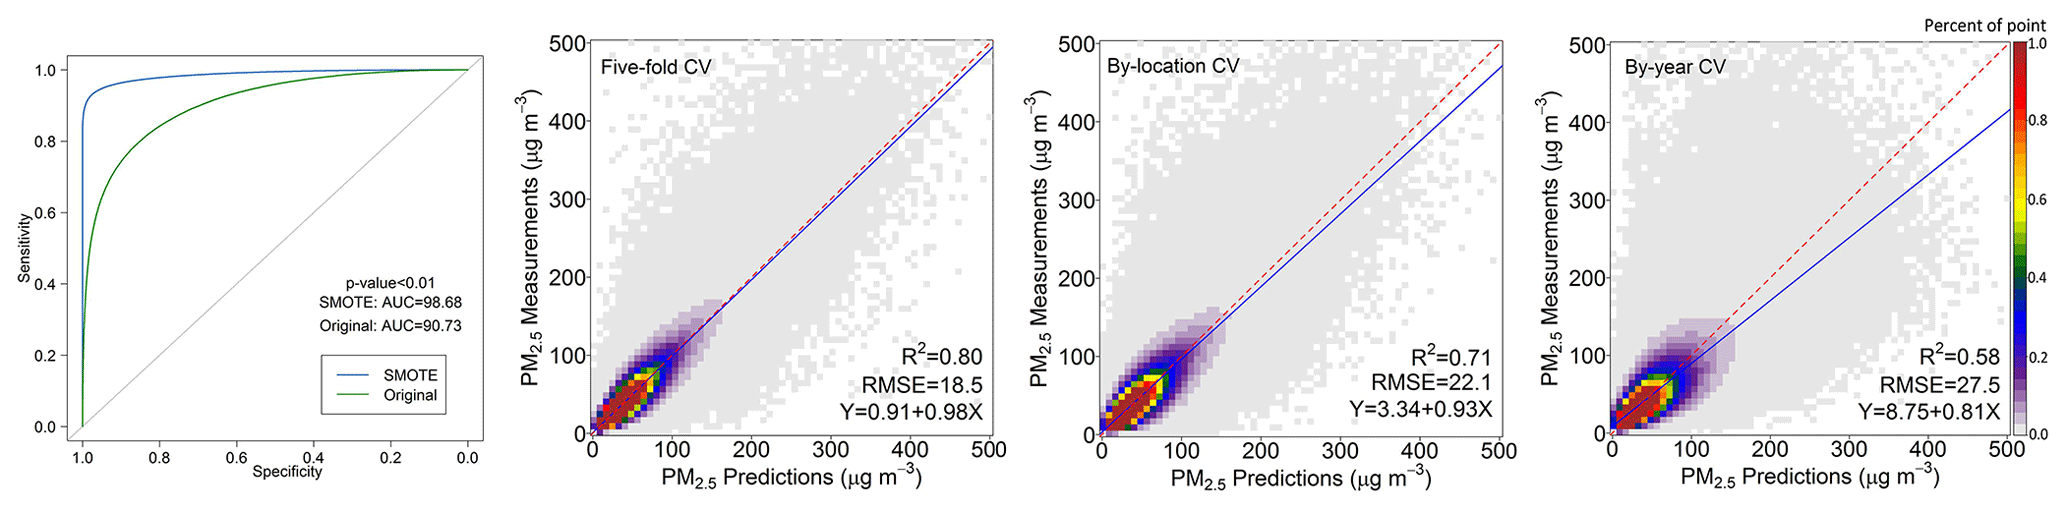
Figure A2Model evaluation of the first-stage model trained with the original dataset and the SMOTE-resampled dataset in fivefold cross-validation (CV) and scatter plots comparing the ground measurements and model predictions in fivefold CV, by-location CV, and by-year CV.
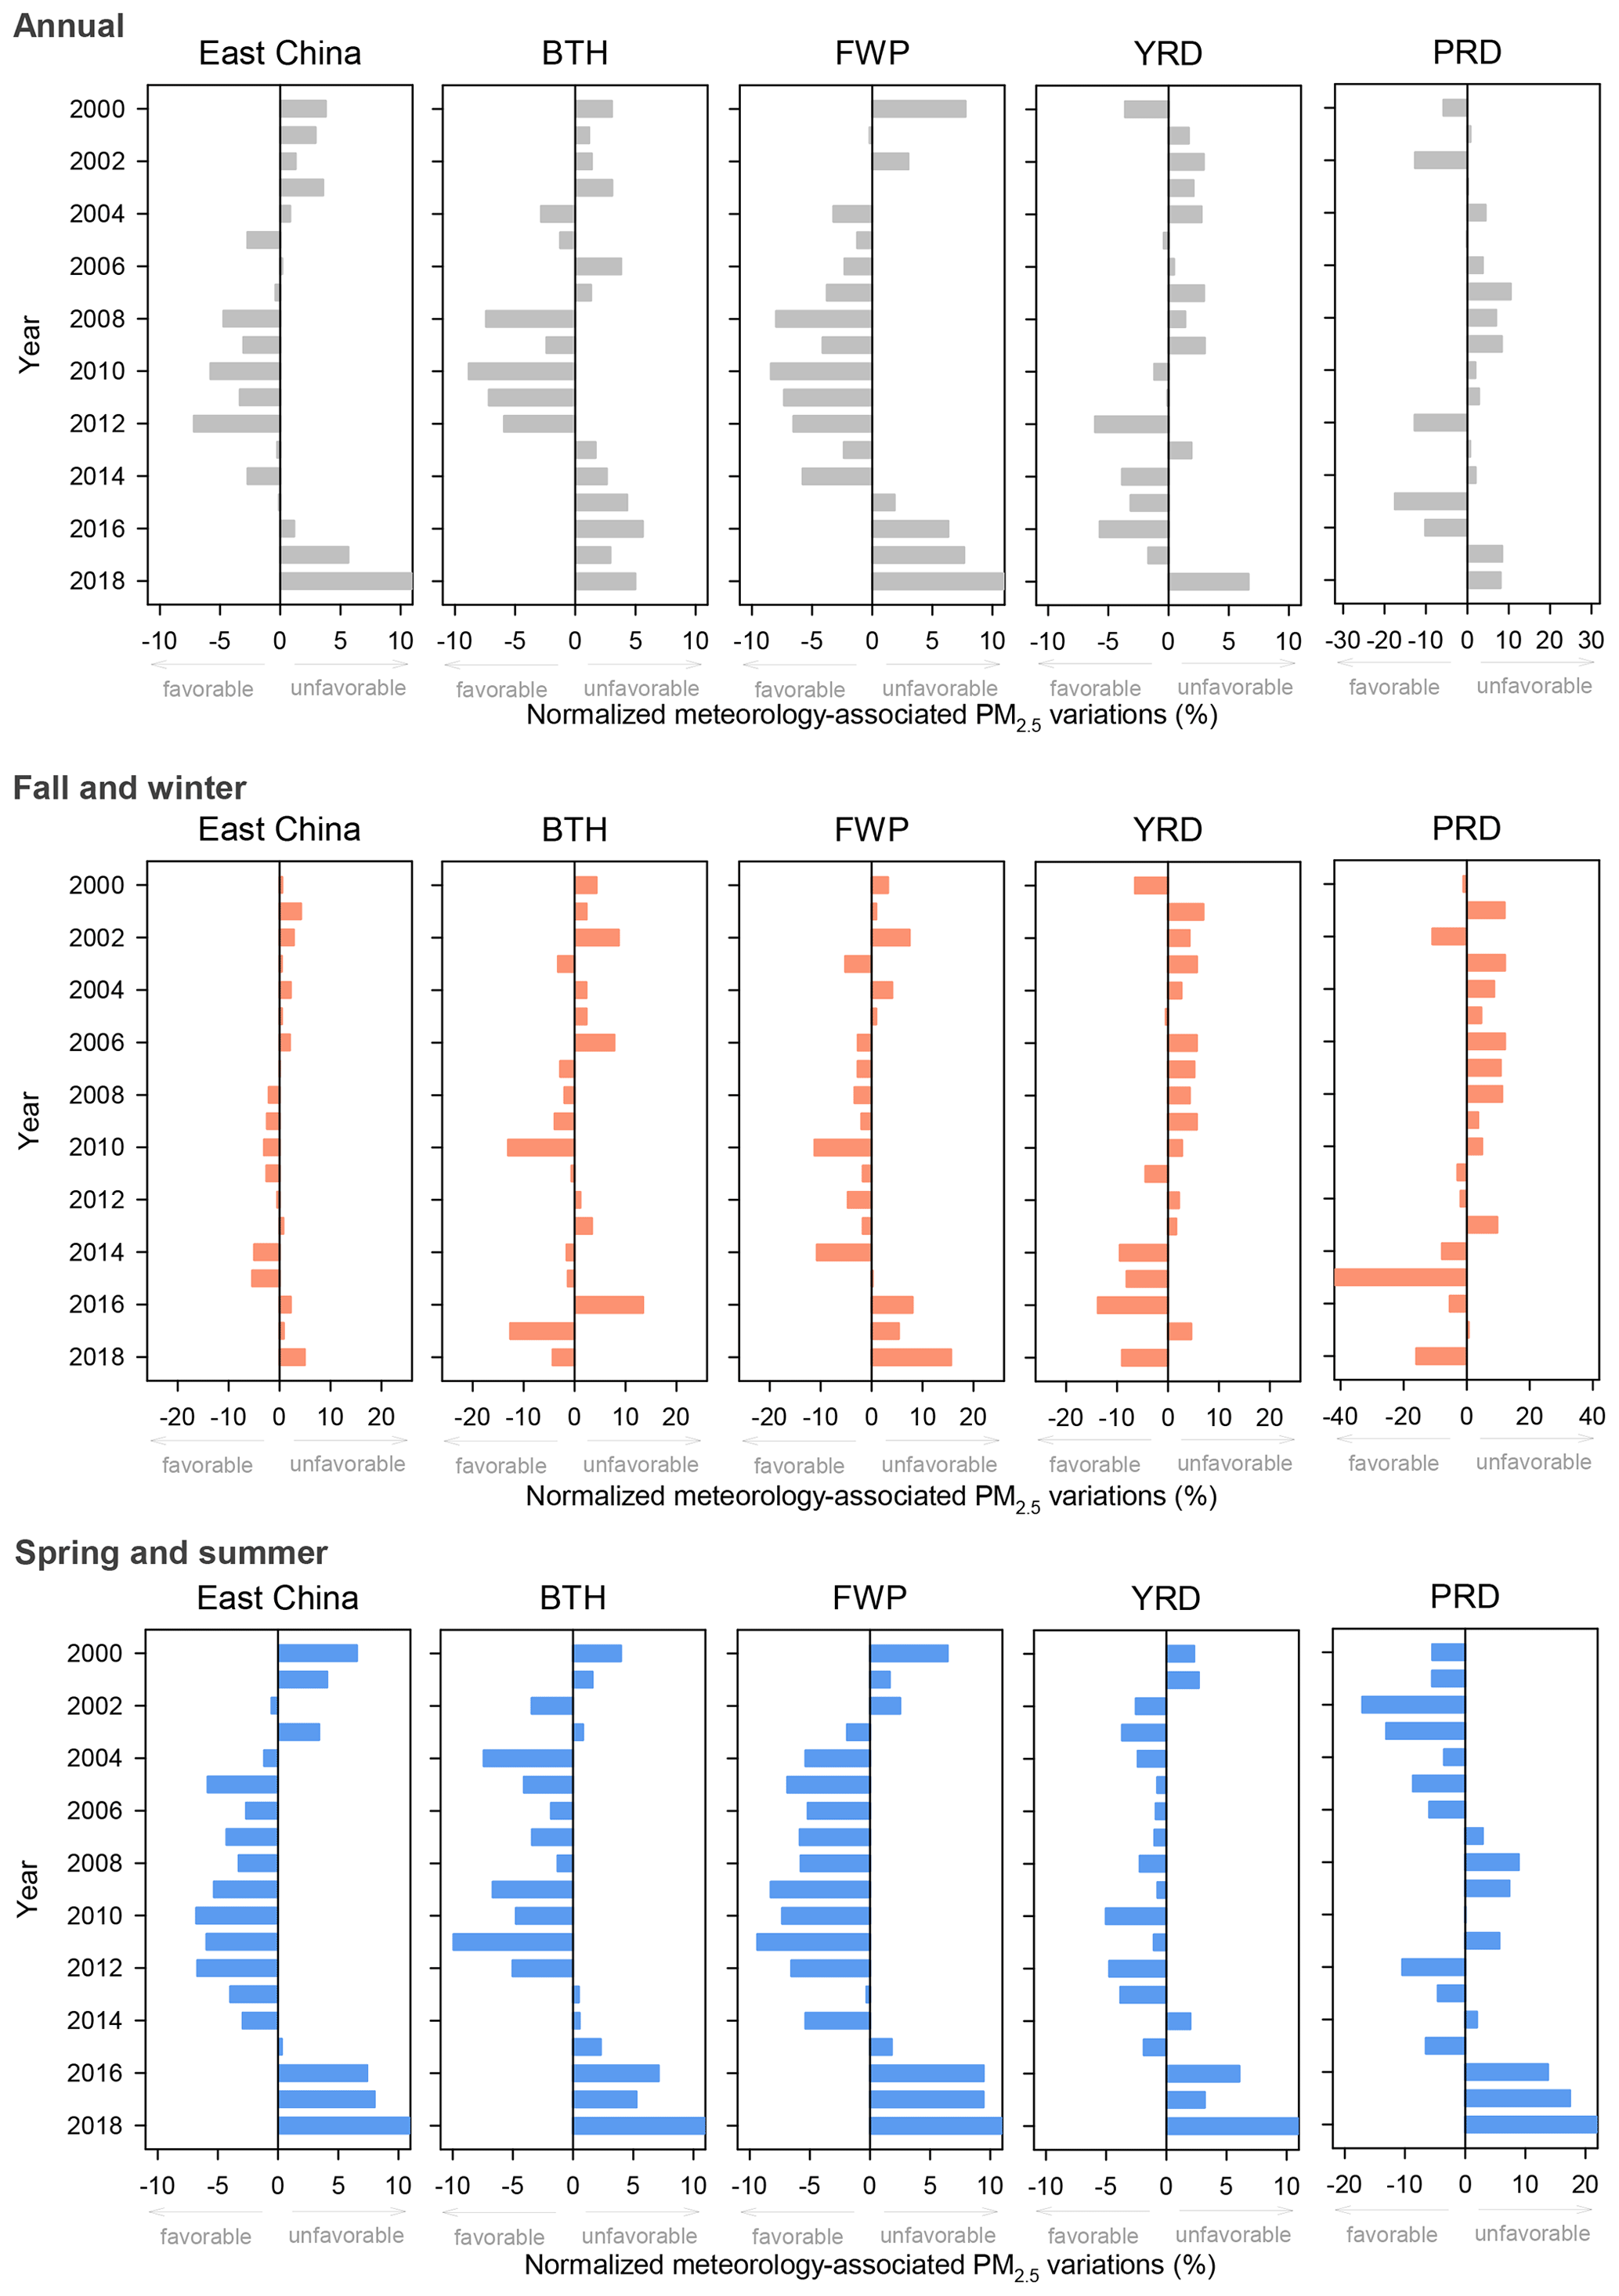
Figure A3The CMAQ estimated relative impact of meteorology on annual average PM2.5 (top row), relative impact of meteorology on average PM2.5 in fall–winter (September, October, November, December, January in next year, and February in next year) (middle), and relative impact of meteorology on average PM2.5 in spring–summer (bottom row) with the long-term trends estimated by polynomial and linear regressions over eastern China, BTH, FWP, YRD, and PRD.
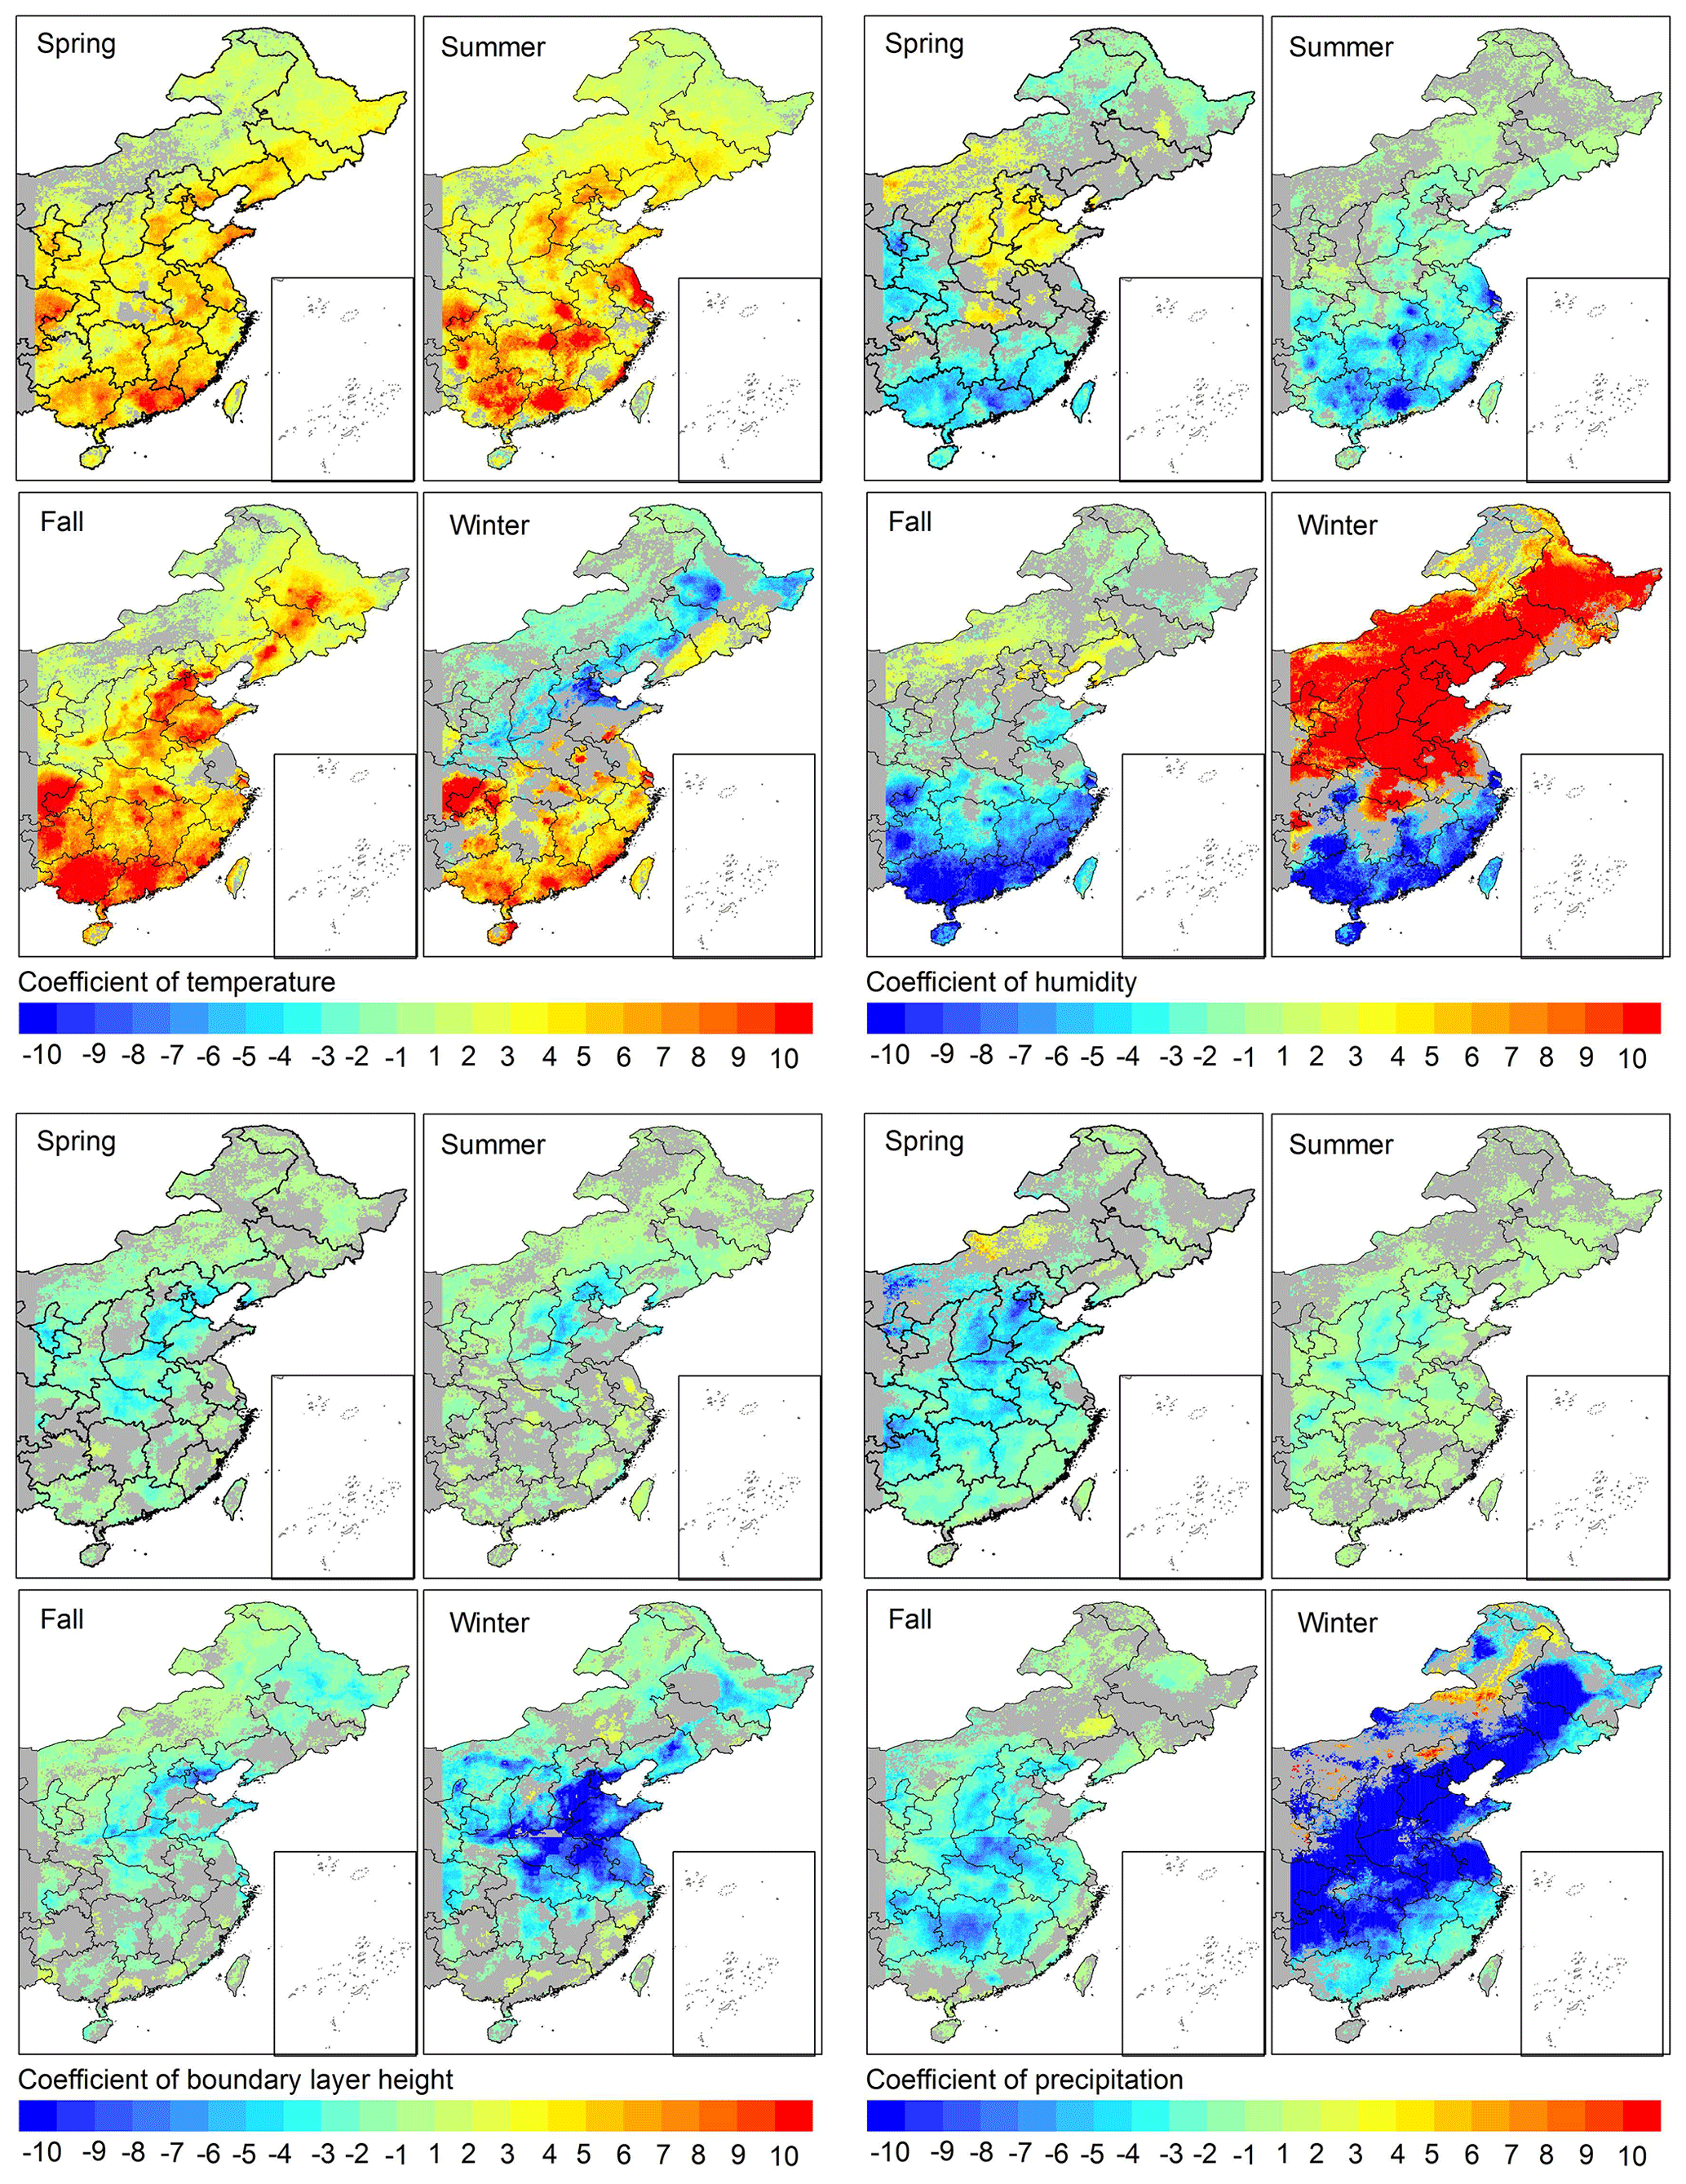
Figure A4Distribution of the estimated seasonal coefficients of the normalized meteorological parameters.
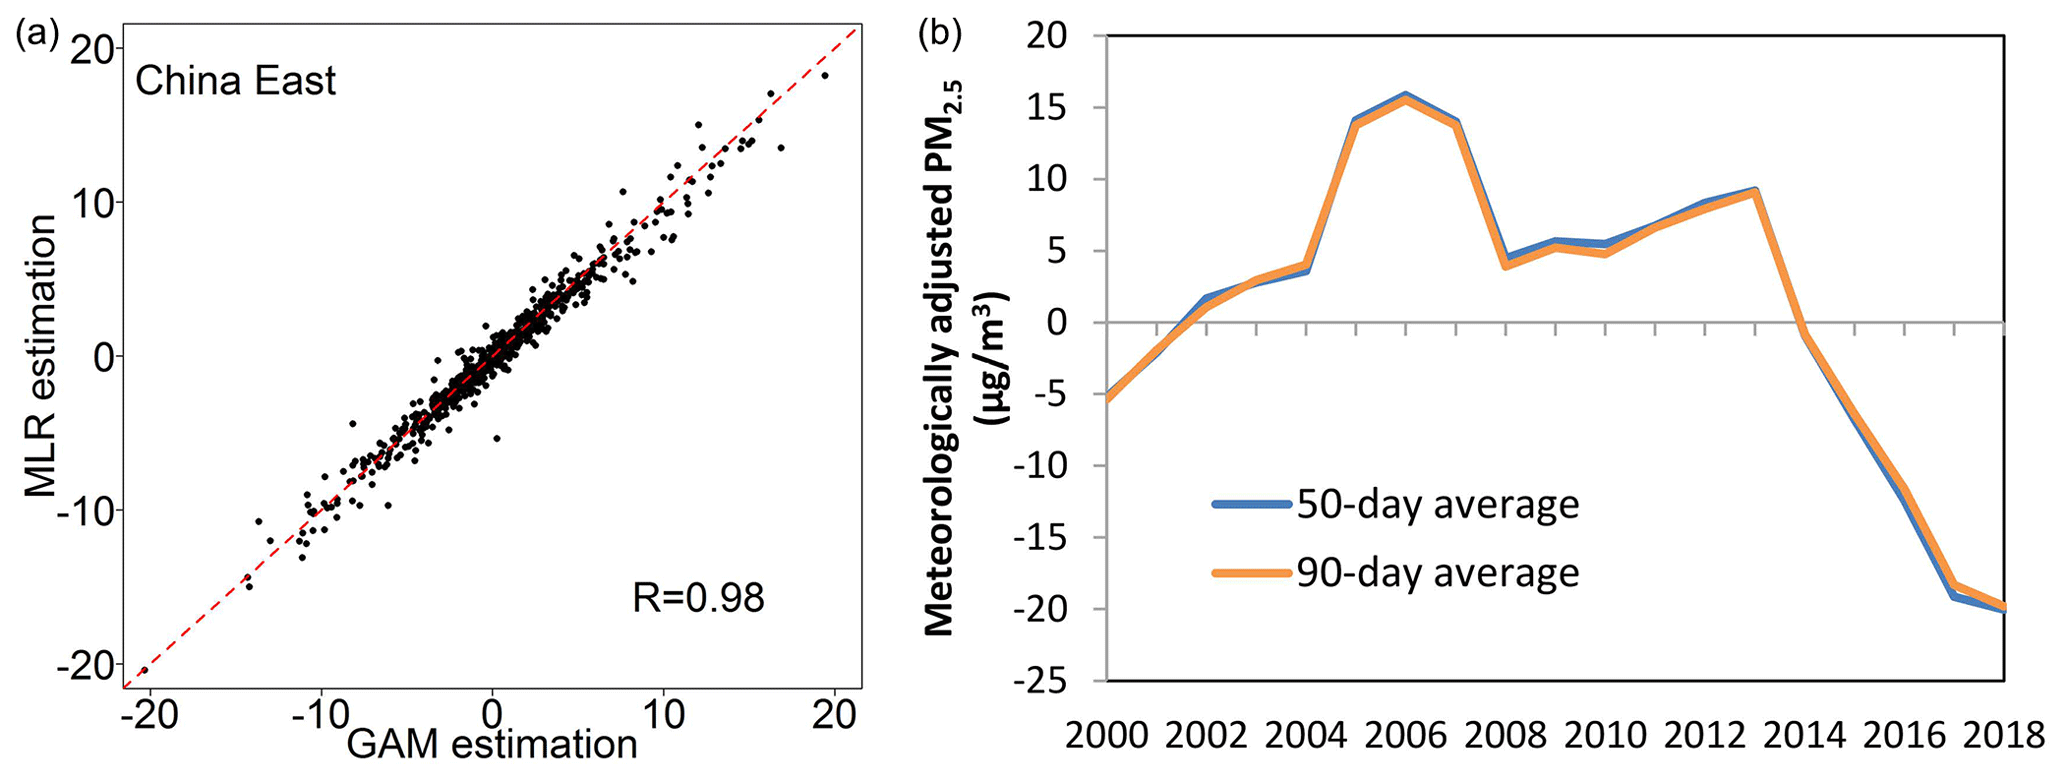
Figure A5Meteorology-associated PM2.5 variations estimated with the MLR and GAM (a) and meteorologically adjusted PM2.5 with 50 d seasonal averaging window and 90 d seasonal averaging window (b).
All the data used to predict PM2.5 concentrations are openly available for download from the websites given in Appendix A.
QX, GG, and QZ designed the analyses, and QX carried them out. YZ performed the WRF/CMAQ simulations. XH optimized the data fusion model. CC, HC, XZ, and KH interpreted the results. QX and GG prepared the article and figures with contributions from all co-authors.
The authors declare that they have no conflict of interest.
We thank the anonymous reviewers for their valuable comments. This work was supported by Tsinghua National Laboratory for Information Science and Technology.
This research has been supported by the National Natural Science Foundation of China (grant nos. 42007189, 42005135, 41921005 and 41625020).
This paper was edited by Pedro Jimenez-Guerrero and reviewed by three anonymous referees.
Bey, I., Jacob, D. J., Yantosca, R. M., Logan, J. A., Field, B. D., Fiore, A. M., Li, Q., Liu, H. Y., Mickley, L. J., and Schultz, M. G.: Global modeling of tropospheric chemistry with assimilated meteorology: Model description and evaluation, J. Geophys. Res., 106, 23073–23095, https://doi.org/10.1029/2001JD000807, 2001.
Bian, Y., Huang, Z., Ou, J., Zhong, Z., Xu, Y., Zhang, Z., Xiao, X., Ye, X., Wu, Y., Yin, X., Li, C., Chen, L., Shao, M., and Zheng, J.: Evolution of anthropogenic air pollutant emissions in Guangdong Province, China, from 2006 to 2015, Atmos. Chem. Phys., 19, 11701–11719, https://doi.org/10.5194/acp-19-11701-2019, 2019.
Buchard, V., Randles, C., da Silva, A., Darmenov, A., Colarco, P., Govindaraju, R., Ferrare, R., Hair, J., Beyersdorf, A., and Ziemba, L.: The MERRA-2 aerosol reanalysis, 1980 onward. Part II: Evaluation and case studies, J. Climate, 30, 6851–6872, 2017.
Cai, W., Li, K., Liao, H., Wang, H., and Wu, L.: Weather conditions conducive to Beijing severe haze more frequent under climate change, Nat. Clim. Change, 7, 257–262, https://doi.org/10.1038/nclimate3249, 2017.
Chang, L., Xu, J., Tie, X., and Wu, J.: Impact of the 2015 El Nino event on winter air quality in China, Sci. Rep.-UK, 6, 34275, https://doi.org/10.1038/srep34275, 2016.
Chawla, N., Bowyer, K., Hall, L., and Kegelmeyer, W.: SMOTE: Synthetic Minority Over-sampling Technique, J. Artif. Intell. Res., 16, 321–357, https://doi.org/10.1613/jair.953, 2002.
Chawla, N., Lazarevic, A., Hall, L., and Bowyer, K.: SMOTEBoost: Improving Prediction of the Minority Class in Boosting, Springer, Berlin, Heidelberg, 107–119, https://doi.org/10.1007/978-3-540-39804-2_12, 2003.
Chen, H., Wang, H., Sun, J., Xu, Y., and Yin, Z.: Anthropogenic fine particulate matter pollution will be exacerbated in eastern China due to 21st century GHG warming, Atmos. Chem. Phys., 19, 233–243, https://doi.org/10.5194/acp-19-233-2019, 2019.
Chen, L., Zhu, J., Liao, H., Yang, Y., and Yue, X.: Meteorological influences on PM2.5 and O3 trends and associated health burden since China's clean air actions, Sci. Total Environ., 744, 140837, https://doi.org/10.1016/j.scitotenv.2020.140837, 2020.
Chen, Z., Chen, D., Zhao, C., Kwan, M.-p., Cai, J., Zhuang, Y., Zhao, B., Wang, X., Chen, B., Yang, J., Li, R., He, B., Gao, B., Wang, K., and Xu, B.: Influence of meteorological conditions on PM2.5 concentrations across China: A review of methodology and mechanism, Environ. Int., 139, 105558, https://doi.org/10.1016/j.envint.2020.105558, 2020.
Cheng, N., Cheng, B., Li, S., and Ning, T.: Effects of meteorology and emission reduction measures on air pollution in Beijing during heating seasons, Atmos. Pollut. Res., 10, 971–979, https://doi.org/10.1016/j.apr.2019.01.005, 2019.
Cheng, X., Boiyo, R., Zhao, T., Xu, X., Gong, S., Xie, X., and Shang, K.: Climate modulation of Niño3.4 SST-anomalies on air quality change in southern China: Application to seasonal forecast of haze pollution, Atmos. Res., 225, 157–164, https://doi.org/10.1016/j.atmosres.2019.04.002, 2019.
Dong, L., Li, S., Yang, J., Shi, W., and Zhang, L.: Investigating the performance of satellite-based models in estimating the surface PM2.5 over China, Chemosphere, 256, 127051, https://doi.org/10.1016/j.chemosphere.2020.127051, 2020.
Feng, J., Liao, H., Li, Y., Zhang, Z., and Tang, Y.: Long-term trends and variations in haze-related weather conditions in north China during 1980–2018 based on emission-weighted stagnation intensity, Atmos. Environ., 240, 117830, https://doi.org/10.1016/j.atmosenv.2020.117830, 2020.
Ghorbani, R. and Ghousi, R.: Comparing Different Resampling Methods in Predicting Students' Performance Using Machine Learning Techniques, IEEE Access, 8, 67899–67911, https://doi.org/10.1109/ACCESS.2020.2986809, 2020.
Gong, P., Li, X., and Zhang, W.: 40-Year (1978–2017) human settlement changes in China reflected by impervious surfaces from satellite remote sensing, Sci. Bull., 64, 756–763, https://doi.org/10.1016/j.scib.2019.04.024, 2019a.
Gong, P., Liu, H., Zhang, M., Li, C., Wang, J., Huang, H., Clinton, N., Ji, L., Li, W., Bai, Y., Chen, B., Xu, B., Zhu, Z., Yuan, C., Ping Suen, H., Guo, J., Xu, N., Li, W., Zhao, Y., Yang, J., Yu, C., Wang, X., Fu, H., Yu, L., Dronova, I., Hui, F., Cheng, X., Shi, X., Xiao, F., Liu, Q., and Song, L.: Stable classification with limited sample: transferring a 30-m resolution sample set collected in 2015 to mapping 10-m resolution global land cover in 2017, Sci. Bull., 64, 370–373, https://doi.org/10.1016/j.scib.2019.03.002, 2019b.
Grange, S. K., Carslaw, D. C., Lewis, A. C., Boleti, E., and Hueglin, C.: Random forest meteorological normalisation models for Swiss PM10 trend analysis, Atmos. Chem. Phys., 18, 6223–6239, https://doi.org/10.5194/acp-18-6223-2018, 2018.
He, C., Liu, R., Wang, X., Liu, S. C., Zhou, T., and Liao, W.: How does El Niño-Southern Oscillation modulate the interannual variability of winter haze days over eastern China?, Sci. Total Environ., 651, 1892–1902, https://doi.org/10.1016/j.scitotenv.2018.10.100, 2019.
He, L. and Wang, D.: Pollution characteristics and influencing factors of PM2.5 in Fuxin City, Ecol. Sci., 1, 201–208, 2017.
He, J., Gong, S., Yu, Y., Yu, L., Wu, L., Mao, H., Song, C., Zhao, S., Liu, H., Li, X., and Li, R.: Air pollution characteristics and their relation to meteorological conditions during 2014–2015 in major Chinese cities, Environ. Pollut., 223, 484-496, https://doi.org/10.1016/j.envpol.2017.01.050, 2017.
He, Q. and Huang, B.: Satellite-based mapping of daily high-resolution ground PM2.5 in China via space-time regression modeling, Remote Sens. Environ., 206, 72–83, 2018.
Hsu, N., Jeong, M. J., Bettenhausen, C., Sayer, A., Hansell, R., Seftor, C., Huang, J., and Tsay, S. C.: Enhanced Deep Blue aerosol retrieval algorithm: The second generation, J. Geophys. Res.-Atmos., 118, 9296–9315, 2013.
Jeong, J. I. and Park, R. J.: Winter monsoon variability and its impact on aerosol concentrations in East Asia, Environ. Pollut., 221, 285–292, https://doi.org/10.1016/j.envpol.2016.11.075, 2017.
Jinnagara Puttaswamy, S., Nguyen, H. M., Braverman, A., Hu, X., and Liu, Y.: Statistical data fusion of multi-sensor AOD over the Continental United States, Geocarto Int., 29, 48–64, 2014.
Levy, R. C., Mattoo, S., Munchak, L. A., Remer, L. A., Sayer, A. M., Patadia, F., and Hsu, N. C.: The Collection 6 MODIS aerosol products over land and ocean, Atmos. Meas. Tech., 6, 2989–3034, https://doi.org/10.5194/amt-6-2989-2013, 2013.
Li, M., Liu, H., Geng, G. N., Hong, C. P., Liu, F., Song, Y., Tong, D., Zheng, B., Cui, H. Y., Man, H. Y., Zhang, Q., and He, K. B.: Anthropogenic emission inventories in China: a review, Natl. Sci. Rev., 4, 834–866, https://doi.org/10.1093/nsr/nwx150, 2017a.
Li, M., Zhang, Q., Kurokawa, J.-I., Woo, J.-H., He, K., Lu, Z., Ohara, T., Song, Y., Streets, D. G., Carmichael, G. R., Cheng, Y., Hong, C., Huo, H., Jiang, X., Kang, S., Liu, F., Su, H., and Zheng, B.: MIX: a mosaic Asian anthropogenic emission inventory under the international collaboration framework of the MICS-Asia and HTAP, Atmos. Chem. Phys., 17, 935–963, https://doi.org/10.5194/acp-17-935-2017, 2017b.
Liu, F., Zhang, Q., Tong, D., Zheng, B., Li, M., Huo, H., and He, K. B.: High-resolution inventory of technologies, activities, and emissions of coal-fired power plants in China from 1990 to 2010, Atmos. Chem. Phys., 15, 13299–13317, https://doi.org/10.5194/acp-15-13299-2015, 2015.
Liu, R., Liao, H., Chang, W., Zhang, T., and Jin, S.: Impact of climate change on aerosol concentrations in eastern China based on Atmospheric Chemistry and Climate Model Intercomparison Project (ACCMIP) datasets, Chinese Journal of Atmospheric Sciences, 41, 739–751, 2017.
Liu, T., Gong, S., He, J., Yu, M., Wang, Q., Li, H., Liu, W., Zhang, J., Li, L., Wang, X., Li, S., Lu, Y., Du, H., Wang, Y., Zhou, C., Liu, H., and Zhao, Q.: Attributions of meteorological and emission factors to the 2015 winter severe haze pollution episodes in China's Jing-Jin-Ji area, Atmos. Chem. Phys., 17, 2971–2980, https://doi.org/10.5194/acp-17-2971-2017, 2017.
Liu, Y., Paciorek, C. J., and Koutrakis, P.: Estimating regional spatial and temporal variability of PM2.5 concentrations using satellite data, meteorology, and land use information, Environ. Health Persp., 117, 886–892, https://doi.org/10.1289/ehp.0800123, 2009.
National Centers for Environmental Prediction/National Weather Service/NOAA/U.S. Department of Commerce: NCEP FNL Operational Model Global Tropospheric Analyses, Continuing from July 1999, https://doi.org/10.5065/D6M043C6, Research Data Archive at the National Center for Atmospheric Research; Computational and Information Systems Laboratory, Boulder, 2000.
United States Environmental Protection Agency: Operational Guidance for the Community Multiscale Air Quality (CMAQ) Modeling System, Version 5.0, February 2012, available at: https://www.airqualitymodeling.org/index.php/CMAQ_version_5.0_(February_2010_release)_OGD (last access: 17 March 2019), 2012.
Pearce, J. L., Beringer, J., Nicholls, N., Hyndman, R. J., and Tapper, N. J.: Quantifying the influence of local meteorology on air quality using generalized additive models, Atmos. Environ., 45, 1328–1336, https://doi.org/10.1016/j.atmosenv.2010.11.051, 2011.
Qiu, D., Liu, J., Zhu, L., Mo, L., and Zhang, Z.: Particulate matter assessment of a wetland in Beijing, J. Environ. Sci., 36, 93–101, https://doi.org/10.1016/j.jes.2015.04.016, 2015.
Qu, L., Liu, S., Ma, L., Zhang, Z., Du, J., Zhou, Y., and Meng, F.: Evaluating the meteorological normalized PM2.5 trend (2014–2019) in the “2+26” region of China using an ensemble learning technique, Environ. Pollut., 266, 115346, https://doi.org/10.1016/j.envpol.2020.115346, 2020.
Randles, C., da Silva, A. M., Buchard, V., Colarco, P., Darmenov, A., Govindaraju, R., Smirnov, A., Holben, B., Ferrare, R., and Hair, J.: The MERRA-2 aerosol reanalysis, 1980 onward. Part I: System description and data assimilation evaluation, J. Climate, 30, 6823–6850, 2017.
Sá, E., Tchepel, O., Carvalho, A., and Borrego, C.: Meteorological driven changes on air quality over Portugal: a KZ filter application, Atmos. Pollut. Res., 6, 979–989, https://doi.org/10.1016/j.apr.2015.05.003, 2015.
Saputra, A. and Suharjito: Fraud Detection using Machine Learning in e-Commerce, Int. J. Adv. Comput. Sci. Appl., 10, 332–339, 2019.
She, Q., Choi, M., Belle, J. H., Xiao, Q., Bi, J., Huang, K., Meng, X., Geng, G., Kim, J., He, K., Liu, M., and Liu, Y.: Satellite-based estimation of hourly PM2.5 levels during heavy winter pollution episodes in the Yangtze River Delta, China, Chemosphere, 239, 124678, https://doi.org/10.1016/j.chemosphere.2019.124678, 2020.
Shen, L., Jacob, D. J., Mickley, L. J., Wang, Y., and Zhang, Q.: Insignificant effect of climate change on winter haze pollution in Beijing, Atmos. Chem. Phys., 18, 17489–17496, https://doi.org/10.5194/acp-18-17489-2018, 2018.
State Council of the People’s Republic of China: Notice of the general office of the state council on issuing the air pollution prevention and control action plan, available at: http://www.gov.cn/zwgk/2013-09/12/content_2486773.htm, last access: 1 December 2020a.
State Council of the People's Republic of China: Notice of the general office of the state council on issuing the three-year action plan on blue sky protection campaign, available at: http://www.gov.cn/zhengce/content/2018-07/03/content_5303158.htm, last access: 1 December 2020b.
Torgo, L.: Data Mining with R: Learning with Case Studies, Chapman and Hall/CRC, New York, https://doi.org/10.1201/9780429292859, 2010.
Vu, T. V., Shi, Z., Cheng, J., Zhang, Q., He, K., Wang, S., and Harrison, R. M.: Assessing the impact of clean air action on air quality trends in Beijing using a machine learning technique, Atmos. Chem. Phys., 19, 11303–11314, https://doi.org/10.5194/acp-19-11303-2019, 2019.
Wang, H.-J. and Chen, H.-P.: Understanding the recent trend of haze pollution in eastern China: roles of climate change, Atmos. Chem. Phys., 16, 4205–4211, https://doi.org/10.5194/acp-16-4205-2016, 2016.
Wang, P., Guo, H., Hu, J., Kota, S. H., Ying, Q., and Zhang, H.: Responses of PM2.5 and O3 concentrations to changes of meteorology and emissions in China, Sci. Total Environ., 662, 297–306, https://doi.org/10.1016/j.scitotenv.2019.01.227, 2019.
Wang, X. and Zhang, R.: Effects of atmospheric circulations on the interannual variation in PM2.5 concentrations over the Beijing–Tianjin–Hebei region in 2013–2018, Atmos. Chem. Phys., 20, 7667–7682, https://doi.org/10.5194/acp-20-7667-2020, 2020.
Wang, Y., Yuan, Q., Li, T., Shen, H., Zheng, L., and Zhang, L.: Evaluation and comparison of MODIS Collection 6.1 aerosol optical depth against AERONET over regions in China with multifarious underlying surfaces, Atmos. Environ., 200, 280–301, https://doi.org/10.1016/j.atmosenv.2018.12.023, 2019.
Wei, J., Li, Z., Cribb, M., Huang, W., Xue, W., Sun, L., Guo, J., Peng, Y., Li, J., Lyapustin, A., Liu, L., Wu, H., and Song, Y.: Improved 1 km resolution PM2.5 estimates across China using enhanced space–time extremely randomized trees, Atmos. Chem. Phys., 20, 3273–3289, https://doi.org/10.5194/acp-20-3273-2020, 2020.
Xiao, Q., Chang, H. H., Geng, G., and Liu, Y.: An Ensemble Machine-Learning Model To Predict Historical PM2.5 Concentrations in China from Satellite Data, Environ. Sci. Technol., 52, 13260–13269, https://doi.org/10.1021/acs.est.8b02917, 2018.
Xiao, Q., Geng, G., Cheng, J., Liang, F., Li, R., Meng, X., Xue, T., Huang, X., Kan, H., Zhang, Q., and He, K.: Evaluation of gap-filling approaches in satellite-based daily PM2.5 prediction models, Atmos. Environ., 244, 117921, https://doi.org/10.1016/j.atmosenv.2020.117921, 2021a.
Xiao, Q., Liang, F., Ning, M., Zhang, Q., Bi, J., He, K., Lei, Y., and Liu, Y.: The long-term trend of PM2.5-related mortality in China: The effects of source data selection, Chemosphere, 263, 127894, https://doi.org/10.1016/j.chemosphere.2020.127894, 2021b.
Xu, Y., Xue, W., Lei, Y., Huang, Q., Zhao, Y., Cheng, S., Ren, Z., and Wang, J.: Spatiotemporal variation in the impact of meteorological conditions on PM2.5 pollution in China from 2000 to 2017, Atmos. Environ., 223, 117215, https://doi.org/10.1016/j.atmosenv.2019.117215, 2020.
Xue, T., Zheng, Y., Tong, D., Zheng, B., Li, X., Zhu, T., and Zhang, Q.: Spatiotemporal continuous estimates of PM2.5 concentrations in China, 2000–2016: A machine learning method with inputs from satellites, chemical transport model, and ground observations, Environ. Int., 123, 345–357, https://doi.org/10.1016/j.envint.2018.11.075, 2019.
Yang, Y., Wang, J., Hong, Q., and Wang, Y.: A plam index forecast method for air quality of beijing in summer, Journal of Applied Meteorological Science, 20, 649–655, https://doi.org/10.1016/S1003-6326(09)60084-4, 2009.
Yanosky, J. D., Paciorek, C. J., Laden, F., Hart, J. E., Puett, R. C., Liao, D., and Suh, H. H.: Spatio-temporal modeling of particulate air pollution in the conterminous United States using geographic and meteorological predictors, Environmental Health, 13, 63, https://doi.org/10.1186/1476-069X-13-63, 2014.
Yarwood, G., Rao, S., Yocke, M., and Whitten, G.: Updates to the Carbon Bond Chemical Mechanism: CB05, Final Report to the US EPA, RT-0400675, available at: https://camx-wp.azurewebsites.net/Files/CB05_Final_Report_120805.pdf (last access: 16 June 2021), 2005.
Yi, K., Liu, J., Wang, X., Ma, J., Hu, J., Wan, Y., Xu, J., Yang, H., Liu, H., Xiang, S., and Tao, S.: A combined Arctic-tropical climate pattern controlling the inter-annual climate variability of wintertime PM2.5 over the North China Plain, Environ. Pollut., 245, 607–615, https://doi.org/10.1016/j.envpol.2018.10.136, 2019.
Yin, Z. and Wang, H.: The relationship between the subtropical Western Pacific SST and haze over North-Central North China Plain, International J. Climatol., 36, 3479–3491, https://doi.org/10.1002/joc.4570, 2016.
Yin, Z. and Wang, H.: Role of atmospheric circulations in haze pollution in December 2016, Atmos. Chem. Phys., 17, 11673–11681, https://doi.org/10.5194/acp-17-11673-2017, 2017.
Yin, Z. and Wang, H.: The strengthening relationship between Eurasian snow cover and December haze days in central North China after the mid-1990s, Atmos. Chem. Phys., 18, 4753–4763, https://doi.org/10.5194/acp-18-4753-2018, 2018.
Yin, Z., Wang, H., and Yuan, D.: Interdecadal increase of haze in winter over North China and the Huang-huai Area and the weakening of the East Asia Winter Monsoon, Kexue Tongbao/Chinese Sci. Bull., 60, 1395–1400, https://doi.org/10.1360/N972014-01348, 2015.
Yin, Z., Wang, H., and Chen, H.: Understanding severe winter haze events in the North China Plain in 2014: roles of climate anomalies, Atmos. Chem. Phys., 17, 1641–1651, https://doi.org/10.5194/acp-17-1641-2017, 2017.
Zhai, S., Jacob, D. J., Wang, X., Shen, L., Li, K., Zhang, Y., Gui, K., Zhao, T., and Liao, H.: Fine particulate matter (PM2.5) trends in China, 2013–2018: separating contributions from anthropogenic emissions and meteorology, Atmos. Chem. Phys., 19, 11031–11041, https://doi.org/10.5194/acp-19-11031-2019, 2019.
Zhang, L., Wang, T., Lv, M. Y., and Zhang, Q.: On the severe haze in Beijing during January 2013: Unraveling the effects of meteorological anomalies with WRF-Chem, Atmos. Environ., 104, 11–21, https://doi.org/10.1016/j.atmosenv.2015.01.001, 2015.
Zhang, Q., Zheng, Y., Tong, D., Shao, M., Wang, S., Zhang, Y., Xu, X., Wang, J., He, H., Liu, W., Ding, Y., Lei, Y., Li, J., Wang, Z., Zhang, X., Wang, Y., Cheng, J., Liu, Y., Shi, Q., Yan, L., Geng, G., Hong, C., Li, M., Liu, F., Zheng, B., Cao, J., Ding, A., Gao, J., Fu, Q., Huo, J., Liu, B., Liu, Z., Yang, F., He, K., and Hao, J.: Drivers of improved PM2.5 air quality in China from 2013 to 2017, P. Natl. Acad. Sci. USA, 116, 24463, https://doi.org/10.1073/pnas.1907956116, 2019.
Zhang, X., Zhong, J., Wang, J., Wang, Y., and Liu, Y.: The interdecadal worsening of weather conditions affecting aerosol pollution in the Beijing area in relation to climate warming, Atmos. Chem. Phys., 18, 5991–5999, https://doi.org/10.5194/acp-18-5991-2018, 2018.
Zhang, X., Xu, X., Ding, Y., Liu, Y., Zhang, H., Wang, Y., and Zhong, J.: The impact of meteorological changes from 2013 to 2017 on PM2.5 mass reduction in key regions in China, Sci. China Earth Sci., 62, 1885–1902, https://doi.org/10.1007/s11430-019-9343-3, 2019.
Zhang, Y., Vu, T. V., Sun, J., He, J., Shen, X., Lin, W., Zhang, X., Zhong, J., Gao, W., Wang, Y., Fu, T. M., Ma, Y., Li, W., and Shi, Z.: Significant Changes in Chemistry of Fine Particles in Wintertime Beijing from 2007 to 2017: Impact of Clean Air Actions, Environ. Sci. Technol., 54, 1344–1352, https://doi.org/10.1021/acs.est.9b04678, 2020.
Zhao, X. J., Zhao, P. S., Xu, J., Meng,, W., Pu, W. W., Dong, F., He, D., and Shi, Q. F.: Analysis of a winter regional haze event and its formation mechanism in the North China Plain, Atmos. Chem. Phys., 13, 5685–5696, https://doi.org/10.5194/acp-13-5685-2013, 2013.
Zheng, B., Tong, D., Li, M., Liu, F., Hong, C., Geng, G., Li, H., Li, X., Peng, L., Qi, J., Yan, L., Zhang, Y., Zhao, H., Zheng, Y., He, K., and Zhang, Q.: Trends in China's anthropogenic emissions since 2010 as the consequence of clean air actions, Atmos. Chem. Phys., 18, 14095–14111, https://doi.org/10.5194/acp-18-14095-2018, 2018.
Zheng, Y. X., Xue, T., Zhang, Q., Geng, G. N., Tong, D., Li, X., and He, K. B.: Air quality improvements and health benefits from China's clean air action since 2013, Environ. Res. Lett., 12, 114020, https://doi.org/10.1088/1748-9326/aa8a32, 2017.
Zhu, J., Liao, H., and Li, J.: Increases in aerosol concentrations over eastern China due to the decadal-scale weakening of the East Asian summer monsoon, Geophysical Research Letters, 39, https://doi.org/10.1029/2012GL051428, 2012.