the Creative Commons Attribution 4.0 License.
the Creative Commons Attribution 4.0 License.
 | 17 Jun 2021
Technical note: Sea salt interference with black carbon quantification in snow samples using the single particle soot photometer
Marco Zanatta
Andreas Herber
Zsófia Jurányi
Oliver Eppers
Johannes Schneider
Joshua P. Schwarz
After aerosol deposition from the atmosphere, black carbon (BC) takes part in the snow albedo feedback contributing to the modification of the Arctic radiative budget. With the initial goal of quantifying the concentration of BC in the Arctic snow and subsequent climatic impacts, snow samples were collected during the research vessel (R/V) Polarstern expedition of PASCAL (Physical Feedbacks of Arctic Boundary Layer, Sea Ice, Cloud and Aerosol; Polarstern cruise 106) in the sea-ice-covered Fram Strait in early summer 2017. The refractory BC (rBC) content was then measured in the laboratory of the Alfred Wegener Institute with the single particle soot photometer (SP2). Based on the strong observational correlations between both rBC concentration and rBC diameter with snow salinity, we hypothesize a salt-induced matrix effect interfering with the SP2 analysis. This paper evaluates the impact of sea salt, based on the measurement of electrical conductivity (κ) in water samples, on rBC measurements made with a SP2 nebulizer technique. Under realistic salinity conditions, laboratory experiments indicated a dramatic six-fold reduction in observed rBC concentration with increasing salinity. In the salinity conditions tested in the present work (salt concentration below 0.4 g L−1) the impact of salt on the nebulization of water droplets might be negligible. However, the SP2 mass detection efficiency systematically decreased with increasing salinity, with the smaller rBC particles being preferentially undetected. The high concentration of suspended salt particles and the formation of thick salt coatings on rBC cores caused problems in the SP2 analog-to-digital conversion of the signal and incandescence quenching, respectively. Changes to the signal acquisition parameters and the laser power of the SP2 improved the mass detection efficiency, which, nonetheless, stayed below unity. The present work provides evidence that a high concentration of sea salt undermines the quantification of rBC in snow performed with the SP2 nebulizer system described here. This interference has not been previously reported and might affect the future such analysis of rBC particles in snow collected, especially over sea ice or coastal regions strongly affected by sea salt deposition.
- Article
(2006 KB) - Full-text XML
-
Supplement
(3978 KB) - BibTeX
- EndNote


Black carbon (BC) aerosol, produced by incomplete combustion of biomass and fossil fuels, is transported from extensive mid-latitude source regions to the Arctic atmosphere (Schacht et al., 2019), where it influences the regional climate (Quinn et al., 2015). Once removed from the atmosphere, BC particles continue to affect the Arctic radiative budget by directly decreasing the snow albedo (Dou and Xiao, 2016) and promoting snow grain growth (Skiles and Painter, 2017). In turn, the acceleration of the melting rate leads to earlier exposure to the underlying surface. The overall process is usually called snow albedo feedback and might be considered among the strongest forcing mechanisms in the Arctic region (Hansen and Nazarenko, 2004; Flanner et al., 2007; Skiles et al., 2018).
Considering the climatic repercussions caused by BC in snow, the scientific community has been measuring the content of BC in snow across the Arctic for almost 4 decades (Clarke and Noone, 1985; Doherty et al., 2010; Dou and Xiao, 2016; Tørseth et al., 2019). Unfortunately, a standardized and universally accepted analytical technique for the measurement does not yet exist. Generally, the wide variety of analytical approaches to measure BC in snow can be divided into offline and online methods. Considering the offline approach, BC mass can be measured after the melting and filtration of the snow sample via thermal optical analysis (Hagler et al., 2007) or transmittance spectroscopy (Doherty et al., 2010). Alternatively, BC mass can be quantified, after the nebulization of the melted snow samples, with online techniques such as the photoacoustic technique (Schnaiter et al., 2019) or the laser-induced incandescence technique (Schwarz et al., 2012).
In recent years, the laser-induced incandescence technique, more specifically with the single particle soot photometer (SP2; Droplet Measurement Technologies, Longmont, CO, USA), was often used to quantify refractory BC (rBC) particle (Petzold et al., 2013) concentrations in the snow and ice in various regions of the Arctic (Khan et al., 2017; Macdonald et al., 2017; Jacobi et al., 2019; Mori et al., 2019; Zhang et al., 2020). The rBC analytical procedure now generally includes the following three steps: (1) melting of the snow and/or ice sample, (2) nebulization with the pneumatic concentric nebulizer equipped with a warming–cooling desolvating system (i.e., Marin-5 – Teledyne Technologies, Omaha, NE, USA; Apex Q – Elemental Scientific Inc., Omaha, NE, USA) and (3) sampling the resulting aerosol with the SP2. During nebulization, the melted sample is usually transported to the nebulizer at a constant flow rate via a peristaltic pump. The liquid is then broken into small droplets and suspended in a nebulization chamber by means of a pneumatic concentric nebulizer. Once suspended, the solvent in the droplets is evaporated and removed with a warming cooling cycle. Several studies addressed the issue of reducing the losses of rBC during the nebulization phases by controlling the liquid flow rate, gas flow rate and pressure and temperature cycle (Lim et al., 2014; Wendl et al., 2014; Mori et al., 2016; Katich et al., 2017). Overall, up to 75 % of rBC mass is suspended from the sample, transported through the nebulizer and, finally, detected by the SP2 without the addition of surfactants (Lim et al., 2014; Mori et al., 2016). Due to the reduction in water density and viscosity, the doping with isopropyl alcohol increases the rBC mass nebulization efficiency to values close to unity (Katich et al., 2017). It must be considered that, despite corrections for the nebulization efficiency, the degree of comparability with more traditional techniques such as the thermal optical method and the integrating sphere/integrating sandwich spectrophotometer is still variable (Schwarz et al., 2012; Lim et al., 2014; Mori et al., 2019).
In the Arctic region, many snow samples were collected in coastal regions and over sea ice (Tørseth et al., 2019) where the sea salt components often dominate the snow chemical composition, especially in summer in presence of open water (Krnavek et al., 2012; Jacobi et al., 2019). This is particularly relevant over sea ice, where sea salt aerosol, suspended as sea spray, can be deposited at the snow surface, and the capillary upward migration of sea salt from the sea ice can lead to a high salt concentration at the bottom of the snowpack (Domine et al., 2004). Our surface snow samples, collected over the sea-ice-covered Fram Strait in summer 2017 within the PASCAL (Physical Feedbacks of Arctic Boundary Layer, Sea Ice, Cloud and Aerosol) experiment, were highly affected by salt deposition and showed a wide range of salinity. The presence of salt might have broad impacts on snow analysis, including, via the influence of the nebulization of the sample, the analyte and solvent transport and even the analytical signal of certain analytical techniques, such as inductively coupled plasma atomic emission spectroscopy (e.g., Sharp, 1988; Todolí et al., 2002; Burgener and Makonnen, 2020). Such effects are commonly called matrix effects. Until now, the potential interference of sea salt during the analysis of rBC particles with the SP2 has not been assessed.
Considering the high salinity of the snow samples collected in the Fram Strait, a series of laboratory experiments were conducted to quantify the impact of sea salt on nebulization and rBC detection with the SP2 instrument. This work aims to identify the importance of the salt matrix effect, especially in the context of the MOSAiC (Multidisciplinary drifting Observatory for the Study of Arctic Climate; https://mosaic-expedition.org/, last access: 15 June 2021) project, where hundreds of snow samples were collected during the 1-year-long drift over the sea ice for the analysis of rBC in the snow with the SP2 nebulizer technique.
2.1 Snow sampling during the PASCAL expedition
The PASCAL expedition (Flores and Macke, 2018), organized within the framework of the (AC)3 project (ArctiC Amplification: Climate Relevant Atmospheric and SurfaCe Processes, and Feedback Mechanisms; Wendisch et al., 2018), was a shipborne field campaign on board the research vessel (RV) Polarstern, the research icebreaker of the Alfred Wegener Institute (Bremerhaven, Germany). The 25 surface snow samples discussed here were collected on the sea ice during the drift phase, which occurred between 3 and 16 June 2017 in the Fram Strait between 10.0–11.5∘ E and 81.7–82∘ N at a distance between 0.5 and 1 km from open leads. These samples were collected in the first 5 cm of the snowpack and stored frozen at −20 ∘C in polypropylene tubes (Fisher Scientific GmbH, Schwerte, Germany) of 50 mL volume (typically 20–30 g water content) until analysis. For each snow sample, the physical properties of the corresponding snow layer were also measured. The specific surface area (SSA) was measured with the IceCube instrument (A2 Photonic Sensors, Grenoble, France), the snow density with a custom-made density cutter and the snow temperature with a negative temperature coefficient one channel thermometer (model 101; Testo Ltd, Alton Hampshire, United Kingdom).
2.2 Instrumental setup during laboratory analysis
The experimental setup used for the snow sample analysis is schematized in Fig. 1. First, the snow samples were melted in a thermostatic bath at 25 ∘C. Immediately after melting, the electrical conductivity (κ) of the liquid sample was measured with a portable conductivity meter (model – Cond 3110; WTW, Xylem Analytics, Weilheim, Germany) equipped with a two-electrode conductivity cell (model – KLE 325; WTW, Xylem Analytics, Weilheim, Germany). The probe was immersed in the sample and was rinsed with Milli-Q water before and after each measurement. Considering that the electrical conductivity generally increases by 2 % per 1 ∘C increase (Hayashi, 2004), we estimate that our κ measurements had a precision of 10 %. The electrical conductivity of Milli-Q water never exceeded 1 µS cm−1 and was considerably lower than that of any snow sample.
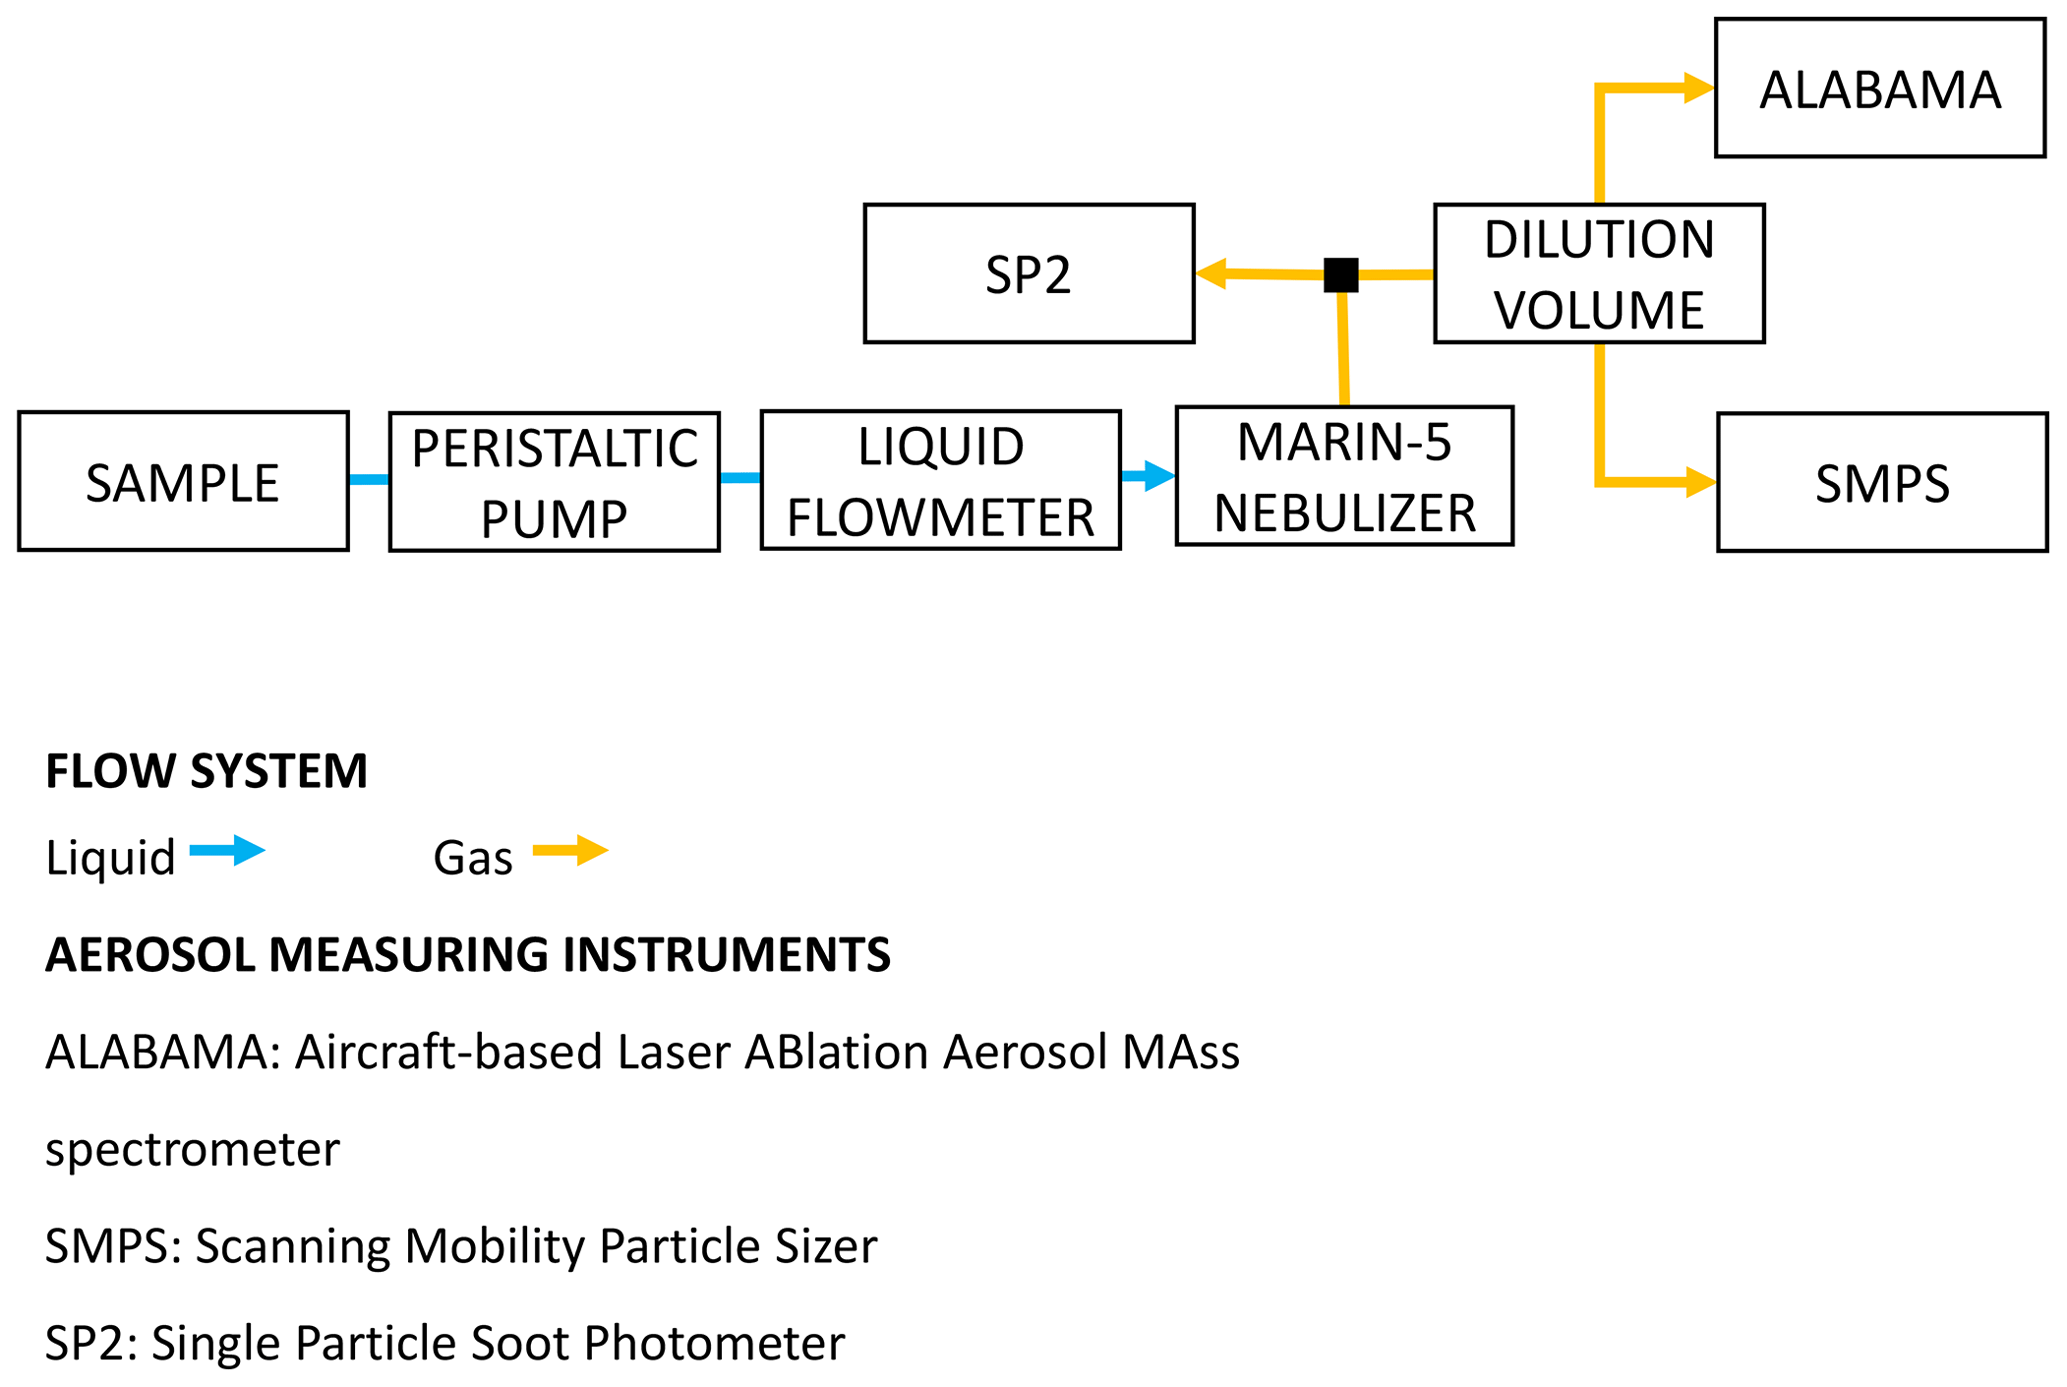
Figure 1Schematic of the instrumental setup deployed to analyze the PASCAL snow samples and to perform the laboratory test experiments. ALABAMA (aircraft-based laser ablation aerosol mass spectrometer) was not available for laboratory test experiments.
The sample was then fed via a peristaltic pump and through a liquid flow meter (SLI liquid flow meter; Sensirion AG, Staefa, Switzerland) to a Marin-5 nebulizer (Teledyne Technologies, Omaha, NE, USA). In the Marin-5, the liquid sample was aerosolized into an airflow by a concentric pneumatic nebulizer, and the resulting droplets were dehydrated by a heating–cooling cycle (110–5 ∘C). Finally, the dry aerosol (relative humidity below 30 %; Katich et al., 2017) was transported via tubing to the aerosol-measuring instruments. The mass nebulization efficiency varied between 0.58 and 0.66 (see Sect. 3.3 for more details). A more detailed description of the Marin-5 nebulizer can be found in Mori et al. (2016). The liquid (70 µL min−1) and air (1 L min−1) flow rates were selected to maximize the suspension of rBC mass, following Katich et al. (2017), and kept constant during all experiments. No surfactants were added to the snow samples or to the test suspensions and/or solutions. In this work, the aerosolized particles were directed to a single particle soot photometer (SP2; Droplet Measurement Technologies, Longmont, USA), a scanning mobility particle sizer (SMPS; TSI, Shoreview, MN, USA), and a single-particle mass spectrometer ALABAMA (aircraft-based laser ablation aerosol mass spectrometer; Brands et al., 2011; Köllner et al., 2017; Clemen et al., 2020). Our SP2 sampled the aerosol directly from the Marin-5 exhaust and provided a number concentration (NrBC), mass mixing ratio (MrBC) and size distribution of rBC in the mass equivalent diameter (DrBC) range of 70–1000 nm. DrBC was calculated from the rBC mass measured in individual particles using a void-free density of 1800 kg m−3 (Moteki and Kondo, 2010). The operating principles of the SP2 for atmospheric applications are given by Stephens et al. (2003), while assessments of the performance of the SP2 during snow sample analysis can be found in Lim et al. (2014), Mori et al. (2016) and Katich et al. (2017). The incandescence detectors of the SP2 were calibrated with mass-selected fullerene soot (FS; Alfa Aesar; lot no. W08A039), as described in Laborde et al. (2012b). The SMPS measured the number concentration (N) and size distribution between 14 and 680 nm mobility diameter (DP). Multiple charges and diffusion losses were corrected with the aerosol instrument manager software issued by TSI. The ALABAMA was used to obtain additional information on the chemical composition of single particles with diameters between approximately 110 and 5000 nm (Clemen et al., 2020). Different chemical species, identified using characteristic marker ions of the mass spectra, include sodium chloride, magnesium, non-sea-salt nitrate, non-sea-salt sulfate, organic carbon, levoglucosan–dicarboxylic acids and elemental carbon. Both the SMPS and ALABAMA sampling line were diluted with air by a factor 10.
Transport losses of aerosol particles were calculated using the Particle Loss Calculator software, which treats aerosol diffusion and sedimentation as well as turbulent inertial deposition and inertial deposition in the bends and contractions of tubing (von der Weiden et al., 2009). The software was developed at the Max Planck Institute for Chemistry in Mainz (Germany) and is available at https://www.mpic.de/4230607/particle-loss-calculator-plc (last access: 8 April 2021).
3.1 Surface snow properties in the Fram Strait
3.1.1 Snow physical properties
Warm conditions were encountered during the sampling campaign, with the air temperature increasing from approximately −4 ∘C at the beginning of the campaign to approximately −1 ∘C (with 1 min average values up to 2 ∘C) at the end of sampling. As a consequence of the temperature increase, the snow-specific surface area decreased from 70 to 5 m2 kg, and the snow density increased from 280 to 350 kg m−3. The electrical conductivity of surface snow decreased from values above 1000 µS cm−1 to κ values below 10 µS cm−1 towards the end of the campaign. The decrease in SSA and increase in snow density during the drift phase of the PASCAL expedition indicates the occurrence of melt–refreeze cycles (Haas et al., 2001; Massom et al., 2001; Domine et al., 2007), and the downward migration of soluble salts with percolating water explains the decrease in κ (Domine et al., 2004; Doherty et al., 2013). Considering the wide variability in electrical conductivity, the data set was organized into five salinity classes (Sn). The samples with the lowest conductivity (κ≈5–10 µS cm−1) accounted for 38 % of the total samples and were mainly collected after the melting onset and grouped into S1. S2 includes the samples collected at the snowmelt which showed κ values between approximately 20 and 30 µS cm−1 and accounted for 17 % of the samples. The samples characterized by a κ value above 200 µS cm−1 and below 2000 µS cm−1 represented 46 % of the total number of the collected probes and were organized into three different salinity classes (S3, S4 and S5). The most saline snow sample (κ=3600 µS cm−1) was excluded from further analysis. The mean and boundaries of κ values defining the five salinity classes are listed in Table 1.
Table 1Properties of snow samples grouped in conductivity classes. Conductivity of melted samples measured between 20 and 25 ∘C. Total aerosolized particles measured in the mobility diameter range 14–685 nm show the number concentration (N) and geometric mean of the number size distribution (GDP−N). rBC particles are measured between 60 and 1000 nm of DrBC, showing the number concentration (NrBC), mass mixing ratio (MrBC), geometric mean of the number (GDrBC-N) and mass (GDrBC-M) size distribution. The number fraction of rBC particles (FrBC) is also given.

3.1.2 Relationship between salinity of snow samples and particle aerosolization
Here we investigate the potential relationship between electrical conductivity, which is used here as a proxy for salinity, and the aerosolization of particles. Note that N and NrBC are presented in this section without correction for the nebulization efficiency of the Marin-5 nebulizer.
Under fixed nebulization conditions (constant liquid sample flow and gas flow), a large number of particles (droplet residues) were suspended by the nebulization process. N increased with the electrical conductivity of the sample from 6.1×105 cm−3 in low conductivity samples (κ<10 µS cm−1) to 1.5×106 cm−3 for samples showing conductivity values above 1000 µS cm−1 (Fig. 2a; Table 1). A similar trend was recently observed by Rösch and Cziczo (2020). The correlation of N with κ suggests that most of the aerosolized particles are composed of sea salt, which is expected to be the major solute in seawater. As indicated in Table 1, the size of the aerosolized particles (geometric mean of the number size distribution – GDP−N) increased with κ from 27 nm (S1; κ<10 µS cm−1) to 89 nm (S5; κ>1000 µS cm−1). The GDP−N–κ relationship and the absence of multiple modes in the aerosol size distribution (Fig. S1 in the Supplement) support the assumption of sea salt controlling the aerosol composition. The increase in particle diameter with the liquid concentration of soluble inorganic salts was already observed (Clifford et al., 1993) and was found to be mainly caused by the higher concentration of salt in the primary aerosolized droplets. Additionally, particle growth caused by coalescence and promoted by the high number concentration of aerosolized particles might also contribute to the diameter shift (Olivares and Houk, 1986). The shift of the size distribution mode into the size detection range of the SMPS might also contribute to the N-κ positive correlation shown in Fig. 2a.
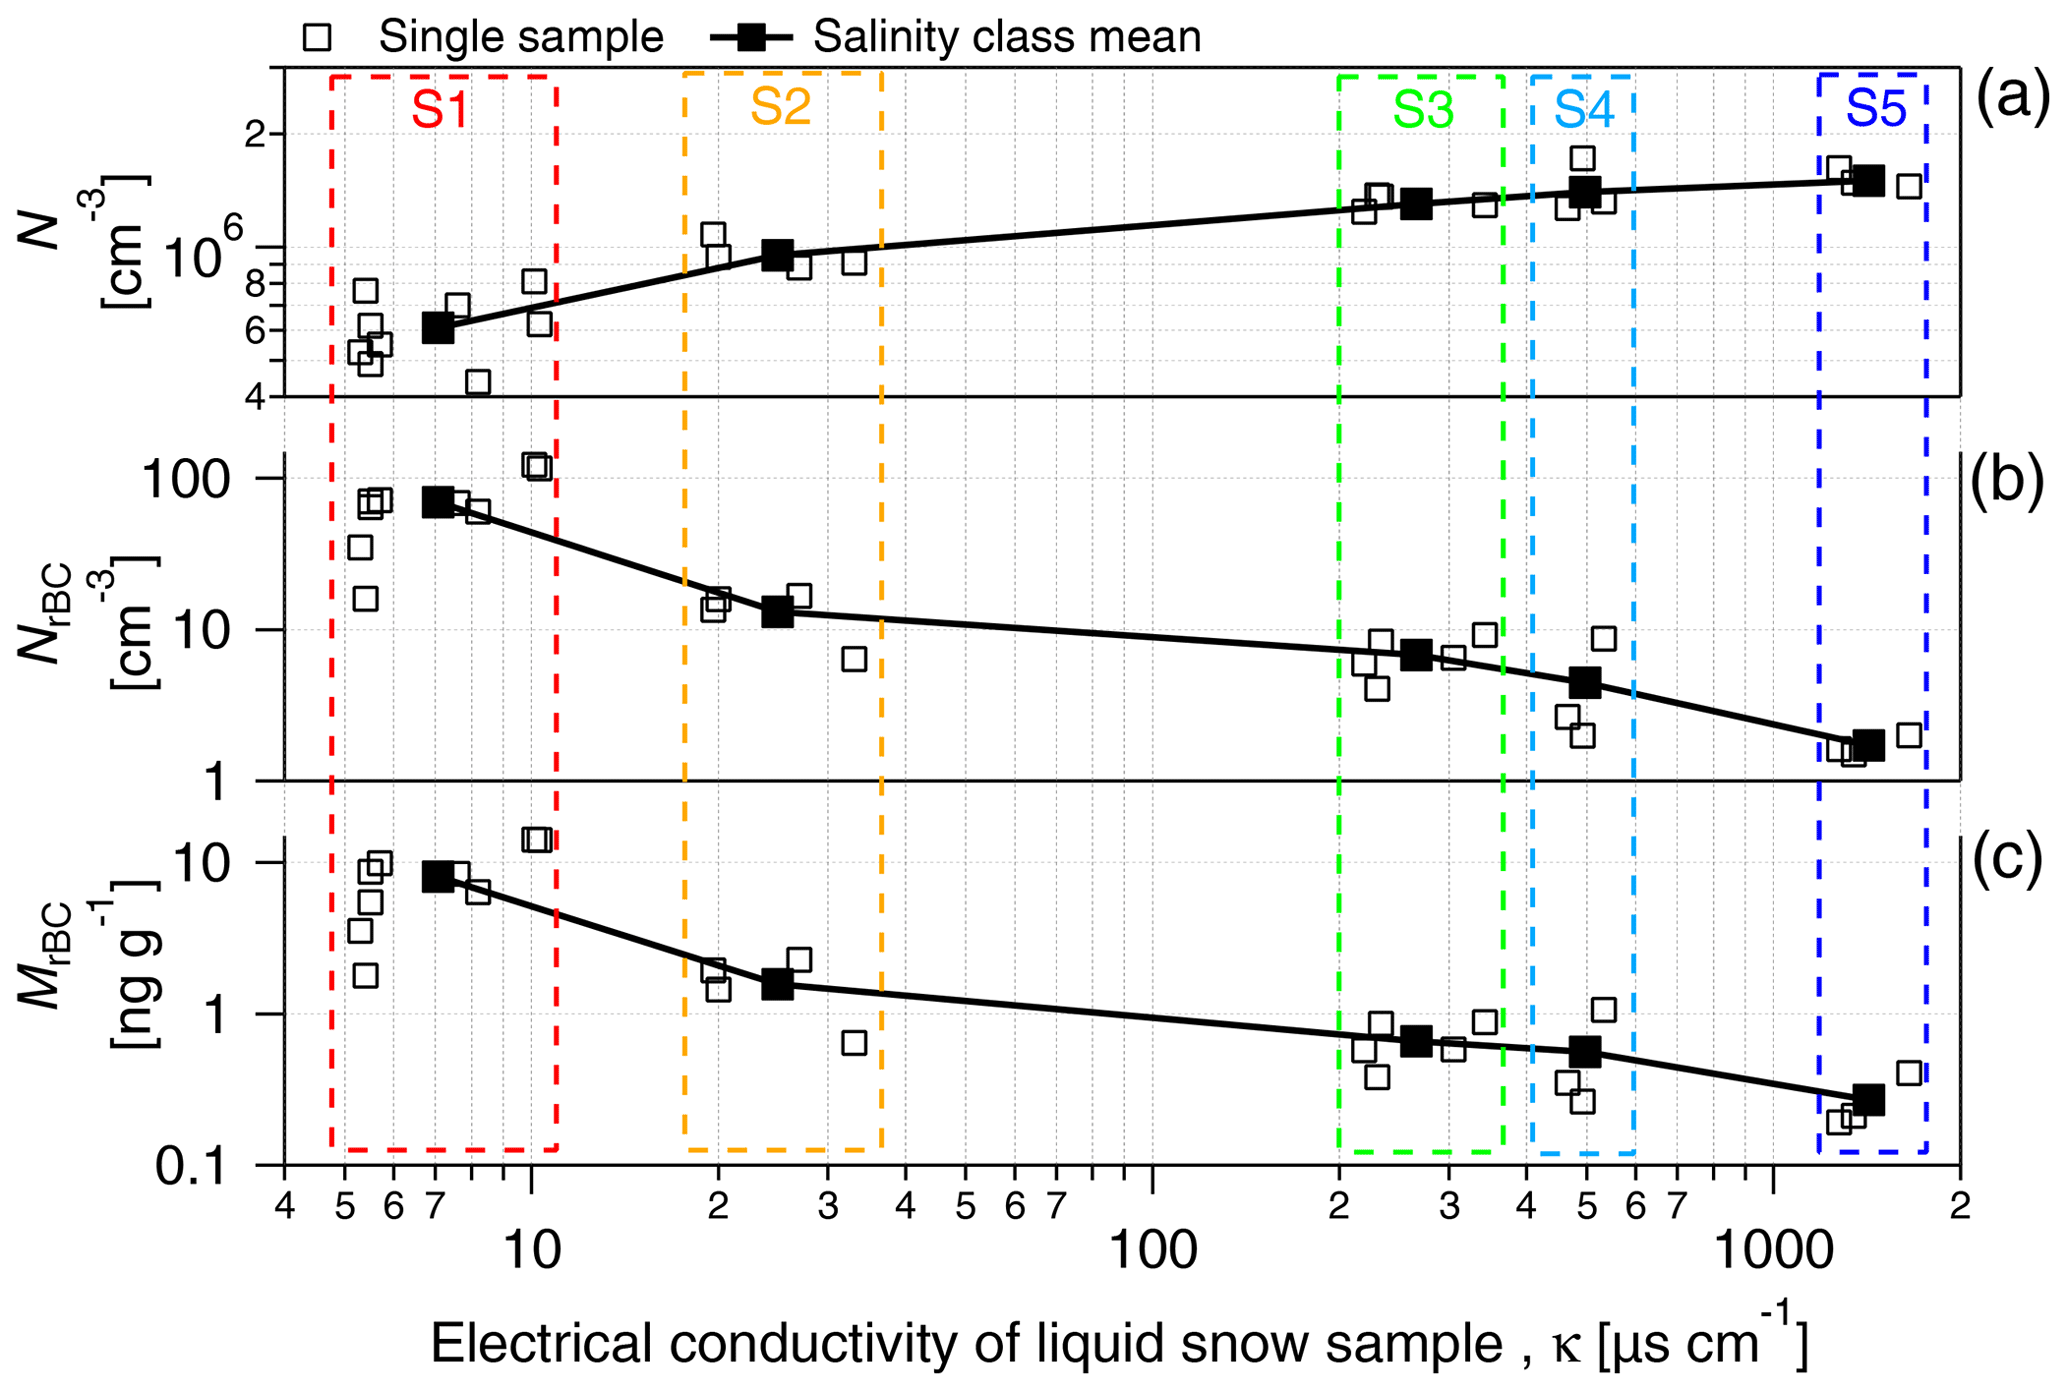
Figure 2(a) The number concentration of the total particles (N), (b) number concentration of rBC particles (NrBC) and (c) mass mixing ratio (MrBC) produced from the nebulization of PASCAL snow samples as a function of the electrical conductivity of melted snow samples. Boxes indicate the salinity classes (Sn). N is measured with the SPMS in the 14–680 nm diameter range. rBC particles are measured with the SP2 in the 70–1000 nm diameter range. S1, S2, S3, S4 and S5 represent the salinity classes.
The ALABAMA measurements confirmed the predominant presence of seawater components, such as sodium chloride (NaCl) and magnesium (Mg), over other chemical species (shown in Fig. 3). The particle fraction (PF) of NaCl-containing particles increased from roughly 30 % for the lowest salinity class to 60 %–80 % of all analyzed particles for S2, S3, S4 and S5. A similar increase was observed for Mg-containing particles. Other particle species, e.g., non-sea-salt (nss) nitrate and sulfate, were only relatively abundant in samples with low conductivity. For salinity class S4, the fraction of NaCl- and Mg-containing particles is significantly lower compared to other classes with κ>10 µS cm−1, which is due to one sample of S4 containing more of the other particle species.
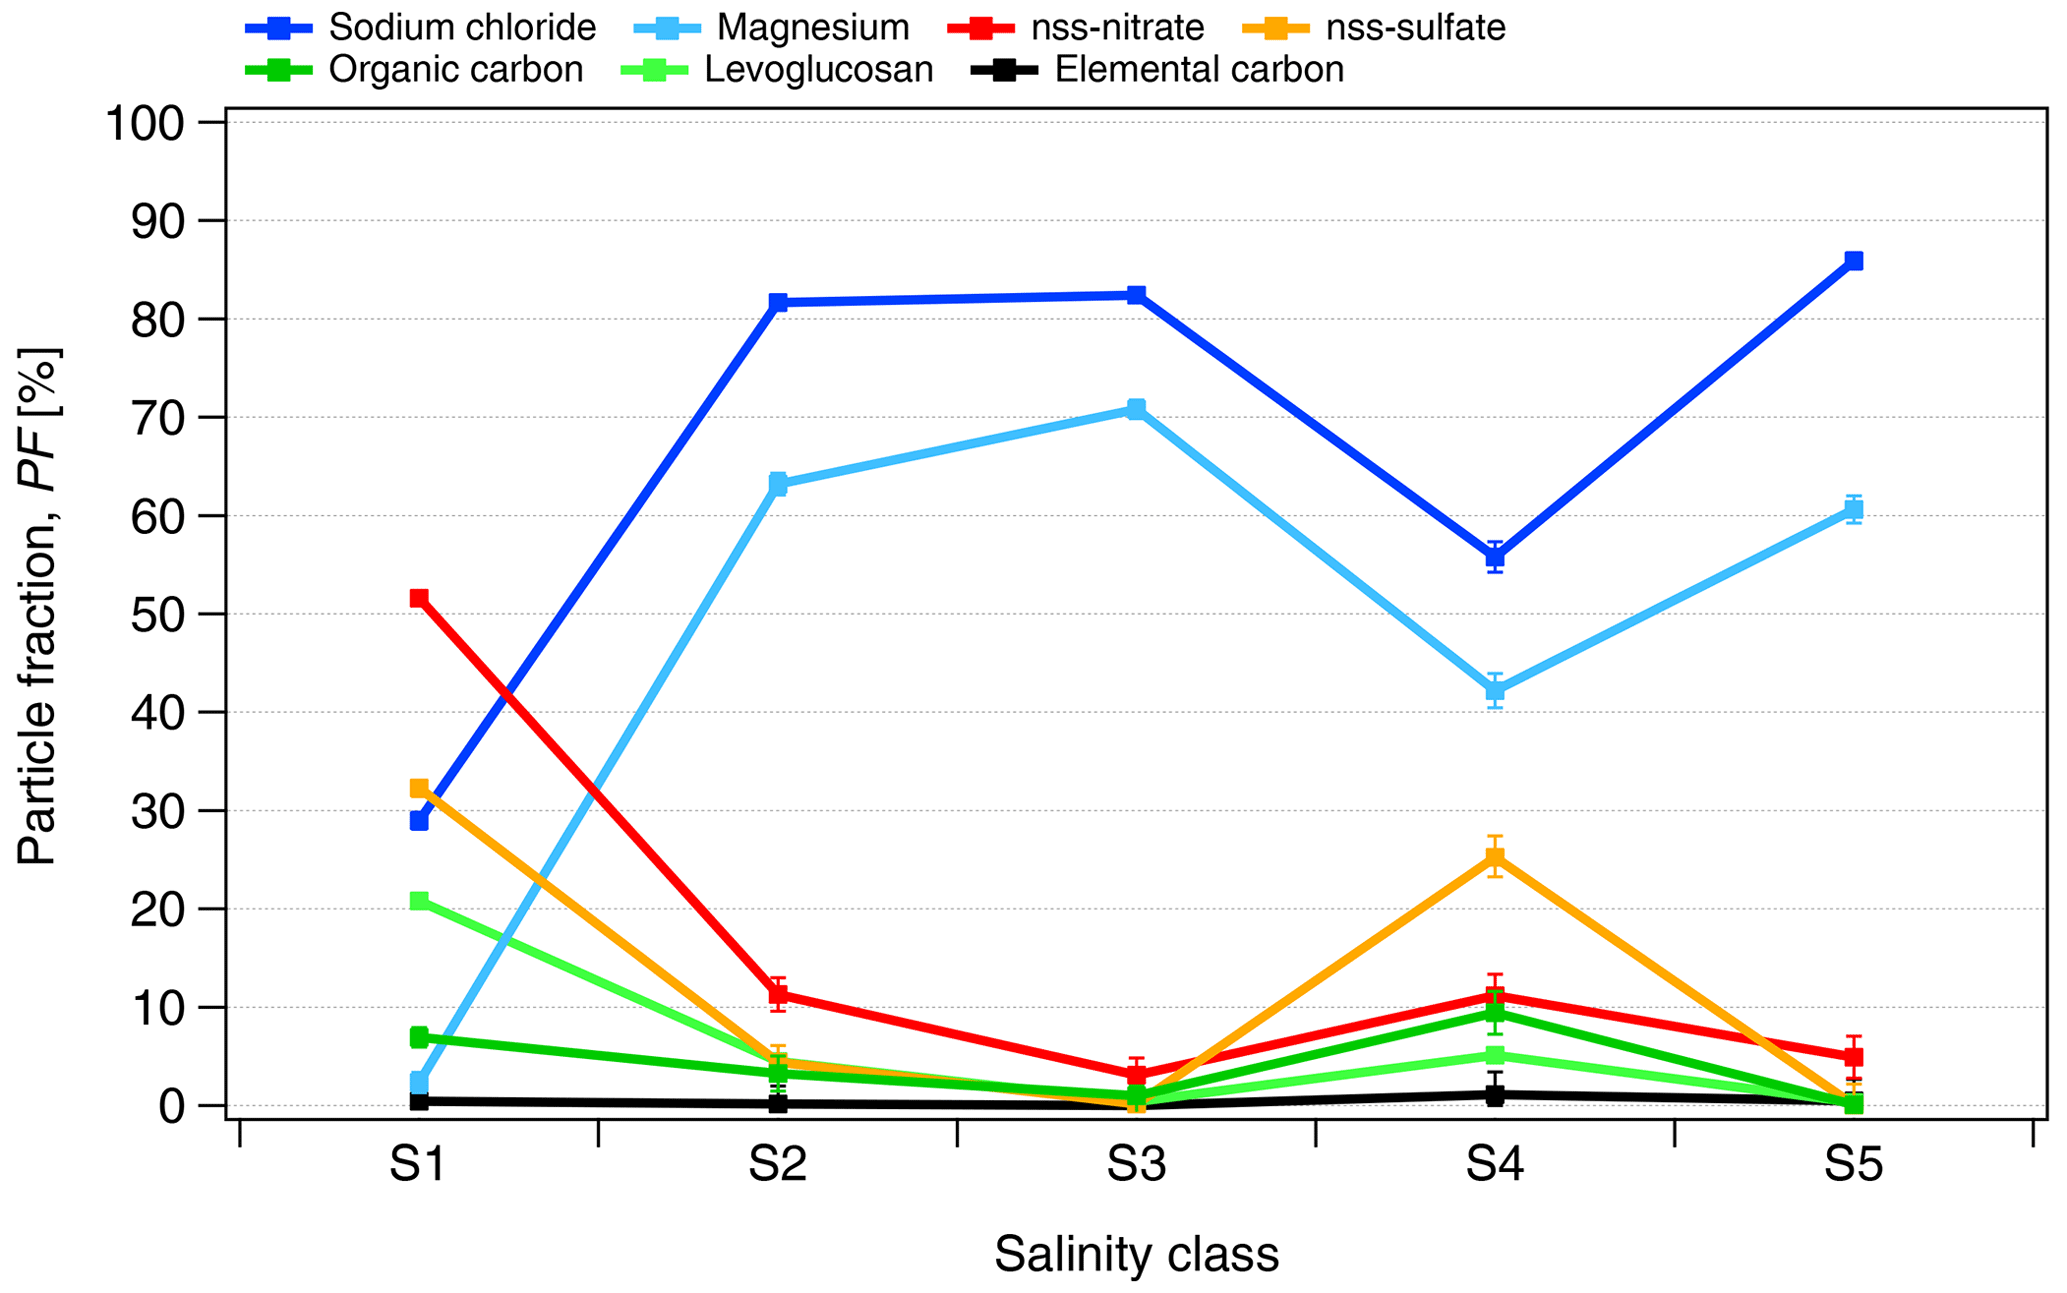
Figure 3The number fraction of analyzed particles (PF) containing the given chemical species measured by ALABAMA in the PASCAL snow samples as a function of the salinity classes (Sn). The selected species are sodium chloride (NaCl), non-sea-salt (nss) nitrate, nss sulfate, magnesium (Mg), levoglucosan and dicarboxylic acids, organic carbon (OC) and elemental carbon (EC). The chemical composition is measured for particles in the 110–5000 nm diameter range.
SP2 measurements indicated a monotonic decrease in NrBC with conductivity (Fig. 2b; Table 1), which is the opposite to N. Considering only the salinity classes, the rBC number concentration decreased from approximately 70 cm−3 in S1 to 1.7 cm−3 in S5. Additionally, the number size distribution of detected rBC particles showed a shift to larger diameters as a function of salinity (Fig. S1b). The resulting rBC geometric mean diameter calculated from the number size distribution (GDrBC-N) increased from approximately 90 to 120 nm from S1 to S5 (Table 1). The detected rBC mass mixing ratio (MrBC) monotonically decreased with κ from 8.05 ng g−1 in S1 to 0.27 ng g−1 in S5 (Fig. 2c). Although MrBC concentrations have already been observed in different locations and seasons across the Arctic (Sinha et al., 2017; Jacobi et al., 2019; Mori et al., 2019, 2020) and might be partially explained by BC redistribution during melting (Doherty et al., 2013), here the abrupt (factor 12) and sudden (48 h) increase, observed between S3 and S1, in MrBC at the snow surface has never been observed in the Arctic region and is not believed to be physical. The MrBC values presented here are corrected only for the mass nebulization efficiency (see more detail in Sect. 3.3). Similar to GDrBC-N, the rBC geometric mean diameter, calculated from the mass size distribution (GDrBC-M), increased from 225 to 257 nm from S1 to S5 (Table 1). Considering that the melt–freeze cycle promotes agglomeration of BC particles (Schwarz et al., 2012; Kinase et al., 2020), the decrease in GDrBC-M at the melt onset (S1–S2) was unexpected. The respective rBC mass size distributions are shown in Fig. S1c.
These results make it clear that rBC-containing particles represent the small minority of the aerosol population nebulized from the snow samples. In fact, the number fraction of detected rBC particles (FrBC) decreased with salinity from % in S1 to % in S5 (Table 1). Moreover, EC-containing particles were found in less than 1 % of all analyzed particles by ALABAMA (Fig. 3). Hence, considering the remarkable concentration of total particles, the minor fraction of rBC particles, the sudden decrease in MrBC with conductivity, and the unexpected diameter decrease at the melt onset, laboratory experiments were designed to reproduce the salinity conditions of PASCAL snow samples to investigate the potential interference mechanisms of salt on rBC detection by the SP2. We find that the rBC properties presented in this section were prone to high error and are not representative of natural processes only. This is particularly relevant for the saline samples belonging to S3–S5.
3.2 Reproducing realistic snow samples conditions in laboratory experiments
The laboratory experiments aimed to reproduce BC snow concentrations representative of generic Arctic conditions and the specific salinity conditions representative of PASCAL snow samples. It is important to note that the salt concentrations explored in the present work do not represent realistic conditions encountered in continental or mountain regions where sea salt aerosol deposition is not dominant. The ability to reproduce such conditions and practical limitations is presented in the following.
3.2.1 Sample preparation
Fullerene soot (FS; Alfa Aesar; lot no. W08A039) was used as a proxy for ambient black carbon. FS is a well-characterized standard for SP2 calibration (Gysel et al., 2011; Laborde et al., 2012a) and is accepted as the reference standard for ambient black carbon (Moteki and Kondo, 2010; Baumgardner et al., 2012). A total of three different inorganic salts were chosen to replicate the conductivity array of the snow samples, i.e., sodium chloride (NaCl; Honeywell International Inc), potassium chloride (KCl; Honeywell International Inc) and ammonium sulfate ((NH4)2SO4; Sigma-Aldrich).
The proportionality between electrical conductivity and the mass concentration of the salts was assessed (Fig. S2). All the saline solutions showed a linear relationship between conductivity and mass concentration, with a high correlation coefficient (r2>0.98) and no dependence on salt composition. We have chosen the concentration range of the dissolved salt to be between approximately 3 and 870 mg L−1 to match the range of salinity values between the lowest and the highest boundaries of the S1–S5 classes. As in the case of snow samples, the number concentration of aerosolized particles (measured by the SMPS in the size range of 14–680 nm) increased with salinity (Fig. 4) from approximately 6×105 cm−3 at S1 (κ≈7 µS cm−1) to approximately 1.7×106 cm−3 at S5 (κ≈1450 µS cm−1). The number concentration of particles produced by nebulization of saline solutions is similar to that of the snow samples, within 10 % for the S1–S4 classes and within 15 % for S5. The increase in particle diameter with conductivity observed in the snow samples was also closely replicated by the saline solutions (Fig. 5). The increase in the concentration and diameter of total suspended particles with salinity observed in the snow samples was successfully reproduced with salt standards, justifying the use of inorganic salts to simulate the snow saline conditions. Due to the similarity of results between the different salts, and to the fact that NaCl was the major component of PASCAL samples (Fig. 3), NaCl was chosen as the reference salt for all the experiments presented in the rest of the study.
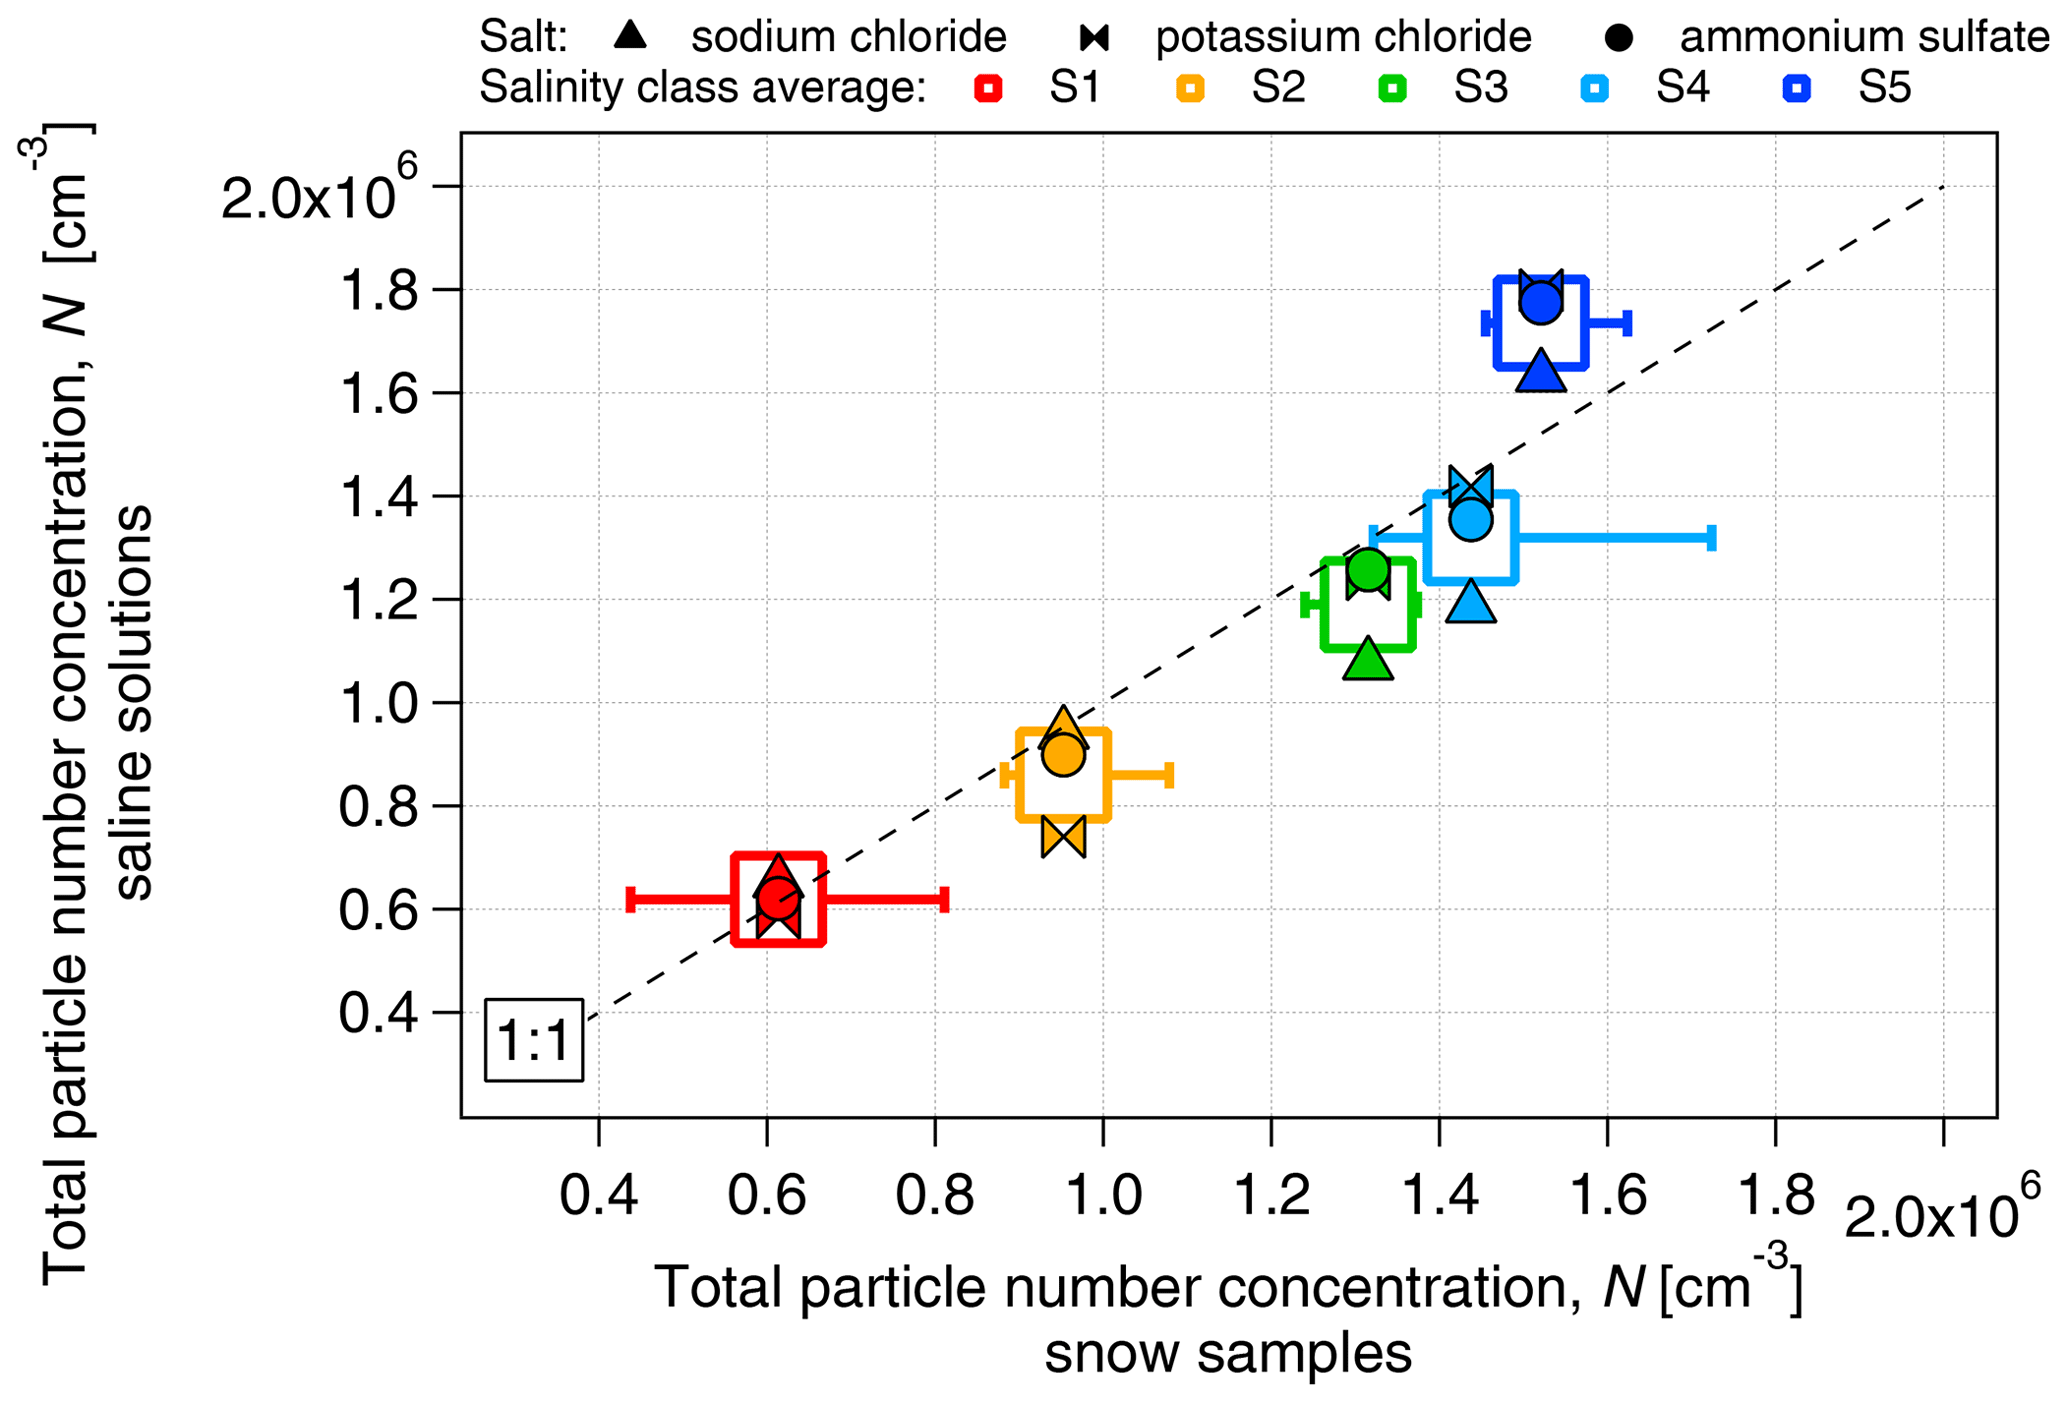
Figure 4Comparison of the number concentration of aerosolized particles produced from inorganic salt solutions (sodium chloride, potassium chloride and ammonium sulfate) and snow samples as a function of salinity.
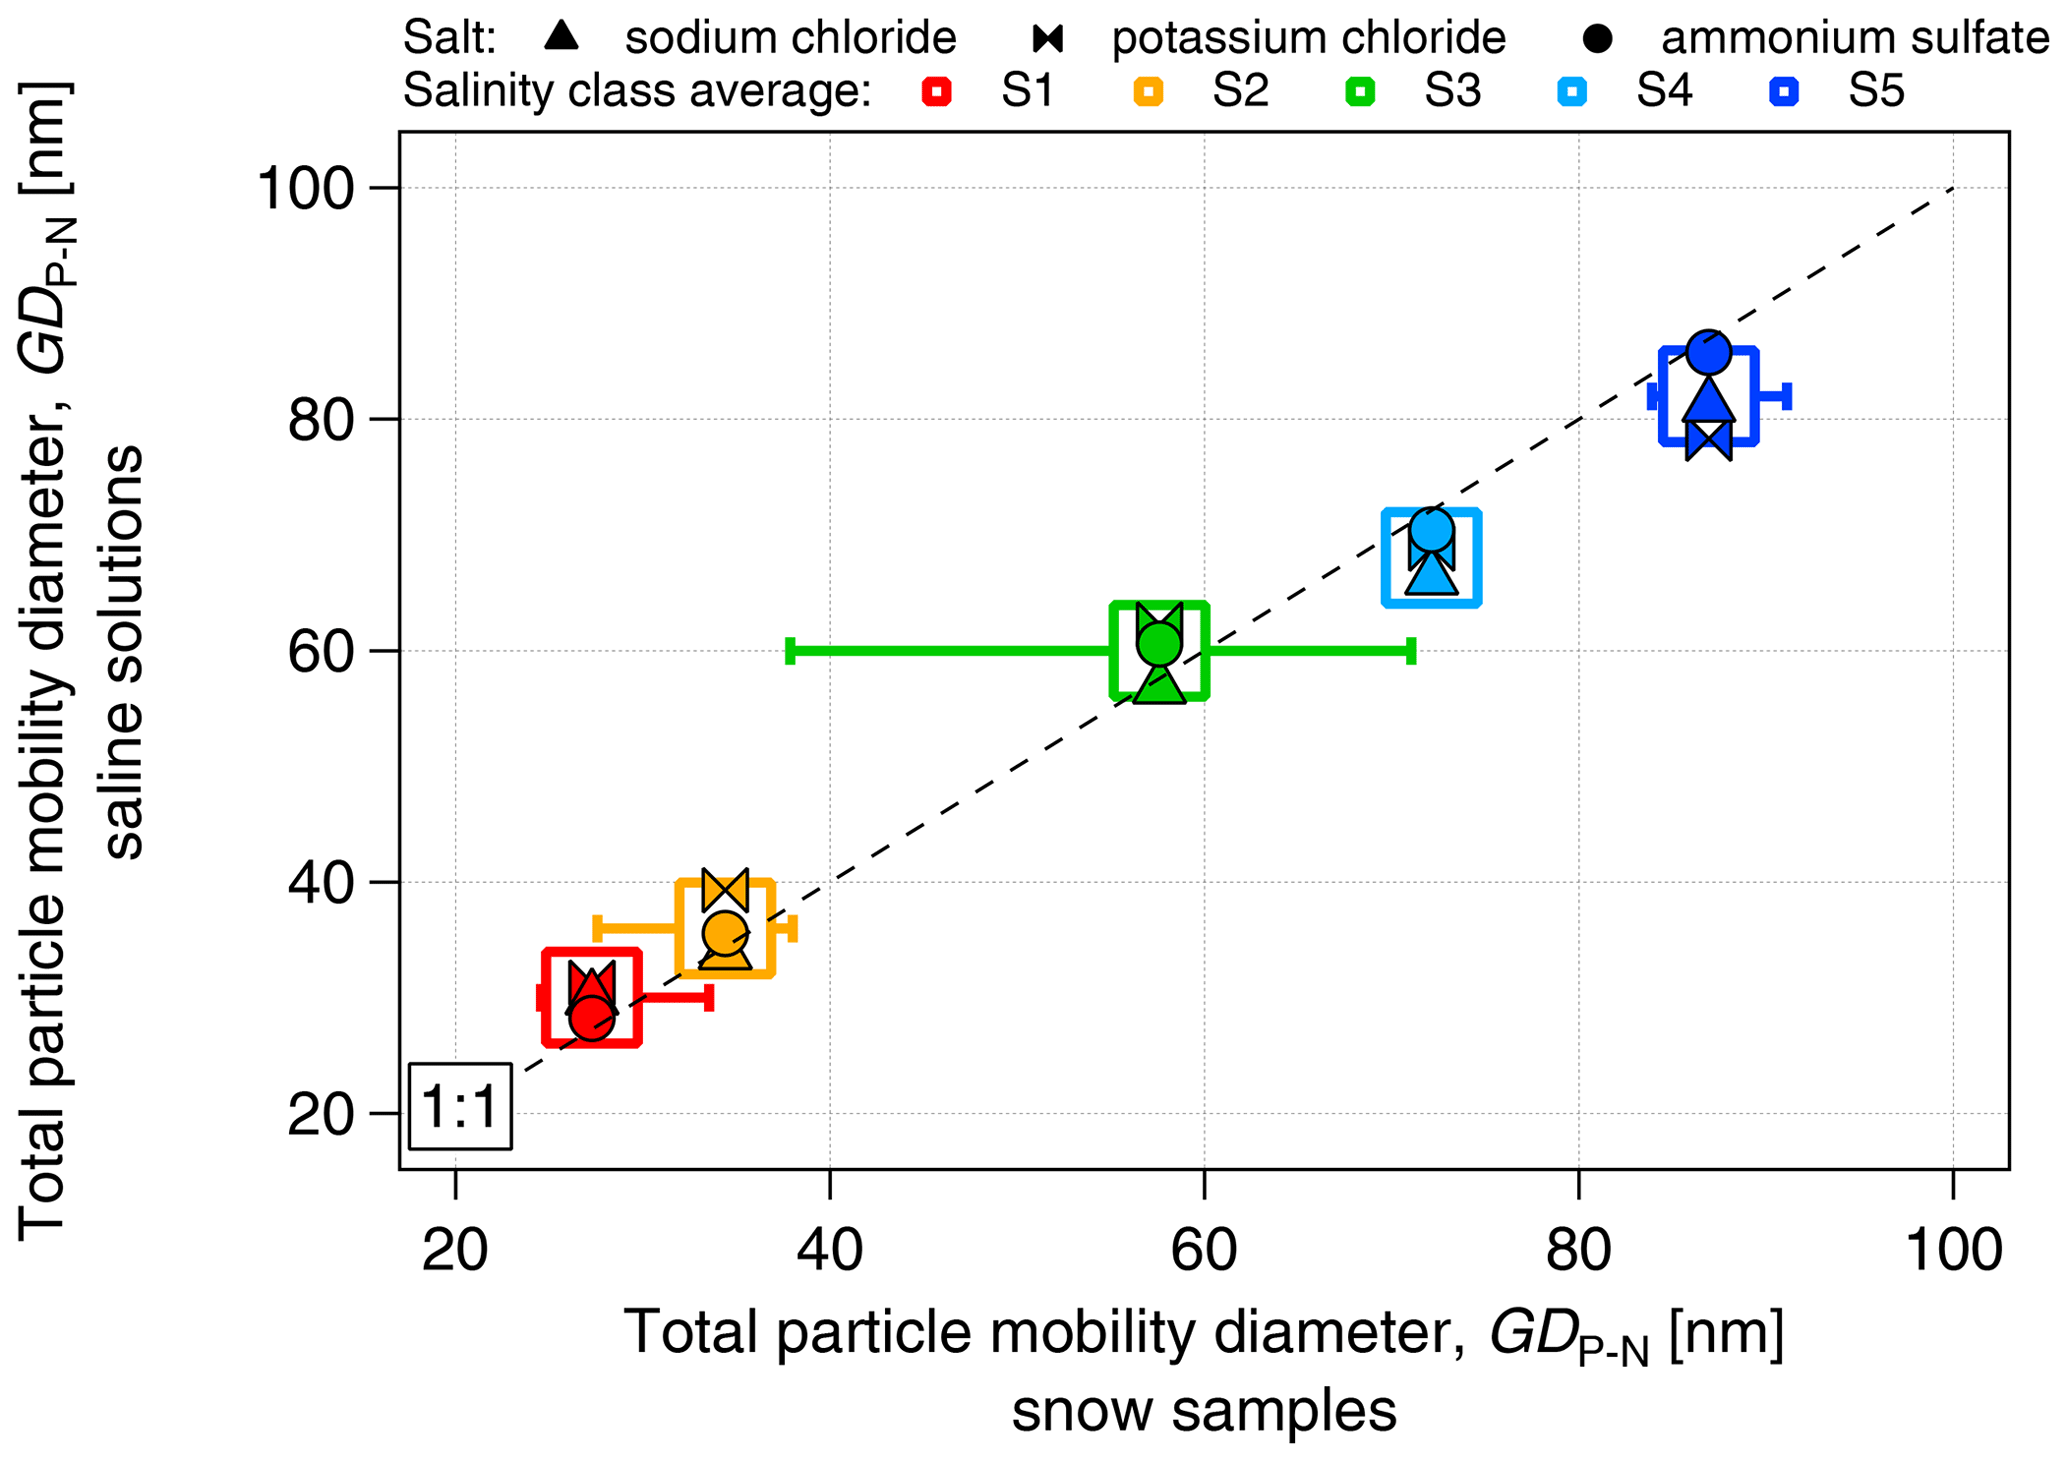
Figure 5Comparison of the diameter of aerosolized particles produced from inorganic salt solutions (sodium chloride, potassium chloride and ammonium sulfate) and snow samples as a function of salinity. The diameter is expressed as the geometric mean diameter calculated from the number size distribution of aerosolized particles.
3.2.2 Salt-induced limitations to SP2 operation
Although ambient salinity conditions were successfully reproduced, the SP2 was not able to operate stably under the most concentrated salt conditions. For the ambient samples, the SP2 was only exposed to the highest concentrations intermittently and for short times. However, for more focused laboratory conditions here, the range of BC and salt concentration that the SP2 was exposed to was limited, compared with ambient conditions, to ensure stable SP2 operation.
SP2 laser beam shadowing
During the snow sample analysis, the large light extinction of the dense aerosol produced from one extremely saline sample (κ=3600 µS cm−1) caused a marked but temporary decrease in the YAG power (approximately 50 % reduction). The laser power completely and immediately recovered after switching to clean air sampling. Despite this extreme event, in the salinity range of our snow samples (κ<1652 µS cm−1), the YAG power decreased only by 2 % with increasing salinity. This effect on net laser intensity in the cavity might, thus, be important for extremely saline solutions but is negligible for solutions or samples with κ below 1500 µS cm−1 at the rates at which we nebulized the liquid.
SP2 flow system
The prolonged sampling of the rich saline solution affected the flow system of the SP2. The sampling time needed to acquire a minimum of 30 000 recorded particles substantially increased with decreasing FS concentration (Fig. S3). The prolonged nebulization (longer than 30 min) of 1 and 5 µg L−1 FS suspension, with electrical conductivity equal to and above 600 µs cm−1, led to the accumulation of salt in the SP2 aerosol jet tubing. This finally formed a solid obstruction and caused the decreased sampling flow rate and the pressure at the detection chamber. To remove the salt obstruction, the full jet assembly was disconnected from the SP2, the clogged section of the metal tubing was first soaked in Milli-Q water, sonicated for a few seconds and dried with compressed air. The formation of the salt obstruction and its removal altered the flow rate sensor accuracy and could have modified the alignment of the sample aerosol with the laser. Due to the unknown degree of uncertainty, the first set of experiments at different FS concentrations are not shown. Moreover, to shorten the duration of the measurements and minimize the risk of clogging, all of the following experiments were performed with FS suspensions with a concentration of 10 µg L−1. Although previous SP2-based studies reported lower rBC mixing ratios in the Arctic (Sinha et al., 2017; Jacobi et al., 2019; Mori et al., 2019, 2020), this value is fairly comparable to the MrBC observed in the PASCAL samples for the less saline samples (8.05 ng g−1; Table 1). To further reduce the chances of clogging, the upper limit of FS suspension's κ was set to 800 µS cm−1 (approximately 0.4 g L−1 of NaCl). Considering our inability to reproduce the most extreme sample conditions (low BC and high salt concentration), the SP2 results acquired during the analysis of S5 samples are affected by unknown bias. However, it is unlikely that a lower BC concentration contributes to this additional uncertainty.
3.3 Salt impact on the rBC mass quantification by the SP2
In this section, we investigate the possible impact of salt on the SP2 rBC quantification, using the laboratory-generated snow sample proxies. When nebulizing liquid samples, the overall mass quantification efficiency of rBC (ε) can be calculated as the mass of rBC pumped into the nebulizer per unit of time divided by the mass of rBC coming out of the nebulizer in aerosol form and detected by the SP2 per unit of time, as follows (Katich et al., 2017):
where MrBC-SP2 is the mass concentration of rBC particles quantified by the SP2, and MrBC-smp is the mass concentration of rBC particles in the liquid sample. FGas is the gas flow rate applied to the nebulizer, and FLiq is the liquid flow rate of the sample pumped into the nebulizer. ε may be decomposed in three distinct contributions, namely the mass nebulization efficiency (εNeb), the transport efficiency (εTrn) and the mass detection efficiency of the SP2 (εSP2). εNeb is the mass of rBC pumped into the nebulizer per unit of time divided by the mass of rBC coming out of the nebulizer in aerosol form per unit of time. Hence, εNeb depends on the suspension efficiency of the liquid sample in liquid droplets and on the transport efficiency of the wet and dry aerosol within the nebulizer. εTrn is the ratio of the mass of rBC pumped out the nebulizer per unit of time to the mass of rBC reaching the SP2 sampling inlet per unit of time. εTrn is controlled by diffusion, impaction and sedimentation losses and depends on flow rate, particle size and the length, orientation and bends in the sampling line. εSP2 is the mass of rBC in the aerosol form being introduced to the SP2 laser per unit of time divided by the mass of rBC in aerosol form reported by the SP2 per unit of time. Considering the typical atmospheric SP2 operation, εSP2 depends on the size distribution of rBC particles, the presence of other absorbing–refractory atmospheric components and the SP2 size detection range configuration (Schwarz et al., 2010). The ideal, but unrealistic, ε of 1 indicates that 100 % of rBC particles contained in the liquid sample are nebulized, transported and finally detected by the SP2. In reality, the ε values obtained for various soot standards suspended in pure water and nebulized with the Marin-5 nebulizer vary between 0.5 and 0.6 (Mori et al., 2016; Katich et al., 2017), while ε of 0.75 was calculated by Lim et al. (2014) using an APEX-Q nebulizer. The ε calculated in the present work for non-saline suspensions at different FS mass concentrations varied between 0.57 and 0.66. Our results are in good agreement with the previous studies, indicating good reproducibility of nebulization conditions during the laboratory experiments. It must be considered that past studies always assumed 100 % εSP2 and εTrn for rBC particles falling in the size detection range of the SP2. Therefore, ε (calculated exactly as in this study, according to Eq. 1) was usually addressed as nebulization efficiency. In this study, ε decreased monotonically down to values between 0.33 and 0.21 for the most saline FS suspensions (κ=800 cm−1). This decrease clearly indicated a salt-induced bias on the mass quantification efficiency. Hence, the assumption of a 100 % εSP2 and εTrn might not be realistic for saline samples. The potential impact of salt presence on the nebulization and transport efficiency and on the SP2 detection efficiency will be addressed in the following subsections.
3.3.1 Nebulization and transport efficiency
Inorganic salt can alter water's physical properties, such as viscosity and surface tension, modifying the size distribution of droplets produced in the spray chamber and affecting the nebulization efficiency of various analytes (Todolí et al., 2002). High surface tension and viscosity cause an increase in the mean diameter of the liquid droplets suspended by pneumatic nebulizers, decreasing their transport efficiency (Sharp, 1988). NaCl concentrations above 1 g L−1 cause a significant increase in the droplet diameter (Clifford et al., 1993) and a decrease in transport efficiency (Sötebier et al., 2016). However, previous studies on pneumatic nebulizers (Dubuisson et al., 1998; Cano et al., 2002) indicated that the salt matrix effect on the liquid droplet diameter and transport at concentrations below 1 g L−1 is negligible. Note that, as summarized by Todolí et al. (2002), several studies have reported different or contradictory results on the impact of matrix effect during the nebulization process with pneumatic nebulizers. Thus, the understanding of the processes causing the diameter increase and the efficiency decrease remains uncertain. The viscosity and surface tension of our NaCl solutions was extrapolated from Lide (1995) and Ozdemir et al. (2009), respectively. A total of 0.8 g L−1 of NaCl, representative of S5 samples (κ=1400 µS cm−1), causes a small increase of both viscosity (+0.08 %) and surface tension (+0.03 %) compared to pure water. Our calculations and the results of Dubuisson et al. (1998) and Cano et al. (2002) indicate a negligible change in water properties and, thus, nebulization efficiency for the salinity levels tested in the laboratory experiments (κ below 800 µS cm−1; NaCl concentration below 0.4 g L−1). Considering the dominant presence of NaCl in the snow samples (Fig. 3), our calculations also represent the salt-influenced snow samples. To support our calculations, the mass quantification efficiency was calculated for NaCl solutions (εNaCl) at different salt concentrations from SMPS measurements (14 nm < Dp < 680 nm). The aerosolized mass concentration of the NaCl was calculated assuming spherical particles with a density of 2170 kg m−3 (manufacturer data). Considering the factor 10 dilution, which enabled SMPS operation below the highest limit of the detection, and the low relative humidity (RH; < 30 %), we assumed a SMPS detection efficiency of 100 % in the 14–680 nm diameter range. Thus, εNaCl should solely be affected by nebulization efficiency. εNaCl remained very stable (range of 0.57–0.58) from low (κ=25 µS cm−1) to high (κ=800 µS cm−1) salinity. In turn, this suggests that the nebulization efficiency of rBC particles is independent of salinity (salt concentration below 4 g L−1 or electrical conductivity below 800 µS cm−1).
The transport losses were estimated for the SP2 sampling line, which was 30 cm long (distance from the Marin-5 exhaust) and composed of two different sections. The first section was 24 cm long, with an internal diameter of 4.82 mm and an airflow rate of 1 L min−1 and carried flow to SP2, SMPS and ALABAMA. After a two-way flow splitter with a “Y” joint (model 1100; Brechtel, Hayward, USA), the SP2-specific sampling line was 6 cm long, with an internal diameter of 1.8 mm and an airflow rate of 0.12 L min−1. No sharp bends or additional flow splitters were present along the second section. We assumed spherical particles with a void-free density of 1800 kg m−3 (Moteki and Kondo, 2010). Losses of 2 %–5 % and 2 %–16 % were calculated for smaller (10–40 nm) and larger (1–5 µm) particles, respectively. The particle losses in the SP2 detection range (70–1000 nm of diameter) were estimated to remain well below 2 %; hence, these results were not taken into account in forthcoming calculations.
3.3.2 SP2 detection efficiency
In this section, we will investigate the consequences of high number particle density transiting the SP2 laser beam in its data acquisition system at different acquisition settings. Additionally, the potential quenching of incandescence caused by the presence of thick salt coatings on rBC cores will be addressed. εSP2 is the ratio between reported MrBC of the NaCl-doped suspensions at a certain conductivity (κ>0 µS cm−1; κx), and the MrBC of the non-saline reference suspension (κ≈0 µS cm−1; κ0) is as follows:
A size-dependent εSP2 is the ratio of the mass size distribution at a specific conductivity (κx) over the mass size distribution of non-saline suspensions (κ0) at a certain rBC diameter (DrBC) as follows:
where dMrBC represents the mass concentration of rBC particles contained in each diameter bin of the rBC mass size distribution.
Sensitivity of data acquisition to sample salinity
The frequency of recorded scattering events increased up to 17 500 counts per second for saline solutions with 250 µS cm−1 electrical conductivity (Fig. S4). Considering the high frequency of simultaneous events (multiple particles passing through the laser beam during one acquisition period), this number is most likely lower than the rate of particles entering the instrument. Operating the SP2 at this overloaded condition might lead to data loss caused by the limitations of the analogue to digital converter and computational power of the instrument's computer. This is possibly responsible for the observed exponential decrease in the frequency of detected scattering events for saline solutions with κ values above 250 µS cm−1. Simultaneous particles and trigger hysteresis (used to reduce some types of data artifacts in the SP2) issues do not only reduce the acquisition of scattering events but also cause the decrease in the detected frequency of incandescence events (Fig. S4). Considering the low concentration of rBC particles with the high concentration of non-rBC particles, the acquisition settings become extremely important to avoid non-detection of individual incandescence signals. The importance of triggering choices was, hence, tested with 10 µg L−1 FS concentration and increasing NaCl concentration (conductivity range of 0–800 µS cm−1). The mass detection efficiency was then measured with either the signal acquisition triggering off only the high-gain scattering channel (εSP2-Tsc) or only off the broadband high-gain incandescence channel (εSP2-Tin).
First, the result obtained by triggering on the scattering detector (the typical setup when operating the SP2 for atmospheric observations) will be discussed. εSP2-Tsc steadily decreased with conductivity to 0.34 at 800 µS cm−1, while the rBC mean diameter increased from 180 at 0 µS cm−1 nm to 207 nm at 800 µS cm−1 (Fig. 6). The increasing rBC mean diameter indicates size dependency in εSP2-Tsc (see rBC size distribution in Fig. S5). Indeed, εSP2-Tsc systematically increased with DrBC across the entire salinity range tested in the present study (Fig. 7a). At lower conductivity (κ<200 µS cm−1), εSP2-Tsc increased from approximately 0.4–0.6 for rBC components smaller than 100 nm to values above 0.7 for rBC components larger than 200 nm. The difference in εSP2-Tsc across the rBC size distribution was remarkable at higher conductivity (κ>600 µS cm−1), where εSP2-Tsc increased from 0.1–0.2 for DrBC below 100 nm to 0.4–0.6 for DrBC above 300 nm. It is, thus, evident that not only the mass concentration but also the size distribution of rBC might be strongly biased when the standard atmospheric configuration of the SP2 is implemented for measurements of liquids with significant salt content. Below 200 µS cm−1, no significant difference could be identified between εSP2-Tsc and εSP2-Tin. This result indicates that triggering settings are not crucial for snow samples with up to 0.1 g L−1 water salt content in the absence of contaminants.
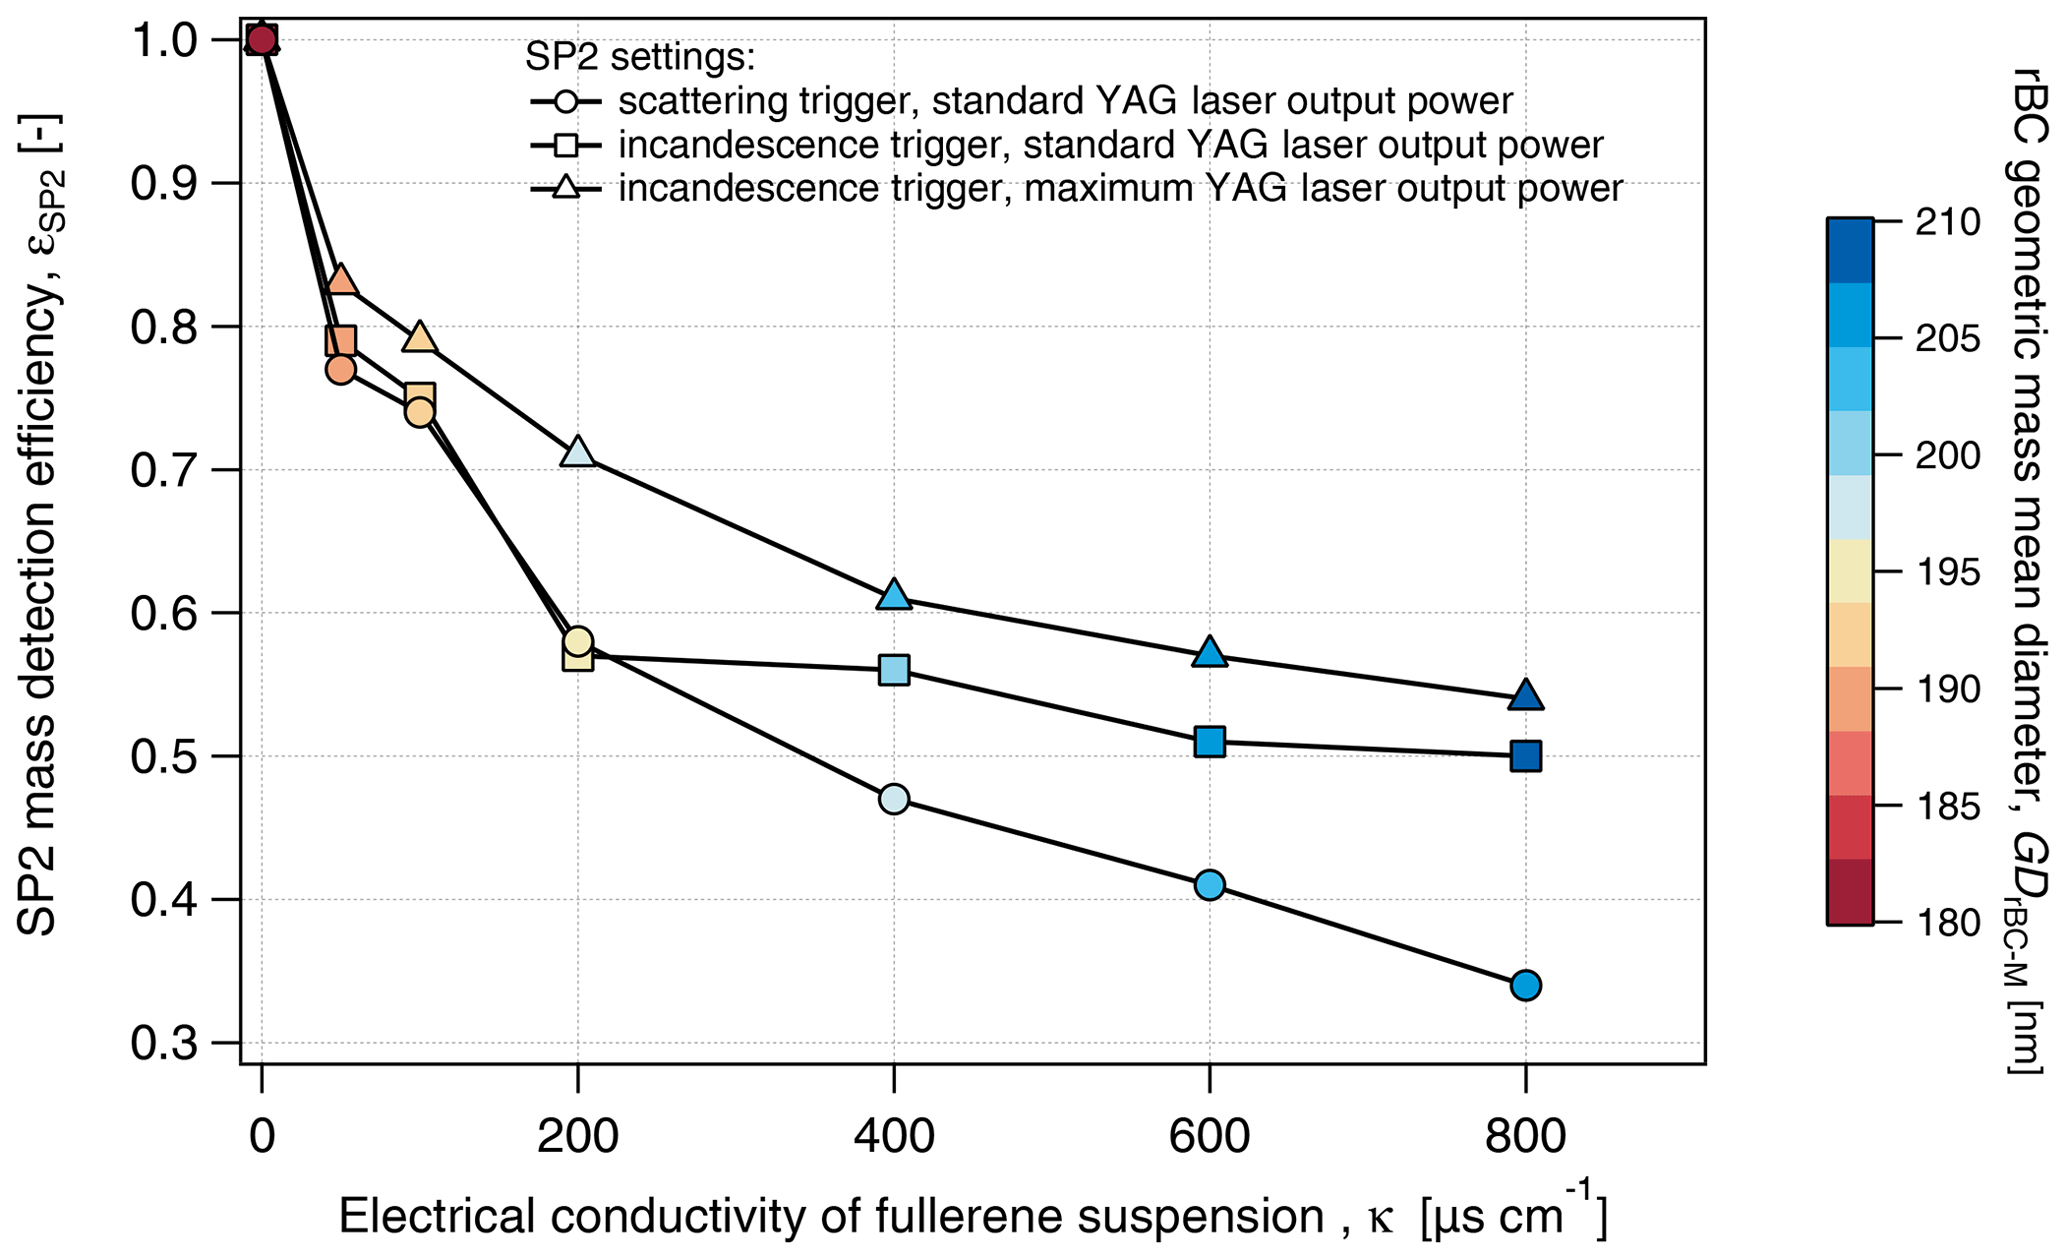
Figure 6Mass detection efficiency of the SP2 for different SP2 settings and increasing electrical conductivity. Data are acquired from the analysis of a fullerene soot suspension at 10 µg L−1.
Triggering only off the incandescence signal reported 20 %–50 % more rBC mass compared to triggering only off the scattering signal at higher salinity (κ>200 µS cm−1). Similar to εSP2-Tsc, εSP2-Tin showed an increasing trend with DrBC at all considered electrical conductivities (Fig. 7b). Note here that, for DrBC larger than 400 nm, low rBC concentration resulted in statistical uncertainty that caused unrealistic εSP2 values above 1. These results indicate that the triggering setting does not appear to substantially modify the size dependency of the SP2 detection efficiency. Nevertheless, the use of the scattering trigger should be avoided in future studies when analyzing rBC in snow samples. Diluting these saline samples to achieve only single particles per detection in the SP2 (Katich et al., 2017) would likely reduce the detection problem, even for samples with κ above 200 µS cm−1 (NaCl concentration above 0.1 g L−1).
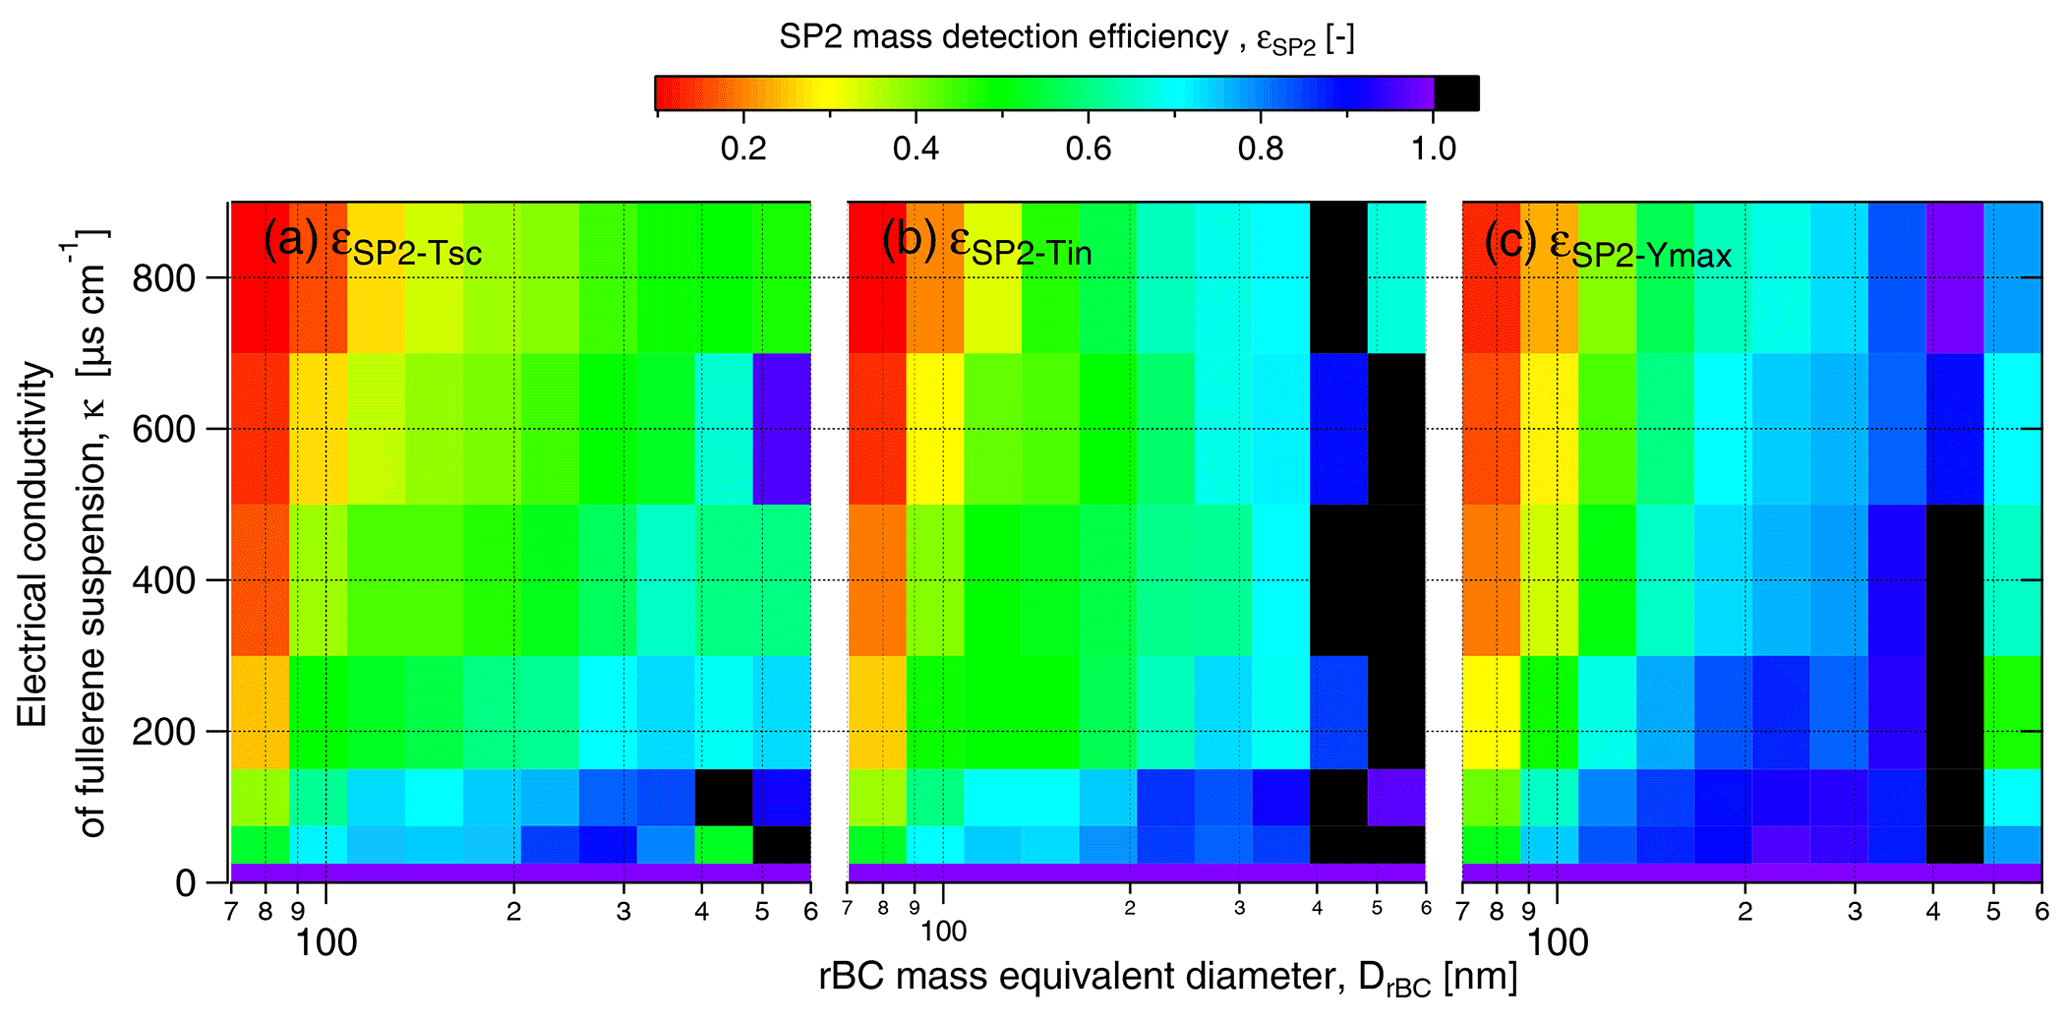
Figure 7rBC mass detection efficiency as a function of DrBC for different SP2 settings. Panel (a) shows the acquisition triggered on the scattering detector with standard YAG laser output power, εSP2-Tsc. Panel (b) shows the acquisition triggered on the incandescence detector with standard YAG laser output power εSP2-Tin. Panel (c) shows the acquisition triggered on the incandescence detector with maximum YAG laser output power, εSP2-Ymax. Results are given for FS suspensions with a concentration of 10 µg L−1.
Incandescence quenching
Very thick coatings encapsulating rBC cores might not permit the SP2 laser to penetrate the coating, warm the rBC core, evaporate the coating and, finally, allow correct detection by bringing the rBC to vaporization temperature. This phenomenon will be called incandescence quenching. During the nebulization of saline samples, the salt contained in each droplet will remain on the rBC component after the water is evaporated and create thick coatings encapsulating the rBC.
As a rough estimation, we calculated that the theoretical coating thickness and coating–rBC mass ratio of spherical rBC cores have a diameter of 100, 200, 300, 400 and 500 nm as a function of salinity. We assumed the presence of a single rBC core per droplet, a concentric core shell geometry and NaCl density of 2170 kg m−3. No direct measurements of the droplet size distribution are available for the Marine-5 nebulizer, but Mori et al. (2016) calculated a hypothetical droplet diameter of 2.5 µm based on the size distribution of total particles nebulized with the Marin-5 from an ammonium sulfate solution at a known concentration of 13.4 mg L−1. By using the same equation, we calculated a droplet diameter of approximately 20 µm for a NaCl solution at a similar concentration of 13.1 mg L−1 (κ=25 µS cm−1; representative of S2). Considering the marked difference with the result of Mori et al. (2016), most probably due to an oversimplification of the nebulization process, we assumed a droplet diameter of 8 µm. This value represents the peak of the primary droplet number size distribution suspended by various concentric pneumatic nebulizers working with a gas flow rate of 1 L min−1 and a liquid flow range of 11–20 µL min−1 (Burgener and Makonnen, 2020). The calculated coating thickness and coating–rBC mass ratio can be found in Tables S1 and S2, respectively. The thickest coatings are expected for the smallest rBC cores (100 nm in diameter) with values increasing from 47 nm at 50 µS cm−1 to 182 nm at 800 µS cm−1. The coating thickness of the largest cores considered here (500 nm) was significantly smaller, having values below 55 nm for the considered NaCl concentration. Similarly, the mass fraction of coating material decreased with the rBC core diameter. Laboratory experiments showed that relatively thin coatings (coating–rBC mass ratio below 3.5) do not have any significant negative impact on the SP2 detection efficiency (Schwarz et al., 2010). According to the coating calculation presented above (droplet diameter 8 µm), a coating–rBC mass ratio above 3.5 is expected for rBC particles with a diameter below 300 nm. For 100 nm particles, the coating–rBC mass ratio was calculated to exceed a value of 7 at a salinity of 50 µS cm−1. The mass of salt associated with each core is assumed to be constant, but the absorption cross section scales approximately linearly with the mass of the rBC core as the cube of the rBC diameter. Hence, the potential for salt to quench incandescence is highest for the smallest rBC cores. This phenomenon could explain the measured εSP2 values' diameter dependence (shown in Fig. 7). Considering our calculation, and the size-dependent detection results obtained by Schwarz et al. (2010), incandescence quenching is likely particularly important for the smallest rBC particles. It must be noted that the calculated coating thickness and mass ratio is only a rough assumption since its value strongly depends on the size and mass of the nebulized droplets. Assuming 12 and 5 µm droplet diameter (upper and lower mode of the droplet size distribution shown in Burgener and Makonnen, 2020) the coating–rBC mass ratio increases by, approximately, a factor of 10.
To further investigate the potential quenching effect of salt, FS suspensions (FS concentration of 10 µg L−1) with increasing NaCl concentrations were nebulized and analyzed with the SP2 operating at maximum YAG laser power and signal acquisition triggered only with the incandescence signal. High YAG laser power is expected to speed up the vaporization of thicker coatings and to increase the mass detection efficiency of rBC (Schwarz et al., 2010). During standard operating conditions, and for the previous results, the pump laser was operated below peak power. For the following experiments, the laser power was increased to its upper limit (leading to an increase in the YAG laser power output from 5.2 to 6 V. The mass detection efficiency, and its size distribution, here called εSP2-Ymax, was calculated according to Eqs. (1) and (2), respectively. εSP2-Ymax decreased monotonically from 0.83 at 50 µS cm−1 to 0.55 at 800 µS cm−1 (Fig. 6). Although the negative correlation between εSP2 and κ was still present, εSP2-Ymax was systematically (10 % on average) higher than εSP2-Tin across the full salinity range (κ>0 µS cm−1). The size-dependent efficiency shown in Fig. 7c indicates that the higher laser power did not improve the detection efficiency in the 70–100 nm DrBC range. An improvement in εSP2-Ymax was observed for rBC particles with DrBC larger than 100–150 nm compared εSP2-Tin. It is evident that operating the pump laser at the maximum performance we could achieve does not impact the overall decreasing trend of εSP2 with κ and does not ensure homogeneous size detection of rBC particles in the typical SP2 size range. These results are consistent with quenching of incandescence due to coatings, stronger reductions in smaller and more thickly coated rBC cores and explain the size shift observed in the snow samples, where the GDrBC-M increases by approximately 14 % from S1 to S5 samples (Table 1). A similar increase was observed in the laboratory test (SP2 operated at maximum YAG laser power), where GDrBC-M increases from 183 nm at ∼0 µS cm−1 to 211 nm at 800 µS cm−1 (15 % increase). This similarity suggests that incandescence quenching might have completely masked the diameter increase caused by particles agglomeration during melting–freezing cycles that may have existed in the snow samples (Schwarz et al., 2012; Kinase et al., 2020). Diluting these samples to electrical conductivity values below 50 µS cm−1 (salt concentration of 0.03 g L−1), when εSP2 is higher than 80 %, might significantly reduce incandescence quenching. However, the dilution factor will linearly increase with conductivity up to a factor of 16 for very saline samples (κ=800 µS cm−1). Considering the low BC concentration generally observed in Arctic snow, dilution will strongly increase analysis time.
Laboratory experiments were conducted to assess the interference caused by inorganic salt on SP2 quantification of rBC mass and size distribution in saline snow samples nebulized with a Marin-5. These experiments were designed to reproduce the salinity conditions of snow samples collected over the sea-ice-covered Fram Strait in summer 2017 during the PASCAL drift shipborne campaign. Such salt concentrations might be exclusively encountered in snow collected in coastal areas or over sea ice in the vicinity of open water. The total mass quantification efficiency (ε), which consists of the nebulization efficiency (εNeb) and the SP2 detection efficiency (εSP2), was strongly influenced by the salinity of the FS suspension. Compared to ε of 0.58–0.66 for a non-saline FS suspension, high salinity (electrical conductivity of 800 µS cm−1 and NaCl concentration of 0.4 g L−1) caused ε drop to 0.2–0.3. The sensitivity of εSP2 to different SP2 settings was also tested to verify (1) the impact of high number concentration of non-rBC particles on the SP2 signal acquisition, and (2) the incandescence quenching produced by thick coatings. Different SP2 settings were tested, but none of them allowed unbiased detection of rBC mass, with maximum εSP2 of approximately 0.85 and 0.55 for low and high saline samples, respectively. The SP2 detection efficiency was also found to strongly depend on the rBC core diameter. Overall, rBC cores below 100 nm were substantially undetected, showing εSP2 below 0.2 for the most saline samples (electrical conductivity of 800 µS cm−1 and NaCl concentration of 0.4 g L−1) compared to values above 0.6 for rBC particles larger than 200 nm. As a consequence of these interactions, the measured rBC mass concentration in the PASCAL snow samples was affected by a high degree of uncertainty and significantly biased to have low values depending on snow salinity. By operating the SP2 in its optimal triggering setup and maximum YAG laser power, the rBC mass concentrations in the less saline samples, collected after melting (electrical conductivity below 50 µS cm−1) and representing 55 % of total probes, the bias was limited to a maximum of 17 %. In the most saline samples collected before melting (electrical conductivity above 800 µS cm−1 and NaCl concentration above 0.4 g L−1) the measured rBC mass concentrations might have been biased to have low values by at least 45 %. Note that the nebulization and sampling of saline samples might damage the SP2 directly and affect its performance. Extremely saline samples can cause a temporary drop in the YAG laser output power, and prolonged sampling of even low salinity samples can clog the SP2 internal airflow tubing. All told, these effects, when unrecognized and uncorrected, can alter the interpretation of natural processes. The work demonstrates the influences of sea salt on the performances of the SP2 system during the analysis of snow samples containing a notable amount of inorganic salt. This technical analytical issue has never been explicitly addressed before and should be considered in the analysis of future studies conducted in marine regions. Additional work needs to be performed to minimize the impact of the matrix effect and to address the potential interference of salt on other BC measuring techniques.
The SP2 data were analyzed with PSI Toolkit single particle soot photometer (SP2), version 4.110. Contact Droplet Measurement Technologies to download the software.
Data are available upon request.
The supplement related to this article is available online at: https://doi.org/10.5194/acp-21-9329-2021-supplement.
MZ collected the snow samples and performed the SP2, SMPS and physical measurements. OE performed the ALABAMA measurements. MZ drafted the paper, with contributions from all co-authors.
The authors declare that they have no conflict of interest.
This article is part of the special issue “Arctic mixed-phase clouds as studied during the ACLOUD/PASCAL campaigns in the framework of (AC)3 (ACP/AMT/ESSD inter-journal SI)”. It is not associated with a conference.
We gratefully acknowledge the funding by the Deutsche Forschungsgemeinschaft (DFG – German Research Foundation; project ID 268020496 – TRR 172) within the Transregional Collaborative Research Center project of “ArctiC Amplification: Climate Relevant Atmospheric and SurfaCe Processes, and Feedback Mechanisms (AC)3”. Oliver Eppers acknowledges funding by the Max Planck Graduate School (MPGC).
This research has been supported by the Deutsche Forschungsgemeinschaft (DFG, German Research Foundation) (grant no. Projektnummer 268020496 – TRR 172).
The article processing charges for this open-access publication were covered by the Alfred Wegener Institute, Helmholtz Centre for Polar and Marine Research (AWI).
This paper was edited by Jost Heintzenberg and reviewed by two anonymous referees.
Baumgardner, D., Popovicheva, O., Allan, J., Bernardoni, V., Cao, J., Cavalli, F., Cozic, J., Diapouli, E., Eleftheriadis, K., Genberg, P. J., Gonzalez, C., Gysel, M., John, A., Kirchstetter, T. W., Kuhlbusch, T. A. J., Laborde, M., Lack, D., Müller, T., Niessner, R., Petzold, A., Piazzalunga, A., Putaud, J. P., Schwarz, J., Sheridan, P., Subramanian, R., Swietlicki, E., Valli, G., Vecchi, R., and Viana, M.: Soot reference materials for instrument calibration and intercomparisons: a workshop summary with recommendations, Atmos. Meas. Tech., 5, 1869–1887, https://doi.org/10.5194/amt-5-1869-2012, 2012.
Brands, M., Kamphus, M., Böttger, T., Schneider, J., Drewnick, F., Roth, A., Curtius, J., Voigt, C., Borbon, A., Beekmann, M., Bourdon, A., Perrin, T., and Borrmann, S.: Characterization of a Newly Developed Aircraft-Based Laser Ablation Aerosol Mass Spectrometer (ALABAMA) and First Field Deployment in Urban Pollution Plumes over Paris During MEGAPOLI 2009, Aerosol Sci. Tech., 45, 46–64, https://doi.org/10.1080/02786826.2010.517813, 2011.
Burgener, J. A. and Makonnen, Y.: Chapter 2 – Nebulization systems, in: Sample Introduction Systems in ICPMS and ICPOES, edited by: Beauchemin, D., Elsevier, Amsterdam, 57–142, https://doi.org/10.1016/B978-0-444-59482-2.00002-6, 2020.
Cano, J. M., Todolí, J. L., Hernandis, V., and Mora, J.: The role of the nebulizer on the sodium interferent effects in inductively coupled plasma atomic emission spectrometry, J. Anal. Spectrom., 17, 57–63, https://doi.org/10.1039/B105077J, 2002.
Clarke, A. D. and Noone, K. J.: Soot in the Arctic snowpack: a cause for perturbations in radiative transfer, Atmos. Environ., 19, 2045–2053, https://doi.org/10.1016/0004-6981(85)90113-1, 1985.
Clemen, H.-C., Schneider, J., Klimach, T., Helleis, F., Köllner, F., Hünig, A., Rubach, F., Mertes, S., Wex, H., Stratmann, F., Welti, A., Kohl, R., Frank, F., and Borrmann, S.: Optimizing the detection, ablation, and ion extraction efficiency of a single-particle laser ablation mass spectrometer for application in environments with low aerosol particle concentrations, Atmos. Meas. Tech., 13, 5923–5953, https://doi.org/10.5194/amt-13-5923-2020, 2020.
Clifford, R. H., Tan, H., Liu, H., Montaser, A., Zarrin, F., and Keady, P. B.: Particle size measurements in the submicron range by the differential electromobility technique: comparison of aerosols from thermospray, ultrasonic, pneumatic and frit-type nebulizers, Spectrochim. Acta B, 48, 1221–1235, https://doi.org/10.1016/0584-8547(93)80107-6, 1993.
Doherty, S. J., Warren, S. G., Grenfell, T. C., Clarke, A. D., and Brandt, R. E.: Light-absorbing impurities in Arctic snow, Atmos. Chem. Phys., 10, 11647–11680, https://doi.org/10.5194/acp-10-11647-2010, 2010.
Doherty, S. J., Grenfell, T. C., Forsström, S., Hegg, D. L., Brandt, R. E., and Warren, S. G.: Observed vertical redistribution of black carbon and other insoluble light-absorbing particles in melting snow, J. Geophys. Res.-Atmos., 118, 5553–5569, https://doi.org/10.1002/jgrd.50235, 2013.
Domine, F., Sparapani, R., Ianniello, A., and Beine, H. J.: The origin of sea salt in snow on Arctic sea ice and in coastal regions, Atmos. Chem. Phys., 4, 2259–2271, https://doi.org/10.5194/acp-4-2259-2004, 2004.
Domine, F., Taillandier, A.-S., and Simpson, W. R.: A parameterization of the specific surface area of seasonal snow for field use and for models of snowpack evolution, J. Geophys. Res.-Earth, 112, F02031, https://doi.org/10.1029/2006JF000512, 2007.
Dou, T.-F. and Xiao, C.-D.: An overview of black carbon deposition and its radiative forcing over the Arctic, Adv. Clim. Change Res., 7, 115–122, https://doi.org/10.1016/j.accre.2016.10.003, 2016.
Dubuisson, C., Poussel, E., and Mermet, J. M.: Comparison of ionic line-based internal standardization with axially and radially viewed inductively coupled plasma atomic emission spectrometry to compensate for sodium effects on accuracy, J. Anal. Atom. Spectrom., 13, 1265–1269, https://doi.org/10.1039/A805424J, 1998.
Flanner, M. G., Zender, C. S., Randerson, J. T., and Rasch, P. J.: Present-day climate forcing and response from black carbon in snow, J. Geophys. Res.-Atmos., 112, D11202, https://doi.org/10.1029/2006JD008003, 2007.
Flores, H. and Macke, A.: The Expeditions PS106/1 and 2 of the Research Vessel POLARSTERN to the Arctic Ocean in 2017, Alfred-Wegener-Institut, Helmholtz-Zentrum für Polar- und Meeresforschung, https://doi.org/10.2312/BZPM_0719_2018, 2018.
Gysel, M., Laborde, M., Olfert, J. S., Subramanian, R., and Gröhn, A. J.: Effective density of Aquadag and fullerene soot black carbon reference materials used for SP2 calibration, Atmos. Meas. Tech., 4, 2851–2858, https://doi.org/10.5194/amt-4-2851-2011, 2011.
Haas, C., Thomas, D. N., and Bareiss, J.: Surface properties and processes of perennial Antarctic sea ice in summer, J. Glaciol., 47, 613–625, https://doi.org/10.3189/172756501781831864, 2001.
Hagler, G. S. W., Bergin, M. H., Smith, E. A., Dibb, J. E., Anderson, C., and Steig, E. J.: Particulate and water-soluble carbon measured in recent snow at Summit, Greenland, Geophys. Res. Lett., 34, L16505, https://doi.org/10.1029/2007GL030110, 2007.
Hansen, J. and Nazarenko, L.: Soot climate forcing via snow and ice albedos, P. Natl. Acad. Sci. USA, 101, 423–428, https://doi.org/10.1073/pnas.2237157100, 2004.
Hayashi, M.: Temperature-Electrical Conductivity Relation of Water for Environmental Monitoring and Geophysical Data Inversion, Environ. Monit. Assess., 96, 119–128, https://doi.org/10.1023/B:EMAS.0000031719.83065.68, 2004.
Jacobi, H.-W., Obleitner, F., Da Costa, S., Ginot, P., Eleftheriadis, K., Aas, W., and Zanatta, M.: Deposition of ionic species and black carbon to the Arctic snowpack: combining snow pit observations with modeling, Atmos. Chem. Phys., 19, 10361–10377, https://doi.org/10.5194/acp-19-10361-2019, 2019.
Katich, J. M., Perring, A. E., and Schwarz, J. P.: Optimized detection of particulates from liquid samples in the aerosol phase: Focus on black carbon, Aerosol Sci. Tech., 51, 543–553, https://doi.org/10.1080/02786826.2017.1280597, 2017.
Khan, A. L., Dierssen, H., Schwarz, J. P., Schmitt, C., Chlus, A., Hermanson, M., Painter, T. H., and McKnight, D. M.: Impacts of coal dust from an active mine on the spectral reflectance of Arctic surface snow in Svalbard, Norway, J. Geophys. Res.-Atmos., 122, 1767–1778, https://doi.org/10.1002/2016JD025757, 2017.
Kinase, T., Adachi, K., Oshima, N., Goto-Azuma, K., Ogawa-Tsukagawa, Y., Kondo, Y., Moteki, N., Ohata, S., Mori, T., Hayashi, M., Hara, K., Kawashima, H., and Kita, K.: Concentrations and Size Distributions of Black Carbon in the Surface Snow of Eastern Antarctica in 2011, J. Geophys. Res.-Atmos., 125, e2019JD030737, https://doi.org/10.1029/2019JD030737, 2020.
Köllner, F., Schneider, J., Willis, M. D., Klimach, T., Helleis, F., Bozem, H., Kunkel, D., Hoor, P., Burkart, J., Leaitch, W. R., Aliabadi, A. A., Abbatt, J. P. D., Herber, A. B., and Borrmann, S.: Particulate trimethylamine in the summertime Canadian high Arctic lower troposphere, Atmos. Chem. Phys., 17, 13747–13766, https://doi.org/10.5194/acp-17-13747-2017, 2017.
Krnavek, L., Simpson, W. R., Carlson, D., Domine, F., Douglas, T. A., and Sturm, M.: The chemical composition of surface snow in the Arctic: Examining marine, terrestrial, and atmospheric influences, Atmos. Environ., 50, 349–359, https://doi.org/10.1016/j.atmosenv.2011.11.033, 2012.
Laborde, M., Mertes, P., Zieger, P., Dommen, J., Baltensperger, U., and Gysel, M.: Sensitivity of the Single Particle Soot Photometer to different black carbon types, Atmos. Meas. Tech., 5, 1031–1043, https://doi.org/10.5194/amt-5-1031-2012, 2012a.
Laborde, M., Schnaiter, M., Linke, C., Saathoff, H., Naumann, K.-H., Möhler, O., Berlenz, S., Wagner, U., Taylor, J. W., Liu, D., Flynn, M., Allan, J. D., Coe, H., Heimerl, K., Dahlkötter, F., Weinzierl, B., Wollny, A. G., Zanatta, M., Cozic, J., Laj, P., Hitzenberger, R., Schwarz, J. P., and Gysel, M.: Single Particle Soot Photometer intercomparison at the AIDA chamber, Atmos. Meas. Tech., 5, 3077–3097, https://doi.org/10.5194/amt-5-3077-2012, 2012b.
Lide, D. R.: CRC Handbook of Chemistry and Physics: A Ready-reference Book of Chemical and Physical Data, CRC Press, 2648 pp., 1995.
Lim, S., Faïn, X., Zanatta, M., Cozic, J., Jaffrezo, J.-L., Ginot, P., and Laj, P.: Refractory black carbon mass concentrations in snow and ice: method evaluation and inter-comparison with elemental carbon measurement, Atmos. Meas. Tech., 7, 3307–3324, https://doi.org/10.5194/amt-7-3307-2014, 2014.
Macdonald, K. M., Sharma, S., Toom, D., Chivulescu, A., Hanna, S., Bertram, A. K., Platt, A., Elsasser, M., Huang, L., Tarasick, D., Chellman, N., McConnell, J. R., Bozem, H., Kunkel, D., Lei, Y. D., Evans, G. J., and Abbatt, J. P. D.: Observations of atmospheric chemical deposition to high Arctic snow, Atmos. Chem. Phys., 17, 5775–5788, https://doi.org/10.5194/acp-17-5775-2017, 2017.
Massom, R. A., Eicken, H., Hass, C., Jeffries, M. O., Drinkwater, M. R., Sturm, M., Worby, A. P., Wu, X., Lytle, V. I., Ushio, S., Morris, K., Reid, P. A., Warren, S. G., and Allison, I.: Snow on Antarctic sea ice, Rev. Geophys., 39, 413–445, https://doi.org/10.1029/2000RG000085, 2001.
Mori, T., Moteki, N., Ohata, S., Koike, M., Goto-Azuma, K., Miyazaki, Y., and Kondo, Y.: Improved technique for measuring the size distribution of black carbon particles in liquid water, Aerosol Sci. Tech., 50, 242–254, https://doi.org/10.1080/02786826.2016.1147644, 2016.
Mori, T., Goto-Azuma, K., Kondo, Y., Ogawa-Tsukagawa, Y., Miura, K., Hirabayashi, M., Oshima, N., Koike, M., Kupiainen, K., Moteki, N., Ohata, S., Sinha, P. R., Sugiura, K., Aoki, T., Schneebeli, M., Steffen, K., Sato, A., Tsushima, A., Makarov, V., Omiya, S., Sugimoto, A., Takano, S., and Nagatsuka, N.: Black Carbon and Inorganic Aerosols in Arctic Snowpack, J. Geophys. Res.-Atmos., 124, 13325–13356, https://doi.org/10.1029/2019JD030623, 2019.
Mori, T., Kondo, Y., Ohata, S., Zhao, Y., Sinha, P. R., Oshima, N., Matsui, H., Moteki, N., and Koike, M.: Seasonal Variation of Wet Deposition of Black Carbon in Arctic Alaska, J. Geophys. Res.-Atmos., 125, e2019JD032240, https://doi.org/10.1029/2019JD032240, 2020.
Moteki, N. and Kondo, Y.: Dependence of Laser-Induced Incandescence on Physical Properties of Black Carbon Aerosols: Measurements and Theoretical Interpretation, Aerosol Sci. Tech., 44, 663–675, https://doi.org/10.1080/02786826.2010.484450, 2010.
Olivares, J. A. and Houk, R. S.: Suppression of analyte signal by various concomitant salts in inductively coupled plasma mass spectrometry, Anal. Chem., 58, 20−-25, https://doi.org/10.1021/ac00292a008, 1986.
Ozdemir, O., Karakashev, S. I., Nguyen, A. V., and Miller, J. D.: Adsorption and surface tension analysis of concentrated alkali halide brine solutions, Miner. Eng., 22, 263–271, https://doi.org/10.1016/j.mineng.2008.08.001, 2009.
Petzold, A., Ogren, J. A., Fiebig, M., Laj, P., Li, S.-M., Baltensperger, U., Holzer-Popp, T., Kinne, S., Pappalardo, G., Sugimoto, N., Wehrli, C., Wiedensohler, A., and Zhang, X.-Y.: Recommendations for reporting “black carbon” measurements, Atmos. Chem. Phys., 13, 8365–8379, https://doi.org/10.5194/acp-13-8365-2013, 2013.
Quinn, P. K., Stohl, A., Arnold, S., Baklanov, A., Berntsen, T. K., Christensen, J. H., Eckhardt, S., Flanner, M., Klimont, Z., Korsholm, U. S., Kupiainen, K., Langner, J., Law, K., Monks S., von Salzen, K., Sand, M., Schmale, J., and Vestreng, V.: AMAP Assesment 2015: Black carbon and ozone as Arctic climate forcers, Arctic Monitoring and Assessment Programme (AMAP), Oslo, Norway, vii + 116 pp., 2015.
Rösch, M. and Cziczo, D. J.: Aqueous particle generation with a 3D printed nebulizer, Atmos. Meas. Tech., 13, 6807–6812, https://doi.org/10.5194/amt-13-6807-2020, 2020.
Schacht, J., Heinold, B., Quaas, J., Backman, J., Cherian, R., Ehrlich, A., Herber, A., Huang, W. T. K., Kondo, Y., Massling, A., Sinha, P. R., Weinzierl, B., Zanatta, M., and Tegen, I.: The importance of the representation of air pollution emissions for the modeled distribution and radiative effects of black carbon in the Arctic, Atmos. Chem. Phys., 19, 11159–11183, https://doi.org/10.5194/acp-19-11159-2019, 2019.
Schnaiter, M., Linke, C., Ibrahim, I., Kiselev, A., Waitz, F., Leisner, T., Norra, S., and Rehm, T.: Specifying the light-absorbing properties of aerosol particles in fresh snow samples, collected at the Environmental Research Station Schneefernerhaus (UFS), Zugspitze, Atmos. Chem. Phys., 19, 10829–10844, https://doi.org/10.5194/acp-19-10829-2019, 2019.
Schwarz, J. P., Spackman, J. R., Gao, R. S., Perring, A. E., Cross, E., Onasch, T. B., Ahern, A., Wrobel, W., Davidovits, P., Olfert, J., Dubey, M. K., Mazzoleni, C., and Fahey, D. W.: The Detection Efficiency of the Single Particle Soot Photometer, Aerosol Sci. Tech., 44, 612–628, https://doi.org/10.1080/02786826.2010.481298, 2010.
Schwarz, J. P., Doherty, S. J., Li, F., Ruggiero, S. T., Tanner, C. E., Perring, A. E., Gao, R. S., and Fahey, D. W.: Assessing Single Particle Soot Photometer and Integrating Sphere/Integrating Sandwich Spectrophotometer measurement techniques for quantifying black carbon concentration in snow, Atmos. Meas. Tech., 5, 2581–2592, https://doi.org/10.5194/amt-5-2581-2012, 2012.
Sharp, B. L.: Pneumatic nebulisers and spray chambers for inductively coupled plasma spectrometry. A review. Part 1. Nebulisers, J. Anal. Atom. Spectrom., 3, 613–652, https://doi.org/10.1039/JA9880300613, 1988.
Sinha, P. R., Kondo, Y., Goto-Azuma, K., Tsukagawa, Y., Fukuda, K., Koike, M., Ohata, S., Moteki, N., Mori, T., Oshima, N., Førland, E. J., Irwin, M., Gallet, J.-C., and Pedersen, C. A.: Seasonal Progression of the Deposition of Black Carbon by Snowfall at Ny-Ålesund, Spitsbergen, J. Geophys. Res.-Atmos., 123, 997–1016, https://doi.org/10.1002/2017JD028027, 2017.
Skiles, S. M. and Painter, T.: Daily evolution in dust and black carbon content, snow grain size, and snow albedo during snowmelt, Rocky Mountains, Colorado, J. Glaciol., 63, 118–132, https://doi.org/10.1017/jog.2016.125, 2017.
Skiles, S. M., Flanner, M., Cook, J. M., Dumont, M., and Painter, T. H.: Radiative forcing by light-absorbing particles in snow, Nat. Clim. Change, 8, 964–971, https://doi.org/10.1038/s41558-018-0296-5, 2018.
Sötebier, C., Kutscher, D., Rottmann, L., Jakubowski, N., Panne, U., and Bettmer, J.: Combination of single particle ICP-QMS and isotope dilution analysis for the determination of size, particle number and number size distribution of silver nanoparticles, J. Anal. Atom. Spectrom., 31, 2045–2052, https://doi.org/10.1039/C6JA00137H, 2016.
Stephens, M., Turner, N., and Sandberg, J.: Particle identification by laser-induced incandescence in a solid-state laser cavity, Appl. Optics, 42, 3726–3736, https://doi.org/10.1364/AO.42.003726, 2003.
Todolí, J. L., Gras, L., Hernandis, V., and Mora, J.: Elemental matrix effects in ICP-AES, J. Anal. Atmos. Spectrom., 17, 142–169, https://doi.org/10.1039/B009570M, 2002.
Tørseth, K., Andrews, E., Asmi, E., Eleftheriadis, K., Fiebig, M., Herber, A., Huang, L., Kylling, A., Lupi, A., Massling, A., Mazzola, M., Nøjgaard, J. K., Popovicheva, O., Schichtel, B., Schmale, J., Sharma, S., Skov, H., Stebel, K., Vasel, B., Vitale, V., Whaley, C., Yttri, K. E., and Zanatta, M.: Review of Observation Capacities and Data Availability for Black Carbon in theArctic Region, EU Action on Black Carbon in the Arctic – Technical Report 1, AMAP – Arctic Monitoring and Assessment Programme, Oslo, p. 35, 2019.
von der Weiden, S.-L., Drewnick, F., and Borrmann, S.: Particle Loss Calculator – a new software tool for the assessment of the performance of aerosol inlet systems, Atmos. Meas. Tech., 2, 479–494, https://doi.org/10.5194/amt-2-479-2009, 2009.
Wendisch, M., Macke, A., Ehrlich, A., Lüpkes, C., Mech, M., Chechin, D., Dethloff, K., Velasco, C. B., Bozem, H., Brückner, M., Clemen, H.-C., Crewell, S., Donth, T., Dupuy, R., Ebell, K., Egerer, U., Engelmann, R., Engler, C., Eppers, O., Gehrmann, M., Gong, X., Gottschalk, M., Gourbeyre, C., Griesche, H., Hartmann, J., Hartmann, M., Heinold, B., Herber, A., Herrmann, H., Heygster, G., Hoor, P., Jafariserajehlou, S., Jäkel, E., Järvinen, E., Jourdan, O., Kästner, U., Kecorius, S., Knudsen, E. M., Köllner, F., Kretzschmar, J., Lelli, L., Leroy, D., Maturilli, M., Mei, L., Mertes, S., Mioche, G., Neuber, R., Nicolaus, M., Nomokonova, T., Notholt, J., Palm, M., van Pinxteren, M., Quaas, J., Richter, P., Ruiz-Donoso, E., Schäfer, M., Schmieder, K., Schnaiter, M., Schneider, J., Schwarzenböck, A., Seifert, P., Shupe, M. D., Siebert, H., Spreen, G., Stapf, J., Stratmann, F., Vogl, T., Welti, A., Wex, H., Wiedensohler, A., Zanatta, M., and Zeppenfeld, S.: The Arctic Cloud Puzzle: Using ACLOUD/PASCAL Multiplatform Observations to Unravel the Role of Clouds and Aerosol Particles in Arctic Amplification, B. Am. Meteorol. Soc., 100, 841–871, https://doi.org/10.1175/BAMS-D-18-0072.1, 2018.
Wendl, I. A., Menking, J. A., Färber, R., Gysel, M., Kaspari, S. D., Laborde, M. J. G., and Schwikowski, M.: Optimized method for black carbon analysis in ice and snow using the Single Particle Soot Photometer, Atmos. Meas. Tech., 7, 2667–2681, https://doi.org/10.5194/amt-7-2667-2014, 2014.
Zhang, Y., Kang, S., Gao, T., Sprenger, M., Dou, T., Han, W., Zhang, Q., Sun, S., Du, W., Chen, P., Guo, J., Cui, X., and Sillanpää, M.: Dissolved organic carbon in Alaskan Arctic snow: concentrations, light-absorption properties, and bioavailability, Tellus B, 72, 1–19, https://doi.org/10.1080/16000889.2020.1778968, 2020.