the Creative Commons Attribution 4.0 License.
the Creative Commons Attribution 4.0 License.
 | 16 Jun 2021
Elevated 3D structures of PM2.5 and impact of complex terrain-forcing circulations on heavy haze pollution over Sichuan Basin, China
Zhuozhi Shu
Yubao Liu
Tianliang Zhao
Junrong Xia
Chenggang Wang
Le Cao
Haoliang Wang
Lei Zhang
Yu Zheng
Lijuan Shen
Lei Luo
Yueqing Li
Deep basins create uniquely favorable conditions for causing air pollution, and the Sichuan Basin (SCB) in Southwest China is such a basin featuring frequent heavy pollution. A wintertime heavy haze pollution event in the SCB was studied with conventional and intensive observation data and the WRF-Chem model to explore the 3D distribution of PM2.5 to understand the impact of regional pollutant emissions, basin circulations associated with plateaus, and downwind transport to the adjacent areas. It was found that the vertical structure of PM2.5 over the SCB was characterized by a remarkable hollow sandwiched by high PM2.5 layers at heights of 1.5–3 km and a highly polluted near-surface layer. The southwesterlies over the Tibetan Plateau (TP) and Yunnan-Guizhou Plateau (YGP) resulted in a lee vortex over the SCB, which helped form and maintain heavy PM2.5 pollution. The basin PM2.5 was lifted into the free troposphere and transported outside of the SCB. At the bottom of the SCB, high PM2.5 concentrations were mostly located in the northwestern and southern regions. Due to the blocking effect of the plateau terrain on the northeasterly winds, PM2.5 gradually increased from northeast to southwest in the basin. In the lower free troposphere, the high PM2.5 centers were distributed over the northwestern and southwestern SCB areas, as well as the central SCB region. For this event, the regional emissions from the SCB contributed 75.4 %–94.6 % to the surface PM2.5 concentrations in the SCB. The SCB emissions were the major source of PM2.5 over the eastern regions of the TP and the northern regions of the YGP, with contribution rates of 72.7 % and 70.5 %, respectively, during the dissipation stage of heavy air pollution over the SCB, which was regarded as the major pollutant source affecting atmospheric environment changes in Southwest China.
- Article
(8579 KB) - Full-text XML
-
Supplement
(1017 KB) - BibTeX
- EndNote


Haze pollution has caused serious environmental problems, especially in the densely populated and economically developed regions in China, which have high levels of fine particulate matter (PM2.5) (particulate matter with an aerodynamic diameter equal to or less than 2.5 µm) (Guo et al., 2014; P. Li et al., 2015; Gu and Yim, 2016; Lin et al., 2018). Owing to the significant adverse effects on human health and climate change (Dawson et al., 2007; Langrish et al., 2012; Megaritis et al., 2014; Guo et al., 2016), understanding PM2.5 pollution distributions and mechanisms is of high interest in environmental and climate studies.
Anthropogenic pollutant emissions and stagnant meteorological conditions are commonly regarded as two key factors influencing haze pollution with excessive concentrations of PM2.5 (Yim et al., 2014; Zhang et al., 2015; Cai et al., 2017). With strong anthropogenic emissions and favorable meteorological conditions, four main regions with frequent heavy haze pollution have been identified, centered over the North China Plain (NCP) (Tao et al., 2012; Ye et al., 2016; Zhang et al., 2016; Huang et al., 2017), the Yangtze River Delta (YRD) in East China (Wang et al., 2012; B. Li et al., 2015; Tang et al., 2015; Ming et al., 2017), the Pearl River Delta (PRD) in South China (Wu et al., 2013; Zhang et al., 2013; Guo et al., 2016), and the Sichuan Basin (SCB) in Southwest China (Tao et al., 2013; Chen et al., 2014; Zhou et al., 2019). Haze pollution over the NCP, YRD, and PRD, the main economic centers with large flatlands, has been extensively studied. However, air pollution in the SCB region with highly frequent heavy PM2.5 pollution is not completely understood owing to the complex deep basin terrain, particularly the effect of the immediately adjoining Tibetan Plateau (TP).
The TP's “harbor effect” on the tropospheric westerlies favors a stable atmospheric stratification and low wind speeds in the boundary layer over the downstream SCB (Xu et al., 2015, 2016), which is conducive to air pollutant accumulation in the SCB (Yim et al., 2014; Xu et al., 2016; H. Wang et al., 2018a). The downslope flows at the lee side of the plateau can induce a special stagnation meteorological condition in the lower troposphere (Wang et al., 2014; Ning et al., 2018a). Air stagnation days account for 76.6 % of the total days in winter over the SCB (Liao et al., 2018), where near-surface weakened wind, strong vertical air temperature inversion, and shallow boundary layer significantly restrain the atmospheric diffusion capacity (Ning et al., 2018a; X. Wang et al., 2018; Tian et al., 2019), resulting in the occurrence of heavy air pollution in the SCB.
The SCB, covering 260 000 km2 of the Sichuan-Chongqing plain with a dense population of more than 100 million people, is a deep basin in Southwest China surrounded by plateaus and mountains. It lies immediately to the east of the TP, with a large elevation drop exceeding 3000 m over a short horizontal distance. The unique terrain effect generates the asymmetries of meteorological and air pollutant distribution (Zhang et al., 2019), with a remarkable difference in PM2.5 concentrations between the eastern and western regions over the SCB (Chen and Xie, 2012; Ning et al., 2018b). The weak vertical diffusion in the atmospheric boundary layer is one of the main causes of air pollution in winter (Hu et al., 2014; Tian et al., 2017; Zhao et al., 2018). Many studies have suggested that air pollution over the SCB is mostly caused by the accumulation of air pollutants originating from local emissions (Chen et al., 2014; Liao et al., 2017; H. Wang et al., 2018a; Qiao et al., 2019). However, because of the complex flows in the SCB, it is important to study how PM2.5 is circulated in three dimensions to estimate the roles of local emissions and exchanges with outside regions more accurately.
In this study, observation data analysis and numerical experiments were conducted to analyze the 3D distribution of PM2.5 concentrations in the SCB during a heavy haze pollution episode in January 2017. The contributions of the SCB pollutant emissions and PM2.5 transport to the surrounding plateaus and mountains were estimated. Section 2 introduces the observation data and the modeling methods used in this study. Section 3 characterizes the horizontal and vertical distributions of PM2.5, during the formation, maintenance, and dissipation stages of the heavy haze pollution episode. We also assessed the contribution of local emissions to the heavy PM2.5 pollution within the SCB and the impact of external transport of the PM2.5 in the SCB on the surrounding areas in Southwest China. The summary and conclusions are provided in Sect. 4.
2.1 Observation data
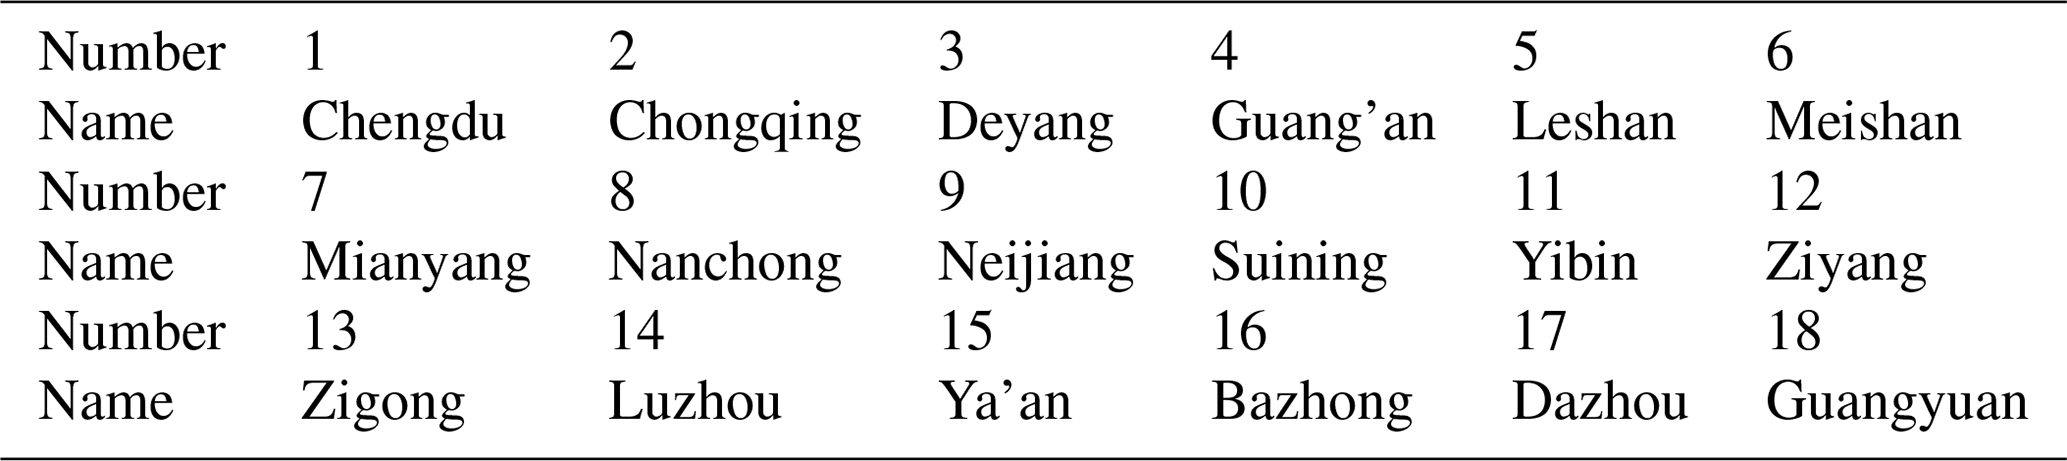
The surface air pollutant concentrations and meteorological elements observed in 18 cities (Fig. 1; Table 1) over the SCB were used to investigate the distribution of PM2.5, weather circulations, and modeling performance. The hourly meteorological observational data, including surface air temperature, relative humidity, wind speed, and wind direction, were obtained from the Chinese meteorological monitoring network, and the hourly observational PM2.5 concentrations were obtained from the China National Environmental Monitoring Center (http://www.cnemc.cn, last access: 1 June 2021).

Figure 1(a) Three nesting domains D1, D2, and D3 of the WRF-Chem simulation with the terrain heights (m in a.s.l.) and (b) the location of 18 urban observation sites (black dots; Table 1) including site 1 (Chengdu) with the intensive sounding observations and site 15 (Ya'an) with the ground-based MPL detection in the SCB with the surrounding Tibetan Plateau (TP), Yunnan-Guizhou Plateau (YGP), Mountains Daba (Mt. Daba), and Wu (Mt. Wu) in Southwest China. The red dashed lines indicate the location of the cross sections, respectively, along 30.67∘ N and 104.02∘ E.
Table 1Names of 18 observation sites with the corresponding site number (Fig. 1b) in the SCB.
In addition to the above-mentioned conventional observations, sounding observations were conducted every 3 h using a kite balloon with the sounding system TT12 DigiCORA (Vaisala, Finland) at the Meteorological Observatory of Chengdu (Site 1 in Fig. 1) during 1–20 January 2017. The vertical sounding data of air temperature, wind speed, wind direction, and relative humidity were observed at time intervals of 1 s. In addition, a micropulse lidar type 4 system (MPL-4B-IDS, Sigma Space, America) was operated at the observational site, Ya'an (Site 15 in Fig. 1), in the western SCB edge to retrieve the vertical PM2.5 structures at 532 nm (laser emission wavelength), 2500 Hz (laser repetition rate), and 6–8 µJ (optimal laser output range).
2.2 Model configuration and simulation experiments
The Weather Research and Forecasting with Chemistry (WRF-Chem, version 3.8.1) model was employed to simulate severe haze pollution events during 2–7 January 2017 in the SCB (Fig. 2). The spin-up time of modeling for the first 24 h, starting on 31 December 2016, was dropped. The ERA-Interim meteorological reanalysis data of the European Center for Medium-Range Weather Forecasts (https://www.ecmwf.int/en/forecasts/datasets/reanalysis-datasets/era-interim, last access: 1 June 2021) served as the initial and boundary conditions of the WRF-Chem simulation. The model domains and topography are presented in Fig. 1. There were three nesting domains with domain 1 (D1: 101 × 95) covering most areas of China, domain 2 (D2: 169 × 169) covering Southwest China, and an inner domain 3 (D3: 229 × 213) covering the SCB and the surrounding areas at grid intervals of 48, 12, and 3 km, respectively (Fig. 1). Considering the sharp drop of topography between the SCB and surrounding plateaus and mountains with the terrain influence on westerlies and atmospheric circulations, we adopted the 1:4 grid ratio for simulation experiments. Although an even nested ratio, which is not recommended, may result in interpolation errors at the nested-domain boundary owing to the nature of Arakawa C-grid staggering, the 1:4 grid ratio available in the WRF framework was reasonably applied in previous simulation studies (Tie et al., 2010; Rai et al., 2019). An adequate vertical resolution is fundamental for evaluating thermal stratification over complex terrain. Therefore, 35 vertical layers from the ground to the model top at 100 hPa were set for the modeling experiments in this study on air pollution change with the 18 layers in the fine resolutions of 30–120 m vertically from the ground to 1 km within the atmospheric boundary layer. The MYJ is a local closure scheme (Janjić, 1994) that is applicable to the atmospheric environment with stable stratification for weak turbulent mixing (Jia and Zhang, 2020) and underlying complex terrain (Lu et al., 2012; Madala et al., 2015; Bei et al., 2019). Therefore, The MYJ was used as the planetary boundary layer parameterization scheme in the simulation. The detailed physical and chemical schemes for the WRF-Chem simulation involving the Morrison 2 microphysics (Morrison et al., 2009), the Rapid Radiative Transfer Model (RRTM) longwave radiation (Mlawer et al., 1997), the RRTM for General Circulation Models (RRTMG) shortwave radiation (Iacono et al., 2008), the Noah land surface model (Chen and Dudhia, 2001), and the Grell 3D cumulus (Grell and Devenyi, 2002) are listed in Table 2.
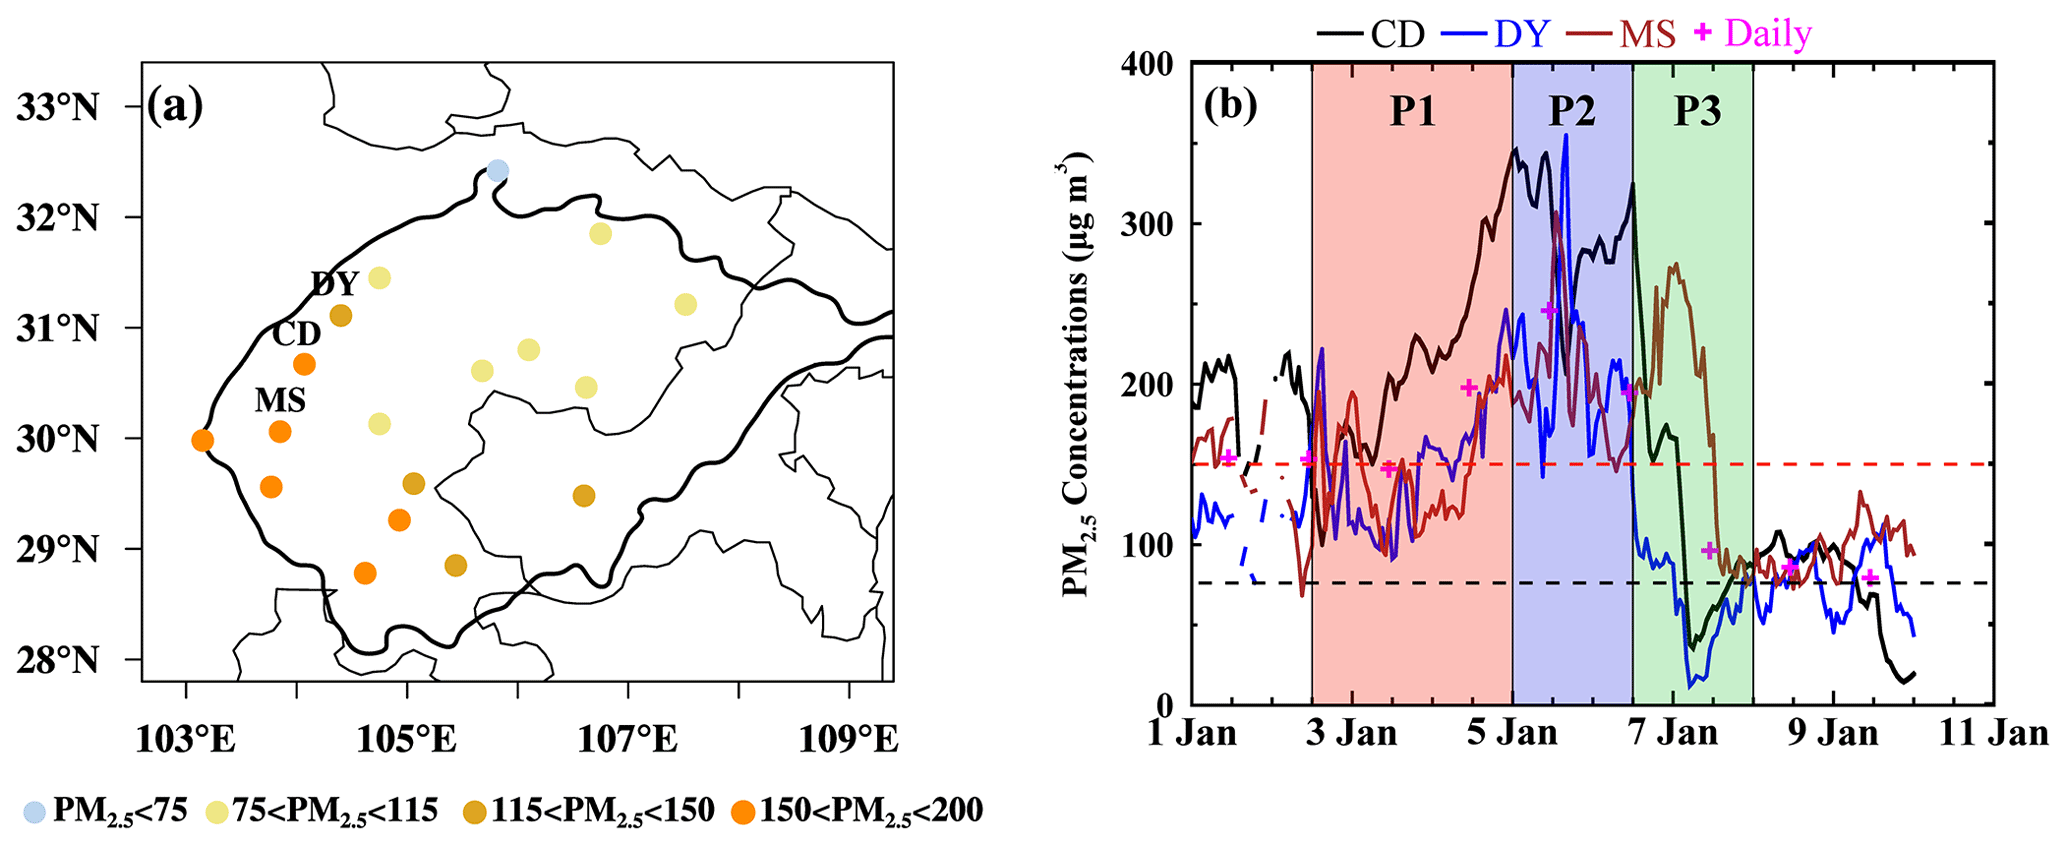
Figure 2(a) Surface PM2.5 concentrations over 18 urban sites averaged during the heavy haze pollution during 2–7 January 2017 and (b) hourly variations of PM2.5 concentrations observed at the three heaviest polluted cities Chengdu (CD), Deyang (DY), and Meishan (MS) (Fig. 1; Table 1) over 1–10 January 2017. The P1, P2, and P3 indicated, respectively, the formation, maintenance, and dissipation periods of heavy haze pollution with the light pollution level of 75 µg m−3 (black dashed line) and heavy pollution level of 150 µg m−3 (red dashed line).
Table 2Setting of physical and chemical schemes in the WRF-Chem simulations.
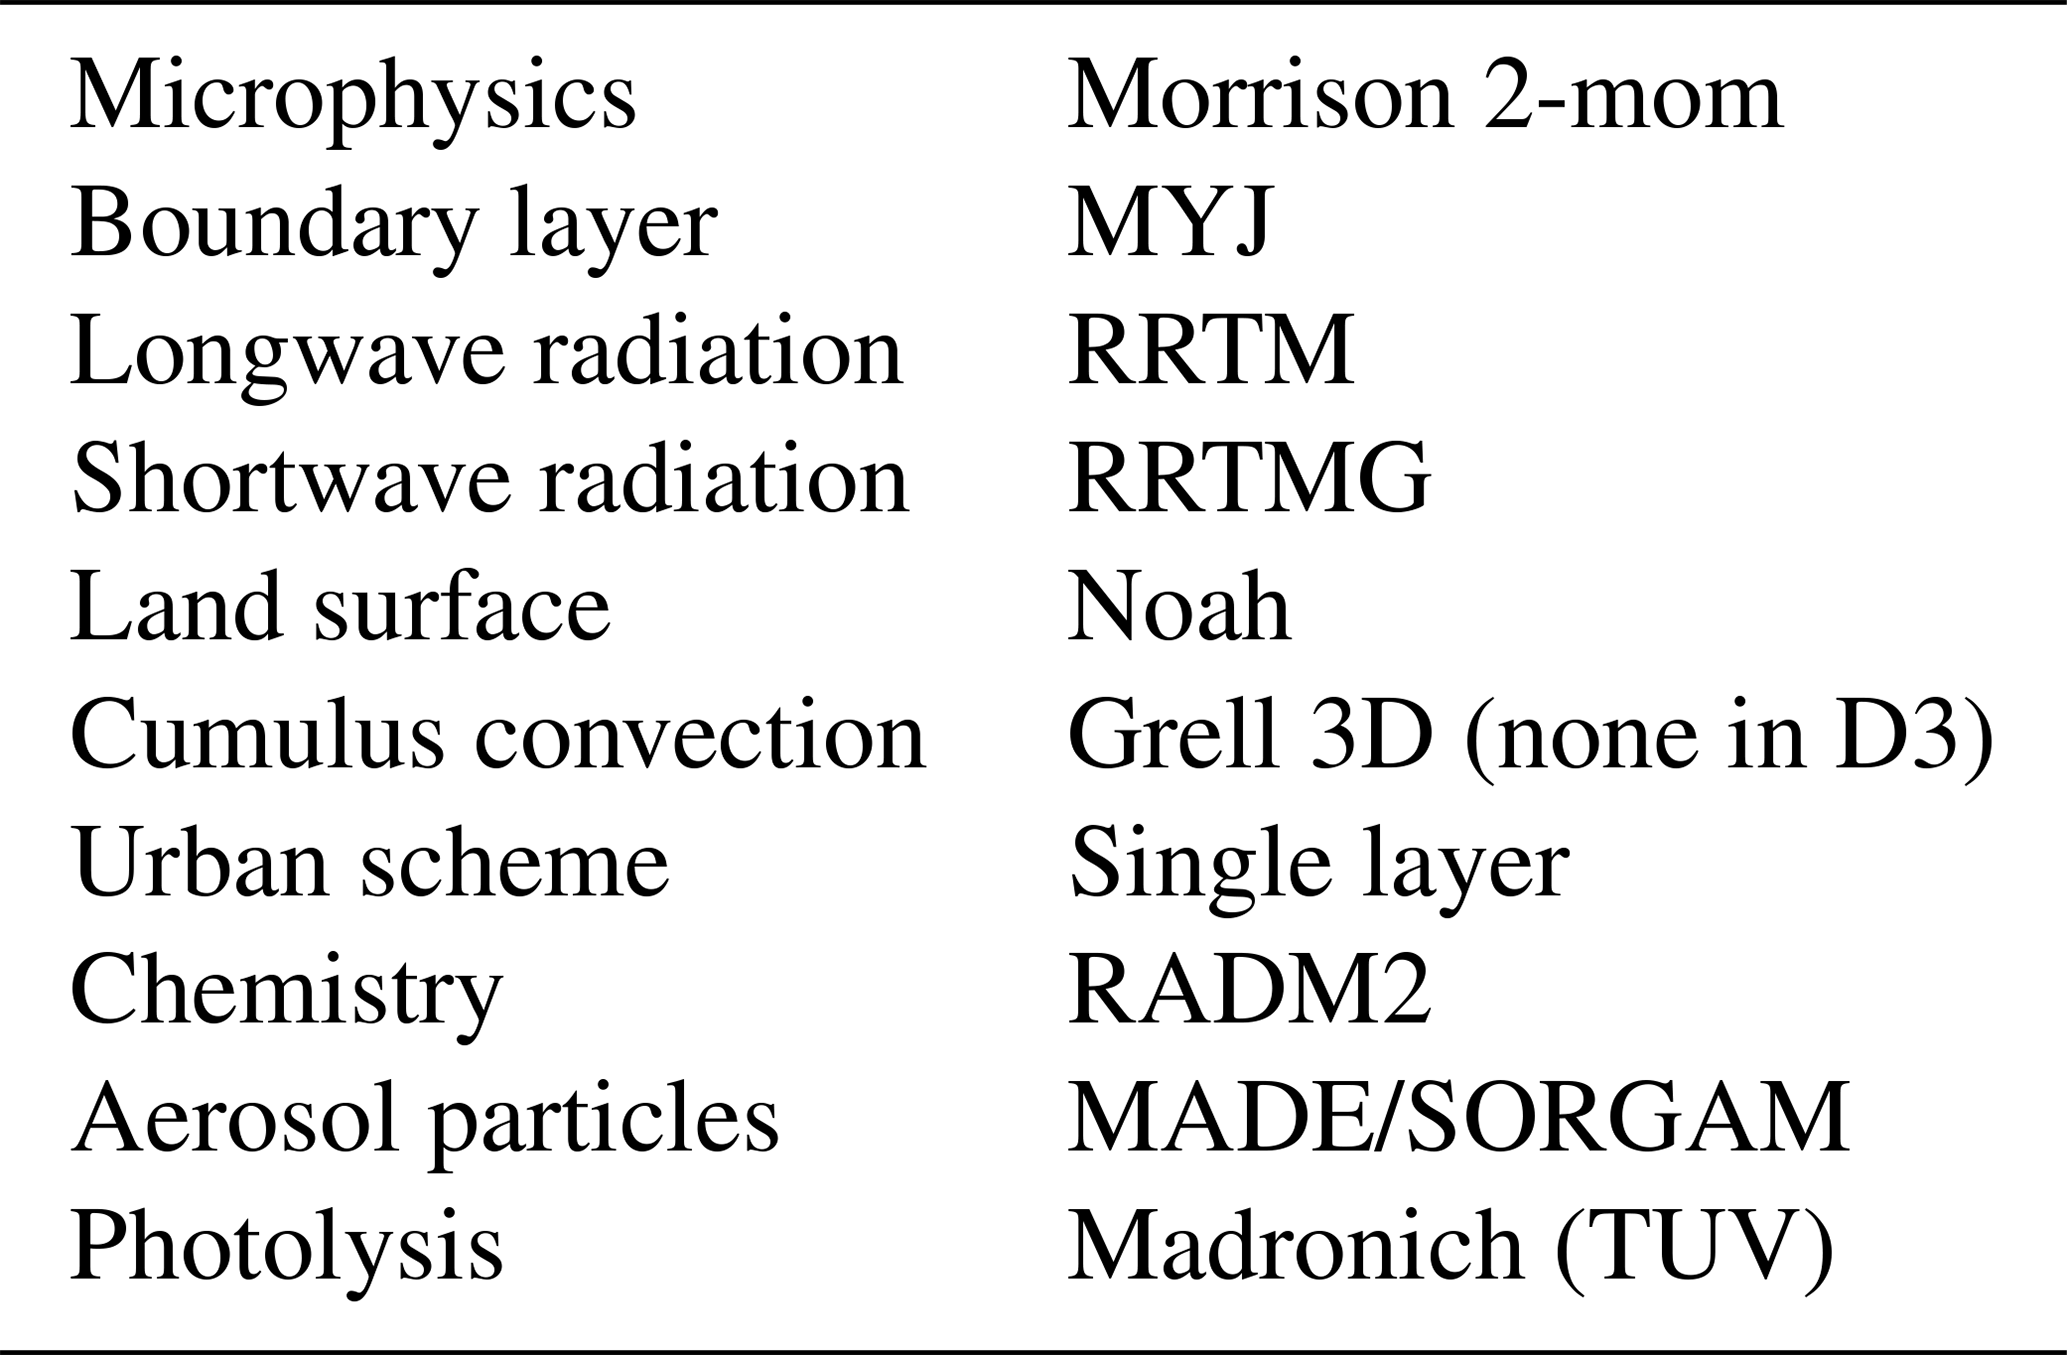
The regional acid deposition model, version 2 (RADM2) (Stockwell et al., 1990) was selected for the atmospheric gas-phase chemistry mechanism, including the main inorganic ions, elemental carbon, primary and secondary organic aerosols, and other aerosol species (Tuccella et al., 2012). The Multi-resolution Emission Inventory for China (MEIC) from 2012 (http://www.meicmodel.org, last access: 1 June 2021) with a horizontal resolution of 0.25 × 0.25∘ was used to model the anthropogenic emissions of air pollutants. The Model of Emissions of Gases and Aerosols from Nature (v2.1) was applied to the natural emission sources in the simulation with dust emission parameterization.
The weakened vertical diffusion capacity is conducive to the accumulation of
air pollutants (Ren et al., 2019) and in the formation of severe haze pollution with the explosive growth of PM2.5 (Zhong et al., 2018). Approximately 80 % reduction in turbulent diffusion coefficient provides a more accurate prediction of PM2.5 over the NCP (H. Wang et al., 2018b). High PM2.5 levels in the atmosphere could significantly reduce the near-ground solar radiation, resulting in decreasing vertical turbulent diffusion in the boundary layer (Wang et al., 2019), which could be incompletely considered in the meteorological reanalysis data driving the WRF-Chem simulation. In this study, we found that a 50 % decrease in the turbulent diffusion coefficient in the SCB could greatly improve the deviation of PM2.5 simulations in the extremely stable atmosphere through the sensitivity tests. Hence, the turbulent diffusion coefficient was cut halfway for the simulation of the 3D structures of PM2.5, during the heavy air pollution event over the SCB region. Two simulation experiments were conducted: (1) a baseline simulation (Emi-Real), with the MEIC anthropogenic emission inventory over all three domains and (2) a sensitivity simulation (Emi-Non), similar to Emi-Real but involved shutting down the anthropogenic emission sources in the SCB (Fig. 1). By comparing the PM2.5 concentrations between Emi-Real and Emi-Non, we quantified the contribution of local emission sources to the heavy haze pollution over the SCB and estimated the transport from the polluted SCB to the adjoined areas over the eastern TP, the northern YGP, and the Daba Mountain (DBM) region (Fig. 1). The definite ranges of the three regions were defined with the altitudes of 750–3500 m over 30.5–33.0∘ N, 102.7–105.3∘ E (the eastern TP edge), 750–3000 m over 27.8–29∘ N, 103.5–108.5∘ E (northern YGP edge), and above 750 m over 31.5–33.0∘ N, 106.0–109.4∘ E (DBM region), as shown in Fig. S4 in the Supplement.
2.3 Case description
A severe haze pollution event occurred during 2–7 January 2017 in the SCB. As shown in Fig. 2, high and low PM2.5 concentrations were centered in the western and eastern regions during the episode, respectively, presenting a generally asymmetric horizontal distribution.
Based on the National Ambient Air Quality Standards of China by the Ministry of Ecology and Environment in 2012 (http://www.mee.gov.cn/, last access: 1 June 2021), light and heavy air pollution levels of PM2.5 were categorized with daily average PM2.5 concentrations exceeding 75 and 150 µg m−3 in ambient air, respectively. The most heavily polluted regions were mainly concentrated in the northwestern city cluster of the SCB, including Chengdu, Deyang, and Meishan, with daily mean PM2.5 concentrations exceeding 150 µg m−3 (Figs. 1 and 2a). An hourly PM2.5 peak of 345.0 µg m−3 was observed in Chengdu, a representative megacity in Southwest China. According to the hourly PM2.5 variations in the city cluster over the northwestern SCB region, we divided the heavy haze episode into three periods, P1, P2, and P3, corresponding to formation (from 12:00 on 2 January to 00:00 on 5 January 2017), maintenance (from 00:00 on 5 January to 12:00 on 6 January 2017), and dissipation (from 12:00 on 6 January to 00:00 on 8 January 2017) stages, respectively (local time was used in this study). As shown in Fig. 2b, during P1, the surface PM2.5 concentrations sharply increased to the heavy haze pollution level, and then fluctuated at the heavy pollution level in P2. Finally, in P3, the concentrations of PM2.5 dropped below 75 µg m−3 and the event ended on 7 January 2017 (Fig. 2b).
Under the typical Asian monsoon climate in January over the SCB, the change of synoptic conditions during the haze event over the SCB was characterized by the cold air invasion driven by near-surface northeasterly winds with the vertical configuration of trough development and movement in the mid-latitude westerlies at 700 hPa (Figs. 3 and 7). A 700 hPa trough in the mid-latitude westerlies moved eastward from the eastern edge of the TP to the western SCB margin during P1 (Fig. 3a), the trough of low pressure evolved at 700 hPa during P2 (Fig. 3b), and the 700 hPa trough and the low-pressure system disappeared in P3 over the SCB (Fig. 3c). Meteorologically, the direction and intensity of cold air invasion with near-surface northeasterly winds are steered by the development and movement of the westerly trough in the mid-troposphere (Fig. 3c). The 700 hPa trough approached, developed, and disappeared in P1, P2, and P3 of the haze pollution event over the SCB (Fig. 3), which is associated with the increase of northeasterly winds for the cold air invasion to the SCB region during the dissipation stage. The changes in atmospheric circulations in the three stages reflected the meteorological modulation of heavy haze development over the SCB in association with the effect of the TP topography on the westerlies.
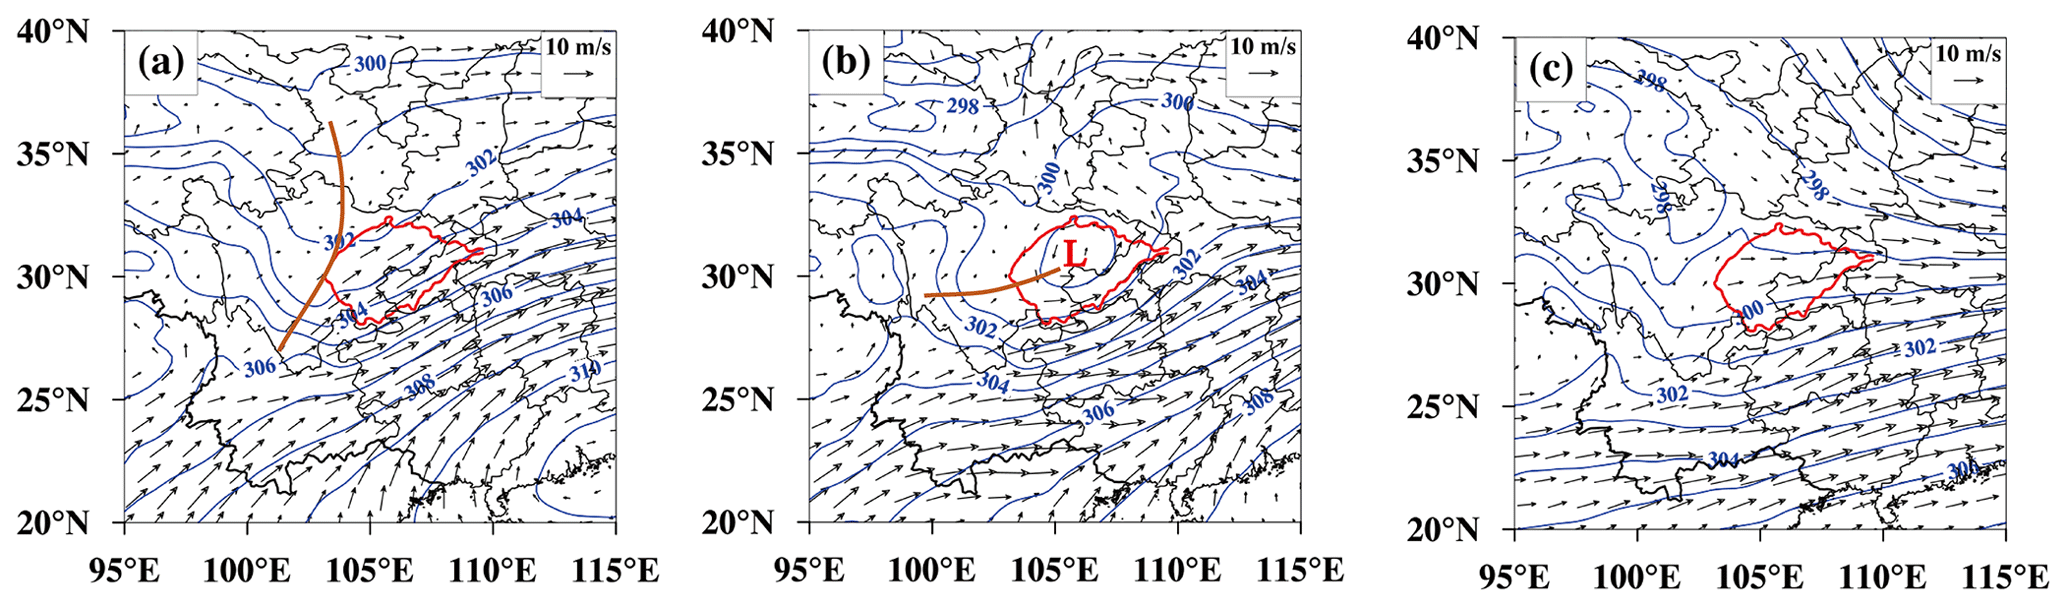
Figure 3The 700 hPa geopotential height fields and wind vectors averaged during (a) P1, (b) P2, and (c) P3 stages with the trough line (brown lines) and low-pressure center (L). The SCB is outlined with red solid lines.
Analysis of the observations revealed noteworthy patterns of the spatial distribution of surface PM2.5 concentrations over the SCB in the three periods (Fig. 4). During P1, the surface PM2.5 concentrations were distributed relatively even over the SCB, but during P2, the PM2.5 concentrations exhibited a northeast–southwest gradient and a dramatic increase in the western SCB area. For example, the surface PM2.5 concentrations increased from 202.1 to 276.6 µg m−3, from 148.6 to 181.0 µg m−3, from 104.9 to 205.7 µg m−3, and from 145.6 to 168.4 µg m−3 at sites 1, 3, 6, and 15, respectively (Fig. 1; Table 1). In contrast, during the dissipation period P3, strong northeasterly winds developed, and the air quality was improved from the northeast to the southwest regions, with the reduction in PM2.5 concentrations in the northeastern SCB (Fig. 4). The northeast–southwest gradients of the surface PM2.5 concentrations in the SCB mostly resulted from the near-surface northeasterly winds that were blocked by plateaus and mountains located to the southwest of the SCB, which will be further discussed in the following sections.
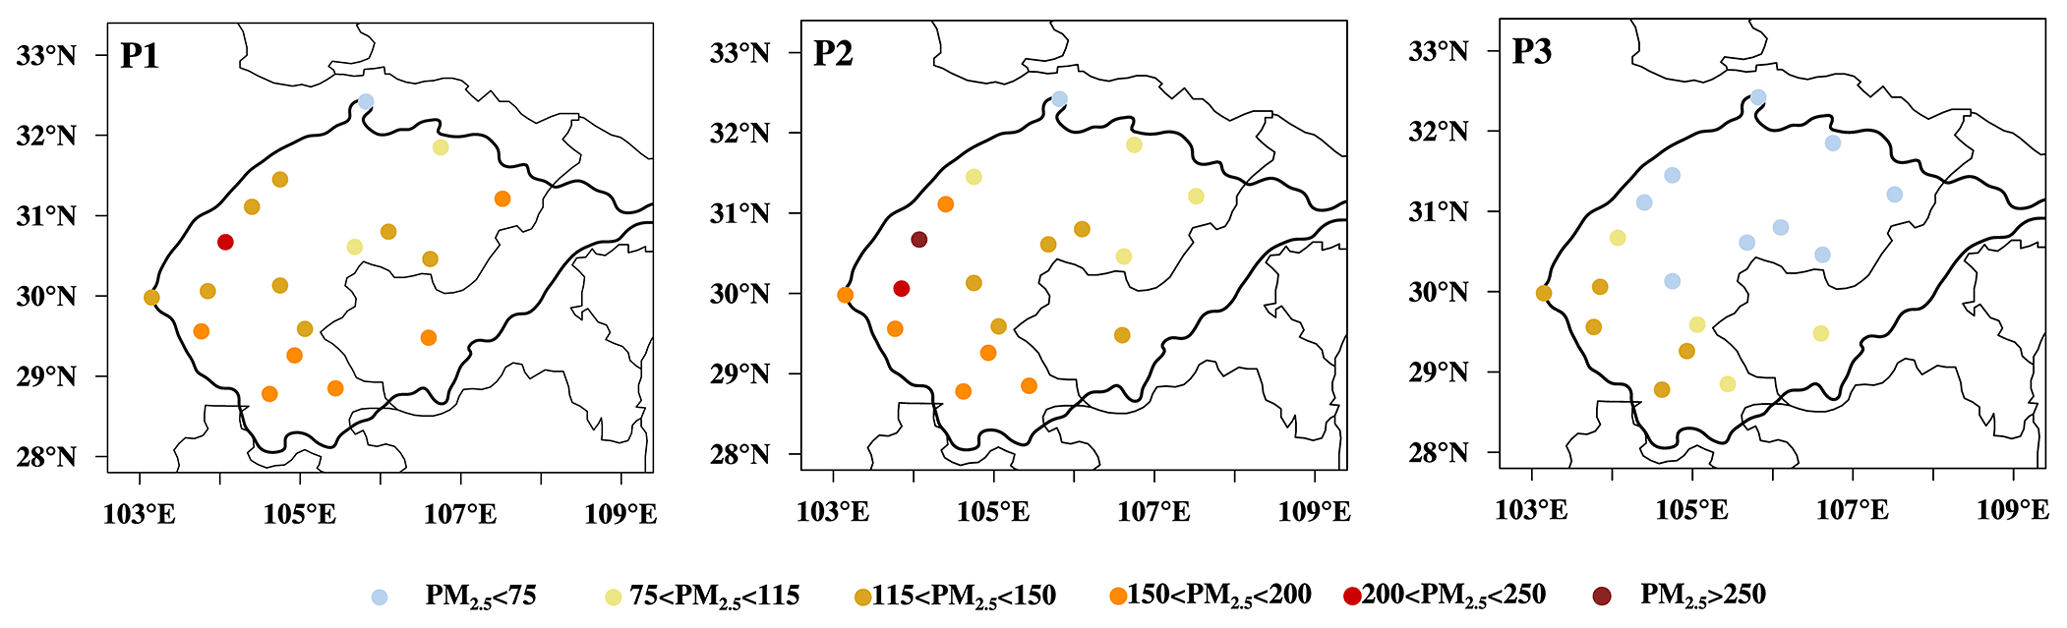
Figure 4Spatial distributions of observed surface PM2.5 concentrations in the SCB averaged in the formation, maintenance, and dissipation periods, P1, P2, and P3 (Fig. 2b), respectively, of the heavy haze pollution episode during 2–7 January 2017.
3.1 Model evaluation
First, we validated the WRF-Chem simulation performance by comparing it with the meteorological and PM2.5 observations in the SCB, especially with the intensive vertical soundings, for verifying the vertical structures of the simulated boundary layer (Figs. S1–S3 in the Supplement). The simulated vertical PM2.5 distribution in the lower troposphere was evaluated using ground-based MPL detection at site 15 in the western SCB (Fig. 1; Table 1).
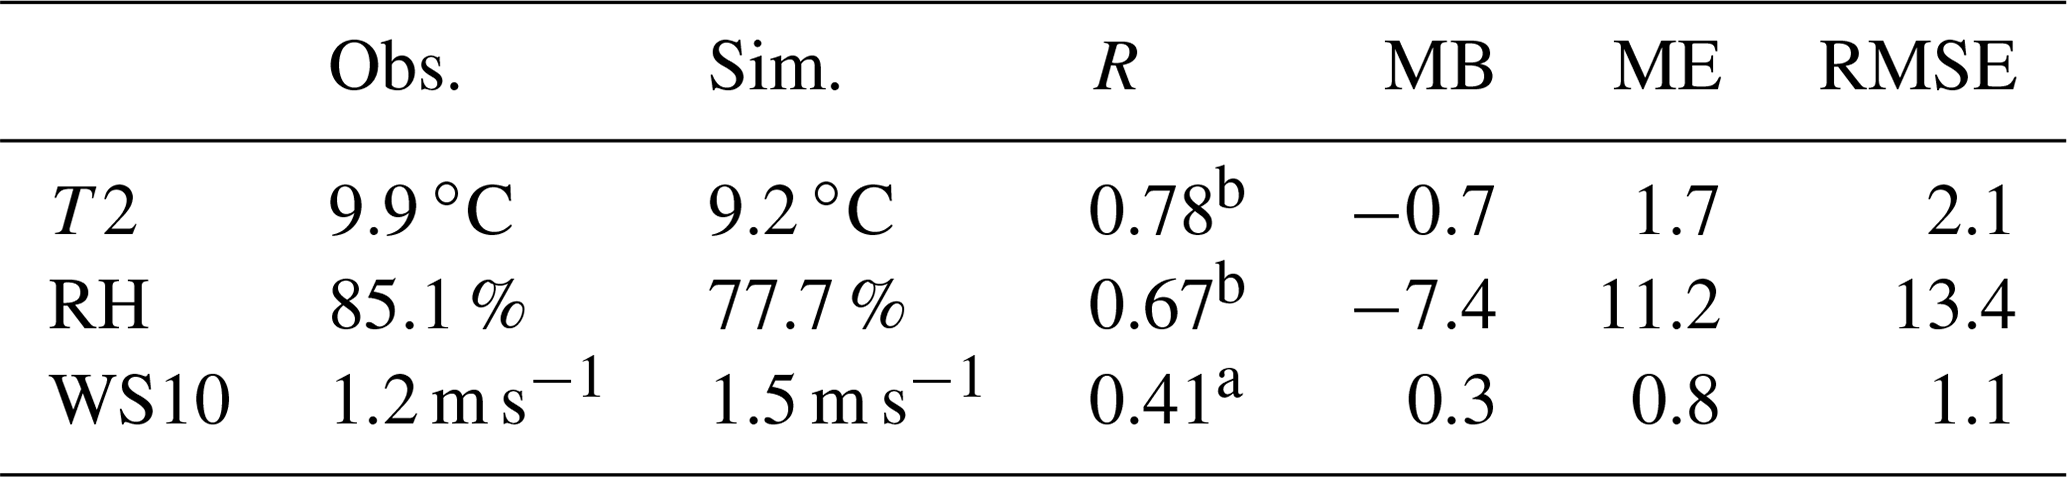
A reasonable simulation of meteorology is crucial for modeling variations in air pollutants (Hanna and Yang, 2001). The meteorological simulation was validated by comparing the model results with hourly surface meteorological observations of 2 m air temperature (T2), 10 m wind speed (WS10), and relative humidity (RH). The statistical metrics of comparisons between simulated and observed meteorological variables are given in Table 3, including the mean bias (MB), mean error (ME), and root mean squared error (RMSE). The verification metrics in Table 3 showed a reasonably good model performance with reference to previous studies (Emery et al., 2001; Chang and Hanna, 2004), although RH was slightly underestimated and wind speed was slightly overestimated. The statistical verification of the simulated surface PM2.5 concentrations are shown in Table 4 with the normalized mean bias (NMB), normalized mean error (NME), mean fractional bias (MFB), and mean fractional error (MFE) in two levels of light PM2.5 pollution (75–150 µg m−3) and heavy PM2.5 pollution (>150 µg m−3). In general, the verification suggested that the WRF-Chem simulations reasonably reproduced the meteorological conditions and the evolution of PM2.5 concentrations over the SCB within the criteria for regulatory applications (Emery et al., 2017).
Table 3Statistical metrics of comparisons between simulated (Sim.) and observed (Obs.) 2 m air temperature (T2), surface relative humidity (RH), and 10 m wind speed (WS10) with the correlation coefficient (R), mean bias (MB), mean error (ME), and root mean squared error (RMSE) during air pollution period between 2 and 7 January 2017.
Note: MB, ME, RMSE were calculated as follows:
;
; ; (M and O represented the results from
simulation and observation).
b and a, respectively, indicate the
correlation coefficients R passing the 99 % and 95 % significant test.
Table 4Statistical metrics of comparisons between simulated and observed surface PM2.5 concentrations in two levels of light and heavy PM2.5 pollution during 2–7 January 2017.
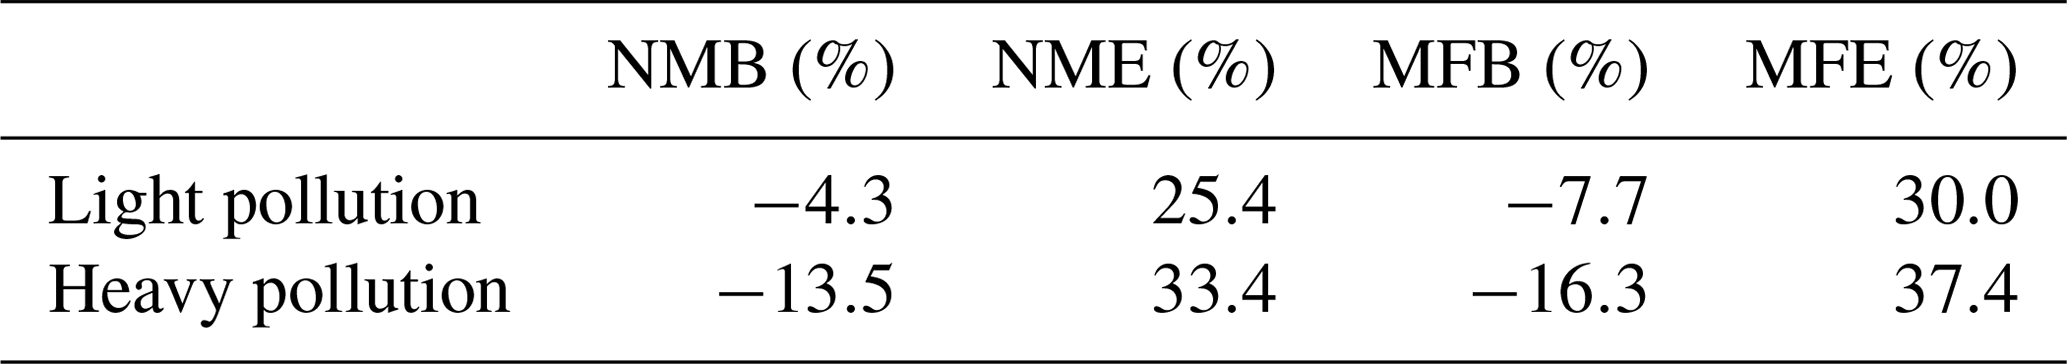
Note: NMB, NME, MFB and MFE were calculated as follows: %; %; %; %.
The vertical structure of the atmospheric boundary layer directly affects the vertical diffusion of atmospheric pollutants. Therefore, we compared the vertical profiles of the model simulation with the intensive sounding observations in terms of the variation range and average profiles during the heavy haze episode. Compared with the observed air temperature, the WRF-Chem simulations were evaluated to reasonably capture the vertical temperature profiles for understanding atmospheric stability in the vertical thermodynamic structures of the boundary layer over the SCB (Fig. S3 in the Supplement). The potential temperature, wind speed, and RH of the simulation were also validated for both daytime and nighttime, as shown in Fig. 5. The simulated vertical profiles of the meteorological variables were generally acceptable in the lower troposphere (Fig. 5). It should be noted that the significant underestimation of RH above 1 km, where the observed RH reached nearly 100 %, was caused by the clouds that formed with the abundant moisture at night, which the model failed to reproduce.
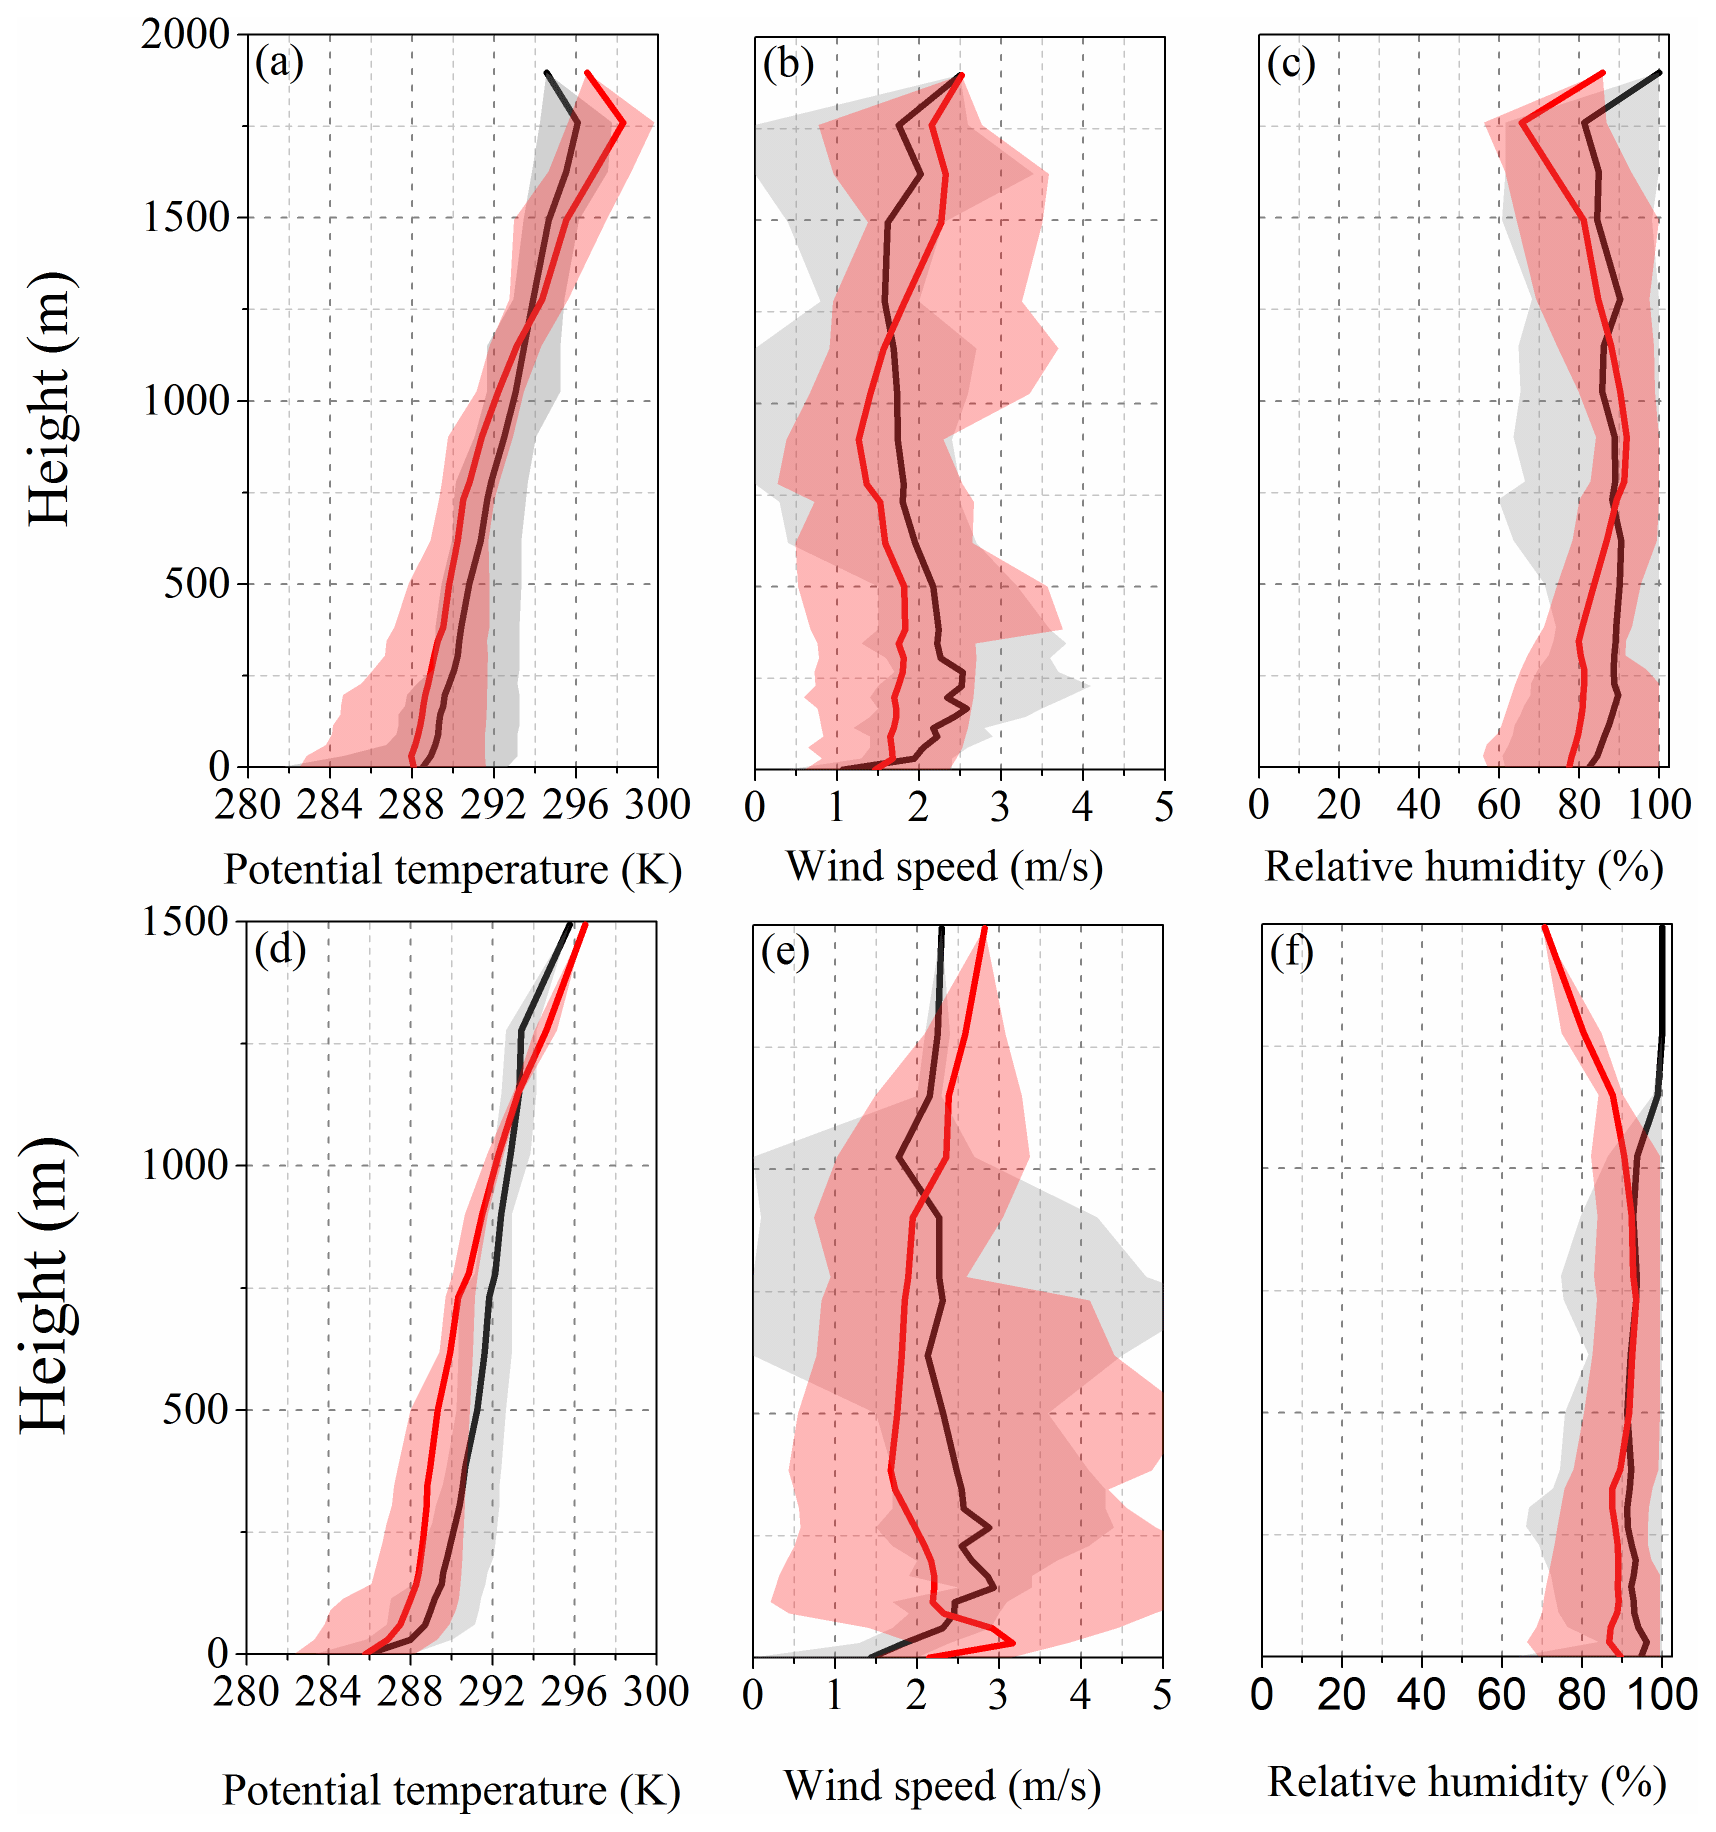
Figure 5Comparisons of observed and simulated vertical profiles of potential temperature, wind speed, and relative humidity in the daytime (a, b, c) and nighttime (d, e, f) at Chengdu (site 1 in Fig. 1) during 2–7 January 2017. The red and gray shaded areas represent the variation range of simulation and observation in all vertical profiles with averaged values (lines), respectively.
The MPL-4B lidar, located at site 15 (Fig. 1) on the western edge of the SCB to the east of the TP, continuously detected aerosol extinction ratios in the troposphere. The vertical distribution of the PM2.5 mass concentrations was derived from the extinction ratio (Ansmann et al., 2012; Córdoba-Jabonero et al., 2016). The height–time cross sections of the derived and simulated PM2.5 mass concentrations from 7:00 to 14:00 on 5 January 2017, are presented in Fig. 6. It can be seen that a good agreement between the lidar observation and the WRF-Chem simulation was achieved. One of the significant features is that in addition to the occurrence of near-surface high PM2.5, which is typical for most heavy haze pollution events over areas with a relatively flat terrain, a layer of high PM2.5 developed between 1 and 2 km above ground level (Fig. 6a), leaving a hollow layer between the two heavily polluted layers. The upper high PM2.5 layer was built due to the uplifting and then overturning of the air flows associated with the blocking effect of the TP terrain, which is addressed in the next section.
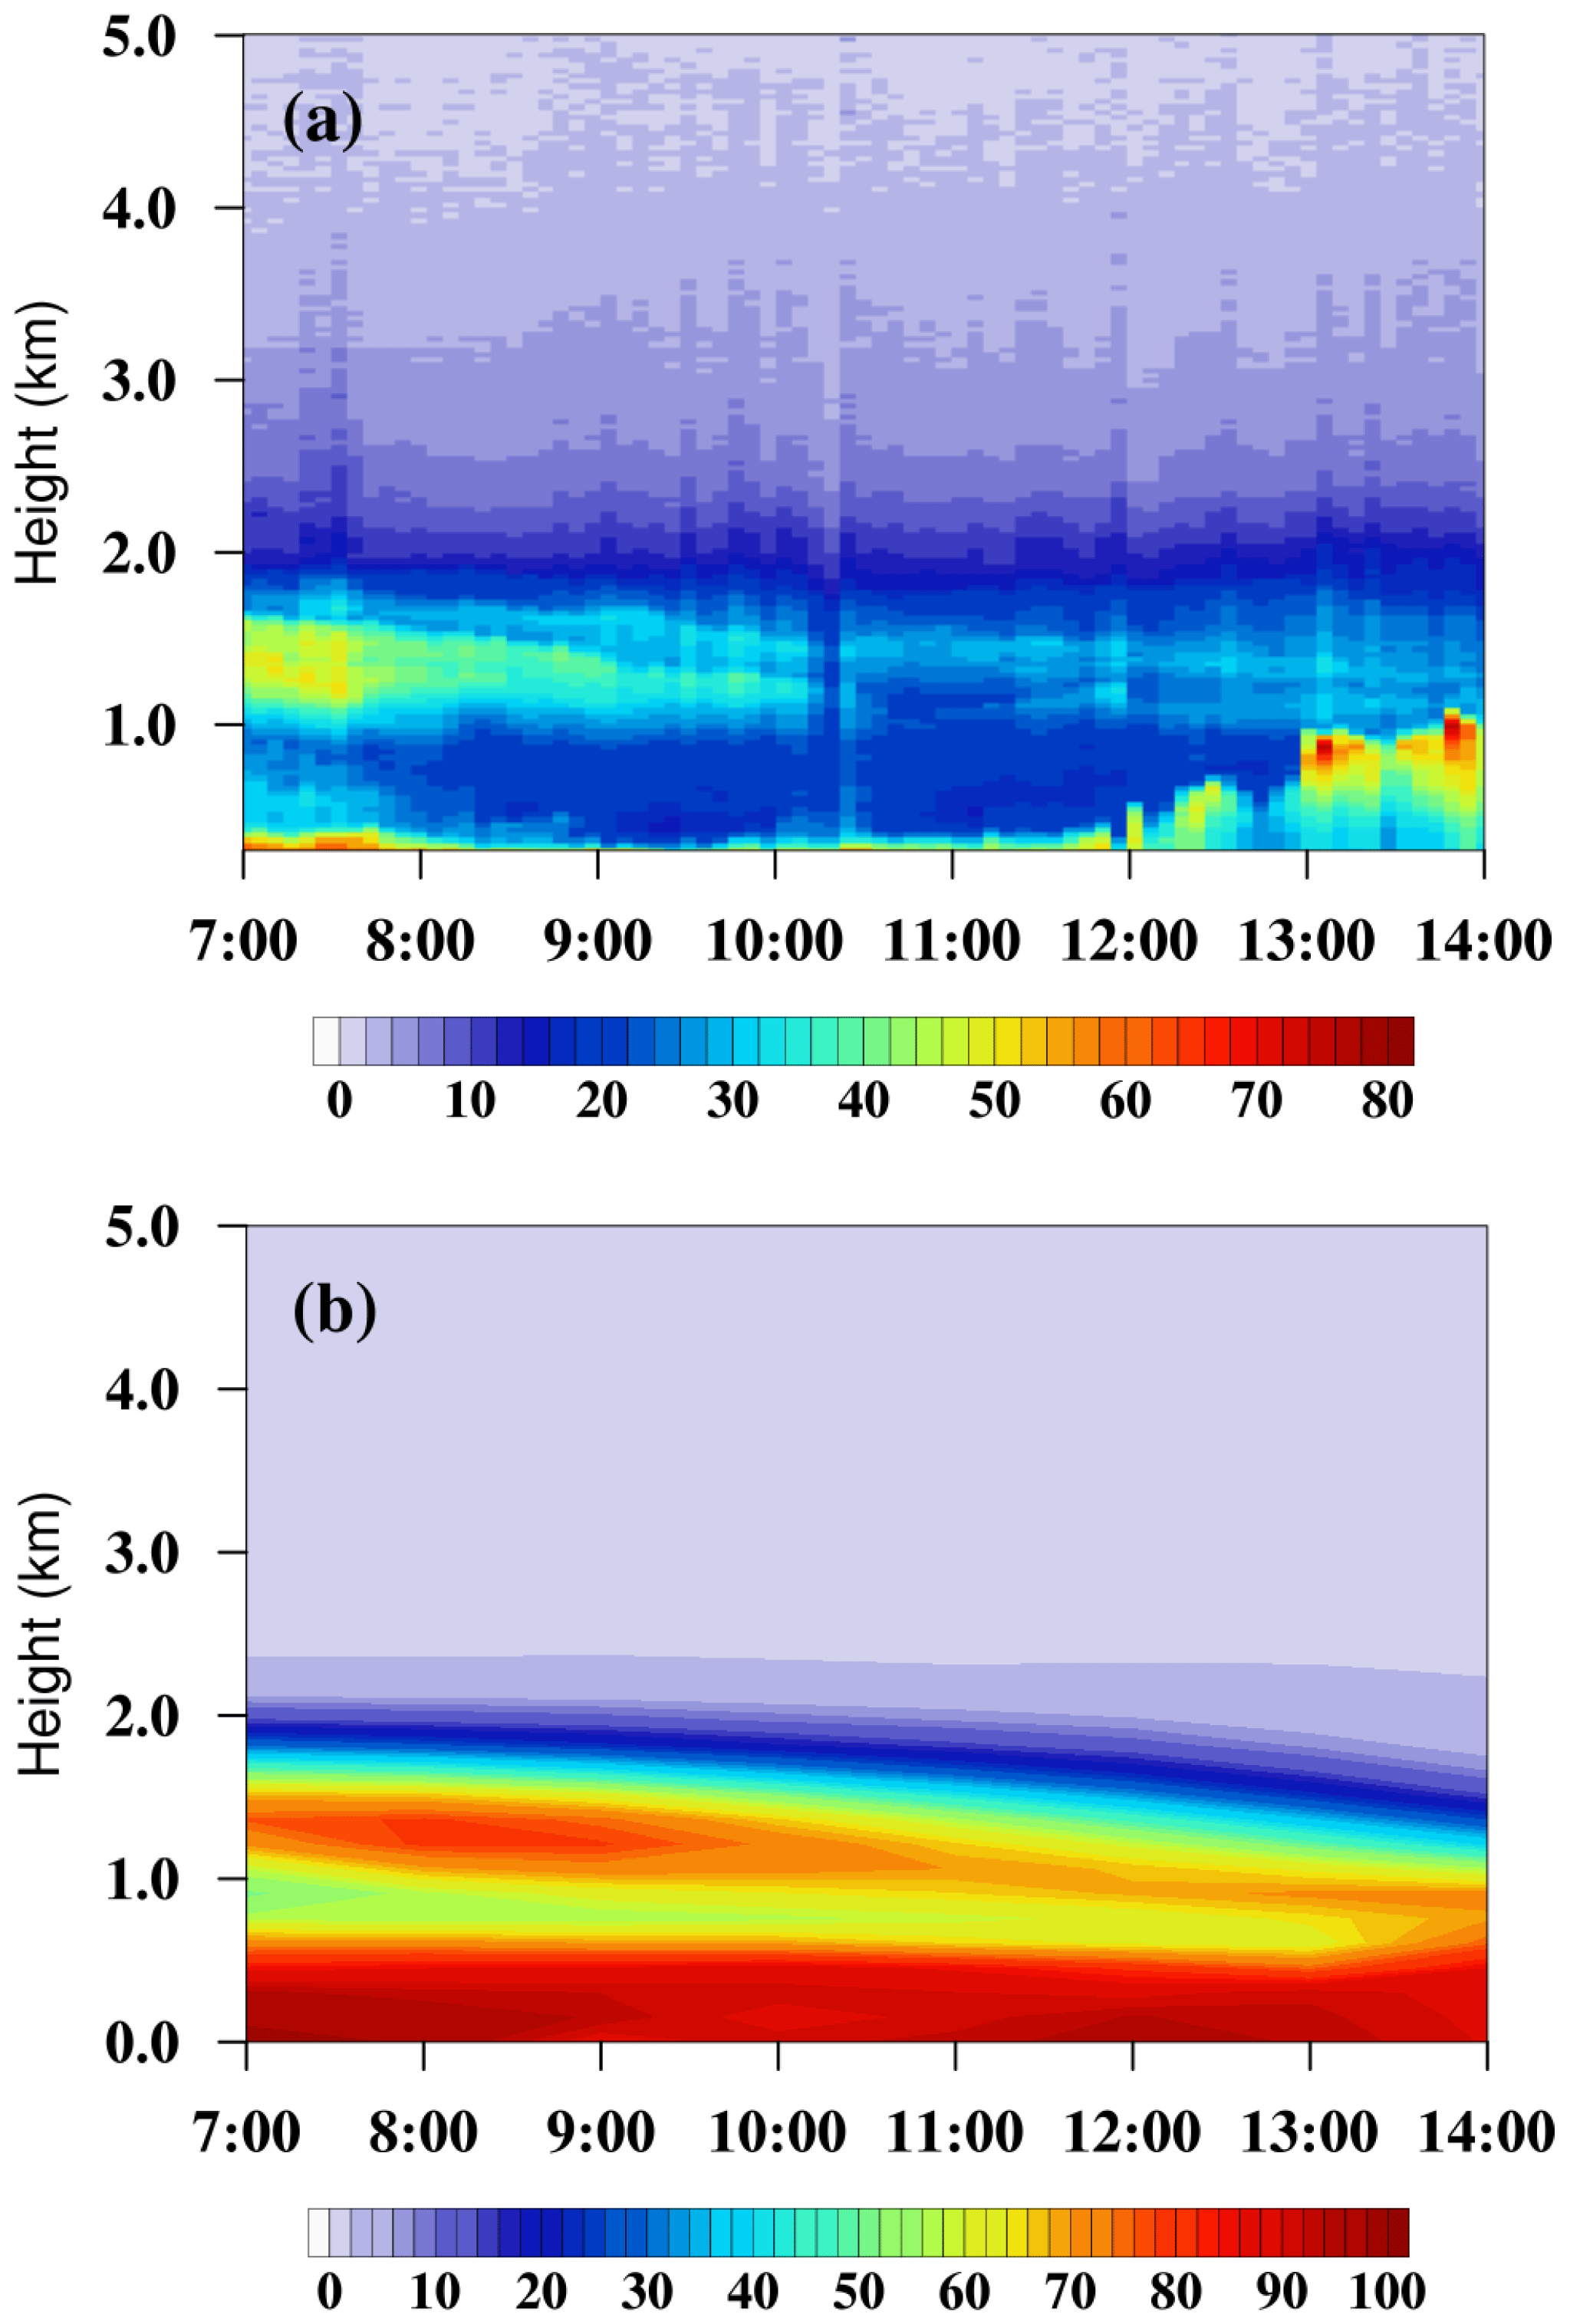
Figure 6Vertical and time cross sections of PM2.5 mass concentrations (µg m−3) from (a) MPL-4B retrieval products and (b) simulation results at site 15 (Fig. 1; Table 1) on the western SCB edge during 7:00–14:00 on 5 January 2017.
3.2 Surface PM2.5 concentrations
Figure 7 shows the simulated surface PM2.5 concentrations and near-surface wind fields during the formation, maintenance, and dissipation periods of 2–7 January 2017. The high PM2.5 concentrations were mostly centered in the northwest and southern SCB regions, featuring the Chengdu–Chongqing urban agglomeration (Fig. 1). The prevailing northeasterly winds strengthened gradually over the SCB from the P1 to the P2 and P3 periods (Fig. 7). The high plateaus and mountains, especially the YGP and TP to the west of the SCB, blocked the upcoming northeasterly winds. The spatial distribution of surface PM2.5 concentrations (Fig. 7) clearly reflects the combined effect of the urban anthropogenic air pollutant emissions and the PM2.5 accumulation by the flow convergence forced by the TP and the YGP blocking the prevailing winds. During the formation and maintenance stage, the surface winds were weak (1.4–1.7 m s−1) over the SCB and were insufficient to dispel the air pollutants but led to an accumulation of PM2.5 locally from light to heavy pollution conditions (Fig. 7a, b). During P2, heavy air pollution blanketed a large area in the SCB with excessive PM2.5 concentrations (mostly >150.0 µg m−3). During P3, the northeasterly winds intensified and removed PM2.5 from the SCB (Fig. 7c).
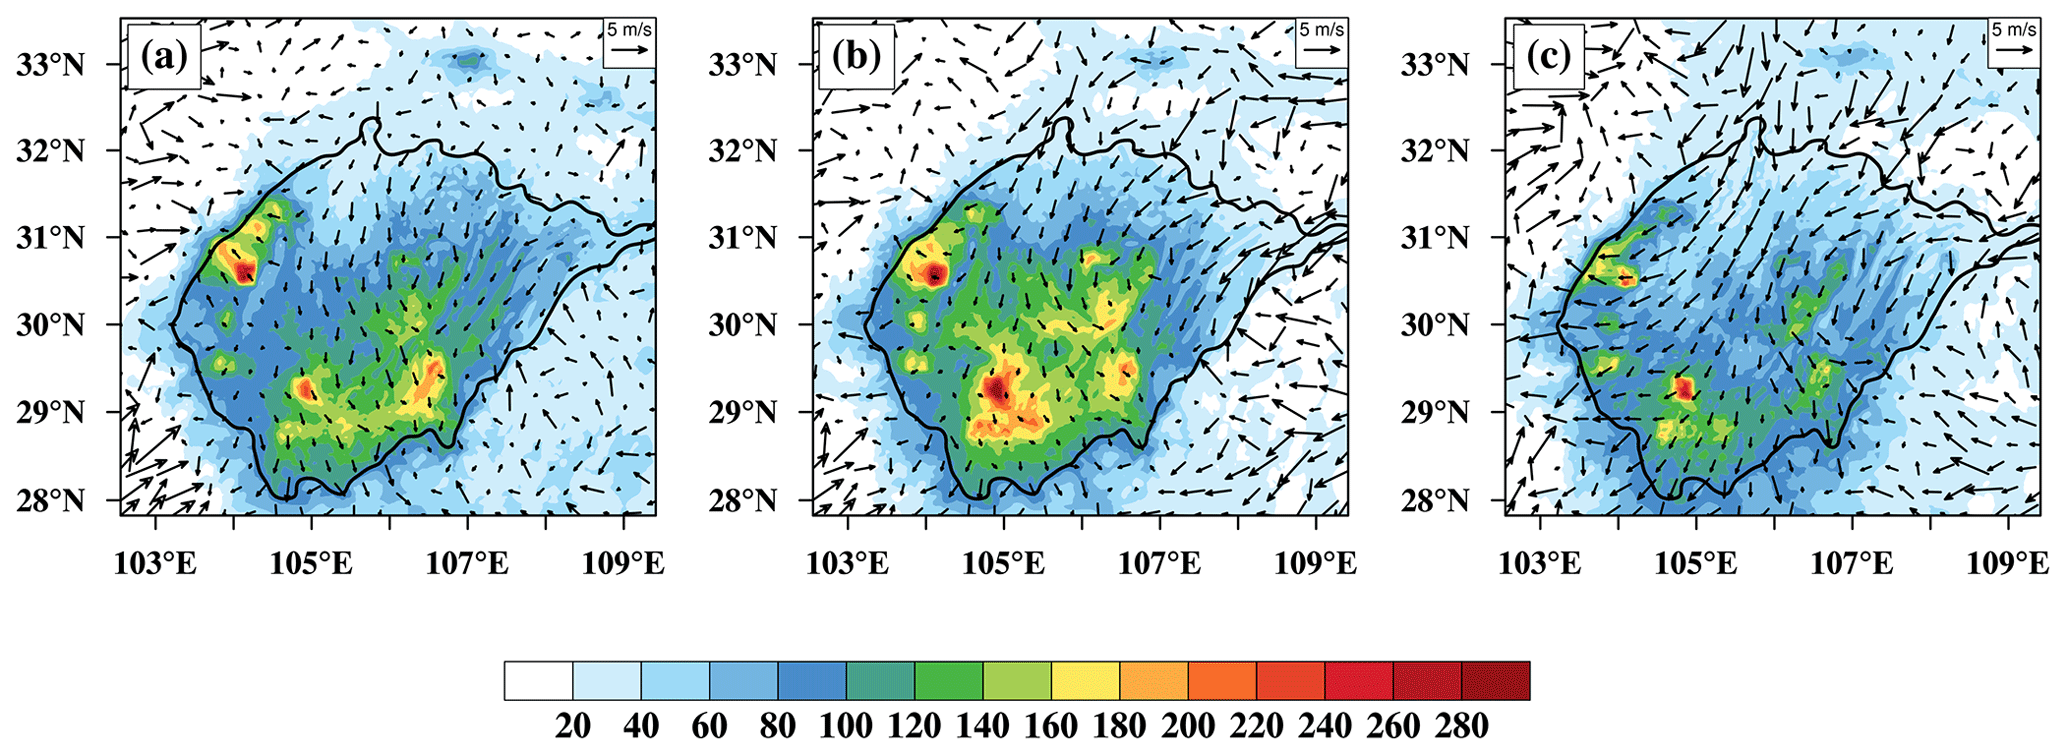
Figure 7Horizontal distribution of surface PM2.5 concentrations (µg m−3; color contours) and wind vectors at 10 m averaged in the periods (a) P1, (b) P2, and (c) P3, respectively. The SCB was outlined with an altitude contour line of 750 m (a.s.l.; black lines).
3.3 Vertical structures of PM2.5 concentrations
The high terrain of the YGP and TP blocked the northeastern airflows over the SCB by lifting the airflow along with air pollutants, altering the vertical PM2.5 distribution. Therefore, it was of great interest to analyze the vertical distribution and transport structures of PM2.5 over the SCB and the surrounding regions.
The terrain effect of the TP, the “world roof” on the mid-latitude westerlies, could modulate haze pollution in the downstream region over China (Xu et al., 2016). The SCB is immediately to the east of the TP, with a large elevation drop exceeding 3000 m over a short horizontal distance. The unique terrain-forcing circulations generate asymmetries in meteorological and air pollutant distributions over the SCB (Zhang et al., 2019). Chengdu (site 1: 104.02∘ E; 30.67∘ N), which is a metropolis in the SCB with high anthropogenic pollutant emissions and has the highest pollution levels in Southwest China (Ning et al., 2018b), is situated on the far west side of the SCB and was selected to better understand the elevated 3D structures of PM2.5. It is important to investigate how the urban surface high PM2.5 levels evolved vertically in the atmosphere with the combination of high urban emissions and the TP's terrain-forcing lifting over the SCB.
The distributions of PM2.5 and the atmospheric circulations in the vertical–meridional and vertical–zonal cross sections over the SCB and surrounding areas, respectively, are shown in Figs. 8 and 9 for a clean environment, formation, maintenance, and dissipation periods of the heavy haze pollution episode. A remarkable feature in the vertical distributions of PM2.5 was the unique hollows over the SCB region, between the two high PM2.5 layers at the surface and heights of 1.5–3 km. Similarly, PM2.5 elevated to the free atmosphere in a clean environment and dissipation periods and pressed down in formation and maintenance periods. The special phenomenon was developed by the interaction of atmospheric circulations in the free troposphere and topographic forcing in the boundary layer. In the atmospheric boundary layer, the lee side vortices often occur over the SCB owing to the effect of the large TP topography on the mid-latitude westerlies, which reinforces the vertical exchange of PM2.5 concentrations (Zhang et al., 2019). Meanwhile, a strong temperature inversion appeared and acted as a lid covering PM2.5 due to the trough of a low-pressure system (Ning et al., 2018a). In the current case, the variations of lee vortex circulation, working together with the basin near-surface flows, drove a 3D PM2.5 transport and its temporal changes over the SCB (Figs. 8–9).
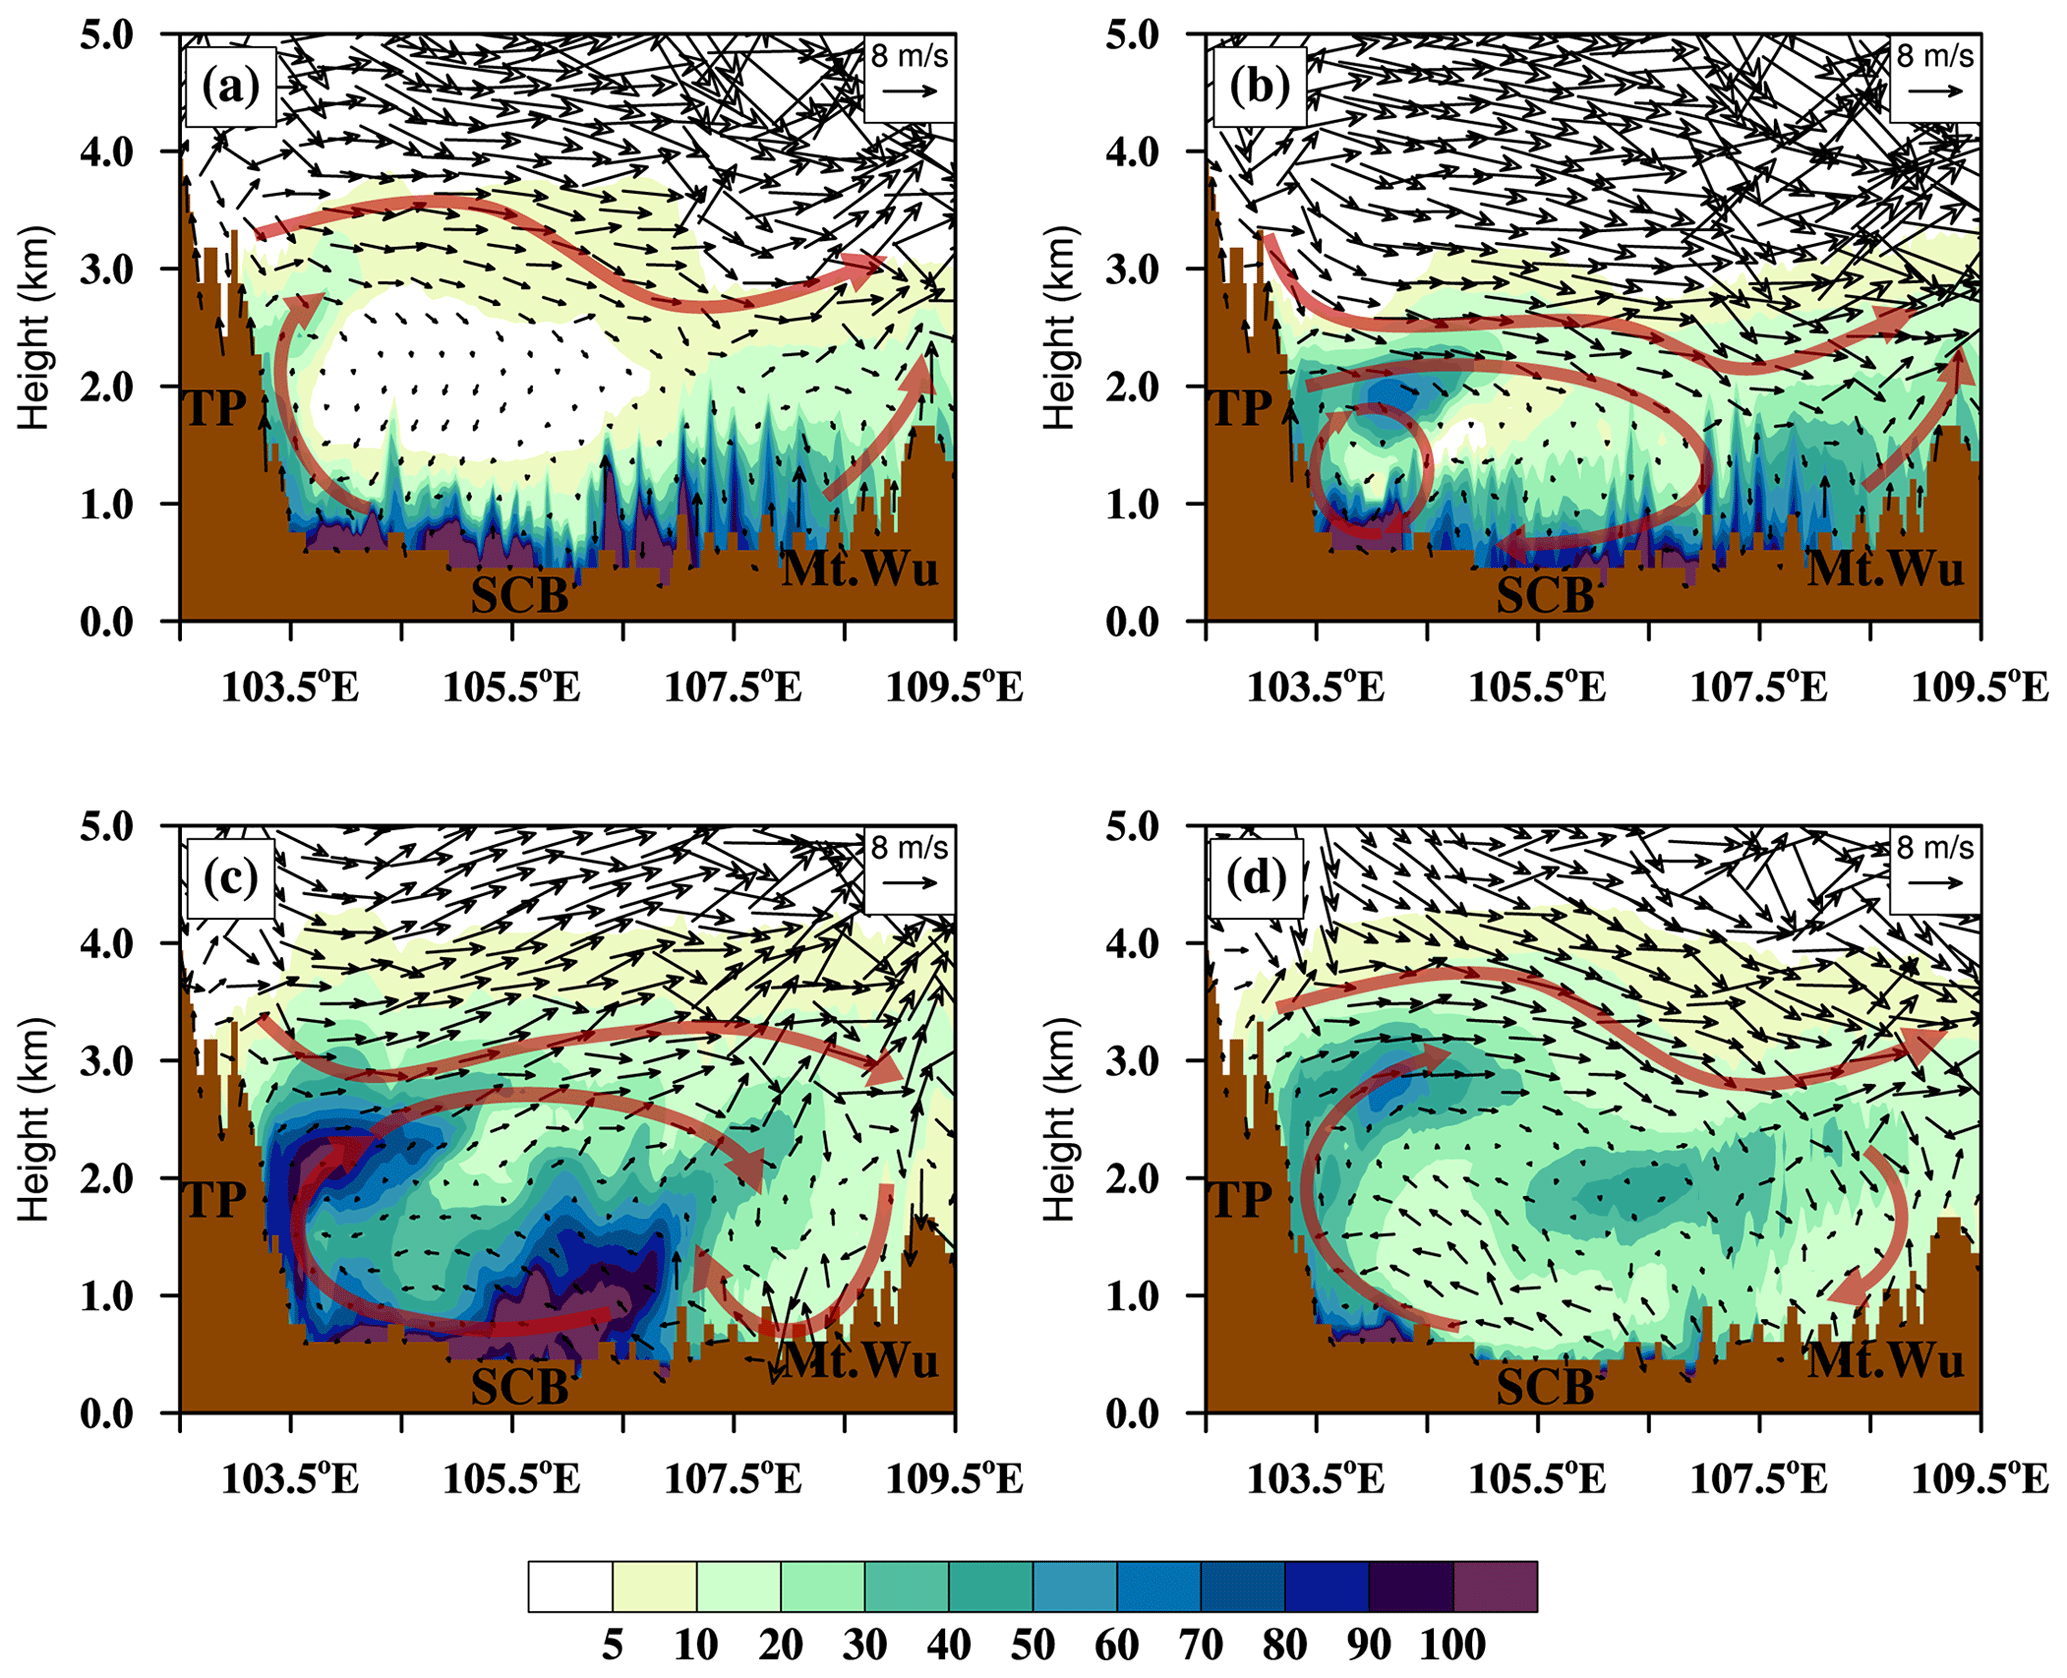
Figure 8Height–longitude cross sections of PM2.5 concentrations (color contours: µg m−3) and wind vectors along 30.67∘ N in the (a) clean environment at 12:00 on 2 January 2017, (b) heavy air pollution formation stage at 12:00 on 3 January 2017, (c) maintenance stage at 8:00 on 6 January 2017, and (d) dissipation stage at 8:00 on 7 January 2017. The brown arrows highlight the major air flows (red arrows) associated with the terrain of the TP, SCB, and Mt. Wu (filled brown areas).
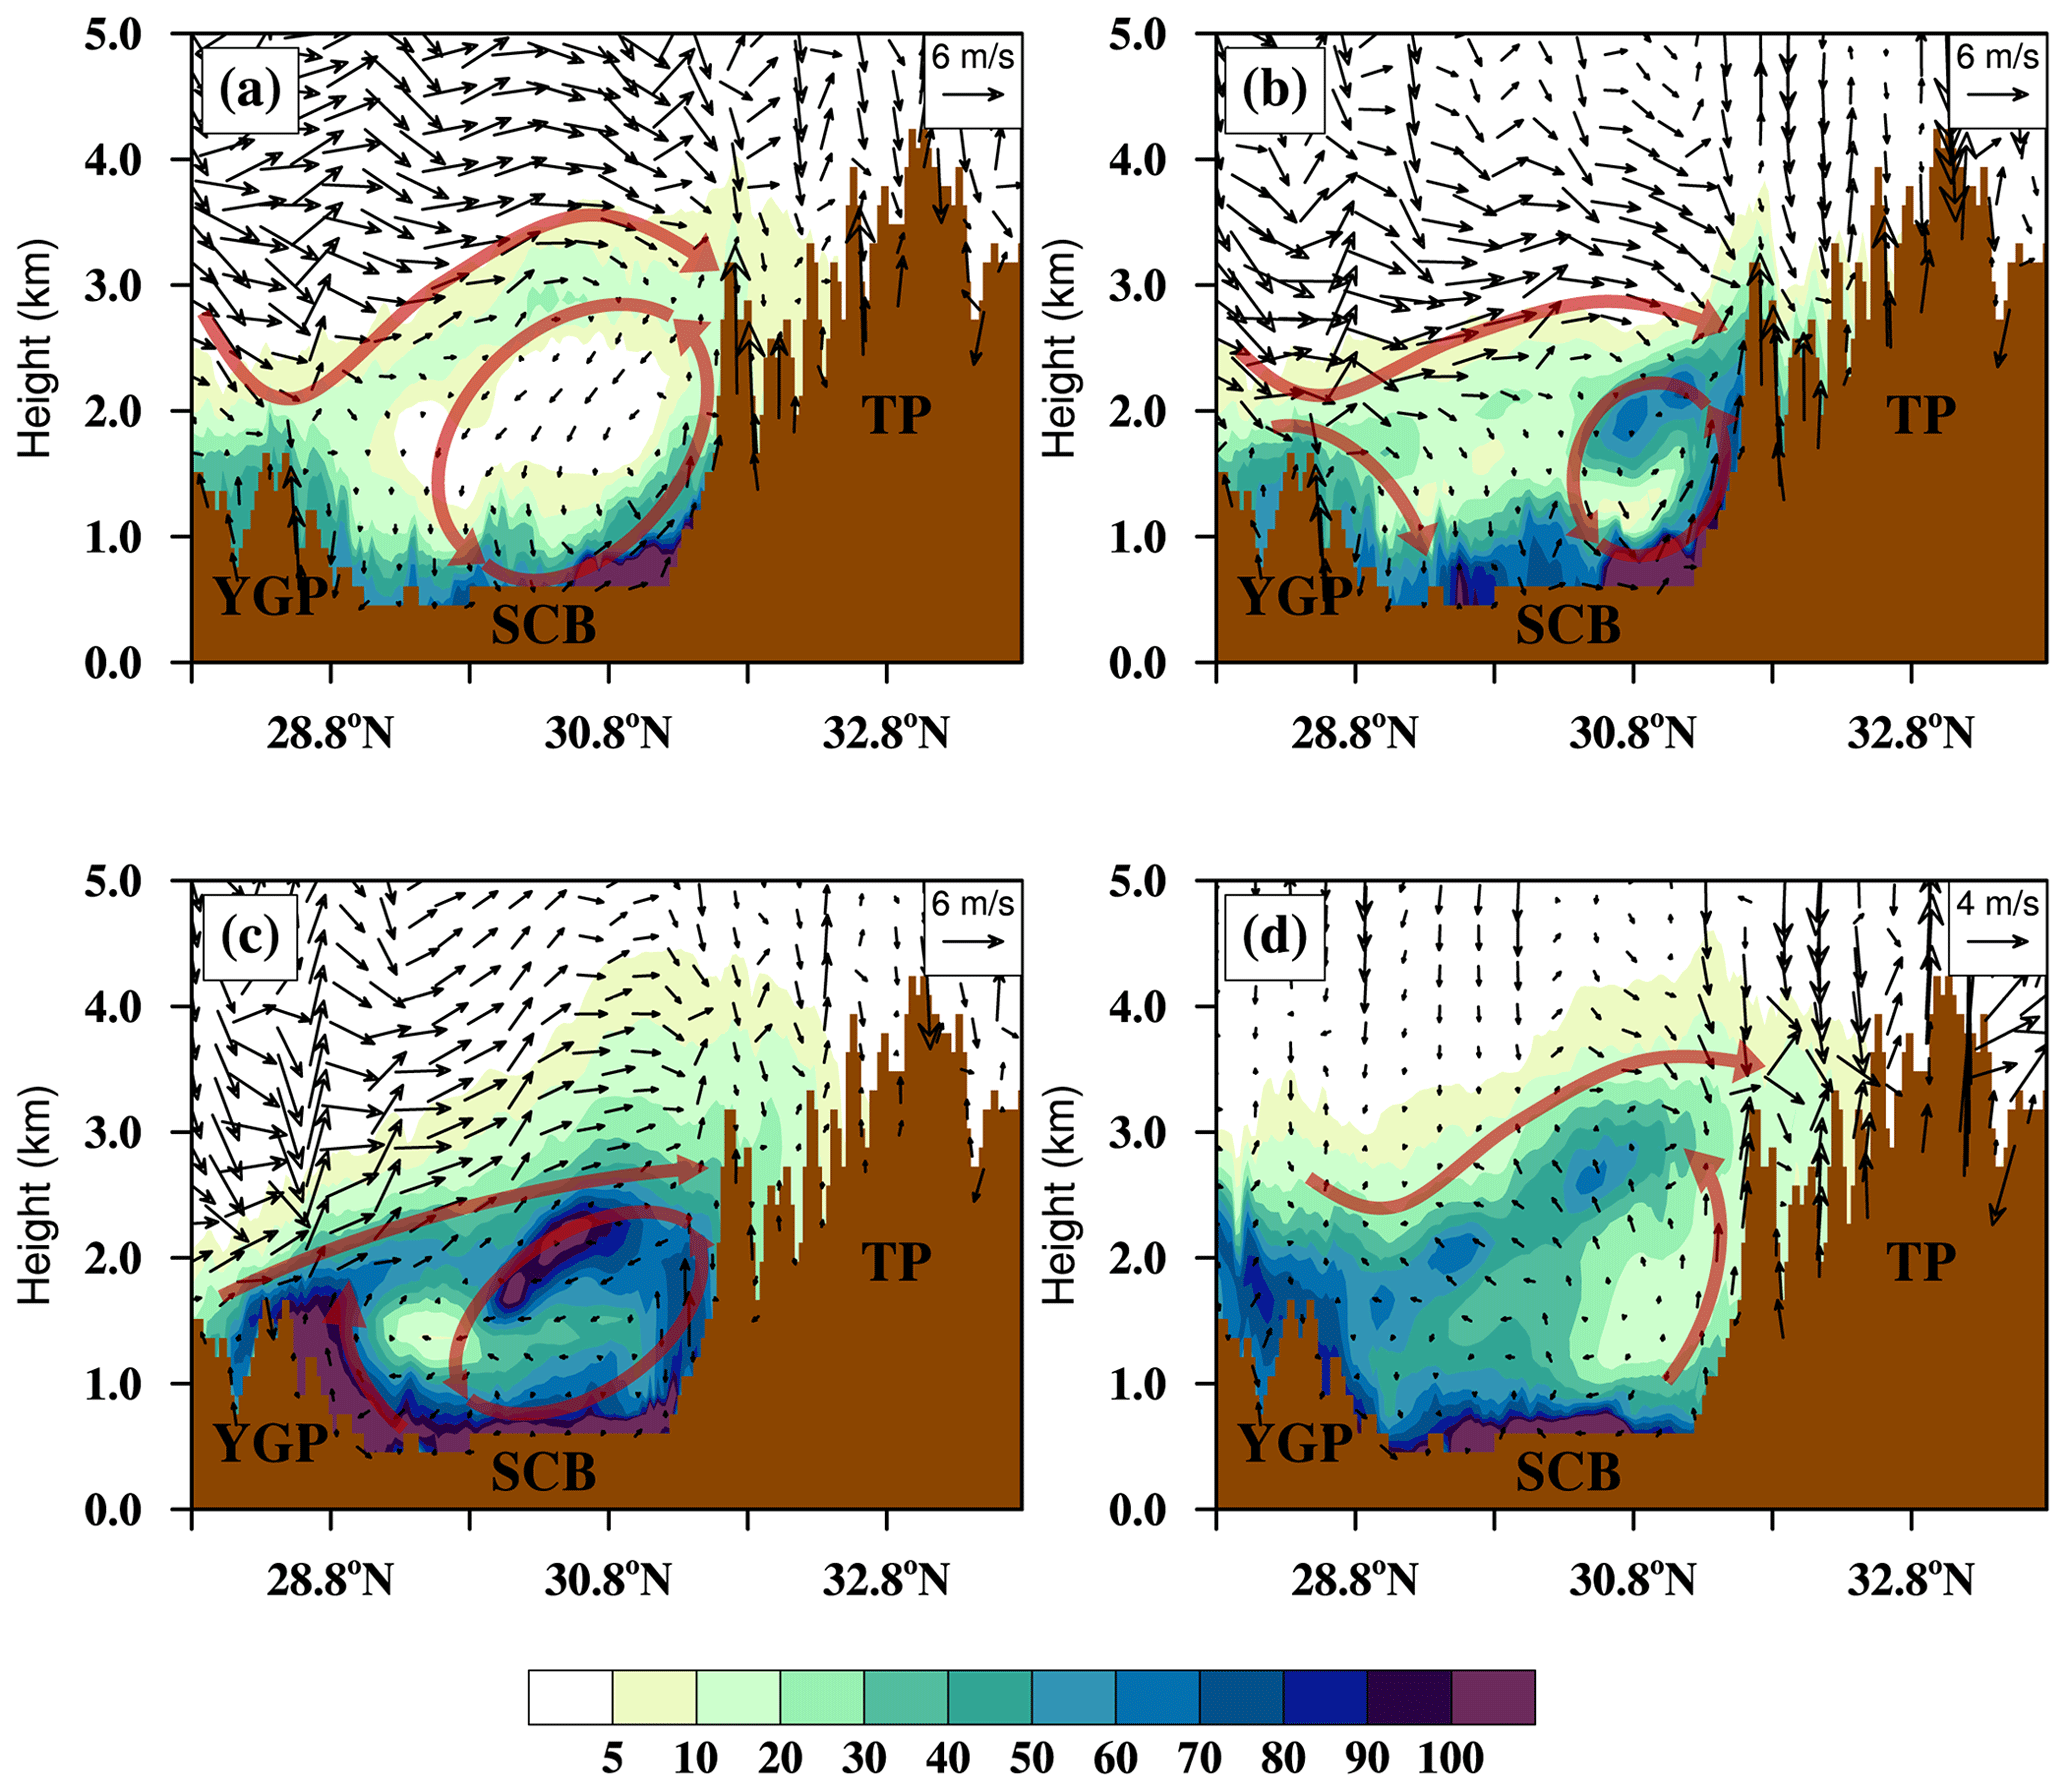
Figure 9Same as Fig. 8, but for height–latitude cross sections of PM2.5 concentrations and wind vectors.
Driven by the near-surface northeasterly winds (Fig. 7), the high concentrations of near-ground PM2.5 over the SCB were uplifted over the windward slopes of the TP and YGP, respectively. Comparing the vertical structures of PM2.5 and the circulations in different periods, the southwesterly wind prevailed at approximately 3 km height in the clean and dissipation stages (Figs. 8a, d, 9a, and d). It means that the elevated PM2.5 transport process in the free troposphere is a general pattern with the plateau–basin configuration over the SCB. By contrast, the so-called lid with a southwesterly wind in vortex circulation was pressed down to 2 km over the SCB. The uphill airflows were restrained and overturned below 2.5 km (a.s.l.), forming a well-structured vertical sub-circulation over the SCB region (Figs. 8b, c, 9b and c). Governed by the vertical sub-circulations, the downward transport from the high PM2.5 layers could replenish the surface PM2.5 concentrations in the northwest SCB with the addition of near-surface accumulation and maintenance of air pollutants. The sink momentum of vertical sub-circulation was weakened and confined PM2.5 exchange along with the eastern TP while the trough evolves into a low-pressure system (Figs. 3b, 8c and 9c). The cold air invasion with stronger near-surface northeasterly winds was steered by the movement of a westerly trough in the mid-troposphere during the dissipation stage of PM2.5 pollution (Figs. 3c, 8d and 9d). The haze pollution event over the SCB integrally indicated the formation of elevated PM2.5 structure and reconstruction of a trans-boundary transport pattern of PM2.5.
The TP and YGP lee vortices over the SCB also modify the vertical thermodynamical structures in the atmosphere (Xu et al., 2016), altering the height and intensity of the lid in stable stratification and covering air pollutants (Ning et al., 2018a). The potential temperature vertical gradients (Fig. 5), which are used for assessing atmospheric stability, were estimated with 4.0, 7.8, and 5.2 K km−1 in the boundary layer during the three periods of haze pollution with near-surface strong temperature inversion (Fig. S3 in the Supplement), presenting a thermodynamic structure with stable stratification in the atmospheric boundary layer, weakening the air pollutant dispersion.
The complex terrain-forcing circulations along the windward slopes of the TP and YGP, accompanying the lowering of westerlies lid, drove a remarkable hollow of PM2.5 sandwiched by a high PM2.5 layer in the free troposphere and a highly polluted near-surface layer in northwest SCB. It was also noted that the high PM2.5 concentrations over the SCB were transported to the downwind regions following westerlies by a special pathway above the atmospheric boundary layer.
3.4 Distribution of PM2.5 in the upper high-concentration layer
This section describes the characteristics of the upper-layer high PM2.5 concentrations. The PM2.5 concentrations were averaged between the heights of 1.5–2.5 km, as shown in Fig. 10. Compared with the surface PM2.5 concentrations, the PM2.5 concentrations decreased significantly in the lower free troposphere (Figs. 7 and 10), reflecting the important role of surface air pollutant emissions in the atmospheric environment over the SCB. During the formation period of a heavy air pollution event, the PM2.5 particles in the free troposphere were concentrated in the northwestern SCB (Fig. 10a). During P2, high PM2.5 centers were developed in the northwestern SCB edge, and PM2.5 concentrations increased in the southwestern and central SCB regions (Fig. 10b), reflecting the strong vertical diffusion of PM2.5 in the lower troposphere during the heavy air pollution periods (Figs. 8c and 9c). Driven by strong northeasterly winds during P3 (Fig. 7c), the high PM2.5 concentrations in the lower free troposphere were centered in the narrow southwestern and southern SCB areas (Fig. 10c), where PM2.5 from the polluted SCB region was transported out from the gap between the eastern TP and northern YGP edge.
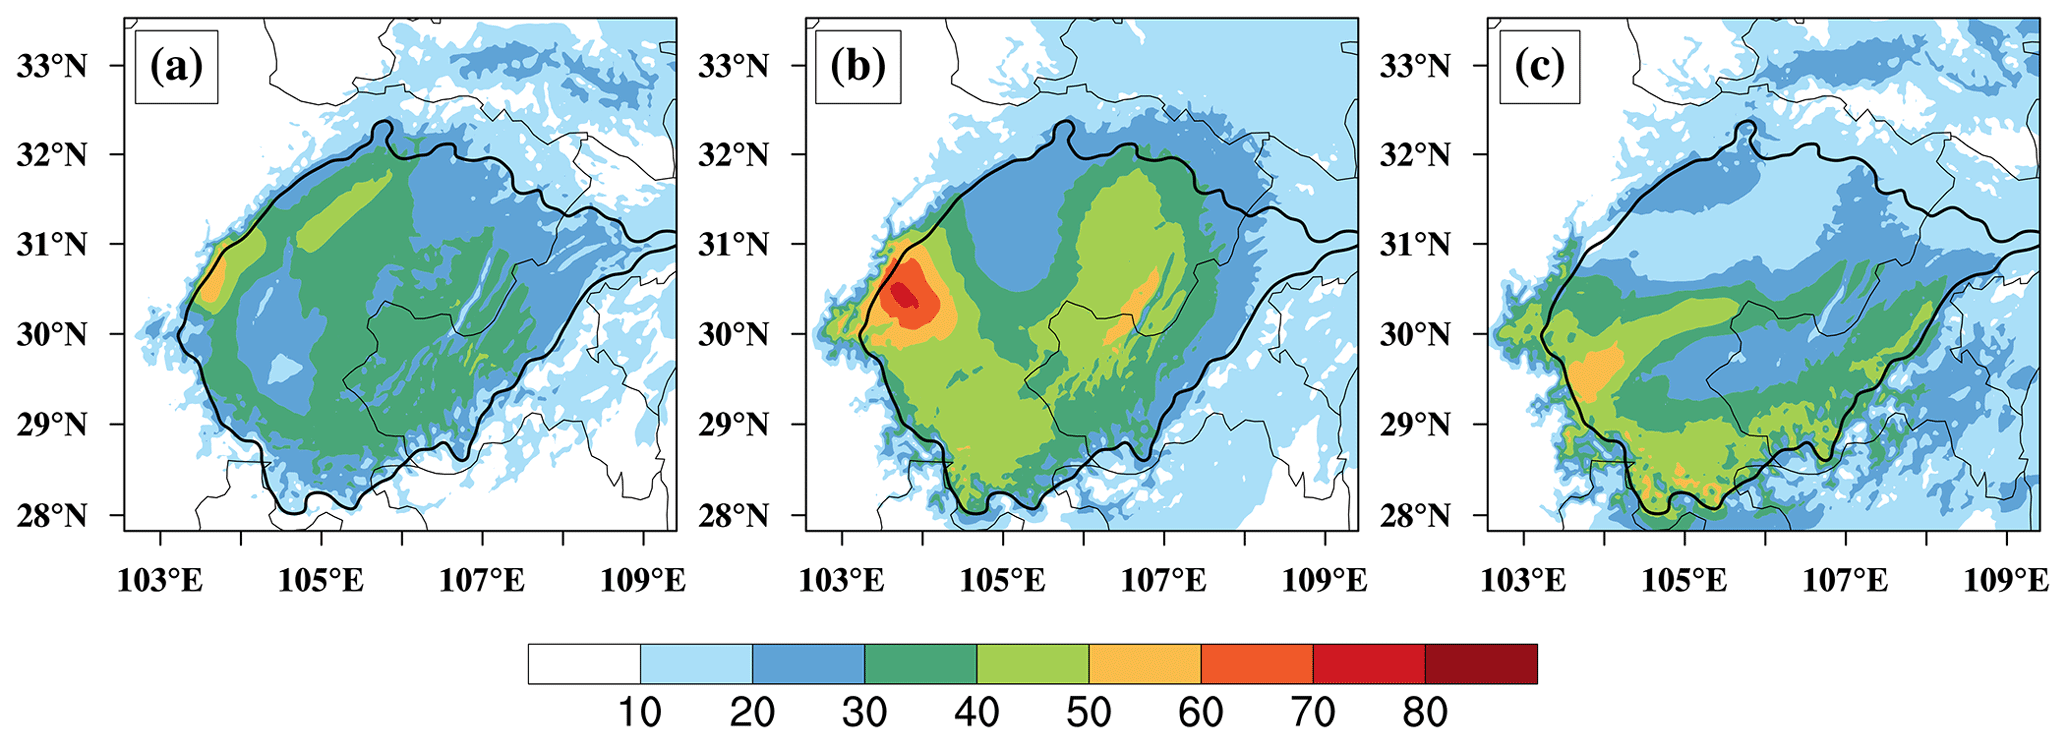
Figure 10Horizontal distribution of PM2.5 concentrations (color contours: µg m−3) averaged between 1.5 and 2.5 km heights (in the lower free troposphere) for (a) formation, (b) maintenance, and (c) dissipation periods of a heavy haze pollution event over the SCB. The SCB was outlined with an altitude contour of 750 m in a.s.l. (dark black lines).
3.5 Contribution of local emission and outflow transport
Local emissions and regional transport of air pollutants are the two key factors that affect air quality. The SCB region in the northeastern part of Southwest China, characterized by a deep-bowl structure, is isolated by plateaus (the TP in the west and the YGP in the south) and mountains with a clean atmospheric environment. Haze pollution events with extremely high PM2.5 concentrations over the SCB are ascribed to the accumulation of local anthropogenic pollutants and air pollutant transport over the basin (H. Wang et al., 2018a; Qiao et al., 2019; Zhao et al., 2019). High local anthropogenic emissions in the SCB dominate regional air pollution over the SCB (Liao et al., 2017). The transport of air pollutants from neighboring countries in South Asia is mostly concentrated in the neighboring regions of the southern TP and southern YGP (H. Wang et al., 2018a; Zhao et al., 2019; Yin et al., 2020). Therefore, the anthropogenic emission data of South Asia are not included in the WRF-Chem simulation due to a negligible contribution of air pollutant transport from South Asia northward to the wintertime air pollution over the SCB, driven by the prevailing northeasterly winds during Asian winter monsoon season. Here, the differences in PM2.5 concentrations between the numerical experiments, Emi-Real and Emi-Non, were analyzed to assess the contribution of regional air pollutant emissions to surface PM2.5 concentrations in the SCB and the impact of PM2.5 transport from the SCB to the surrounding plateaus and mountains.
Figure 11 shows the PM2.5 concentrations originating from local emissions of primary PM2.5, gaseous precursors of PM2.5 over the SCB, and the relative contribution rates to air pollution changes. The SCB's regional air pollutant emissions provided surface PM2.5 from 40.6 to 136.2 µg m−3, contributing 75.4 %–94.6 % of the total concentration for the heavy pollution episode over the SCB. This indicates the dominant role of local air pollutant emissions on air quality changes over this isolated deep basin in Southwest China. The surface PM2.5 concentrations sourced from the regional air pollutant emissions over the SCB were averaged, with 88.64, 91.04, and 65.96 µg m−3 for P1, P2, and P3, respectively. However, interestingly, the average contribution rates of regional air pollutant emissions to surface PM2.5 concentrations in the SCB actually decreased from 90.7 % in P1 to 85.6 % in P2 and 83.3 % in P3 (Fig. 11). This could be attributed to the exchanges between the PM2.5-rich air mass over the SCB and PM2.5-poor air mass in the surrounding plateaus and mountains over Southwest China (Figs. 8 and 9).

Figure 11Hourly variations of surface PM2.5 concentrations originating from the SCB's anthropogenic emissions (blue filled areas) and the contribution proportions to the basin surface PM2.5 levels (red curve) during 1–7 January 2017 based on the regional averages over the SCB.
To assess the impact of the PM2.5 transport from the SCB on the air quality over the surrounding areas in Southwest China, we calculated the contribution and rates of the SCB's regional air pollutant emissions to the PM2.5 concentrations in the adjoining regions in the plateaus and mountains based on the differences in PM2.5 concentrations between Emi-Real and Emi-Non (Table 5). The near-surface prevailing northeasterly winds of the SCB brought PM2.5 from the SCB to the eastern TP edge, the northern YGP edge, and the DBM region (Fig. 7), resulting in an increase in the concentrations of surface PM2.5 during the heavy haze pollution event, with averages of 18.0, 31.3, and 10.4 µg m−3, respectively (Table 5). The TP and YGP, the cleaner regions in China (Song et al., 2017; Zhan et al., 2018), received significant pollution due to the PM2.5 transport from the SCB. During the dissipation period of the heavy air pollution episode, the eastern TP edge and northern YGP regions gained peak imports of PM2.5 at 22.5 and 41.9 µg m−3 (Table 5). Thus, in this case, the downwind adjoining the TP and YGP regions was the main receptor area of the SCB emissions.
Table 5Amounts and contribution rates of PM2.5 trans-boundary transport from the SCB to surface PM2.5 concentrations averaged over the eastern TP edge (ETP), northern YGP edge (YGP), and DBM region during the formation (P1), maintenance (P2), and dissipation (P3) periods of the heavy haze pollution event over the SCB region.
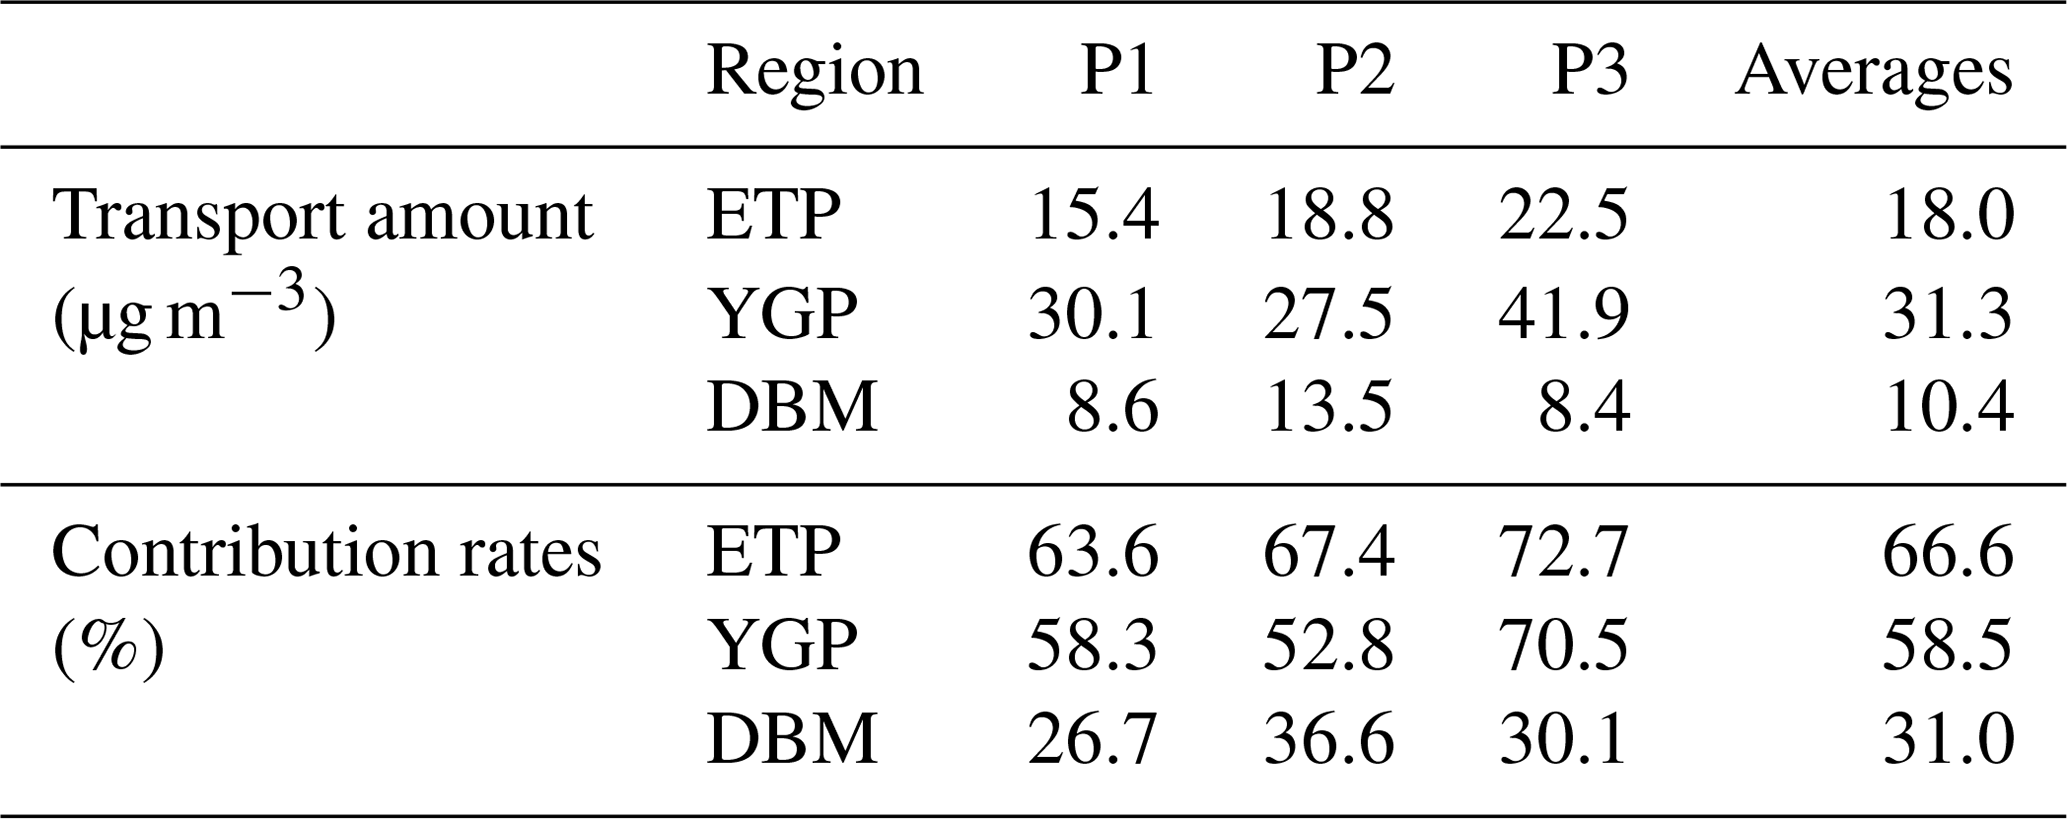
Finally, the PM2.5 contribution rates, i.e., the percentage of the PM2.5 concentrations transported from the basin to those in the adjacent regions of plateaus and mountains, were calculated for different periods of the heavy PM2.5 pollution event over the SCB. The surface PM2.5 in the eastern TP edge mostly originated from the source region of the SCB, with dominant contribution rates of 63.6 %, 67.4 %, and 72.7 % in the formation, maintenance, and dispersion periods, respectively. The PM2.5 imported from the SCB pollutant emissions also contributed to the majority of surface PM2.5 concentrations in the northern YGP, with contribution rates of 58.3 %, 52.8 %, and 70.5 % during the three periods, with an overall contribution rate of 58.5 % (averaged for the entire SCB heavy air pollution event). In contrast, the DBM region was less influenced by the SCB's emission sources, with a contribution rate of 31.0 % (averaged during the heavy air pollution event).
By using multiple ground observations, meteorological sounding data, and micropulse lidar retrievals as well as conducting modeling experiments with the WRF-Chem model, this study investigated the 3D structures and the development mechanisms of the PM2.5 for a wintertime heavy haze pollution event over the SCB, an isolated deep basin in Southwest China. The roles of the basin pollutant emissions and the unique basin circulations were evaluated for their contributions to the 3D distribution of PM2.5 over the SCB and to the neighboring YGP, TP, and DBM regions.
The vertical structure of PM2.5 in the lower troposphere over the SCB was characterized by unique hollows located between a high PM2.5 layer at a height of 1.5–3 km and a high PM2.5 surface layer. The hollow was developed by the interaction of the upper-level free tropospheric circulations and the lower-level topographic boundary layer. The southwesterlies passing over the TP and YGP resulted in a lee vortex over the SCB, which helped form and maintain high PM2.5 concentrations, with well-developed vertical secondary circulations along the eastern TP upslope, whereas the southwesterlies with the underlying high PM2.5 layers were elevated in the dissipation of heavy PM2.5 pollution over the SCB.
Due to the joint impact of the urban anthropogenic air pollutant emissions and the large terrain blocking flow at the eastern TP slope and YGP, high surface PM2.5 concentrations were mostly distributed in the northwestern and southern SCB regions. The tropospheric circulations, which altered the vertical diffusion of PM2.5, exerted a strong impact on PM2.5 distribution in the lower free troposphere. The high PM2.5 centers in the lower free troposphere were distributed over the northwestern and southwestern SCB edges, as well as the central SCB regions. Driven by strong northeasterly winds in the dissipation period, PM2.5 in the lower free troposphere converged to the west boundary of the SCB and then was transported to the eastern TP edge and the northern YGP edge areas.
The regional emissions of air pollutants in the SCB played a dominant role in the formation of heavy air pollution, contributing 75.4 %–94.6 % to surface PM2.5 concentrations over the basin for the heavy pollution event studied herein. Furthermore, the surface PM2.5 concentrations in the eastern TP were mostly transported from the SCB's emission sources, with contribution rates of 63.6 %, 67.4 %, and 72.7 % for P1, P2, and P3, respectively. Similarly, the SCB also contributed the majority of surface PM2.5 concentrations in the adjacent northern YGP, with an average contribution rate of 58.5 % for the whole SCB pollution period and a very high contribution of 70.5 % during the dissipation period. Therefore, the SCB region is the major source of air pollutants for the downwind receptor areas over the adjoining TP and YGP regions and affects the atmospheric environmental changes in Southwest China.
This study highlights the unique and important 3D structures of PM2.5 and investigated their formation mechanisms and downwind outflow transport over the SCB. The deep basin terrain along with the TP and YGP forcing effect creates very complex PM2.5 pollution conditions over the SCB region, which is significantly different from those over relatively flat regions. To generalize our findings, further work with more case studies and regional climatic analyses with long-term observation data and numerical modeling with data assimilation and refined physical and chemical schemes are required. MEIC 2017 was not available for the WRF-Chem model. The SCB is located in Southwest China, with larger uncertainties in the anthropogenic emission inventory compared to eastern China. An accurate emission inventory could improve air pollution simulations and air quality change assessments in future studies. Furthermore, as pointed out in this study, the PM2.5 emission sources in the SCB greatly influence the regional environmental changes in Southwest China. Thus, the regional transport modeling of air pollutants with careful consideration of the thermal and dynamic forcing of the underlying complex plateau terrain should be further investigated.
Data used in this paper can be provided by Zhuozhi Shu (shuzhuozhi@foxmail.com) upon request.
The supplement related to this article is available online at: https://doi.org/10.5194/acp-21-9253-2021-supplement.
ZS and TZ conducted the study design. ZS, TZ, JX, CW and LC conducted the vertical observational experiment. ZS wrote the manuscript with the help of TZ and YLiu. LZ and YZ assisted with data processing. HW and LS were involved in the scientific interpretation and discussion. LL and YLi provided the surface meteorological data. All of the authors provided commentary on the paper.
The authors declare that they have no conflicts of interest.
We greatly acknowledge the reviewers for their constructive suggestions. Also we thank the European Centre for Medium-range Weather Forecasts for the ERA-Interim reanalysis dataset and the China National Environmental Monitoring Center for the air quality data in this study.
This research has been supported by the National Key R & D Program Pilot Projects of China (grant no. 2016YFC0203304), the Second Tibetan Plateau Scientific Expedition and Research (STEP) program (grant no. 2019QZKK0105), the National Natural Science Foundation of China (grant nos. 91744209, 91644223 and 91544109), and the Graduate Research and Innovation Projects of Jiangsu Province (grant no. SJKE19_0941).
This paper was edited by Jerome Brioude and reviewed by two anonymous referees.
Ansmann, A., Seifert, P., Tesche, M., and Wandinger, U.: Profiling of fine and coarse particle mass: case studies of Saharan dust and Eyjafjallajökull/Grimsvötn volcanic plumes, Atmos. Chem. Phys., 12, 9399–9415, https://doi.org/10.5194/acp-12-9399-2012, 2012.
Bei, N., Li, X., Tie, X., Zhao, L., Wu, J., Li, X., Liu, L., Shen, Z., and Li, G.: Impact of synoptic patterns and meteorological elements on the wintertime haze in the Beijing-Tianjin-Hebei region, China from 2013 to 2017, Sci. Total Environ., 704, 135210, https://doi.org/10.1016/j.scitotenv.2019.135210, 2019.
Cai, W., Li, K., Liao, H., Wang, H., and Wu, L.: Weather conditions conducive to Beijing severe haze more frequent under climate change, Nat. Clim. Change, 7, 257–262, https://doi.org/10.1038/nclimate3249, 2017.
Chang, J. C. and Hanna, S. R.: Air quality model performance evaluation, Meteorol. Atmos. Phys., 87, 167–196, https://doi.org/10.1007/s00703-003-0070-7, 2004.
Chen, F. and Dudhia, J.: Coupling an Advanced Land Surface–Hydrology Model with the Penn State–NCAR MM5 Modeling System. Part I: Model Implementation and Sensitivity, Mon. Weather Rev., 129, 569–585, https://doi.org/10.1175/1520-0493(2001)129<0569:CAALSH>2.0.CO;2, 2001.
Chen, Y. and Xie, S.: Temporal and spatial visibility trends in the Sichuan Basin, China, 1973 to 2010, Atmos. Res., 112, 25–34, https://doi.org/10.1016/j.atmosres.2012.04.009, 2012.
Chen, Y., Xie, S., Luo, B., and Zhai, C.: Characteristics and origins of carbonaceous aerosol in the Sichuan Basin, China, Atmos. Environ., 94, 215–223, https://doi.org/10.1016/j.atmosenv.2014.05.037, 2014.
Córdoba-Jabonero, C., Andrey-Andrés, J., Gómez, L., Adame, J. A., Sorribas, M., Navarro-Comas, M., Puentedura, O., Cuevas, E., and Gil-Ojeda, M.: Vertical mass impact and features of Saharan dust intrusions derived from ground-based remote sensing in synergy with airborne in-situ measurements, Atmos. Environ., 142, 420–429, https://doi.org/10.1016/j.atmosenv.2016.08.003, 2016.
Dawson, J. P., Adams, P. J., and Pandis, S. N.: Sensitivity of PM2.5 to climate in the Eastern US: a modeling case study, Atmos. Chem. Phys., 7, 4295–4309, https://doi.org/10.5194/acp-7-4295-2007, 2007.
Emery, C., Liu, Z., Russell, A. G., Odman, M. T., Yarwood, G., and Kumar, N.: Recommendations on statistics and benchmarks to assess photochemical model performance, J. Air. Waste. Manage, 67, 582–598, https://doi.org/10.1080/10962247.2016.1265027, 2017.
Emery, C. A., Tai, E., and Yarwood, G.: Enhanced meteorological modeling and performance evaluation for two Texas ozone episodes, Report to the Texas Natural Resource Conservation Commissions ENVIRON, International Corporation, Novato, CA, 2001.
Grell, G. A. and Devenyi, D.: A generalized approach to parameterizing convection combining ensemble and data assimilation techniques, Geophys. Res. Lett., 29, 1693, https://doi.org/10.1029/2002GL015311, 2002.
Gu, Y. and Yim, S. H.: The air quality and health impacts of domestic trans-boundary pollution in various regions of China, Environ. Int., 97, 117–124, https://doi.org/10.1016/j.envint.2016.08.004, 2016.
Guo, S., Hu, M., Zamora, M. L., Peng, J., Shang, D., Zheng, J., Du, Z., Wu, Z., Shao, M., Zeng, L. Molina, M. J., and Zhang, R.: Elucidating severe urban haze formation in China, P. Natl. Acad. Sci. USA., 111, 17373–17378, https://doi.org/10.1073/pnas.1419604111, 2014.
Guo, Y., Zeng, H., Zheng, R., Li, S., Barnett, A. G., Zhang, S., Zou, X., Huxley, R., Chen, W., and Williams, G.: The association between lung cancer incidence and ambient air pollution in China: a spatiotemporal analysis, Environ. Res., 144, 60–65, https://doi.org/10.1016/j.envres.2015.11.004, 2016.
Hanna, S. R. and Yang, R.: Evaluations of mesoscale models' simulations of near-surface winds, temperature gradients, and mixing depths, J. Appl. Meteorol., 40, 1095–1104, https://doi.org/10.1175/1520-0450(2001)040<1095:EOMMSO>2.0.CO;2, 2001.
Hu, X., Ma, Z., Lin, W., Zhang, H., Hu, J., Wang, Y., Xu, X., Fuentes, J. D., and Xue, M.: Impact of the Loess Plateau on the atmospheric boundary layer structure and air quality in the North China Plain: A case study. Sci. Total. Environ., 499, 228–237, https://doi.org/10.1016/j.scitotenv.2014.08.053, 2014.
Huang, X., Liu, Z., Liu, J., Hu, B., Wen, T., Tang, G., Zhang, J., Wu, F., Ji, D., Wang, L., and Wang, Y.: Chemical characterization and source identification of PM2.5 at multiple sites in the Beijing–Tianjin–Hebei region, China, Atmos. Chem. Phys., 17, 12941–12962, https://doi.org/10.5194/acp-17-12941-2017, 2017.
Iacono, M., Delamere, J., Mlawer, E., Shephard, M., Clough, S., and Collins, W.: Radiative forcing by long-lived greenhouse gases: Calculations with the AER radiative transfer models, J. Geophys. Res., 113, D13103, https://doi.org/10.1029/2008JD009944, 2008.
Janjić, Z.: The step-mountain eta coordinate model: further developments of the convection, viscous sublayer, and turbulence closure schemes, Mon. Weather Rev., 122, 927–945, https://doi.org/10.1175/1520-0493(1994)122<0927:TSMECM>2.0.CO;2, 1994.
Jia, W. and Zhang, X.: The role of the planetary boundary layer parameterization schemes on the meteorological and aerosol pollution simulations: A review, Atmos. Res., 239, 104890, https://doi.org/10.1016/j.atmosres.2020.104890, 2020.
Langrish, J. P., Li, X., Wang, S., Lee, M. M. Y., Barnes, G. D., Miller, M. R., Cassee, F. R., Boon, N. A., Donaldson, K., Li, J., Li, L., Mills, N. L., Newby, D. E., and Jiang, L.: Reducing Personal Exposure to Particular Air Pollution Improves Cardiovascular Health in Patients with Coronary Heart Disease, Environ. Health Persp., 120, 367–372, https://doi.org/10.1289/ehp.1103898, 2012.
Li, B., Zhang, J., Zhao, Y., Yuan, S., Zhao, Q., Shen, G., and Wu, H.: Seasonal variation of urban carbonaceous aerosols in a typical city Nanjing in Yangtze River Delta, China, Atmos. Environ., 106, 223–231, https://doi.org/10.1016/j.atmosenv.2015.01.064, 2015.
Li, P., Xin, J., Wang, Y., Li, G., Pan, X., Wang, S., Cheng, M., Wen, T., Wang, G., and Liu, Z.: Association between particulate matter and its chemical constituents of urban air pollution and daily mortality or morbidity in Beijing city, Environ. Sci. Pollut. R., 22, 358–368, https://doi.org/10.1007/s11356-014-3301-1, 2015.
Liao, T., Wang, S., Ai, J., Gui, K., Duan, B., Zhao, Q., Zhang, X., Jiang, W., and Sun, Y.: Heavy pollution episodes, transport pathways and potential sources of PM2.5, during the winter of 2013 in Chengdu (China), Sci. Total. Environ., 584, 1056–1065, https://doi.org/10.1016/j.scitotenv.2017.01.160, 2017.
Liao, T., Gui, K., Jiang, W., Wang, S., Wang, B., Zeng, Z., Che, H., Wang, Y., and Sun, Y.: Air stagnation and its impact on air quality during winter in Sichuan and Chongqing, southwestern China, Sci. Total. Environ., 635, 576–585, https://doi.org/10.1016/j.scitotenv.2018.04.122, 2018.
Lin, Y., Zou, J., Yang, W., and Li, C.: A review of recent advances in research on PM2.5 in China, Int. J. Environ. Res. Public Health, 15, 438, https://doi.org/10.3390/ijerph15030438, 2018.
Lu, W., Zhong, S., Charney, J., Bian, X., and Liu, S.: WRF simulation over complex terrain during a southern California wildfire event, J. Geophys. Res., 117, D05125, https://doi.org/10.1029/2011JD017004, 2012.
Madala, S., Satyanarayana, A., Srinivas, C., and Kumar, M.: Mesoscale atmospheric flow-field simulations for air quality modeling over complex terrain region of Ranchi in eastern India using WRF, Atmos. Environ., 107, 315–328, https://doi.org/10.1016/j.atmosenv.2015.02.059, 2015.
Megaritis, A. G., Fountoukis, C., Charalampidis, P. E., Denier van der Gon, H. A. C., Pilinis, C., and Pandis, S. N.: Linking climate and air quality over Europe: effects of meteorology on PM2.5 concentrations, Atmos. Chem. Phys., 14, 10283–10298, https://doi.org/10.5194/acp-14-10283-2014, 2014.
Ming, L., Jin, L., Li, J., Fu, P., Yang, W., Liu, D., Zhang, G., Wang, Z., and Li, X.: PM2.5 in the Yangtze River Delta, China: Chemical compositions, seasonal variations, and regional pollution events, Environ. Pollut., 223, 200–212, https://doi.org/10.1016/j.envpol.2017.01.013, 2017.
Mlawer, E. J., Taubman, S. J., Brown, P. D., Iacono, M. J., and Clough, S. A.: Radiative transfer for inhomogeneous atmospheres: RRTM, a validated correlated-k model for the longwave, J. Geophys. Res., 102, 16663–16682, https://doi.org/10.1029/97JD00237, 1997.
Morrison, H., Thompson, G., and Tatarskii, V.: Impact of cloud microphysics on the development of trailing stratiform precipitation in a simulated squall line: Comparison of one- and two-moment schemes, Mon. Weather Rev., 137, 991–1007, https://doi.org/10.1175/2008MWR2556.1, 2009.
Ning, G., Wang, S., Yim, S. H. L., Li, J., Hu, Y., Shang, Z., Wang, J., and Wang, J.: Impact of low-pressure systems on winter heavy air pollution in the northwest Sichuan Basin, China, Atmos. Chem. Phys., 18, 13601–13615, https://doi.org/10.5194/acp-18-13601-2018, 2018a.
Ning, G., Wang, S., Ma, M., Ni, C., Shang, Z., Wang, J., and Li, J.: Characteristics of air pollution in different zones of Sichuan Basin, China, Sci. Total. Environ., 612, 975–984, https://doi.org/10.1016/j.scitotenv.2017.08.205, 2018b.
Qiao, X., Guo, H., Tang, Y., Wang, P., Deng, W., Zhao, X., Hu, J., Ying, Q., and Zhang, H.: Local and regional contributions to fine particulate matter in the 18 cities of Sichuan Basin, southwestern China, Atmos. Chem. Phys., 19, 5791–5803, https://doi.org/10.5194/acp-19-5791-2019, 2019.
Rai, R., Berg, L., Kosović, B., Sue, E., Jeffrey, D., Brandon, L., and Caroline, D.: Evaluation of the impact of horizontal grid spacing in terra incognita on coupled mesoscale–microscale simulations using the WRF framework, Mon. Weather Rev., 147, 1007–1027, https://doi.org/10.1175/MWR-D-18-0282.1, 2019.
Ren, Y., Zhang, H., Wei, W., Wu, B., Liu, J., Cai, X., and Song, Y.: Comparison of the turbulence structure during light and heavy haze pollution episodes, Atmos. Res., 230, 104645, https://doi.org/10.1016/j.atmosres.2019.104645, 2019.
Song, C., Wu, L., Xie, Y., He, J., Chen, X., Wang, T., Lin, Y., Jin, T., Wang, A., Liu, Y., Dai, Q., Liu, B., Wang, Y., and Mao, H.: Air pollution in China: status and spatiotemporal variations, Environ. Pollut., 227, 334–347, https://doi.org/10.1016/j.envpol.2017.04.075, 2017.
Stockwell, W. R., Middleton, P., Chang, J. S., and Tang, X.: The second generation regional acid deposition model chemical mechanism for regional air quality modeling, J. Geophys. Res.-Atmos., 95, 16343–16367, https://doi.org/10.1029/JD095iD10p16343, 1990.
Tang, L., Yu, H., Ding, A., Zhang, Y., Qin, W., Zhuang, W., Chen, W., Hua, Y., and Yang, X.: Regional contribution to PM1 pollution during winter haze in Yangtze River Delta, China, Sci. Total. Environ., 541, 161–166, https://doi.org/10.1016/j.scitotenv.2015.05.058, 2015.
Tao, J., Zhang, L., Engling, G., Zhang, R., Yang, Y., Cao, J., Zhu, C., Wang, Q., and Luo L.: Chemical composition of PM2.5 in an urban environment in Chengdu, China: Importance of springtime dust storms and biomass burning, Atmos. Res., 122, 270–283, https://doi.org/10.1016/j.atmosres.2012.11.004, 2013.
Tao, M., Chen, L., Su, L., and Tao, J.: Satellite observation of regional haze pollution over the North China Plain, J. Geophys. Res.-Atmos., 117, D12203, https://doi.org/10.1029/2012JD017915, 2012.
Tian, M., Liu, Y., Yang, F., Zhang, L., Peng, C., Chen, Y., Shi, G., Wang, H., Luo, B., Jiang, C., Li, B., Takeda, N., and Koizumi, K.: Increasing importance of nitrate formation for heavy aerosol pollution in two megacities in Sichuan Basin, southwest China, Environ. Pollut., 250, 898–905, https://doi.org/10.1016/j.envpol.2019.04.098, 2019.
Tian, P., Cao, X., Zhang, L., Sun, N., Sun, L., Logan, T., Shi, J., Wang, Y., Ji, Y., Lin, Y., Huang, Z., Zhou, T., Shi, Y., and Zhang, R.: Aerosol vertical distribution and optical properties over China from long-term satellite and ground-based remote sensing, Atmos. Chem. Phys., 17, 2509–2523, https://doi.org/10.5194/acp-17-2509-2017, 2017.
Tie, X., Brasseur, G., and Ying, Z.: Impact of model resolution on chemical ozone formation in Mexico City: application of the WRF-Chem model, Atmos. Chem. Phys., 10, 8983–8995, https://doi.org/10.5194/acp-10-8983-2010, 2010.
Tuccella, P., Curci, G., Visconti, G., Bessagnet, B., and Menut L., and Park, R. J.: Modeling of gas and aerosol with WRF-Chem over Europe: Evaluation and sensitivity study, J. Geophys. Res.-Atmos., 117, D03303, https://doi.org/10.1029/2011JD016302, 2012.
Wang, H., Tian, M., Chen, Y., Shi, G., Liu, Y., Yang, F., Zhang, L., Deng, L., Yu, J., Peng, C., and Cao, X.: Seasonal characteristics, formation mechanisms and source origins of PM2.5 in two megacities in Sichuan Basin, China, Atmos. Chem. Phys., 18, 865–881, https://doi.org/10.5194/acp-18-865-2018, 2018a.
Wang, H., Peng, Y., Zhang, X., Liu, H., Zhang, M., Che, H., Cheng, Y., and Zheng, Y.: Contributions to the explosive growth of PM2.5 mass due to aerosol–radiation feedback and decrease in turbulent diffusion during a red alert heavy haze in Beijing–Tianjin–Hebei, China, Atmos. Chem. Phys., 18, 17717–17733, https://doi.org/10.5194/acp-18-17717-2018, 2018b.
Wang, L., Liu, J., Gao, Z., Li, Y., Huang, M., Fan, S., Zhang, X., Yang, Y., Miao, S., Zou, H., Sun, Y., Chen, Y., and Yang, T.: Vertical observations of the atmospheric boundary layer structure over Beijing urban area during air pollution episodes, Atmos. Chem. Phys., 19, 6949–6967, https://doi.org/10.5194/acp-19-6949-2019, 2019.
Wang, T., Jiang, F., Deng, J., Shen, Y., Fu, Q., Wang, Q., Fu, Y., Xu, J., and Zhang, D.: Urban air quality and regional haze weather forecast for Yangtze River Delta region, Atmos. Environ., 58, 70–83, https://doi.org/10.1016/j.atmosenv.2012.01.014, 2012.
Wang, X., Dickinson, R. E., Su, L., Zhou, C., and Wang K.: PM2.5 pollution in China and how it has been exacerbated by terrain and meteorological conditions, B. Am. Meteorol. Soc., 99, 105–119, https://doi.org/10.1175/BAMS-D-16-0301.1, 2018.
Wu, M., Wu, D., Fan, Q., Wang, B. M., Li, H. W., and Fan, S. J.: Observational studies of the meteorological characteristics associated with poor air quality over the Pearl River Delta in China, Atmos. Chem. Phys., 13, 10755–10766, https://doi.org/10.5194/acp-13-10755-2013, 2013.
Xu, R., Tang, G., Wang, Y., and Tie, X.: Analysis of a long-term measurement of air pollutants (2007–2011) in North China Plain (NCP); Impact of emission reduction during the Beijing Olympic Games, Chemosphere, 159, 647–658, https://doi.org/10.1016/j.chemosphere.2016.06.025, 2016.
Xu, X., Wang, Y., Zhao, T., Cheng, X., Meng, Y., and Ding, G.: “Harbor” effect of large topography on haze distribution in eastern China and its climate modulation on decadal variations in haze, Chinese Sci. Bull., 60, 1132–1143, https://doi.org/10.1360/N972014-00101, 2015.
Xu, X., Zhao, T., Liu, F., Gong, S. L., Kristovich, D., Lu, C., Guo, Y., Cheng, X., Wang, Y., and Ding, G.: Climate modulation of the Tibetan Plateau on haze in China, Atmos. Chem. Phys., 16, 1365–1375, https://doi.org/10.5194/acp-16-1365-2016, 2016.
Ye, X., Song, Y., Cai, X., and Zhang, H.: Study on the synoptic flow patterns and boundary layer process of the severe haze events over the North China Plain in January 2013, Atmos. Environ., 124, 129–145, https://doi.org/10.1016/j.atmosenv.2015.06.011, 2016.
Yim, S. H. L., Fung, J. C. H., and Ng, E. Y. Y.: An assessment indicator for air ventilation and pollutant dispersion potential in an urban canopy with complex natural terrain and significant wind variations, Atmos. Environ., 94, 297–306, https://doi.org/10.1016/j.atmosenv.2014.05.044, 2014.
Yin, D., Zhao, S., Qu, J., Yu, Y., Kang, S., Ren, X., Zhang, J., Zou, Y., Dong, L., Li, J., He, J., Li, P., and Qin, D.: The vertical profiles of carbonaceous aerosols and key influencing factors during wintertime over western Sichuan Basin, China, Atmo. Environ., 223, 1352–2310, https://doi.org/10.1016/j.atmosenv.2020.117269, 2020.
Zhan, D., Kwan, M. P., Zhang, W., Yu, X., Meng, B., and Liu, Q.: The driving factors of air quality index in China, J. Clean Prod., 197, 1342–1351, https://doi.org/10.1016/j.jclepro.2018.06.108, 2018.
Zhang, L., Guo, X., Zhao, T., Gong, S., Xu, X., Li, Y., Luo, L., Gui, K., Wang, H., Zheng, Y., and Yin, X.: A modelling study of the terrain effects on haze pollution in the Sichuan Basin, Atmos. Environ., 196, 77–85, https://doi.org/10.1016/j.atmosenv.2018.10.007, 2019.
Zhang, Q., Quan, J., Tie, X., Li, X., Liu, Q., Gao, Y., and Zhao, D.: Effects of meteorology and secondary particle formation on visibility during heavy haze events in Beijing, China, Sci. Total. Environ., 502, 578–584, https://doi.org/10.1016/j.scitotenv.2014.09.079, 2015.
Zhang, Y., Shao, M., Lin, Y., Luan, S., Mao, N., Chen, W., and Wang, M.: Emission inventory of carbonaceous pollutants from biomass burning in the Pearl River Delta Region, China, Atmos. Environ., 76, 189–199, https://doi.org/10.1016/j.atmosenv.2012.05.055, 2013.
Zhang, Z., Zhang, X., Gong, D., Kim, S.-J., Mao, R., and Zhao, X.: Possible influence of atmospheric circulations on winter haze pollution in the Beijing–Tianjin–Hebei region, northern China, Atmos. Chem. Phys., 16, 561–571, https://doi.org/10.5194/acp-16-561-2016, 2016.
Zhao, S., Yu, Y., Yin, D., Qin, D., He, J., and Dong, L.: Spatial patterns and temporal variations of six criteria air pollutants during 2015 to 2017 in the city clusters of Sichuan Basin, China, Sci. Total. Environ., 624, 540–557, https://doi.org/10.1016/j.scitotenv.2017.12.172, 2018.
Zhao, S., Yu, Y., Qin, D., Yin, D., Dong, L., and He, J.: Analyses of regional pollution and transportation of PM2.5 and ozone in the city clusters of Sichuan Basin, China, Atmos. Pollut. Res., 10, 374–385, https://doi.org/10.1016/j.apr.2018.08.014, 2019.
Zhong, J., Zhang, X., Dong, Y., Wang, Y., Liu, C., Wang, J., Zhang, Y., and Che, H.: Feedback effects of boundary-layer meteorological factors on cumulative explosive growth of PM2.5 during winter heavy pollution episodes in Beijing from 2013 to 2016, Atmos. Chem. Phys., 18, 247–258, https://doi.org/10.5194/acp-18-247-2018, 2018.
Zhou, Y., Luo, B., Li, J., Hao, Y., Yang, W., Shi, F., Chen, Y., Simayi, M., and Xie, S.: Characteristics of six criteria air pollutants before, during, and after a severe air pollution episode caused by biomass burning in the southern Sichuan Basin, China, Atmos. Environ., 215, 116840, https://doi.org/10.1016/j.atmosenv.2019.116840, 2019.