the Creative Commons Attribution 4.0 License.
the Creative Commons Attribution 4.0 License.
 | 15 Jun 2021
Large-scale synoptic drivers of co-occurring summertime ozone and PM2.5 pollution in eastern China
Lian Zong
Yuanjian Yang
Hong Wang
Peng Wang
Hongliang Zhang
Linlin Wang
Guicai Ning
Chao Liu
Yubin Li
Zhiqiu Gao
Surface ozone (O3) pollution during summer (June–August) over eastern China has become more severe in recent years, resulting in a co-occurrence of surface O3 and PM2.5 (particulate matter with aerodynamic diameters ≤ 2.5 µm in the air) pollution. However, the mechanisms regarding how the synoptic weather pattern (SWP) might influence this compound pollution remain unclear. In this study, we applied the T-mode principal component analysis (T-PCA) method to objectively classify the occurrence of four SWPs over eastern China, based on the geopotential heights at 500 hPa during summer (2015–2018). These four SWPs over eastern China were closely related to the western Pacific subtropical high (WPSH), exhibiting significant intra-seasonal and interannual variations. Based on ground-level air quality observations, remarkable spatial and temporal disparities of surface O3 and PM2.5 pollution were also found under the four SWPs. In particular, there were two SWPs that were sensitive to compound pollution (Type 1 and Type 2). Type 1 was characterized by a stable WPSH ridge with its axis at about 22∘ N and the rain belt located south of the Yangtze River Delta (YRD); Type 2 also exhibited WPSH dominance (ridge axis at ∼ 25∘ N) but with the rain belt (over the YRD) at a higher latitude compared to Type 1. In general, SWPs have played an important role as driving factors of surface O3–PM2.5 compound pollution in a regional context. Our findings demonstrate the important role played by SWPs in driving regional surface O3–PM2.5 compound pollution, in addition to the large quantities of emissions, and may also provide insights into the regional co-occurring high levels of both PM2.5 and O3 via the effects of certain meteorological factors.
- Article
(13737 KB) - Full-text XML
-
Supplement
(3150 KB) - BibTeX
- EndNote


In recent years, China has been experiencing serious air pollution problems owing to its enormous emissions of polluting gases (e.g., sulfur dioxide and nitrogen dioxide (NO2)) and aerosol particulates (e.g., particulate matter with aerodynamic diameters ≤ 2.5 or 10 µm in the air, abbreviated to PM2.5 and PM10, respectively) associated with its rapid economic development, industrialization and urbanization, together with certain unfavorable meteorological conditions (Wang and Chen, 2016; Zhang et al., 2014, 2016). In particular, atmospheric compound pollution has become serious (Li et al., 2019; Saikawa et al., 2017; C. Zhang et al., 2019), especially for the economically developed and densely populated eastern urban agglomerations of China, such as the Beijing–Tianjin–Hebei (BTH), Yangtze River Delta (YRD) and Pearl River Delta (PRD) regions (Cai et al., 2017; Du et al., 2019; Ji et al., 2018; Li et al., 2020), exerting a severe threat in terms of public health, economy and society (Chen et al., 2019; Cohen et al., 2017; Day et al., 2017; Yim et al., 2019).
In general, significant diurnal variation of PM2.5 pollution has been observed, possibly due to obvious local emissions caused by industrial production and human activities related to daily living (Amil et al., 2016; H. Liu et al., 2019). In particular, the pollution level tends to be higher during the morning and evening of a normal weekday, with a weakened effect found in the afternoon, possibly caused by the co-effects of the boundary layer structure and anthropogenic emissions. There has also been seasonal variation of PM2.5 pollution detected across China, indicating a higher level of pollution in winter than summer (Ye et al., 2018; Zhang and Cao, 2015). The PM2.5 level in China showed a steady increase from 2004 to 2007 and has since stabilized (Ma et al., 2016); however, there are still frequent PM2.5 pollution events in autumn and winter (Song et al., 2017; Yang et al., 2018; Ye et al., 2018; Zhang et al., 2014). In the past few years, the PM2.5 concentration in China has decreased significantly as a result of measures introduced across the country that have reduced multi-pollutant emissions, adjusted the energy structure and increased the supply of clean energy (Gui et al., 2019; Yang et al., 2020; Q. Zhang et al., 2019; Zhang et al., 2020). While PM2.5 is still one of the dominant air pollutants across China, surface O3 pollution in summer has also gradually risen to prominence. Several studies have even indicated that O3 might replace PM2.5 as the primary air pollutant during summer (Li et al., 2019), which has caught the attention of researchers in recent years. For instance, Sun et al. (2016) showed that the observed summertime O3 at Mt. Tai increased significantly by 1.7 ppbv yr−1 for the month of June and by 2.1 ppbv yr−1 for the months of July–August during the period 2003–2015. Furthermore, an increase in the maximum daily 8 h average concentration of O3 (MDA8 O3) at an annual average rate of 4.6 % was reported by Fan et al. (2020), albeit with a decrease in the frequency of PM2.5 pollution.
The modulations of atmospheric circulation systems often lead to changes in meteorological elements and thereby also affect the processes of pollutant formation, transmission and diffusion. Furthermore, many studies have indicated that PM2.5 and O3 pollution are strongly correlated with local meteorological factors such as temperature, relative humidity (RH) and wind speed (WS) (Huang et al., 2016; Miao et al., 2015; Shu et al., 2019; Tai et al., 2010). Miao et al. (2015) suggested that a low boundary layer height (BLH) and stable atmosphere would be an unfavorable condition for the dispersion of winter aerosol pollution over the BTH region. Zhang et al. (2017) found that the majority of O3 extremes occurred with a daily maximum temperature (Tmax) of between 300 and 320 K, a minimum RH (RHmin) of less than 40 %, and a minimum WS of less than 3 m s−1,
through an analysis of extreme O3 and PM2.5 events from historical data (30 years for O3 and 10 years for PM2.5) in the United States. Furthermore, the number of annual extreme PM2.5 days was highly positively correlated with extreme RH days, and the correlation coefficient between PM2.5 and RHmin (Tmax) was highest in urban and suburban (rural) regions. Shi et al. (2020) studied the sensitivity of O3-8 h (O3 8 h moving average) and PM2.5 associated with meteorological parameters. Their study focused on the air pollution and meteorological conditions between January and July 2013, with the results showing that temperature could have had the greatest impact on the daily maximum O3-8 h, while the PM2.5 sensitivities were negatively (positively) correlated with temperature, WS and BLH (absolute humidity) in most regions of China. Miao et al. (2015) showed that RH was high when aerosol pollution occurred in the BTH region. However, O3 pollution in China is more frequent in summer and the warm and humid flow brought by the East Asian summer monsoon (EASM) induces a hot and humid condition over the summer. Zhao et al. (2019) investigated the RH of O3 pollution in Shijiazhuang between 15 June and 14 July 2016 and found that the O3 concentration was higher at moderate humidity (average RH during daytime from 10:00 to 17:00 LT was 40 %–50 %). Recently, Han et al. (2020) assessed the impacts of local and synoptic meteorological factors on the daily variability of surface O3 over eastern China. Their study revealed that meteorological factors could explain ∼ 46 % of the daily variations in summer surface O3. In particular, synoptic factors contributed ∼ 37 % to the overall effects associated with meteorological factors. Furthermore, six predominant synoptic weather patterns (SWPs) were identified by a self-organizing map, and related results indicated a weak cyclonic system and southward prevailing wind induced the positive O3 anomalies over eastern China. The abovementioned studies indicate that the variations of meteorological factors play a non-negligible role in air pollution. Therefore, classification of air pollution according to meteorological circulation has become particularly important, not least because of its worth when applied to air quality monitoring, forecasting and evaluation (N. Liu et al., 2019; Ning et al., 2019; Yang et al., 2018; Zheng et al., 2015).
Since the 1990s, it has become possible to objectively classify atmospheric circulation conditions using weather data such as geopotential height (GH), sea level pressure, WS and temperature, thus allowing the physical mechanism of extreme weather to be better understood and analyzed. Compared with subjective weather classification, the objective approach has been widely used in air pollution research (Miao et al., 2017, 2019; Ning et al., 2018). Miao et al. (2019), based on the daily 900 hPa GH fields during winter in Beijing, identified seven synoptic patterns using an objective approach and found that the weak northwesterly prevailing winds and strong elevated thermal inversion layer, along with the local emissions of aerosols, play a decisive role in the formation of heavy pollution in Beijing. The authors also noted that southerly prevailing winds can transport pollutants emitted from southern cities to Beijing. Zheng et al. (2015) studied the relationship between regional pollution and the patterns of large-scale atmospheric circulation over eastern China in October from 2001 to 2010 and identified six pollution types and three clean types. Specifically, weather patterns such as a uniform surface pressure field in eastern China or a steady straight westerly in the middle troposphere, particularly when at the rear of an anticyclone at 850 hPa, were found to be typically responsible for heavy pollution events. Many studies have suggested a modulating effect of the East Asian summer monsoon (EASM) and western Pacific subtropical high (WPSH) on air quality over China (Li et al., 2018; Yin et al., 2019; Zhao et al., 2010). In particular, Li et al. (2018) applied RegCM4-CHEM to analyze the differences in O3 between three strong and weak monsoon years and found that the concentrations of O3 over the central and eastern part of China were higher in strong EASM years than in weak EASM years. The anomalous high-pressure system at 500 hPa, associated with downward dry, hot air and intense solar radiation, can enhance the photochemical reactions to elevate the production of tropospheric O3 (Gong and Liao, 2019; Yin et al., 2019). Furthermore, Zhao and Wang (2017) and Yin et al. (2019) noted that the positive GH anomalies at high latitudes tended to significantly weaken the cold-air advection from the north, resulting in locally high temperatures near the surface in northern China, while the WPSH could transport sufficient water vapor to the YRD region, leading to a decrease in surface O3. In addition, different subregions can exhibit various distributions of pollutants, even with identical emission scenarios (Li et al., 2019; Saikawa et al., 2017; C. Zhang et al., 2019). Also, it is still unclear how the distribution of pollution responds locally to large-scale atmospheric circulation patterns. Due to the variability of local meteorological conditions under various synoptic weather types and the modulation of the large-scale movement of the WPSH (Li et al., 2018; Wang et al., 2019; Yang et al., 2021; Zhao and Wang, 2017), the causes and consequences of meteorological factors for the formation of compound O3–PM2.5 pollution could be complex. Overall, the mechanism by which the SWP modulates the characteristics of O3–PM2.5 compound pollution has yet to be comprehensively described.
In this study, the SWPs corresponding to the co-occurrence of O3 and PM2.5 pollution during summertime were analyzed, with a focus on eastern China (104–135∘ E, 17–53∘ N). Then, the synoptic causes of O3–PM2.5 compound pollution, as well as O3-only pollution, from the perspective of the objective classification of atmospheric circulation patterns were revealed. The findings are expected to provide a scientific reference for the monitoring, forecasting and evaluation of summertime air pollution in eastern China.
The air quality data, including PM2.5, NO2, O3 and O3-8 h, are from the national 24 h continuous air quality observations published by the China Environmental Monitoring Station (http://www.cnemc.cn/, last access: 7 June 2021). Summertime hourly data (2015–2018) for 1174 stations were retrieved from an observational network in eastern China (104–135∘ E, 17–53∘ N), which includes the more prominent pollution areas in the eastern urban agglomeration, such as the BTH (113.5–119.8∘ E, 36–42.6∘ N), YRD (115.3–122.6∘ E, 27.2–34.5∘ N), PRD (112.5–113.7∘ E, 21.3–23.1∘ N), Guanzhong Plain (GZP (104.6–112.2∘ E, 33.3–36.8∘ N)) and Northeast Megalopolis (NEM (121.2–131.0∘ E, 39.8–47.3∘ N)) regions (the specific locations of stations and urban agglomerations are shown in Fig. 1a). Surface meteorological data, such as Tmax, precipitation, WS and RH from 611 meteorological observation stations, along with 367 sounding profiles at 14:00 Beijing time (BJT) from 64 stations and 368/368 sounding profiles at 08:00/20:00 BJT from 77 stations, respectively, in eastern China were obtained from the China National Meteorological Information Center of the China Meteorological Administration (http://data.cma.cn/site/index.html, last access: 7 June 2021). The BLH was calculated according to the method given by Seidel et al. (2012) and Guo et al. (2016, 2019) (the detailed method can be seen in Text S1 of the Supplement) and the FLWD (frequency of light wind (< 2 m s−1) days, which can be defined as the ratio between the number of days with average daily WS lower than 2 m s−1 and the total days of each pattern), precipitation frequency (PF, which can be defined as the ratio of the number of rainy days to total days under each pattern) and MDA8 O3 were also quantified.
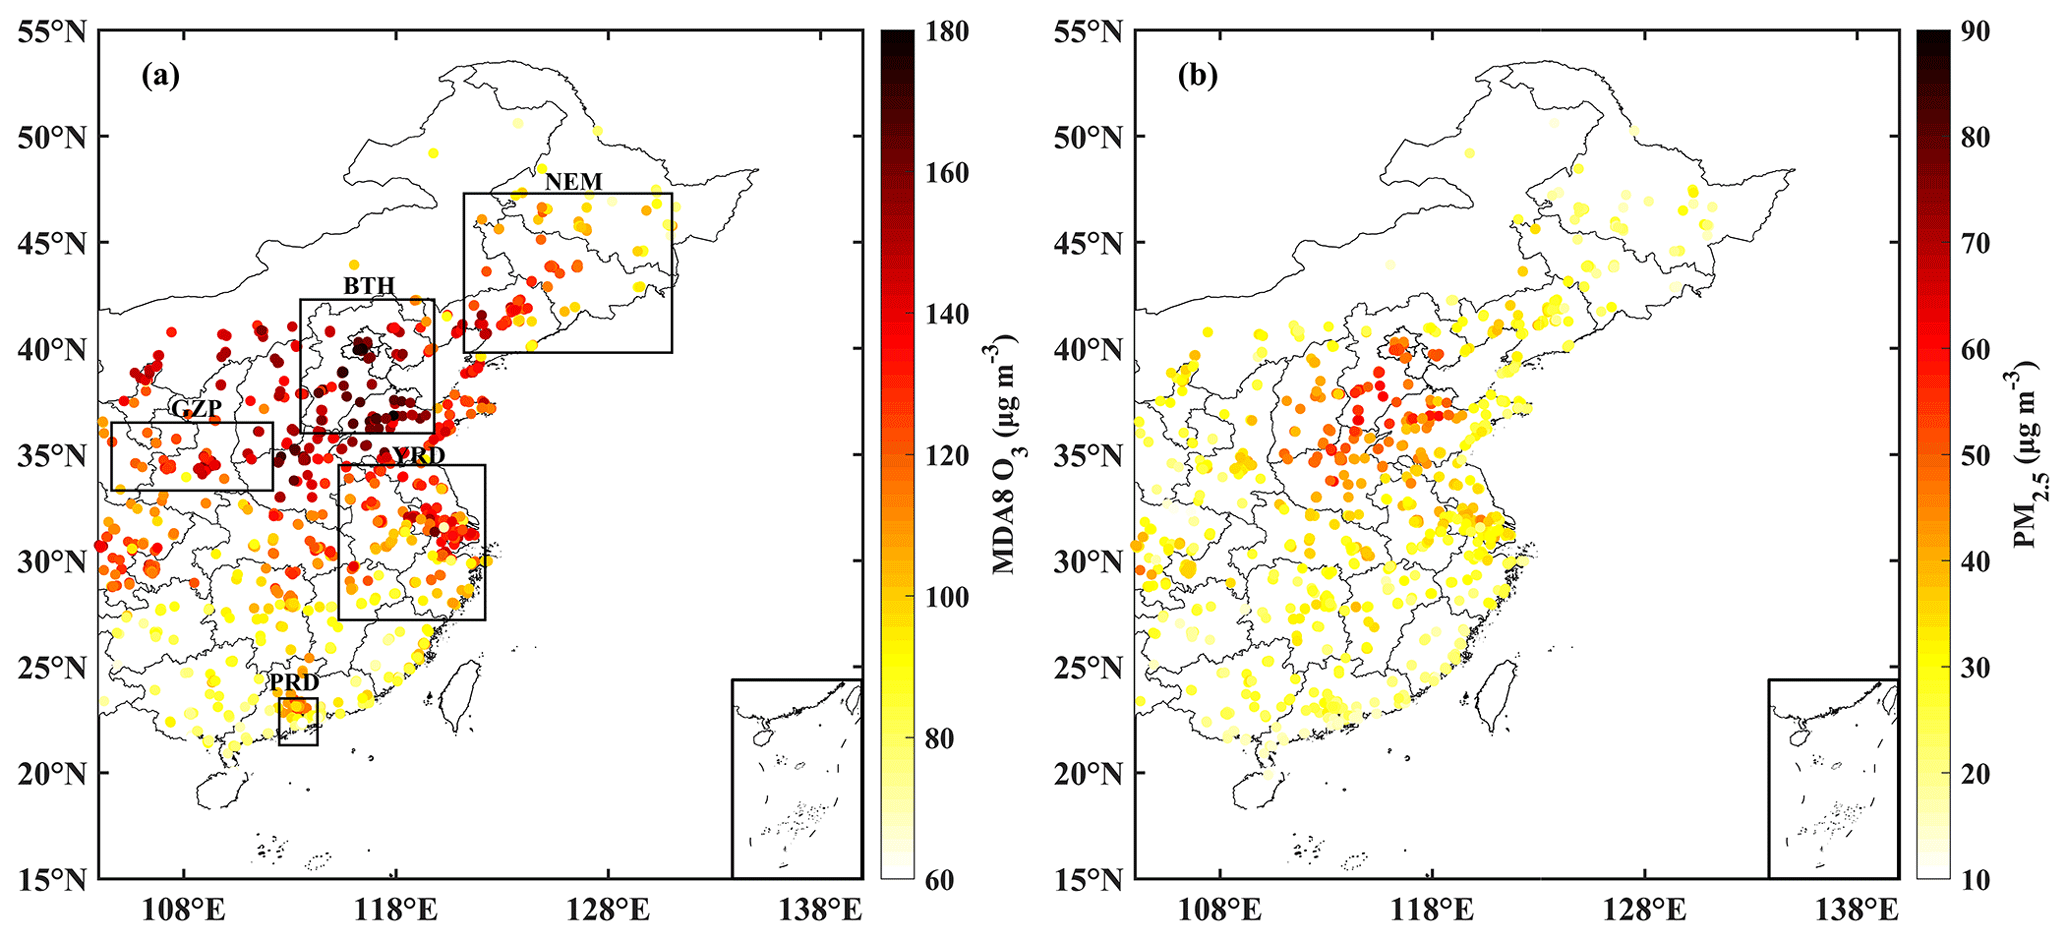
Figure 1Average concentration of MDA8 O3 (a) and PM2.5 (b) in eastern China during the summers of 2015–2018. Stations and key urban clusters (black boxes) are shown in (a).
Additionally, for synoptic analysis of particulate matter and O3 pollution in summer, we use the GH field at 500 hPa, wind and specific humidity field at 850 hPa from the NCEP/NCAR (National Centers for Environmental Prediction/National Center for Atmospheric Research) daily reanalysis dataset (https://psl.noaa.gov/data/gridded/data.ncep.reanalysis.html, last access: 7 June 2021) on a 2.5∘ latitude × 2.5∘-longitude grid during the study period. For further analysis of the modulation of the co-occurrence of O3–PM2.5 pollution by the boundary layer structure in some local areas, we also used the BLH, uv wind, vertical velocity, RH and temperature fields of the fifth generation European Centre for Medium-Range Weather Forecasts reanalysis (ERA5), which has a high spatiotemporal resolution (0.25∘ latitude × 0.25∘ longitude, hourly; https://psl.noaa.gov/data/gridded/data.ncep.reanalysis.html, last access: 7 June 2021).
T-mode principal component analysis (T-PCA) is an objective mathematical computer-based method that can be used to classify the synoptic circulation patterns of regional gridded data in the troposphere at the lower level. Indeed, it is commonly regarded as the most promising weather pattern classification method at present (Huth et al., 2008). Moreover, this approach has been widely used in studies of aerosols and O3 pollution-related atmospheric circulation in China (Miao et al., 2017, 2019; Ning et al., 2018, 2019). The T-PCA analysis module of the COST733 software (http://cost733.met.no/, last access: 7 June 2021) developed by the European Scientific and Technical Research Cooperation was used to classify the synoptic circulation pattern based on the 500 hPa GH field. The COST733class program is a FORTRAN software package consisting of several modules for classification, evaluation and comparison of weather and circulation patterns. First, the weather data are spatially standardized and split into 10 subsets by T-PCA. Then, the principal components (PCs) of weather information are estimated by applying singular value decomposition and the PC score for each subset can be calculated after oblique rotation. Finally, the resultant subset with the highest sum will be selected by comparing 10 subsets according to contingency tables and its type can be outputted as well (Miao et al., 2017; Philipp et al., 2014). To assess the performance of synoptic classification and determine the number of classes, the explained cluster variance (ECV) was selected in this study (Hoffmann and Schlünzen, 2013; Ning et al., 2019; Philipp et al., 2014). Detailed information about the ECV method is provided in the Supplement.
Based on the Ambient Air Quality Standards (GB3095-2012) issued by the Ministry of Ecology and Environment of the People's Republic of China, O3 (PM2.5) pollution occurs when the MDA8 O3 (PM2.5 24-h) concentration exceeds 160 (75) µg m−3. For a particular region, when haze occurs at more than 50 % of the observed sites, the day can be defined as a haze day (Chen and Wang, 2015). In this study, we characterized regional pollution days as occurring when the average values of more than 50 % of sites in this region exceeded the aforementioned thresholds. The specific standard limits of each pollution level are set according to their concentration limits based on the Technical Regulation on Ambient Air Quality Index (on trial) (HJ633-2012) issued by the Ministry of Ecology and Environment of the People's Republic of China (Table S1 in the Supplement).
Finally, in order to be clear regarding the changes in O3 and PM2.5 concentrations in the analysis of different weather types, we calculated the average distribution of O3 and PM2.5 as well as the meteorological conditions for each type. Plus, the anomalous distribution of these variables (i.e., the average of O3 and PM2.5 and the average of the meteorological conditions under the respective patterns minus the average during the summertime of 2015–2018) were given as well. The statistical significance was tested with a 0.05 confidence level via analysis of variance, which enabled us to distinguish the significant differences of spatial distribution characteristics between O3 and PM2.5 pollution under four SWPs.
3.1 Spatial and temporal distribution of O3 and PM2.5 during summer 2015–2018
Figure 1 shows the summer-averaged MDA8 O3 and PM2.5 concentrations at 1174 stations in the eastern region of China for the period 2015–2018. Among these stations, the MDA8 O3 concentration at most stations (795/1174) exceeded 100 µg m−3, of which 45 sites exceeded 160 µg m−3. The highest O3 pollution was found in Zibo, Shandong, with a value of 181.5 µg m−3. The average PM2.5 at most sites (844/1174) was below 35 µg m−3, while it reached 62.6 µg m−3 in Handan, Hebei Province. On the whole, the MDA8 O3 and PM2.5 in the BTH region and its surrounding areas was significantly higher than in other regions. In addition, the level of O3 in some urban clusters, such as the PRD, YRD, GZP and NEM regions, was particularly higher than that of the surroundings, and thus we focus on analyzing these key areas later in the paper.
Figures 2 and 3 show the daily variations in pollution levels of O3 and PM2.5, respectively. In recent years, the reduced visibility of haze days has weakened the solar radiation reaching the ground and inhibited photochemical reactions from generating O3 (Li et al., 2019; Zhang et al., 2015). As a result, the concentration of O3 has continued to increase with the mitigation of PM2.5 pollution. During the study period, the number of days of O3 pollution in the BTH, YRD, PRD, GZP and NEM regions was 254, 133, 84, 165 and 96, respectively, while the number of days of PM2.5 pollution was only 93, 8, 0, 2 and 1, of which compound pollution occurred on 76, 7, 0, 2 and 0 d according to Chinese standards (the asterisks in Fig. 3 indicate the compound pollution events). China has implemented strict policies for emission control, and the effects of these policies have been remarkable. However, despite a decrease in PM2.5 in the last five years, there has also been an increase in O3 pollution over China (Fan et al., 2020; Sun et al., 2016); “double-high” pollution reported on the weather scale has reduced. As the limit of PM2.5 concentration for pollution control is relatively relaxed in China, previous studies have tended to refer to the interim target 1 (IT-1) of the World Health Organization (WHO) as the standard threshold. Our study pushed forward to the next stage, i.e., we used the WHO's IT-2 threshold (24 h average concentration of PM2.5 of 35 µg m−3) as our target limit to count the number of compound pollution days across each region. Based on this target, the number of pollution days for the five urban clusters was 194, 52, 16, 47 and 20, respectively (Fig. 3). These results indicate that despite PM2.5 reductions, compound pollution events remain serious and deserving of public attention. Overall, the O3 and PM2.5 concentrations in eastern China exhibit distinct intra-seasonal and interannual variations, indicating that aside from the changes in emission sources (because it is considered that inter-seasonal and short-term changes in emission sources are not significant), they may also be regulated by meteorological conditions, which is further analyzed below.
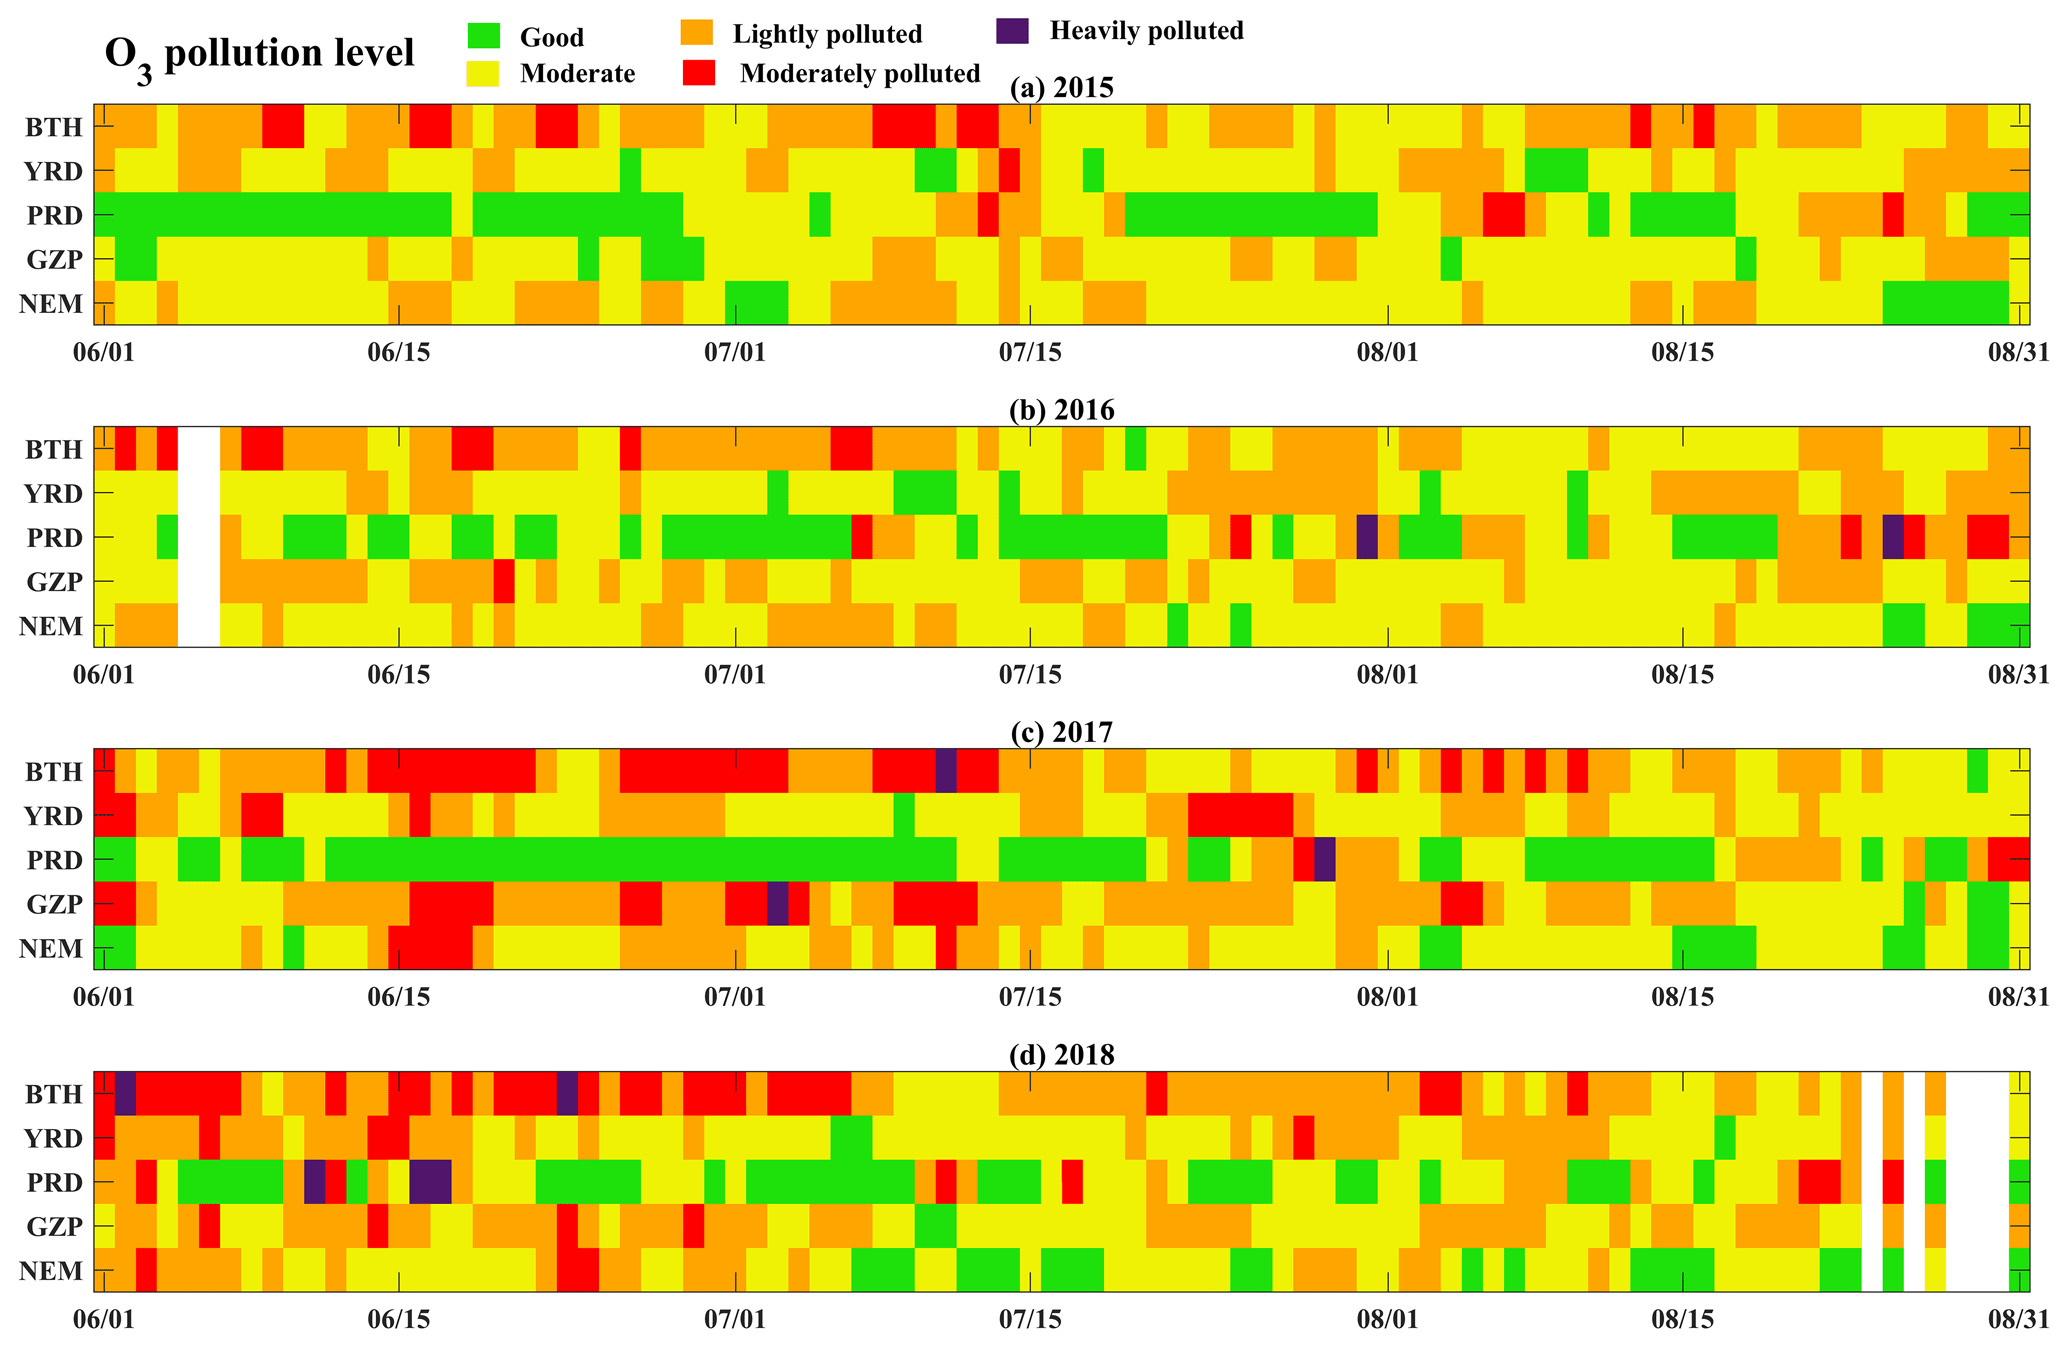
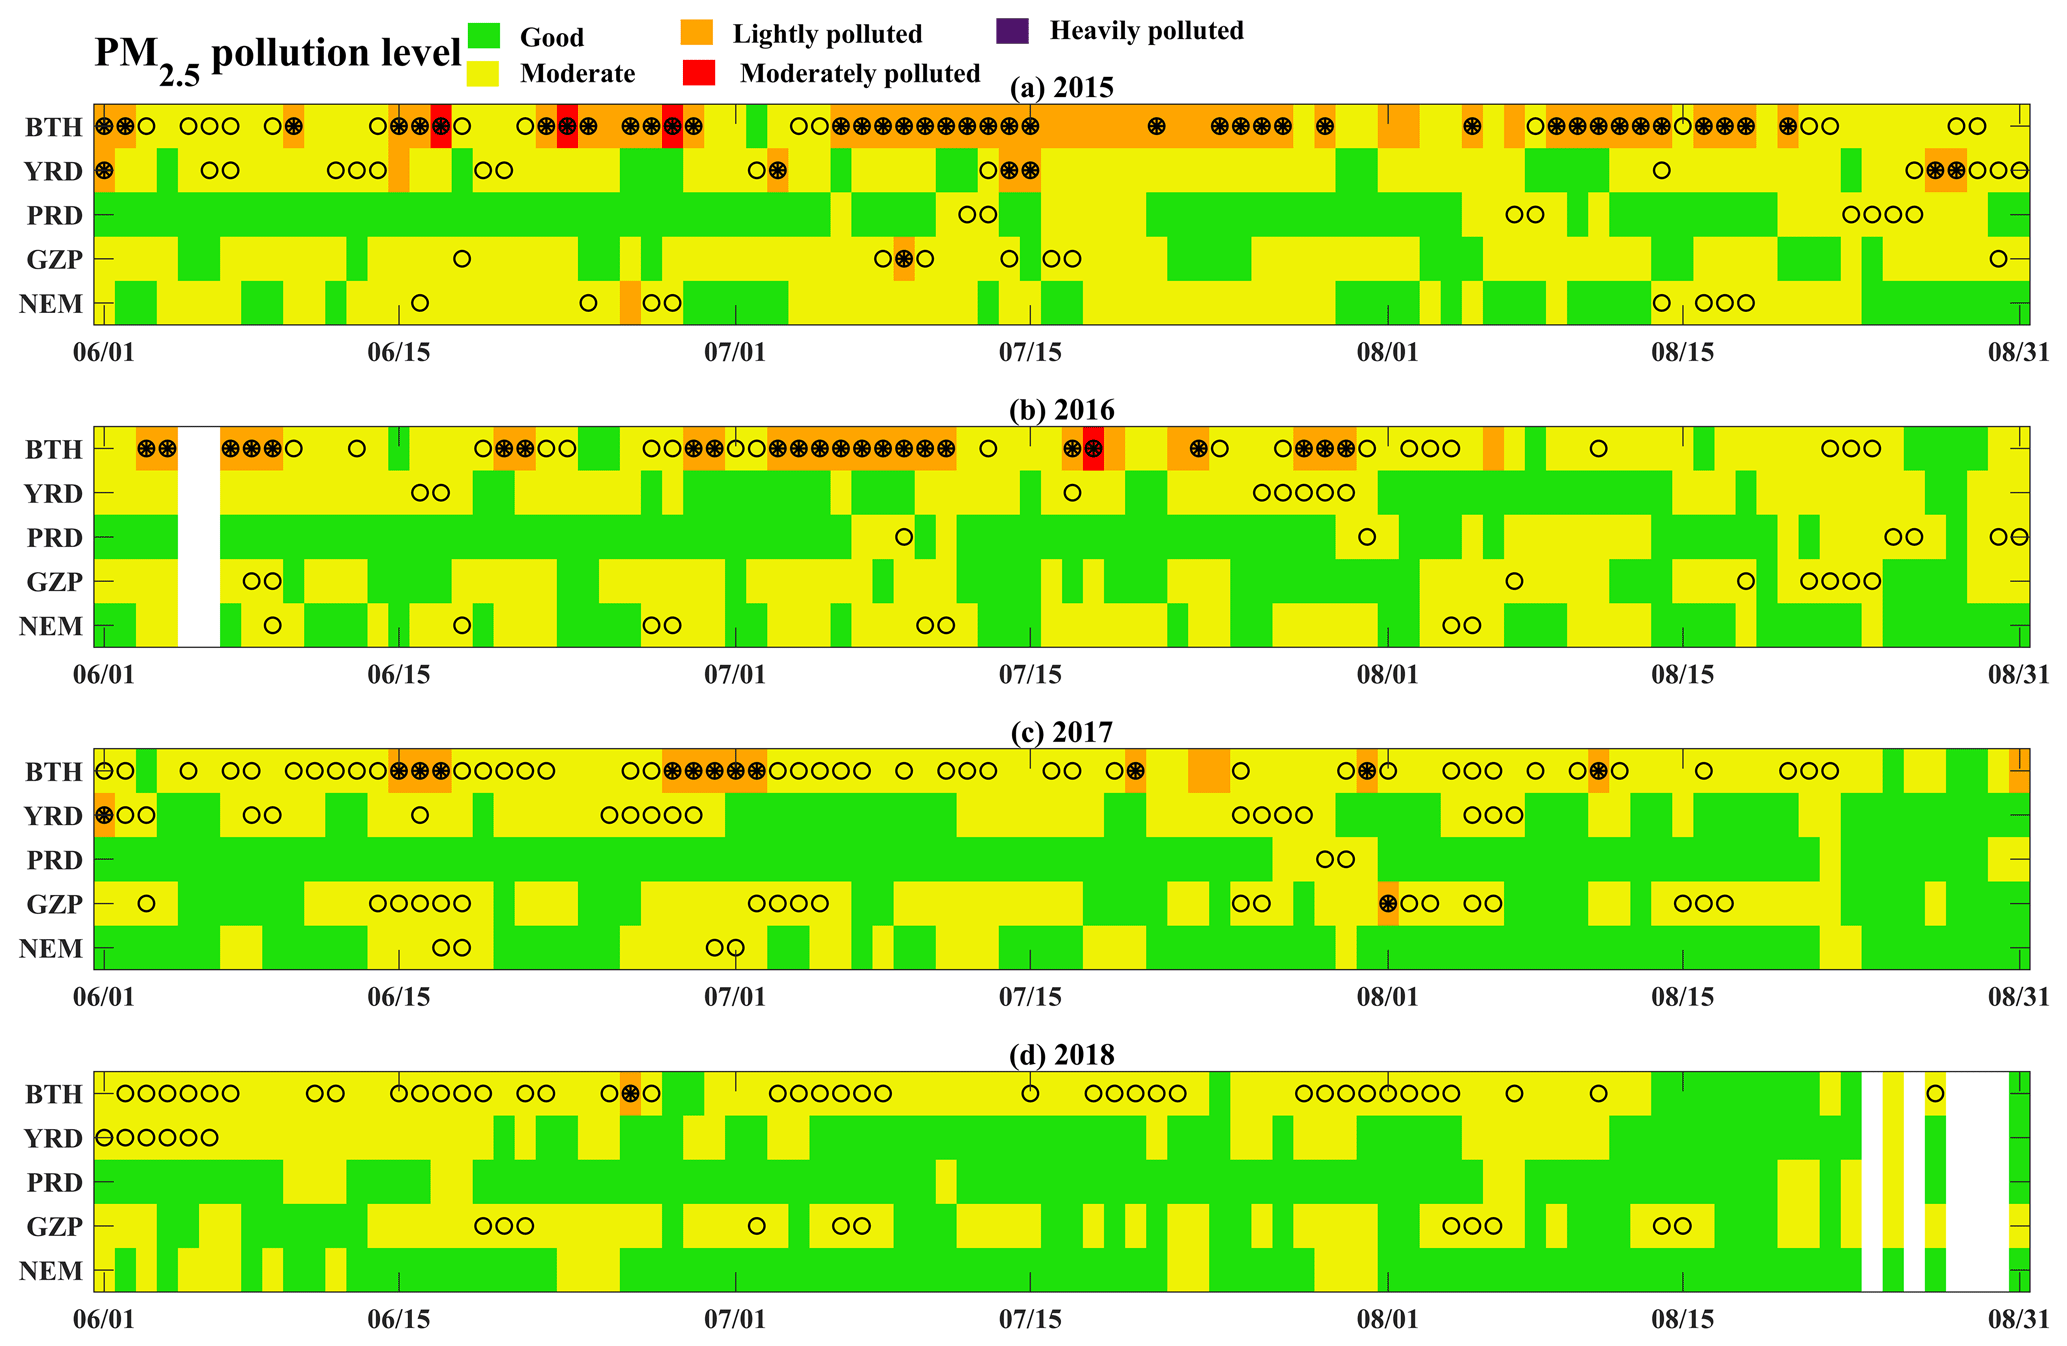
Figure 3Time series of PM2.5 pollution levels in key urban clusters. Black dots indicate the compound events. Asterisks indicate the compound events under the Chinese standard (WHO interim target 1; IT-1) and the circles indicate the compound events under WHO IT-2.
3.2 Objective classification of large-scale SWPs in summer
To analyze the effect of meteorological conditions on the changes in O3 and PM2.5 concentrations, it is necessary to statistically analyze the large-scale weather circulation situation in summer. Existing studies have shown that the WPSH (500 hPa GH field with obvious anticyclonic characteristics and downward flow around the center) in summer prominently regulates the weather and climate of East Asia (Lu, 2002), owing to its varying location, shape and intensity (Ding, 1994). Low-level southerly monsoonal flow forming at the periphery of an anomalously enhanced WPSH, along with the transportation of warm and humid air from the ocean to East Asia, might also be responsible for the asymmetric spatial distribution of ground-level O3 (i.e., a decrease in southern China but an increase over northern China, Zhao and Wang, 2017).
Therefore, we used the T-PCA method to objectively classify the weather circulation of the 500 hPa GH field in the summers of 2015–2018, from which we ultimately obtained four SWPs related to the movement and development of the WPSH (Wang et al., 2019; Yang et al., 2021). The western ridge point and northern boundary of the WPSH at 500 hPa in Type 1 were located at around 120∘ E and 30∘ N, respectively (Fig. 4a and Table S2 in the Supplement). The southwestern flow of this WPSH was able to transport water vapor to the YRD region, resulting in a southwestward prevailing wind across the YRD region and westward flow from the north of the WPSH, forming a convergence area at 850 hPa. These conditions were also associated with high temperature and humidity during the summer in the Meiyu season, which is a climate phenomenon characterized by continuous cloudy and rainy days that generally occurs during June and July every year across the middle and lower reaches of the Yangtze river, Taiwan in China, central and southern Japan, and southern Korea. For Type 2, the westerly trough was able to deepen as the WPSH shifted northwards slightly from Type 1 or retreated southeast from Type 3 (Fig. 4b). The southwest wind from the South China Sea might have combined with the southerly wind in the eastern periphery of the WPSH. As a result, southerly winds prevailed across southeastern China, while northern China was mainly controlled by the westerly trough. In comparison to Type 2, Type 3 was characterized by the boundary of the WPSH being at a higher latitude with a westward extension (Fig. 4c), disintegrating a closed high-pressure monomer along the eastern coast of China, and the main body of the WPSH remained over the ocean (Figs. 4c and S4 in the Supplement). This led to a condition that was completely controlled by the monomer of the WPSH over the YRD region, resulting in hot and dry weather at the end the rainy season at the beginning of mid-summer. Figure 4d indicates that the location of the WPSH monomer was more to the west and north compared with under the other SWPs, thus controlling northern China for a long time; the western ridge point was located at around 95∘ E and the northern boundary at around 40∘ N.
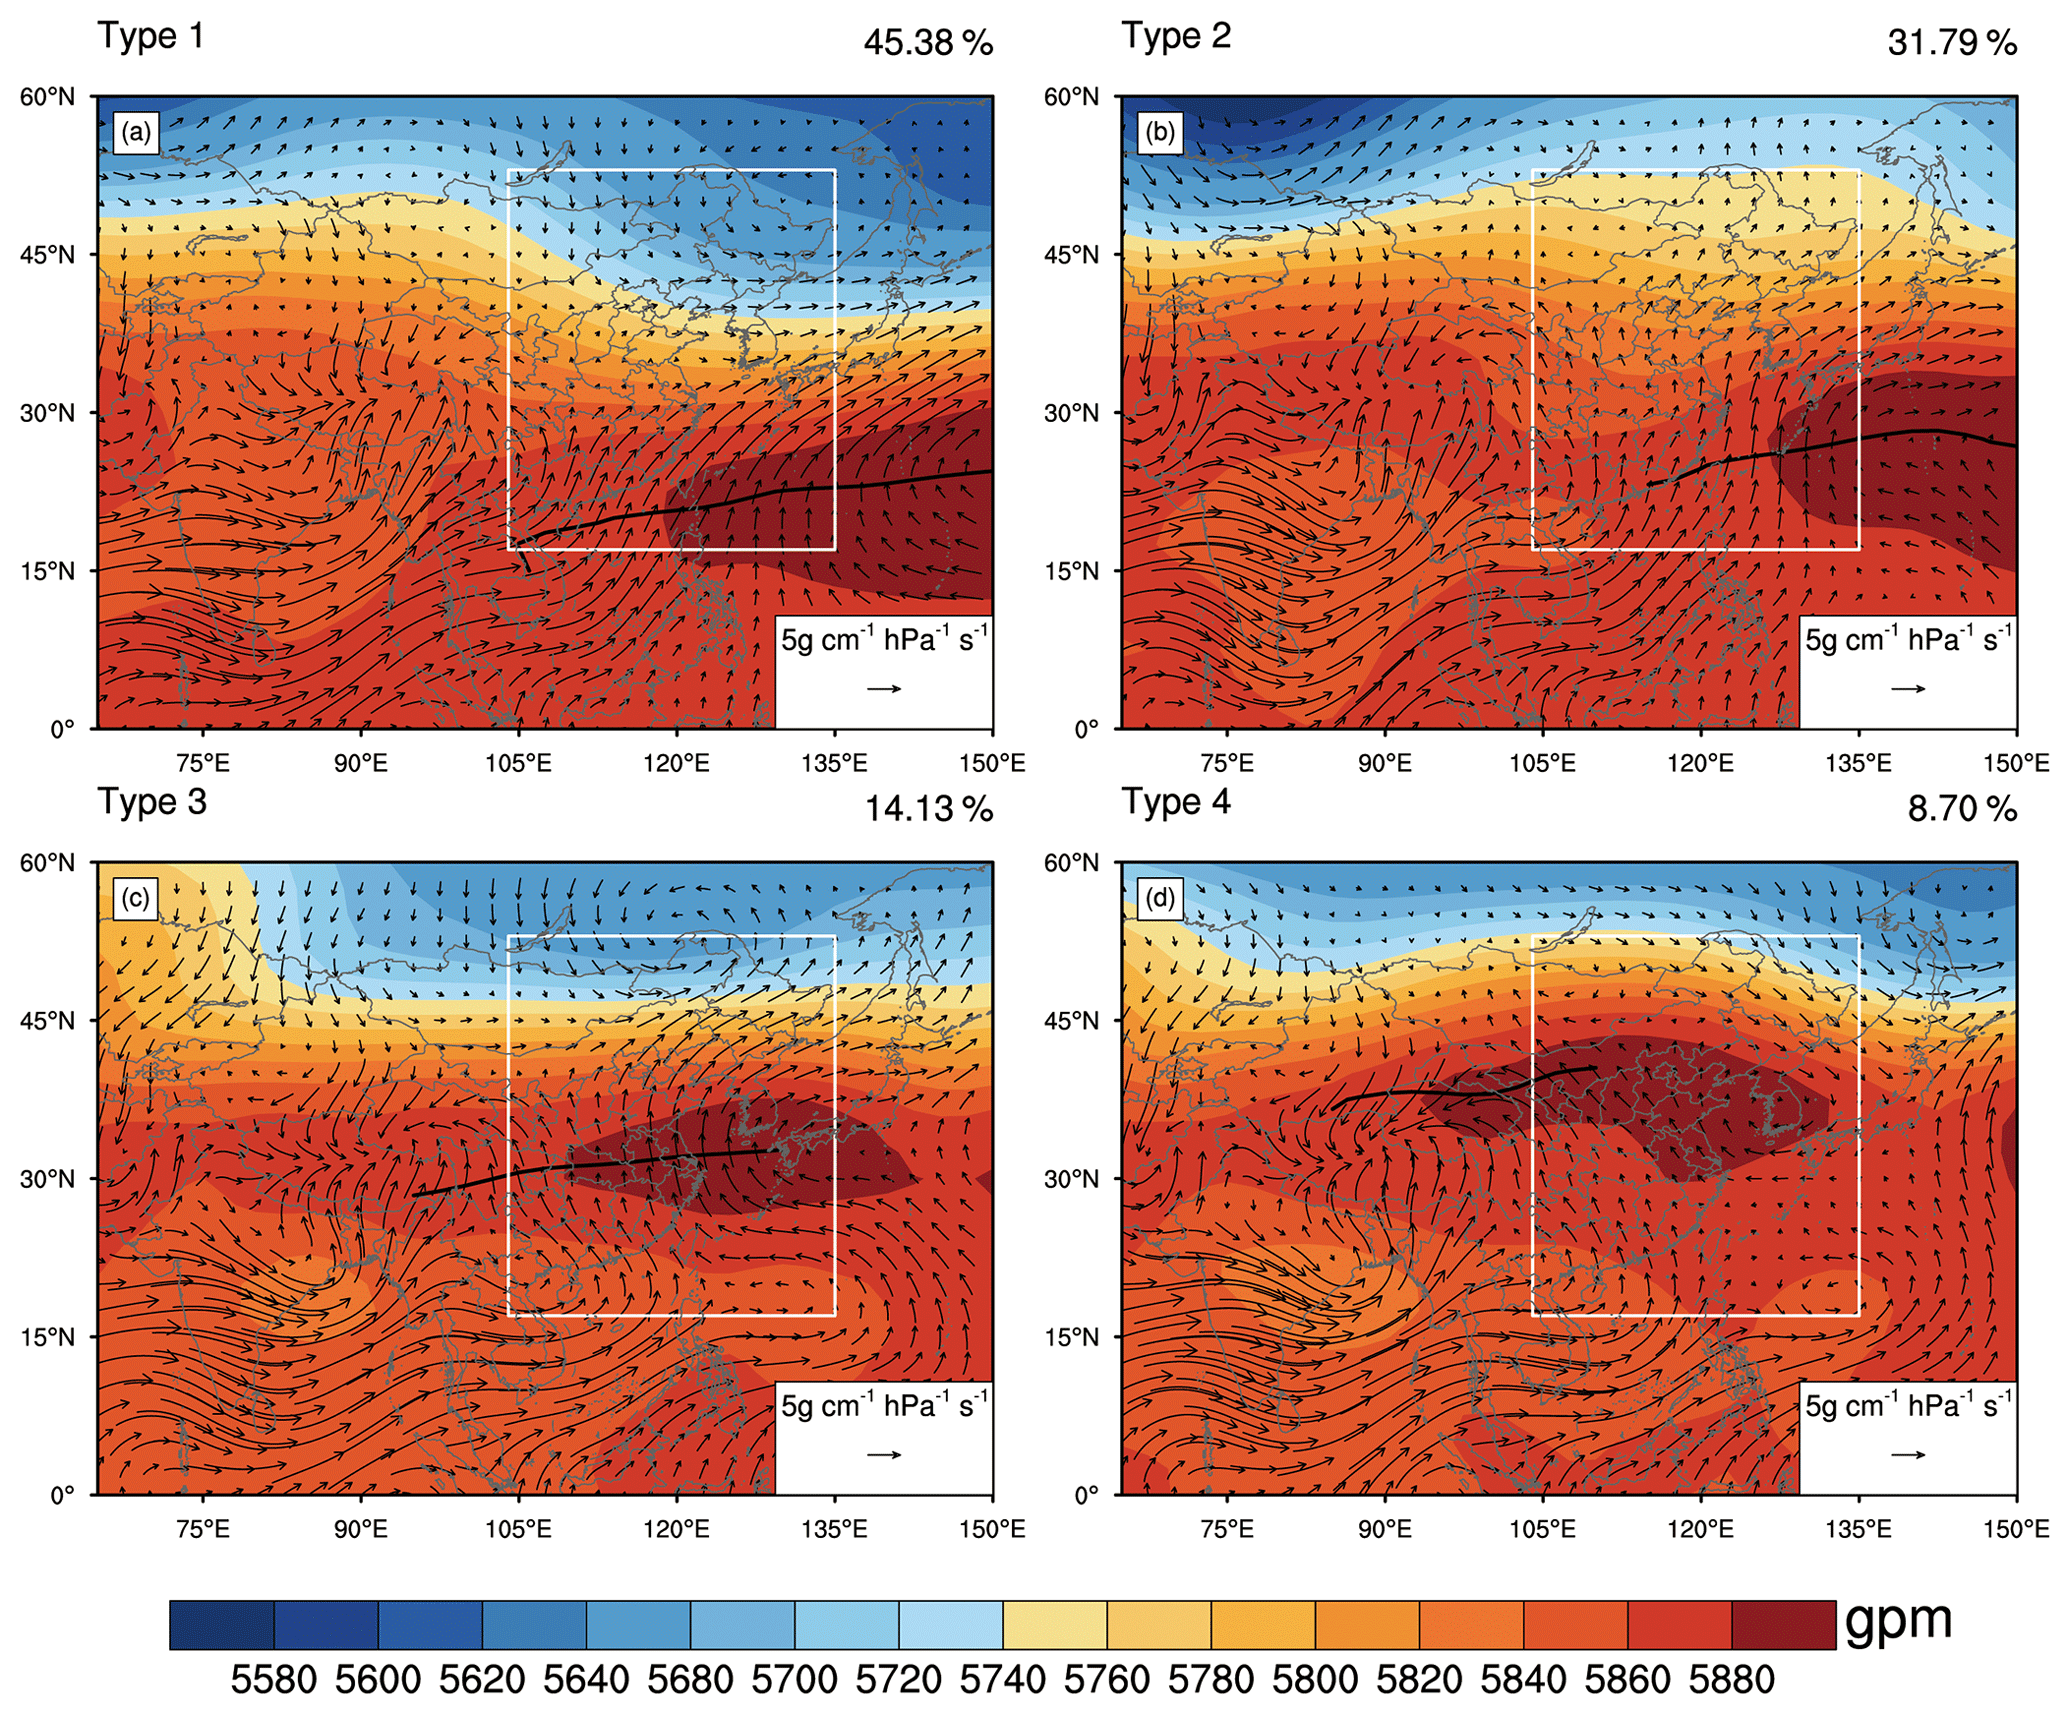
Figure 4850 hPa water vapor flux (, where q is specific humidity, g is gravitational acceleration and V is horizonal wind; vectors indicate WVF; see scale arrow in the bottom right in units of 5 g cm−1 hPa−1 s−1) and 500 hPa GH (contours indicate GH; see scale bar at bottom in units of gpm) patterns based on objective classification (see text for details). The white framed area is the area of eastern China, the number in the upper-right corner of each panel indicates the frequency of occurrence of each pattern type and the black line in each panel presents the ridge axis of the WPSH.
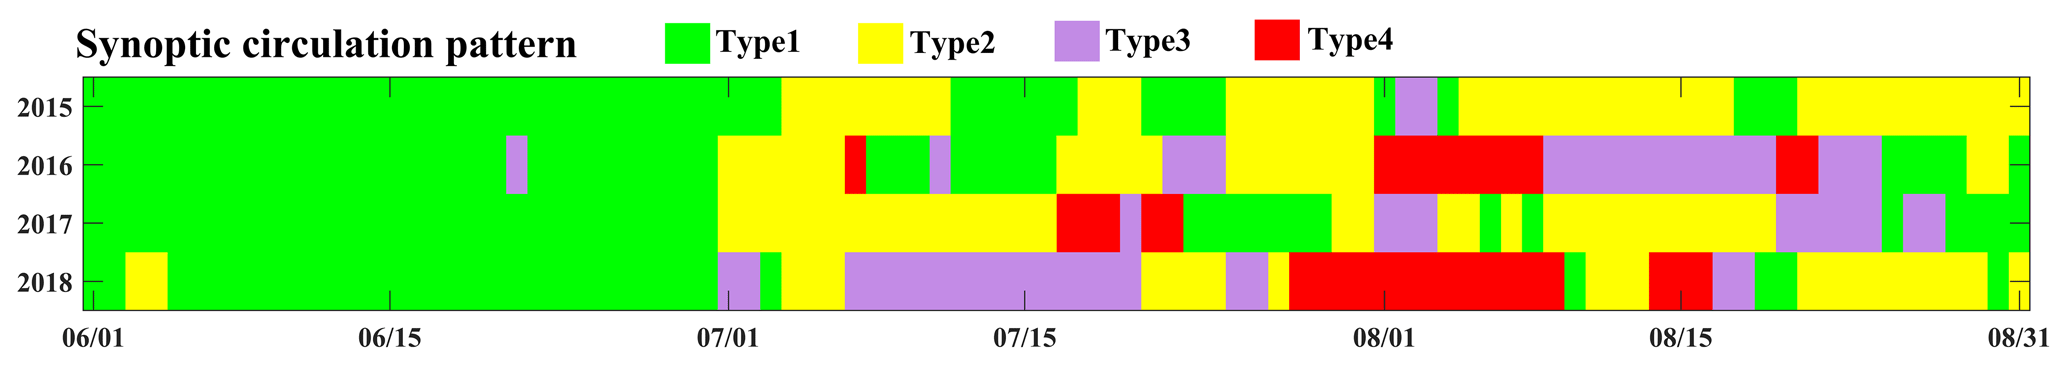
Figure 5 presents the daily and annual variations of the SWPs in the summers of 2015–2018. Usually, the advancement of the WPSH in eastern China occurs in June and July, while its gradual withdrawal occurs mainly in August; in this respect, Type 1 and Type 2 represented normal WPSH characteristics during early and late summer. Type 3 and Type 4, however, reflected a split of the WPSH, which mainly occurred in late summer. Consequently, there were 167, 117, 52 and 32 d for Type 1, Type 2, Type 3 and Type 4 over the study period, respectively. Since the WPSH's movement is generally affected by the weather phenomena of its surrounding climatic systems (such as typhoons and the Tibetan high) (Ge et al., 2019; Liu and You, 2020; Shu et al., 2016; Wang et al., 2019), it may have resulted in a short-term southward retreat during the advancement of the WPSH (e.g., around 10 August 2018) and a short-term northward advancement during its process of retreat (e.g., 21 and 29 August 2016). For instance, tropical storm NEPARTAK generated at 00:00 UTC (08:00 BJT) 3 July 2016 over the western North Pacific and upgraded to a super typhoon at 12:00 UTC (20:00 BJT) 5 July 2016 (Fig. S5 in the Supplement; see also Su et al., 2017). Due to the rapid movement of NEPARTAK to the northwest, the WPSH quickly decomposed to a monomer and moved north. With the strengthening and landing of the typhoon, the monomer gradually collapsed. The SWP also underwent a transition from Type 2 to Type 4 and then to Type 1 (Figs. 4 and S5 in the Supplement). In general, the WPSH is able to provide evidence of intra-seasonal and interannual changes over China, which will inevitably modulate the weather as well as climatic and environmental changes in eastern China.
3.3 O3 and PM2.5 pollution characteristics under the four SWPs
3.3.1 Spatial characteristics
We calculated the averaged (Fig. S6 in the Supplement) and anomalous (Fig. 6) spatial distributions of the MDA8 of O3 and PM2.5 under the four SWPs. The O3 concentration was relatively high in the area north of the Yangtze River under Type 1 and the high values of MDA8 O3 were mainly concentrated in the North China Plain (NCP) region, with a total of 100 stations surpassing 160 µg m−3. Type 2 O3 pollution was slightly weaker than that for Type 1, and the MDA8 O3 at the 72 sites exceeded 160 µg m−3. The O3 high-value areas lay mainly in the NCP, GZP and YRD regions under Type 4, and there were 37 stations with concentrations larger than 160 µg m−3. Of the four SWPs, the lowest overall MDA8 O3 occurred under Type 3, with only one site exceeding 160 µg m−3 (Fig. S6a–d in the Supplement). It was also found that the regions that experienced significant positive deviations of MDA8 O3 from the summer mean were as follows: the BTH, YRD and NEM regions under Type 1; the BTH and GZP regions under Type 2; the central of the YRD and PRD regions under Type 3; and the YRD, GZP and PRD regions under Type 4 (Fig. 6a–d).
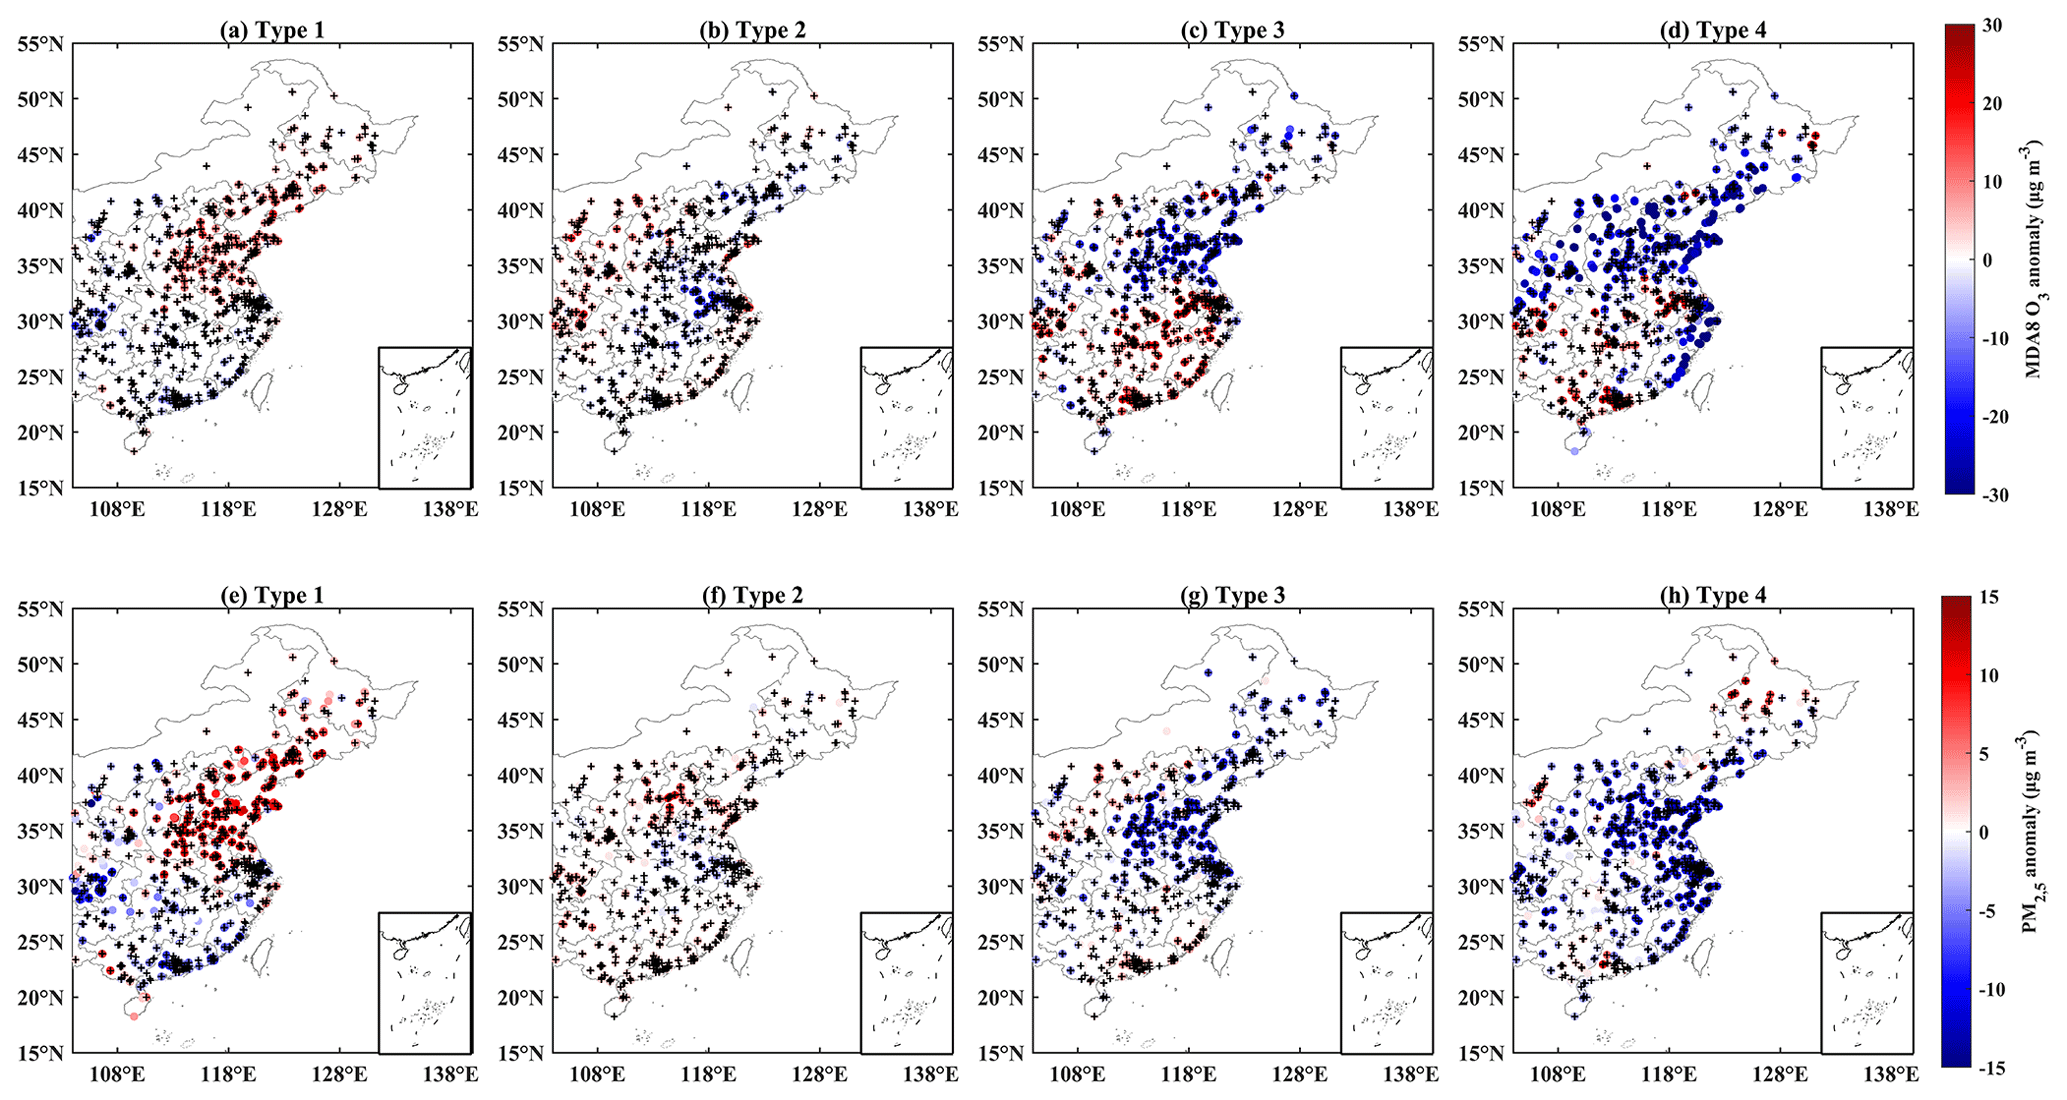
Figure 6The MDA8 O3 (a–d) and PM2.5 (e–h) anomaly under the four SWPs, where the sites marked with a “+” indicate that the analysis of variance passed the significance level of 0.05.
Analogously, Fig. 6e–h shows the anomaly and significance of difference in PM2.5 under the four weather types, presented as positive anomalies in the south of the BTH and YRD regions under Type 1, in the BTH, GZP and PRD regions under Type 2, and in the GZP and PRD regions under Type 4. Due to the obvious seasonal variations of PM2.5 concentration (higher in winter and lower in summer) (H. Liu et al., 2019; Miao et al., 2015), no site exceeded 75 µg m−3 for the averaged PM2.5 concentration. Even so, the level of PM2.5 in the BTH region was still significantly higher under the four types than that for other urban agglomerations (Fig. S6e–h in the Supplement).
3.3.2 Pollution pattern differences in key areas
Air pollution is principally found in dense urban areas such as the BTH and YRD regions (Gui et al., 2019; Han et al., 2019), so we took the BTH, PRD, YRD, GZP and NEM regions in the eastern region as key areas, counted the daily anomalies and average variation of O3 and PM2.5 in each key region under the different weather patterns (Figs. 7 and S7 in the Supplement) and calculated the over-limit ratio in those key regions via the “stations × days” statistics (see Table 1). The diurnal variation of O3 was more obvious, peaking at about 15:00 BJT, while contrasting diurnal variations of PM2.5 were found for different regions. According to Fig. 7 and Table 1, the following characteristics could be identified for different urban clusters: (1) in the BTH region, the O3 concentrations of Type 1 and Type 2 were relatively high with their over-limit rates reaching 47.1 % and 54.2 % and the PM2.5 pollution rates reaching 18.8 % and 16.3 %, respectively; (2) in the PRD region, the over-limit rates and concentrations of O3 and PM2.5 were similar under the four SWPs; (3) in the YRD region, the O3 pollution over-limit rate presents as Type 1 > Type 4 > Type 2 > Type 3, PM2.5 pollution largely appeared under Type 1, and both O3 and PM2.5 under Type 1 were higher than those for the other types; (4) in the GZP region, the O3 pollution frequency was higher under Type 2 and Type 4, and PM2.5 pollution occurred more frequently under Type 2; and (5) in the NEM region, O3 pollution was always found under Type 1, Type 2 and Type 4, but the over-limit rate was no more than 15 % and PM2.5 pollution under Type 1 was more than under Type 2.
Table 1Over-limit ratio and concentration of MDA8 O3 and PM2.5 calculated via “stations × days” statistics in key urban clusters under four SWPs.
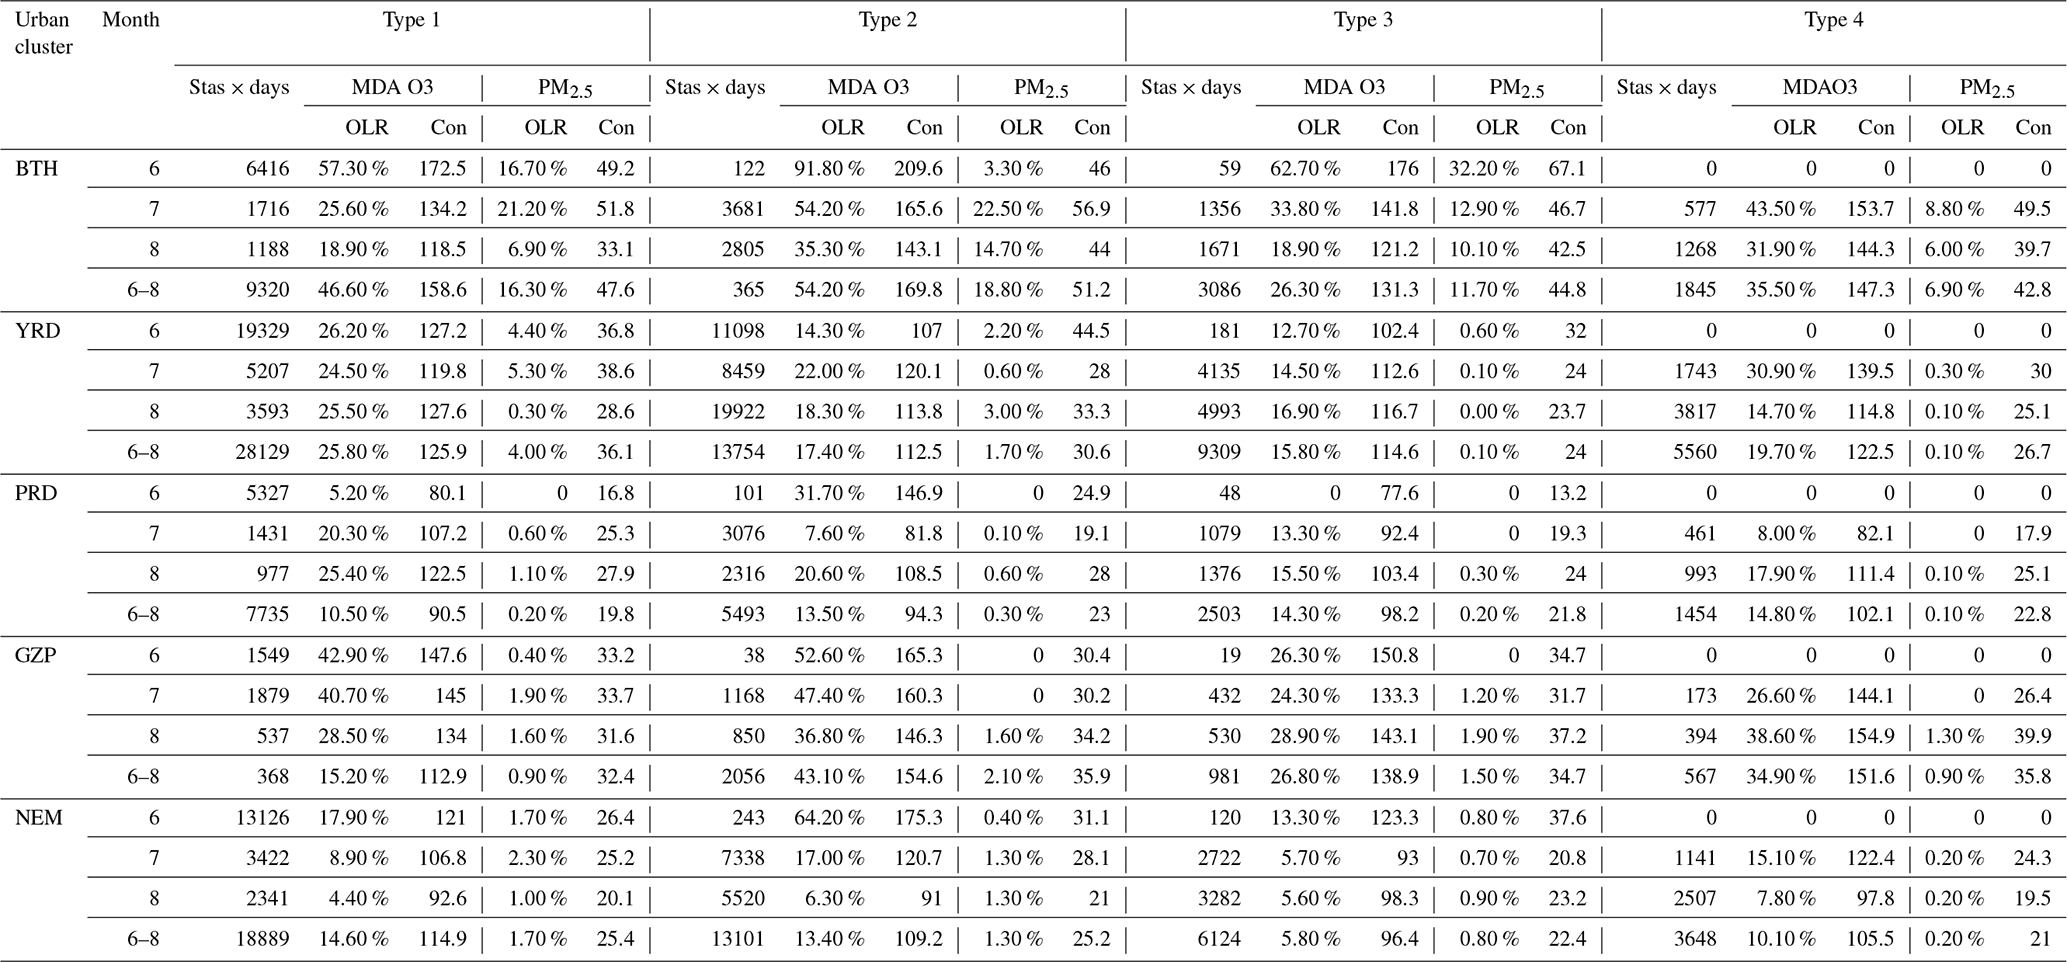
Stas × days = stations × days. OLR = over-limit ratio. Con = concentration (µg m−3).
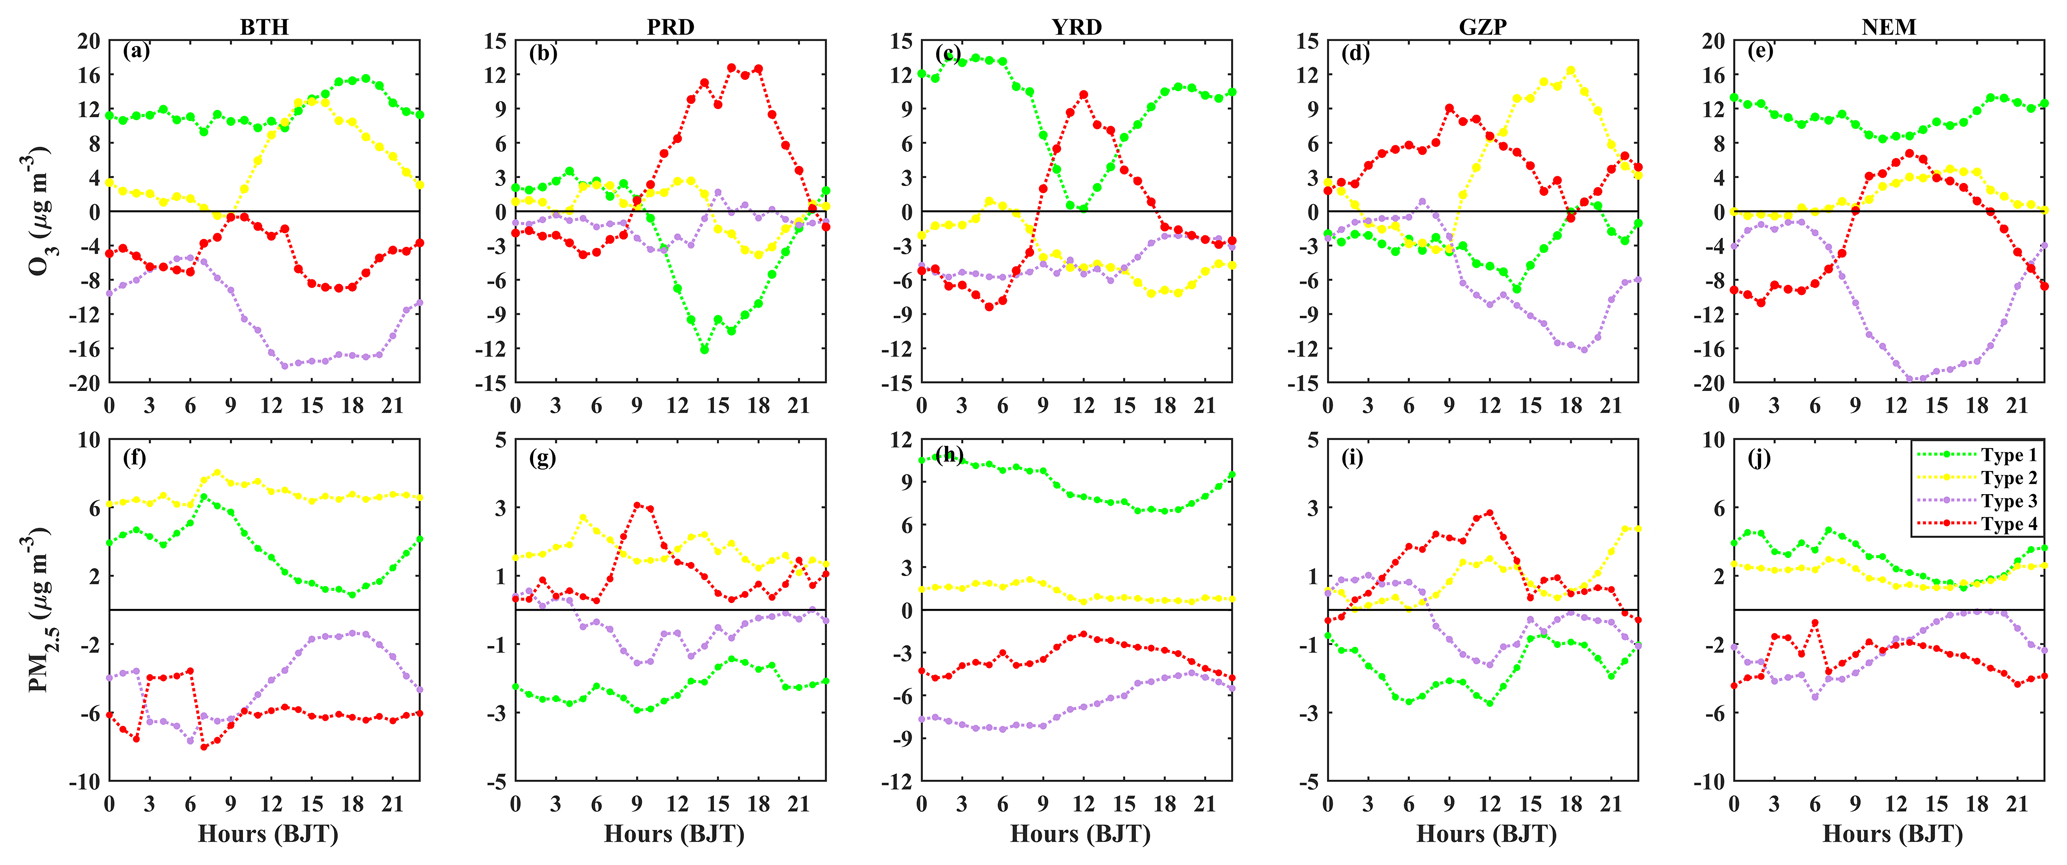
Figure 7Daily variations of O3 and PM2.5 anomalies under the four SWPs in key urban clusters.
In summary, Type 1 was prone to the formation of O3–PM2.5 compound pollution (that is, when the ground MDA8 O3 concentration exceeded 160 µg m−3, the PM2.5 concentration also exceeded 75 µg m−3) in the area from the BTH to northern YRD regions (Fig. S6 in the Supplement), which can be denoted as “BTH–NYRD O3–PM2.5 compound pollution”. In detail, Fig. S8 in the Supplement shows the number and probability of occurrence of compound pollution days at each site in summer during 2015–2018, indicating that a high occurrence probability (maximum values approaching 46.7 %) of compound pollution appeared over the NCP (to the north of 32∘ N) and that approximately 55.6 % of compound pollution occurrence days at all sites occurred under Type 1. Similarly, Type 2 can also be denoted as “BTH O3–PM2.5 compound pollution”, with compound pollution occurrence days accounting for 33.8 %, Type 3 as “BTH–YRD–PRD O3-only pollution” and Type 4 as “BTH–GZP–YRD–PRD O3-only pollution” (Fig. 12).
3.4 Analysis of local meteorological factors
To explore the meteorological causes of O3 and PM2.5 pollution, we analyzed the distribution of the average and anomalies for Tmax, RH, PF, BLH and FLWD under the four SWPs (Figs. 8 and 9; Figs. S9 and S10 in the Supplement). Under the influence of the EASM, over 80 % of the stations experienced high temperatures () under each SWP, although the anomaly of Tmax under Type 1 (early summer) presented as negative (Fig. 8a). Type 1 was characterized by humid conditions in the southern area and dry conditions in the northern region owing to an extensive southwestern flow of the WPSH, resulting in a rain belt found in southeastern coastal areas such as the PRD and YRD regions. Type 2 was associated with meridional flow and dry and wet anomalies in northern China, resulting in a rain band located over the central areas between the BTH and YRD regions owing to the northern advancement of the WPSH compared with Type 1. Furthermore, there was higher RH for most of the study sites under Type 3 and Type 4, possibly because of the shifted rain belt in the BTH and NEM regions under Type 3 once the northern boundary of the WPSH reached 37.5∘ N, and an occurrence of heavy precipitation across the western PRD region as well as central areas between the BTH and YRD regions under Type 4 (Fig. S9 in the Supplement).
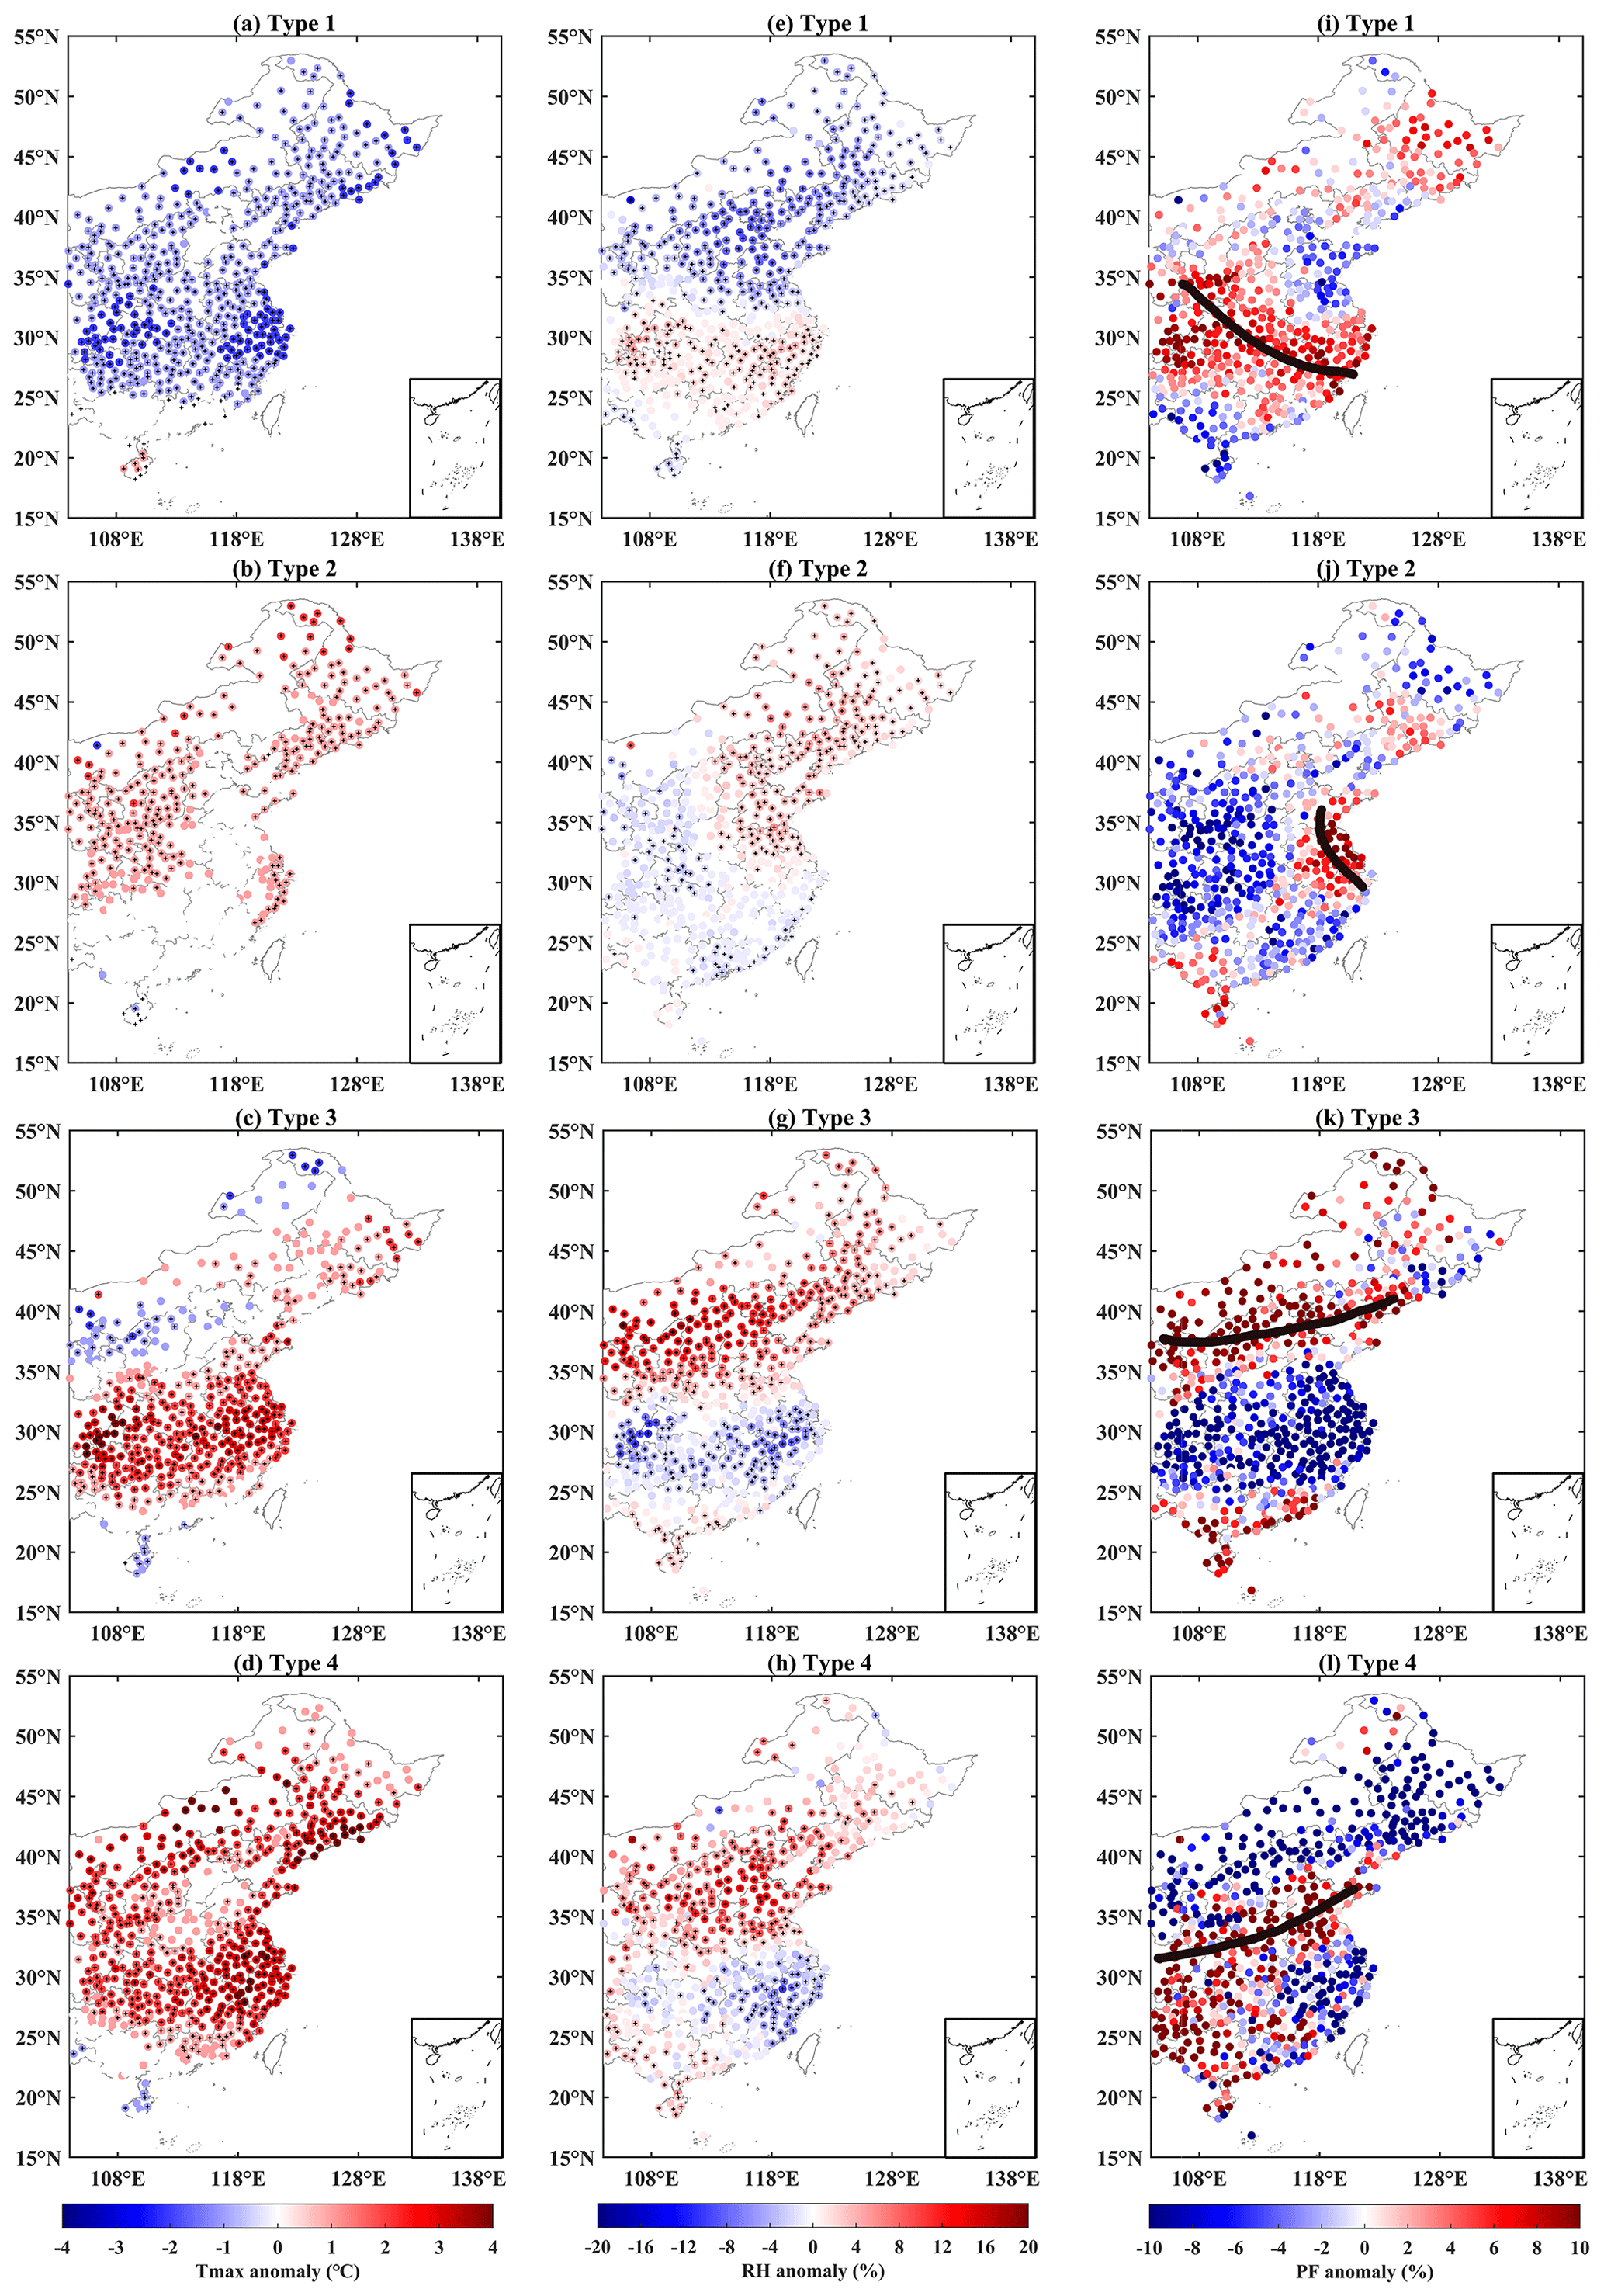
Figure 8As in Fig. 6 but for Tmax (a–d), RH (e–h) and PF (i–l). The black solid line presents the rain belt of each SWP.
In terms of their anomalous spatial distributions, the positive anomalies of Tmax were located in the southern region under Type 3 and most of the eastern region under Type 4; since Type 1 always appeared in early summer, most areas were negative (Fig. 8a–d). For RH, Types 2, 3 and 4 were negative for the south and positive in the north, while the opposite was true under Type 1 (Fig. 8e–h). PF was characterized by positive anomalies in the area south of the Yangtze River under Type 1, in the YRD region under Type 2, in the BTH and NEM regions under Type 3, and in the area between the BTH and YRD regions under Type 4 (Fig. 8i–l). As can be seen from Fig. 9, when the BLH at 14:00 BJT had a positive anomaly, the contrary FLWD had a negative anomaly (e.g., BTH in Type 1), which indicates that the higher the BLH and lower the FLWD, the more conducive it was to the diffusion of pollutants; conversely, a lower BLH and higher FLWD (such as BTH under Type 2) did not support the diffusion of pollutants. After further inspection of Fig. S10 in the Supplement, we found that the YRD region under Type 1, the YRD under Type 2, and the BTH and PRD regions under Type 3 and 4 had shallow BLHs and high FLWDs, which was detrimental to the transportation of pollution in these areas, thus corresponding to high levels of pollution under these weather patterns. However, there was also more serious pollution in some higher BLH areas, such as in the BTH region under Type 1, which we discuss next.
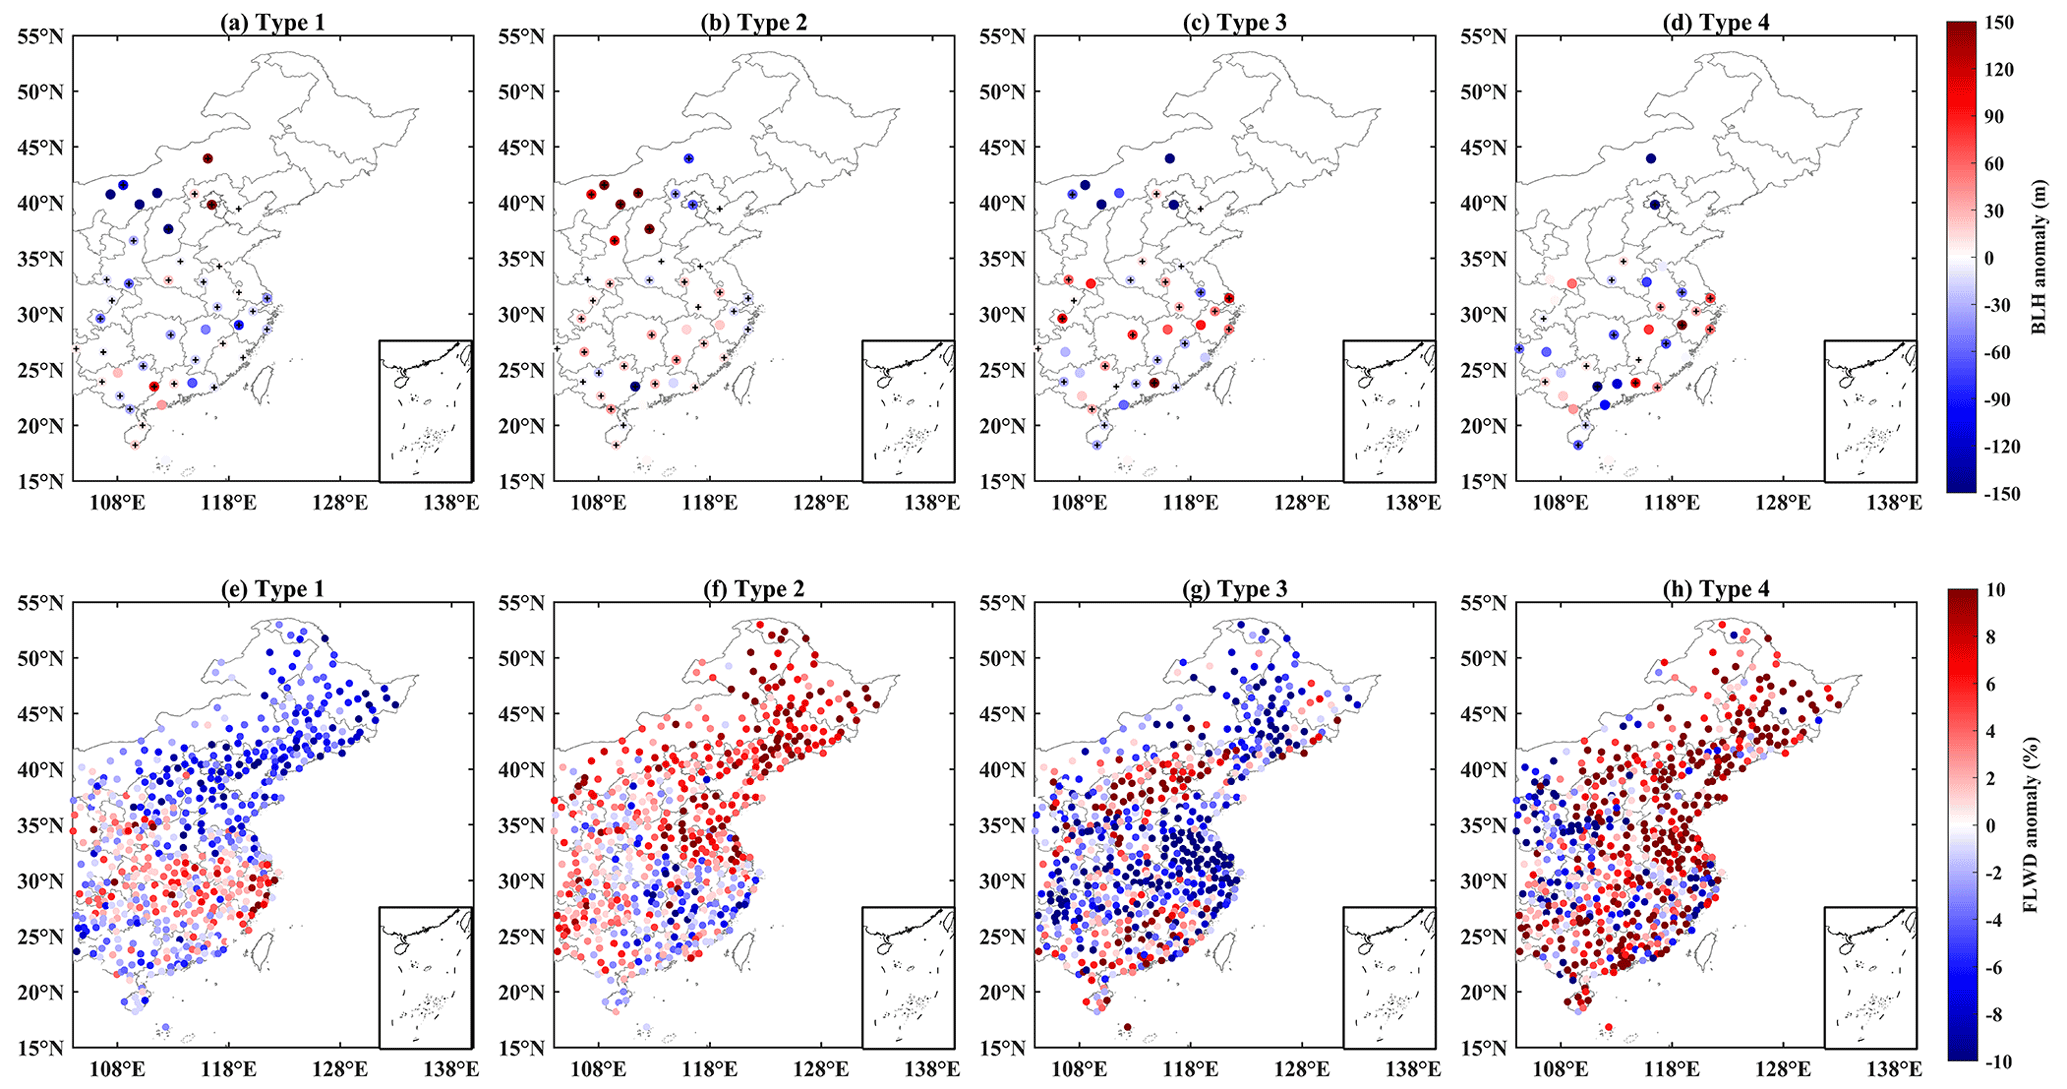
Figure 9As in Fig. 6 but for the BLH at 14:00 BJT (a–d) and FLWD (e–h).
3.5 Potential implications of NO2
The photochemical production of O3 mainly involves emissions of volatile organic compounds and NOx from anthropogenic, biogenic and biomass burning sources (Deng et al., 2019; Gvozdić et al., 2011; Sillman, 2002). The photochemical reaction of NO, NO2 and O3 in the troposphere forms a closed system (Yu et al., 2020), and this photochemical cycle of NOx and O3 is the basis of photochemical processes in the troposphere. Oxidant (OX, OX = O3+ NO2), a conservative quantity over short timescales, is defined as a parameter to evaluate the photochemical processes and, due to the unstable nature of NO, it can quickly react with the equivalent amount of O3 to generate NO2 (Kley et al., 1994). In order to compare the photochemical reaction efficiency of the five urban clusters under the different SWPs, Fig. 10 presents the daily variations of NO2 and OX. As we can see, the daily variations of NO2 showed two peaks during a day, including a first peak in the morning and a second peak associated with traffic emissions in the evening (Xie et al., 2016; Yu et al., 2020). As we found the lowest point of NO2 at 15:00 BJT and since NO2 can be photolyzed to produce O3 during the day, we assumed that this particular time was the peak time for O3 formation across the study areas. As NO2 is consumed through a photochemical reaction with the involvement of other precursors to produce a large amount of O3, OX can form a peak in the afternoon. In particular, abundant sunlight in summer is beneficial to the photochemical reaction process, but since most parts of eastern China are under a subtropical climate with the same period of rain and heat, the existence of the rainy season will inevitably inhibit the summertime photochemical process. Under the different SWPs, the photochemical reaction over each area bore an obvious relationship with the rain belt. For example, the rainy season in the BTH and NEM areas mainly occurred under Type 3 and the OX of Type 3 in this area was significantly lower than under the other SWPs.
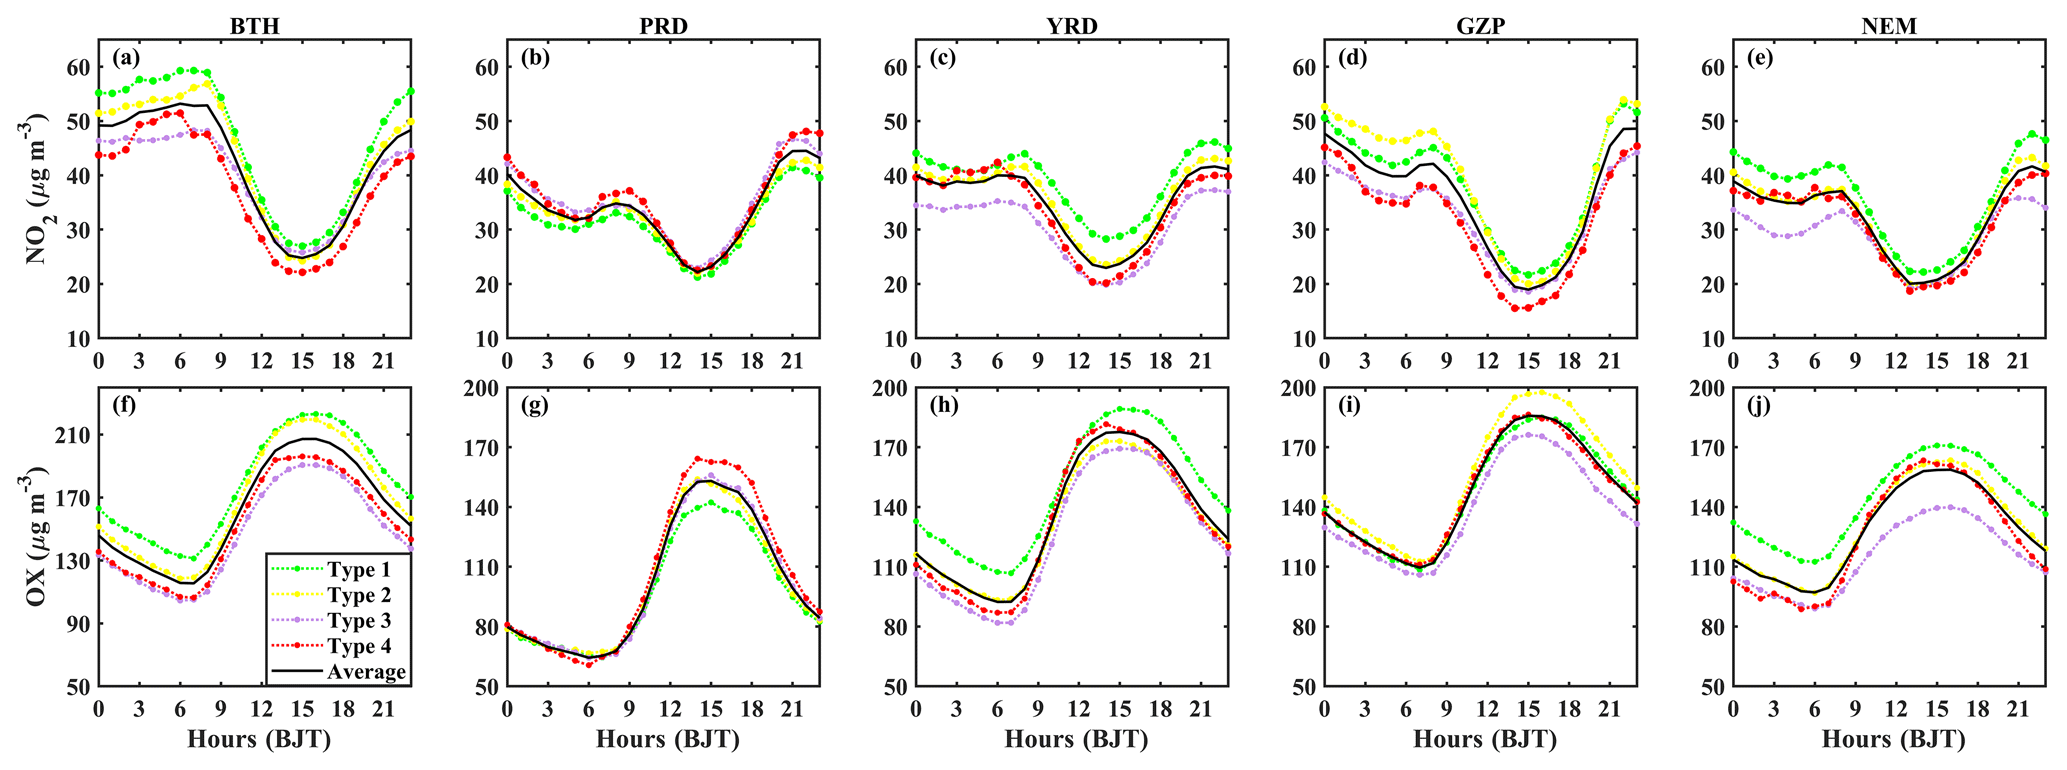
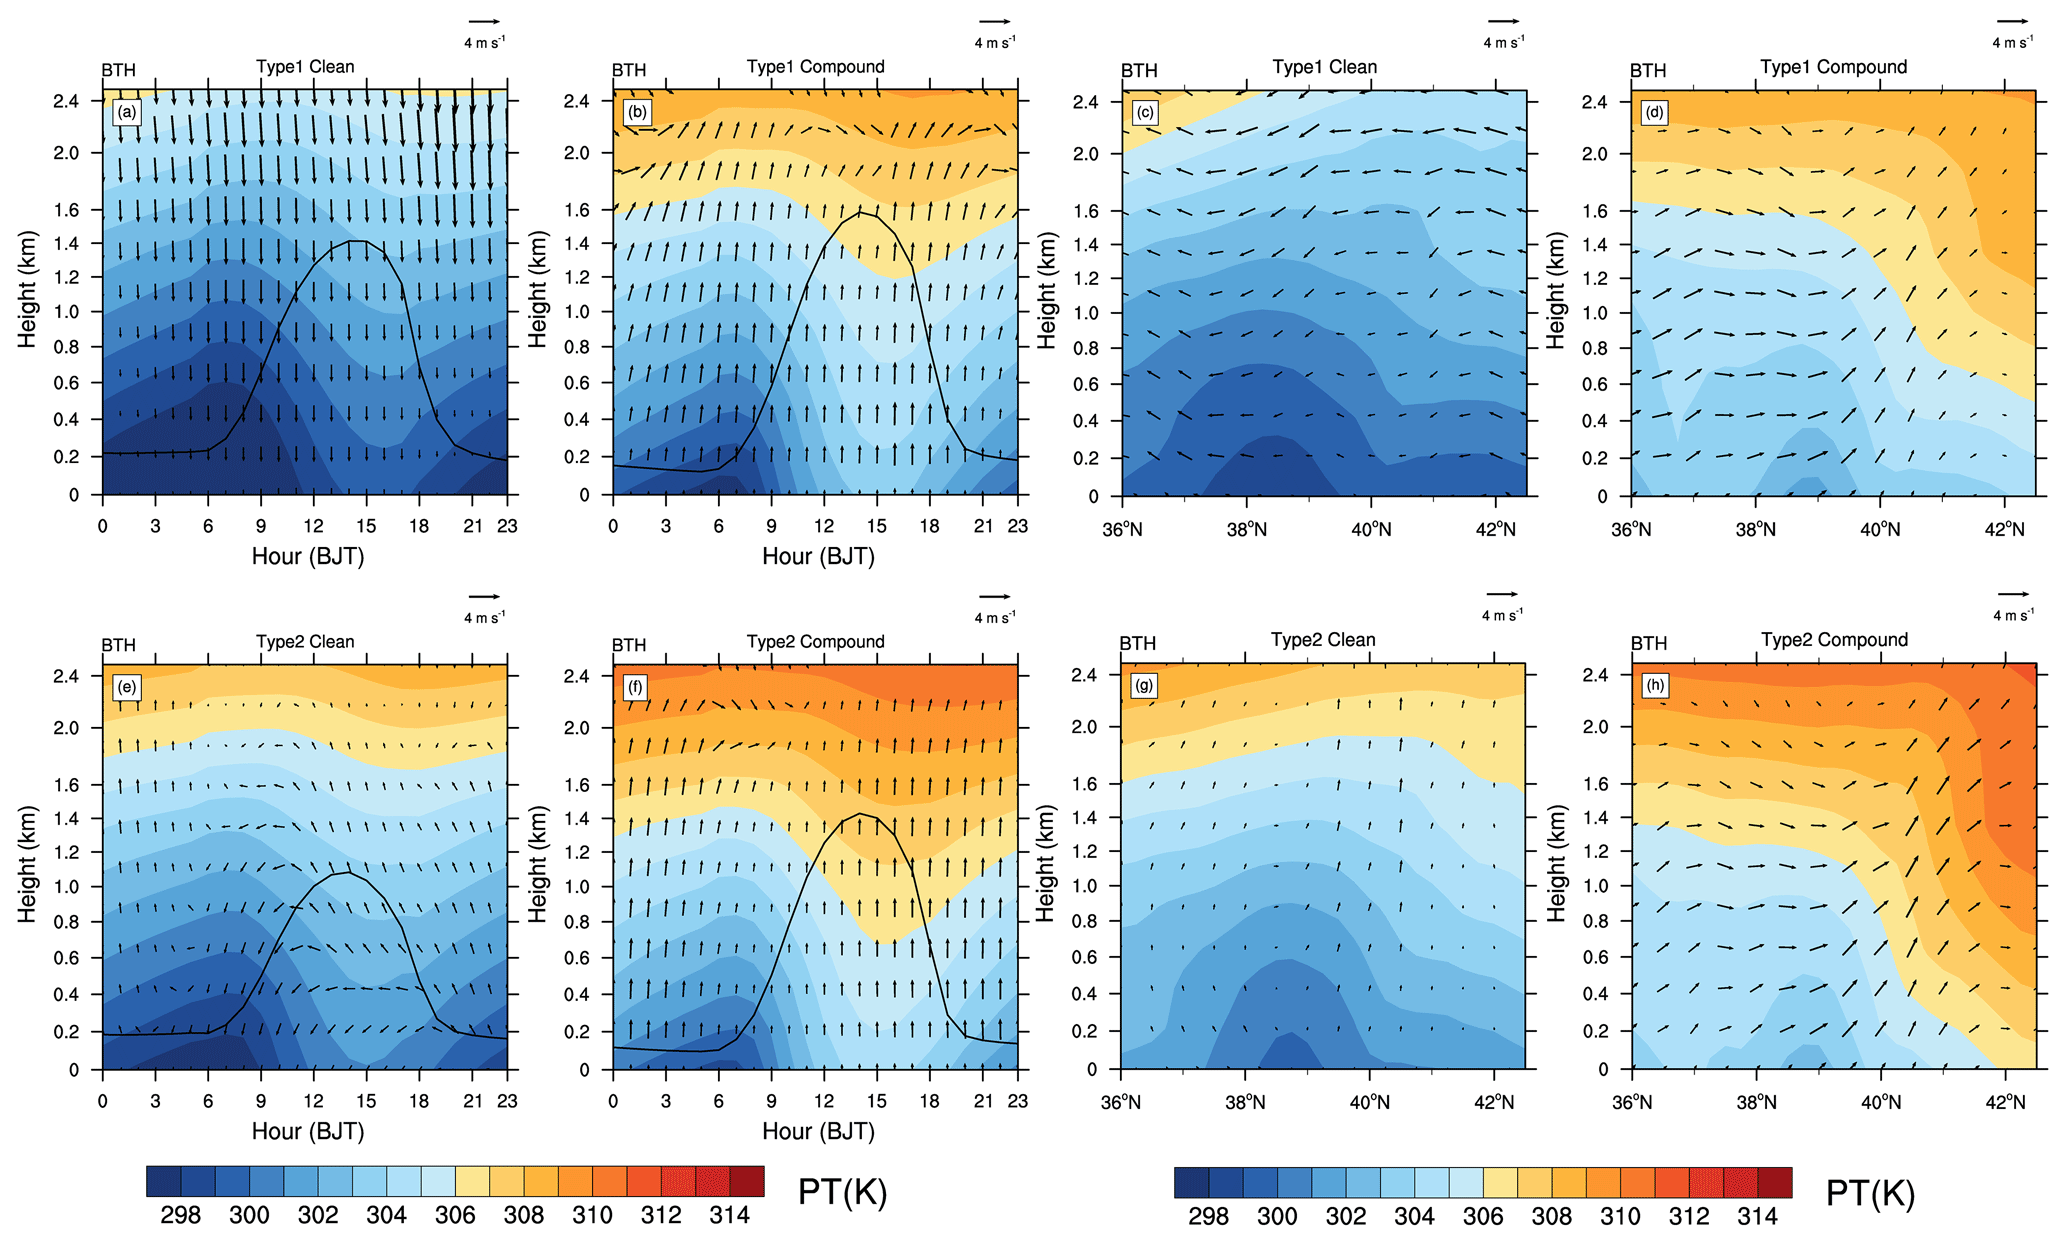
Figure 11Daily variations of horizonal wind, potential temperature and BLH in the BTH area during clean and compound pollution periods under Type 1 and Type 2 (a, b, e, f). The vertical cross section of u wind, w wind and potential temperature for the same situation in the BTH region (c, d, g, h). The w wind is multiplied by 100 when used. The data are from ERA5 reanalysis.
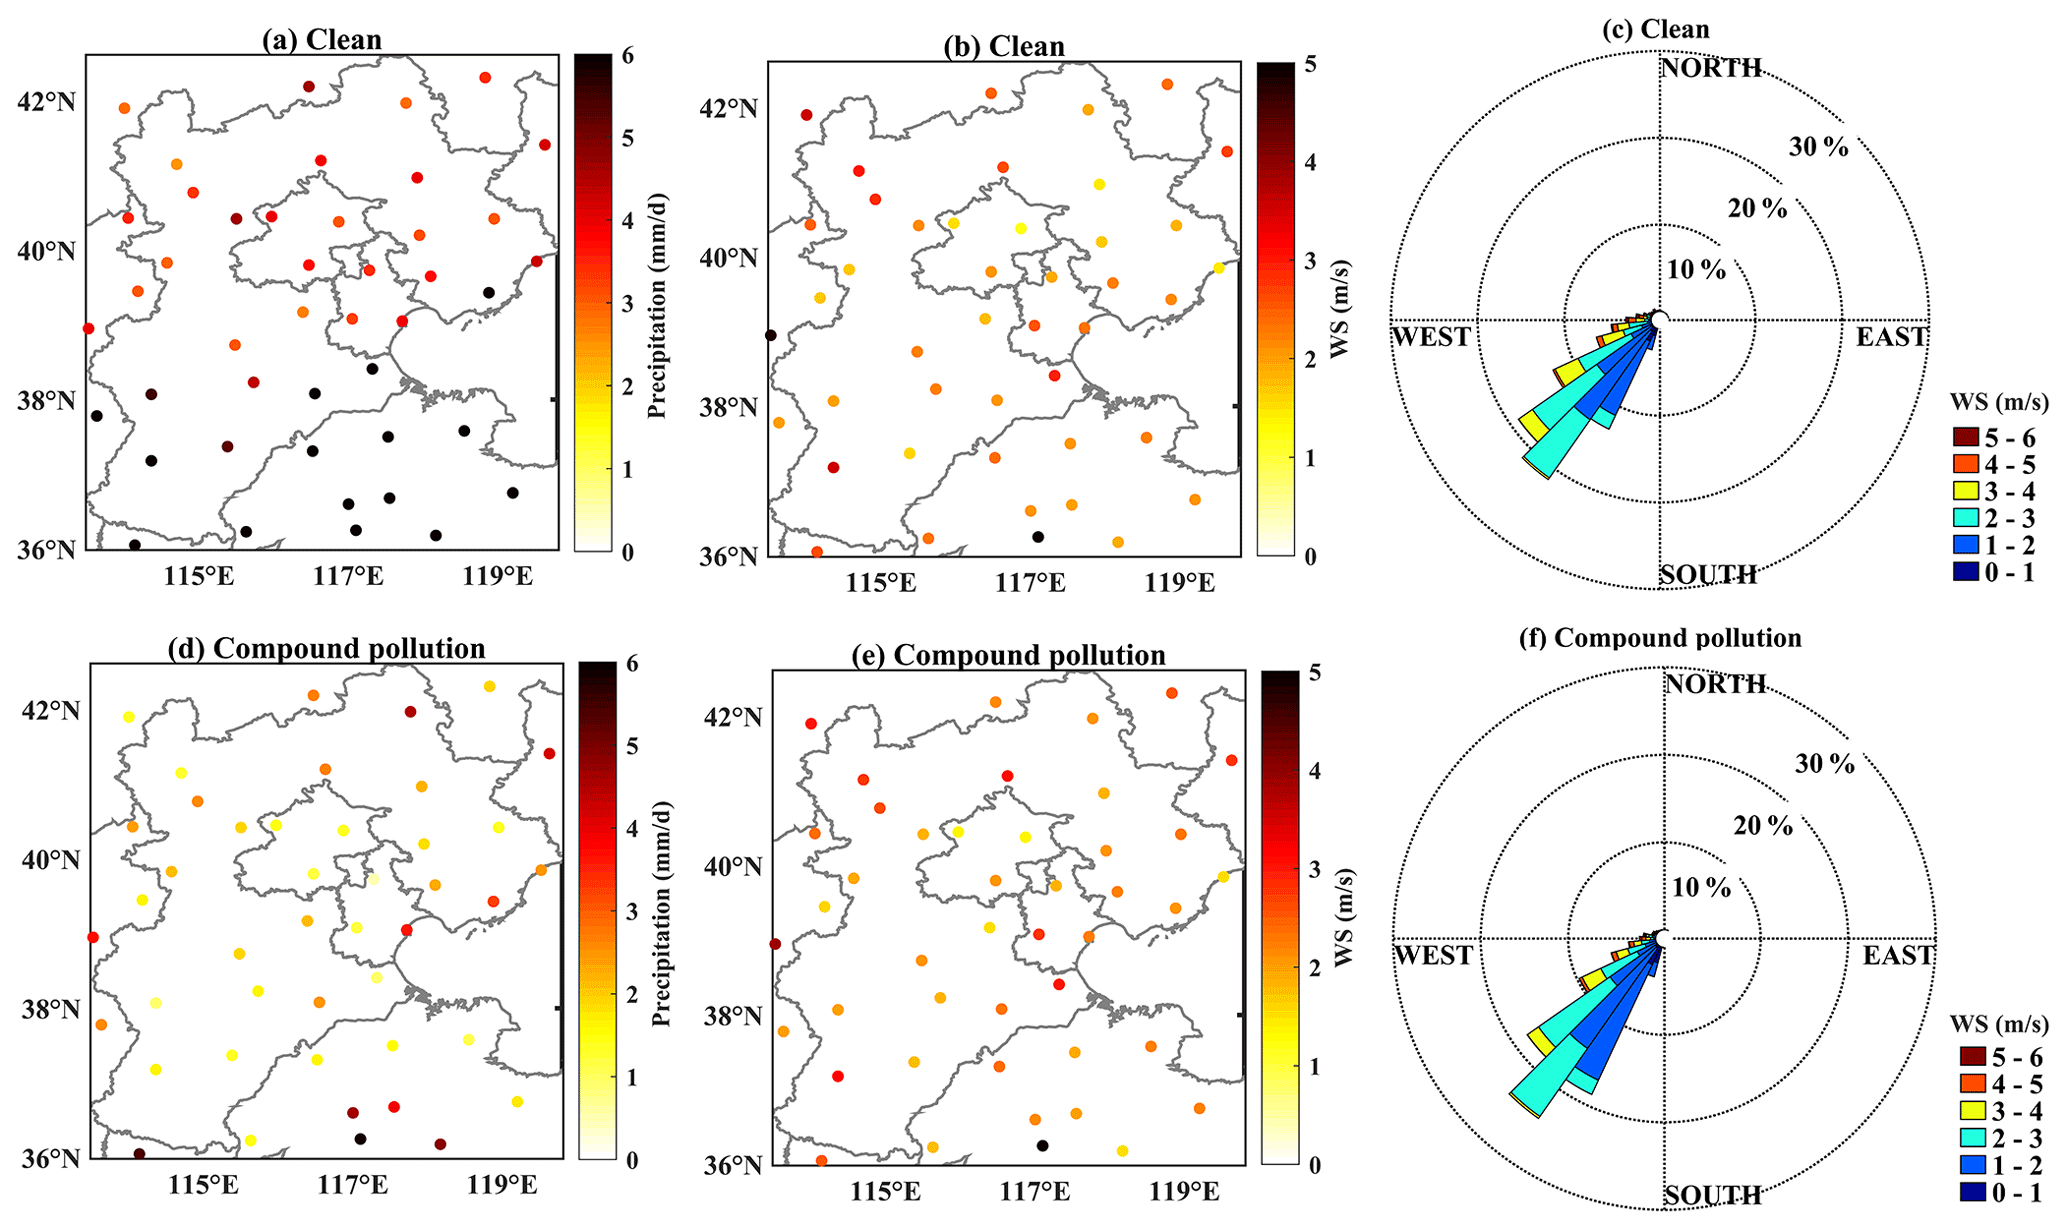
Figure 12Precipitation, WS and WD during clean and compound pollution periods under Type 1 over BTH.
In the last section, we discussed how the SWPs and local meteorological factors modified the summertime O3 and PM2.5 pollution. However, how did the boundary layer structure interact with the co-occurrence of O3 and PM2.5 pollution? To address this question, we conducted some further analysis as follows. As mentioned, the co-occurrence of O3 and PM2.5 pollution mainly took place in the BTH–NYRD areas under Type 1 and in the BTH area under Type 2. Lower WS and its negative anomalies at a lower boundary layer over the BTH–NYRD under Type 1 and over the BTH area under Type 2 may not have enhanced the diffusion of air pollutants (Fig. S11 in the Supplement). In contrast, the moderate RH and its negative anomalies might have favored the formation of compound pollution. Downward vertical motion and negative anomalies might also have stabilized the atmospheric characteristic of the boundary layer (Fig. S12 in the Supplement). Furthermore, we summarized the boundary layer structure, precipitation and ground-level wind flow across the BTH region. Based on their characteristics, we separately defined Type 1 and Type 2 into clean (the concentrations of both O3 and PM2.5 were less than the level of pollution) and compound pollution periods (Figs. 11–13). It can be clearly seen that various precipitation events primarily caused differences in concentrations of both O3 and PM2.5 between clean and pollution days under Type 1/Type 2 (see Figs. 12–13). In particular, Type 1 had significantly warmer temperatures over the boundary layer during the compound pollution periods of the BTH region, as compared with the clean periods. The daytime BLH under the compound pollution condition was also higher than that under the clean condition. In addition, there were different directions of prevailing winds during the two periods. The prevailing southerly winds during the compound pollution period may have driven the transportation of air pollutants from the southern NCP, resulting in more serious pollution (Fig. 11), which is consistent with the results of Miao et al. (2017, 2019). Miao et al. (2020) also proposed another mechanism – that is, the synoptic southerly warm advections at the top of planetary boundary layer (PBL) can strengthen the elevated thermal inversion layer and suppress the development of the PBL, causing worse pollution. Co-influenced by the topographical effect of the northern mountainous areas and the boundary layer structure, air pollutants could be trapped in the BTH region. In comparison, although there was a southerly prevailing wind in the BTH region (Figs. 11 and 13), the rain belt under Type 2 being located in the southern area of the BTH might have led to the potential removal of PM2.5 over this area (Fig. 9j), so the pollutants transported from the southern NCP would be partially reduced. Therefore, we can conclude that the emissions of local pollutants accompanied by unfavorable meteorological conditions will continuously accumulate pollutants (Figs. 12–13; Gui et al., 2019; Zhang et al., 2020), which should be main cause of the BTH compound pollution. In summary, the different SWPs modulated the regional variability of summertime O3 and PM2.5 via changes to the local meteorological conditions as follows:
-
Type 1: Under the conditions of high temperatures (Tmax > 27∘), moderate humidity (RH ∼ 60 %) and low PF, photochemical reactions were greatly promoted to cause severe O3 pollution. Meanwhile, the BTH–NYRD areas were located in front of the westerly trough, under the influence of the warm and humid air of the WPSH, and so the hygroscopic growth of fine particulates potentially caused a certain amount of PM2.5 pollution (Li et al., 2017; Zhang et al., 2016), eventually becoming becoming O3–PM2.5 compound pollution (Fig. 14). In addition, the prevailing southerly winds in the boundary layer were able to transport the pollutants emitted from southern cities to the BTH, atmospheric stratification was stable when the air mass was sinking (Miao et al., 2019; Figs. 11 and S12 in the Supplement) and compound pollution may have been especially severe. Although a relatively high BLH occurred in the BTH region, the prevailing southerly winds in the boundary layer served to further increase the pollution.
-
Type 2: O3 pollution was severe under the meteorological conditions of high temperatures, moderate humidity and weak precipitation. The PM2.5 in the BTH region, which was located in front of the westerly trough, was high since the shallow boundary layer and low wind frequency were unfavorable for the diffusion of pollutants. Therefore, O3–PM2.5 compound pollution was also rather frequent (Fig. 14).
-
Type 3: High temperatures, low humidity and weak precipitation over the YRD region tended to generate a large amount of O3, while the positive BLH and negative FLWD anomalies were unfavorable to O3 accumulation. On the other hand, summer typhoon activities might have weakened the WPSH intensity over the YRD region, leading to the eastward retreat and northward shift of the WPSH. As a result, the high WS across coastal areas was able to ease the ground-level O3 pollution (Shu et al., 2016). For the BTH and PRD regions, the high PF tended to suppress the production of O3.
-
Type 4: High temperatures, medium-high humidity and weak precipitation in the GZP and PRD regions were able to cause O3–PM2.5 compound pollution, but the PM2.5 pollution in both regions was not heavy, possibly in relation to local lower emissions of pollutants. Under the control of the WPSH, there were strong photochemical reactions at high temperatures and little rainfall in some eastern regions (such as the northern BTH, YRD), which was also conducive to O3 generation (Fig. 14). Meanwhile, relative to Type 1, O3 pollution was lighter in the BTH, due to the differences of RH, BLH and FLWD.
It is important to note that our work contains a few limitations and uncertainties. Although T-PCA, an objective classification method, was chosen in this study, there were still some subjective decisions made, e.g., the number of SWPs (Huth et al., 2008). In the present work, we selected four SWPs based on both the larger ECV and greater ΔECV to further reduce the subjective impact. Nevertheless, at a large scale, the present four SWPs were closely associated with intra-seasonal movements of the WPSH, because the WPSH is one of the most important components of the present large-scale SWPs in summertime (Zhao and Wang, 2017). In addition, note that short-term disturbances induced by typhoons with a specific pattern were not excluded. The quick passage of a typhoon in summer could lead to various atmospheric processes (e.g., precipitation, large-scale subsidence) and pollution levels (Deng et al., 2019), which should be explored in future work. In addition, although this study emphasizes the important impacts of large-scale synoptic drivers of co-occurring summertime O3 and PM2.5 pollution in eastern China, the presence of PM2.5 may play a role in radiation forcing to reduce O3. Indeed, the interaction between O3 and PM2.5 is deserving of further exploration in future work to better comprehend the mechanism of O3–PM2.5 compound pollution.
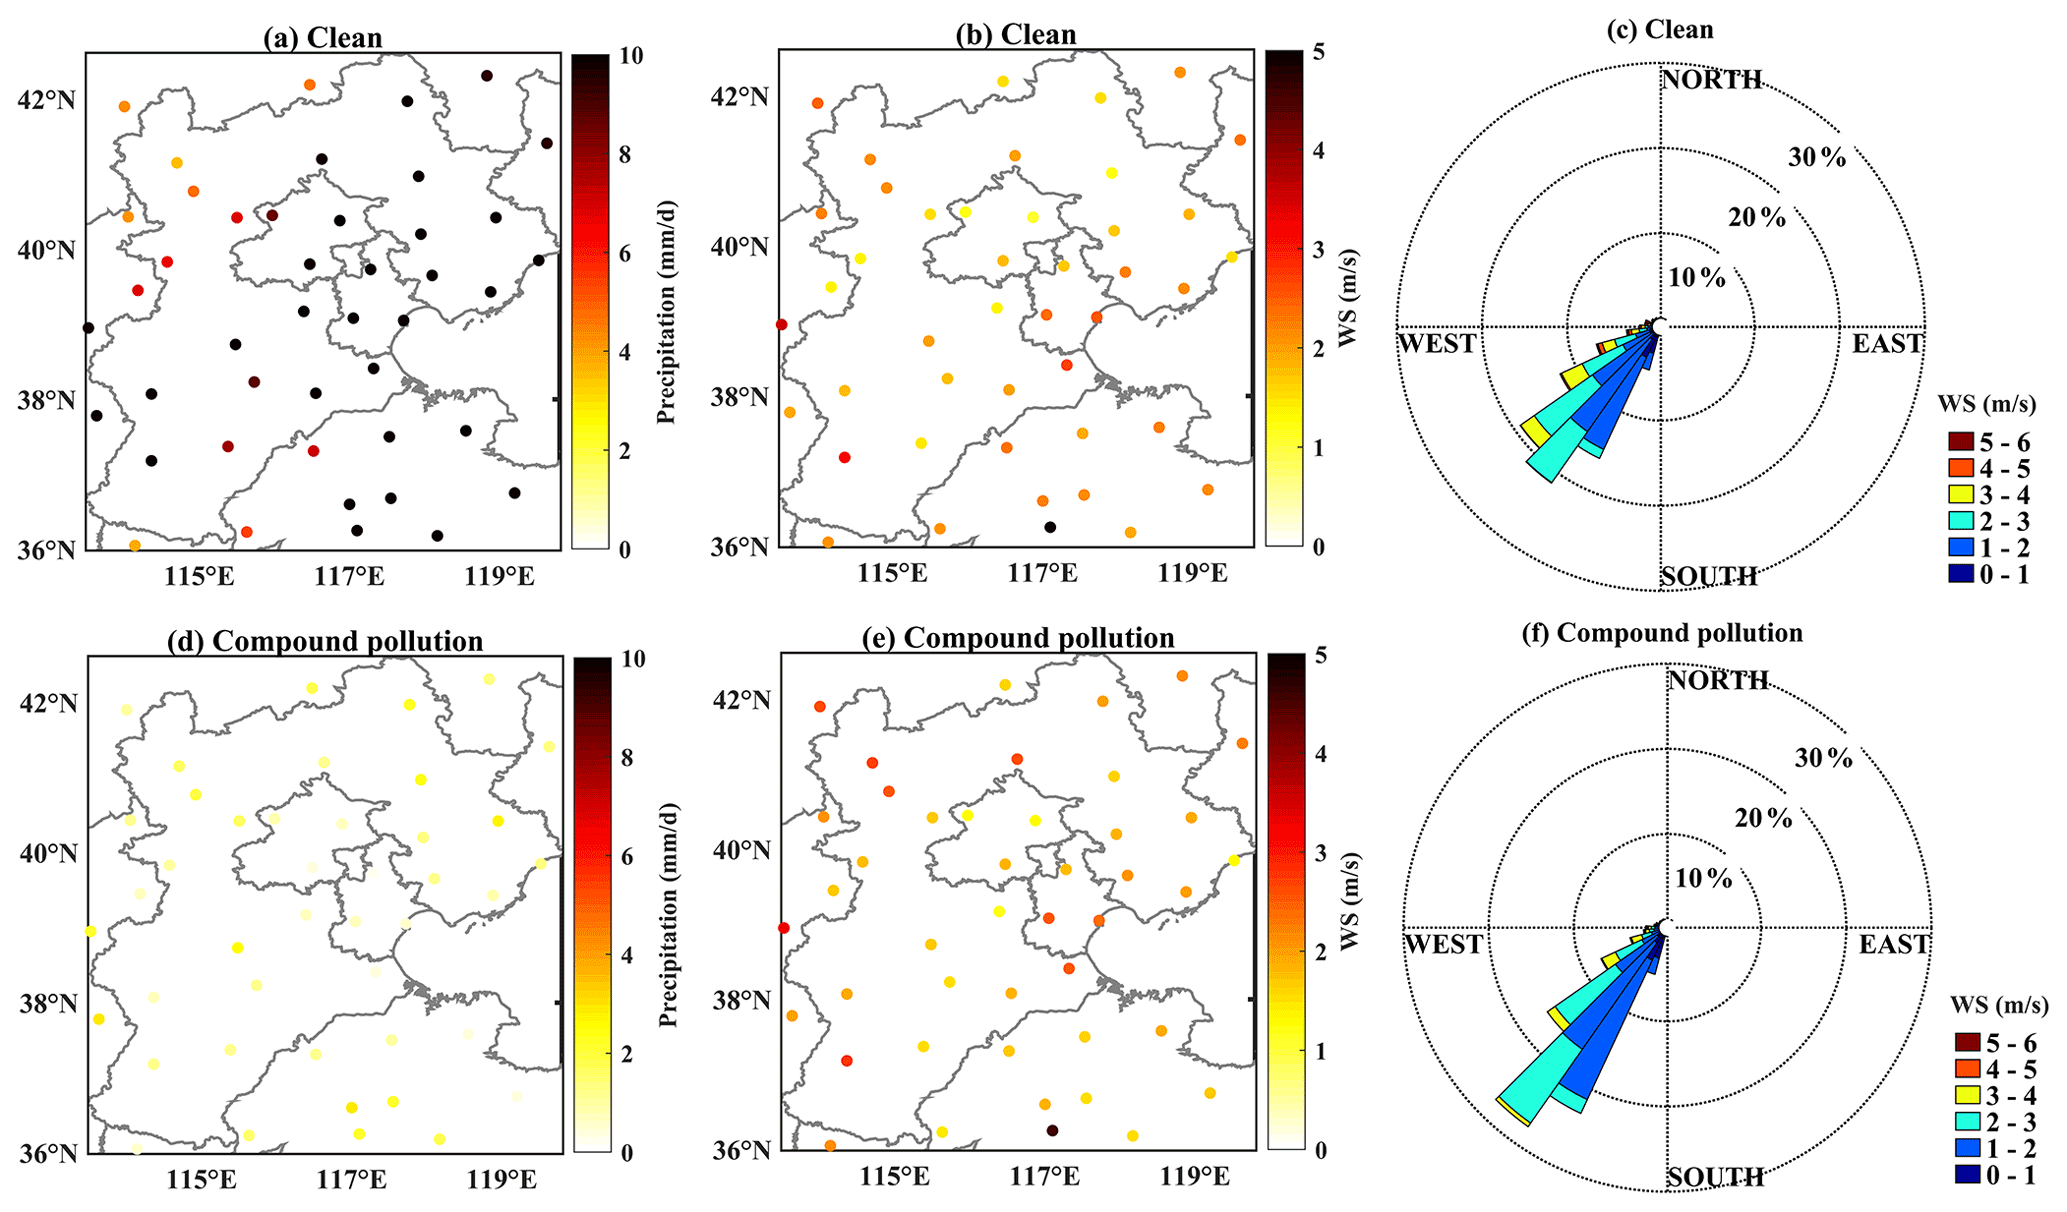
Figure 13As in Fig. 12 but for Type 2.
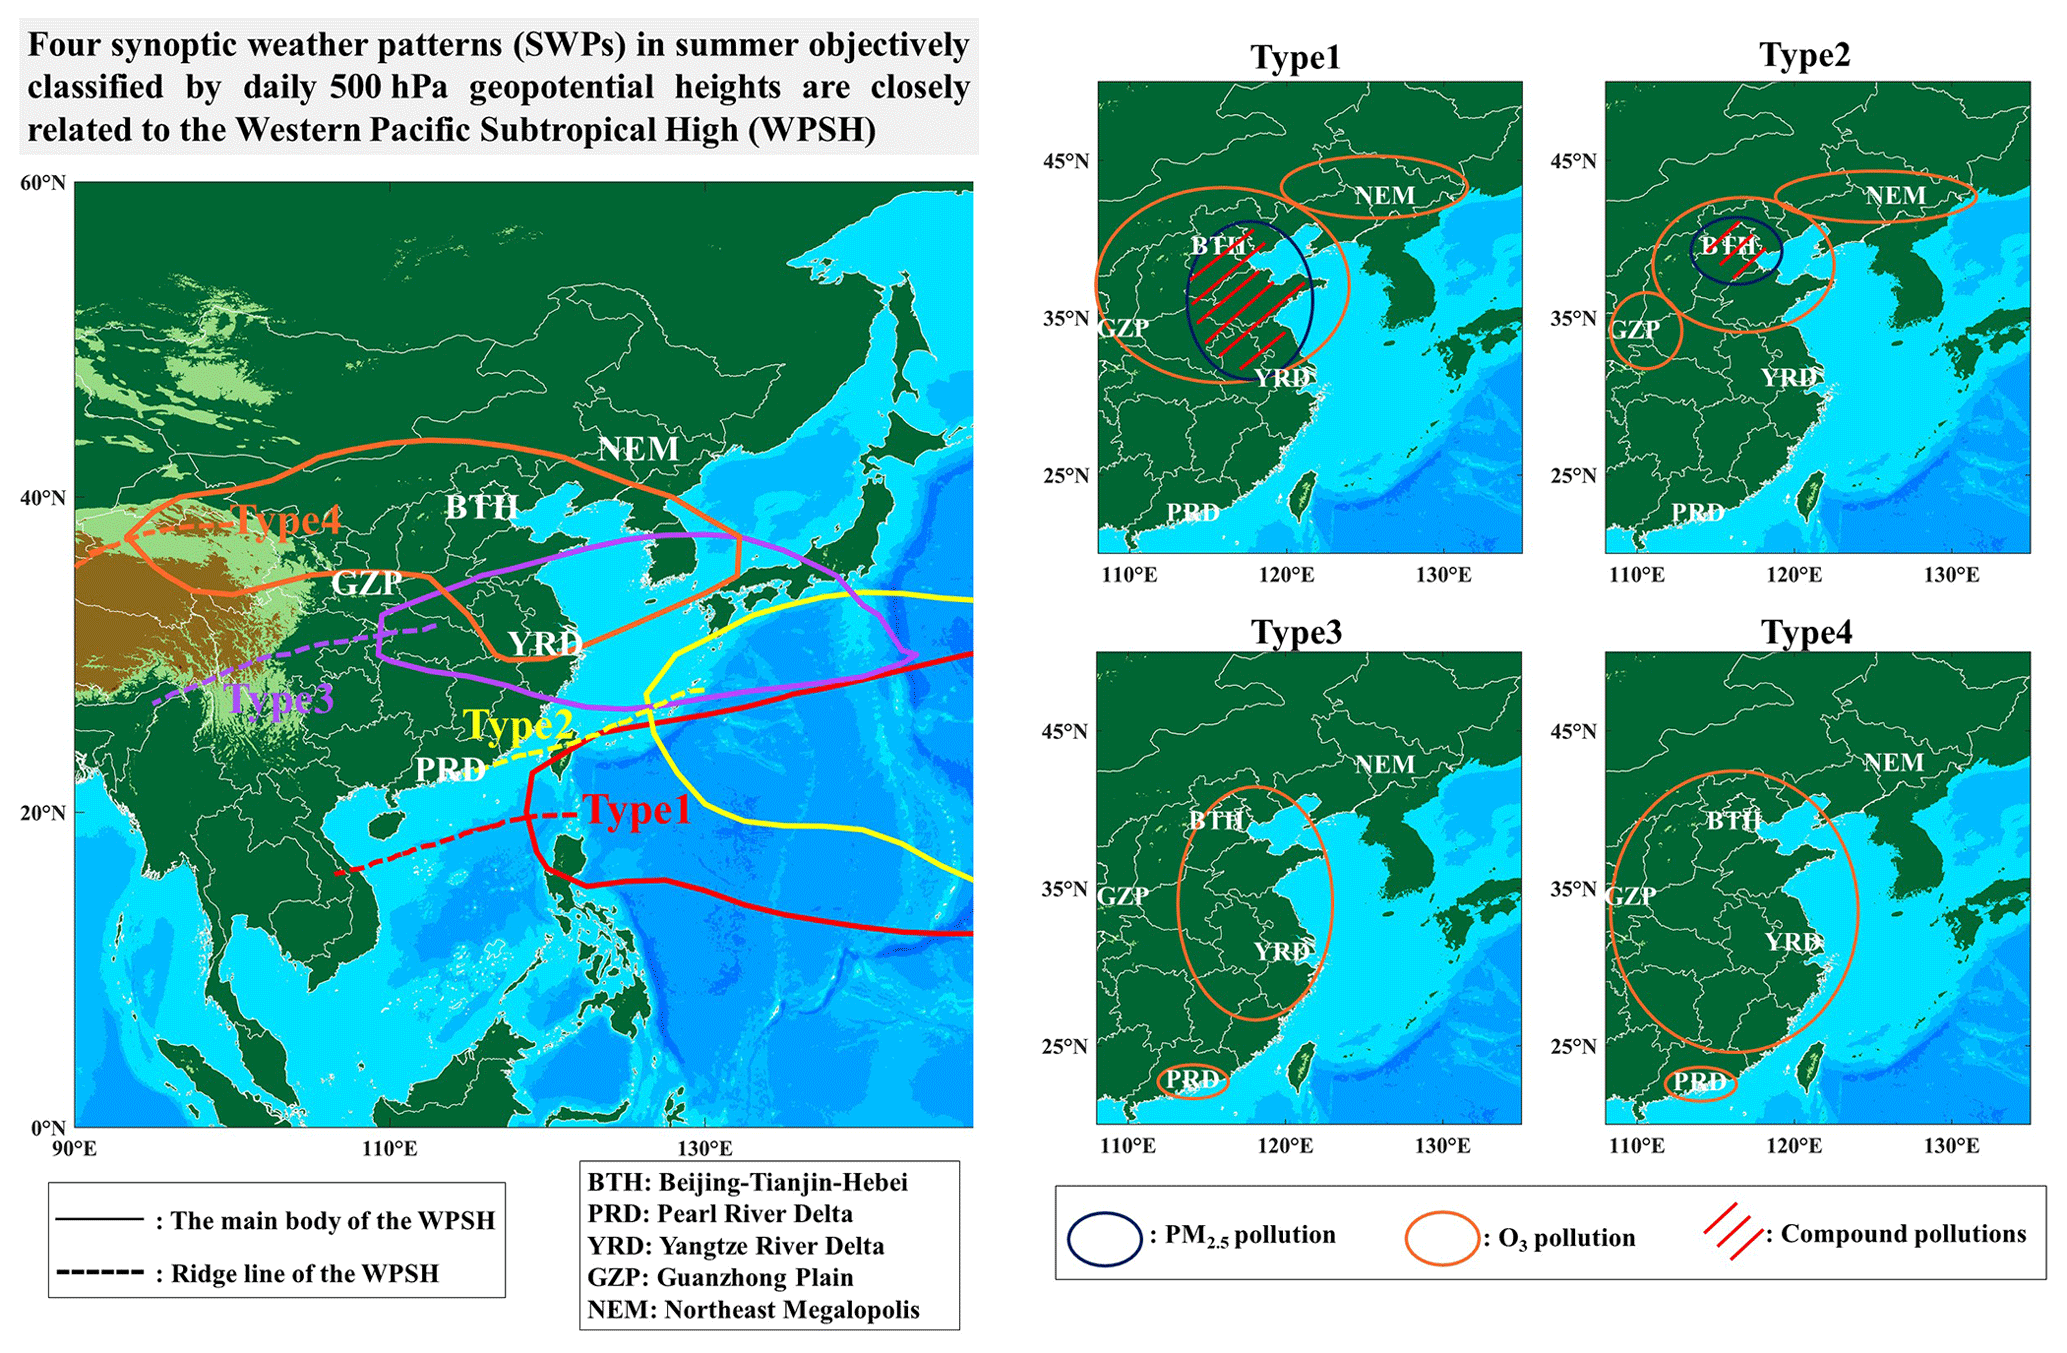
Figure 14Schematic diagrams describing the relationships between the WPSH, four SWPs and summertime O3 and PM2.5 pollution in various regions.
In this study, T-PCA, an objective classification method, was applied to classify the 500 hPa weather circulation pattern into four SWPs in the summers of 2015–2018. It was found that these four SWPs were closely related to the development of the WPSH. The spatial and temporal distribution characteristics of O3 and PM2.5 pollution in eastern China under the four SWPs were analyzed to regulate and differentiate O3 and PM2.5 pollution in key areas. We found two synoptic patterns were prone to leading to the co-occurrence of O3 and PM2.5 pollution: in BTH–NYRD areas under Type 1 and in the BTH area under Type 2, which were associated with double-high levels of O3 and PM2.5. The probabilities of compound pollution at all sites under Type 1, 2, 3 and 4 were 54.3 %, 33.8 %, 6.8 % and 5.1 %, respectively.
The Type 1 weather pattern appeared frequently in early summer with a stable WPSH ridge axis at about 22∘ N, and the warm and humid air brought by the WPSH reached the area south of the Yangtze River, where a hot and humid Meiyu season was formed, with the high humidity suppressing the photochemical reaction of O3 generation. Meanwhile, the north of China was controlled by a low-pressure trough at 500 hPa with high temperatures and little rain. The hygroscopic growth of PM2.5 occurred in the corresponding area in front of the trough, with a small amount of water vapor transported by the WPSH, causing compound pollution of O3 and PM2.5 in the BTH–NYRD regions. In addition, the prevailing southerly winds in the boundary layer were able to transport the pollutants emitted from southern cities to the BTH region, and the atmospheric stratification was stable when the air mass was sinking. Thus, the compound pollution was potentially severe. In general, the synoptic circulation in the boundary layer might be responsible for the concentration of pollutants under this SWP.
Under Type 2, the WPSH shifted northwards from Type 1 or retreated southwards from Type 3 or Type 4 to 32.5∘ N with the meridional deepening of the East Asian major trough at 500 hPa, and thus warm and humid airstreams were brought to northern China (e.g., the BTH region), gradually elevating temperatures and humidity. Although the positive RH anomaly promoted the hygroscopic growth of PM2.5, water vapor absorbed solar radiation, leading by contrast to reduced O3 formation. As a result, the probability of double-high levels of O3 and PM2.5 under Type 2 was less than under Type 1, and the extent of compound pollution under Type 2 was also narrowed, which was mainly located in the BTH area. On the other hand, weak precipitation, a shallow boundary layer and low WS in the BTH area tended to create favorable conditions for the maintenance of pollution. In spite of the southerly winds over the BTH area, the precipitation in southern cities reduced pollutant concentrations and horizontal transportation. Meteorological factors might have been responsible for the accumulation of compound pollution.
In general, the location of the WPSH was found to be tightly associated with O3 pollution in eastern China, and the changes in meteorological conditions in different regions affected by the WPSH induced significant regional differences in O3 and PM2.5 pollution. On one hand, appropriate warm and moist flow brought by the WPSH promoted hygroscopic growth of the fine particulate matter in some local areas (i.e., the BTH–NYRD areas under Type 1 and the BTH area under Type 2), resulting in increased of PM2.5 concentrations. On the other hand, transboundary O3 and PM2.5 were simultaneously transported to these local areas, which may have contributed to the formation of co-occurring surface O3 and PM2.5 pollution. More importantly, the effects of various large-scale weather circulation patterns on O3–PM2.5 compound pollution and their corresponding physical and chemical processes have been clarified, which has important scientific reference value in terms of summertime air-quality forecasts as well as assessment and policymaking services.
Hourly PM2.5, NO2, O3 and O3-8 h data are published by the China National Environmental Monitoring Station (2021, http://www.cnemc.cn/). Surface meteorological data, such as Tmax, precipitation, WS and RH, and radiosonde data can be obtained from the China National Meteorological Information Center of the China Meteorological Administration (2021, http://data.cma.cn/site/index.html). The NCEP/NCAR daily reanalysis dataset can be downloaded from https://psl.noaa.gov/data/gridded/data.ncep.reanalysis.html (Physical Sciences Laboratory, 2021). The ERA5 hourly reanalysis dataset can be derived from https://cds.climate.copernicus.eu/cdsapp#!/home (European Centre for Medium-Range Weather Forecasts, 2021).
The supplement related to this article is available online at: https://doi.org/10.5194/acp-21-9105-2021-supplement.
YY designed the research. LZ and YY developed and wrote the manuscript. LZ and YY collected and analyzed the data. MG, HW, PW, HZ, LW, GN, CL, YL and ZG provided useful comments. All the authors contributed to the revision of the manuscript.
The authors declare that they have no conflict of interest.
We thank editor, Stefan Rahimi-Esfarjani and two anonymous reviewers for their constructive comments.
This research has been supported by the National Natural Science Foundation of China (grant nos. 42061134009, 42075072, and 41575010) and the National Key Research and Development Program of China (grant no. 2018YFC1506502).
This paper was edited by Xiaohong Liu and reviewed by Stefan Rahimi-Esfarjani and two anonymous referees.
Amil, N., Latif, M. T., Khan, M. F., and Mohamad, M.: Seasonal variability of PM2.5 composition and sources in the Klang Valley urban-industrial environment, Atmos. Chem. Phys., 16, 5357–5381, https://doi.org/10.5194/acp-16-5357-2016, 2016.
Cai, W., Li, K., Liao, H., Wang, H., and Wu, L.: Weather conditions conducive to Beijing severe haze more frequent under climate change, Nat. Clim. Change, 7, 257–262, https://doi.org/10.1038/nclimate3249, 2017.
Chen, C., Saikawa, E., Comer, B., Mao, X., and Rutherford, D.: Ship Emission Impacts on Air Quality and Human Health in the Pearl River Delta (PRD) Region, China, in 2015, With Projections to 2030, GeoHealth, 3, 284–306, https://doi.org/10.1029/2019GH000183, 2019.
Chen, H. and Wang, H.: Haze days in North China and the associated atmospheric circulations based on daily visibility data from 1960 to 2012, J. Geophys. Res.-Atmos., 120, 5895–5909, https://doi.org/10.1002/2015JD023225, 2015.
China National Environmental Monitoring Centre: Real-time National Air Quality, available at: http://www.cnemc.cn/, last access: 7 June 2021.
CMA Meteorological Data Centre: Hourly Data From Surface Meteorological Stations In China, available at: http://data.cma.cn/site/index.html, last access: 7 June 2021.
Cohen, A. J., Brauer, M., Burnett, R., Anderson, H. R., Frostad, J., Estep, K., Balakrishnan, K., Brunekreef, B., Dandona, L., Dandona, R., Feigin, V., Freedman, G., Hubbell, B., Jobling, A., Kan, H., Knibbs, L., Liu, Y., Martin, R., Morawska, L., Pope, C. A., Shin, H., Straif, K., Shaddick, G., Thomas, M., van Dingenen, R., van Donkelaar, A., Vos, T., Murray, C. J. L., and Forouzanfar, M. H.: Estimates and 25-year trends of the global burden of disease attributable to ambient air pollution: an analysis of data from the Global Burden of Diseases Study 2015, Lancet, 389, 1907–1918, https://doi.org/10.1016/S0140-6736(17)30505-6, 2017.
Day, D. B., Xiang, J., Mo, J., Li, F., Chung, M., Gong, J., Weschler, C. J., Ohman-Strickland, P. A., Sundell, J., Weng, W., Zhang, Y., and Zhang, J. J.: Association of ozone exposure with cardiorespiratory pathophysiologic mechanisms in healthy adults, JAMA Intern. Med., 177, 1344–1353, https://doi.org/10.1001/jamainternmed.2017.2842, 2017.
Deng, Y., Li, J., Li, Y., Wu, R., and Xie, S.: Characteristics of volatile organic compounds, NO2, and effects on ozone formation at a site with high ozone level in Chengdu, J. Environ. Sci.-China, 75, 334–345, https://doi.org/10.1016/j.jes.2018.05.004, 2019.
Ding, Y.: The Summer Monsoon in East Asia, in: Monsoons over China, 1–90, Atmospheric Sciences Library, vol 16. Springer, Dordrecht, 1994.
Du, Y., Wan, Q., Liu, H., Liu, H., Kapsar, K., and Peng, J.: How does urbanization influence PM2.5 concentrations? Perspective of spillover effect of multi-dimensional urbanization impact, J. Clean. Prod., 220, 974–983, https://doi.org/10.1016/j.jclepro.2019.02.222, 2019.
European Centre for Medium-Range Weather Forecasts: ERA5 hourly data on pressure levels from 1979 to present, available at: https://cds.climate.copernicus.eu/cdsapp#!/home, last access: 7 June 2021.
Fan, H., Zhao, C., and Yang, Y.: A comprehensive analysis of the spatio-temporal variation of urban air pollution in China during 2014–2018, Atmos. Environ., 220, 117066, https://doi.org/10.1016/j.atmosenv.2019.117066, 2020.
Ge, J., You, Q., and Zhang, Y.: Effect of Tibetan Plateau heating on summer extreme precipitation in eastern China, Atmos. Res., 218, 364–371, https://doi.org/10.1016/j.atmosres.2018.12.018, 2019.
Gong, C. and Liao, H.: A typical weather pattern for ozone pollution events in North China, Atmos. Chem. Phys., 19, 13725–13740, https://doi.org/10.5194/acp-19-13725-2019, 2019.
Gui, K., Che, H., Wang, Y., Wang, H., Zhang, L., Zhao, H., Zheng, Y., Sun, T., and Zhang, X.: Satellite-derived PM2.5 concentration trends over Eastern China from 1998 to 2016: Relationships to emissions and meteorological parameters, Environ. Pollut., 247, 1125–1133, https://doi.org/10.1016/j.envpol.2019.01.056, 2019.
Guo, J., Miao, Y., Zhang, Y., Liu, H., Li, Z., Zhang, W., He, J., Lou, M., Yan, Y., Bian, L., and Zhai, P.: The climatology of planetary boundary layer height in China derived from radiosonde and reanalysis data, Atmos. Chem. Phys., 16, 13309–13319, https://doi.org/10.5194/acp-16-13309-2016, 2016.
Guo, J., Li, Y., Cohen, J. B., Li, J., Chen, D., Xu, H., Liu, L., Yin, J., Hu, K., and Zhai, P.: Shift in the Temporal Trend of Boundary Layer Height in China Using Long-Term (1979–2016) Radiosonde Data, Geophys. Res. Lett., 46, 6080–6089, https://doi.org/10.1029/2019GL082666, 2019.
Gvozdić, V., Kovač-Andrić, E., and Brana, J.: Influence of Meteorological Factors NO2, SO2, CO and PM10 on the Concentration of O3 in the Urban Atmosphere of Eastern Croatia, Environ. Model. Assess., 16, 491–501, https://doi.org/10.1007/s10666-011-9256-4, 2011.
Han, H., Liu, J., Shu, L., Wang, T., and Yuan, H.: Local and synoptic meteorological influences on daily variability in summertime surface ozone in eastern China, Atmos. Chem. Phys., 20, 203–222, https://doi.org/10.5194/acp-20-203-2020, 2020.
Hoffmann, P. and Schlünzen, K. H.: Weather pattern classification to represent the urban heat island in present and future climate, J. Appl. Meteorol. Clim., 52, 2699–2714, https://doi.org/10.1175/JAMC-D-12-065.1, 2013.
Huang, X., Ding, A., Liu, L., Liu, Q., Ding, K., Niu, X., Nie, W., Xu, Z., Chi, X., Wang, M., Sun, J., Guo, W., and Fu, C.: Effects of aerosol–radiation interaction on precipitation during biomass-burning season in East China, Atmos. Chem. Phys., 16, 10063–10082, https://doi.org/10.5194/acp-16-10063-2016, 2016.
Huth, R., Beck, C., Philipp, A., Demuzere, M., Ustrnul, Z., Cahynová, M., Kyselý, J., and Tveito, O. E.: Classifications of atmospheric circulation patterns: Recent advances and applications, Ann. NY. Acad. Sci., 1146, 105–152, https://doi.org/10.1196/annals.1446.019, 2008.
Ji, X., Yao, Y., and Long, X.: What causes PM2.5 pollution? Cross-economy empirical analysis from socioeconomic perspective, Energ. Policy, 119, 458–472, https://doi.org/10.1016/j.enpol.2018.04.040, 2018.
Kley, D., Geiss, H., and Mohnen, V. A.: Tropospheric ozone at elevated sites and precursor emissions in the United States and Europe, Atmos. Environ., 28, 149–158, https://doi.org/10.1016/1352-2310(94)90030-2, 1994.
Li, K., Jacob, D. J., Liao, H., Zhu, J., Shah, V., Shen, L., Bates, K. H., Zhang, Q., and Zhai, S.: A two-pollutant strategy for improving ozone and particulate air quality in China, Nat. Geosci., 12, 906–910, https://doi.org/10.1038/s41561-019-0464-x, 2019.
Li, M., Wang, L., Liu, J., Gao, W., Song, T., Sun, Y., Li, L., Li, X., Wang, Y., Liu, L., Daellenbach, K. R., Paasonen, P. J., Kerminen, V. M., Kulmala, M., and Wang, Y.: Exploring the regional pollution characteristics and meteorological formation mechanism of PM2.5 in North China during 2013–2017, Environ. Int., 134, 105283, https://doi.org/10.1016/j.envint.2019.105283, 2020.
Li, S., Wang, T., Huang, X., Pu, X., Li, M., Chen, P., Yang, X. Q., and Wang, M.: Impact of East Asian Summer Monsoon on Surface Ozone Pattern in China, J. Geophys. Res.-Atmos., 123, 1401–1411, https://doi.org/10.1002/2017JD027190, 2018.
Li, Z., Guo, J., Ding, A., Liao, H., Liu, J., Wang, T., Xue, H., Zhang, H., and Zhu, B.: Aerosol and boundary-layer interactions and impact on air quality, Natl. Sci. Rev., 4, 810–833, https://doi.org/10.1093/nsr/nwx117/4191281, 2017.
Liu, H., Tian, H., Zhang, K., Liu, S., Cheng, K., Yin, S., Liu, Y., Liu, X., Wu, Y., Liu, W., Bai, X., Wang, Y., Shao, P., Luo, L., Lin, S., Chen, J., and Liu, X.: Seasonal variation, formation mechanisms and potential sources of PM2.5 in two typical cities in the Central Plains Urban Agglomeration, China, Sci. Total Environ., 657, 657–670, https://doi.org/10.1016/j.scitotenv.2018.12.068, 2019.
Liu, J. and You, Q.: A diagnosis of the interannual variation of the summer hydrometeor based on ERA-interim over Eastern China, Atmos. Res., 231, 104654, https://doi.org/10.1016/j.atmosres.2019.104654, 2020.
Liu, N., Zhou, S., Liu, C., and Guo, J.: Synoptic circulation pattern and boundary layer structure associated with PM2.5 during wintertime haze pollution episodes in Shanghai, Atmos. Res., 228, 186–195, https://doi.org/10.1016/j.atmosres.2019.06.001, 2019.
Lu, R.: Indices of the Summertime Western North Pacific Subtropical High, Adv. Atmos. Sci., 19, 1004–1028, https://doi.org/10.1007/s00376-002-0061-5, 2002.
Ma, Z., Hu, X., Sayer, A. M., Levy, R., Zhang, Q., Xue, Y., Tong, S., Bi, J., Huang, L., and Liu, Y.: Satellite-based spatiotemporal trends in PM2.5 concentrations: China, 2004–2013, Environ. Health Persp., 124, 184–192, https://doi.org/10.1289/ehp.1409481, 2016.
Miao, Y., Hu, X.-M., Liu, S., Qian, T., Xue, M., Zheng, Y., and Wang, S.: Seasonal variation of local atmospheric circulations and boundary layer structure in the Beijing-Tianjin-Hebei region and implications for air quality, J. Adv. Model. Earth Sy., 7, 1602–1626, https://doi.org/10.1002/2015ms000522, 2015.
Miao, Y., Guo, J., Liu, S., Liu, H., Li, Z., Zhang, W., and Zhai, P.: Classification of summertime synoptic patterns in Beijing and their associations with boundary layer structure affecting aerosol pollution, Atmos. Chem. Phys., 17, 3097–3110, https://doi.org/10.5194/acp-17-3097-2017, 2017.
Miao, Y., Liu, S., and Huang, S.: Synoptic pattern and planetary boundary layer structure associated with aerosol pollution during winter in Beijing, China, Sci. Total Environ., 682, 464–474, https://doi.org/10.1016/j.scitotenv.2019.05.199, 2019.
Miao, Y., Che, H., Zhang, X., and Liu, S.: Relationship between summertime concurring PM2.5 and O3 pollution and boundary layer height differs between Beijing and Shanghai, China, Environ. Pollut., 268, 115775, https://doi.org/10.1016/j.envpol.2020.115775, 2020.
Ning, G., Wang, S., Yim, S. H. L., Li, J., Hu, Y., Shang, Z., Wang, J., and Wang, J.: Impact of low-pressure systems on winter heavy air pollution in the northwest Sichuan Basin, China, Atmos. Chem. Phys., 18, 13601–13615, https://doi.org/10.5194/acp-18-13601-2018, 2018.
Ning, G., Yim, S. H. L., Wang, S., Duan, B., Nie, C., Yang, X., Wang, J., and Shang, K.: Synergistic effects of synoptic weather patterns and topography on air quality: a case of the Sichuan Basin of China, Clim. Dynam., 53, 6729–6744, https://doi.org/10.1007/s00382-019-04954-3, 2019.
Philipp, A., Beck, C., Esteban, P., Krennert, T., Lochbihler, K., Spyros, P., Pianko-Kluczynska, K., Post, P., Alvarez, R., Spekat, A., and Streicher, F.: Cost733class-1.2 User guide, available at: http://cost733.met.no/cost733class_userguide.pdf (last access: 7 June 2021), 2014.
Physical Sciences Laboratory: NCEP/NCAR Reanalysis 1, available at: https://psl.noaa.gov/data/gridded/data.ncep.reanalysis.html, last access: 7 June 2021.
Saikawa, E., Kim, H., Zhong, M., Avramov, A., Zhao, Y., Janssens-Maenhout, G., Kurokawa, J.-I., Klimont, Z., Wagner, F., Naik, V., Horowitz, L. W., and Zhang, Q.: Comparison of emissions inventories of anthropogenic air pollutants and greenhouse gases in China, Atmos. Chem. Phys., 17, 6393–6421, https://doi.org/10.5194/acp-17-6393-2017, 2017.
Seidel, D. J., Zhang, Y., Beljaars, A., Golaz, J. C., Jacobson, A. R., and Medeiros, B.: Climatology of the planetary boundary layer over the continental United States and Europe, J. Geophys. Res.-Atmos., 117, D17106, https://doi.org/10.1029/2012JD018143, 2012.
Shi, Z., Huang, L., Li, J., Ying, Q., Zhang, H., and Hu, J.: Sensitivity analysis of the surface ozone and fine particulate matter to meteorological parameters in China, Atmos. Chem. Phys., 20, 13455–13466, https://doi.org/10.5194/acp-20-13455-2020, 2020.
Shu, L., Xie, M., Wang, T., Gao, D., Chen, P., Han, Y., Li, S., Zhuang, B., and Li, M.: Integrated studies of a regional ozone pollution synthetically affected by subtropical high and typhoon system in the Yangtze River Delta region, China, Atmos. Chem. Phys., 16, 15801–15819, https://doi.org/10.5194/acp-16-15801-2016, 2016.
Shu, L., Wang, T., Xie, M., Li, M., Zhao, M., Zhang, M., and Zhao, X.: Episode study of fine particle and ozone during the CAPUM-YRD over Yangtze River Delta of China: Characteristics and source attribution, Atmos. Environ., 203, 87–101, https://doi.org/10.1016/j.atmosenv.2019.01.044, 2019.
Sillman, S.: The relation between ozone, NOx and hydrocarbons in urban and polluted rural environments, Dev. Environ. Sci., 1, 339–385, https://doi.org/10.1016/S1474-8177(02)80015-8, 2002.
Song, C., Wu, L., Xie, Y., He, J., Chen, X., Wang, T., Lin, Y., Jin, T., Wang, A., Liu, Y., Dai, Q., Liu, B., Wang, Y.-n., and Mao, H.: Air pollution in China: Status and spatiotemporal variations, Environ. Pollut., 227, 334–347, https://doi.org/10.1016/j.envpol.2017.04.075, 2017.
Su, H., Qian, C., Gu, H., and Wang, Q.: The Impact of Tropical Cyclones on China in 2016, Tropical Cyclone Research and Review, 5, 1–11, https://doi.org/10.6057/2016TCRRh1.01, 2017.
Sun, L., Xue, L., Wang, T., Gao, J., Ding, A., Cooper, O. R., Lin, M., Xu, P., Wang, Z., Wang, X., Wen, L., Zhu, Y., Chen, T., Yang, L., Wang, Y., Chen, J., and Wang, W.: Significant increase of summertime ozone at Mount Tai in Central Eastern China, Atmos. Chem. Phys., 16, 10637–10650, https://doi.org/10.5194/acp-16-10637-2016, 2016.
Tai, A. P. K., Mickley, L. J., and Jacob, D. J.: Correlations between fine particulate matter (PM2.5) and meteorological variables in the United States: Implications for the sensitivity of PM2.5 to climate change, Atmos. Environ., 44, 3976–3984, https://doi.org/10.1016/j.atmosenv.2010.06.060, 2010.
Wang, H.-J. and Chen, H.-P.: Understanding the recent trend of haze pollution in eastern China: roles of climate change, Atmos. Chem. Phys., 16, 4205–4211, https://doi.org/10.5194/acp-16-4205-2016, 2016.
Wang, T., Zhong, Z., Sun, Y., and Wang, J.: Impacts of tropical cyclones on the meridional movement of the western Pacific subtropical high, Atmos. Sci. Lett., 20, e893, https://doi.org/10.1002/asl.893, 2019.
Xie, M., Zhu, K., Wang, T., Chen, P., Han, Y., Li, S., Zhuang, B., and Shu, L.: Temporal characterization and regional contribution to O3 and NOx at an urban and a suburban site in Nanjing, China, Sci. Total Environ., 551–552, 533–545, https://doi.org/10.1016/j.scitotenv.2016.02.047, 2016.
Yang, Y., Zheng, X., Gao, Z., Wang, H., Wang, T., Li, Y., Lau, G. N. C., and Yim, S. H. L.: Long-Term Trends of Persistent Synoptic Circulation Events in Planetary Boundary Layer and Their Relationships With Haze Pollution in Winter Half Year Over Eastern China, J. Geophys. Res.-Atmos., 123, 10991–11007, https://doi.org/10.1029/2018JD028982, 2018.
Yang, Y., Zheng, Z., Yim, S. Y. L., Roth, M., Ren, G., Gao, Z., Wang, T., Li, Q., Shi, C., Ning, G., and Li, Y.: PM2.5 Pollution Modulates Wintertime Urban Heat Island Intensity in the Beijing-Tianjin-Hebei Megalopolis, China, Geophys. Res. Lett., 47, e2019GL084288, https://doi.org/10.1029/2019GL084288, 2020.
Yang, Y., Wang, R., Chen, F., Liu, C., Bi, X., and Huang, M.: Synoptic weather patterns modulate the frequency, type and vertical structure of summer precipitation over Eastern China: A perspective from GPM observations, Atmos. Res., 249, 105342, https://doi.org/10.1016/j.atmosres.2020.105342, 2021.
Ye, W. F., Ma, Z. Y., and Ha, X. Z.: Spatial-temporal patterns of PM2.5 concentrations for 338 Chinese cities, Sci. Total Environ., 631–632, 524–533, https://doi.org/10.1016/j.scitotenv.2018.03.057, 2018.
Yim, S. H. L., Wang, M., Gu, Y., Yang, Y., Dong, G., and Li, Q.: Effect of Urbanization on Ozone and Resultant Health Effects in the Pearl River Delta Region of China, J. Geophys. Res.-Atmos., 124, 11568–11579, https://doi.org/10.1029/2019JD030562, 2019.
Yin, Z., Cao, B., and Wang, H.: Dominant patterns of summer ozone pollution in eastern China and associated atmospheric circulations, Atmos. Chem. Phys., 19, 13933–13943, https://doi.org/10.5194/acp-19-13933-2019, 2019.
Yu, S., Yin, S., Zhang, R., Wang, L., Su, F., Zhang, Y., and Yang, J.: Spatiotemporal characterization and regional contributions of O3 and NO2: An investigation of two years of monitoring data in Henan, China, J. Environ. Sci.-China, 90, 29–40, https://doi.org/10.1016/j.jes.2019.10.012, 2020.
Zhang, C., Liu, C., Hu, Q., Cai, Z., Su, W., Xia, C., Zhu, Y., Wang, S., and Liu, J.: Satellite UV-Vis spectroscopy: implications for air quality trends and their driving forces in China during 2005–2017, Light-Sci. Appl., 8, 100, https://doi.org/10.1038/s41377-019-0210-6, 2019.
Zhang, H., Wang, Y., Park, T. W., and Deng, Y.: Quantifying the relationship between extreme air pollution events and extreme weather events, Atmos. Res., 188, 64–79, https://doi.org/10.1016/j.atmosres.2016.11.010, 2017.
Zhang, Q., Zheng, Y., Tong, D., Shao, M., Wang, S., Zhang, Y., Xu, X., Wang, J., He, H., Liu, W., Ding, Y., Lei, Y., Li, J., Wang, Z., Zhang, X., Wang, Y., Cheng, J., Liu, Y., Shi, Q., Yan, L., Geng, G., Hong, C., Li, M., Liu, F., Zheng, B., Cao, J., Ding, A., Gao, J., Fu, Q., Huo, J., Liu, B., Liu, Z., Yang, F., He, K., and Hao, J.: Drivers of improved PM2.5 air quality in China from 2013 to 2017, P. Natl. Acad. Sci. USA, 116, 24463–24469, https://doi.org/10.1073/pnas.1907956116, 2019.
Zhang, R. H., Li, Q., and Zhang, R. N.: Meteorological conditions for the persistent severe fog and haze event over eastern China in January 2013, Sci. China Earth Sci., 57, 26–35, https://doi.org/10.1007/s11430-013-4774-3, 2014.
Zhang, W., Wang, H., Zhang, X., Peng, Y., Zhong, J., Wang, Y., and Zhao, Y.: Evaluating the contributions of changed meteorological conditions and emission to substantial reductions of PM2.5 concentration from winter 2016 to 2017 in Central and Eastern China, Sci. Total Environ., 716, 136892, https://doi.org/10.1016/j.scitotenv.2020.136892, 2020.
Zhang, Y. L. and Cao, F.: Fine particulate matter (PM2.5) in China at a city level, Sci. Rep.-UK, 5, 14884, https://doi.org/10.1038/srep14884, 2015.
Zhang, Z., Zhang, X., Gong, D., Quan, W., Zhao, X., Ma, Z., and Kim, S. J.: Evolution of surface O3 and PM2.5 concentrations and their relationships with meteorological conditions over the last decade in Beijing, Atmos. Environ., 108, 67–75, https://doi.org/10.1016/j.atmosenv.2015.02.071, 2015.
Zhang, Z., Zhang, X., Gong, D., Kim, S.-J., Mao, R., and Zhao, X.: Possible influence of atmospheric circulations on winter haze pollution in the Beijing–Tianjin–Hebei region, northern China, Atmos. Chem. Phys., 16, 561–571, https://doi.org/10.5194/acp-16-561-2016, 2016.
Zhao, C., Wang, Y., Yang, Q., Fu, R., Cunnold, D., and Choi, Y.: Impact of East Asian summer monsoon on the air quality over China: View from space, J. Geophys. Res.-Atmos., 115, D09301, https://doi.org/10.1029/2009JD012745, 2010.
Zhao, W., Tang, G., Yu, H., Yang, Y., Wang, Y., Wang, L., An, J., Gao, W., Hu, B., Cheng, M., An, X., Li, X., and Wang, Y.: Evolution of boundary layer ozone in Shijiazhuang, a suburban site on the North China Plain, J. Environ. Sci.-China, 83, 152–160, https://doi.org/10.1016/j.jes.2019.02.016, 2019.
Zhao, Z. and Wang, Y.: Influence of the West Pacific subtropical high on surface ozone daily variability in summertime over eastern China, Atmos. Environ., 170, 197–204, https://doi.org/10.1016/j.atmosenv.2017.09.024, 2017.
Zheng, X. Y., Fu, Y. F., Yang, Y. J., and Liu, G. S.: Impact of atmospheric circulations on aerosol distributions in autumn over eastern China: observational evidence, Atmos. Chem. Phys., 15, 12115–12138, https://doi.org/10.5194/acp-15-12115-2015, 2015.