the Creative Commons Attribution 4.0 License.
the Creative Commons Attribution 4.0 License.
 | 15 Jun 2021
Measurement report: An assessment of the impact of a nationwide lockdown on air pollution – a remote sensing perspective over India
Aarathi Muppalla
Sayan Hazra
Mahalakshmi D. Venkata
Kanchana A. Lakshmi
Vijay K. Sagar
Raja Shekhar
Srinivasulu Jella
Sesha Sai M. V. Rama
Uma Vijayasundaram
The nationwide lockdown was imposed over India from 25 March to 31 May 2020 with varied relaxations from phase I to phase IV to contain the spread of COVID-19. Thus, emissions from industrial and transport sectors were halted during lockdown (LD), which has resulted in a significant reduction of anthropogenic pollutants. The first two lockdown phases were strictly implemented (phase I and phase II) and hence were considered to be total lockdown (TLD) in this study. Satellite-based tropospheric columnar nitrogen dioxide (TCN) from the years 2015 to 2020, tropospheric columnar carbon monoxide (TCC) during 2019/20, and aerosol optical depth (AOD550) from the years 2014 to 2020 during phase I and phase II LD and pre-LD periods were investigated with observations from Aura OMI, Sentinel-5P TROPOMI, and Aqua and Terra MODIS. To quantify lockdown-induced changes in TCN, TCC, and AOD550, detailed statistical analysis was performed on de-trended data using the Student paired statistical t test. Results indicate that mean TCN levels over India showed a dip of 18 % compared to the previous year and also against the 5-year mean TCN levels during the phase I lockdown, which was found to be statistically significant (p value < 0.05) against the respective period. Furthermore, drastic changes in TCN levels were observed over hotspots, namely eastern region and urban cities. For example, there was a sharp decrease of 62 % and 54 % in TCN levels compared to 2019 and against 5-year mean TCN levels over New Delhi with a p value of 0.0002 (which is statistically significant) during total LD. The TCC levels were high in the northeast (NE) region during the phase I LD period, which is mainly attributed to the active fire counts in this region. However, lower TCC levels are observed in the same region due to the diminished fire counts during phase II. Further, AOD550 is reduced over the country by ∼ 16 % (Aqua and Terra) from the 6-year (2014–2019) mean AOD550 levels, with a significant reduction (Aqua MODIS 28 %) observed over the Indo-Gangetic Plain (IGP) region with a p value of ≪ 0.05. However, an increase in AOD550 levels (25 % for Terra MODIS, 15 % for Aqua MODIS) was also observed over central India during LD compared to the preceding year and found significant with a p value of 0.03. This study also reports the rate of change of TCN levels and AOD550 along with statistical metrics during the LD period.
- Article
(3620 KB) - Full-text XML
- BibTeX
- EndNote


Following the outbreak of the novel coronavirus disease (COVID-19) and its declaration as a pandemic by the World Health Organization (WHO) on 11 March 2020, several countries across the globe imposed national lockdowns to contain this global pandemic (e.g. Tian et al., 2020). India confirmed its first COVID-19 case on 30 January 2020 with an exponential increase to 360 cases by 22 March 2020 (https://www.mohfw.gov.in/, last access: 1 August 2020). In an attempt to restrict this pandemic, the Indian government called for a “Janata Curfew” on 22 March 2020, followed by the nationwide lockdown (LD) in a phased manner starting from 25 March–14 April 2020 (21 d) as phase I, 15 April–3 May 2020 (19 d) as phase II, 4 May–17 May 2020 (14 d) as phase III, and 18 May–31 May in 2020 (14 d) as phase IV. During this lockdown period, about 1.3 billion citizens of India were advised to stay indoors, all transport including domestic and international flights and roadways were suspended, and almost all the industries were closed with the exception of essential services, namely medical and daily needs. However, agriculture farming and its related sectors were permitted during phase II as India is an agrarian country. However, indoor emissions due to cooking and emissions from the emergency services were still present in phase I. During phase II, crop residue burnings were added in addition to phase I emissions. Except for these, the rest of the anthropogenic emissions from the above sectors are completely shut during phase I and phase II. Thus, economic activities were greatly affected and hence there was a shortfall in net energy consumption by about 30 % (https://www.ppac.gov.in/, last access: 4 August 2020) during the strict lockdown period (first two lockdown phases).
Elevated levels of air pollution are considered an environmental issue that is harmful to human health (Xu et al., 2020) and extends from local to global scales (Fang et al., 2009). The oxides of nitrogen (NO, NO2) play an important role in tropospheric chemistry and climate change. Increased exposure to air pollutants, especially to nitrogen dioxide (NO2), has been correlated with an increased rate of morbidity and subsequently increased rate of mortality (WHO, 2013). Global emissions of NOx (NO, NO2) are primarily due to anthropogenic activities such as transportation (32 % in India), industrial activities (21 % in India), thermal power plants (28 % in India), and biomass burning (19 % in India), whereas the natural sources of NOx are soils and lightning (Biswal et al., 2021). Thus, hotspot regions of NO2 are thermal power plants, urban cities, and industrial regions. In addition to NO2, carbon monoxide (CO) is also an important trace gas in the troposphere and is the main precursor of secondary pollutant ozone in NOx-rich environments. Though CO is not a direct greenhouse gas, it has a global warming potential because of its effects on the lifetime of several greenhouse gases. The natural and anthropogenic sources of CO are forest fire, biofuel burning, volcanic activities, and incomplete combustion of fossil fuels, oil, coal, wood, natural gas, and oxidation of hydrocarbons. However, a significant amount of contribution to CO is from anthropogenic emissions. Harmful effects of CO are dizziness, headaches, stomach aches, confusion, and tiredness. CO is a tracer of air pollution due to its lifetime of about ∼ 1–2 months (Drummond and Mand, 1996).
Natural sources and anthropogenic activities are responsible for the presence of aerosol in the atmosphere. Anthropogenic activities over South Asia have caused considerable changes in aerosol composition and loading. Fine-mode aerosol (PM2.5) is mainly from gas-to-particle conversions, which are from biogenic and anthropogenic emissions. Coarse-mode aerosol (particles with a diameter larger than 10 µm) arises from natural sources such as deserts, oceans, volcanoes, and the biosphere, with less contribution from anthropogenic activities. Over the ocean surface, the natural global aerosol mass is controlled by sulfate, sea salt, and dust aerosol (David et al., 2018). Further, aerosol also affects the earth–atmosphere radiation budget directly in scattering and absorption of incoming solar radiation and indirectly as cloud formation and precipitation (Ramachandran and Kedia, 2013), thereby influencing the Indian monsoon (David et al., 2018).
Earlier studies indicate that the emissions from vehicles (Mahalakshmi et al., 2014, 2015), industry, and thermal power plants (Ramachandran et al., 2013) contribute significantly to atmospheric pollution, including gaseous pollutants. The ambient air quality is largely determined by the concentration of trace gases and particulate matter in the atmosphere (Nishanth et al., 2014). An increase in the concentration levels of trace gases and particulate matter is really a challenging environmental issue in urban and industrial areas. Numerous studies have been carried out across the globe to understand the air pollution concentrations during the lockdown period, and the results indicate the varied range of percentage reductions in pollutant concentrations. These studies are either based on ground-based measurements (Mohato et al., 2020; Mor et al., 2020) or satellite data alone (Biswal et al., 2020; Xu et al., 2020) or with a combination of both (Ratnam et al., 2021; Biswal et al., 2021; Singh and Chauhan, 2020). Biswal et al. (2021) reported lockdown-induced changes in tropospheric NO2 variability even in rural regions of the Indian sub-continent with a marked reduction of 30 %–50 % over the urban areas and megacities. This change was mainly attributed to the reduced traffic emissions due to restricted movements of limited transport. In contrast to the above, an increase in levels of air pollutants during lockdown is also noticed in certain regions, which are associated with natural emissions (dust storms, forest fires) and prevailing meteorological conditions. A decrease in aerosol optical depth (AOD550) over the Indo-Gangetic Plains (IGP) and a drastic increase over central India were reported during the phase I lockdown in India, which were mainly due to the absence of anthropogenic activities and dominance of natural sources, respectively (Ratnam et al., 2021). However, the preceding studies have not carried out any detailed statistical analysis to indicate the significant changes are due to the imposed lockdown besides the long-term variability.
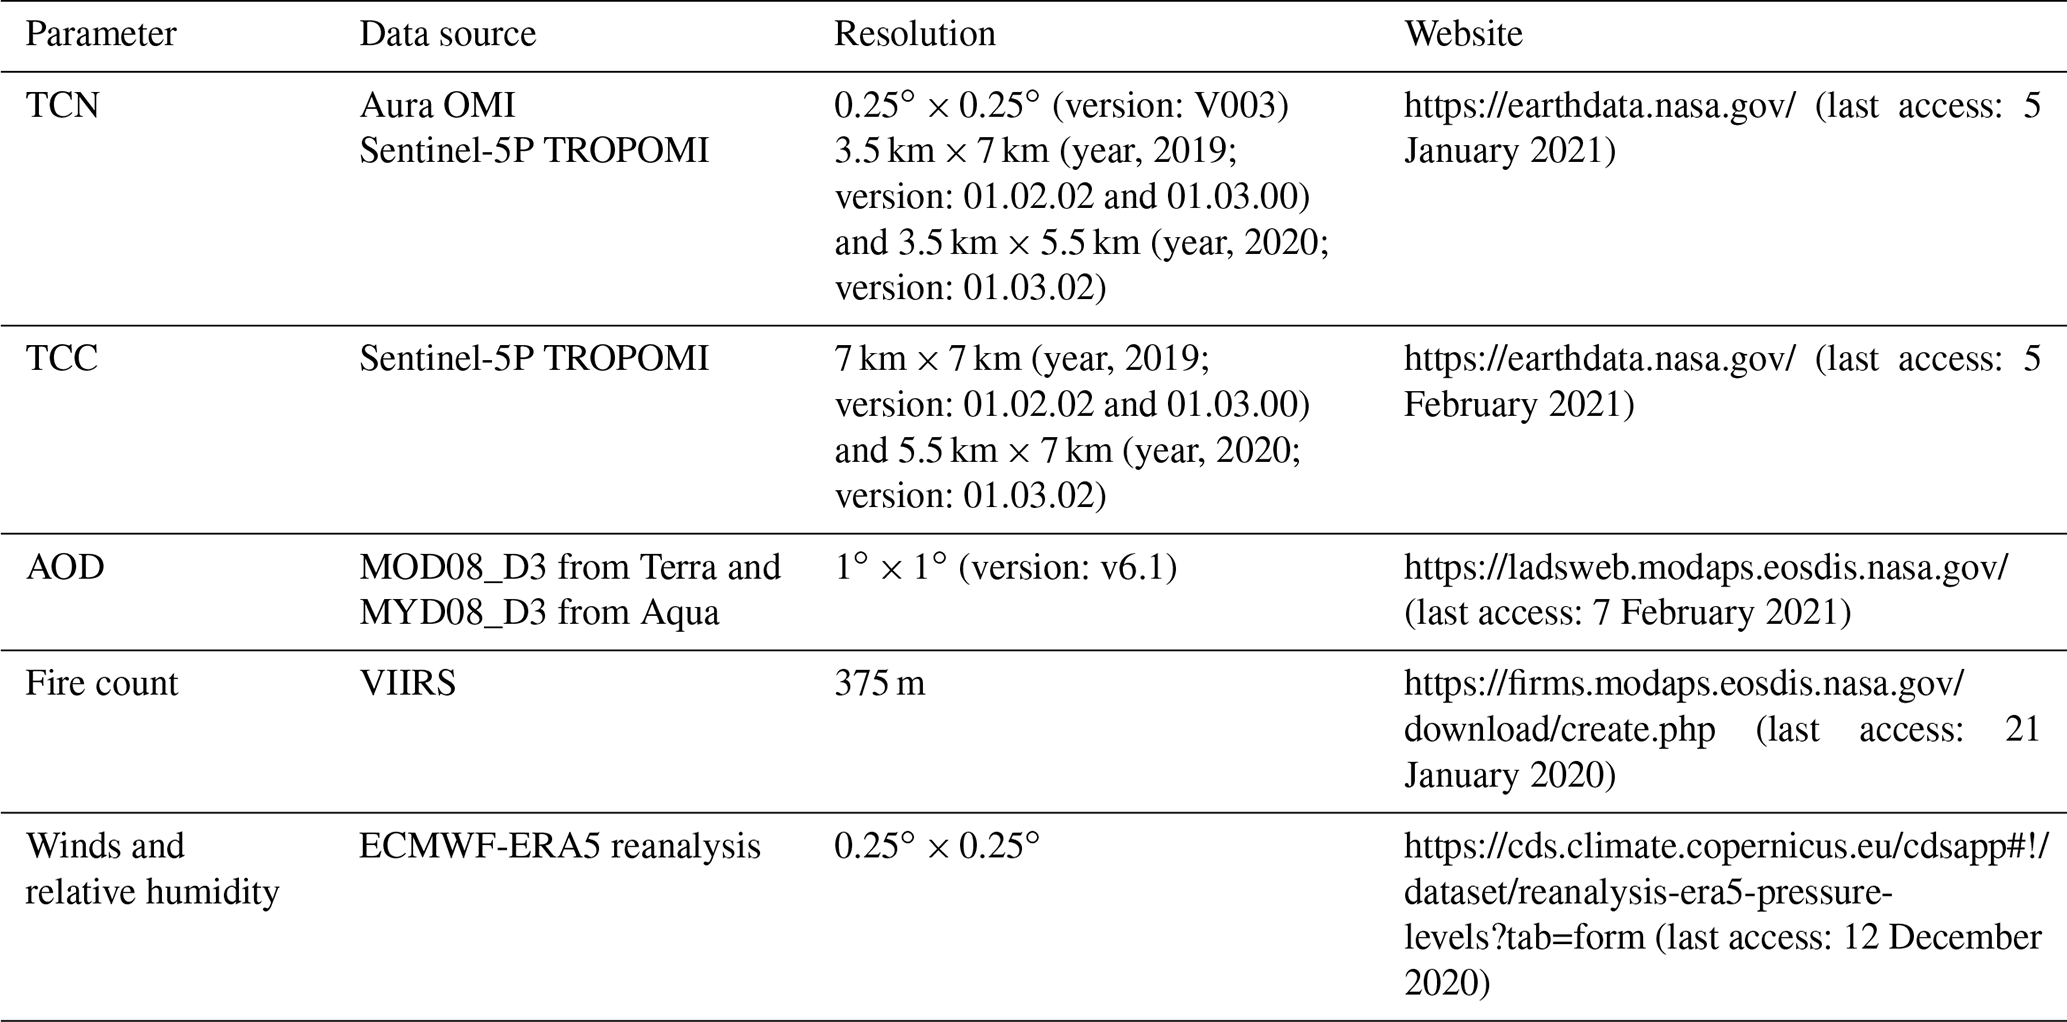
Table 1Data resources.
Reference period: January–July (2014–2020); strict lockdown period: 25 March–3 May 2020.
Therefore, the present study has attempted to understand and quantify the spatio-temporal variations in air pollutants over the Indian region during COVID-19 lockdown (LD) restrictions in the country. Thus, the present study examined the spatio-temporal variations in remotely sensed tropospheric columnar NO2 (TCN), tropospheric columnar CO (TCC), and aerosol optical depth (AOD550) during LD and pre-LD and compared with the preceding year (2019) and short-term mean (2014–2020). The present study reported lockdown-induced changes on TCN, TCC, and AOD550 over the Indian region with special emphasis on the hotspot (usual predominant sources) and urban regions. Further, statistical analyses were carried out to assess the implications of strict lockdown in India on the levels of these air pollutants besides their inter-annual variability. Subsequent changes in air quality associated with meteorology, long-range transport, and forest fires have been taken into account through statistical correlations to distinguish between natural and anthropogenic emissions.
Satellite-measured air pollutant data offer reliable, uninterrupted observations with higher spatial and temporal coverage than ground-based measurements, which are point observations. Thus, the TCN observations from the Sentinel-5P Tropospheric Monitoring Instrument (S5P-TROPOMI) and Aura Ozone Monitoring Instrument (Aura OMI), TCC data from high-spatial-resolution TROPOMI, and AOD550 data from Moderate Resolution Imaging Spectroradiometer (MODIS) Terra–Aqua platforms are used in the present study. The brief details of these sensors are given in Table 1. TROPOMI was launched on 13 October 2017 as the single payload on board the S5P satellite of the European Space Agency (ESA) and has a nadir-viewing spectral range covering wavelength bands between the ultraviolet and the shortwave infrared. TROPOMI is a push-broom imaging spectrometer flying in a sun-synchronous orbit at 824 km altitude and is designed to retrieve the concentration of several atmospheric constituents which include TCN, TCC, SO2, etc. TROPOMI retrieved TCN and TCC values with a quality flag greater than 0.50 are considered in the present study (Eskes et al., 2019). It was developed jointly by ESA and the Royal Netherlands Meteorological Institute (KNMI), which is the most advanced multispectral imaging spectrometer (Alonso et al., 2020). OMI was successfully launched on the National Aeronautics and Space Administration (NASA) Earth Observing System Aura satellite and is a push broom ultraviolet–visible spectrometer that measures the Earth's backscattered radiance and solar irradiance. Aura OMI has a swath width of 2600 km with a nadir field of view, at a spatial resolution of 0.25∘ × 0.25∘ giving a daily global 30 % cloud-screened TCN level 3 product (present study used Version 3) and crossing the Equator at 13:45 LT (Krotkov et al., 2017). The MODIS sensor on board NASA's two Earth Observing System Terra and Aqua platforms provide AOD retrievals.
Daily level 3 (version: V003) TCN data were obtained from Aura OMI for computing the short-term mean of TCN from 2015–2019 (https://disc.gsfc.nasa.gov/datasets/OMNO2d_003/summary, last access: 29 December 2020). However, high-spatial-resolution TCN and TCC data (Level 2) from TROPOMI are used during the LD period of 2020 and the corresponding period in 2019 (https://doi.org/10.5270/S5P-s4ljg54). The daily gridded global AOD products (Level 3) from Terra (MOD08_D3_v6.1) aerosol optical depth at 550 nm (Deep Blue algorithm, land-only) and Aqua (MYD08_D3_v6.1) aerosol optical depth at 550 nm (Deep Blue algorithm, land-only) platforms were used to investigate the aerosol loading over the Indian region for the abovementioned period. Detailed information about the OMI sensor and MODIS sensor on board Aqua–Terra platforms is explained by Li et al. (2020). Overland, the previous studies reported that MODIS-derived AOD uncertainty with respect to the AErosol RObotic NETwork (AERONET) is ± 0.05 ± 0.20 × AODAERONET (Sayer et al., 2013; Levy et al. 2013). Details of the MODIS AOD retrieval algorithm for collection 6.1 and its validation can be found in Hsu et al., (2019) and Sayer et al., (2019), respectively. In addition to the above datasets, fire count data from the Visible Infrared Imaging Radiometer Suite (VIIRS) with confidence > 80 % were used. To understand the role of meteorology, winds from the European Centre for Medium-Range Weather Forecasts (ECMWF- ERA5) reanalysis, which gives hourly data at different pressure levels (700 and 850 hPa), were also used in the present study. Similarly, relative humidity from ECMWF for the respective pressure levels is also used.
In the present study, we attempted to assess the impact of lockdown on air quality over India by examining remotely sensed daily concentrations of TCN, TCC, and AOD550 from January 2014 to October 2020. Further, daily concentrations of the abovementioned parameters were de-trended during the study period to subside the long-term changes. Hence, phase-wise changes in TCN, TCC levels, and AOD550 could be attributed to LD-induced changes. Thus, the present study focused on the air pollution over the Indian region, its states, and its capital city during the strict lockdown periods (phase I and phase II). Analysis of satellite-based observations of TCN from the years 2015 to 2020, TCC during 2019/20, and AOD550 from 2014–2020 was carried out for the lockdown period (phase I and phase II) as well as the pre-lockdown period. Short-term climatological means during pre-LD, phase I, and phase II were computed for TCN from 2015 to 2020 and AOD550 from 2014 to 2020 to assess the temporal changes of pollutants in the atmosphere. We have focused our analysis on the first two phases of lockdown in which the industrial and transport sectors were brought to a near standstill.
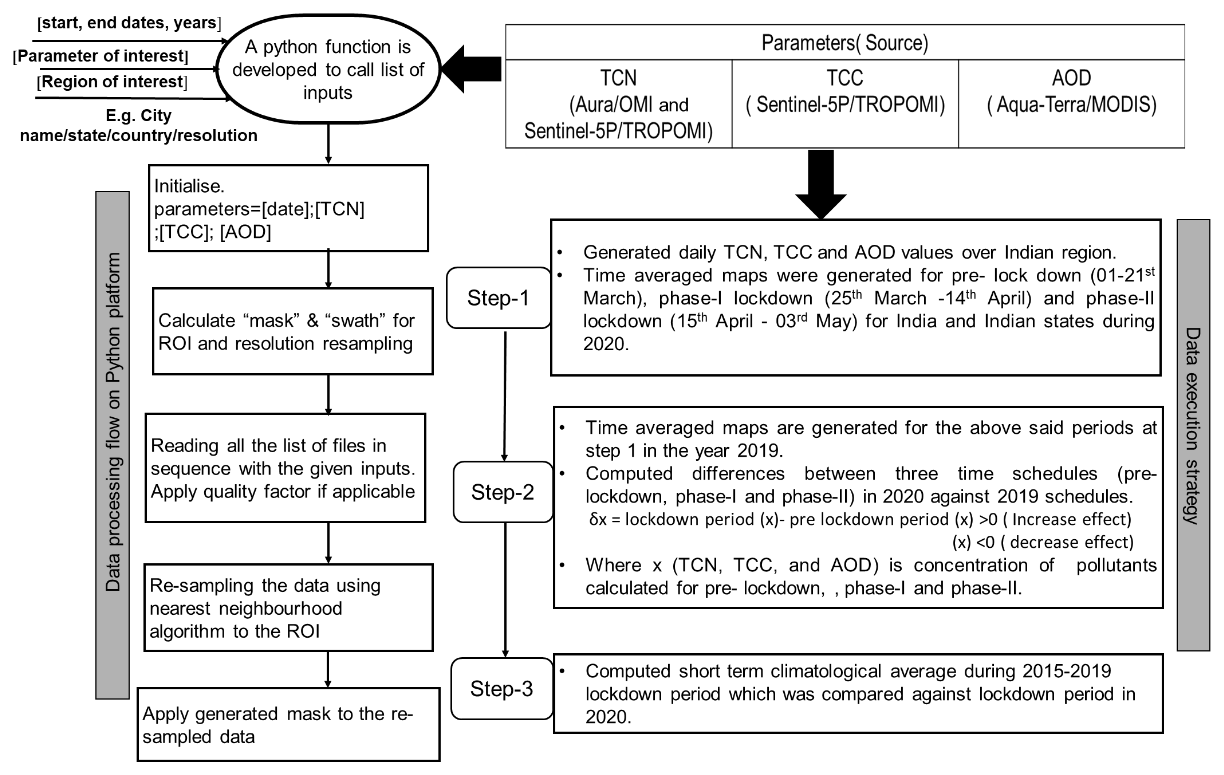
Figure 1 shows the data processing and execution strategy followed in this study. The detailed methodology used in this study is as follows. The Python programming language is used to analyse TCN, TCC, and AOD550 variables during the study period as discussed in Fig. 1. The parameters TCN, TCC, and AOD550 are extracted from the respective source files considering quality flags (https://github.com/aarathimuppalla/airpollution_ld_study.git, last access: 10 May 2021). Swath and mask are calculated for the region of interest, and the data are resampled using the nearest-neighbour algorithm. Further, time-averaged maps of TCN, TCC, and AOD550 for pre-lockdown, phase I, and phase II lockdown were generated for the years 2020 and 2019 along with maps depicting the differences. With respect to 2020, if the difference in pollutant concentrations (δx) is greater than zero, an increased effect is indicated and vice versa. Short-term climatological means of TCN for the years 2015–2020 and AOD for the years 2014–2020 were computed. Thereafter, the regional increase and decrease in pollutant concentrations over the country and individual states were analysed.
Statistical metrics
Further, detailed statistical metrics for TCN, TCC, and AOD550, namely mean, standard deviation (SD), percentage of the number of positive and negative pixels, and Student's paired t test values, were computed. TCN data obtained from OMI and AOD550 from MODIS were utilised to estimate metrics from the long-term data against the lockdown period in 2020. These metrics are calculated for every week starting from 1 January to 31 July as 31 weeks in total for the years 2015–2020 for TCN and 2014–2020 for AOD550 over the Indian region. Thus, the following steps were implemented to quantify the metrics. These steps are written for TCN as an example.
Here N is the total number of qualified pixels over the Indian region and μb is mean bias. At each pixel, weekly bias (b) of TCN is estimated from the weekly mean TCN during the 2020 lockdown period vs. 2019 and 2015–2019 periods as shown in Eqs. (1) and (2). For prominent change detection, a 1 SD deviation filter was additionally applied to the bias values of TCN and AOD550. Therefore, if bias is greater than 1 SD, then the featured pixels are classified as positive, and if less than −1 SD then they are considered negative pixels. Pixels within ± 1 SD are omitted to avoid minimalistic feature changes and for better characterisation. Subsequently, we computed the percentage of positive (increased area) and negative pixels (decreased area) using the following Eqs. (5) and (6).
The same equations were applied to AOD550 during the 2014–2020 study periods. Further, to understand LD-induced changes in TCN and AOD550 quantitatively, daily mean values are de-trended using yearly data, which accounts for long-term changes in TCN and AOD550. De-trended values of TCN and AOD550 are generated by subtracting the linear-regression-estimated values from the daily values of TCN and AOD550. To study the lockdown-induced changes with significant levels, a paired t test (Freedman et al., 2007) was implemented on the de-trended TCN and AOD550 data during the respective study period. The t test follows a Student t distribution under the null hypothesis of H0 with the means (μ) of two populations being equal (μ1=μ2) with an alternative hypothesis Ha: μ1≠μ2. To reject or accept the null hypothesis, the p value was used in this study. The hypothesis H0 is rejected when a p value is less than 0.05 and accepted if the p value is greater than 0.05 (5 % significance level).
In the present study we have analysed the spatio-temporal variations in satellite-based data for TCN, TCC, and AOD550 during LD and pre-LD periods to understand the lockdown effects on their changes over the Indian region.
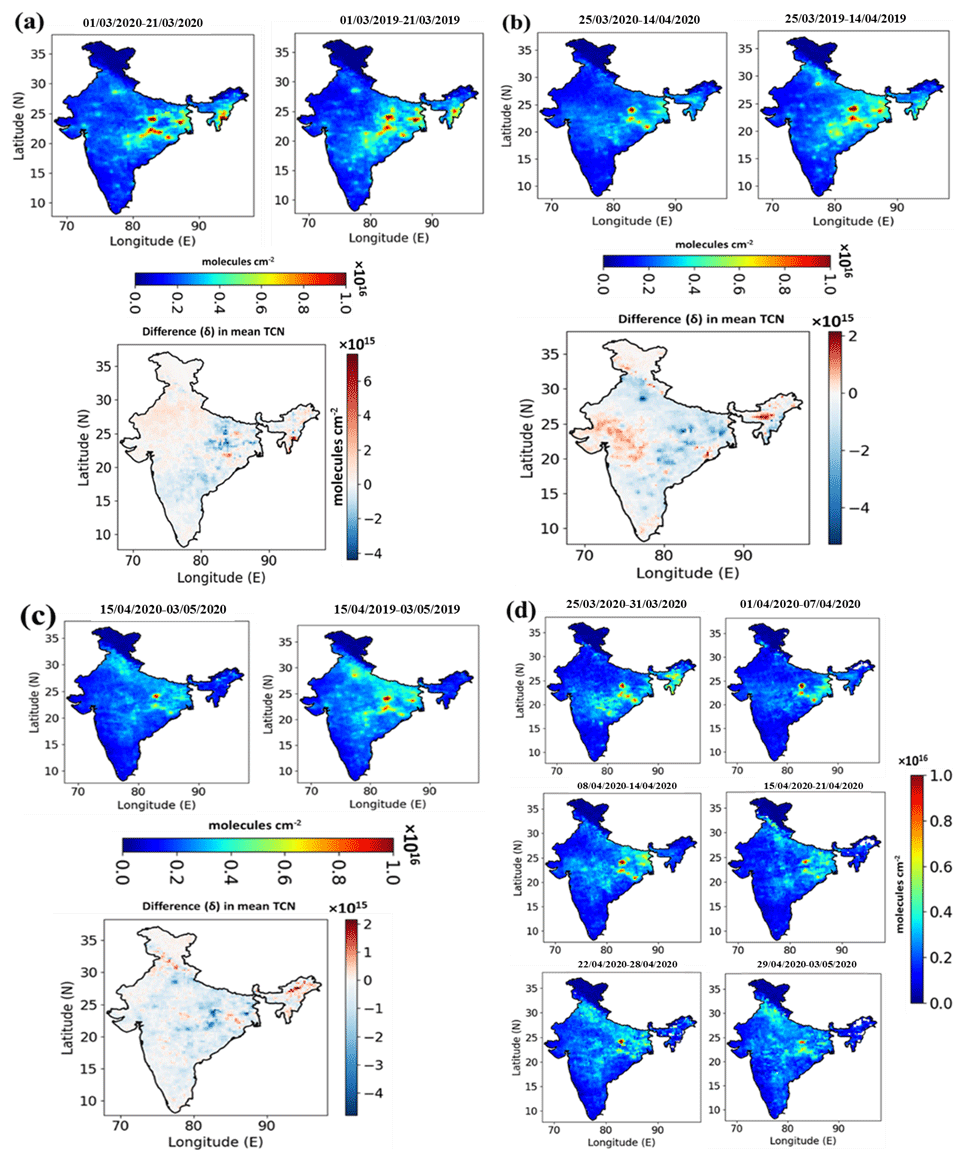
Figure 2Time-averaged TROPOMI TCN concentration and its difference maps between 2020 and 2019 during (a) pre-LD, (b) phase I lockdown, and (c) phase II lockdown. (d) Weekly mean TCN variation starting from 25 March to 3 May 2020.
4.1 Effect of lockdown (LD) on TCN
The spatio-temporal variability in TCN concentrations during the pre-lockdown and lockdown period (phase I and phase II) was analysed for the years 2019 and 2020 using high-spatial-resolution (Table 1) TROPOMI. Temporally averaged concentrations of TCN during pre-LD (1 March to 21 March 2020), phase I and phase II of lockdown, and the corresponding period of the previous year (2019) are shown in Fig. 2a–c, along with the differences in concentration levels between different periods. During the pre-LD time of years 2019 and 2020 as shown in Fig. 2a, the extent of TCN hotspot regions (majorly eastern India and National Capital Region) remains the same; however, a mild reduction of TCN was noticed during pre-LD of 2020 compared to 2019. This could probably be due to inter-annual variability in TCN levels and also the absence of source emissions due to lockdown imposed by neighbouring countries via long-range transport (for example lockdown imposed in China from 23 January 2020, Italy from 21 February 2020, and Malaysia from 18 March 2020). During this period, similar reduction of TCN over the National Capital Region (NCR) (Biswal et al., 2021) and other cities across the globe was reported (Tian et al., 2020; Xu et al., 2020; Berman and Ebisu, 2020; Collivignarelli et al., 2020; Jephcote et al., 2021).
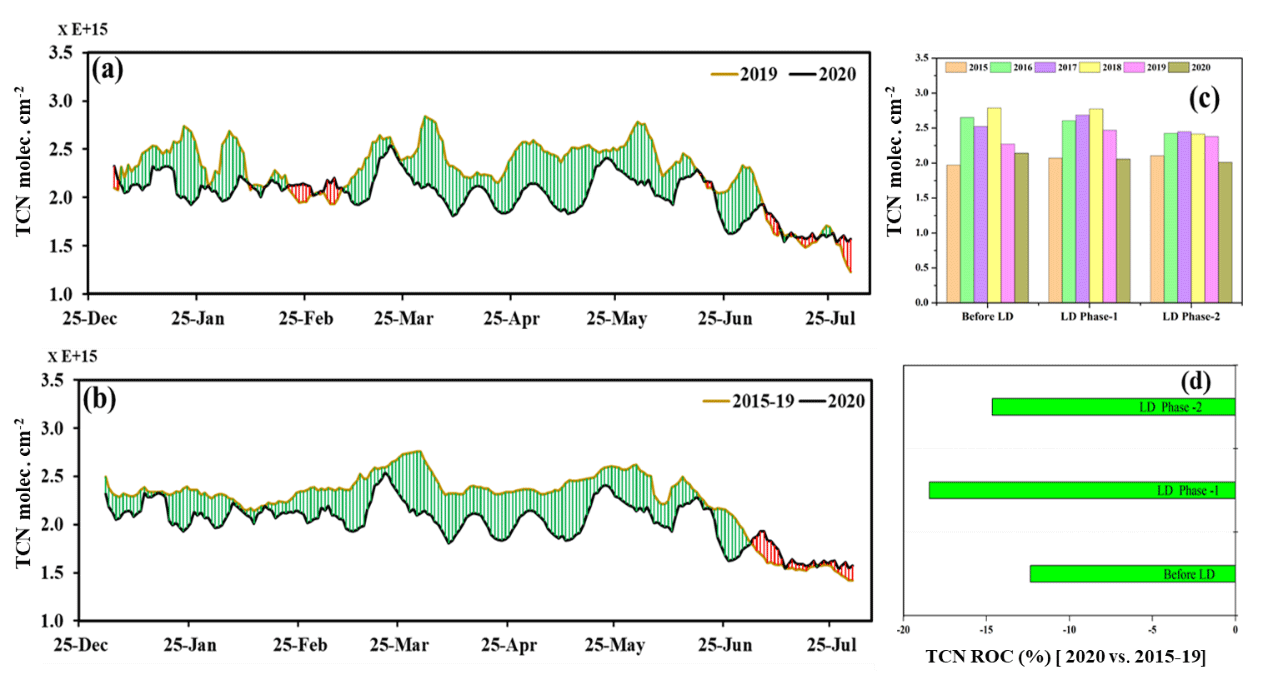
Figure 3Moving-average time series analysis during January–July of TCN during (a) 2019 vs. 2020, (b) short-term climatological mean of TCN (2015–2019) vs. 2020, (c) annual variations in TCN (2015–2020) during the period before lockdown and different phases of lockdown, and (d) rate of change of TCN during 2020 vs. the 2015–2019 period.
The mean TCN over the entire country during phase I of 2020 and 2019 is 1.53 × 10¹⁵ and 1.86 × 10¹⁵ , respectively. A reduction of about 22 % TCN levels is observed in 2020 compared to 2019 during phase I, which accounts for both inter-annual variability and lockdown effects. Further, to understand the lockdown-induced changes in TCN levels, this study was focused on TCN hotspots, which include power plants and metropolitan cities with industrial and transport activities. To contain the spread of COVID-19, about 95 % of the anthropogenic activities were halted (Ratnam et al., 2021) during phase I LD. However, during phase I, a few anthropogenic emissions are present under essential services (such as pharma industries, power plants, medical services, and transportation for carrying daily commodities) and indoor emissions. As a result, the TCN levels and their area of extent as shown in Fig. 2b during phase I of LD in 2020 over the hotspot regions (eastern region of India) decreased by 22 % when compared to the corresponding period of 2019. The eastern region of India has a significant number of major power plants and refineries with associated industries. During LD phase I in 2020, a reduction of TCN levels is observed over this region, due to the shutdown of industries and stoppage of urban activities involving transportation and small-scale industries. However, the country's high TCN levels are noticed in the eastern region with less spread, indicating the contribution of power plants in this region. Simultaneously, the National Capital Region (NCR) shows a marked reduction by about ∼ 70 % during the phase I LD. The major source of emissions in the NCR is attributed to heavy traffic and densely located industries of steel, cement, and sugar (Garg et al., 2002; Ghude et al., 2008). As mentioned above, only essential services were permitted during India's strict lockdown; consequently, all the remaining activities were halted during the phase I period. Thus, there were low levels of TCN over the hotspot regions except in the eastern region and a few grids of the central western region, which was due to continuous operation of power plants and petroleum refineries (Biswal et al., 2021).
To sustain the Indian economy, farming activities, other agricultural practices, and associated activities, namely crop residue burning, were permitted during phase II along with phase I restrictions. Figure 2c shows TCN levels and their difference map during phase II LD. With respect to the same period of phase II in 2019, the TCN levels over the country decreased by 13 % with a mean TCN of 1.55 × 10¹⁵ and 1.75 × 10¹⁵ in 2020 and 2019. Thus, a continued decrease in TCN levels is recorded over the hotspot regions. However, an increase in TCN was also observed over the neighbouring regions of the eastern region, indicating the dispersion of TCN. In contrast to earlier observation, an increase in TCN levels over the northeast region could be due to seasonal biomass burning in this region. Thus, the mean TCN levels over the entire country are 1.54 × 10¹⁵ during total LD (phase I and phase II together), with a reduction of 18 % compared to the corresponding period in 2019 as well as with respect to 5-year mean TCN levels.
Overall, the southern part of India reported lower TCN values compared to the eastern and NCR regions (hotspot regions) during pre-LD, phase I, and phase II. The hotspots over the southern part of India are not as dense as in the eastern and northern regions, and this could be one of the reasons for its lower values. The southern part of India is comparatively hot and humid, which will lead to higher OH (hydroxyl) radical concentrations than the northern part of India. As a result, photolysis of NO2 will increase, which results in low NO2 concentrations. Further, in south India, the number of large point sources, amount of biomass burning, and vehicular population are lower compared to the northern part of India (Ghude et al., 2008). Thus, reduced TCN levels over the southern part of India irrespective of LD were observed. Weekly variations in TCN are also shown in Fig. 2d to assess the extent of source emission during the lockdown period. Therefore, the present study depicted the possible driving factors of TCN values during pre-LD, phase I, and phase II using high-resolution spatial data from the satellite.
Table 2Student's paired t test for TCN during the lockdown period against the 5-year mean (2015–2019).
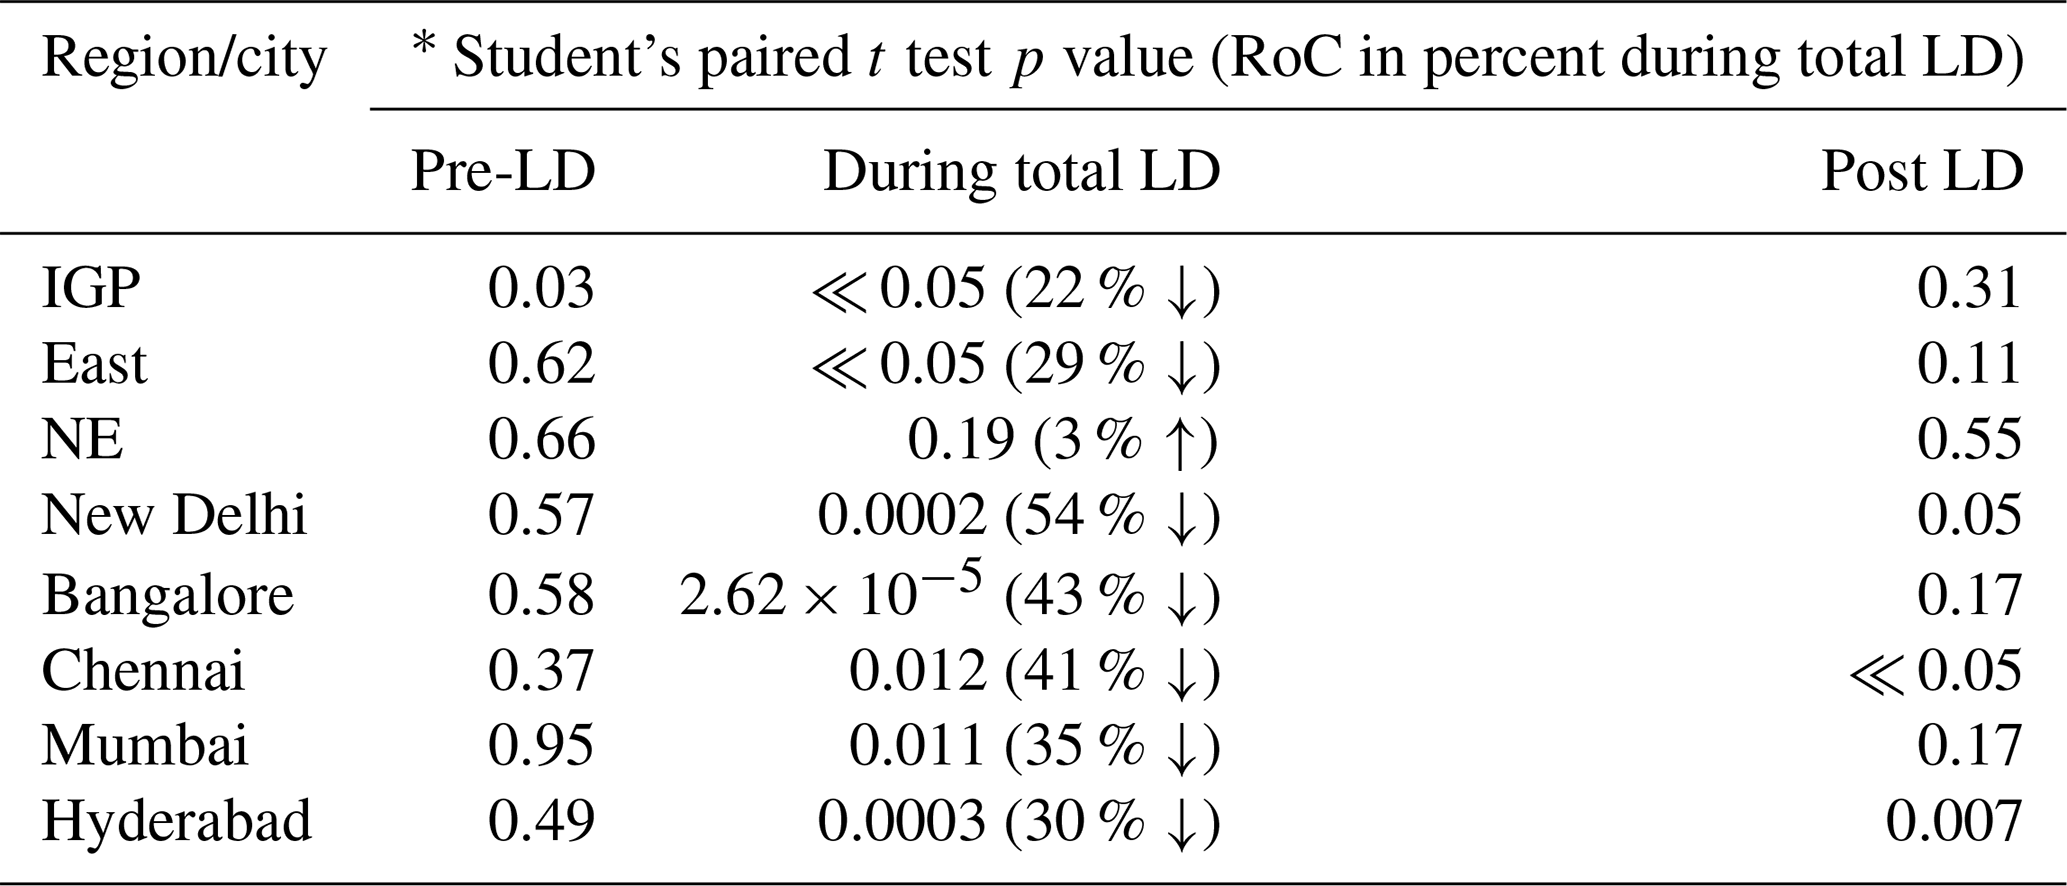
∗ p value < 0.05 is significant and vice versa; (↓, ↑) indicates (decrease, increase).
Short-term climatological variations in TCN due to lockdown
Time series analysis of TCN was carried out for the years 2015 to 2020 from January to July over the entire Indian region covering cold and hotspot regions (Fig. 3a–d). A smoothing function with a span of 7 d was used for better visualisation of patterns/trends in TCN levels (Fig. 3a and b), with red (green) bars indicating an increase (decrease) in TCN levels in 2020 when compared to the corresponding period of 2019 and with mean TCN values of 2015–2019. The 7 d moving average shows a significant decrease in TCN concentration with a 99.99 % (p value ≪ 0.05) confidence interval during the total lockdown period. However, it is also noticed that there is a decrease in TCN during prior and post-lockdown periods, which is further tested statistically and found to be insignificant with p values of 0.08 and 0.24, respectively. Further, statistical significance of TCN variability across hotspot, cold-spot regions, and also the major cities where TCN dropped (↓) drastically (except NE which showed increase) along with their percent drop during total LD when compared to 5-year mean TCN levels were summarised in Table 2. It clearly shows the TCN levels over the IGP (22 % ↓), eastern region (29 % ↓), and major cities (New Delhi 54 % ↓) declined significantly compared to the preceding 5-year mean TCN levels during the total LD period. Change in TCN during the study period is also associated with the inter-annual and seasonal variability in addition to its dominant anthropogenic sources. Figure 3c shows the annual means of TCN in pre-LD, phase I, and phase II LD during the 2015–2020 period. It depicts inter-annual variability in TCN between the years at each timescale along with the lockdown-imposed changes. Between the timescales during the study period, a clear seasonality in TCN levels is also observed in Fig. 3c.
The horizontal bar plots in Fig. 3d show the rate of change (RoC) in TCN levels in 2020 against the mean TCN levels during 2015–2019, indicating the impact of lockdown on TCN concentrations over the Indian region. The RoC is extremely important in weather and climatological studies because it allows understanding and prediction of the trends/patterns in climatic parameters. RoC is used to describe the percentage change in a parameter over a defined time period, and it represents the rate of acceleration of the parameter. De-trended TCN daily values were used to compute the RoC in this study, which account for the long-term variability in TCN. Thus, the RoC computed in the present study indicates the TCN variability due to the lockdown-imposed changes alone. There is an observable lowering in TCN levels relative to the short-term climatological mean by 12 % for the pre-lockdown period as also reported by Lal et al. (2020). During the period from January–April 2020, a substantial reduction in the level of TCN, TCC, and AOD550 was reported across the globe during the COVID-19 pandemic as different countries (at different spatial scales) imposed lockdown at different timescales. This could be the reason for a reduction in concentrations of TCN during the pre-LD period in 2020 compared with 2019 as well as with mean value of 2015–2019. Furthermore, a significant reduction of TCN concentration by 18 % and 15 % is observed for the phase I and phase II lockdowns, respectively, over the Indian region.
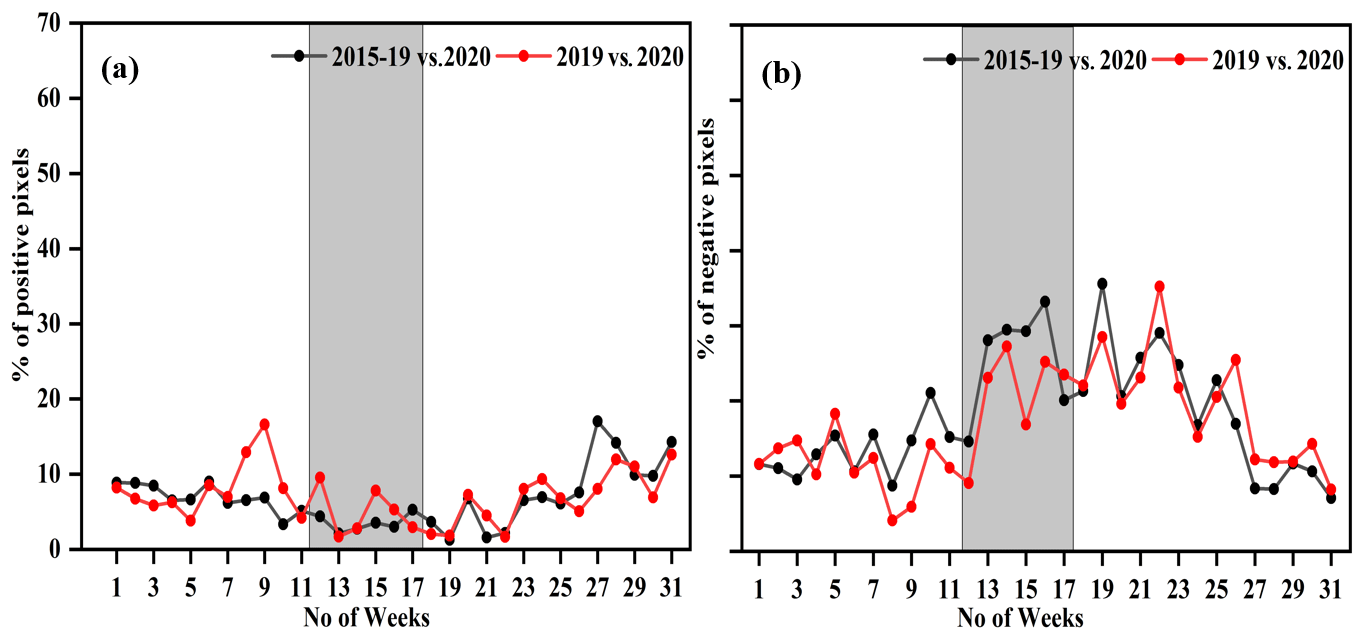
Figure 4OMI measured the TCN (a) percentage of positive pixels and (b) percentage of negative pixels during the period 2020 vs. (2015–2019) and 2020 vs. 2019.
Figure 4a and b show statistically computed TCN metrics for a number of positive pixels and number of negative pixels in percent from January to July at a weekly interval which starts from 1 January. Weekly TCN means for the years 2015–2019, 2019 and 2020 were used to calculate positive and negative pixel count based on the methodology stated in Sect. 3.1. Thus, the red line in Fig. 4a and b represents the number of positive/negative pixels for the years 2019 vs. 2020, and the black line represents the same for the years 2015–2019 vs. 2020. The study showed a greater number of negative pixels (decreased area) during lockdown weeks and vice versa for positive pixels, which depict the extent of area affected due to LD and subsequent changes in air pollutants over the Indian region.

Figure 5TROPOMI-derived time-averaged TCC concentration and their difference maps in 2020 and 2019 (a) pre-LD, (b) phase I lockdown, and (c) phase II lockdown. (d) Fire counts from VIIRS for phase I and phase II during 2020.
4.2 Effect of LD on TCC
The mean TCC levels over the Indian region during the pre-lockdown and LD periods were studied to assess the COVID-19 lockdown-induced changes in TCC. Figure 5a–c show mean concentrations of TCC over the Indian region during pre-LD, phase I, and phase II LD periods using TROPOMI data. During the pre-lockdown period (1–21 March 2020), TCC levels were higher (mean = 2.39 × 10¹⁸ ) compared to 2019 by ∼ 4.8 %, which indicates the increasing effect of anthropogenic activities and inter-annual variability. As shown in the Fig. 5b difference map, the TCC levels increased in the northeastern (NE) region followed by parts of central India (CI) and south-northwest (SNW) India compared to 2019 and the phase I LD period. An increase observed over these regions was evaluated statistically and found to be insignificant (p > 0.05). An increase in TCC in the NE region of India is mainly attributed to the active fire counts (Fig. 5d) during phase I of LD as shown in Fig. 5b. During phase I, other regions of India, namely the IGP, north, and south regions, show decreased TCC levels compared to the same period of 2019. The decreased TCC levels in these regions during phase I are attributed to the shutdown of industries (cement, sugar, steel, etc.), absence of transportation, and restriction on crop residue burning. However, household emissions due to residential cooking are still present during lockdown, which is a major contribution to CO from rural areas and some parts of the urban region (slums). In India, 72 % of the population live in rural and urban slums, and most of them continued to use household biofuel for cooking under lockdown (Verma et al., 2018; Beig et al., 2021).
However, the mean TCC levels as shown in Fig. 5c are higher during phase II of lockdown. Over the entire country, the mean TCC value during phase II is 2.38 × 10¹⁸ in comparison to the 2019 mean value of 2.32 × 10¹⁸ . In phase II of LD, the TCC levels are decreased in the NE region, which is mainly attributed to the reduced active fire activity in this region as shown in Fig. 5c. Except in the NE region, a consistent increase in TCC levels is observed during phase II. Since the agriculture farming industry is exempted in the phase II LD and observed active fire counts in central India, an enhancement in the TCC levels is observed. An increase or decrease in TCC levels in the atmosphere is mainly dominated significantly by anthropogenic activities compared to natural emissions (Kanchana et al., 2020). However, comprehensive reasons for the increase in TCC levels from the phase II LD are not investigated in this study.
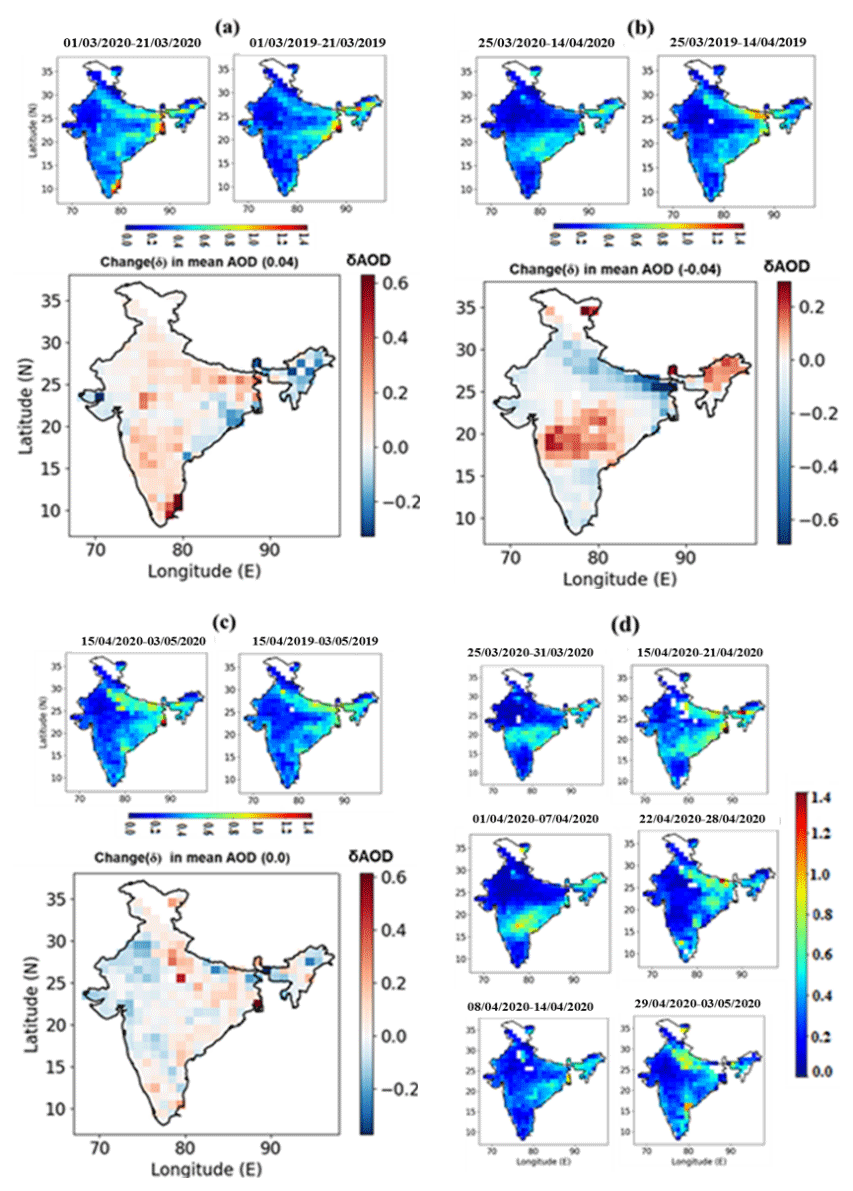
Figure 6Aqua MODIS-derived time-averaged AOD550 and its difference maps in 2020 and 2019 (a) pre-LD, (b) phase I lockdown, and (c) phase II lockdown. (d) Weekly variation in total lockdown period during 2020.
4.3 Effect of LD on AOD550
We have used Terra–Aqua MODIS-derived AOD550 during 2014–2020 for January to July to understand the lockdown-imposed changes. Terra MODIS AOD550 represents the footprint for 10:30 LT and Aqua MODIS AOD550 for the 13:30 LT. Although we observed similar spatial variation in AOD550 from both Terra and Aqua MODIS, only Aqua MODIS-derived AOD550 is shown here (Fig. 6). AOD550 levels over the Indian region for 2019 and 2020 and the difference in AOD550 for both years for the pre-lockdown period are depicted in Fig. 6a. During this period, the AOD550 levels for 2020 over the IGP region (∼ 21 % of the Indian territory landmass) are more compared to the rest of the regions of India, which is expected throughout the year. This is mainly because of its orographic effect and dense population (accommodating ∼ 40 % of the Indian population). The main anthropogenic sources over the IGP region are coal-based power plants and industries, crop residue and forest fires, and household cooking, which contribute to high AOD in this region. Thus, the IGP is known as the first hotspot for anthropogenic aerosol emission in South Asia. During phase I of LD as shown in Fig. 6b, aerosol loading over the IGP region attained its baseline concentration (∼ 45 % drop in comparison to 2019 of the same period) due to the strict implementation of LD. This region is densely populated and shows congested industrial activities, which were shut down during this period, resulting in a nearly AOD-free atmosphere. This indicates an absence of anthropogenic activities due to mobility restrictions. Further, prevailing meteorology over IGP (high wind speed and low relative humidity at 850 and 700 hPa) is also favourable for a decrease in AOD550 during phase I LD.
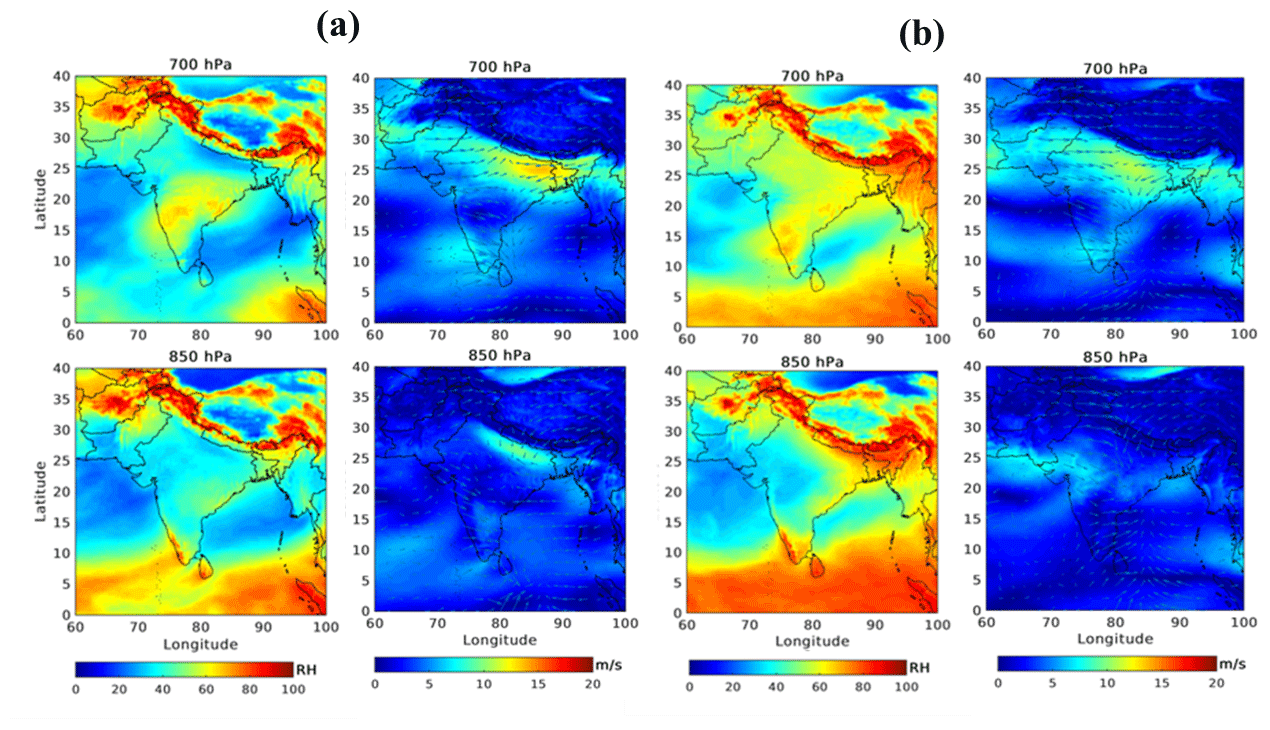
Figure 7Mean relative humidity (%) and mean winds (m s−1) observed at 700 and 850 hPa (a) phase I of lockdown and (b) phase II of lockdown.
Despite the strict LD in the country, an unexpected increase in AOD550 is observed by ∼ 28 % compared to the preceding year of the same period over central India (CI), which is predominantly dominated by dust storms (Ratnam et al., 2021) through long-range transport and prevailing meteorology (Pandey and Vinoj, 2020). Thus, to understand the prevailing meteorology over CI, phase-wise relative humidity and wind speed at pressure levels 850 and 700 hPa, respectively, were analysed as shown in Fig. 7a and b. During phase I and phase II, the majority of the winds over CI are dominated by westerly (calm) winds with high relative humidity. Under this prevailing meteorology, calm winds contribute to slow dispersion, and high relative humidity (RH) modulates the aerosol chemistry and hygroscopic growth mechanism (Pandey and Vinoj, 2020). As a result, the increase in AOD550 over CI is observed. Further, high AOD550 over NE regions was also observed because of high active forest fire counts (Fig. 5d) compared to the 2019 LD period. Figure 6c shows AOD550 during phase II of India's LD in 2020 against AOD550 in 2019 of the same period. During this phase, an increase in AOD550 (∼ 3 %) over IGP was observed. Over CI, a reduction of AOD550 (∼ 18 %) was observed compared to phase I of LD and not much change (∼ 1 %) when compared to the respective period in 2019, which depicts reversal of meteorology in phase II with respect to phase I. Causative factors for this decrease over CI with respect to phase I are due to low RH and high wind speed at 700 and 850 hPa over this region.
In a nutshell, this study demonstrates the lockdown induced Terra MODIS AOD550 changes over the IGP and CI during the total LD period and shows a significant change, with a p value of 0.01 (99 % confidence interval) with a decrease of 20 % over IGP and 0.03 (97 % confidence interval) with an increase of 25 % over CI when compared with the corresponding period of 2019.
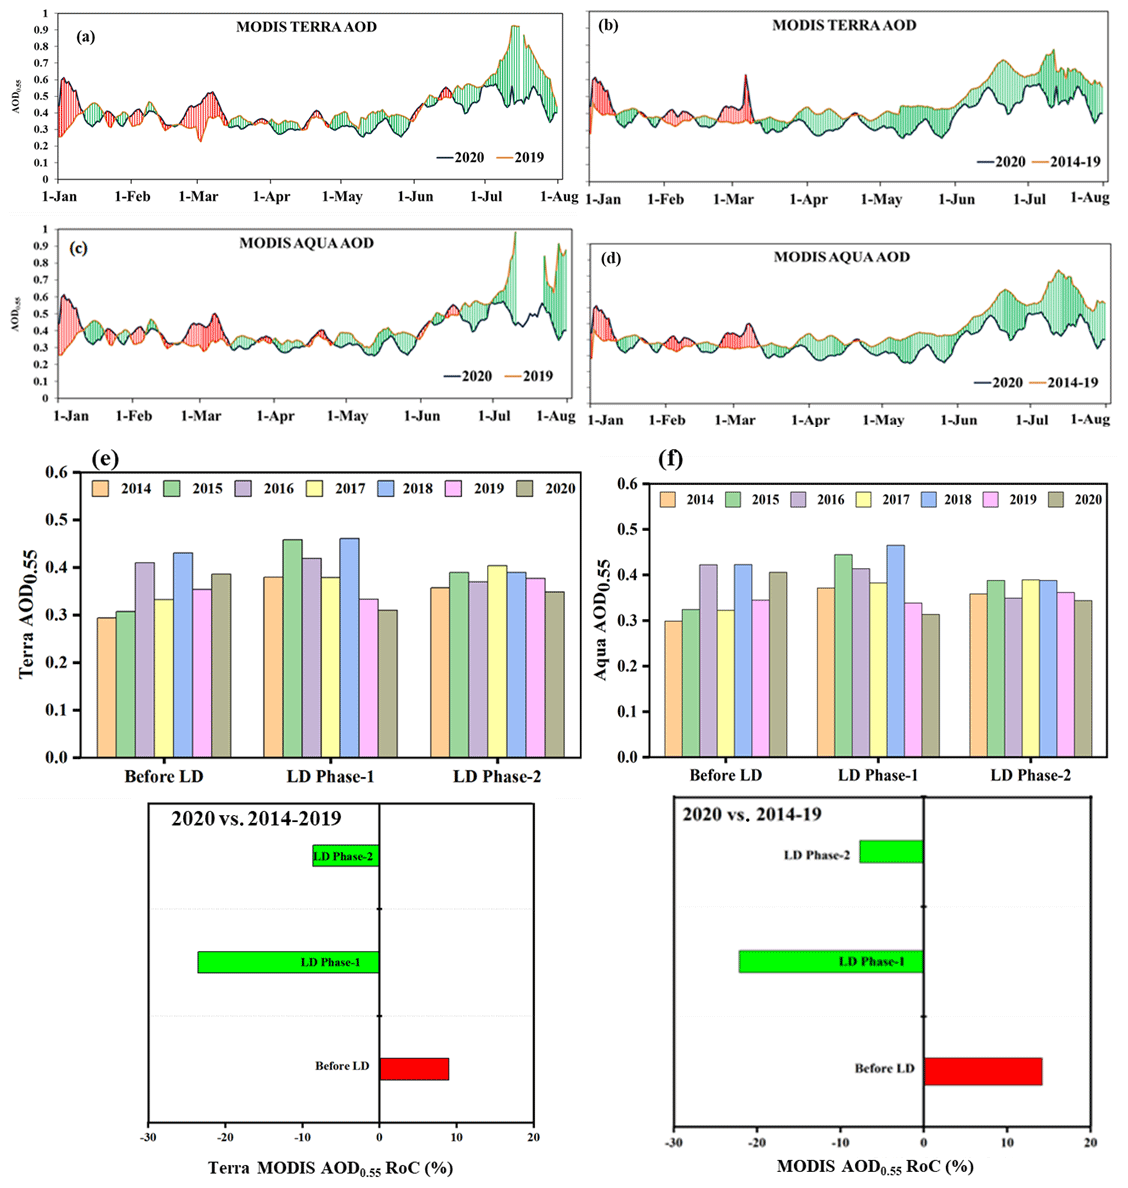
Figure 8(a) Moving-average time series analysis of AOD550 measured by Terra MODIS during 2019 and 2020. (b) Terra MODIS short-term climatological mean of AOD550 (2014–2019) vs. 2020 (c) time series AOD550 measured by Aqua MODIS during 2019 and 2020. (d) Aqua MODIS short-term climatological mean of AOD550 (2014–2019) vs. 2020. (e) Variations in Terra MODIS-measured AOD550 before lockdown and different phases of lockdown and respective RoC. (f) Variations in Aqua MODIS-measured AOD550 before lockdown and different phases of lockdown and respective RoC.
Short-term climatological variation in AOD550 due to lockdown
Aerosol optical depth is one of the important short-term climatic forcing agents along with long-lived greenhouse gases, namely carbon dioxide (CO2), methane (CH4), water vapour (H2O), and nitrous oxide (N2O). A 7 d smoothing average filter was applied to AOD550 time series data as discussed in Sect. 4.1.1. Figure 8a–d show a 7 d moving-average time series analysis of AOD550 levels for MODIS Terra and Aqua from January to July over the Indian region for 2014–2019 mean values, 2019, and 2020. AOD550 measured by Terra–Aqua MODIS (Fig. 8b and 8d) shows a significant change in aerosol loading over the country during the lockdown period in 2020 compared to the mean AOD550 of 2014–2019. Statistical analysis of Student's paired t test shows a strongly significant change in AOD550 with a p value of ≪ 0.05 for Terra–Aqua MODIS during the total LD against the 6-year mean (2014–2019). Interestingly, the present analysis shows a significant change in AOD550 during post-LD compared to LD, with p value ⋘ 0.05 (order of an Integer × 10−12), which is attributed to the continued effect of lockdown phases III and IV and scavenging effects during the monsoon season. Due to increasing precipitation during the active summer monsoon (June–July) season, lowering of aerosol is expected (Boucher et al., 2013). Thus, the continued lockdown and active monsoon improved the air quality beyond the strict lockdown period as shown in Fig. 8a–d.
The annual mean AOD550 over the Indian region in each phase is shown as vertical bars in Fig. 8e and f, indicating the inter-annual variability of AOD550 across the phases and seasonal modulation between the phases during 2014–2020. Despite inter-annual and seasonal variability of AOD550, the strict lockdown in 2020 shows a decrease in phase I and phase II compared to pre-LD, which could be associated with the reduced anthropogenic sources in addition to prevailing meteorology as discussed in Sect. 4.3. The RoC in AOD550 was computed (Fig. 8e and f) to understand the effect of short-term climatological mean AOD550 over the lockdown period in 2020. A positive RoC of +8.8 % (+14 %) was observed during pre-LD as measured by Terra MODIS (Aqua MODIS) against the 6-year mean AOD550. This increase is tested statistically and found insignificant with p values of 0.11 and 0.37 for Terra MODIS and Aqua MODIS, respectively. During phase I (phase II) Terra MODIS showed statistically significant negative RoC with −24 % (−9 %), and Aqua MODIS showed −22 % (−7 %) against 6-year mean AOD550 as most of the sectors were turned off except household emissions and essential services. Therefore, our study demonstrates that India's strict lockdown improved the aerosol air quality over the country, with marked changes over the IGP and CI.
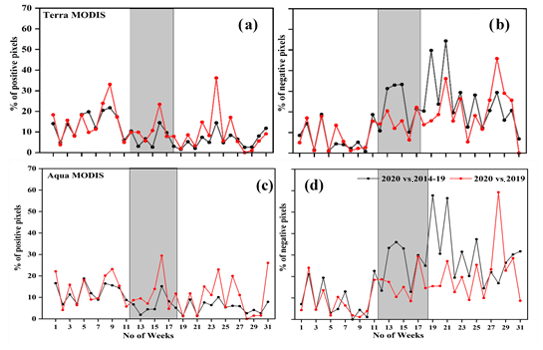
Figure 9Terra MODIS (a) percentage of number of positive pixels, and (b) percentage of number of negative pixels during the period 2020 vs. (2014–2019) and 2020 vs. 2019. Aqua MODIS (c) percentage of positive pixels and (d) percentage of negative pixels during the period 2020 vs. (2014–2019) and 2020 vs. 2019.
Figure 9a–d show the number of positive and negative AOD550 pixels in percent at weekly intervals computed from the respective biases during the study period over the Indian region. Figure 9a and b show the percentage of positive and negative pixels of AOD550 measured by the Terra MODIS. During the lockdown weeks (shaded in grey colour) in 2020, the number of positive pixels was fewer compared to 2019 and the short-term climatological mean of AOD. Figure 9b shows a higher percentage of negative pixels during the same study period, indicating the larger extent of the area with lower AOD550 due to strict lockdown in India. This change is even high with respect to short-term climatological mean of AOD550. The Aqua MODIS-derived AOD550 also shows similar variability and is shown in Fig. 9c and d.
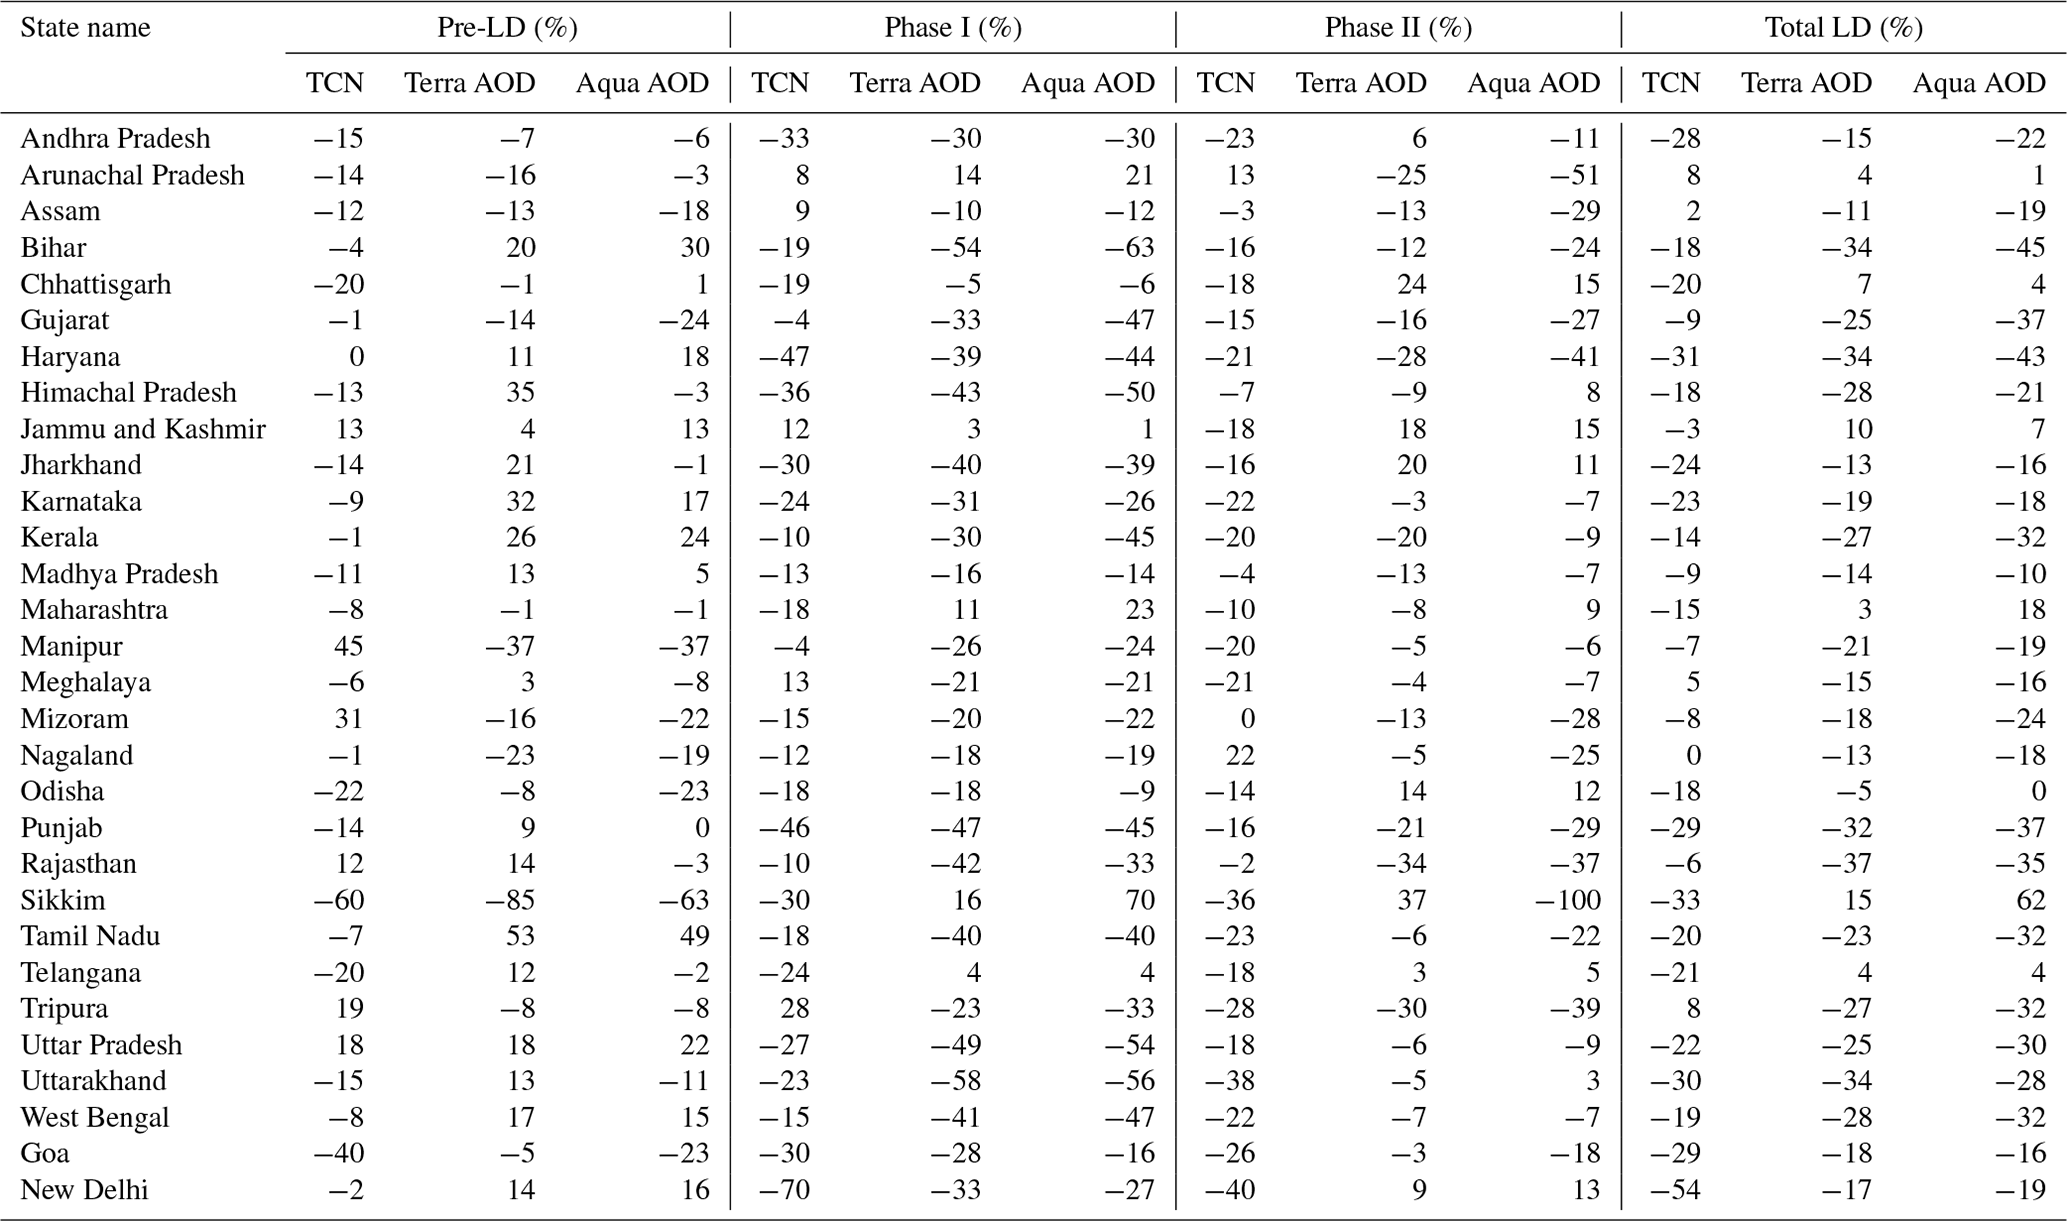
Table 3State-wise RoC (%) computed during pre-LD, phase I, phase II, and total LD for TCN, Terra MODIS-derived AOD550, and Aqua MODIS-derived AOD550.
4.4 State-wise rate of change (RoC) of TCN and AOD550
Table 3 shows state-wise RoC computed for pre-LD, phase I, phase II, and total LD phases in 2020 with respect to the 5-year mean (2015–2019) for TCN and with respect to the 6-year mean (2014–2019) for Terra AOD550 and Aqua AOD550. A positive percentage of RoC indicates an increase in pollutants for the respective phases shown in Table 3 when compared to the same period of means of TCN and AOD550 for 2015–2019 and 2014–2019, respectively. A negative percentage of RoC indicates the decrease in TCN and AOD550 with respect to 2015–2019 and 2014–2019 values, respectively, for the phases as shown in Table 3. Results depict the change of pollutants over each state during the lockdown period compared to the respective period in 5-year mean for TCN and 6-year mean for AOD550.
TCN values during the lockdown in 2020 significantly dropped in the hotspot zones of eastern states (Odisha, Chhattisgarh, and Jharkhand) and NCR regions (New Delhi, Ghaziabad, Faridabad, Gurugram, and Noida) compared to the mean TCN values of 2015–2019. Similarly, the AOD550 measured by the Terra–Aqua MODIS also shows a significant drop over the IGP region during the total LD. However, an unexpected increasing effect is noticed in the CI states with respect to the 6-year mean of AOD550 during phase I. Similar results are also observed when compared to the preceding (2019) year mean AOD550, which is discussed in detail in the earlier section. It is observed that the negative RoC of AOD550 over the IGP region during phase I is more prominent compared to phase II. Further, it is noticed that the RoC of AOD550 computed from Terra and Aqua showed similar trends during the total lockdown period with a small difference in the amplitudes. This difference of amplitude between these two sensors could be due to a difference in overpass time, which changes atmospheric dynamics such as planetary boundary layer height, solar zenith angle, and prevailing meteorology. An average of Terra–Aqua MODIS-derived RoC of AOD550 shows a strong reduction in the western part of India, mainly Rajasthan (−36 %) and Gujarat (−31 %) during the total LD period (Ranjan et al., 2020). Therefore, in a nutshell, an analysis of RoC depicts regional variability of air pollutants during the total LD period in 2020 with respect to short-term (5–6-year) mean.
The present study carried out an analysis on air pollution in connection with the world's largest lockdown imposed by the government of India to contain the spread of COVID-19. The lockdown was extended as four lockdowns with strict lockdown from phase I to several relaxations in phase IV. However, the lockdown was near total only in phases I and II, with the total shutdown of industrial and transport sectors. Therefore, the first two phases are only considered total lockdown in the present study. We have analysed satellite-based observations of TCN, TCC, and AOD550 pollutant concentrations during the period of lockdown and before LD against the same period of the preceding year (2019) and also against the short-term mean (2014–2019) of about 6 years.
Following are the major findings from the present study.
-
The TCN levels dropped significantly by 18 % across the country during the strict lockdown period compared to the preceding year with a p value of 0.0007 (confidence interval of 99.93 %).
-
A reduction of 29 % in TCN levels was observed over the hotspot regions of the Indian sub-continent during the total LD period with a higher confidence interval.
-
The TCN levels with respect to short-term climatological mean markedly dropped over the urban cities, namely New Delhi (−54 %), Bangalore (−43 %), Chennai (−41 %), Mumbai (−35 %), and Hyderabad (−30 %) with a high confidence interval of about 99.90 %.
-
An unusual increase in TCN levels over the NE region of India is attributed to the seasonal biomass burning in this region. This increase is also evaluated statistically against 5-year mean TCN and found to be insignificant with a p value of 0.19.
-
Significant reduction in TCC levels over the IGP, north, and south regions during phase I LD attributed to the absence of emissions because of a complete halt of transportation and shutdown of industries. Although variability in the TCC levels was noticed during the total LD, it was found statistically insignificant. High and low tropospheric CO levels in the NE region during phase I and phase II of LD period, respectively, are mainly attributed to the active and dormant fire counts during the corresponding period.
-
AOD550 levels are attained to near baseline in this region (AOD mean value = 0.2) in the densely populated IGP region due to the complete shutdown of all the industries during the LD. This drastic decrease in AOD550 over the IGP region was statistically evaluated and found to be very significant, with a p value of 0.008 with the preceding year (45 % decrease) and 50 % reduction against 6-year mean with a p value ≪ 0.05.
-
Despite the country's LD, the AOD550 levels are found to be high over the CI region because of the influence of transported dust storms and prevailing meteorology. Also observed was high AOD550 over NE and was associated with active fire counts. However, this increase is significant in the CI with a p value of 0.03 and insignificant in the NE region with a p value of 0.33, which indicates insignificant change due to LD.
-
The LD-induced changes in AOD550 measured by Terra–Aqua MODIS show a significant change over the Indian region, with very high confidence against the 6-year short-term climatological mean.
-
Further, an analysis of RoC was carried out to depict the regional variability of air pollutants during the total LD period in 2020 compared to short-term climatological mean.
Our study successfully demonstrated how the satellite-based TCN, TCC, and AOD550 changes over the Indian region can be used to understand and quantify the spatio-temporal variations in air quality during COVID-19 lockdown in India during 2020 and compared against the preceding year (2019) and also compared with their short-term 6-year mean values (2014–2019).
The satellite and reanalysis data used in the present study are freely available and can be downloaded as summarised in Table 1 with the user's credentials. The Python code is uploaded to an online repository (https://github.com/aarathimuppalla/airpollution_ld_study.git, last access: 21 April 2021, https://doi.org/10.5281/zenodo.4726649, Pathakoti, 2021).
Conceptualisation and formal analysis were performed by MP, AM, SH, DVM, and VKS. Writing of the original draft was carried out by MP, DVM, and ALK. Writing, review, and editing were carried out by DVM, ALK, JS, SSR, MVR, and UV.
The authors declare that they have no conflict of interest.
The authors sincerely thank Raj Kumar, director of the NRSC, for his support and encouragement in carrying out this study. We greatly acknowledge the Earthdata web portal for providing free access to the Aura OMI and Sentinel-5P TROPOMI satellites data. We also greatly acknowledge LAADS (Level-1 and Atmosphere Archive and Distribution System) operated by the National Aeronautics and Space Administration (NASA) for providing Aqua and Terra MODIS satellite data. The authors would also like to thank Land, Atmosphere Near real-time capability for Earth Observation system (LANCE)/Fire Information for Resource Management System (FIRMS) operated by NASA for providing the fire data. The authors further thank the European Centre for Medium Range Weather Forecasts (ECMWF) for providing the relative humidity and wind data. We thank Pushpanathan Raja, principal scientist, Indian Institute of Soil and Water Conservation-Indian Council of Agriculture Research, Ooty, India, for reviewing the manuscript. The authors sincerely thank the handling editor and anonymous reviewers for their constructive comments and suggestions for improving the present work.
This paper was edited by Rolf Müller and reviewed by G. China Satyanarayana and two anonymous referees.
Beig, G., Korhale, N., Rathod, A., Maji, S., Sahu, S. K., Dole, S., Latha, R., and Murthy, B. S.: On modelling growing menace of household emissions Under COVID-19 in Indian Metros, Environ. Pollut., 272, 115993, https://doi.org/10.1016/j.envpol.2020.115993, 2021.
Berman, J. D. and Ebisu, K.: Changes in US air pollution during the COVID-19 pandemic, Sci. Total Environ., 739, 139864, https://doi.org/10.1016/j.scitotenv.2020.139864, 2020.
Biswal, A., Singh, T., Singh, V., Ravindra, K., and Mor, S.: COVID-19 lockdown and its impact on tropospheric NO2 concentrations over India using satellite-based data, Heliyon, 6, e04764. https://doi.org/10.1016/j.heliyon.2020.e04764, 2020.
Biswal, A., Singh, V., Singh, S., Kesarkar, A. P., Ravindra, K., Sokhi, R. S., Chipperfield, M. P., Dhomse, S. S., Pope, R. J., Singh, T., and Mor, S.: COVID-19 lockdown-induced changes in NO2 levels across India observed by multi-satellite and surface observations, Atmos. Chem. Phys., 21, 5235–5251, https://doi.org/10.5194/acp-21-5235-2021, 2021.
Boucher, O., Randall, D., Artaxo, P., Bretherton, C., Feingold, G., Forster, P., Kerminen, V.-M., Kondo, Y., Liao, H., Lohmann, U., Rasch, P., Satheesh, S. K., Sherwood, S., Stevens, B., and Zhang, X. Y.: Clouds and Aerosols, in: Climate Change 2013: The Physical Science Basis. Contribution of Working Group I to the Fifth Assessment Report of the Intergovernmental Panel on Climate Change Stocker, edited by: Stocker, T. F., Qin, D., Plattner, G.-K., Tignor, M., Allen, S. K., Boschung, J., Nauels, A., Xia, Y., Bex, V., and Midgley, P. M.: Cambridge University Press, Cambridge, United Kingdom and New York, NY, USA, available at: https://www.ipcc.ch/report/ar5/ (last access: 5 October 2017), 2013.
Collivignarelli, M. C., Abbà, A., Bertanza, G., Pedrazzani, R., Ricciardi, P., and Miino, M. C.: Lockdown for CoViD-2019 in Milan: What are the effects on air quality?, Sci. Total Environ., 732, 139280, https://doi.org/10.1016/j.scitotenv.2020.139280, 2020.
David, L. M., Ravishankara, A. R., Kodros, J. K., Venkataraman, C., Sadavarte, P., Pierce, J. R., Chaliyakunnel S., and Millet, D. B.: Aerosol optical depth over India, J. Geophys.Res.-Atmos., 123, 3688–3703, https://doi.org/10.1002/2017JD027719, 2018.
Drummond, J. R. and Mand, G. S.: The Measurements of Pollution in the Troposphere (MOPITT) instrument: Overall performance and calibration requirements, J. Atmos. Ocean. Tech., 13, 314–320, 1996.
Eskes, H., van Geffen, J., Boersma, F., Eichmann, K.-U., Apituley, A., Pedergnana, M., Sneep, M., Veefkind, J. P., and Loyola, D.: Sentinel-5 precursor/TROPOMI Level 2 Product User Manual Nitrogendioxide, Tech. Rep. S5P-KNMI-L2- 0021-MA, CI-7570-PUM, issue 3.0.0, Koninklijk Nederlands Meteorologisch Instituut (KNMI), available at: https://sentinel.esa.int/documents/247904/2474726/Sentinel-5P-Level-2-Product-User-Manual-Nitrogen-Dioxide (last access: 15 January 2021), 2019.
Fang, M., Chan, C. K., and Yao, X.: Managing air quality in a rapidly developing nation: China, Atmos. Environ., 43, 79–86, https://doi.org/10.1016/j.atmosenv.2008.09.064, 2009.
Freedman, D. A., Pisani, R. and Purves, R.: Statistics 93–110, W. W. Norton & Co Inc, New York, 2007.
Garg, A., Kapshe, M., Shukla, P. R., and Ghosh, D.: Large point source (LPS) emissions from India: regional and sectoral analysis, Atmos. Environ., 36, 213–224, https://doi.org/10.1016/S1352-2310(01)00439-3, 2002.
Ghude, S. D., Fadnavis, S., Beig, G., Polade, S. D., and Van Der A, R. J.: Detection of surface emission hot spots, trends, and seasonal cycle from satellite retrieved NO2 over India, J. Geophys. Res.-Atmos., 113, D20305, https://doi.org/10.1029/2007JD009615, 2008.
Hsu, N. C., Lee, J., Sayer, A. M., Kim, W., Bettenhausen, C., and Tsay, S. C.: VIIRS Deep Blue Aerosol Products Over Land: Extending the EOS long-Term Aerosol Data Records, J. Geophys. Res.-Atmos., 124, 4026–4053, https://doi.org/10.1029/2018JD029688, 2019.
Jephcote, C., Hansell, A. L., Adams, K., and Gulliver, J.: Changes in air quality during COVID-19 'lockdown' in the United Kingdom. Environ. Pollut., 272, 116011, https://doi.org/10.1016/j.envpol.2020.116011, 2021.
Kanchana, A. L., Sagar, V. K., Pathakoti, M., Mahalakshmi, D. V., Mallikarjun, K., and Gharai, B.: Ozone variability: Influence by its precursors and meteorological parameters-an investigation, J. Atmos. Sol.-Terr. Phy., 211, 105468, https://doi.org/10.1016/j.jastp.2020.105468, 2020.
Krotkov, N. A., Lamsal, L. N., Celarier, E. A., Swartz, W. H., Marchenko, S. V., Bucsela, E. J., Chan, K. L., Wenig, M., and Zara, M.: The version 3 OMI NO2 standard product, Atmos. Meas. Tech., 10, 3133–3149, https://doi.org/10.5194/amt-10-3133-2017, 2017.
Lal, Preet., Kumar, A., Kumar, S., Kumari, S., Saikia, P., Dayanandan, A., Adhikari, D., and Khan, M. L.: The dark cloud with a silver lining: Assessing the impact of the SARS COVID-19 pandemic on the global environment, Sci. Total Environ. 732, 139297, https://doi.org/10.1016/j.scitotenv.2020.139297, 2020.
Levy, R. C., Mattoo, S., Munchak, L. A., Remer, L. A., Sayer, A. M., Patadia, F., and Hsu, N. C.: The Collection 6 MODIS aerosol products over land and ocean, Atmos. Meas. Tech., 6, 2989–3034, https://doi.org/10.5194/amt-6-2989-2013, 2013.
Li, R., Mei, X., Chen, L., Wang, L., Wang, Z., and Jing, Y.: Long-Term (2005–2017) View of Atmospheric Pollutants in Central China Using Multiple Satellite Observations, Remote Sens.-Basel, 12, 1041, https://doi.org/10.3390/rs12061041, 2020.
Mahalakshmi, D. V., Sujatha, P., Naidu, C. V., and Chowdary, V. M.: Contribution of vehicular emissions on urban air quality: results from public strike in Hyderabad, Indian J. Radio Space, 43, 340–348, 2014.
Mahalakshmi, D. V., Sujatha, P., Naidu, C. V., and Chowdary, V. M.: Response of vehicular emissions to air pollution and radiation-A case study during public strike in Hyderabad, India, Sustain. Environ. Res., 25, 227–234, 2015.
Martínez-Alonso, S., Deeter, M., Worden, H., Borsdorff, T., Aben, I., Commane, R., Daube, B., Francis, G., George, M., Landgraf, J., Mao, D., McKain, K., and Wofsy, S.: 1.5 years of TROPOMI CO measurements: comparisons to MOPITT and ATom, Atmos. Meas. Tech., 13, 4841–4864, https://doi.org/10.5194/amt-13-4841-2020, 2020.
Mohato, S., Pal, S., and Ghosh, K. G.: Effect of lockdown amid COVID-19 pandemic on air quality of the megacity Delhi, India, Sci. Total Environ., 730, 139086, https://doi.org/10.1016/j.scitotenv.2020.139086, 2020.
Mor, S., Kumar, S., Singh, T., Dogra, S., Pandey, V., and Ravindra, K.: Impact of COVID-19 lockdown on air quality in Chandigarh, India: Understanding the emission sources during controlled anthropogenic activities, Chemosphere, 263, 127978, https://doi.org/10.1016/j.chemosphere.2020.127978, 2020.
Nishanth, T., Praseed, K., Kumar, M. K. S., and Valsaraj, K. T.: Observational study of surface O3, NOx, CH4 and total NMHCs at Kannur, India, Aerosol Air Qual. Res., 14, 1074–1088, https://doi.org/10.4209/aaqr.2012.11.0323, 2014.
Pandey, S. K. and Vinoj, V.: Surprising Changes in Aerosol Loading over India amid COVID-19 Lockdown, Aerosol Air Qual. Res., 21, 200466, https://doi.org/10.4209/aaqr.2020.07.0466, 2020.
Pathakoti, M., Muppalla, A., Hazra, S., D. Venkata, M., A. Lakshmi, K., K. Sagar, V., Shekhar, R., Jella, S., M. V. Rama, S. S., and Vijayasundaram, U.: Measurement report: An assessment of the impact of a nationwide lockdown on air pollution – a remote sensing perspective over India, Zenodo [code], https://doi.org/10.5281/zenodo.4726649, 29 April 2021.
Ramachandran, S. and Kedia, S: Aerosol-precipitation interactions over India: review and future perspectives, Adv. Meteorol., 2013, 649156, https://doi.org/10.1155/2013/649156, 2013.
Ramachandran, A., Jain, N. K., Sharma, S. A., and Pallipad, J.: Recent trends in tropospheric NO2 over India observed by SCIAMACHY: Identification of hot spots, Atmos. Pollut. Res., 4, 354–361. https://doi.org/10.5094/APR.2013.040, 2013.
Ranjan, A. K., Patra, A. K., and Gorai, A. K.: Effect of lockdown due to SARS COVID-19 on aerosol optical depth (AOD) over urban and mining regions in India, Sci. Total Environ, 745, 141024. https://doi.org/10.1016/j.scitotenv.2020.141024, 2020.
Ratnam, V., Prasad, P., Raj, S. A., and Ibrahim, H.: Effect of Lockdown due to COVID-19 on the Aerosol and Trace Gases Spatial Distribution over India and Adjoining Regions, Aerosol Air Qual. Res., 21, 200397, https://doi.org/10.4209/aaqr.2020.07.0397, 2021.
Sayer, A. M., Hsu, N. C., Bettenhausen, C., and Jeong, M. J.: Validation and uncertainty estimates for MODIS Collection 6 “Deep Blue” aerosol data, J. Geophys. Res.-Atmos., 118, 7864–7872, https://doi.org/10.1002/jgrd.50600, 2013.
Sayer, A. M., Hsu, N. C., Lee, J., Kim, W. V., and Dutcher, S. T.: Validation, stability, and consistency of MODIS Collection 6.1 and VIIRS Version 1 Deep Blue aerosol data over land, J. Geophys. Res.-Atmos., 124, 4658–4688, https://doi.org/10.1029/2018JD029598, 2019.
Singh, R. P. and Chauhan, A.: Impact of lockdown on air quality in India during COVID-19 pandemic, Air Qual. Atmos. Hlth., 13, 921–928, https://doi.org/10.1007/s11869-020-00863-1, 2020.
Tian, H., Liu, Y., Li, Y., Wu, C., Chen, B., Kraemer, M., Li, B., Cai, J., Xu, B., Yang, Q., Wang, B., Yang, P., Cui, Y., Song, Y., Zheng, P., Wang, Q., Bjornstad, O., Yang, R., Grenfell, B., Pybus, O., and Dye, C.: An investigation of transmission control measures during the first 50 days of the COVID-19 epidemic in China, Science, 368, 638–642, https://doi.org/10.1126/science.abb6105, 2020.
Verma, M., Pervez, S., Deb, M. K., and Majumdar, D.: Domestic use of cooking fuel in India: A Review on Emission Characteristics and Associated Health Concerns, Asian J. Chem., 30, 235–245, https://doi.org/10.14233/ajchem.2018.21006, 2018.
World Health Organization (WHO): Review of evidence on health aspects of air pollution–REVIHAAP project: final technical report, WHO European Centre for Environment and Health, Bonn, 2013.
Xu, K., Cui, K., Young, L., Hsieh, Y., Wang, Y., Zhang, J., and Wan, S.: Impact of the COVID-19 Event on Air Quality in Central China, Aerosol Air Qual. Res., 20, 915–929, https://doi.org/10.4209/aaqr.2020.04.0150, 2020.