the Creative Commons Attribution 4.0 License.
the Creative Commons Attribution 4.0 License.
 | 11 Jun 2021
Urban aerosol size distributions: a global perspective
Tianren Wu
Urban aerosol measurements are necessary to establish associations between air pollution and human health outcomes and to evaluate the efficacy of air quality legislation and emissions standards. The measurement of urban aerosol particle size distributions (PSDs) is of particular importance as they enable characterization of size-dependent processes that govern a particle's transport, transformation, and fate in the urban atmosphere. PSDs also improve our ability to link air pollution to health effects through evaluation of particle deposition in the respiratory system and inhalation toxicity. To inform future measurements of urban aerosol observations, this paper reviews and critically analyzes the current state of knowledge on urban aerosol PSD measurements by synthesizing 737 PSD observations made between 1998 to 2017 in 114 cities in 43 countries around the globe. Significant variations in the shape and magnitude of urban aerosol number and mass PSDs were identified among different geographical regions. In general, number PSDs in Europe (EU) and North America, Australia, and New Zealand (NAAN) are dominated by nucleation- and Aitken-mode particles. PSDs in Central, South, and Southeast Asia (CSSA) and East Asia (EA) are shifted to larger sizes, with a meaningful contribution from the accumulation mode. Urban mass PSDs are typically bimodal, presenting a dominant mode in the accumulation mode and a secondary mode in the coarse mode. Most PSD observations published in the literature are short-term, with only 14 % providing data for longer than 6 months. There is a paucity of PSDs measured in Africa (AF), CSSA, Latin America (LA), and West Asia (WA), demonstrating the need for long-term aerosol measurements across wide size ranges in many cities around the globe.
Geographical variations in urban aerosol effective densities were also reviewed. Size-resolved urban aerosol effective density functions from 3 to 10 000 nm were established for different geographical regions and intra-city sampling locations in order to accurately translate number PSDs to mass PSDs, with significant variations observed between near-road and urban background sites. The results of this study demonstrate that global initiatives are urgently needed to develop infrastructure for routine and long-term monitoring of urban aerosol PSDs spanning the nucleation to coarse mode. Doing so will advance our understanding of spatiotemporal trends in urban PSDs throughout the world and provide a foundation to more reliably elucidate the impact of urban aerosols on atmospheric processes, human health, and climate.
- Article
(6702 KB) - Full-text XML
-
Supplement
(27547 KB) - BibTeX
- EndNote
- Included in Encyclopedia of Geosciences


Urban air pollution is a major global environmental health challenge. Aerosols are a key constituent of urban air pollution and include a diverse mixture of liquid and solid particles spanning in size from several nanometers to tens of micrometers. Urban aerosol measurements are critical for monitoring the extent of urban air pollution, identifying pollutant sources, understanding aerosol transport and transformation mechanisms, and evaluating human exposure and health outcomes (Asmi et al., 2011; Azimi et al., 2014; Harrison et al., 2011; Hussein et al., 2004; Morawska et al., 1998; Peng et al., 2014; Shi et al., 1999; Shiraiwa et al., 2017; Vu et al., 2015; Wu et al., 2008). Human exposure to aerosols in urban environments is responsible for adverse health effects, including mortality and morbidity due to cardiovascular and respiratory diseases, asthma, and neural diseases (Allen et al., 2017; Burnett et al., 2018; Delfino et al., 2005; Meldrum et al., 2017; Oberdörster et al., 2005; Rychlik et al., 2019; Shiraiwa et al., 2017; Sioutas et al., 2005). Improved characterization of urban aerosols is needed to better understand the impact of aerosol exposure on human health and to evaluate the efficacy of current and future air quality legislation.
Of particular importance are measurements of urban aerosol particle size distributions (PSDs). The ambient aerosol PSD is the result of direct particle emissions, in situ formation processes, atmospheric interactions between particles or between particles and gaseous compounds, and deposition processes. Typically, nucleation-mode particles (3 to ∼ 20 nm) are freshly formed via the nucleation of gaseous molecules and ions (Brines et al., 2015; Charron and Harrison, 2003; Zhu et al., 2002a). Aitken- (∼ 20 to 100 nm) and accumulation-mode (100 to 1000 nm) particles are often associated with primary emissions from combustion sources and condensation of secondary materials (Yue et al., 2009). Coarse-mode particles (> 1000 nm) generally result from mechanical processes, such as aerodynamic resuspension and abrasion. Nucleation-mode particles can be removed relatively quickly via coagulation due to their high diffusivity (Hinds, 2012). They can also grow into the Aitken mode during new particle formation (NPF) events (Cai et al., 2017; Xiao et al., 2015). Aitken-mode particles may further form accumulation-mode particles via coagulation and condensation. Accumulation-mode particles can have a long lifetime due to their low gravitational settling velocities and slow coagulation rates among themselves. In the urban environment, nucleation- and Aitken-mode particles generally dominate number PSDs due to the abundance of primary emission sources, such as power generation, traffic, and industrial activities. Their concentrations are high close to emission sources, while decreasing rapidly with distance from the source (Zhu et al., 2002a). Particle size can grow during transport by condensation of secondary materials. Coarse-mode particles in the urban environment often contain road dust (Almeida et al., 2006), tire debris (Adachi and Tainosho, 2004; Rogge et al., 1993), and biological particles (e.g., pollen) (Saari et al., 2015). Due to their high gravitational settling velocities, their number concentrations can be 2–4 orders of magnitudes lower than other modes.
Measurement of urban aerosol PSDs provides a basis for in-depth evaluation of size-resolved aerosol transport and transformation processes in the urban atmosphere (e.g., Hussein et al., 2004; Peng et al., 2014; Salma et al., 2011; Wehner et al., 2008; Wu et al., 2008), air pollution source apportionment (e.g., Harrison et al., 2011; Sowlat et al., 2016; Wang et al., 2013b), aerosol deposition in the human respiratory system (e.g., Hussein et al., 2019, 2020; Kodros et al., 2018; Zwozdziak et al., 2017), and associated toxicological effects on the human body (e.g., Bentayeb et al., 2015; Burnett et al., 2014; Oberdürster, 2000; Shiraiwa et al., 2017; Tseng et al., 2015; Wong et al., 2015). In addition, the measurement of aerosol PSDs is important for evaluating global climate change as particle size strongly affects the interaction of particles with solar radiation and their ability to form fog and cloud droplets (Mahowald, 2011; Seinfeld and Pandis, 2012; Zhang et al., 2012). Despite the atmospheric and health relevance of urban PSDs, long-term aerosol measurements are often focused on size-integrated concentration metrics, such as PM2.5, that lack essential size-resolved information. While urban aerosol PSD measurements have been conducted in cities around the globe, they are often short in duration and not performed as part of routine air quality monitoring. Urban PSDs provide a more complete assessment of an aerosol population, beyond what can be achieved with size-integrated metrics. Of particular importance are urban PSDs that capture the ultrafine particle (UFP) regime. UFPs tend to dominate number PSDs, which can penetrate deep into the lung and translocate to different organs and are associated with various deleterious human health outcomes (Allen et al., 2017; Delfino et al., 2005; Jiang et al., 2009; Li et al., 2016, 2017; Oberdörster, 2001; Oberdörster et al., 2004, 2005; Rychlik et al., 2019; Sioutas et al., 2005; Weichenthal et al., 2017).
A future urban aerosol PSD observation network will improve our ability to more fully understand the health implications of urban aerosols. Measurements of PSDs incorporating the UFP regime are needed given the importance of UFPs on human health and the size dependency of deposition in the human respiratory tract. The health effects of UFPs are increasingly receiving more attention due to their high number concentrations in the urban environment, high surface area to mass ratios, and higher oxidative stress compared to larger particles (Allen et al., 2017; Burnett et al., 2018; Delfino et al., 2005; Li et al., 2016, 2017; Oberdörster et al., 2004, 2005; Pieters et al., 2015; Pietropaoli et al., 2004; Rychlik et al., 2019). Human exposure to UFPs has been associated with the development of cardiopulmonary and cardiovascular diseases, lung cancer, and asthma (Anderson et al., 2012; Delfino et al., 2005; Li et al., 2016; Meldrum et al., 2017; Oberdörster et al., 2005; Pietropaoli et al., 2004; Rychlik et al., 2019; Tsiouri et al., 2015; Valavanidis et al., 2008). Inhaled deposited dose rates on a number basis are dominated by UFPs in nearly all geographical and respiratory tract regions. The deposition fraction in the pulmonary region, which is often assumed to be more relevant for respiratory diseases, shows a maximum in the UFP regime, which overlaps with the prominent modes of many urban aerosol number PSDs.
Presently, there are no comprehensive literature reviews synthesizing urban aerosol PSD observations from around the globe in order to identify geospatial trends in the structure of number and mass PSDs. Previous literature reviews of urban aerosol PSDs have focused on major emission sources and source apportionment techniques (Vu et al., 2015) and the implications of urban aerosol PSDs on indoor air quality (Azimi et al., 2014). There has been a large number of urban aerosol PSD observations conducted over the past few decades. The objective of this study is to provide a comprehensive overview of urban aerosol PSD observations from around the globe.
This study reviews urban aerosol PSD observations measured between 1998 to 2017. Urban aerosol PSD data spanning the nucleation to coarse mode (3 to 10 000 nm as electrical mobility diameter) were extracted from the literature, fit to multi-modal lognormal distribution functions, and agglomerated by geographical region in order to identify trends in the physical characteristics of aerosol populations from different regions. This represents the first attempt, to the best of the authors' knowledge, to understand geographical variations in urban aerosol PSDs at a global scale. The geographical distribution of measurement locations and the categorization of the collected PSDs enables the identification of gaps in urban aerosol PSD measurements. This will help motivate future research efforts and frame forthcoming urban air pollution measurement needs. As climate models have been improved significantly in terms of spatial resolution, a compilation of urban PSDs can also serve as useful input for models to estimate the direct and indirect influence of aerosols on regional and global climates. Along with urban aerosol PSDs, size-resolved urban aerosol effective densities were also reviewed. The effective density is an important aerosol morphological parameter that provides a basis to reliably translate measured number PSDs to mass PSDs.
An expansive literature search was conducted on short- and long-term stationary and mobile measurements of urban aerosol number and mass PSDs between 1998 and 2017. The aim was to capture any potentially relevant peer-reviewed resources in which urban aerosol PSDs have been reported. Two academic search indices, Web of Science and ScienceDirect, along with Google Scholar, were used to conduct the literature search. Search terms included urban aerosol, particle size distribution, urban aerosol size distribution, aerosol size distribution, urban particulate matter, scanning mobility particle sizer urban, differential mobility particle sizer urban, and urban aerosol MOUDI (micro-orifice uniform deposit impactor), among others. Approximately 3400 peer-reviewed journal articles and reports were initially screened to determine if they contained suitable information. Approximately 200 of them, which reported urban or semi-urban aerosol PSDs in the submicron regime (< 1000 nm), with some also covering the coarse regime (> 1000 nm), were selected for detailed analysis. These articles presented 737 individual PSDs (182 of which covered both the submicron and coarse regime) which have been reported in previous peer-reviewed journal articles in the form of figures or fitting parameters, from 114 cities in 43 countries around the globe (Table S1). All the PSDs are the result of a time average over certain sampling periods. Most PSDs reported number-based concentrations [e.g., measured with a scanning mobility particle sizer (SMPS), aerodynamic particle sizer (APS), or optical particle sizer (OPS)], while some report mass-based concentrations (e.g., measured by inertial impactors). For PSDs reported only in the form of figures without lognormal fitting parameters, as was most common among the references, the GRABIT tool in MATLAB (The MathWorks, Inc., Natick, MA, USA) and WebPlotDigitizer (https://automeris.io/WebPlotDigitizer, last access: 27 February 2021, Version 4.0) were utilized to extract the data points of the PSDs. The PSDs were subsequently reproduced in MATLAB. A consistent particle size definition, the electrical mobility diameter (Dem), was used for all PSDs, as described in Sects. 3 and 4.
The PSDs were classified by geographical region: Africa (AF), Central, South, and Southeast Asia (CSSA), East Asia (EA), Europe (EU), Latin America (LA), North America, Australia, and New Zealand (NAAN), and West Asia (WA) (Table S1). The PSDs in each geographical region were separated into two site types depending on the measurement location within the city. “Urban” indicates that the measurement was conducted in urban areas that are not strongly affected by localized traffic emissions. “Traffic (near-road)” indicates that the environment was strongly influenced by traffic emissions, e.g., street canyon or roadside.
3.1 Introduction to size-resolved urban aerosol effective density functions
Evaluation of geographical variations in size-resolved aerosol morphological features is needed to better characterize urban aerosol populations around the world. This section outlines the development of size-resolved urban aerosol effective density (ρeff) functions from Dem=3 to 10 000 nm. Size-dependent differences in the aerosol particle density (ρp) and dynamic shape factor (χ) are best captured together through ρeff. The ρeff functions serve three purposes in this study: (1) to translate urban aerosol number PSDs to mass PSDs, (2) to convert aerodynamic diameter (Da)-based PSDs to Dem-based PSDs, and (3) to provide a summary of ρeff measurements in the urban atmosphere. Point (2) is necessary to enable a consistent particle size definition to be used in compiling PSD observations from around the globe, as described in Sect. 4. The size-resolved ρeff functions include a combination of direct measurements of ρeff in the urban atmosphere (Sect. 3.2) and approximations for size fractions where direct measurements have not yet been reported in the literature, such as sub-10 nm and coarse-mode particles (Sect. 3.3–3.5). The integration of the size-resolved ρeff functions with the urban aerosol PSD observations is presented in Sect. 3.6.
Different definitions of ρeff have been used in previous studies (DeCarlo et al., 2004). In the current study, ρeff is defined as the ratio of the measured particle mass (mp) to the volume calculated from Dem assuming spheres (DeCarlo et al., 2004; Hu et al., 2012; McMurry et al., 2002; Qiao et al., 2018) (Eq. 1):
Only empirical ρeff values defined in this manner were collected from the literature. The particle volume (Vp) is defined as the volume taken up by all of the solid and liquid material in the particle and void space enclosed within the particle envelope (DeCarlo et al., 2004). For an irregular particle, the volume equivalent diameter (Dve) represents the diameter of a sphere that has the same volume as Vp (DeCarlo et al., 2004; Hinds, 2012; Seinfeld and Pandis, 2012) (Eq. 2):
The ratio of mp to Vp is referred to as the particle density (ρp), as shown in Eq. (3):
The relationship between Dem and Dve is given by DeCarlo et al. (2004) and Seinfeld and Pandis (2012):
where Cc is the Cunningham slip correction factor (Allen and Raabe, 1982, 1985; Hinds, 2012). For a spherical particle, χ is equal to 1; Dem is equal to Dve; and ρeff is equal to ρp. For particles with irregular shapes, χ is greater than 1; Dem is greater than Dve; and ρeff is less than ρp.
For coarse-mode particles, the value of is approximately unity, such that the Cunningham slip correction factors in Eq. (4) can be reasonably neglected. Therefore, Eq. (4) becomes Dem=Dveχ. Plugging this into Eq. (1), we arrive at Eq. (5):
Combining Eqs. (3) and (5), we can derive Eq. (6), which describes the relationship between ρeff, ρp, and χ for coarse- mode particles (an example is given in Fig. 2):
3.2 Urban aerosol effective densities: summary of direct measurements
Direct measurements of ρeff in urban environments are limited. However, sufficient data are available in the literature to identify trends in ρeff among geographical regions and intra-city site types (urban or traffic). Size-resolved urban aerosol ρeff values were extracted from nine studies conducted in Denmark, China, the United States, and Finland (Table S2). The studies report direct measurements of ρeff, primarily in the submicron regime through use of various aerosol instrument configurations, such as those evaluating the mass–mobility relationship of an aerosol population through a differential mobility analyzer (DMA)–aerosol particle mass analyzer (APM) system (e.g., McMurry et al., 2002). The measured ρeff values and measurement information, including measurement technique, duration, and site (city, country), are summarized in Table S2. All the results are the averages over given sampling periods.
As the PSD and direct ρeff measurements were conducted in different cities and at different site types within the city, it is reasonable to apply ρeff values which were measured under a condition consistent with a PSD measurement when converting number PSDs to mass PSDs and Da to Dem. In order to apply the most reasonable ρeff to a PSD observation, the collected size-resolved ρeff values were divided into three groups according to the geographical region where the direct measurement was conducted and the site type (urban or traffic). Direct measurements conducted in China in “urban” environments were incorporated into Group A. Direct measurements in the United States in “urban” environments were incorporated into Group B. Direct measurements conducted in the United States, Finland, and Denmark in “traffic” environments were incorporated into Group C. None of the direct ρeff measurements in China were conducted in “traffic” environments. The ρeff values for the size range of 3200 to 5600 nm reported by Hu et al. (2012) were not included as the high ρeff values associated with the abundance of minerals in coarse particles in Beijing might bias the analysis (Guo et al., 2010; Zhang et al., 2010).
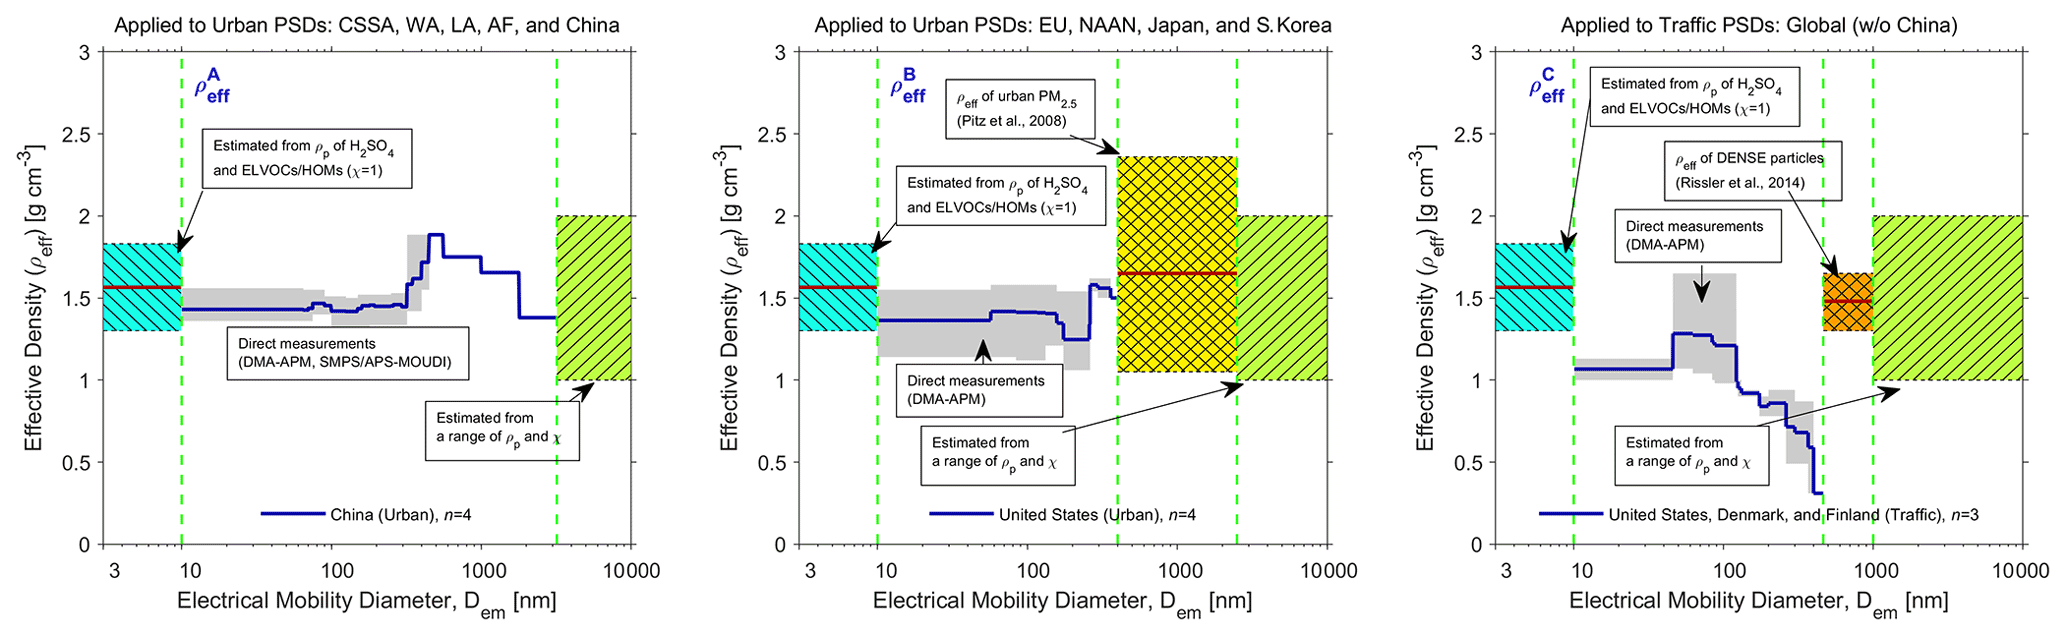
Figure 1Size-resolved urban aerosol effective density functions (ρeff) for Group A (“urban”; obtained from measurements in China), Group B (“urban”; obtained from measurements in the United States), and Group C (“traffic”; obtained from measurements in the United States, Finland, and Denmark). Details of the ρeff measurements are summarized in Table S2. ρeff values for different combinations of χ and ρp are illustrated in Fig. 2. Measurement technique nomenclature: DMA: differential mobility analyzer, APM: aerosol particle mass analyzer, SMPS: scanning mobility particle sizer, APS: aerodynamic particle sizer, MOUDI: micro-orifice uniform deposit impactor.
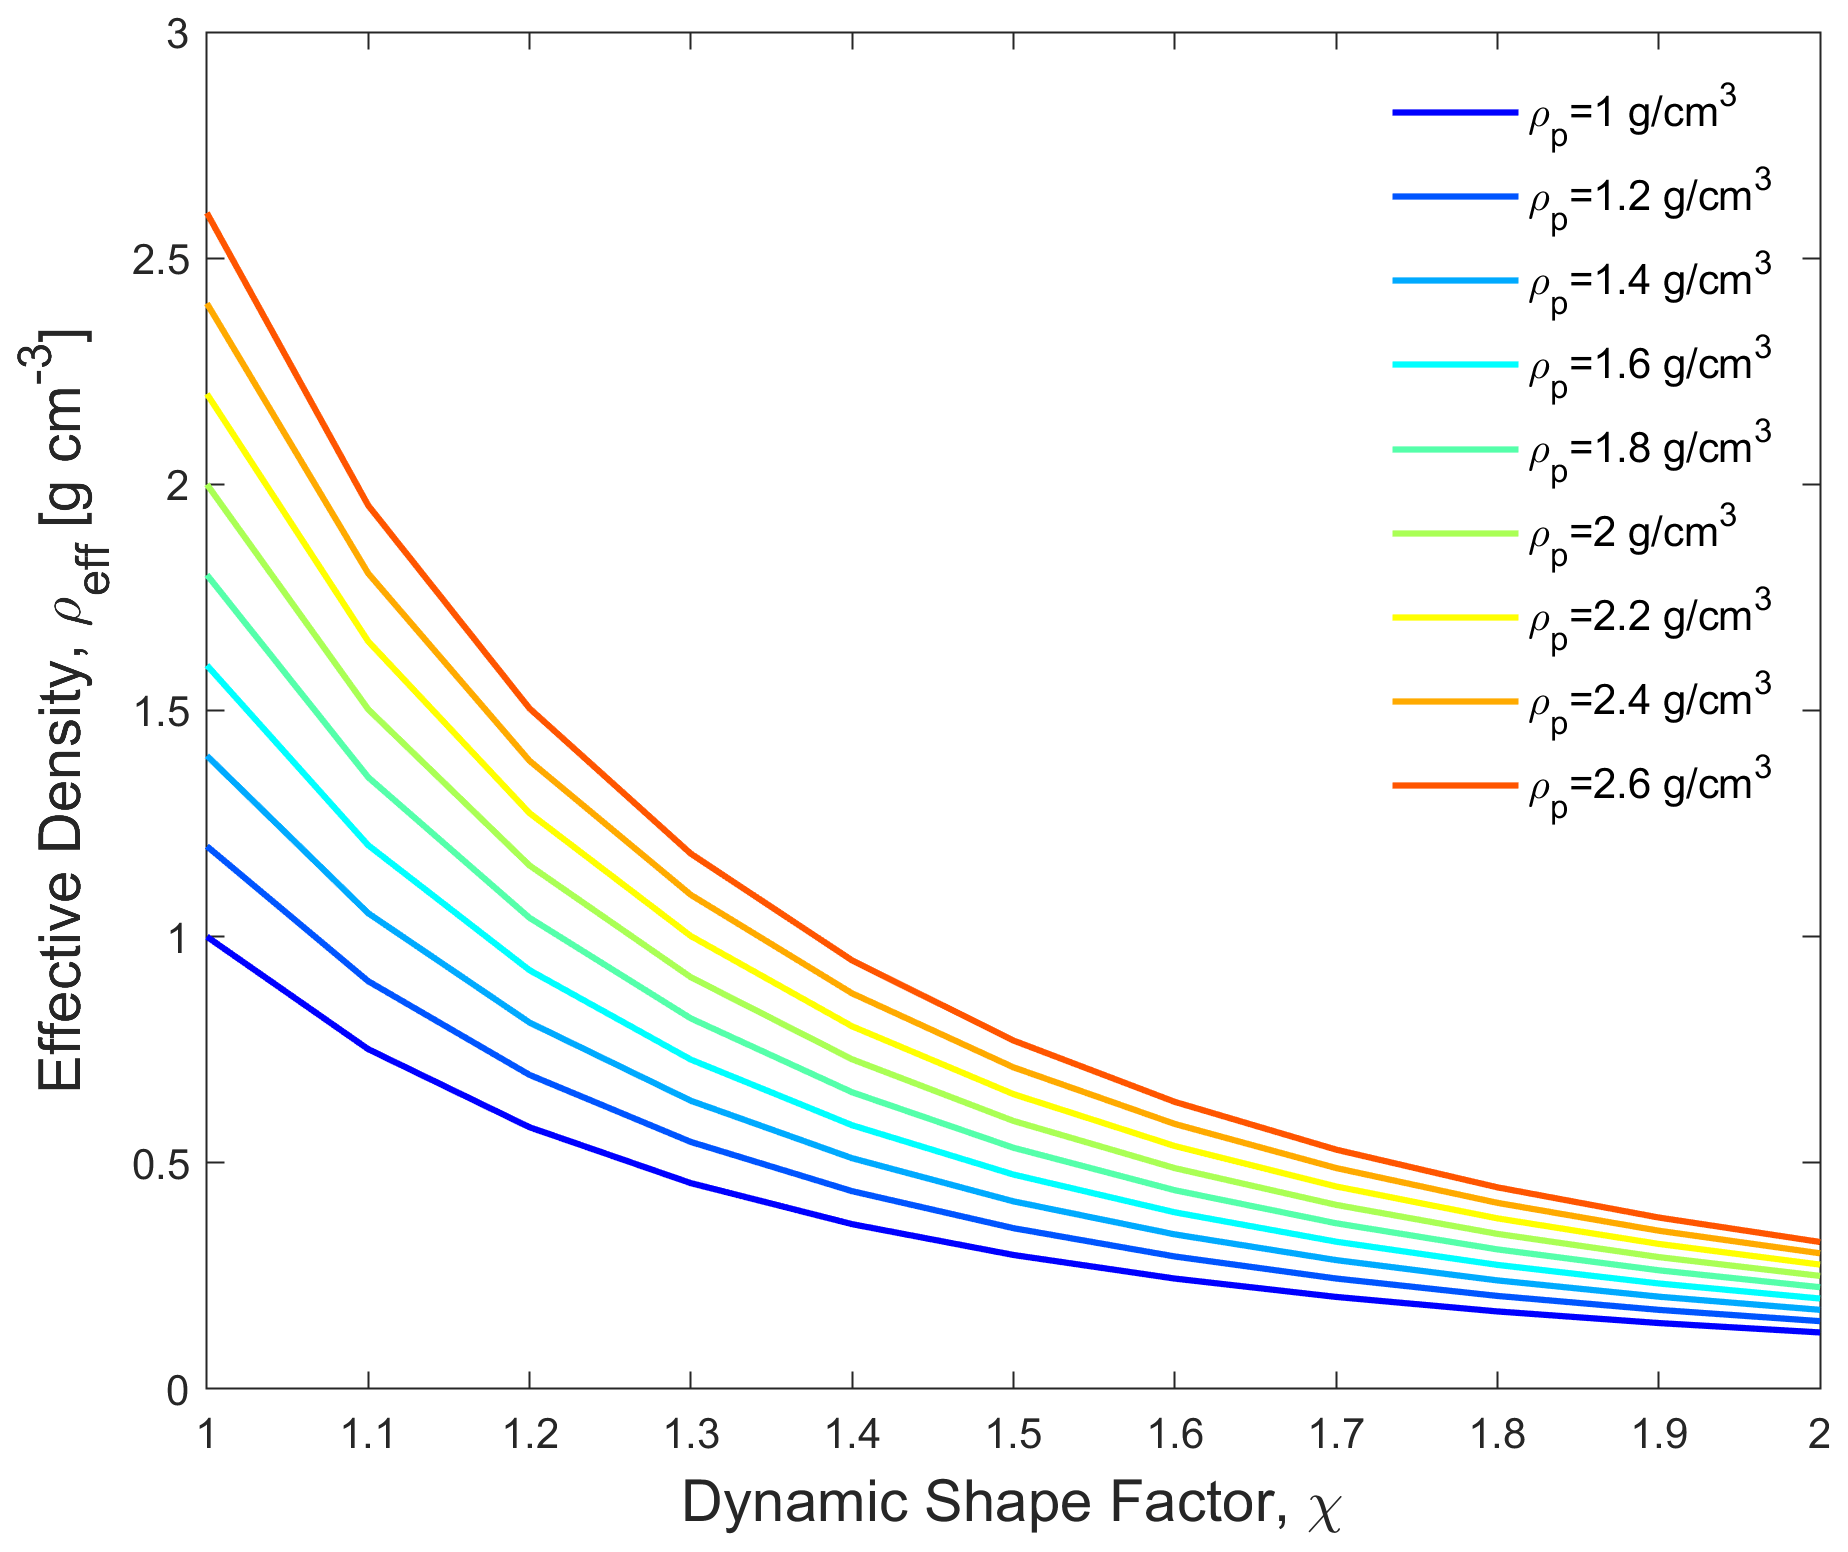
Figure 2Effective densities (ρeff) as derived from different values of dynamic shape factors (χ) and particle densities (ρp), assuming the value of is approximately unity for coarse particles.
Representative size-resolved ρeff functions were estimated for Groups A, B, and C (Fig. 1). For the direct ρeff measurements tabulated in Table S2, the collected values were often reported as a function of particle size discretely. In order to convert them to a continuous ρeff function with respect to size, which can be easily applied when converting number PSDs to mass PSDs and Da to Dem, a few assumptions were made. For particles greater than 10 nm, if the particles at a certain diameter Dem,1 were reported to have an effective density of ρeff,1, we assume the particles in the size range from ( nm) to ( nm) also have the same effective density of ρeff,1. If the particles at diameter Dem,2 (Dem,2 > Dem,1) were reported to have an effective density of ρeff,2 in the same study, and Dem,2 is within the size range from Dem,1 to ( nm), we assume the particles with the size from ( nm) to to have the effective density of ρeff,1, while the particles with the size from to ( nm) have the effective density of ρeff,2. By doing this, we obtained several continuous size-resolved ρeff functions ranging from approximately 10 nm to several hundreds of nanometers. We then took the mean of the size-resolved ρeff values derived from direct measurements in each of the three groups, illustrated as blue lines in the gray regions of Fig. 1.
3.3 Urban aerosol effective densities: considerations for sub-10 nm particles without direct measurements
Direct measurements of ρeff from Dem=3 to 10 nm have not been previously reported in the literature. Particles in this size range are typically formed by homogeneous or heterogeneous nucleation, which can involve sulfuric acid (H2SO4), amines, ammonia, and organic vapors (e.g., Kulmala et al., 2013). H2SO4 and highly oxygenated molecules (HOMs) or extremely low-volatility organic compounds (ELVOCs) are often involved in the nucleation and initial growth of particles during an atmospheric new particle formation event. Previous studies have assumed nucleated particles formed in experimental chambers in the size range of 4 to 12 nm to have a density of 1.5 g cm−3 (Wang et al., 2010). ELVOCs and HOMs are assumed to have a density of 1.5 and 1.4 g cm−3, respectively (Ehn et al., 2014; Tröstl et al., 2016). For simplicity, we used the ρp of condensed ELVOCs (Ehn et al., 2014) (1.5 g cm−3) and the condensed-phase density of H2SO4 (Xiao et al., 2015) (1.83 g cm−3) to estimate the lower and upper limits of ρeff for particles from Dem=3 to 10 nm, assuming the particles adopt a spherical shape with χ=1. The mean value of the two limits was used as the representative ρeff for all three groups (dark red lines in light blue regions of Fig. 1). Despite uncertainties in the assumed ρeff values, particles from Dem=3 to 10 nm contribute negligibly to particle mass concentrations and are seldom measured with aerodynamic-based techniques, thus conversion from Da to Dem is often unnecessary.
3.4 Urban aerosol effective densities: considerations for accumulation-mode particles without direct measurements
There is a lack of direct measurements of ρeff in Groups B and C for particles greater than approximately 400 nm in size. Pitz et al. (2008b) conducted measurements of apparent particle density for particles with a Da≤2500 nm (PM2.5) at an urban background site in Germany. The apparent particle density ranged from 1.05 to 2.36 g cm−3, with a mean value of 1.65 g cm−3. As particles in the accumulation mode strongly contribute to urban aerosol mass concentrations (e.g., PM1, PM2.5), we assume the mean apparent particle density of 1.65 g cm−3 to be the representative ρeff for particles in the size range from Dem=400 to 2500 nm in Group B (dark red line in yellow region of Fig. 1). Rissler et al. (2014) measured the ρeff of urban aerosols from 50 to 400 nm in a street canyon in central Copenhagen and identified two different groups of aerosols with distinctive ρeff: loose chain-like soot aggregates and more dense particles. The ρeff of the dense particles from Dem=50 to 400 nm was in the range of 1.3 to 1.65 g cm−3, of which the main constituents were inorganic salts, such as sulfate, nitrate, and ammonium, along with organics. Previous studies that have investigated the chemical composition of near-road aerosols indicated that the mass fraction of black carbon (elemental carbon) to the total mass of particles from Dem=400 to 1000 nm was 6.4 % to 26.7 % (Brüggemann et al., 2009; Daher et al., 2013; Fushimi et al., 2008; Massoli et al., 2012; Song et al., 2012). Here, we assume that loose chain-like soot aggregates do not contribute significantly to particle mass concentrations in this size range and applied the mean value of ρeff for “dense” particles as measured by Rissler et al. (2014) as the representative ρeff for particles from Dem=400 to 1000 nm in Group C (dark red line in orange region of Fig. 1). Although soot particles, which have a ρeff less than that of the dense particles, exist in the size range of Dem=400 to 1000 nm, denser components, such as organics, mineral dusts, and crustal materials, may also exist in this size range.
3.5 Urban aerosol effective densities: considerations for coarse-mode particles without direct measurements
Direct measurements of urban aerosol ρeff have been rarely conducted in the coarse mode, in part due to the difficulty of extending mass–mobility measurements (e.g., DMA–APM) to this size range. Coarse particles can be composed of organics, ions, dusts, crustal material, brake and tire wear, sea salt, black carbon, and other trace elements (Brüggemann et al., 2009; Cheung et al., 2011; Cozic et al., 2008; Daher et al., 2013; Kim et al., 2003; Koçak et al., 2007; Koulouri et al., 2008; Pakkanen et al., 2001; Song et al., 2012). These materials are associated with a wide range in ρp. Secondary organic aerosol (SOA) synthesized in the laboratory is reported to have ρp ranging from 1 to 1.65 g cm−3, depending on formation conditions and gas-phase precursors (Kostenidou et al., 2007; Malloy et al., 2009; Nakao et al., 2013; Zelenyuk et al., 2008). The ρp values of (NH4)2SO4 and NH4NO3, which represent sulfate and nitrate compounds dominant in ionic mass, were reported to be approximately 1.7 g cm−3 (Lide, 2005; Mikhailov et al., 2013; Neusüß et al., 2002; Tang, 1996). The ρp of dust varies with the associated components, including amorphous silicon oxide (2.1 to 2.3 g cm−3), illite/muscovite (2.7 to 3.1 g cm−3), montmorillonite (2.2 to 2.7 g cm−3), and quartz (2.65 g cm−3) (Reid et al., 2003).
The shape of coarse-mode particles is often composition-dependent. The value of χ depends on the shape of the particle. For a sphere, χ=1; for a cylinder with an axial ratio of 2, χ=1.1; for a cylinder with an axial ratio of 5, χ=1.35; and for a compact cluster of four spheres, χ=1.17 (Hinds, 2012). Some studies indicate that SOA has a spherical shape, suggestive of χ ∼ 1 (Abramson et al., 2013; Pajunoja et al., 2014; Virtanen et al., 2010). Coarse-mode dust particles often exhibit large values of χ. The χ of Saharan mineral dusts measured in Morocco with a Dem = 1200 nm is 1.25 (Kaaden et al., 2009). Davies (1979) reported χ to be 1.36 to 1.82 for quartz, 2.04 for talc, and 1.57 for sand. The complicated mixing state of urban aerosols introduces additional uncertainties in estimating the ρeff for both accumulation- and coarse-mode particles (Riemer et al., 2019).
The values of ρeff were estimated for coarse-mode particles in Group C, for particles larger than 2500 nm in Group B, and for particles larger than 3200 nm in Group A. The ρp and χ of three types of aerosols, including inorganic aerosol, SOA, and mineral dust, were used to estimate a range of values for ρeff. (NH4)2SO4 and NH4NO3, with a ρp of approximately 1.7 g cm−3 and a χ of 1.01 (Hudson et al., 2007; Lide, 2005; Mikhailov et al., 2013; Neusüß et al., 2002; Tang, 1996), were selected as the representative inorganic aerosol to calculate ρeff. Nearly spherical SOA was assumed to adopt ρeff of 1 to 1.65 g cm−3 (Kostenidou et al., 2007; Malloy et al., 2009; Nakao et al., 2013; Zelenyuk et al., 2008). Illite, kaolinite, and montmorillonite were chosen to represent mineral dust, with ρp of 2.7 to 3.1, 2.6, and 2.2 to 2.7 g cm−3, and with χ of 1.3, 1.05, and 1.11, respectively (Hudson et al., 2007, 2008; Reid et al., 2003).
With the different combinations of ρp and χ described above, Eq. (6) was applied to calculate ρeff values for the three types of aerosols. The values span from 1 to approximately 2 g cm−3 (light green region of Fig. 1). The ρeff values within this range are used as the representative ρeff for coarse-mode particles in Group C, for particles larger than 2500 nm in Group B, and for particles larger than 3200 nm in Group A.
3.6 Integration of size-resolved urban aerosol effective density functions with urban aerosol PSD observations
The combination of directly measured and estimated ρeff values between Dem = 3 to 10 000 nm provides a basis to establish continuous, size-resolved urban aerosol ρeff functions for Groups A (), B (), and C (), as illustrated in Fig. 1. When converting number PSDs to mass PSDs and Da to Dem, was applied to number PSDs measured in the “urban” environment in cities in CSSA, WA, LA, AF, and China. The group was applied to number PSDs measured in the “urban” environment in cities in EU, NAAN, Japan, and South Korea. The group was applied to number PSDs measured in the “traffic” areas in cities around the globe, excluding China.
The group was applied to the number PSDs measured at both urban and traffic sites in China. The urban PSD measurements in China collected in this study were mainly from megacities, such as Beijing, Shanghai, and Guangzhou. Heavy-duty diesel trucks are prohibited to enter many urban areas during the daytime in these megacities (Wu et al., 2008). In addition, the fraction of diesel-powered cars in cities in China is much lower than that in Europe or North America. It is shown that gasoline-powered passenger cars contribute 91 % of the total number of vehicles in Beijing (Wu et al., 2008). Therefore, the relative fraction of soot particles in the near-road region was expected to be lower than that in North America and Europe. Previous studies suggest that the contribution of black carbon to PM2.5 mass concentrations was less than 4 % in Shanghai (Cao et al., 2013; Feng et al., 2009). In addition, soot particles from gasoline engine vehicles might be more compact due to the relatively sulfur-rich fuel used in China (Yin et al., 2015). Soot particles may also be heavily aged or internally mixed with other condensable materials due to the higher pollution levels in megacities, resulting in a higher ρeff than freshly emitted soot particles. Huang et al. (2014) indicated that the number fraction of pure black carbon was 1.9 % in Shanghai during polluted periods. Therefore, the near-road size-resolved ρeff was assumed to be closer to the values compiled for , rather than those for .
3.7 Summary of size-resolved urban aerosol effective densities
The size-resolved ρeff functions for Groups A, B, and C are illustrated in Fig. 1. Across the size range covered by direct ρeff measurements in Groups A and B, there is no clear size dependency of ρeff, in part because organics and secondary inorganic ions are dominant in this size range. The directly measured ρeff values collected from cities in the United States (Group B) are between 1.1 to 1.6 g cm−3, while those measured in China (Group A) are slightly greater, with values between 1.3 to 1.9 g cm−3, possibly due to a greater abundance of secondary inorganic species. The directly measured ρeff in the “traffic” environment (Group C) presents a decreasing trend with the increase in particle size for 50 nm < Dem < 400 nm. This is largely due to primary emissions of soot particles from vehicle exhaust, which typically adopt a loose, chain-like agglomerated morphology with a fractal dimension (mass–mobility exponent) less than 3 (Barone et al., 2011; Pagels et al., 2009; Rawat et al., 2016; Rissler et al., 2013, 2014). Numerous studies have revealed the decrease of ρeff with the increase in particle size for vehicle exhaust aerosol (Barone et al., 2011; Maricq et al., 2000; Olfert et al., 2007; Park et al., 2003; Rissler et al., 2013; Virtanen et al., 2006).
ρeff is dependent on the chemical composition and morphological features (χ and ρp) of an urban aerosol population. Typically, direct ρeff measurements are conducted between Dem = 30 and 400 nm. Particles in this size range often consist of organics, secondary inorganic material, and black carbon. As discussed in Sect. 3.5, studies have found SOA to have ρeff values between 1 and 1.65 g cm−3 and secondary inorganic material, such as H2SO4, (NH4)2SO4, and NH4NO3 to have ρeff values between 1.7 and 1.83 g cm−3 (Kostenidou et al., 2007; Lide, 2005; Malloy et al., 2009; Mikhailov et al., 2013; Nakao et al., 2013; Neusüß et al., 2002; Tang, 1996; Xiao et al., 2015; Zelenyuk et al., 2008). The ρeff of soot particles can fall below 1 g cm−3, with a decreasing trend with the increase in particle size. The relative fraction of various species in an urban air mass, such as organics, secondary inorganic materials, and loosely agglomerated soot particles, among others, will determine the size dependency of the ρeff for the externally and internally mixed aerosol population. For example, previous direct ρeff measurements conducted in Los Angeles, Copenhagen, and Beijing found ρeff to be inversely proportional to particle size when the fraction of soot particles from vehicle emissions was relatively abundant due to elevated traffic intensity (Geller et al., 2006; Rissler et al., 2014; Qiao et al., 2018). Conversely, a study in Shanghai observed an increase in ρeff with particle size (Table S2), which was attributed to an abundance of hygroscopic species, such as (NH4)2SO4 and NH4NO3 (Ye et al., 2011; Yin et al., 2015).
Urban aerosol ρeff is expected to be temporally variant at a given sampling location due to the transient nature of emission sources. For example, in the urban environment, diurnal patterns in traffic density can drive time-dependent shifts in ρeff as the relative fraction of soot particles changes throughout the day. A low fraction of soot particles was observed in Copenhagen during the nighttime due to the low traffic density (Rissler et al., 2014). Two minima in ρeff were found in Houston in the morning at 07:00 local time (GMT−5) and in the evening at 19:00 to 20:00 LT, likely due to increased emissions of soot particles during rush hours (Levy et al., 2013). In Beijing, one study found ρeff to decrease during the nighttime due to an increase in the abundance of soot particles (Hu et al., 2012). This temporal shift in the urban aerosol ρeff was found to be due to the emissions of heavy trucks, which are only allowed to enter the fifth ring road in Beijing during the night, as well as more intense coal burning for domestic heating in the night during the heating season.
Urban aerosol ρeff is also influenced by air pollution events and air mass origins. Direct ρeff measurements in Beijing observed higher ρeff values during clean air quality episodes compared to polluted air quality episodes (Hu et al., 2012). This finding was attributed to the greater relative fraction of mineral dust during the clean episodes and abundance of organics and secondary inorganic ions in the particle phase during the polluted episodes (Hu et al., 2012). The ρeff can shift during atmospheric NPF events, depending on the dominant condensable vapor during the particle growth period. Qiao et al. (2018) found ρeff to decrease during a NPF event in Beijing, indicating that the condensable vapors were dominated by organics, which corresponded to the increase in the fraction of organic material in submicron particle mass concentrations. In contrast, ρeff measurements in Shanghai observed an increase in ρeff during NPF events, suggesting that relatively heavier secondary inorganic materials were the primary driver for particle condensational growth (Xie et al., 2017; Yin et al., 2015). Wind direction can affect ρeff by changing the air mass origin. Direct ρeff measurements in a street canyon in central Copenhagen showed higher fractions of dense-mode particles when the air mass traveled over more polluted regions than when the air mass came from clean sea/ocean areas (Rissler et al., 2014).
While the studies summarized in Fig. 1 and Table S2 provide valuable insights into variations of ρeff with particle size, geographical location, and intra-city environments (urban vs. traffic), more measurements are clearly needed in many cities around the world to develop a more comprehensive understanding of the nature of urban aerosol morphology and the factors that drive changes in size-resolved ρeff. In particular, direct ρeff measurements are needed in the accumulation and coarse mode given the variability identified in this study and the contribution of both modes to urban aerosol mass PSDs (Sect. 6). Doing so will provide a basis to better translate measured number PSDs to mass PSDs and Da-based PSDs to Dem-based PSDs.
The constructed size-resolved urban aerosol ρeff functions represent the first attempt to compile previous measured data and extend those to unmeasured size ranges to obtain a continuous function that can be applied in PSD conversions when direct measurements of the size-resolved ρeff are unavailable. With the method and measured data detailed in this paper, one can adjust or reconstruct the ρeff functions according to their own use. It is acknowledged that the number of compiled data is limited, and uncertainties could be significant for size ranges where direct measurements are unavailable. To reduce uncertainties, more direct measurements are needed in the future. The effective density can be affected by different atmospheric processes and is often site-specific and temporally variant. Caution should be taken when applying the ρeff functions. In addition, we compiled the data in a step-wise manner, which resulted in sudden changes at the border of certain size ranges. Other interpolation methods can be used to smooth the ρeff functions.
4.1 Introduction to multi-modal lognormal fitting and transformations of urban aerosol PSDs
The urban aerosol PSDs were fit to the multi-modal lognormal distribution function and translated across number (cm−3), surface area (µm2 cm−3), volume (µm3 cm−3), and mass (µg m−3) domains following different strategies depending on the measurement technique and size range, as described in Sect. 4.1.1–4.1.4. Lognormal fitting parameters, including the geometric mean diameter, geometric standard deviation, and concentration for each mode, along with measurement information, for all 737 PSDs are compiled in the Supplement (Tables S3–S6 and individual PSD figures). For a few selected studies where the measured PSDs were already fit to the multi-modal lognormal distribution function, the listed fitting parameters were used directly. The fitting parameters provide a basis to characterize the shape and magnitude of the PSDs, as well as a mathematical parameterization to reproduce the measured PSDs for subsequent analysis by the atmospheric aerosol research community.
4.1.1 Urban aerosol number PSDs in the submicron regime
Urban aerosol number PSDs that only included modes in the submicron regime (nucleation, Aitken, and accumulation) were typically measured via electrical mobility-based techniques as number-based concentrations (e.g., SMPS). The extracted measured data for these PSDs were fit to the multi-modal lognormal distribution function (, cm−3, Eq. 7; logarithm base 10) by using a lognormal fitting code in MATLAB based on the nonlinear least-squares curve fitting function, lsqcurvefit.m:
The geometric mean diameter (), geometric standard deviation (σi), and particle number concentration or amplitude (Ni) for each mode (i) were determined. The number of modes was based upon what was needed to achieve the best fit to the measured data. Two or three modes can achieve the best fit. Fitting parameters and measurement information for urban aerosol number PSDs in the submicron regime are provided in Table S3, as well as in individual PSD figures presented in the Supplement, an example of which is shown in Fig. S1. The fitted number PSDs were converted to surface area PSDs (, µm2 cm−3) and volume PSDs (, µm3 cm−3) assuming spherical particles and converted to mass PSDs (, µg m−3) using the representative size-resolved ρeff functions for Groups A, B, or C (Sect. 3, Fig. 1). Size-integrated concentrations were also calculated.
4.1.2 Urban aerosol number PSDs that cover both the submicron and coarse regime
Urban aerosol number PSDs that cover both the submicron and coarse regime typically utilize a combination of different aerosol measurement techniques. Electrical mobility-based techniques (e.g., SMPS) are often used for the submicron regime and aerodynamic-based techniques (e.g., APS), or optical-based techniques [e.g., optical particle counter (OPC) or optical particle sizer (OPS)] are used for the coarse regime and a fraction of the accumulation mode. The amplitude of number PSDs can span 1–3 orders of magnitude over the submicron and coarse regimes. When both regimes are measured concurrently, the coarse mode is often present as the tail of the accumulation mode in the number PSDs. Thus, the lognormal fitting of the number PSDs often ignores the coarse-mode particles, which can result in an inaccurate estimation of the volume and mass concentrations of large particles when converting the fitted number PSDs to volume and mass PSDs. Therefore, the PSDs that cover both the submicron and coarse regime were separated into two segments, each of which was individually fitted to the multi-modal lognormal distribution function in order to reproduce the measured data more accurately.
Electrical mobility-based techniques typically cover size fractions that contribute significantly to number PSDs in the urban atmosphere (e.g., Dem ≤ 100 nm). Thus, the segment of the number PSDs measured by such techniques was directly fitted with the multi-modal lognormal distribution function by Eq. (7), and the fitted number PSDs were converted to surface area, volume, and mass PSDs as described in Sect. 4.1.1. Size fractions measured by aerodynamic- or optical-based techniques often cover a fraction of the accumulation mode and the coarse mode, both of which contribute significantly to volume and mass PSDs. Therefore, to best reproduce the volume and mass PSDs, a different approach was employed to fit the PSDs measured by these two techniques.
For aerodynamic-based measurements, Da needs to be converted to Dem so that a consistent particle size definition can be used. In some studies, the authors did this by converting the measured Da-based PSD to a Dem-based PSD using the value for ρeff that gave the best fit between the converted Dem-based PSD with the measured Dem-based PSD in an overlap region (often the accumulation mode) that was covered by both electrical mobility- and aerodynamic-based techniques (e.g., Pitz et al., 2008a). Most urban aerosol number PSDs measured with an APS were reported as Da-based PSDs (e.g., Morawska et al., 1998) or converted to Stokes' or geometric diameter-based PSDs by assuming values for χ and ρp (e.g., Babu et al., 2016; Bäumer et al., 2008; Wehner et al., 2004a; Wu et al., 2008; Yue et al., 2009, 2010). For the latter, such diameters were first converted back to Da, and then to Dem. Equation (8) shows the relationship between Da and Dve (DeCarlo et al., 2004; Hinds, 2012), where ρ0 is the standard density of 1 g cm−3:
For coarse-mode particles, it is assumed that is approximately unity. As mentioned in Sect. 3.1, ; combining this with Eq. (8), we arrive at Eq. (9):
From Eqs. (9) and (6), we can derive the relationship between Da and Dem (Eq. 10), which is used to convert Da to Dem:
As described in Sect. 3, a series of ρeff values were generated from different combinations of χ and ρp (Fig. 2 and light green region of Fig. 1) for a fraction of the coarse mode without direct ρeff measurements in Groups A, B, and C. When converting Da to Dem for these particles, each Da was converted to multiple Dem corresponding to a series of ρeff to account for the uncertainty in ρeff. Therefore, for each of the Da-based number PSDs in the size range where direct ρeff data are lacking, a series of Dem-based number PSDs were determined. Figure S2 shows the ratio of Da to Dem when translating between the two diameters for different values of χ and ρp (assuming ). In general, increases with decreasing χ and increasing ρp.
The converted Dem-based number PSDs were transformed to Dem-based volume PSDs. For the size fraction of the coarse mode where the ρeff was estimated by different combinations of χ and ρp, multiple Dem-based volume PSDs were obtained from the series of Dem-based number PSDs. An example is shown in Fig. S3. We took the mean Dem-based volume PSD of that series of Dem-based volume PSDs and then conducted the multi-modal lognormal fitting via Eq. (11):
where Vi is the volume concentration of mode i. Typically three modes are enough to achieve the best fit, but sometimes four modes are needed. The fitted Dem-based volume PSDs were then converted back to number and surface area Dem-based PSDs. This was done to prevent possible amplification in the difference between the measured and lognormally fitted PSDs when converting number PSDs to volume PSDs.
The converted Dem-based number PSDs were also transformed into Dem-based mass PSDs by applying the effective density functions , , or , according to the measurement location and site type (Sect. 3, Fig. 1). For the size fraction of the coarse mode where the ρeff was estimated by different combinations of χ and ρp, multiple Dem-based mass PSDs were obtained from a series of Dem-based number PSDs. Similar to the volume PSDs, we took the mean Dem-based mass PSD of that series of Dem-based mass PSDs and then conducted the multi-modal lognormal fitting via Eq. (12):
where Mi is the mass concentration of mode i. Typically three modes are enough to achieve the best fit, but sometimes four modes are needed. Now the number, surface area, volume, and mass PSDs in the size range that covered both the electrical mobility- and aerodynamic-based techniques can be reproduced. The goal of this stage is to apply the most appropriate size-resolved ρeff to a given number PSD measurement, thereby accurately estimating its volume and mass PSD and taking into consideration the uncertainties of the unknown size-resolved ρeff values for the coarse mode. Fitting parameters and measurement information for urban aerosol PSD measurements made with both electrical mobility- and aerodynamic-based techniques covering the submicron and coarse regimes are provided in Table S4.
For optical-based measurements, we assume the optical diameter is equivalent to Dem due to the lack of information needed to convert one to the other. The number PSDs measured by optical-based techniques were transformed to mass PSDs assuming a uniform apparent density of 1.65 g cm−3 (Pitz et al., 2008b). The mass PSDs were then fitted with the multi-modal lognormal distribution function using Eq. (12). The fitted mass PSDs were converted back to number, surface area, and volume PSDs. Fitting parameters and measurement information for urban aerosol PSD measurements made with both electrical mobility- and optical-based techniques covering the submicron and coarse regimes are provided in Table S5.
4.1.3 Urban aerosol mass PSDs measured by gravimetric methods employing inertial impactors
For urban aerosol mass PSDs measured by gravimetric methods with inertial impactors, the Da-based mass PSDs were converted to Dem-based mass PSDs to enable comparison with the other electrical mobility-based measurements. According to the measurement location and site type, Da was converted to Dem using the ρeff functions for Groups A, B, or C, via Eq. (10). For the fraction of the coarse mode where a series of χ and ρp were used to estimate ρeff, each Da-based mass PSD was converted to multiple Dem-based mass PSDs, with each PSD corresponding to a particular value of ρeff. Then, the mean Dem-based PSD was taken from the series of Dem-based mass PSDs and merged with the rest of the Dem-based mass PSD determined via the effective density functions , , or . The multi-modal lognormal fitting was conducted for the Dem-based mass PSDs by using Eq. (12). An example is shown in Fig. S4.
The Da-based mass PSDs were also converted to Dem-based volume PSDs by using the ρeff functions for Groups A, B, or C. Similar to the conversion for mass PSDs, for the fraction of the coarse mode where a series of χ and ρp were used to estimate ρeff, each Da-based mass PSD was converted to multiple Dem-based volume PSDs. The mean Dem-based volume PSD was taken from this series of Dem-based volume PSDs and merged with the rest of the Dem-based volume PSD. The multi-modal lognormal fitting was conducted for the Dem-based volume PSDs by using Eq. (11). The fitted Dem-based volume PSDs were converted to Dem-based number and surface area PSDs. For the volume and mass PSDs measured by inertial impactors, typically three modes can achieve the best fit, but sometimes they need four modes. Fitting parameters and measurement information for urban aerosol PSD measurements made with gravimetric methods employing inertial impactors are provided in Table S6.
4.1.4 Considerations for grouping urban aerosol PSD observations by geographical region
The collection of urban aerosol PSD observations from around the globe offers a basis to identify geographical trends in number and mass PSDs. A few considerations were made in grouping the PSDs by geographical region. For urban aerosol number PSDs, the prominent mode is most often present in the UFP regime, which is captured very well by electrical mobility-based techniques (e.g., SMPS). However, PSD measurements made with aerodynamic-based techniques (e.g., APS, inertial impactors) or optical-based techniques (e.g., OPC, OPS) typically cannot accurately characterize number PSDs down to the UFP regime. Thus, when grouping urban aerosol number PSDs by geographical region, only measurements made via electrical mobility-based techniques involving the UFP regime were used. For urban aerosol mass PSDs, the maximum value of the PSD typically exists in either the accumulation mode or the coarse mode. Therefore, urban aerosol PSD measurements made via electrical mobility-based techniques that only cover the submicron regime were not used in the analysis of geographical trends in mass PSDs. Only PSD measurements made with inertial impactors and those combining both electrical mobility- and aerodynamic-/optical-based techniques to cover both the submicron and coarse regime were incorporated into the global mass PSD analysis.
To validate the PSDs compiled in this study, we selected several cities to compare the PM2.5 derived from the compiled PSDs (Fig. 3, blue circular markers) with those measured by local monitoring stations over the same sampling periods (green diamond markers and error bars). The green diamond markers in Fig. 3 represent the mean values of the PM2.5 from local sampling stations measured over the sampling period of the corresponding PSD, and the error bars represent the standard deviations. The blue circular markers represent the derived PM2.5 from mass PSDs. The PSDs from four studies (Cabada et al., 2004; Ding et al., 2017; Harrison et al., 2012; Watson et al., 2002) were selected since long-term PM2.5 data from a monitoring station near the PSD sampling site are available. Although the PM2.5 monitoring stations and the sites of the PSDs measurements are not next to each other, the PM2.5 derived from the PSDs exhibits a good agreement with that measured at local sampling stations, indicating the validity of the collected PSDs. Some discrepancies potentially exist due to the difference in sampling locations between the PSD and local PM2.5 measurements.
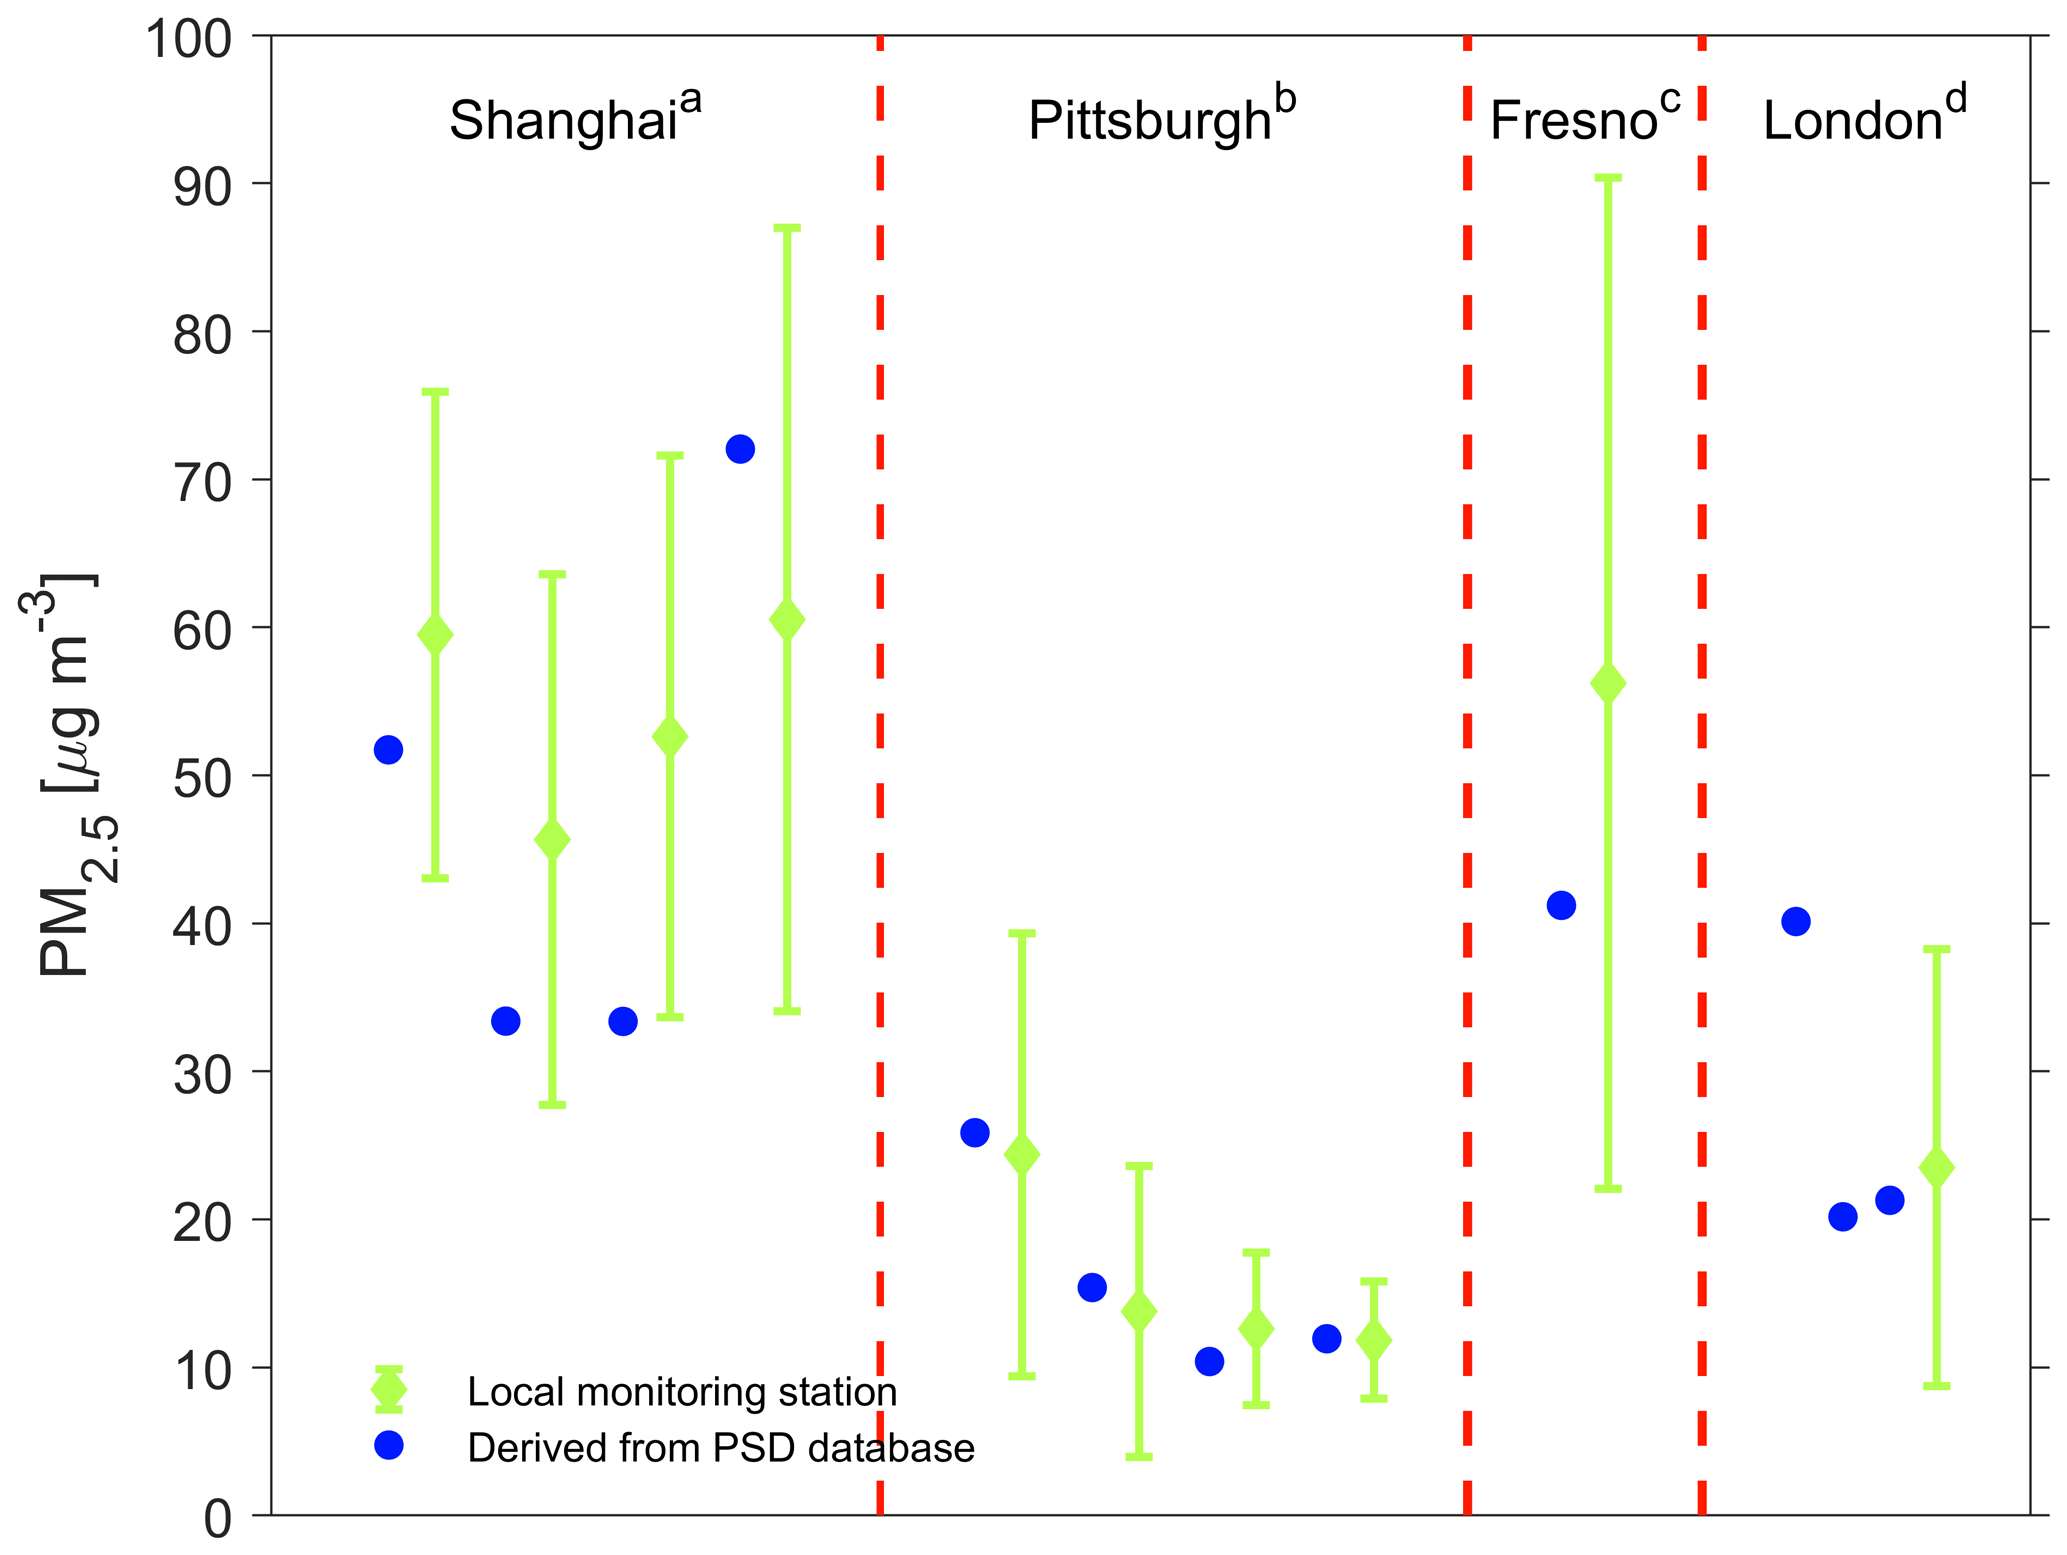
Figure 3Comparison of size-integrated PM2.5 mass concentrations derived from the PSDs collected in this study (blue circular markers) with those measured by local monitoring stations in the same city over the same sampling periods (green diamond markers and error bars). The green diamond markers represent the mean values of the PM2.5 mass concentrations from local sampling stations over the sampling period of the corresponding PSD, and the error bars represent the standard deviations of the mean PM2.5 mass concentrations. a PSDs from Ding et al. (2017) and PM2.5 from Shanghai Environment Monitoring Center at Hongkou Liangcheng station, including four different sampling periods. b PSDs from Cabada et al. (2004) and PM2.5 from U.S. EPA monitoring station (42-003-0021), including four different sampling periods. c PSD from Watson et al. (2002) and PM2.5 from U.S. EPA monitoring station (06-019-0008). d PSDs from Harrison et al. (2012) and PM2.5 from UK Automatic Urban and Rural Monitoring Network at London Marylebone Road. Three PSDs were measured at three different sampling sites over the same period.
Urban aerosol PSD observations made between 1998 and 2017 were collected and analyzed to evaluate geographical variations in the shape and magnitude of number and mass PSDs and to identify gaps in PSD measurements. The PSD observations are summarized and categorized in the Supplement and are grouped by geographical region: AF, CSSA, EA, EU, LA, NAAN, and WA. Among all PSDs, 14.3 % were long-term measurements (> 6 months), and 33.3 % were moderate-term measurements (1–6 months). The remaining PSDs represent observations made over periods less than 1 month through short-term field measurement campaigns. Figure 4 illustrates the temporal and geographical distribution by year between 1998 and 2017 of the urban aerosol PSD references analyzed in this study. Between 1998 and 2007, there is a clear increase in the number of published studies reporting urban aerosol PSD observations. During this period, the majority of PSD measurements were conducted in cities in EU and NAAN. However, beginning in 2006 and continuing through 2017, a greater fraction of published PSD observations were collected in cities in EA and CSSA. Studies reporting PSD observations in NAAN cities appear to have declined between 2009 and 2017. Urban aerosol PSD observations in LA, WA, and AF remain sparse across the examined time period; however, the frequency of publications reporting PSD measurements in LA has been fairly stable between 2009 and 2017.
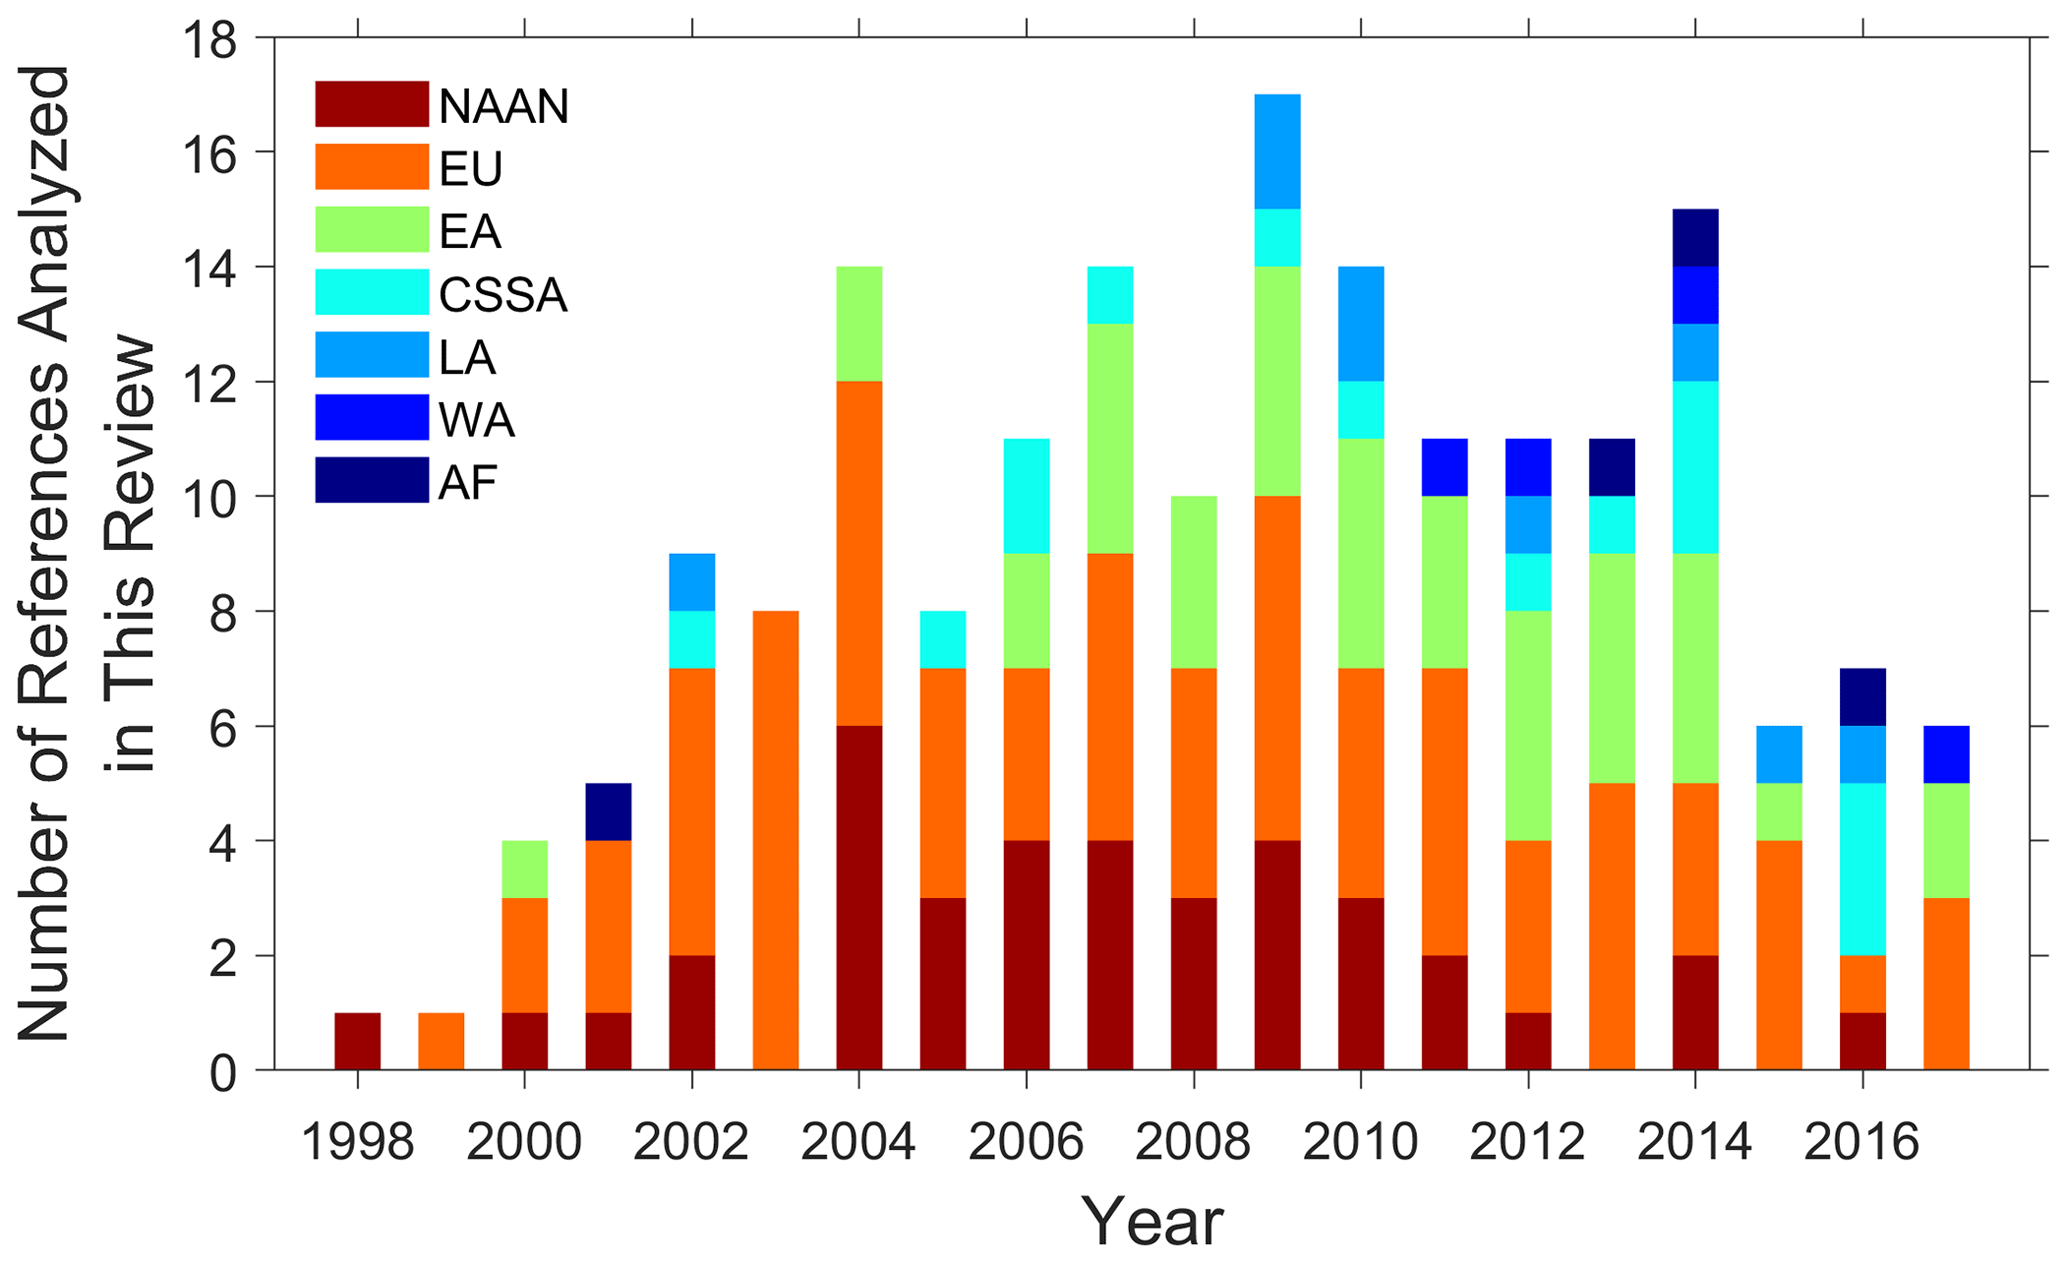
Figure 4Temporal and geographical distribution by year of the urban PSD references analyzed in this study (1998–2017). The geographical regions include North America, Australia, and New Zealand (NAAN), Europe (EU), East Asia (EA), Central, South, and Southeast Asia (CSSA), Latin America (LA), West Asia (WA), and Africa (AF).
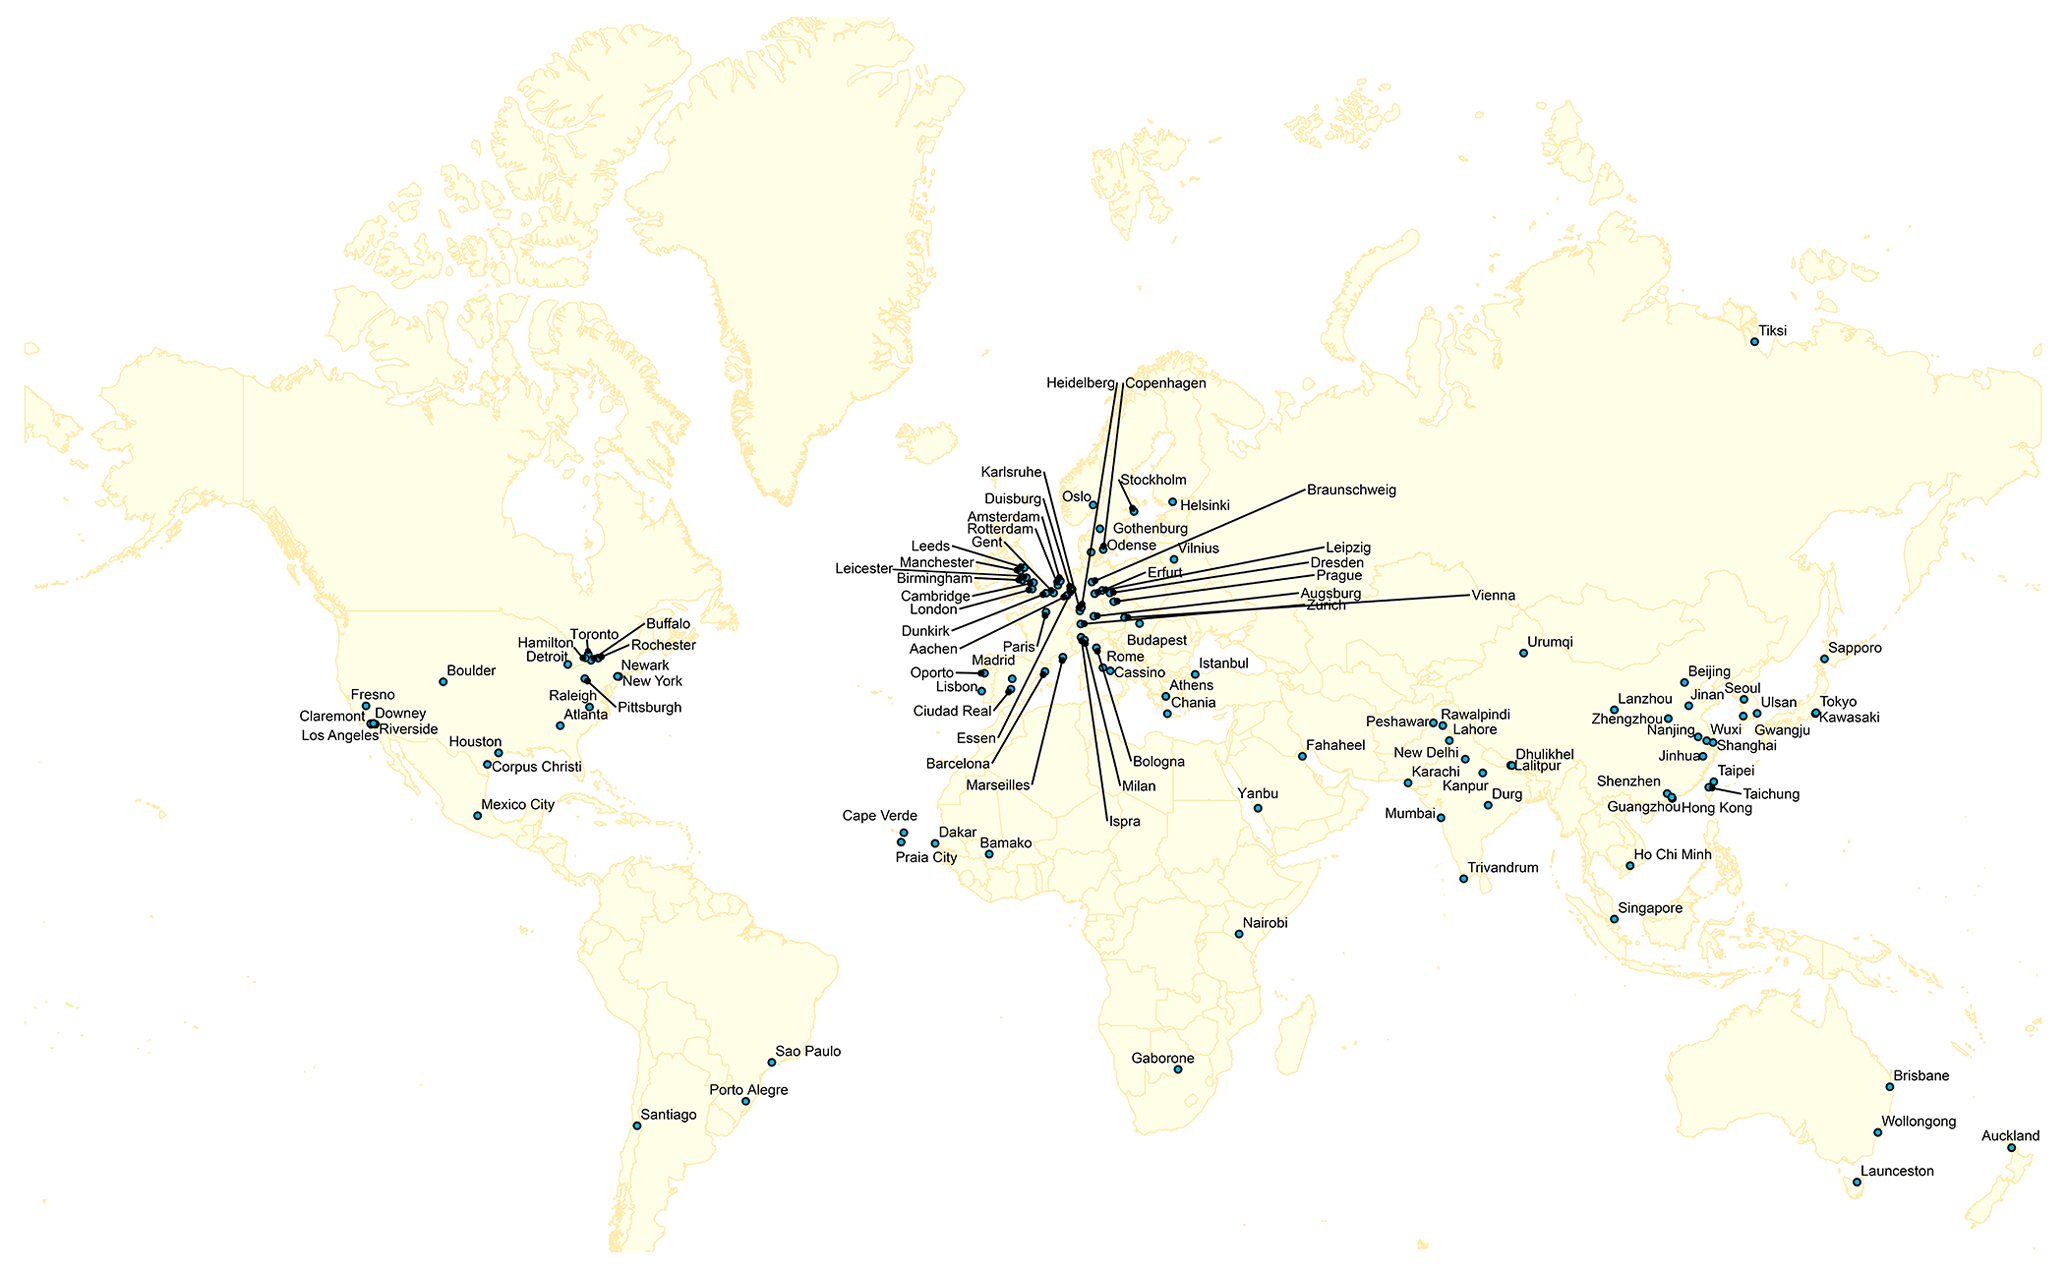
Figure 5Global distribution of urban aerosol PSD measurement locations included in this study.
Figure 5 presents the global distribution of urban aerosol PSD measurement locations included in this study. It is apparent that there are regions where numerous observations have been made (e.g., EU) and others where measurements are scarce (e.g., WA, LA, AF). Among 737 urban aerosol PSD observations collected in this study, 42.6 % of them are from EU, 18.2 % are from North America, and 18.2 % are from EA. Conversely, only 4.7 % are from WA, 6.4 % from LA, and 1 % from AF. The three countries that contribute the most to the collection of urban aerosol PSD observations in this study are the United States (13.7 %), China (12.2 %), and Germany (9.2 %).
A paucity of urban aerosol PSD measurements is clear throughout the entirety of AF, LA, and WA; CSSA excluding India; Canada, although a few measurements have been conducted in the Greater Toronto and Hamilton Area; Russia; Australia; and New Zealand. The few published PSD measurements in AF, CSSA excluding India, and WA were reported. Urban aerosol PSD observations have only been made in five countries in AF. Similarly, in LA, PSD measurements have been made in a few countries, the majority of which have been reported in Brazil (38 PSDs, with 35 from São Paulo), Chile, and Mexico. A total of 35 urban aerosol PSD measurements have been reported in WA, many of which were made in Istanbul, Turkey, Fahaheel, Kuwait, and Yanbu, Saudi Arabia. A total of 69.7 % of the PSD observations in CSSA have been reported in India, with comparatively fewer measurements coming from other countries in the region, including Pakistan, Singapore, Nepal, and Vietnam.
The vast majority of urban aerosol PSD measurements analyzed in this study were made via electrical mobility-based techniques. Comparatively fewer direct measurements of mass PSDs were made via gravimetric methods employing inertial impactors. In total, 82.7 % of the urban aerosol PSDs reported number PSDs down to the UFP fraction of the submicron regime. However, only six of the urban aerosol number PSDs involving the UFP regime are from Southeast Asia; only 13 are from WA, and none are from AF. The lack of urban aerosol PSD measurements down to the UFP regime in many regions of the world makes it very challenging to accurately estimate urban aerosol inhalation exposures. This is of concern given the inhalation toxicity and adverse health effects associated with UFPs (Delfino et al., 2005; Li et al., 2016, 2017; Oberdörster et al., 2004, 2005; Pietropaoli et al., 2004; Rychlik et al., 2019; Sioutas et al., 2005).
6.1 Geographical variations in the magnitude and shape of submicron urban aerosol number PSDs
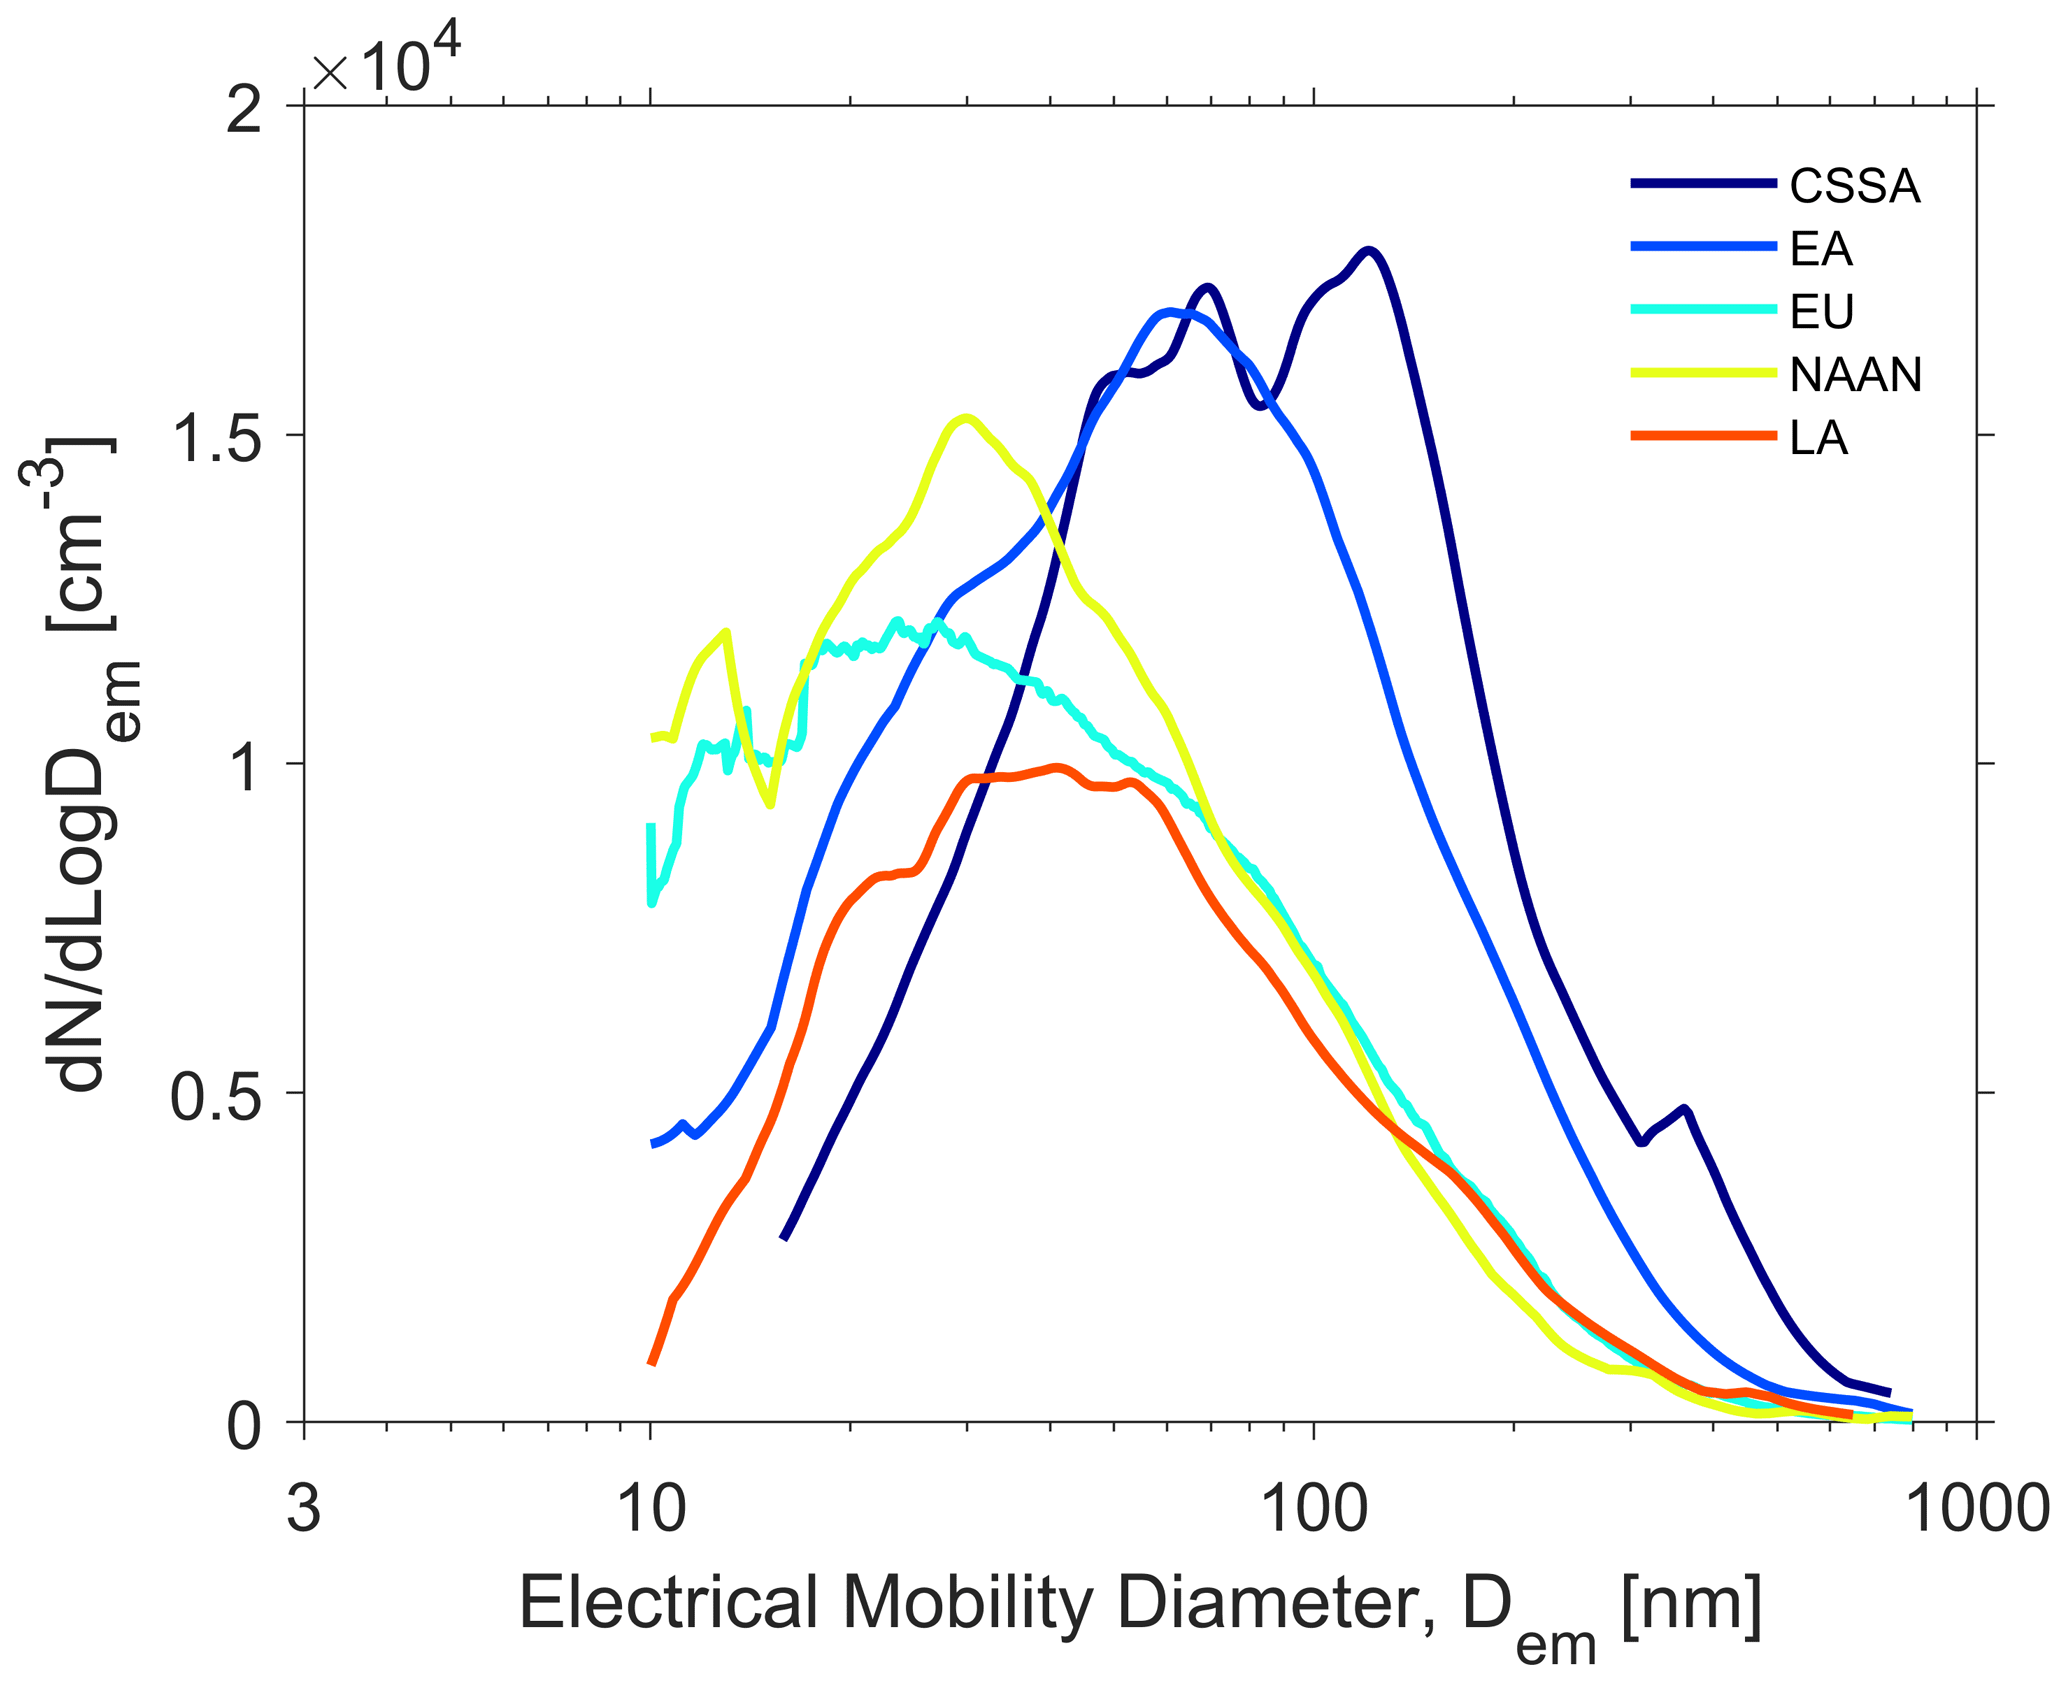
Geographical variations in submicron urban aerosol number PSD measurements (, cm−3) are presented in Fig. 6. Each log–log plot incorporates number PSDs measured with electrical mobility-based techniques that cover the submicron regime (624 PSDs, Table S3). Each line represents an individual PSD observation compiled in the Supplement, and the color indicates the occurrence frequency of the number PSDs at a given particle size (Dem) with a certain particle number concentration. Red, orange, and yellow curves indicate the number PSDs where the occurrence frequency is high among the analyzed studies. All number PSD observations are included in the “Global” plot (top left). Number PSDs for EA, CSSA, EU, LA, and NAAN are presented in the remaining plots; however, AF and WA are not included due to the lack of PSD measurements in the submicron regime in the two regions. The solid black lines indicate the median number PSDs for each group, which are also presented in Fig. 7 on a linear y-axis scale. It can be seen that among the geographical regions, the greatest number of submicron number PSDs has been reported for cities in EU, NAAN, and EA; comparatively fewer have been reported in CSSA and LA.
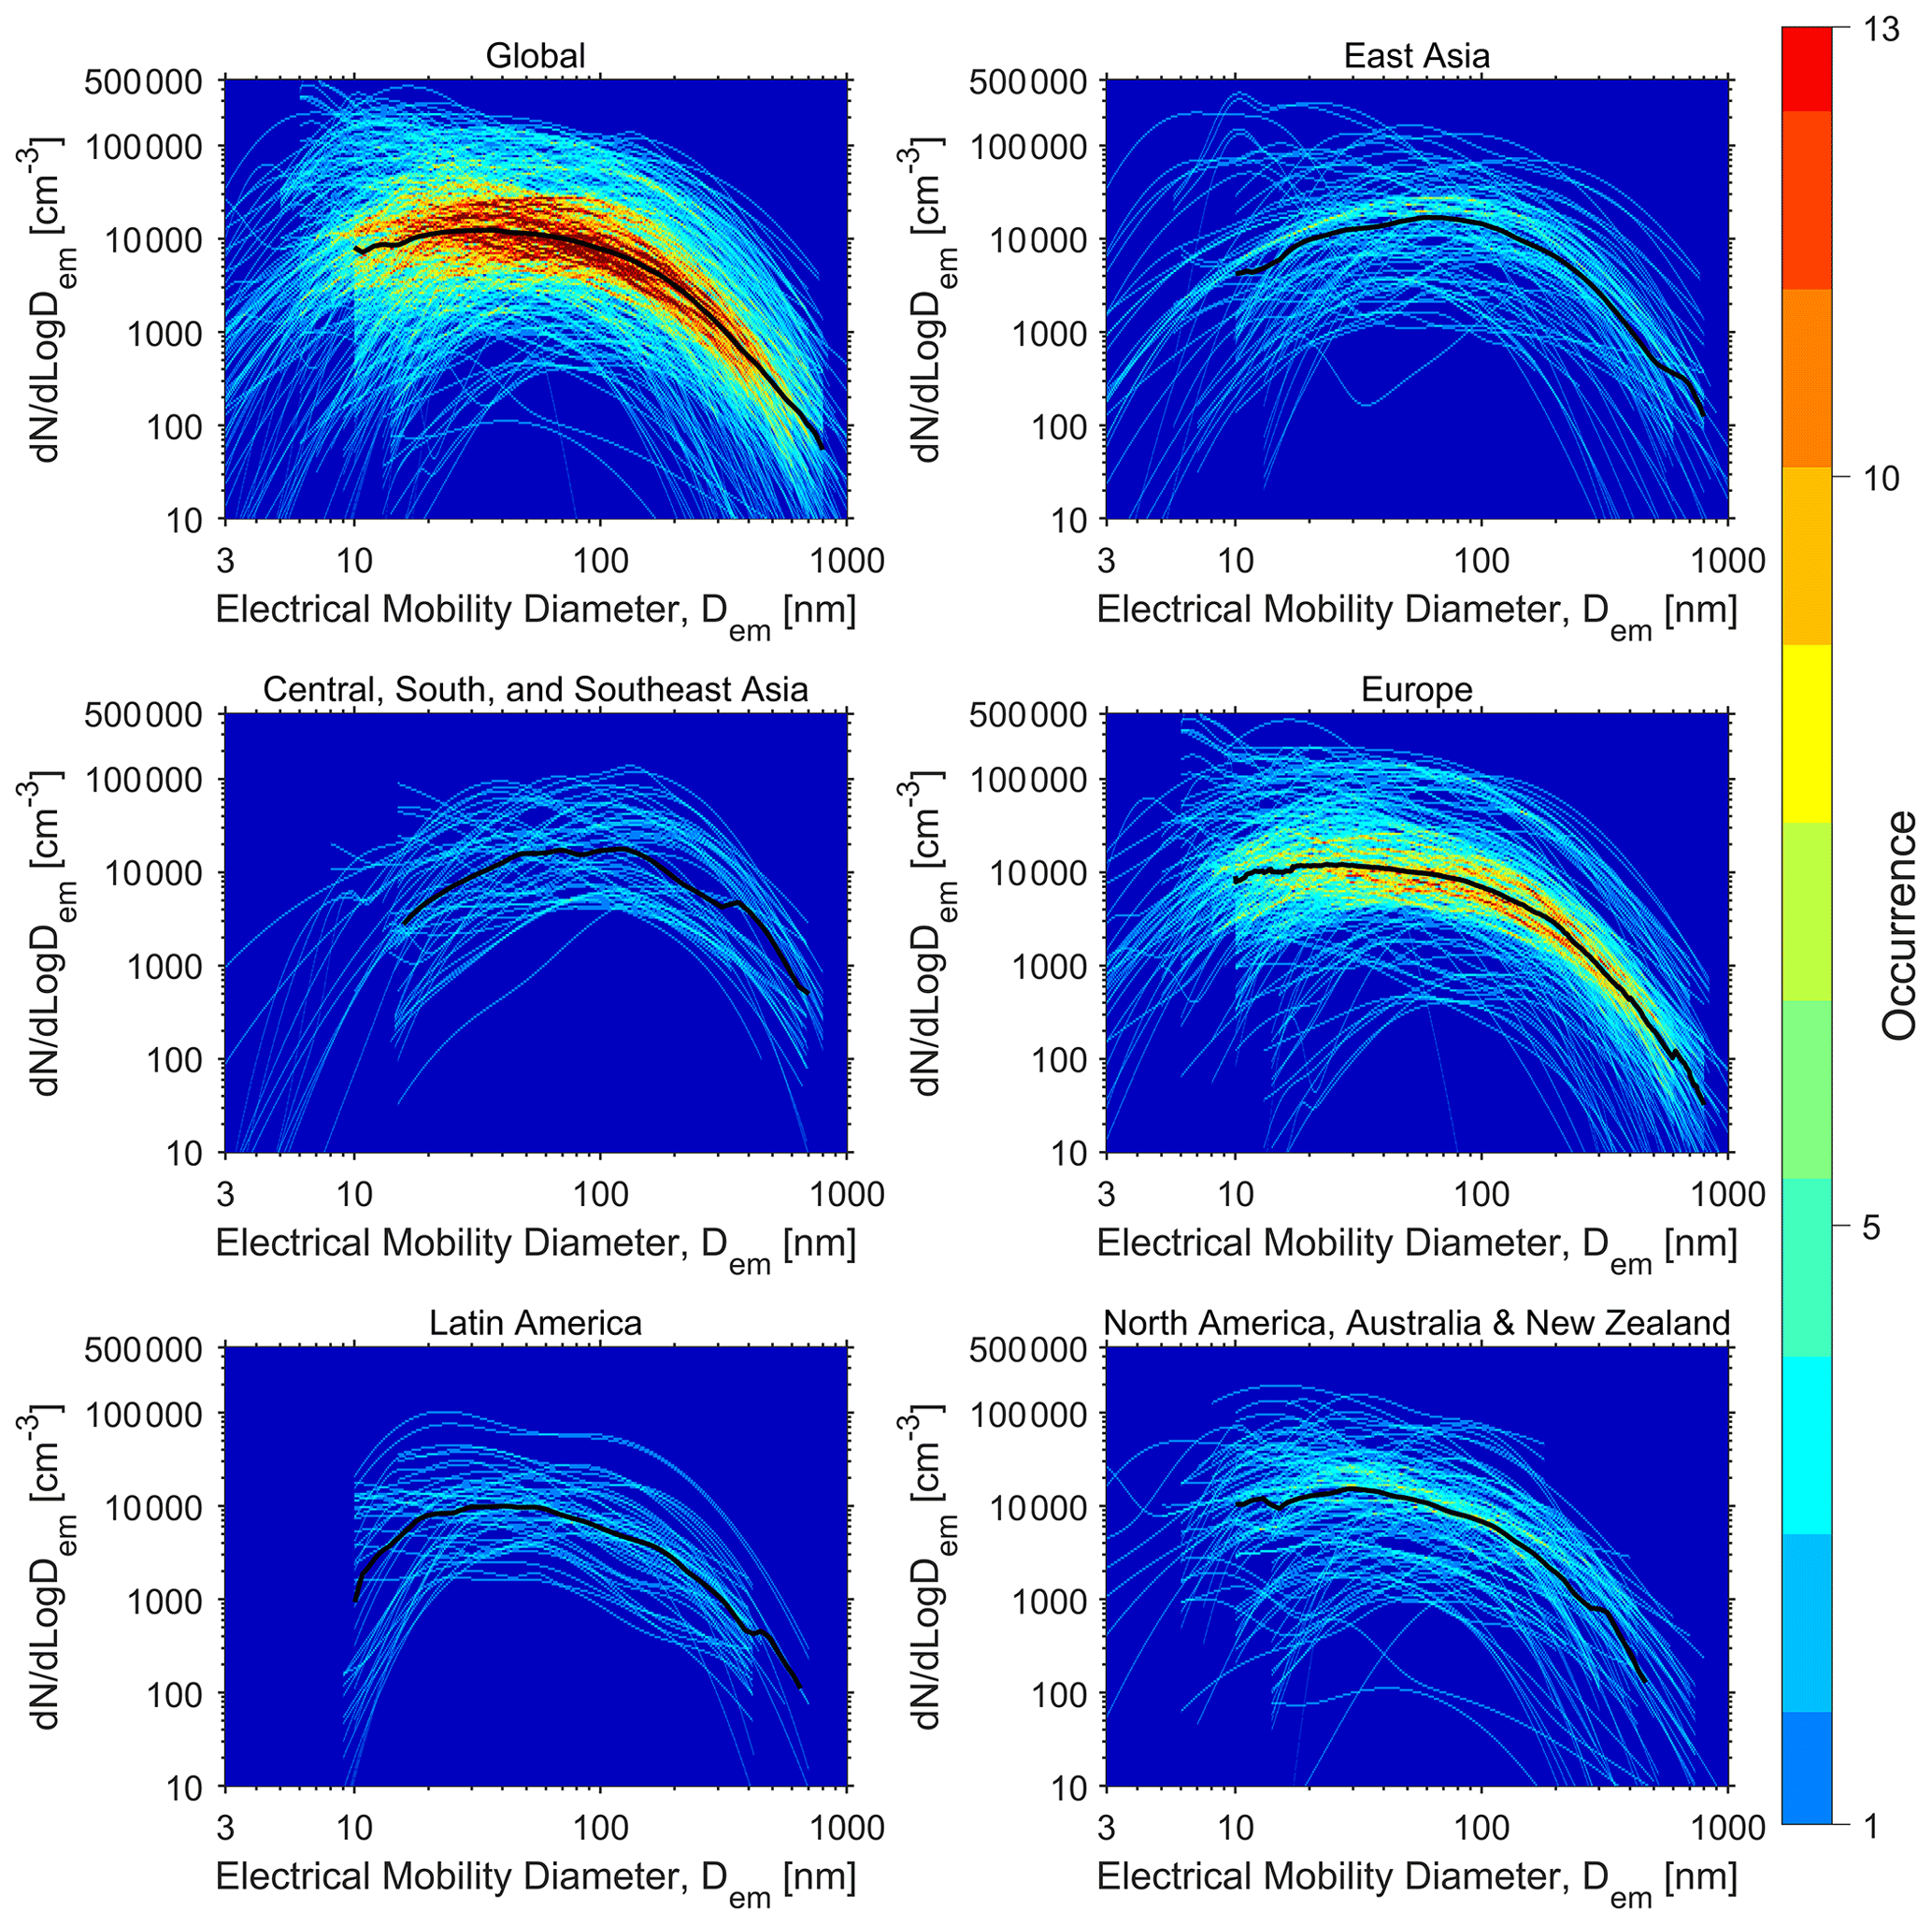
Figure 6Urban aerosol number PSDs analyzed in this study, grouped by geographical region. The figure incorporates all submicron number PSDs measured by electrical mobility-based techniques (624 PSDs). The color represents the occurrence frequency of the number PSDs at a given particle size with a certain concentration. The black lines indicate the median number PSDs in each group.
The visualization of the global distribution in submicron urban aerosol number PSDs (Fig. 6, top left) demonstrates that there are significant variations in both the magnitude and shape of number PSDs measured across urban environments around the world. For a given particle size (Dem), there can be over 2 orders of magnitude variation in the particle number concentration. This variation in the amplitude of the number PSDs is persistent across the considered size range, from Dem = 3 to 1000 nm, which includes the nucleation, Aitken, and accumulation modes. The red–yellow region of the global plot surrounds the median number PSD (black line). Wide variability in the magnitude of the number PSDs above and below the median PSD is apparent. Thus, defining a globally representative urban aerosol number PSD is challenging given the vast array of factors that can influence the shape of a PSD at a particular sampling location within in a city. However, the red region suggests that on a global basis, some tendencies do exist in regard to the shape and magnitude of urban aerosol number PSDs. Notably, number PSDs are often dominated by particles between Dem = 10 to 100 nm, with varying contributions from the sub-10 nm fraction and accumulation mode, depending on the conditions that exist at the measurement site. Across this size fraction, there is a high occurrence frequency of number PSDs with an amplitude between 5000 and 30 000 cm−3. In some cases, the amplitude can reach or exceed 50 000 to 100 000 cm−3, most commonly in the nucleation and Aitken mode. The global median number PSD demonstrates that number PSDs often drop off in magnitude by nearly a factor of 100 across the width of the accumulation mode, from approximately 7000 cm−3 at Dem = 100 nm to 50 cm−3 as Dem approaches 1000 nm.
The geographically resolved collections of urban aerosol number PSDs presented in Figs. 6 and 7 indicate that there is inter-region variability in the shape and magnitude of number PSDs. Number PSDs in NAAN and EU present similar structural characteristics; similarly, number PSDs in EA and CSSA are alike in both shape and magnitude. Number PSDs measured in cities in NAAN and EU tend to skew to the left and are often dominated by nucleation- and Aitken-mode particles, whereas number PSDs measured in cities in EA and CSSA tend to skew to the right and are often dominated by Aitken- and accumulation-mode particles. The magnitude of the number PSDs in the accumulation mode in EA and CSSA tends to be higher than that in NAAN and EU. This is apparent in the collection of individual PSDs in each of the geographical regions in Fig. 6, as well as in the median number PSDs presented in Fig. 7. Conversely, the magnitude of the number PSDs in the sub-50 nm fraction of the UFP regime in EA and CSSA tends to be lower than of those measured in NAAN and EU. This is especially true for the nucleation mode, which is often much more pronounced in the urban atmospheres of NAAN and EU cities. The median number PSD for LA more closely resembles number PSDs measured in NAAN and EU as compared to those in EA and CSSA. However, the lack of PSD observations in LA makes it difficult to draw conclusions about the shape of PSDs in this region. The Dem values associated with the prominent mode for each of the median number PSDs presented in Fig. 7 are Dem ∼ 20 nm for EU, Dem ∼ 30 nm for NAAN, Dem ∼ 35 nm for LA, and Dem ∼ 60 to 100 nm for EA and CSSA.
The variation in the magnitude of the number PSDs for EA, CSSA, EU, LA, and NAAN is generally consistent with that observed in the global distribution of PSDs presented in Fig. 6. The abundance of number PSD observations in EU provides a basis to more reliably identify a representative PSD for the region. The red–yellow–light green band for EU demonstrates that a large fraction of PSD measurements in EU cities tend to cluster around the median number PSD. Between Dem = 10 to 100 nm, the amplitude of this PSD band varies between 5000 and 20 000 cm−3. Less frequently, number PSDs with magnitudes exceeding 30 000 cm−3, or as low as 1000 cm−3, have been reported in EU cities. A faint band of moderate occurrence frequency can be observed in both EA and NAAN; however, the comparatively few PSD observations in CSSA and LA make it difficult to identify such trends in these two regions.
To better visualize differences in the shape of the urban aerosol number PSDs and to probe the relative fraction of particles in different modes, each number PSD was normalized by its maximum concentration such that variations in the magnitude of the number PSDs can be neglected (Fig. S5). The normalized urban aerosol number PSDs presented in Fig. S5 are grouped by country and geographical region (from top to bottom): WA, NAAN, LA, EU, EA, and CSSA. Many of the normalized number PSDs in EA and CSSA tend to show a mode (red–orange color) at around Dem=100 nm, and few show maxima at or near the nucleation mode. Some of the normalized number PSDs measured in China and India present prominent modes in the accumulation mode, between Dem=100 and 200 nm. However, it can be seen that particles greater than Dem=300 nm contribute negligibly to normalized number PSDs in EA and CSSA. Normalized number PSDs in NAAN and EU generally exhibit maxima at smaller particle sizes (Dem=10 to 50 nm), while a few observations made in Germany, Italy, and the United States present modes near Dem= 100 nm. The normalized number PSDs measured in LA, predominately in São Paulo, Brazil, closely resemble observations reported in NAAN and EU. The prominent nucleation mode in the WA normalized number PSDs is in part due to the few PSD observations collected from the region, which were made at a “traffic” site in Fahaheel, Kuwait.
There are clear distinctions between urban aerosol number PSDs measured in NAAN/EU and EA/CSSA. Figure 8 presents the relationship between total particle number concentration, integrated over the measured size range of a PSD measurement, and the count median diameter (CMD) for each of the submicron number PSDs presented in Fig. 6. Number PSDs in EA and CSSA tend to cluster to the right, from CMD = 50 to 100 nm, whereas number PSDs in NAAN and EU tend to cluster toward the left, from CMD = 20 to 60 nm. There are, however, outliers in each region, such as number PSDs in EA with prominent nucleation modes and CMDs of approximately 10 nm and number PSDs in NAAN with prominent accumulation modes and CMDs approaching 100 nm. There are only a few number PSDs in CSSA that exhibit CMDs below 50 nm. In all geographical regions, there are nearly 2 orders of magnitude variation in total particle number concentrations, which are often bounded by 1000 cm−3 at the lower end and 100 000 cm−3 at the upper end. Number PSDs in EU, NAAN, and EA that have CMDs < 20 nm are associated with total particle number concentrations exceeding 10 000 cm−3. Interestingly, numerous number PSDs in EA and CSSA with CMDs of approximately 100 nm have concentrations > 10 000 cm−3. The wide variation in the total particle number concentrations presented in Fig. 8 is consistent with the trends reported in a review of geographical variations in total particle number concentrations across 40 urban roadside measurement sites around the world (Kumar et al., 2014).

Figure 8Relationship between the total particle number concentration, integrated over the measured size range, and the count median diameter (CMD), determined for each submicron number PSD measured by electrical mobility-based techniques (624 PSDs) and grouped by geographical region.
It should be noted that many factors can influence the magnitude and shape of urban aerosol number PSDs, beyond geographical region, which is the focus of the global-scale analysis presented in Figs. 6–8. Country-wide PSD measurement campaigns have identified significant variations in number PSDs among different cities within the same country (Peng et al., 2014; Tuch et al., 2003) and at different measurement sites within the same city (Birmili et al., 2013; Costabile et al., 2009; Hussein et al., 2005; Ketzel et al., 2004; Tuch et al., 2006; Wehner et al., 2002). Regarding the latter, several studies conducted in EU cities have shown that total particle number concentrations can vary as high as a factor of roughly 9 within the same city (Birmili et al., 2013; Buonanno et al., 2011; Mejía et al., 2008; Mishra et al., 2012). Localized spatial variations in urban aerosol PSDs and number concentrations are due in part to the nature of local emission sources near the measurement site and meteorological conditions, including wind speed and direction, temperature, and relative humidity (Baxla et al., 2009; Birmili et al., 2001; Charron and Harrison, 2003; Kaul et al., 2011; Nieto et al., 1994; Rose et al., 2010; Stanier et al., 2004; Swietlicki et al., 2008; Väkevä et al., 2000; Wehner and Wiedensohler, 2003; Weingartner et al., 1997; Yu et al., 2018). Physiochemical processes that can transform an aerosol population over space and time are also very important, such as particle growth due to coagulation and condensation, particle shrinkage due to evaporation, reactive uptake, and wet and dry deposition (Gaston et al., 2014; Limbeck et al., 2003; Lin et al., 2011; Moise and Rudich, 2002; Salma et al., 2011; Shi and Harrison, 1999; Tang et al., 2010; Zhu et al., 2002a, b).
6.2 Geographical variations in the magnitude and shape of urban aerosol mass PSDs
Global variations in urban aerosol mass PSD measurements (, µg m−3) are presented in Fig. 9. The log–log plot incorporates mass PSDs measured by gravimetric methods with inertial impactors and measurements made with electrical mobility- and aerodynamic-/optical-based techniques that cover both the submicron and coarse mode (122 PSDs, Tables S4–S6). As discussed in Sect. 3, the size-resolved ρeff functions for Groups A, B, and C (Fig. 1) were used in converting Da-based PSDs to Dem-based PSDs and translating measured number PSDs to mass PSDs. Similar to Fig. 6, each line represents an individual PSD observation compiled in the Supplement, and the color indicates the occurrence frequency of the mass PSDs at a given particle size (Dem) with a certain particle mass concentration. The solid black line indicates the median mass PSD among the global compilation of observations. In comparing Figs. 6 and 9, it is evident that submicron urban aerosol number PSDs are more commonly reported in the literature compared to mass PSDs or number PSDs spanning the submicron and coarse regimes.

Figure 9Urban aerosol mass PSDs analyzed in this study from around the globe (122 PSDs). The figure incorporates mass PSDs measured by gravimetric methods with inertial impactors and measurements made with electrical mobility-based and aerodynamic-/optical-based techniques that cover both the submicron and coarse mode. The color represents the occurrence frequency of the mass PSDs at a given particle size with a certain concentration. The black line indicates the median mass PSD.
The visualization of the global distribution in urban aerosol mass PSDs in Fig. 9 demonstrates that there are significant variations in both the magnitude and shape of mass PSDs measured across urban environments around the world. While the limited number of mass PSD observations makes it difficult to discern clear trends in the structure of mass PSDs, some trends are evident. Notably, urban aerosol mass PSDs are dominated by particles with Dem > 100 nm and are typically bimodal, exhibiting maxima in both the accumulation and coarse mode, as indicated by the median mass PSD. The relative contribution of the two modes is variable among the PSD observations. In some cases, urban aerosol mass PSDs are dominated by accumulation-mode particles, while other PSDs present a prominent coarse mode. Within the accumulation mode, the amplitude of the mass PSDs spans 2 orders of magnitude, from 1 to 100 µg m−3. The Dem associated with the prominent mode in the accumulation mode is variable. The spread in the magnitude of the mass PSD in the coarse mode is consistent with that observed in the accumulation mode. Some mass PSDs exhibit amplitudes that exceed 100 µg m−3; however, their occurrence frequency is very low. The magnitude of mass PSDs in the UFP regime is relatively insignificant and ranges from 0.01 to 10 µg m−3. Unlike for the number PSDs in Fig. 6, a band of high occurrence frequency is not evident in Fig. 9. Some degree of clustering of mass PSDs around the median PSD is evident; however, there is clearly more variation in the structure of mass PSDs as compared to number PSDs. This may be due to the variety of measurement techniques employed and uncertainties in translating number PSDs to mass PSDs using the size-resolved ρeff functions for Groups A, B, and C.
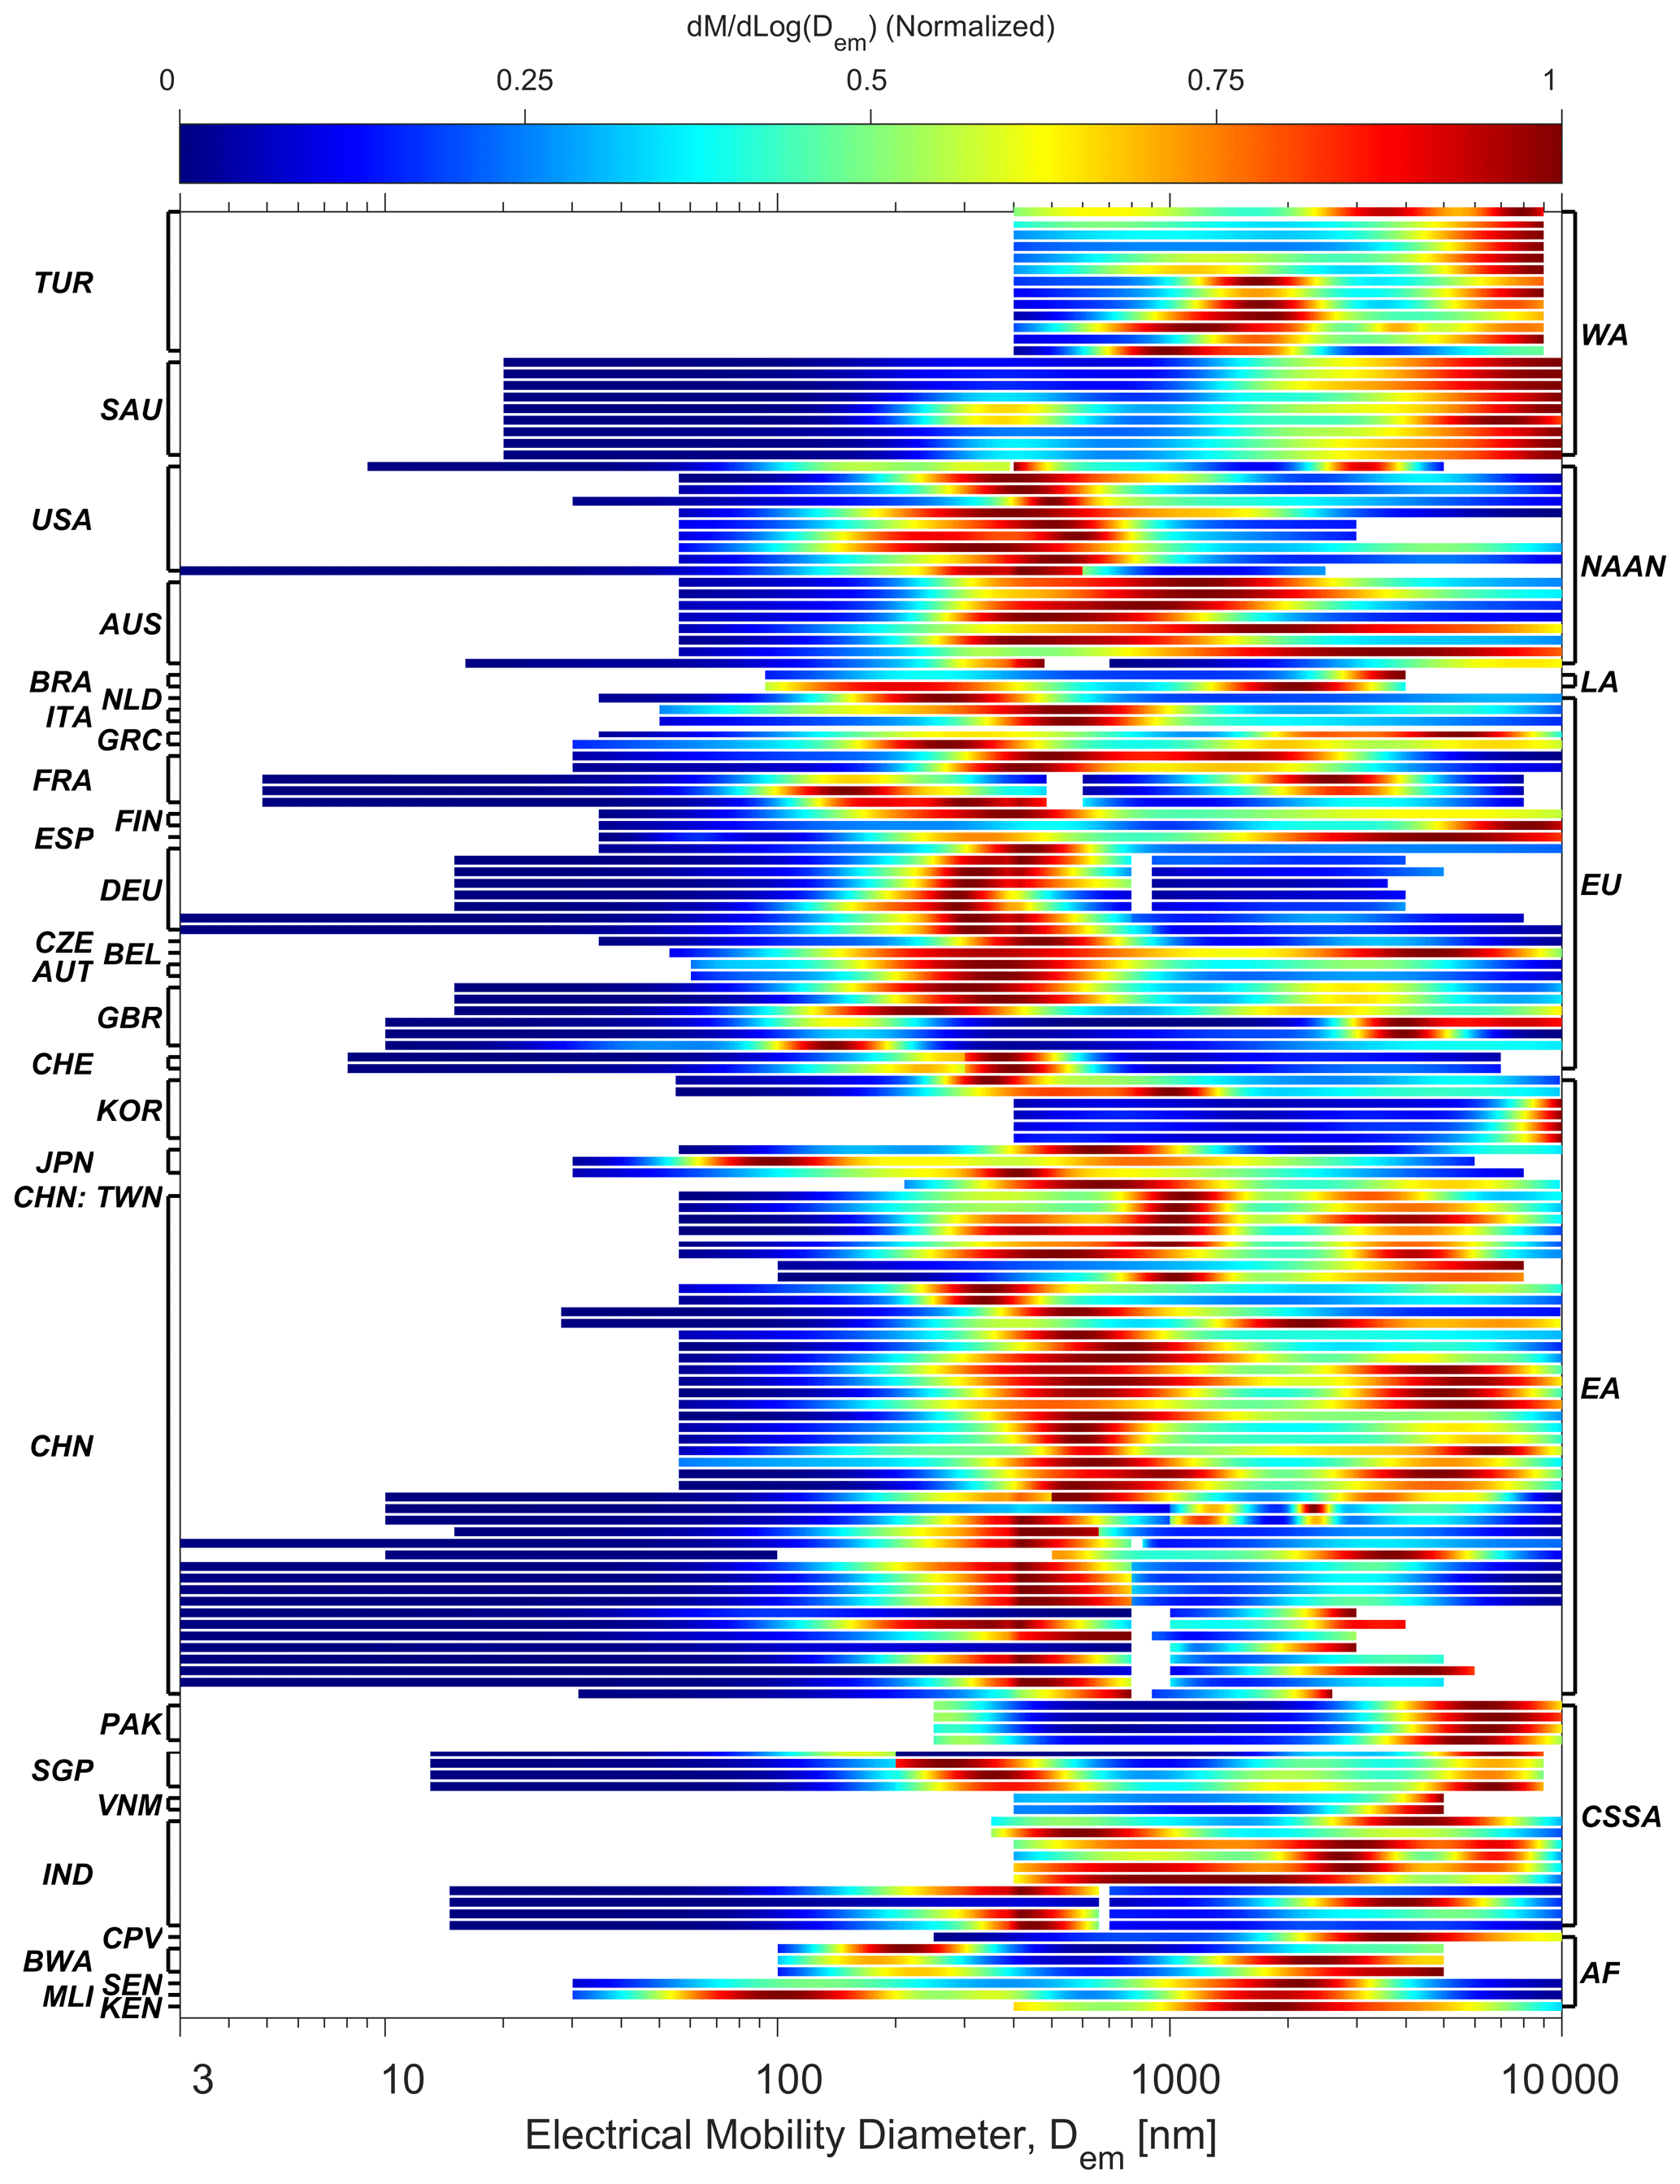
Figure 10Normalized urban aerosol mass PSDs analyzed in this study from around the globe. The country codes are listed on the left, and the region codes are listed on the right.
As with the submicron urban aerosol number PSDs, the mass PSDs were normalized by their maximum concentrations such that variations in the magnitude of the mass PSDs can be neglected (Fig. 10). The normalized urban aerosol mass PSDs presented in Fig. 10 are grouped by country and geographical region (from top to bottom): WA, NAAN, LA, EU, EA, CSSA, and AF. The normalized mass PSDs demonstrate that a significant fraction of particle mass exists below Dem = 1000 nm in numerous cities in NAAN, EU, EA, and CSSA. For measurements that included the UFP regime, it is clear that sub-100 nm particles contribute little to urban aerosol mass PSDs. The majority of the normalized mass PSDs in NAAN and EU show a maximum in the accumulation mode (red–orange color) between Dem = 200 to 600 nm, while some show local maxima in both the accumulation and coarse mode. Most of the normalized mass PSDs in EA (predominately from China) are bimodal, with accumulation-mode maxima that span Dem = 300 to 1000 nm and coarse-mode maxima that span Dem = 3000 to 8000 nm. A few mass PSDs in EA (measured in South Korea) are unimodal, with a prominent coarse mode that extends beyond Dem = 10 000 nm. The normalized mass PSDs in CSSA are more variable in shape, with varying contributions from both modes. The Dem = 100 to 200 nm fraction of the accumulation mode in both EA and CSSA, which contributed meaningfully to number PSDs in the two regions, represents a minor component of submicron aerosol mass.
The shape of normalized urban aerosol mass PSDs in WA and AF is uniquely different from the other geographical regions. In WA, the normalized mass PSDs are clearly dominated by coarse-mode particles. Measurements made in Istanbul, Turkey, show a prominent mode between Dem = 6000 and 10 000 nm, with some displaying a second coarse-mode diameter between Dem = 1000 to 2000 nm. Normalized mass PSDs from Yanbu, Saudi Arabia, show a strong mode near Dem = 10 000 nm, with either a very weak or nonexistent mode in the accumulation mode. The prominent coarse modes in WA cities are likely due to frequent dust events and enhanced dust resuspension in WA cities and the relatively large size of mineral dust particles (Al-Mahmodi, 2011). The few PSD observations from AF display a dominant coarse mode, with modes spanning Dem = 1000 to 5000 nm.
6.3 Intra-city variations in urban aerosol number PSDs between urban background and traffic-influenced sites
Urban aerosol PSDs can exhibit intra-city spatial variations depending on the measurement location and its proximity to local emission sources, such as traffic. Figure 11 presents normalized submicron urban aerosol number PSDs divided into UB (urban background, top) and TR (traffic-influenced, bottom) sites. Only PSD observations with a measurement period greater than 1 week are presented. Normalized number PSDs measured at UB sites often show maxima at larger particle sizes compared to those measured at TR sites. UB measurements are typically dominated by Aitken-mode particles, with mode diameters ranging from Dem = 20 to 90 nm, with a mean CMD of 45 nm. In contrast, many of the TR measurements exhibit prominent nucleation modes, with mode diameters falling below Dem = 30 nm, and in some cases, below Dem = 10 nm, with the mean CMD of 33 nm. The mean concentration fraction of the particles smaller than 20 nm is 35 % and 19 % for the PSDs measured at TR and UB sites, respectively. The larger particles observed at UB sites are due in part to various aerosol transformation processes, such as particle growth due to coagulation and the uptake of condensable organic and inorganic vapors during short-range transport (Fine et al., 2004; Wehner et al., 2002). Urban aerosol number PSD observations made at TR sites are strongly influenced by traffic emissions. Vehicle emissions are a major source of UFPs in the urban atmospheric environment (Kumar et al., 2014; Morawska et al., 2008; Pant and Harrison, 2013). Several studies have reviewed the characteristics of aerosol emissions from traffic, including urban SOA formation associated with vehicle exhaust (Gentner et al., 2017; Kittelson et al., 2006; Morawska et al., 2008; Pant and Harrison, 2013; Thorpe and Harrison, 2008). Traffic emissions can be broadly classified as exhaust- and non-exhaust-related. Exhaust-related vehicle emissions include soot particles from incomplete combustion and particles formed via the nucleation and condensation of H2SO4 and hydrocarbons as the hot exhaust is cooled and diluted in the ambient atmosphere (Dallmann et al., 2014; Kleeman et al., 2000; Meyer and Ristovski, 2007; Morawska et al., 2008; Shi et al., 2001; Shi and Harrison, 1999; Wehner et al., 2002).
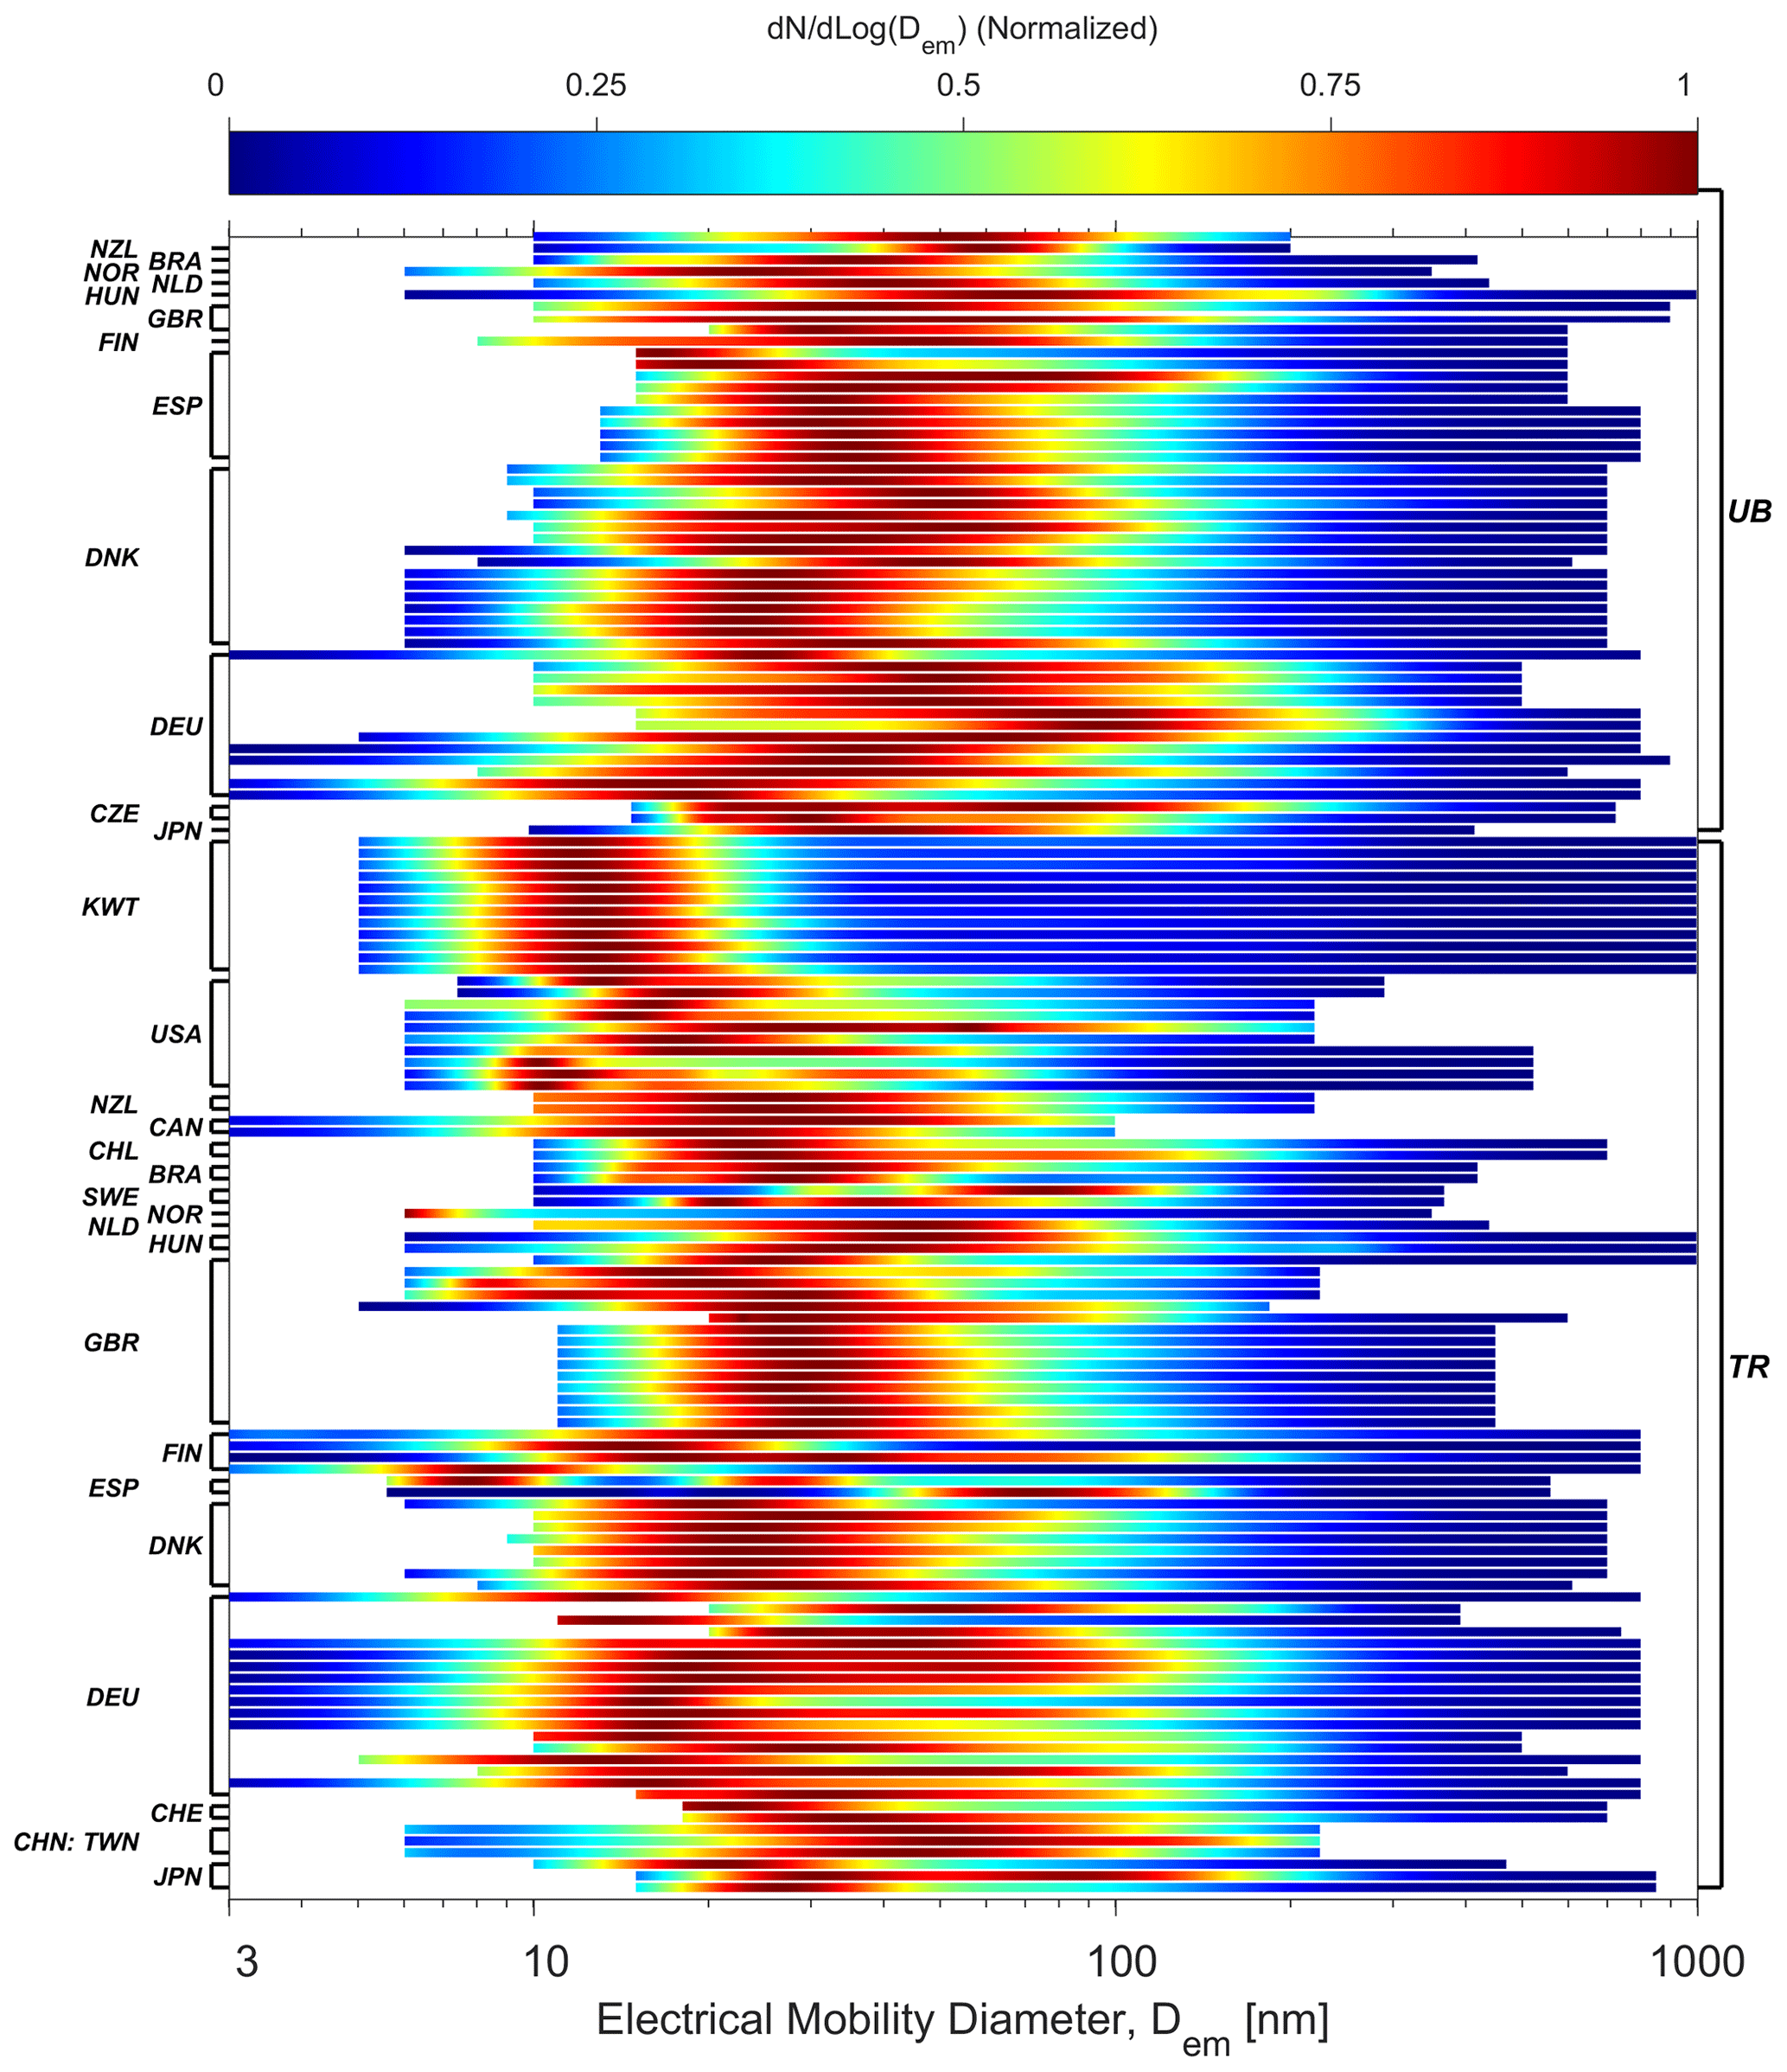
Figure 11Comparison between normalized urban aerosol number PSDs measured at urban background (UB) and traffic-influenced (TR) sites. Only the number PSDs with a measurement period greater than 1 week are presented. The country codes are listed on the left, and the site type is listed on the right.
As illustrated in Fig. S6, which presents normalized number PSDs for selected urban aerosol sources, vehicle exhaust PSDs are typically dominated by UFPs. Freshly nucleated particles in vehicle exhaust are relatively small, with Dem < 30 nm. They can contribute significantly to number PSDs at TR sites (Buonanno et al., 2009; Fushimi et al., 2008; Ketzel et al., 2003; Shi et al., 1999; Zhu et al., 2002a). However, with the increase of distance from the road, either horizontally or vertically, these particles can grow by coagulation and condensation during transport (Agus et al., 2007; Hitchins et al., 2000; Li et al., 2007; Zhu et al., 2002a, b), while some can shrink due to evaporation (Dall'Osto et al., 2011b; Ning et al., 2010; Zhang et al., 2004). Non-exhaust-related traffic emissions include brake wear, road–tire interactions, and road dust resuspension; brake wear is an important source of submicron particles. As shown in Fig. S6, normalized submicron number PSDs of brake wear aerosol can span from the nucleation mode to the accumulation mode.
6.4 Submicron urban aerosol number PSDs in Asia: factors contributing to the prominent accumulation mode
The results presented in Figs. 6–7 indicate that urban aerosol number PSDs in EA and CSSA are more commonly associated with a significant fraction of accumulation-mode particles and CMDs of approximately 100 nm compared to those reported in NAAN and EU. This indicates that submicron urban aerosol populations in EA and CSSA, and particularly in China and India, are relatively larger in size than those reported in other geographical regions. A multitude of factors are responsible for governing the shape of number PSDs in urban environments in EA and CSSA. The pronounced accumulation mode can be driven by the direct emissions of accumulation-mode particles in both the urban area, as well as regional transport of such particles from rural and industrialized areas. Biomass burning is an important emission source in a number of countries in EA and CSSA. The PSDs of biomass burning aerosol depend on a variety of factors, including: the type of biomass, the condition of the flame, and atmospheric aging processes (Janhäll et al., 2010; Reid and Hobbs, 1998; Rissler et al., 2006; Sakamoto et al., 2016; Zhang et al., 2011). As shown in Fig. S6, the burning of grass, corn straw, and rice straw produces normalized number PSDs with a significant fraction of accumulation-mode particles and CMDs of approximately 100 nm (Janhäll et al., 2010; Reid et al., 2005; Sakamoto et al., 2016). It has been observed that residential biomass burning, possibly for cooking and heating, can contribute to high particle number concentrations of accumulation-mode particles in the evening in New Delhi, India (Mönkkönen et al., 2005). A recent study using the GEOS-Chem-TOMAS model identified significant aerosol emissions from biomass burning in India and Indonesia from residential, agricultural, and wildfire sources (Kodros et al., 2018). Direct burning has been reported to be a common technique to eliminate agricultural residuals in both China and India (Bi et al., 2019). The contribution of biomass burning to urban aerosols was confirmed by the high content of water-soluble potassium in the particle phase (Qi et al., 2015; Zheng et al., 2005). In addition to biomass burning, other urban sources may directly emit accumulation-mode particles, such as vehicle exhaust, power plants, and industrial activities (Vu et al., 2015).
Another factor contributing to the abundance of accumulation-mode particles in EA and CSSA is aging processes that can grow nucleation- and Aitken-mode particles through coagulation and condensation of organic or inorganic vapors (Moffet et al., 2008; Yang et al., 2012). Back trajectories indicate that aerosols transported from industrialized regions south and west of Beijing, China, can grow into larger sizes by condensation within slowly moving air masses, thereby contributing to the pronounced accumulation mode in urban areas (Wu et al., 2008). The abundance of condensable organic and inorganic vapors (e.g., NOx, SO2, and volatile organic compounds, VOCs) in polluted areas can aid particle growth to larger sizes. It has been reported that the concentrations of condensable vapors are higher in urban areas in China and India compared to those in NAAN and EU due to heavier air pollution in the former (Gao et al., 2009; Huang et al., 2014; Kodros et al., 2018; Kulmala et al., 2005; Misra et al., 2014; Mönkkönen et al., 2005; Shen et al., 2016a, b; Wang et al., 2013a; Wehner et al., 2004b). High levels of gas-phase precursors in China can result in significant SOA formation, which can contribute to severe haze events that are often dominated by accumulation-mode particles (Huang et al., 2014). The elevated number concentrations of accumulation-mode particles in EA and CSSA have a substantial surface area that can serve as a coagulation sink for nucleation- and Aitken-mode particles. This suppression of UFPs can cause the number PSDs in EA and CSSA to further skew to larger particle sizes.
The urban aerosol PSDs analyzed in this study are the extracted and fitted PSDs from previously reported measurements. The data extraction and lognormal fitting process introduced some uncertainties compared with the original data. Typically, the extraction process can obtain accurate data for the dominant peak of the PSD, where the concentrations are high. However, as the PSDs were primarily reported in the form of figures with a linear y-axis scale, relatively large uncertainties exist for the size ranges with low concentrations due to the limited resolution of the extraction process by using pixel picking in the figures. Similarly, the lognormal fitting process can accurately capture the dominant mode of the PSD, as the high concentrations are weighted greater in the nonlinear least-squares curve fitting (the fitting quality of individual PSDs can be visually checked in the Supplement). However, relatively large uncertainties exist between the originally reported data and the fitted PSDs for the size ranges where the concentrations are relatively low compared with the dominant peak.
These uncertainties, to some extent, affect the comparison of the PSDs in regard to their magnitudes. For example, most of the number PSDs exhibit a dominant mode in the UFP regime, while the accumulation mode often appears as a tail of the dominant mode. Although the number PSDs are fitted well in the UFP regime, the fitted number PSDs in the accumulation mode exhibit relatively large uncertainties. Therefore, we mainly compared the dominant mode in the discussion of geographical variations in urban aerosol PSDs. The uncertainties are expected to affect the comparison of the normalized PSDs to a lesser extent. Since the magnitude of individual PSDs is normalized, only the shape of the main mode is emphasized and compared, while the size ranges with relatively large uncertainties become less important. Therefore, the uncertainties from the data extraction and lognormal fitting would not significantly influence the findings on the geographical variations of the urban aerosol PSDs. The uncertainties potentially affect the absolute concentrations estimated in Fig. 8. Since the fitting quality of the main mode is typically good, and the size range with relatively larger uncertainties does not contribute substantially to the total number concentrations, this influence may not be significant. The mass PSDs include measurements with gravimetric methods employing inertial impactors. These PSDs exhibit low size resolution due to the limited number of size bins of the impactors. The fitted mass PSDs have much greater uncertainties in their shape compared to the number PSDs since the fitted curves were interpolated among the limited data points.
This study constructed size-resolved urban aerosol ρeff functions by using measured and assumed ρeff in a step-wise manner. This resulted in some sharp changes at the borders of the assumed size ranges. Using the ρeff functions in the PSD conversions caused some step-like artifacts. In reality, the ρeff and converted PSDs should transition smoothly with particle size. With the construction method and the previously measured data detailed in the paper, readers can reconstruct the ρeff functions in an interpolated manner to obtain smooth functions.
Critical gaps in urban aerosol PSD observations were identified in many geographical regions and countries, with a severe lack of ground-based PSD data for cities in AF, LA, WA, and parts of CSSA (Figs. 4 and 5). Available PSD measurement data are often short in duration, with only 14.3 % of the analyzed observations extending beyond 6 months. Similarly, there have been few direct measurements of size-resolved urban aerosol effective densities, and existing data are limited for many size fractions (Fig. 1, Table S2). A greater number of direct measurements of urban aerosol effective densities will enable accurate translation of urban aerosol number PSDs to mass PSDs in a given urban environment.
There are significant geographical variations in the shape and magnitude of urban aerosol PSDs due to differences in primary and secondary aerosol sources and meteorological conditions (Figs. 6 and 9). Such differences have important implications for human exposure and health as they drive large changes in the rate at which particles are deposited in each region of the human respiratory tract. The important contribution of sub-200 nm particles to urban aerosol number PSDs in all regions reinforces the need for routine monitoring of the smallest particles in the urban atmosphere. Urban aerosol PSD observations that span the UFP to coarse regimes are especially lacking, with only 14 % of the analyzed PSDs measuring particles across this wide size range. Coordinated global efforts are needed to build a continuous, long-term, wide size range, and ground-based urban PSD observation network in cities across the world. Such a network is necessary for improving our ability to link urban air pollution with human health and toxicological outcomes, understanding the atmospheric transformations of urban aerosol populations, and supporting air quality legislation and policy decisions that address particles both big and small (Kulmala, 2018).
Existing ground-based air quality monitoring stations are largely focused on measurements of size-integrated PM2.5 mass concentrations. Expansive observational datasets of PM2.5 mass concentrations are now available. This has significantly advanced knowledge of the impact of PM2.5 on urban air pollution and human health in the past 2 decades (Apte et al., 2015; Cheng et al., 2016; Van Donkelaar et al., 2010; Gelencsér et al., 2007; de Jesus et al., 2019; Thunis et al., 2017; West et al., 2016). PM2.5 measurement gaps do exist, with 141 of 243 countries lacking ground-based PM2.5 monitoring stations (Martin et al., 2019). The ubiquity of low-cost aerosol sensors (e.g., OPCs) is providing a foundation for large-scale deployment of PM2.5 monitoring networks (Motlagh et al., 2020). However, given the nature of urban aerosol number and mass PSDs, as illustrated in Figs. 6 and 9, observations of PM2.5 mass concentrations are insufficient to accurately characterize an urban aerosol population. Of particular importance is the measurement of PSDs that include the UFP regime, given their significant contribution to particle number concentrations (Figs. 6 and 7). This is especially important given that UFP number concentrations and PM2.5 mass concentrations are not representative of each other, as particles that dominate the two size-integrated metrics often originate from different sources (de Jesus et al., 2019).
The compilation of urban aerosol PSD observations in this study demonstrates the benefit of routinely measuring urban PSDs that include the nucleation, Aitken, accumulation, and coarse mode. CMDs of urban aerosol number PSDs often fall between Dem = 10 and 100 nm (Fig. 8); such particles contribute negligibly to urban aerosol mass PSDs. Many urban aerosol sources, such as biomass burning, traffic emissions (exhaust and non-exhaust), industrial and domestic combustion, cooking, and atmospheric new particle formation events, produce particles in the UFP regime (Fig. S6) (Brines et al., 2015; Kumar et al., 2014; Venecek et al., 2019; Vu et al., 2015). Urban aerosol PSDs provide more detailed information of emission sources than size-integrated concentrations do. Several PSD-based models have been developed using characteristic emission profiles of different sources to identify and apportion the emission sources (Beddows et al., 2009, 2014; Charron et al., 2008; Dall'Osto et al., 2011a; Friend et al., 2012; Gu et al., 2011; Harrison et al., 2011; Kasumba et al., 2009; Kim et al., 2004; Ogulei et al., 2007; Thimmaiah et al., 2009; Tunved et al., 2004; Yue et al., 2013). A detailed review of such models was given by Vu et al. (2015).
Future urban aerosol PSD measurements should aim to span the entirety of the UFP regime. Achieving continuous urban aerosol number PSD observations from the nucleation to coarse mode at the global scale remains a challenge given the cost of sensitive aerosol instrumentation required for the detection of UFPs and the collection of different measurement techniques needed to detect particles across such a wide size range. While advancements in low-cost optical particle sensing for detection of aerosols down to approximately Dem = 300 to 500 nm have been made in recent years, efforts are still needed to develop low-cost condensation particle counters, differential mobility analyzers, and diffusion chargers for measurement of PSDs down to the UFP regime. The combination of routine PM2.5 measurements with condensation particle counters that measure most of the UFP regime could potentially be a cost-effective approach to routinely monitoring both fine particle mass concentrations and UFP number concentrations in the near future.
| AF | Africa |
| APM | Aerosol particle mass analyzer |
| APS | Aerodynamic particle sizer |
| CMD | Count median diameter |
| CSSA | Central, South, and Southeast Asia |
| DMA | Differential mobility analyzer |
| EA | East Asia |
| ELVOC | Extremely low-volatility organic compound |
| EU | Europe |
| HOM | Highly oxygenated molecule |
| LA | Latin America |
| MOUDI | Micro-orifice uniform deposit impactor |
| NAAN | North America, Australia, and New Zealand |
| NPF | New particle formation |
| OPC/OPS | Optical particle counter/optical particle sizer |
| PMX | Integrated mass concentration for particles smaller than X µm |
| PSD | Particle size distribution |
| SOA | Secondary organic aerosol |
| TR | Traffic-influenced |
| UB | Urban background |
| UFP | Ultrafine particle (≤ 100 nm) |
| VOC | Volatile organic compound |
| WA | West Asia |
| Dem | Electrical mobility diameter |
| Da | Aerodynamic diameter |
| Dop | Optical diameter |
| Dve | Volume equivalent diameter |
| ρeff | Aerosol effective density |
| ρp | Aerosol particle density |
| χ | Dynamic shape factor |
| mp | Particle mass |
| Vp | Particle volume |
| Cc | Cunningham slip correction factor |
| Ni | Particle number concentration for mode i |
| Geometric mean diameter for mode i | |
| σi | Geometric standard deviation for mode i |
| Vi | Particle volume concentration for mode i |
| Mi | Particle mass concentration for mode i |
The code for the urban PSD lognormal fitting is available upon request.
The urban PSD data from this study are available upon request.
The Supplement includes a summary of the urban aerosol PSD database. Categorization and presentation of urban aerosol PSD observations in the Supplement are introduced in Tables S1–S2 and Figs. S1–S6 (pg. 1–13). Measurement information and lognormal fitting parameters for each PSD are summarized in Tables S3–S6 (pg. 14–35). Individual PSD figures present the measured and fitted PSDs, translated across number, surface area, volume, and mass domains (pg. 36–804). References used in compiling the urban aerosol PSD database are also included (pg. 805–821). The supplement related to this article is available online at: https://doi.org/10.5194/acp-21-8883-2021-supplement.
BEB conceived and planned the study and secured funding for it. TW conducted the literature search and performed the data collection and analysis under the supervision of BEB. TW and BEB wrote the manuscript.
The authors declare that they have no conflict of interest.
The authors are grateful for the assistance of undergraduate student researchers Geordi Jose and Jihang Liu.
This research has been supported by the American Society of Heating, Refrigeration and Air Conditioning Engineers (grant no. ASHRAE RP-1734). Publication of this article was funded in part by the Purdue University Libraries Open Access Publishing Fund.
This paper was edited by Ulrich Pöschl and reviewed by Ulrich Pöschl and five anonymous referees.
Abramson, E., Imre, D., Beránek, J., Wilson, J., and Zelenyuk, A.: Experimental determination of chemical diffusion within secondary organic aerosol particles, Phys. Chem. Chem. Phys., 15, 2983–2991, https://doi.org/10.1039/c2cp44013j, 2013.
Adachi, K. and Tainosho, Y.: Characterization of heavy metal particles embedded in tire dust, Environ. Int., 30, 1009–1017, 2004.
Agus, E. L., Young, D. T., Lingard, J. J. N., Smalley, R. J., Tate, J. E., Goodman, P. S., and Tomlin, A. S.: Factors influencing particle number concentrations, size distributions and modal parameters at a roof-level and roadside site in Leicester, UK, Sci. Total Environ., 386, 65–82, 2007.
Allen, J. L., Oberdorster, G., Morris-Schaffer, K., Wong, C., Klocke, C., Sobolewski, M., Conrad, K., Mayer-Proschel, M., and Cory-Slechta, D. A.: Developmental neurotoxicity of inhaled ambient ultrafine particle air pollution: parallels with neuropathological and behavioral features of autism and other neurodevelopmental disorders, Neurotoxicology, 59, 140–154, 2017.
Allen, M. D. and Raabe, O. G.: Re-evaluation of Millikan's oil drop data for the motion of small particles in air, J. Aerosol Sci., 13, 537–547, 1982.
Allen, M. D. and Raabe, O. G.: Slip correction measurements of spherical solid aerosol particles in an improved Millikan apparatus, Aerosol Sci. Technol., 4, 269–286, 1985.
Al-Mahmodi, J. N. H.: Measurements and Prediction of Particulate Number Concentrations and their Chemical Composition over Yanbu Industrial City, Saudi Arabia, PhD Thesis, The University of Manchester, Manchester, UK, 2011.
Almeida, S. M., Pio, C. A., Freitas, M. C., Reis, M. A., and Trancoso, M. A.: Source apportionment of atmospheric urban aerosol based on weekdays/weekend variability: evaluation of road re-suspended dust contribution, Atmos. Environ., 40, 2058–2067, 2006.
Anderson, J. O., Thundiyil, J. G., and Stolbach, A.: Clearing the Air: A Review of the Effects of Particulate Matter Air Pollution on Human Health, J. Med. Toxicol., 8, 166–175, https://doi.org/10.1007/s13181-011-0203-1, 2012.
Apte, J. S., Marshall, J. D., Cohen, A. J., and Brauer, M.: Addressing global mortality from ambient PM2.5, Environ. Sci. Technol., 49, 8057–8066, 2015.
Asmi, A., Wiedensohler, A., Laj, P., Fjaeraa, A.-M., Sellegri, K., Birmili, W., Weingartner, E., Baltensperger, U., Zdimal, V., Zikova, N., Putaud, J.-P., Marinoni, A., Tunved, P., Hansson, H.-C., Fiebig, M., Kivekäs, N., Lihavainen, H., Asmi, E., Ulevicius, V., Aalto, P. P., Swietlicki, E., Kristensson, A., Mihalopoulos, N., Kalivitis, N., Kalapov, I., Kiss, G., de Leeuw, G., Henzing, B., Harrison, R. M., Beddows, D., O'Dowd, C., Jennings, S. G., Flentje, H., Weinhold, K., Meinhardt, F., Ries, L., and Kulmala, M.: Number size distributions and seasonality of submicron particles in Europe 2008–2009, Atmos. Chem. Phys., 11, 5505–5538, https://doi.org/10.5194/acp-11-5505-2011, 2011.
Azimi, P., Zhao, D., and Stephens, B.: Estimates of HVAC filtration efficiency for fine and ultrafine particles of outdoor origin, Atmos. Environ., 98, 337–346, https://doi.org/10.1016/j.atmosenv.2014.09.007, 2014.
Babu, S. S., Kompalli, S. K., and Moorthy, K. K.: Aerosol number size distributions over a coastal semi urban location: Seasonal changes and ultrafine particle bursts, Sci. Total Environ., 563–564, 351–365, https://doi.org/10.1016/j.scitotenv.2016.03.246, 2016.
Barone, T. L., Lall, A. A., Storey, J. M. E., Mulholland, G. W., Prikhodko, V. Y., Frankland, J. H., Parks, J. E., and Zachariah, M. R.: Size-resolved density measurements of particle emissions from an advanced combustion diesel engine: effect of aggregate morphology, Energ. Fuel., 25, 1978–1988, 2011.
Bäumer, D., Vogel, B., Versick, S., Rinke, R., Möhler, O., and Schnaiter, M.: Relationship of visibility, aerosol optical thickness and aerosol size distribution in an ageing air mass over South-West Germany, Atmos. Environ., 42, 989–998, https://doi.org/10.1016/j.atmosenv.2007.10.017, 2008.
Baxla, S. P., Roy, A. A., Gupta, T., Tripathi, S. N., and Bandyopadhyaya, R.: Analysis of diurnal and seasonal variation of submicron outdoor aerosol mass and size distribution in a northern indian city and its correlation to black carbon, Aerosol Air Qual. Res., 9, 458–469, https://doi.org/10.4209/aaqr.2009.03.0017, 2009.
Beddows, D. C. S., Dall'Osto, M., Harrison, R. M., Dall'Osto, M., Harrison, R. M., Dall'Osto, M., and Harrison, R. M.: Cluster Analysis of Rural, Urban, and Curbside Atmospheric Particle Size Data, Environ. Sci. Technol., 43, 4694–4700, https://doi.org/10.1021/es803121t, 2009.
Beddows, D. C. S., Dall'Osto, M., Harrison, R. M., Kulmala, M., Asmi, A., Wiedensohler, A., Laj, P., Fjaeraa, A. M., Sellegri, K., Birmili, W., Bukowiecki, N., Weingartner, E., Baltensperger, U., Zdimal, V., Zikova, N., Putaud, J.-P., Marinoni, A., Tunved, P., Hansson, H.-C., Fiebig, M., Kivekäs, N., Swietlicki, E., Lihavainen, H., Asmi, E., Ulevicius, V., Aalto, P. P., Mihalopoulos, N., Kalivitis, N., Kalapov, I., Kiss, G., de Leeuw, G., Henzing, B., O'Dowd, C., Jennings, S. G., Flentje, H., Meinhardt, F., Ries, L., Denier van der Gon, H. A. C., and Visschedijk, A. J. H.: Variations in tropospheric submicron particle size distributions across the European continent 2008–2009, Atmos. Chem. Phys., 14, 4327–4348, https://doi.org/10.5194/acp-14-4327-2014, 2014.
Bentayeb, M., Wagner, V., Stempfelet, M., Zins, M., Goldberg, M., Pascal, M., Larrieu, S., Beaudeau, P., Cassadou, S., and Eilstein, D.: Association between long-term exposure to air pollution and mortality in France: a 25-year follow-up study, Environ. Int., 85, 5–14, 2015.
Bi, X., Dai, Q., Wu, J., Zhang, Q., Zhang, W., Luo, R., Cheng, Y., Zhang, J., Wang, L., Yu, Z., Zhang, Y., Tian, Y., and Feng, Y.: Characteristics of the main primary source profiles of particulate matter across China from 1987 to 2017, Atmos. Chem. Phys., 19, 3223–3243, https://doi.org/10.5194/acp-19-3223-2019, 2019.
Birmili, W., Wiedensohler, A., Heintzenberg, J., and Lehmann, K.: Atmospheric particle number size distribution in central Europe: Statistical relations to air masses and meteorology, J. Geophys. Res.-Atmos., 106, 32005–32018, 2001.
Birmili, W., Tomsche, L., Sonntag, A., Opelt, C., Weinhold, K., Nordmann, S., and Schmidt, W.: Variability of aerosol particles in the urban atmosphere of Dresden (Germany): Effects of spatial scale and particle size, Meteorol. Z., 22, 195–211, https://doi.org/10.1127/0941-2948/2013/0395, 2013.
Brines, M., Dall'Osto, M., Beddows, D. C. S., Harrison, R. M., Gómez-Moreno, F., Núñez, L., Artíñano, B., Costabile, F., Gobbi, G. P., Salimi, F., Morawska, L., Sioutas, C., and Querol, X.: Traffic and nucleation events as main sources of ultrafine particles in high-insolation developed world cities, Atmos. Chem. Phys., 15, 5929–5945, https://doi.org/10.5194/acp-15-5929-2015, 2015.
Brüggemann, E., Gerwig, H., Gnauk, T., Müller, K., and Herrmann, H.: Influence of seasons, air mass origin and day of the week on size-segregated chemical composition of aerosol particles at a kerbside, Atmos. Environ., 43, 2456–2463, https://doi.org/10.1016/j.atmosenv.2009.01.054, 2009.
Buonanno, G., Lall, A. A., and Stabile, L.: Temporal size distribution and concentration of particles near a major highway, Atmos. Environ., 43, 1100–1105, https://doi.org/10.1016/j.atmosenv.2008.11.011, 2009.
Buonanno, G., Fuoco, F. C., and Stabile, L.: Influential parameters on particle exposure of pedestrians in urban microenvironments, Atmos. Environ., 45, 1434–1443, 2011.
Burnett, R., Chen, H., Szyszkowicz, M., Fann, N., Hubbell, B., Pope, C. A., Apte, J. S., Brauer, M., Cohen, A., and Weichenthal, S.: Global estimates of mortality associated with long-term exposure to outdoor fine particulate matter, Proc. Natl. Acad. Sci., 115, 9592–9597, 2018.
Burnett, R. T., Pope III, C. A., Ezzati, M., Olives, C., Lim, S. S., Mehta, S., Shin, H. H., Singh, G., Hubbell, B., and Brauer, M.: An integrated risk function for estimating the global burden of disease attributable to ambient fine particulate matter exposure, Environ. Health Perspect., 122, 397–403, 2014.
Cabada, J. C., Rees, S., Takahama, S., Khlystov, A., Pandis, S. N., Davidson, C. I., and Robinson, A. L.: Mass size distributions and size resolved chemical composition of fine particulate matter at the Pittsburgh supersite, Atmos. Environ., 38, 3127–3141, https://doi.org/10.1016/j.atmosenv.2004.03.004, 2004.
Cai, R., Yang, D., Fu, Y., Wang, X., Li, X., Ma, Y., Hao, J., Zheng, J., and Jiang, J.: Aerosol surface area concentration: a governing factor in new particle formation in Beijing, Atmos. Chem. Phys., 17, 12327–12340, https://doi.org/10.5194/acp-17-12327-2017, 2017.
Cao, J.-J., Zhu, C.-S., Tie, X.-X., Geng, F.-H., Xu, H.-M., Ho, S. S. H., Wang, G.-H., Han, Y.-M., and Ho, K.-F.: Characteristics and sources of carbonaceous aerosols from Shanghai, China, Atmos. Chem. Phys., 13, 803–817, https://doi.org/10.5194/acp-13-803-2013, 2013.
Charron, A. and Harrison, R. M.: Primary particle formation from vehicle emissions during exhaust dilution in the roadside atmosphere, Atmos. Environ., 37, 4109–4119, https://doi.org/10.1016/S1352-2310(03)00510-7, 2003.
Charron, A., Birmili, W., and Harrison, R. M.: Fingerprinting particle origins according to their size distribution at a UK rural site, J. Geophys. Res.-Atmos., 113, D07202, https://doi.org/10.1029/2007JD008562, 2008.
Cheng, Z., Luo, L., Wang, S., Wang, Y., Sharma, S., Shimadera, H., Wang, X., Bressi, M., de Miranda, R. M., Jiang, J., Zhou, W., Fajardo, O., Yan, N., and Hao, J.: Status and characteristics of ambient PM2.5 pollution in global megacities, Environ. Int., 89–90, 212–221, https://doi.org/10.1016/j.envint.2016.02.003, 2016.
Cheung, K., Daher, N., Kam, W., Shafer, M. M., Ning, Z., Schauer, J. J., and Sioutas, C.: Spatial and temporal variation of chemical composition and mass closure of ambient coarse particulate matter (PM10–2.5) in the Los Angeles area, Atmos. Environ., 45, 2651–2662, https://doi.org/10.1016/j.atmosenv.2011.02.066, 2011.
Costabile, F., Birmili, W., Klose, S., Tuch, T., Wehner, B., Wiedensohler, A., Franck, U., König, K., and Sonntag, A.: Spatio-temporal variability and principal components of the particle number size distribution in an urban atmosphere, Atmos. Chem. Phys., 9, 3163–3195, https://doi.org/10.5194/acp-9-3163-2009, 2009.
Cozic, J., Verheggen, B., Weingartner, E., Crosier, J., Bower, K. N., Flynn, M., Coe, H., Henning, S., Steinbacher, M., Henne, S., Collaud Coen, M., Petzold, A., and Baltensperger, U.: Chemical composition of free tropospheric aerosol for PM1 and coarse mode at the high alpine site Jungfraujoch, Atmos. Chem. Phys., 8, 407–423, https://doi.org/10.5194/acp-8-407-2008, 2008.
Daher, N., Saliba, N. A., Shihadeh, A. L., Jaafar, M., Baalbaki, R., and Sioutas, C.: Chemical composition of size-resolved particulate matter at near- freeway and urban background sites in the greater Beirut area, Atmos. Environ., 80, 96–106, 2013.
Dallmann, T. R., Onasch, T. B., Kirchstetter, T. W., Worton, D. R., Fortner, E. C., Herndon, S. C., Wood, E. C., Franklin, J. P., Worsnop, D. R., Goldstein, A. H., and Harley, R. A.: Characterization of particulate matter emissions from on-road gasoline and diesel vehicles using a soot particle aerosol mass spectrometer, Atmos. Chem. Phys., 14, 7585–7599, https://doi.org/10.5194/acp-14-7585-2014, 2014.
Dall'Osto, M., Monahan, C., Greaney, R., Beddows, D. C. S., Harrison, R. M., Ceburnis, D., and O'Dowd, C. D.: A statistical analysis of North East Atlantic (submicron) aerosol size distributions, Atmos. Chem. Phys., 11, 12567–12578, https://doi.org/10.5194/acp-11-12567-2011, 2011a.
Dall'Osto, M., Thorpe, A., Beddows, D. C. S., Harrison, R. M., Barlow, J. F., Dunbar, T., Williams, P. I., and Coe, H.: Remarkable dynamics of nanoparticles in the urban atmosphere, Atmos. Chem. Phys., 11, 6623–6637, https://doi.org/10.5194/acp-11-6623-2011, 2011b.
Davies, C. N.: Particle-fluid interaction, J. Aerosol Sci., 10, 477–513, 1979.
DeCarlo, P. F., Slowik, J. G., Worsnop, D. R., Davidovits, P., and Jimenez, J. L.: Particle morphology and density characterization by combined mobility and aerodynamic diameter measurements. Part 1: Theory, Aerosol Sci. Technol., 38, 1185–1205, 2004.
de Jesus, A. L., Rahman, M. M., Mazaheri, M., Thompson, H., Knibbs, L. D., Jeong, C., Evans, G., Nei, W., Ding, A., and Qiao, L.: Ultrafine particles and PM2.5 in the air of cities around the world: Are they representative of each other?, Environ. Int., 129, 118–135, 2019.
Delfino, R. J., Sioutas, C., and Malik, S.: Potential role of ultrafine particles in associations between airborne particle mass and cardiovascular health, Environ. Health Perspect., 113, 934–946, https://doi.org/10.1289/ehp.7938, 2005.
Ding, X. X., Kong, L. D., Du, C. T., Zhanzakova, A., Fu, H. B., Tang, X. F., Wang, L., Yang, X., Chen, J. M., and Cheng, T. T.: Characteristics of size-resolved atmospheric inorganic and carbonaceous aerosols in urban Shanghai, Atmos. Environ., 167, 625–641, https://doi.org/10.1016/j.atmosenv.2017.08.043, 2017.
Ehn, M., Thornton, J. A., Kleist, E., Sipilä, M., Junninen, H., Pullinen, I., Springer, M., Rubach, F., Tillmann, R., Lee, B., Lopez-Hilfiker, F., Andres, S., Acir, I. H., Rissanen, M., Jokinen, T., Schobesberger, S., Kangasluoma, J., Kontkanen, J., Nieminen, T., Kurtén, T., Nielsen, L. B., Jørgensen, S., Kjaergaard, H. G., Canagaratna, M., Maso, M. D., Berndt, T., Petäjä, T., Wahner, A., Kerminen, V. M., Kulmala, M., Worsnop, D. R., Wildt, J., and Mentel, T. F.: A large source of low-volatility secondary organic aerosol, Nature, 506, 476–479, https://doi.org/10.1038/nature13032, 2014.
Feng, Y., Chen, Y., Guo, H., Zhi, G., Xiong, S., Li, J., Sheng, G., and Fu, J.: Characteristics of organic and elemental carbon in PM2.5 samples in Shanghai, China, Atmos. Res., 92, 434–442, 2009.
Fine, P. M., Shen, S., and Sioutas, C.: Inferring the sources of fine and ultrafine particulate matter at downwind receptor sites in the Los Angeles Basin using multiple continuous measurements, Aerosol Sci. Technol., 38, 182–195, https://doi.org/10.1080/02786820390229499, 2004.
Friend, A. J., Ayoko, G. A., Jayaratne, E. R., Jamriska, M., Hopke, P. K., and Morawska, L.: Source apportionment of ultrafine and fine particle concentrations in Brisbane, Australia, Environ. Sci. Pollut. Res., 19, 2942–2950, 2012.
Fushimi, A., Hasegawa, S., Takahashi, K., Fujitani, Y., Tanabe, K., and Kobayashi, S.: Atmospheric fate of nuclei-mode particles estimated from the number concentrations and chemical composition of particles measured at roadside and background sites, Atmos. Environ., 42, 949–959, https://doi.org/10.1016/j.atmosenv.2007.10.019, 2008.
Gao, J., Wang, T., Zhou, X., Wu, W., and Wang, W.: Measurement of aerosol number size distributions in the Yangtze River delta in China: Formation and growth of particles under polluted conditions, Atmos. Environ., 43, 829–836, 2009.
Gaston, C. J., Riedel, T. P., Zhang, Z., Gold, A., Surratt, J. D., and Thornton, J. A.: Reactive uptake of an isoprene-derived epoxydiol to submicron aerosol particles, Environ. Sci. Technol., 48, 11178–11186, 2014.
Gelencsér, A., May, B., Simpson, D., Sánchez-Ochoa, A., Kasper-Giebl, A., Puxbaum, H., Caseiro, A., Pio, C. A., and Legrand, M.: Source apportionment of PM2.5 organic aerosol over Europe: Primary/secondary, natural/anthropogenic, and fossil/biogenic origin, J. Geophys. Res.-Atmos., 112, 1–12, https://doi.org/10.1029/2006JD008094, 2007.
Geller, M., Biswas, S., and Sioutas, C.: Determination of Particle Effective Density in Urban Environments with a Differential Mobility Analyzer and Aerosol Particle Mass Analyzer, Aerosol Sci. Technol., 40, 709–723, https://doi.org/10.1080/02786820600803925, 2006.
Gentner, D. R., Jathar, S. H., Gordon, T. D., Bahreini, R., Day, D. A., El Haddad, I., Hayes, P. L., Pieber, S. M, Platt, S. M., De Gouw, J., Goldstein, A. H., Harley, R. A., Jimenez, J. L., Prévôt, A. S. H., and Robinson, A. L.: Review of urban secondary organic aerosol formation from gasoline and diesel motor vehicle emi ssions, Environmen. Sci. Technol., 51, 1074–1093, 2017.
Gu, J., Pitz, M., Schnelle-Kreis, J., Diemer, J., Reller, A., Zimmermann, R., Soentgen, J., Stoelzel, M., Wichmann, H.-E., and Peters, A.: Source apportionment of ambient particles: comparison of positive matrix factorization analysis applied to particle size distribution and chemical composition data, Atmos. Environ., 45, 1849–1857, 2011.
Guo, S., Hu, M., Wang, Z. B., Slanina, J., and Zhao, Y. L.: Size-resolved aerosol water-soluble ionic compositions in the summer of Beijing: implication of regional secondary formation, Atmos. Chem. Phys., 10, 947–959, https://doi.org/10.5194/acp-10-947-2010, 2010.
Harrison, R. M., Beddows, D. C. S., and Dall'Osto, M.: PMF analysis of wide-range particle size spectra collected on a major highway, Environ. Sci. Technol., 45, 5522–5528, 2011.
Harrison, R. M., Dall'Osto, M., Beddows, D. C. S., Thorpe, A. J., Bloss, W. J., Allan, J. D., Coe, H., Dorsey, J. R., Gallagher, M., Martin, C., Whitehead, J., Williams, P. I., Jones, R. L., Langridge, J. M., Benton, A. K., Ball, S. M., Langford, B., Hewitt, C. N., Davison, B., Martin, D., Petersson, K. F., Henshaw, S. J., White, I. R., Shallcross, D. E., Barlow, J. F., Dunbar, T., Davies, F., Nemitz, E., Phillips, G. J., Helfter, C., Di Marco, C. F., and Smith, S.: Atmospheric chemistry and physics in the atmosphere of a developed megacity (London): an overview of the REPARTEE experiment and its conclusions, Atmos. Chem. Phys., 12, 3065–3114, https://doi.org/10.5194/acp-12-3065-2012, 2012.
Hinds, W. C.: Aerosol technology: properties, behavior, and measurement of airborne particles, John Wiley & Sons, New York, USA, 2012.
Hitchins, J., Morawska, L., Wolff, R., and Gilbert, D.: Concentrations of submicrometre particles from vehicle emissions near a major road, Atmos. Environ., 34, 51–59, 2000.
Hu, M., Peng, J., Sun, K., Yue, D., Guo, S., Wiedensohler, A., and Wu, Z.: Estimation of size-resolved ambient particle density based on the measurement of aerosol number, mass, and chemical size distributions in the winter in Beijing, Environ. Sci. Technol., 46, 9941–9947, https://doi.org/10.1021/es204073t, 2012.
Huang, R.-J., Zhang, Y., Bozzetti, C., Ho, K.-F., Cao, J.-J., Han, Y., Daellenbach, K. R., Slowik, J. G., Platt, S. M., and Canonaco, F.: High secondary aerosol contribution to particulate pollution during haze events in China, Nature, 514, 218–222, https://doi.org/10.1038/nature13774, 2014.
Hudson, P. K., Gibson, E. R., Young, M. A., Kleiber, P. D., and Grassian, V. H.: A newly designed and constructed instrument for coupled infrared extinction and size distribution measurements of aerosols, Aerosol Sci. Technol., 41, 701–710, https://doi.org/10.1080/02786820701408509, 2007.
Hudson, P. K., Gibson, E. R., Young, M. A., Kleiber, P. D., and Grassian, V. H.: Coupled infrared extinction and size distribution measurements for several clay components of mineral dust aerosol, J. Geophys. Res.-Atmos., 113, 1–11, https://doi.org/10.1029/2007JD008791, 2008.
Hussein, T., Puustinen, A., Aalto, P. P., Mäkelä, J. M., Hämeri, K., and Kulmala, M.: Urban aerosol number size distributions, Atmos. Chem. Phys., 4, 391–411, https://doi.org/10.5194/acp-4-391-2004, 2004.
Hussein, T., Hämeri, K., Aalto, P. P., Paatero, P., and Kulmala, M.: Modal structure and spatial-temporal variations of urban and suburban aerosols in Helsinki – Finland, Atmos. Environ., 39, 1655–1668, https://doi.org/10.1016/j.atmosenv.2004.11.031, 2005.
Hussein, T., Saleh, S. S. A., dos Santos, V. N., Boor, B. E., Koivisto, A. J., and Löndahl, J.: Regional inhaled deposited dose of urban aerosols in an eastern Mediterranean city, Atmosphere, 10, 530, https://doi.org/10.3390/atmos10090530, 2019.
Hussein, T., Boor, B. E., and Löndahl, J.: Regional Inhaled Deposited Dose of Indoor Combustion-Generated Aerosols in Jordanian Urban Homes, Atmosphere, 11, 1150, https://doi.org/10.3390/atmos11111150, 2020.
Janhäll, S., Andreae, M. O., and Pöschl, U.: Biomass burning aerosol emissions from vegetation fires: particle number and mass emission factors and size distributions, Atmos. Chem. Phys., 10, 1427–1439, https://doi.org/10.5194/acp-10-1427-2010, 2010.
Jiang, J., Oberdörster, G., and Biswas, P.: Characterization of size, surface charge, and agglomeration state of nanoparticle dispersions for toxicological studies, J. Nanoparticle Res., 11, 77–89, 2009.
Kaaden, N., Massling, A., Schladitz, A., Müller, T., Kandler, K., Schütz, L., Weinzierl, B., Petzold, A., Tesche, M., Leinert, S., Deutscher, C., Ebert, M., Weinbruch, S., and Wiedensohler, A.: State of mixing, shape factor, number size distribution, and hygroscopic growth of the Saharan anthropogenic and mineral dust aerosol at Tinfou, Morocco, Tellus, Ser. B Chem. Phys. Meteorol., 61, 51–63, https://doi.org/10.1111/j.1600-0889.2008.00388.x, 2009.
Kasumba, J., Hopke, P. K., Chalupa, D. C., and Utell, M. J.: Comparison of sources of submicron particle number concentrations measured at two sites in Rochester, NY, Sci. Total Environ., 407, 5071–5084, 2009.
Kaul, D. S., Gupta, T., Tripathi, S. N., Tare, V., and Collett Jr, J. L.: Secondary organic aerosol: a comparison between foggy and nonfoggy days, Environ. Sci. Technol., 45, 7307–7313, 2011.
Ketzel, M., Wåhlin, P., Berkowicz, R., and Palmgren, F.: Particle and trace gas emission factors under urban driving conditions in Copenhagen based on street and roof-level observations, Atmos. Environ., 37, 2735–2749, https://doi.org/10.1016/S1352-2310(03)00245-0, 2003.
Ketzel, M., Wåhlin, P., Kristensson, A., Swietlicki, E., Berkowicz, R., Nielsen, O. J., and Palmgren, F.: Particle size distribution and particle mass measurements at urban,near-city and rural level in the Copenhagen area and Southern Sweden, Atmos. Chem. Phys., 4, 281–292, https://doi.org/10.5194/acp-4-281-2004, 2004.
Kim, E., Hopke, P. K., Larson, T. V., and Covert, D. S.: Analysis of ambient particle size distributions using unmix and positive matrix factorization, Environ. Sci. Technol., 38, 202–209, 2004.
Kim, K. H., Choi, G. H., Kang, C. H., Lee, J. H., Kim, J. Y., Youn, Y. H., and Lee, S. R.: The chemical composition of fine and coarse particles in relation with the Asian Dust events, Atmos. Environ., 37, 753–765, https://doi.org/10.1016/S1352-2310(02)00954-8, 2003.
Kittelson, D. B., Watts, W. F., and Johnson, J. P.: On-road and laboratory evaluation of combustion aerosols-Part1: Summary of diesel engine results, J. Aerosol Sci., 37, 913–930, https://doi.org/10.1016/j.jaerosci.2005.08.005, 2006.
Kleeman, M. J., Schauer, J. J., and Cass, G. R.: Size and composition distribution of fine particulate matter emitted from motor vehicles, Environ. Sci. Technol., 34, 1132–1142, 2000.
Koçak, M., Mihalopoulos, N., and Kubilay, N.: Chemical composition of the fine and coarse fraction of aerosols in the northeastern Mediterranean, Atmos. Environ., 41, 7351–7368, https://doi.org/10.1016/j.atmosenv.2007.05.011, 2007.
Kodros, J. K., Volckens, J., Jathar, S. H., and Pierce, J. R.: Ambient particulate matter size distributions drive regional and global variability in particle deposition in the respiratory tract, GeoHealth, 2, 298–312, 2018.
Kostenidou, E., Pandis, S. N., Pathak, R. K., Pandis, S. N., Kostenidou, E., and Pandis, S. N.: An algorithm for the calculation of secondary organic aerosol density combining ams and smps data, Aerosol Sci. Technol., 41, 1002–1010, https://doi.org/10.1080/02786820701666270, 2007.
Koulouri, E., Saarikoski, S., Theodosi, C., Markaki, Z., Gerasopoulos, E., Kouvarakis, G., Mäkelä, T., Hillamo, R., and Mihalopoulos, N.: Chemical composition and sources of fine and coarse aerosol particles in the Eastern Mediterranean, Atmos. Environ., 42, 6542–6550, https://doi.org/10.1016/j.atmosenv.2008.04.010, 2008.
Kulmala, M.: Build a global Earth observatory, Nature, 553, 21–23, 2018.
Kulmala, M., Petäjä, T., Mönkkönen, P., Koponen, I. K., Dal Maso, M., Aalto, P. P., Lehtinen, K. E. J., and Kerminen, V.-M.: On the growth of nucleation mode particles: source rates of condensable vapor in polluted and clean environments, Atmos. Chem. Phys., 5, 409–416, https://doi.org/10.5194/acp-5-409-2005, 2005.
Kulmala, M., Kontkanen, J., Junninen, H., Lehtipalo, K., Manninen, H. E., Nieminen, T., Petaja, T., Sipila, M., Schobesberger, S., Rantala, P., Franchin, A., Jokinen, T., Jarvinen, E., Aijala, M., Kangasluoma, J., Hakala, J., Aalto, P. P., Paasonen, P., Mikkila, J., Vanhanen, J., Aalto, J., Hakola, H., Makkonen, U., Ruuskanen, T., Mauldin, R. L., Duplissy, J., Vehkamaki, H., Back, J., Kortelainen, A., Riipinen, I., Kurten, T., Johnston, M. V., Smith, J. N., Ehn, M., Mentel, T. F., Lehtinen, K. E. J., Laaksonen, A., Kerminen, V.-M., and Worsnop, D. R.: Direct Observations of Atmospheric Aerosol Nucleation, Science, 339, 943–946, https://doi.org/10.1126/science.1227385, 2013.
Kumar, P., Morawska, L., Birmili, W., Paasonen, P., Hu, M., Kulmala, M., Harrison, R. M., Norford, L., and Britter, R.: Ultrafine particles in cities, Environ. Int., 66, 1–10, 2014.
Levy, M. E., Zhang, R., Khalizov, A. F., Zheng, J., Collins, D. R., Glen, C. R., Wang, Y., Yu, X. Y., Luke, W., Jayne, J. T., and Olaguer, E.: Measurements of submicron aerosols in Houston, Texas during the 2009 SHARP field campaign, J. Geophys. Res.-Atmos., 118, 10518–10534, https://doi.org/10.1002/jgrd.50785, 2013.
Li, N., Georas, S., Alexis, N., Fritz, P., Xia, T., Williams, M. A., Horner, E., and Nel, A.: A work group report on ultrafine particles (American Academy of Allergy, Asthma & Immunology): Why ambient ultrafine and engineered nanoparticles should receive special attention for possible adverse health outcomes in human subjects, J. Allergy Clin. Immunol., 138, 386–396, https://doi.org/10.1016/j.jaci.2016.02.023, 2016.
Li, R., Yang, J., Saffari, A., Jacobs, J., Baek, K. I., Hough, G., Larauche, M. H., Ma, J., Jen, N., Moussaoui, N., Zhou, B., Kang, H., Reddy, S., Henning, S. M., Campen, M. J., Pisegna, J., Li, Z., Fogelman, A. M., Sioutas, C., Navab, M., and Hsiai, T. K.: Ambient Ultrafine Particle Ingestion Alters Gut Microbiota in Association with Increased Atherogenic Lipid Metabolites, Sci. Rep., 7, 1–12, https://doi.org/10.1038/srep42906, 2017.
Li, X. L., Wang, J. S., Tu, X. D., Liu, W., and Huang, Z.: Vertical variations of particle number concentration and size distribution in a street canyon in Shanghai, China, Sci. Total Environ., 378, 306–316, https://doi.org/10.1016/j.scitotenv.2007.02.040, 2007.
Lide, D. R.: CRC handbook of chemistry and physics, 85th edition, CRC press, Boca Raton, Florida, USA, 2005.
Limbeck, A., Kulmala, M., and Puxbaum, H.: Secondary organic aerosol formation in the atmosphere via heterogeneous reaction of gaseous isoprene on acidic particles, Geophys. Res. Lett., 30, 1996, https://doi.org/10.1029/2003GL017738, 2003.
Lin, Y.-H., Zhang, Z., Docherty, K. S., Zhang, H., Budisulistiorini, S. H., Rubitschun, C. L., Shaw, S. L., Knipping, E. M., Edgerton, E. S., and Kleindienst, T. E.: Isoprene epoxydiols as precursors to secondary organic aerosol formation: acid-catalyzed reactive uptake studies with authentic compounds, Environ. Sci. Technol., 46, 250–258, 2011.
Mahowald, N.: Aerosol indirect effect on biogeochemical cycles and climate, Science, 334, 794–796, 2011.
Malloy, Q. G. J., Nakao, S., Qi, L., Austin, R., Stothers, C., Hagino, H., and Cocker, D. R.: Real-Time aerosol density determination utilizing a modified scanning mobility particle sizer aerosol particle mass analyzer system, Aerosol Sci. Technol., 43, 673–678, https://doi.org/10.1080/02786820902832960, 2009.
Maricq, M. M., Podsiadlik, D. H., and Chase, R. E.: Size distributions of motor vehicle exhaust PM: a comparison between ELPI and SMPS measurements, Aerosol Sci. Technol., 33, 239–260, 2000.
Martin, R. V, Brauer, M., van Donkelaar, A., Shaddick, G., Narain, U., and Dey, S.: No one knows which city has the highest concentration of fine particulate matter, Atmos. Environ., 3, 100040, https://doi.org/10.1016/j.aeaoa.2019.100040, 2019.
Massoli, P., Fortner, E. C., Canagaratna, M. R., Williams, L. R., Zhang, Q., Sun, Y., Schwab, J. J., Trimborn, A., Onasch, T. B., Demerjian, K. L., Kolb, C. E., Worsnop, D. R., and Jayne, J. T.: Pollution gradients and chemical characterization of particulatematter from vehicular traffic near major roadways: Results from the 2009 queens college air quality study in NYC, Aerosol Sci. Technol., 46, 1201–1218, https://doi.org/10.1080/02786826.2012.701784, 2012.
McMurry, P. H., Wang, X., Park, K., and Ehara, K.: The relationship between mass and mobility for atmospheric particles: A new technique for measuring particle density, Aerosol Sci. Technol., 36, 227–238, https://doi.org/10.1080/027868202753504083, 2002.
Mejía, J. F., Morawska, L., and Mengersen, K.: Spatial variation in particle number size distributions in a large metropolitan area, Atmos. Chem. Phys., 8, 1127–1138, https://doi.org/10.5194/acp-8-1127-2008, 2008.
Meldrum, K., Guo, C., Marczylo, E. L., Gant, T. W., Smith, R., and Leonard, M. O.: Mechanistic insight into the impact of nanomaterials on asthma and allergic airway disease, Part. Fibre Toxicol., 14, 1–35, https://doi.org/10.1186/s12989-017-0228-y, 2017.
Meyer, N. K. and Ristovski, Z. D.: Ternary nucleation as a mechanism for the production of diesel nanoparticles: Experimental analysis of the volatile and hygroscopic properties of diesel exhaust using the volatilization and humidification tandem differential mobility analyzer, Environ. Sci. Technol., 41, 7309–7314, 2007.
Mikhailov, E., Vlasenko, S., Rose, D., and Pöschl, U.: Mass-based hygroscopicity parameter interaction model and measurement of atmospheric aerosol water uptake, Atmos. Chem. Phys., 13, 717–740, https://doi.org/10.5194/acp-13-717-2013, 2013.
Mishra, V. K., Kumar, P., Van Poppel, M., Bleux, N., Frijns, E., Reggente, M., Berghmans, P., Panis, L. I., and Samson, R.: Wintertime spatio-temporal variation of ultrafine particles in a Belgian city, Sci. Total Environ., 431, 307–313, 2012.
Misra, A., Gaur, A., Bhattu, D., Ghosh, S., Dwivedi, A. K., Dalai, R., Paul, D., Gupta, T., Tare, V., Mishra, S. K., Singh, S., and Tripathi, S. N.: An overview of the physico-chemical characteristics of dust at Kanpur in the central Indo-Gangetic basin, Atmos. Environ., 97, 386–396, https://doi.org/10.1016/j.atmosenv.2014.08.043, 2014.
Moffet, R. C., de Foy, B., Molina, L. T., Molina, M. J., and Prather, K. A.: Measurement of ambient aerosols in northern Mexico City by single particle mass spectrometry, Atmos. Chem. Phys., 8, 4499–4516, https://doi.org/10.5194/acp-8-4499-2008, 2008.
Moise, T. and Rudich, Y.: Reactive uptake of ozone by aerosol-associated unsaturated fatty acids: kinetics, mechanism, and products, J. Phys. Chem. A, 106, 6469–6476, 2002.
Mönkkönen, P., Koponen, I. K., Lehtinen, K. E. J., Hämeri, K., Uma, R., and Kulmala, M.: Measurements in a highly polluted Asian mega city: observations of aerosol number size distribution, modal parameters and nucleation events, Atmos. Chem. Phys., 5, 57–66, https://doi.org/10.5194/acp-5-57-2005, 2005.
Morawska, L., Thomas, S., Bofinger, N., Wainwright, D., and Neale, D.: Comprehensive characterization of aerosols in a subtropical urban atmosphere: Particle size distribution and correlation with gaseous pollutants, Atmos. Environ., 32, 2467–2478, https://doi.org/10.1016/S1352-2310(98)00023-5, 1998.
Morawska, L., Ristovski, Z., Jayaratne, E. R., Keogh, D. U., and Ling, X.: Ambient nano and ultrafine particles from motor vehicle emissions: Characteristics, ambient processing and implications on human exposure, Atmos. Environ., 42, 8113–8138, https://doi.org/10.1016/j.atmosenv.2008.07.050, 2008.
Motlagh, N. H., Lagerspetz, E., Nurmi, P., Li, X., Varjonen, S., Mineraud, J., Siekkinen, M., Rebeiro-Hargrave, A., Hussein, T., and Petaja, T.: Toward massive scale air quality monitoring, IEEE Commun. Mag., 58, 54–59, 2020.
Nakao, S., Tang, P., Tang, X., Clark, C. H., Qi, L., Seo, E., Asa-Awuku, A., and Cocker III, D.: Density and elemental ratios of secondary organic aerosol: Application of a density prediction method, Atmos. Environ., 68, 273–277, 2013.
Neusüß, C., Wex, H., Birmili, W., Wiedensohler, A., Koziar, C., Busch, B., Brüggemann, E., Gnauk, T., Ebert, M., and Covert, D. S.: Characterization and parameterization of atmospheric particle number-, mass-, and chemical-size distributions in central Europe during LACE 98 and MINT, J. Geophys. Res.-Atmos., 107, 1–13, https://doi.org/10.1029/2001JD000514, 2002.
Nieto, P. J. G., García, B. A., Diaz, J. M. F., and Brana, M. A. R.: Parametric study of selective removal of atmospheric aerosol by below-cloud scavenging, Atmos. Environ., 28, 2335–2342, 1994.
Ning, Z., Hudda, N., Daher, N., Kam, W., Herner, J., Kozawa, K., Mara, S., and Sioutas, C.: Impact of roadside noise barriers on particle size distributions and pollutants concentrations near freeways, Atmos. Environ., 44, 3118–3127, https://doi.org/10.1016/j.atmosenv.2010.05.033, 2010.
Oberdörster, G.: Pulmonary effects of inhaled ultrafine particles, Int. Arch. Occup. Environ. Health, 74, 1–8, https://doi.org/10.1007/s004200000185, 2001.
Oberdörster, G., Sharp, Z., Atudorei, V., Elder, A., Gelein, R., Kreyling, W., and Cox, C.: Translocation of inhaled ultrafine particles to the brain, Inhal. Toxicol., 16, 437–445, https://doi.org/10.1080/08958370490439597, 2004.
Oberdörster, G., Oberdörster, E., and Oberdörster, J.: Nanotoxicology: An emerging discipline evolving from studies of ultrafine particles, Environ. Health Perspect., 113, 823–839, https://doi.org/10.1289/ehp.7339, 2005.
Oberdürster, G.: Toxicology of ultrafine particles: in vivo studies, Philos. Trans. R. Soc. London. Ser. A Math. Phys. Eng. Sci., 358, 2719–2740, 2000.
Ogulei, D., Hopke, P. K., Ferro, A. R., and Jaques, P. A.: Factor analysis of submicron particle size distributions near a major United States–Canada trade bridge, J. Air Waste Manag. Assoc., 57, 190–203, https://doi.org/10.1080/10473289.2007.10465316, 2007.
Olfert, J. S., Symonds, J. P. R., and Collings, N.: The effective density and fractal dimension of particles emitted from a light-duty diesel vehicle with a diesel oxidation catalyst, J. Aerosol Sci., 38, 69–82, https://doi.org/10.1016/j.jaerosci.2006.10.002, 2007.
Pagels, J., Khalizov, A. F., McMurry, P. H., and Zhang, R. Y.: Processing of soot by controlled sulphuric acid and water condensation mass and mobility relationship, Aerosol Sci. Technol., 43, 629–640, https://doi.org/10.1080/02786820902810685, 2009.
Pajunoja, A., Malila, J., Hao, L., Joutsensaari, J., Lehtinen, K. E. J., and Virtanen, A.: Estimating the viscosity range of SOA particles based on their coalescence time, Aerosol Sci. Technol., 48, i–iv, https://doi.org/10.1080/02786826.2013.870325, 2014.
Pakkanen, T. A., Loukkola, K., Korhonen, C. H., Aurela, M., Mäkelä, T., Hillamo, R. E., Aarnio, P., Koskentalo, T., Kousa, A., and Maenhaut, W.: Sources and chemical composition of atmospheric fine and coarse particles in the Helsinki area, Atmos. Environ., 35, 5381–5391, https://doi.org/10.1016/S1352-2310(01)00307-7, 2001.
Pant, P. and Harrison, R. M.: Estimation of the contribution of road traffic emissions to particulate matter concentrations from field measurements: A review, Atmos. Environ., 77, 78–97, https://doi.org/10.1016/j.atmosenv.2013.04.028, 2013.
Park, K., Cao, F., Kittelson, D. B., and McMurry, P. H.: Relationship between particle mass and mobility for diesel exhaust particles, Environ. Sci. Technol., 37, 577–583, https://doi.org/10.1021/es025960v, 2003.
Peng, J. F., Hu, M., Wang, Z. B., Huang, X. F., Kumar, P., Wu, Z. J., Guo, S., Yue, D. L., Shang, D. J., Zheng, Z., and He, L. Y.: Submicron aerosols at thirteen diversified sites in China: size distribution, new particle formation and corresponding contribution to cloud condensation nuclei production, Atmos. Chem. Phys., 14, 10249–10265, https://doi.org/10.5194/acp-14-10249-2014, 2014.
Pieters, N., Koppen, G., van Poppel, M., de Prins, S., Cox, B., Dons, E., Nelen, V., Panis, L. I., Plusquin, M., Schoeters, G., and Nawrot, T. S.: Blood pressure and same-day exposure to air pollution at school: Associations with nano-sized to coarse PM in children, Environ. Health Perspect., 123, 737–742, https://doi.org/10.1289/ehp.1408121, 2015.
Pietropaoli, A. P., Frampton, M. W., Hyde, R. W., Morrow, P. E., Oberdörster, G., Cox, C., Speers, D. M., Frasier, L. M., Chalupa, D. C., Huang, L. S., and Utell, M. J.: Pulmonary function, diffusing capacity, and inflammation in healthy and asthmatic subjects exposed to ultrafine particles, Inhal. Toxicol., 16, 59–72, https://doi.org/10.1080/08958370490443079, 2004.
Pitz, M., Birmili, W., Schmid, O., Peters, A., Wichmann, H. E., and Cyrys, J.: Quality control and quality assurance for particle size distribution measurements at an urban monitoring station in Augsburg, Germany, J. Environ. Monit., 10, 1017–1024, https://doi.org/10.1039/b807264g, 2008a.
Pitz, M., Schmid, O., Heinrich, J., Birmili, W., Maguhn, J., Zimmermann, R., Wichmann, H. E., Peters, A., and Cyrys, J.: Seasonal and diurnal variation of PM2.5 apparent particle density in urban air in Augsburg, Germany, Environ. Sci. Technol., 42, 5087–5093, 2008b.
Qi, X. M., Ding, A. J., Nie, W., Petäjä, T., Kerminen, V.-M., Herrmann, E., Xie, Y. N., Zheng, L. F., Manninen, H., Aalto, P., Sun, J. N., Xu, Z. N., Chi, X. G., Huang, X., Boy, M., Virkkula, A., Yang, X.-Q., Fu, C. B., and Kulmala, M.: Aerosol size distribution and new particle formation in the western Yangtze River Delta of China: 2 years of measurements at the SORPES station, Atmos. Chem. Phys., 15, 12445–12464, https://doi.org/10.5194/acp-15-12445-2015, 2015.
Qiao, K., Wu, Z., Pei, X., Liu, Q., Shang, D., Zheng, J., Du, Z., Zhu, W., Wu, Y., Lou, S., Guo, S., Chan, C. K., Pathak, R. K., Hallquist, M., and Hu, M.: Size-resolved effective density of submicron particles during summertime in the rural atmosphere of Beijing, China, J. Environ. Sci. (China), 73, 69–77, https://doi.org/10.1016/j.jes.2018.01.012, 2018.
Rawat, V. K., Buckley, D. T., Kimoto, S., Lee, M. H., Fukushima, N., and Hogan, C. J.: Two dimensional size-mass distribution function inversion from differential mobility analyzer-aerosol particle mass analyzer (DMA-APM) measurements, J. Aerosol Sci., 92, 70–82, https://doi.org/10.1016/j.jaerosci.2015.11.001, 2016.
Reid, J. S. and Hobbs, P. V: Physical and optical properties of young smoke from individual biomass fires in Brazil, J. Geophys. Res.-Atmos., 103, 32013–32030, 1998.
Reid, J. S., Jonsson, H. H., Maring, H. B., Smirnov, A., Savoie, D. L., Cliff, S. S., Reid, E. A., Livingston, J. M., Meier, M. M., Dubovik, O., and Tsay, S.-C.: Comparison of size and morphological measurements of coarse mode dust particles from Africa, J. Geophys. Res., 108, 8593, https://doi.org/10.1029/2002JD002485, 2003.
Reid, J. S., Koppmann, R., Eck, T. F., and Eleuterio, D. P.: A review of biomass burning emissions part II: intensive physical properties of biomass burning particles, Atmos. Chem. Phys., 5, 799–825, https://doi.org/10.5194/acp-5-799-2005, 2005.
Riemer, N., Ault, A. P., West, M., Craig, R. L., and Curtis, J. H.: Aerosol Mixing State: Measurements, Modeling, and Impacts, Rev. Geophys., 57, 187–249, https://doi.org/10.1029/2018RG000615, 2019.
Rissler, J., Vestin, A., Swietlicki, E., Fisch, G., Zhou, J., Artaxo, P., and Andreae, M. O.: Size distribution and hygroscopic properties of aerosol particles from dry-season biomass burning in Amazonia, Atmos. Chem. Phys., 6, 471–491, https://doi.org/10.5194/acp-6-471-2006, 2006.
Rissler, J., Messing, M. E., Malik, A. I., Nilsson, P. T., Nordin, E. Z., Bohgard, M., Sanati, M., and Pagels, J. H.: Effective density characterization of soot agglomerates from various sources and comparison to aggregation theory, Aerosol Sci. Technol., 47, 792–805, https://doi.org/10.1080/02786826.2013.791381, 2013.
Rissler, J., Nordin, E. Z., Eriksson, A. C., Nilsson, P. T., Frosch, M., Sporre, M. K., Wierzbicka, A., Svenningsson, B., Löndahl, J., Messing, M. E., Sjogren, S., Hemmingsen, J. G., Loft, S., Pagels, J. H., and Swietlicki, E.: Effective density and mixing state of aerosol particles in a near-traffic urban environment, Environ. Sci. Technol., 48, 6300–6308, https://doi.org/10.1021/es5000353, 2014.
Rogge, W. F., Hildemann, L. M., Mazurek, M. A., Cass, G. R., and Simoneit, B. R. T.: Sources of fine organic aerosol. 3. Road dust, tire debris, and organometallic brake lining dust: roads as sources and sinks, Environ. Sci. Technol., 27, 1892–1904, 1993.
Rose, D., Nowak, A., Achtert, P., Wiedensohler, A., Hu, M., Shao, M., Zhang, Y., Andreae, M. O., and Pöschl, U.: Cloud condensation nuclei in polluted air and biomass burning smoke near the mega-city Guangzhou, China – Part 1: Size-resolved measurements and implications for the modeling of aerosol particle hygroscopicity and CCN activity, Atmos. Chem. Phys., 10, 3365–3383, https://doi.org/10.5194/acp-10-3365-2010, 2010.
Rychlik, K. A., Secrest, J. R., Lau, C., Pulczinski, J., Zamora, M. L., Leal, J., Langley, R., Myatt, L. G., Raju, M., and Chang, R. C.-A.: In utero ultrafine particulate matter exposure causes offspring pulmonary immunosuppression, Proc. Natl. Acad. Sci., 116, 3443–3448, 2019.
Saari, S. E., Niemi, J., Rönkkö, T., Kuuluvainen, H., Järvinen, A., Pirjola, L., Aurela, M., Hillamo, R., and Keskinen, J.: Seasonal and diurnal variations of fluorescent bioaerosol concentration and size distribution in the urban environment, Aerosol Air Qual. Res., 15, 572–581, https://doi.org/10.4209/aaqr.2014.10.0258, 2015.
Sakamoto, K. M., Laing, J. R., Stevens, R. G., Jaffe, D. A., and Pierce, J. R.: The evolution of biomass-burning aerosol size distributions due to coagulation: dependence on fire and meteorological details and parameterization, Atmos. Chem. Phys., 16, 7709–7724, https://doi.org/10.5194/acp-16-7709-2016, 2016.
Salma, I., Borsós, T., Weidinger, T., Aalto, P., Hussein, T., Dal Maso, M., and Kulmala, M.: Production, growth and properties of ultrafine atmospheric aerosol particles in an urban environment, Atmos. Chem. Phys., 11, 1339–1353, https://doi.org/10.5194/acp-11-1339-2011, 2011.
Seinfeld, J. H. and Pandis, S. N.: Atmospheric chemistry and physics: from air pollution to climate change, John Wiley & Sons, New York, USA, 2012.
Shen, X., Sun, J., Zhang, X., Zhang, Y., Zhang, L., and Fan, R.: Key features of new particle formation events at background sites in China and their influence on cloud condensation nuclei, Front. Environ. Sci. Eng., 10, 5, https://doi.org/10.1007/s11783-016-0833-2, 2016a.
Shen, X. J., Sun, J. Y., Zhang, X. Y., Zhang, Y. M., Zhang, L., Fan, R. X., Zhang, Z. X., Zhang, X. L., Zhou, H. G., and Zhou, L. Y.: The influence of emission control on particle number size distribution and new particle formation during China's V-Day parade in 2015, Sci. Total Environ., 573, 409–419, 2016b.
Shi, J. P. and Harrison, R. M.: Investigation of ultrafine particle formation during diesel exhaust dilution, Environ. Sci. Technol., 33, 3730–3736, 1999.
Shi, J. P., Khan, A. A., and Harrison, R. M.: Measurements of ultrafine particle concentration and size distribution in the urban atmosphere, Sci. Total Environ., 235, 51–64, https://doi.org/10.1016/S0048-9697(99)00189-8, 1999.
Shi, J. P., Harrison, R. M., and Evans, D.: Comparison of ambient particle surface area measurement by epiphaniometer and SMPS/APS, Atmos. Environ., 35, 6193–6200, https://doi.org/10.1016/S1352-2310(01)00382-X, 2001.
Shiraiwa, M., Ueda, K., Pozzer, A., Lammel, G., Kampf, C. J., Fushimi, A., Enami, S., Arangio, A. M., Fröhlich-Nowoisky, J., Fujitani, Y., Furuyama, A., Lakey, P. S. J., Lelieveld, J., Lucas, K., Morino, Y., Pöschl, U., Takahama, S., Takami, A., Tong, H., Weber, B., Yoshino, A., and Sato, K.: Aerosol health effects from molecular to global scales, Environ. Sci. Technol., 51, 13545–13567, https://doi.org/10.1021/acs.est.7b04417, 2017.
Sioutas, C., Delfino, R. J., and Singh, M.: Exposure assessment for atmospheric Ultrafine Particles (UFPs) and implications in epidemiologic research, Environ. Health Perspect., 113, 947–955, https://doi.org/10.1289/ehp.7939, 2005.
Song, S., Wu, Y., Jiang, J., Yang, L., Cheng, Y., and Hao, J.: Chemical characteristics of size-resolved PM2.5at a roadside environment in Beijing, China, Environ. Pollut., 161, 215–221, https://doi.org/10.1016/j.envpol.2011.10.014, 2012.
Sowlat, M. H., Hasheminassab, S., and Sioutas, C.: Source apportionment of ambient particle number concentrations in central Los Angeles using positive matrix factorization (PMF), Atmos. Chem. Phys., 16, 4849–4866, https://doi.org/10.5194/acp-16-4849-2016, 2016.
Stanier, C. O., Khlystov, A. Y., and Pandis, S. N.: Nucleation events during the Pittsburgh Air Quality Study: description and relation to key meteorological, gas phase, and aerosol parameters special issue of aerosol science and technology on findings from the fine particulate matter supersites program, Aerosol Sci. Technol., 38, 253–264, 2004.
Swietlicki, E., Hansson, H. C., Hämeri, K., Svenningsson, B., Massling, A., Mcfiggans, G., Mcmurry, P. H., Petäjä, T., Tunved, P., Gysel, M., Topping, D., Weingartner, E., Baltensperger, U., Rissler, J., Wiedensohler, A., and Kulmala, M.: Hygroscopic properties of submicrometer atmospheric aerosol particles measured with H-TDMA instruments in various environments – A review, Tellus, Ser. B Chem. Phys. Meteorol., 60B, 432–469, https://doi.org/10.1111/j.1600-0889.2008.00350.x, 2008.
Tang, I. N.: Chemical and size effects of hygroscopic aerosols on light scattering coefficients, J. Geophys. Res.-Atmos., 101, 19245–19250, 1996.
Tang, M. J., Thieser, J., Schuster, G., and Crowley, J. N.: Uptake of NO3 and N2O5 to Saharan dust, ambient urban aerosol and soot: a relative rate study, Atmos. Chem. Phys., 10, 2965–2974, https://doi.org/10.5194/acp-10-2965-2010, 2010.
Thimmaiah, D., Hovorka, J., and Hopke, P. K.: Source apportionment of winter submicron Prague aerosols from combined particle number size distribution and gaseous composition data, Aerosol Air Qual. Resarch, 9, 209–236, 2009.
Thorpe, A. and Harrison, R. M.: Sources and properties of non-exhaust particulate matter from road traffic: A review, Sci. Total Environ., 400, 270–282, https://doi.org/10.1016/j.scitotenv.2008.06.007, 2008.
Thunis, P., Degraeuwe, B., Pisoni, E., Trombetti, M., Peduzzi, E., Belis, C. A., Wilson, J., and Vignati, E.: Urban PM2.5 atlas – air quality in European cities, Publications Office of the European Union, Luxembourg, JRC108595, https://doi.org/10.2760/336669, 2017.
Tröstl, J., Chuang, W. K., Gordon, H., Heinritzi, M., Yan, C., Molteni, U., Ahlm, L., Frege, C., Bianchi, F., and Wagner, R.: The role of low-volatility organic compounds in initial particle growth in the atmosphere, Nature, 533, 527–531, https://doi.org/10.1038/nature18271, 2016.
Tseng, E., Ho, W.-C., Lin, M.-H., Cheng, T.-J., Chen, P.-C., and Lin, H.-H.: Chronic exposure to particulate matter and risk of cardiovascular mortality: cohort study from Taiwan, BMC Public Health, 15, 936, https://doi.org/10.1186/s12889-015-2272-6, 2015.
Tsiouri, V., Kakosimos, K. E., and Kumar, P.: Concentrations, sources and exposure risks associated with particulate matter in the Middle East Area – a review, Air Qual. Atmos. Heal., 8, 67–80, https://doi.org/10.1007/s11869-014-0277-4, 2015.
Tuch, T. M., Wehner, B., Pitz, M., Cyrys, J., Heinrich, J., Kreyling, W. G., Wichmann, H. E., and Wiedensohler, A.: Long-term measurements of size-segregated ambient aerosol in two German cities located 100 km apart, Atmos. Environ., 37, 4687–4700, https://doi.org/10.1016/j.atmosenv.2003.07.010, 2003.
Tuch, T. M., Herbarth, O., Franck, U., Peters, A., Wehner, B., Wiedensohler, A., and Heintzenberg, J.: Weak correlation of ultrafine aerosol particle concentrations < 800 nm between two sites within one city, J. Expo. Sci. Environ. Epidemiol., 16, 486–490, https://doi.org/10.1038/sj.jes.7500469, 2006.
Tunved, P., Ström, J., and Hansson, H.-C.: An investigation of processes controlling the evolution of the boundary layer aerosol size distribution properties at the Swedish background station Aspvreten, Atmos. Chem. Phys., 4, 2581–2592, https://doi.org/10.5194/acp-4-2581-2004, 2004.
Väkevä, M., Hämeri, K., Puhakka, T., Nilsson, E. D., Hohti, H., and Mäkelä, J. M.: Effects of meteorological processes on aerosol particle size distribution in an urban background area, J. Geophys. Res.-Atmos., 105, 9807–9821, https://doi.org/10.1029/1999JD901143, 2000.
Valavanidis, A., Fiotakis, K., and Vlachogianni, T.: Airborne particulate matter and human health: Toxicological assessment and importance of size and composition of particles for oxidative damage and carcinogenic mechanisms, J. Environ. Sci. Heal. – Part C Environ. Carcinog. Ecotoxicol. Rev., 26, 339–362, https://doi.org/10.1080/10590500802494538, 2008.
Van Donkelaar, A., Martin, R. V, Brauer, M., Kahn, R., Levy, R., Verduzco, C., and Villeneuve, P. J.: Global estimates of ambient fine particulate matter concentrations from satellite-based aerosol optical depth: development and application, Environ. Health Perspect., 118, 847–855, 2010.
Venecek, M. A., Yu, X., and Kleeman, M. J.: Predicted ultrafine particulate matter source contribution across the continental United States during summertime air pollution events, Atmos. Chem. Phys., 19, 9399–9412, https://doi.org/10.5194/acp-19-9399-2019, 2019.
Virtanen, A., Rönkkö, T., Kannosto, J., Ristimäki, J., Mäkelä, J. M., Keskinen, J., Pakkanen, T., Hillamo, R., Pirjola, L., and Hämeri, K.: Winter and summer time size distributions and densities of traffic-related aerosol particles at a busy highway in Helsinki, Atmos. Chem. Phys., 6, 2411–2421, https://doi.org/10.5194/acp-6-2411-2006, 2006.
Virtanen, A., Joutsensaari, J., Koop, T., Kannosto, J., Yli-Pirilä, P., Leskinen, J., Mäkelä, J. M., Holopainen, J. K., Pöschl, U., Kulmala, M., Worsnop, D. R., and Laaksonen, A.: An amorphous solid state of biogenic secondary organic aerosol particles, Nature, 467, 824–827, https://doi.org/10.1038/nature09455, 2010.
Vu, T. V., Delgado-Saborit, J. M., and Harrison, R. M.: Review: Particle number size distributions from seven major sources and implications for source apportionment studies, Atmos. Environ., 122, 114–132, https://doi.org/10.1016/j.atmosenv.2015.09.027, 2015.
Wang, L., Khalizov, A. F., Zheng, J., Xu, W., Ma, Y., Lal, V., and Zhang, R.: Atmospheric nanoparticles formed from heterogeneous reactions of organics, Nat. Geosci., 3, 238–242, https://doi.org/10.1038/ngeo778, 2010.
Wang, Z. B., Hu, M., Sun, J. Y., Wu, Z. J., Yue, D. L., Shen, X. J., Zhang, Y. M., Pei, X. Y., Cheng, Y. F., and Wiedensohler, A.: Characteristics of regional new particle formation in urban and regional background environments in the North China Plain, Atmos. Chem. Phys., 13, 12495–12506, https://doi.org/10.5194/acp-13-12495-2013, 2013a.
Wang, Z. B., Hu, M., Wu, Z. J., Yue, D. L., He, L. Y., Huang, X. F., Liu, X. G., and Wiedensohler, A.: Long-term measurements of particle number size distributions and the relationships with air mass history and source apportionment in the summer of Beijing, Atmos. Chem. Phys., 13, 10159–10170, https://doi.org/10.5194/acp-13-10159-2013, 2013b.
Watson, J. G., Chow, J. C., Lowenthal, D. H., Stolzenburg, M. R., Kreisberg, N. M., and Hering, S. V.: Particle size relationships at the Fresno Supersite, J. Air Waste Manag. Assoc., 52, 822–827, https://doi.org/10.1080/10473289.2002.10470817, 2002.
Wehner, B. and Wiedensohler, A.: Long term measurements of submicrometer urban aerosols: statistical analysis for correlations with meteorological conditions and trace gases, Atmos. Chem. Phys., 3, 867–879, https://doi.org/10.5194/acp-3-867-2003, 2003.
Wehner, B., Birmili, W., Gnauk, T., and Wiedensohler, A.: Particle number size distributions in a street canyon and their transformation into the urban background: Measurements and a simple model study, Atmos. Environ., 36, 2215–2223, https://doi.org/10.1016/S1352-2310(02)00174-7, 2002.
Wehner, B., Philippin, S., Wiedensohler, A., Scheer, V., and Vogt, R.: Variability of non-volatile fractions of atmospheric aerosol particles with traffic influence, Atmos. Environ., 38, 6081–6090, https://doi.org/10.1016/j.atmosenv.2004.08.015, 2004a.
Wehner, B., Wiedensohler, A., Tuch, T. M., Wu, Z. J., Hu, M., Slanina, J., and Kiang, C. S.: Variability of the aerosol number size distribution in Beijing, China: New particle formation, dust storms, and high continental background, Geophys. Res. Lett., 31, 1–4, https://doi.org/10.1029/2004GL021596, 2004b.
Wehner, B., Birmili, W., Ditas, F., Wu, Z., Hu, M., Liu, X., Mao, J., Sugimoto, N., and Wiedensohler, A.: Relationships between submicrometer particulate air pollution and air mass history in Beijing, China, 2004–2006, Atmos. Chem. Phys., 8, 6155–6168, https://doi.org/10.5194/acp-8-6155-2008, 2008.
Weichenthal, S., Bai, L., Hatzopoulou, M., Van Ryswyk, K., Kwong, J. C., Jerrett, M., Van Donkelaar, A., Martin, R. V., Burnett, R. T., Lu, H., and Chen, H.: Long-term exposure to ambient ultrafine particles and respiratory disease incidence in in Toronto, Canada: A cohort study, Environ. Heal. A Glob. Access Sci. Source, 16, 1–11, https://doi.org/10.1186/s12940-017-0276-7, 2017.
Weingartner, E., Burtscher, H., and Baltensperger, U.: Hygroscopic properties of carbon and diesel soot particles, Atmos. Environ., 31, 2311–2327, 1997.
West, J. J., Cohen, A., Dentener, F., Brunekreef, B., Zhu, T., Armstrong, B., Bell, M. L., Brauer, M., Carmichael, G., and Costa, D. L.: What we breathe impacts our health: improving understanding of the link between air pollution and health, Environ. Sci. Technol., 50, 4895–4904, https://doi.org/10.1021/acs.est.5b03827, 2016.
Wong, C. M., Lai, H. K., Tsang, H., Thach, T. Q., Thomas, G. N., Lam, K. B. H., Chan, K. P., Yang, L., Lau, A. K. H., and Ayres, J. G.: Satellite-based estimates of long-term exposure to fine particles and association with mortality in elderly Hong Kong residents, Environ. Health Perspect., 123, 1167–1172, 2015.
Wu, Z., Hu, M., Lin, P., Liu, S., Wehner, B., and Wiedensohler, A.: Particle number size distribution in the urban atmosphere of Beijing, China, Atmos. Environ., 42, 7967–7980, https://doi.org/10.1016/j.atmosenv.2008.06.022, 2008.
Xiao, S., Wang, M. Y., Yao, L., Kulmala, M., Zhou, B., Yang, X., Chen, J. M., Wang, D. F., Fu, Q. Y., Worsnop, D. R., and Wang, L.: Strong atmospheric new particle formation in winter in urban Shanghai, China, Atmos. Chem. Phys., 15, 1769–1781, https://doi.org/10.5194/acp-15-1769-2015, 2015.
Xie, Y., Ye, X., Ma, Z., Tao, Y., Wang, R., Zhang, C., Yang, X., Chen, J., and Chen, H.: Insight into winter haze formation mechanisms based on aerosol hygroscopicity and effective density measurements, Atmos. Chem. Phys., 17, 7277–7290, https://doi.org/10.5194/acp-17-7277-2017, 2017.
Yang, F., Chen, H., Du, J., Yang, X., Gao, S., Chen, J., and Geng, F.: Evolution of the mixing state of fine aerosols during haze events in Shanghai, Atmos. Res., 104, 193–201, 2012.
Ye, X., Ma, Z., Hu, D., Yang, X., and Chen, J.: Size-resolved hygroscopicity of submicrometer urban aerosols in Shanghai during wintertime, Atmos. Res., 99, 353–364, https://doi.org/10.1016/j.atmosres.2010.11.008, 2011.
Yin, Z., Ye, X., Jiang, S., Tao, Y., Shi, Y., Yang, X., and Chen, J.: Size-resolved effective density of urban aerosols in Shanghai, Atmos. Environ., 100, 133–140, https://doi.org/10.1016/j.atmosenv.2014.10.055, 2015.
Yu, F., Wang, Q., Yan, Q., Jiang, N., Wei, J., Wei, Z., and Yin, S.: Particle size distribution, chemical composition and meteorological factor analysis: A case study during wintertime snow cover in Zhengzhou, China, Atmos. Res., 202, 140–147, https://doi.org/10.1016/j.atmosres.2017.11.016, 2018.
Yue, D., Hu, M., Wu, Z., Wang, Z., Guo, S., Wehner, B., Nowak, A., Achtert, P., Wiedensohler, A., Jung, J., Kim, Y. J., and Liu, S.: Characteristics of aerosol size distributions and new particle formation in the summer in Beijing, J. Geophys. Res.-Atmos., 114, 1–13, https://doi.org/10.1029/2008JD010894, 2009.
Yue, D. L., Hu, M., Wu, Z. J., Guo, S., Wen, M. T., Nowak, A., Wehner, B., Wiedensohler, A., Takegawa, N., Kondo, Y., Wang, X. S., Li, Y. P., Zeng, L. M., and Zhang, Y. H.: Variation of particle number size distributions and chemical compositions at the urban and downwind regional sites in the Pearl River Delta during summertime pollution episodes, Atmos. Chem. Phys., 10, 9431–9439, https://doi.org/10.5194/acp-10-9431-2010, 2010.
Yue, D. L., Hu, M., Wang, Z. B., Wen, M. T., Guo, S., Zhong, L. J., Wiedensohler, A., and Zhang, Y. H.: Comparison of particle number size distributions and new particle formation between the urban and rural sites in the PRD region, China, Atmos. Environ., 76, 181–188, https://doi.org/10.1016/j.atmosenv.2012.11.018, 2013.
Zelenyuk, A., Yang, J., Song, C., Zaveri, R. A., and Imre, D.: A new real-time method for determining particles' sphericity and density: application to secondary organic aerosol formed by ozonolysis of α-pinene, Environ. Sci. Technol., 42, 8033–8038, 2008.
Zhang, H., Hu, D., Chen, J., Ye, X., Wang, S. X., Hao, J. M., Wang, L., Zhang, R., and An, Z.: Particle size distribution and polycyclic aromatic hydrocarbons emissions from agricultural crop residue burning, Environ. Sci. Technol., 45, 5477–5482, 2011.
Zhang, K., O'Donnell, D., Kazil, J., Stier, P., Kinne, S., Lohmann, U., Ferrachat, S., Croft, B., Quaas, J., Wan, H., Rast, S., and Feichter, J.: The global aerosol-climate model ECHAM-HAM, version 2: sensitivity to improvements in process representations, Atmos. Chem. Phys., 12, 8911–8949, https://doi.org/10.5194/acp-12-8911-2012, 2012.
Zhang, K. M., Wexler, A. S., Zhu, Y. F., Hinds, W. C., and Sioutas, C.: Evolution of particle number distribution near roadways. Part II: the “Road-to-Ambient” process, Atmos. Environ., 38, 6655–6665, 2004.
Zhang, W., Zhuang, G., Guo, J., Xu, D., Wang, W., Baumgardner, D., Wu, Z., and Yang, W.: Sources of aerosol as determined from elemental composition and size distributions in Beijing, Atmos. Res., 95, 197–209, 2010.
Zheng, X., Liu, X., Zhao, F., Duan, F., Yu, T., and Cachier, H.: Seasonal characteristics of biomass burning contribution to Beijing aerosol, Sci. China Ser. B Chem., 48, 481–488, 2005.
Zhu, Y., Hinds, W. C., Kim, S., and Sioutas, C.: Concentration and size distribution of ultrafine particles near a major highway, J. Air Waste Manag. Assoc., 52, 1032–1042, https://doi.org/10.1080/10473289.2002.10470842, 2002a.
Zhu, Y., Hinds, W. C., Kim, S., Shen, S., and Sioutas, C.: Study of ultrafine particles near a major highway with heavy-duty diesel traffic, Atmos. Environ., 36, 4323–4335, 2002b.
Zwozdziak, A., Gini, M. I., Samek, L., Rogula-Kozlowska, W., Sowka, I., and Eleftheriadis, K.: Implications of the aerosol size distribution modal structure of trace and major elements on human exposure, inhaled dose and relevance to the PM2.5 and PM10 metrics in a European pollution hotspot urban area, J. Aerosol Sci., 103, 38–52, 2017.
- Abstract
- Introduction
- Methodology for establishing the current state of knowledge on urban aerosol PSD observations
- Geographical trends in size-resolved urban aerosol effective densities
- Methodology for analyzing urban aerosol PSD observations
- Urban aerosol PSD observations around the globe: an overview of existing data
- Urban aerosol PSDs: from number to mass
- Uncertainties in the extraction and lognormal fitting of urban aerosol PSDs
- Framing future research directions for urban aerosol PSD observations at a global scale
- Appendix A: List of symbols and abbreviations
- Code availability
- Data availability
- Author contributions
- Competing interests
- Acknowledgements
- Financial support
- Review statement
- References
- Supplement
- Article
(6702 KB) - Full-text XML
- Abstract
- Introduction
- Methodology for establishing the current state of knowledge on urban aerosol PSD observations
- Geographical trends in size-resolved urban aerosol effective densities
- Methodology for analyzing urban aerosol PSD observations
- Urban aerosol PSD observations around the globe: an overview of existing data
- Urban aerosol PSDs: from number to mass
- Uncertainties in the extraction and lognormal fitting of urban aerosol PSDs
- Framing future research directions for urban aerosol PSD observations at a global scale
- Appendix A: List of symbols and abbreviations
- Code availability
- Data availability
- Author contributions
- Competing interests
- Acknowledgements
- Financial support
- Review statement
- References
- Supplement