the Creative Commons Attribution 4.0 License.
the Creative Commons Attribution 4.0 License.
 | 09 Jun 2021
Substantial changes in gaseous pollutants and chemical compositions in fine particles in the North China Plain during the COVID-19 lockdown period: anthropogenic vs. meteorological influences
Rui Li
Yilong Zhao
Hongbo Fu
Meng Peng
Chunying Wang
The rapid response to the COVID-19 pandemic led to unprecedented decreases in economic activities, thereby reducing the pollutant emissions. A random forest (RF) model was applied to determine the respective contributions of meteorology and anthropogenic emissions to the changes in air quality. The result suggested that the strict lockdown measures significantly decreased primary components such as Cr (−67 %) and Fe (−61 %) in PM2.5 (p<0.01), whereas the higher relative humidity (RH) and NH3 level and the lower air temperature (T) remarkably enhanced the production of secondary aerosol, including (29 %), (29 %), and (21 %) (p<0.05). The positive matrix factorization (PMF) result suggested that the contribution ratios of secondary formation (SF), industrial process (IP), biomass burning (BB), coal combustion (CC), and road dust (RD) changed from 36 %, 27 %, 21 %, 12 %, and 4 % before the COVID-19 outbreak to 44 %, 20 %, 20 %, 9 %, and 7 %, respectively. The rapid increase in the contribution ratio derived from SF to PM2.5 implied that the intermittent haze events during the COVID-19 period were characterized by secondary aerosol pollution, which was mainly contributed by the unfavorable meteorological conditions and high NH3 level.
- Article
(3251 KB) - Full-text XML
-
Supplement
(1863 KB) - BibTeX
- EndNote


In December 2019, a cluster of pneumonia cases with unknown etiology were first reported in Wuhan and quickly spread around the world (F. Wu et al., 2020). The continuous global outbreak of the coronavirus disease (COVID-19), declared as a public health emergency of international concern by the World Health Organization, resulted in unprecedented public health responses in many countries including lockdown, travel restrictions, and quarantines (Griffiths and Woodyatt, 2020; Horowitz and Freeman, 2020). On 23 January 2020, the Chinese government imposed a lockdown in Wuhan and many surrounding cities in Hubei Province in order to prevent the spread of the epidemic. Afterwards, many similar measures including blocked roads, shutdown of factories, restricted citizen mobility, and checkpoints were soon extended to other cities throughout the entire country. During this period, energy production by coal-fired power plants only remained at two-thirds of the levels of the same periods in preceding years (Chang et al., 2020). Additionally, the transport volume was reduced by more than 70 % due to the COVID-19 outbreak (Chang et al., 2020). These drastic government-enforced lockdown measures substantially decreased the pollutant emissions and at least partly improved local air quality. S. Feng et al. (2020) confirmed that the COVID-19 lockdown led to more than a 70 % reduction in NOx emissions in many large cities over China. Correspondingly, the concentrations of PM2.5 and NO2 decreased by 35 % and 60 %, respectively (Shi and Brasseur, 2020). The natural experiment provided an unprecedented opportunity to explore the potential for emission reduction and the corresponding response of air quality.
A growing body of studies assessed the response of PM2.5 and gaseous pollutants to the COVID-19 lockdown and found that these stringent restrictions resulted in significant decreases in these pollutant (e.g., PM2.5, NO2, and CO) concentrations (Miyazaki et al., 2020; Marlier et al., 2020). However, some haze events still occurred during this period, especially in East China. Huang et al. (2020) employed the chemical transport models (CTMs) to infer that these extraordinary findings might be attributable to enhanced secondary pollution. Understanding that the formation mechanism of puzzle haze events depending on CTMs alone might not be very robust, it was highly imperative to perform more field observations to analyze the temporal variations in chemical compositions, especially the secondary ions (e.g., , ) in PM2.5 before and after the COVID-19 outbreak, and then to validate these inferences.
To date, only several field observations analyzed the temporal variations in chemical components in fine particles during the COVID-19 lockdown period. Chang et al. (2020) observed that a remarkably enhanced nitrate formation in the Yangtze River Delta (YRD) counteracted the decreases in primary components in fine particles, which was in good agreement with the modeling result drawn by Huang et al. (2020). In contrast, Xu et al. (2020) found that the marked decreases in fine particle concentrations in Lanzhou during the COVID-19 lockdown period was mainly contributed by the lower production rate for secondary aerosols. Under the condition of similar emission control measures, the polarized conclusion might be associated with the local meteorology. He et al. (2017) demonstrated that meteorology might explain more than 70 % of variances in daily average pollutant levels over China during 2014–2015. Additionally, X. Zhang et al. (2020) also revealed that the release of primary pollutants and the generation of reactive semi-volatile products partitioned between gas and aerosol phases were strongly dependent on the temperature and relative humidity (RH). Thus, in order to accurately assess the effects of lockdown measures on air quality and to reveal the key driver of the haze paradox, it was necessary to isolate the contribution of meteorology. Unfortunately, to date, the respective contributions of emission and meteorology to chemical compositions in PM2.5 during the COVID-19 period have not been quantified yet in most pioneering studies (Chang et al., 2020; Huang et al., 2020; Xu et al., 2020). Moreover, the comparison of source contributions to chemical compositions between pre-lockdown and post-lockdown were scarcely performed. Such knowledge is critical to design effective PM2.5 mitigation strategies in the near future.
As a heavily industrialized region, the North China Plain (NCP) possesses many energy-intensive industries including coal-fired power plants, non-ferrous smelting industries, textiles, building materials, chemical engineering, and paper-making industries (Ren et al., 2011). Due to these intensive industrial emissions, the NCP suffered from poor air quality and frequent aerosol pollution in the past decades (Zhang et al., 2018; Luo et al., 2017). Nevertheless, these strict lockdown measures during the COVID-19 period inevitably led to dramatic decreases in industrial emissions, and thus a study about the response of chemical compositions to emission reduction in the heavy-pollution city might be more sensible.
Here, we selected the typical industrial city (Tangshan) in the NCP to determine the concentrations of gaseous pollutants and chemical compositions in PM2.5 during 1 January–31 March 2020 and then to analyze their temporal variations before and after the COVID-19 outbreak. Additionally, a machine-learning approach was applied to separate the contributions of emission reduction and meteorology to the temporal variabilities in chemical compositions and gaseous pollutants. Finally, the source apportionment was performed based on the meteorology-normalized datasets to compare the source difference for these pollutants before and after the COVID-19 lockdown.
2.1 Field observation
Hourly gaseous pollutants and PM2.5 chemical compositions including water-soluble ions and trace elements were measured using online instruments during 1 January–31 March 2020 at a supersite in Tangshan. The supersite is located in a commercial region without short-distance industrial emissions (Fig. 1). SO2, NO2, and CO concentrations were determined by the ultraviolet fluorescence analyzer (TEI model 43i from Thermo Fisher Scientific Inc., USA), chemiluminescence trace gas analyzer (TEI model 42i from Thermo Fisher Scientific Inc., USA), and the correlation infrared absorption analyzer (TAPI model 300E, USA) (Li et al., 2017, 2019). The mass concentration of PM2.5 was determined using an oscillating balance analyzer (TH-2000Z, China) (Wang et al., 2014). The NH3 concentration and water-soluble ions including sulfate (), nitrate (), ammonium (), sodium ion (Na+), and chloridion (Cl−) were monitored with a gas and aerosol collector combined with ion chromatography (GAC–IC; TH-PKU-303, China) (Wang et al., 2014; Zheng et al., 2019). Organic carbon (OC) and elemental carbon (EC) were measured using an OC–EC analyzer (model RT-4, Sunset Laboratory Inc., Tigard, Oregon, USA). Nine trace elements including Hg, Pb, K, Ca, Cr, Cu, Fe, Ni, and Zn were determined by an online multi-element analyzer (model Xact 625, Cooper Environment Service, USA). The quality assurance of SO2, NO2, CO, and PM2.5 was conducted based on HJ 630-2011 specifications. For the quality assurance of NH3 and water-soluble ions, the concentration gradients of anion and cation standard solutions were set based on the pollution levels of target species, and correlation coefficients of the calibration curve must be higher than 0.99. Additionally, a standard sample was collected each day, and the relative standard deviation for the reproducibility test must be less than 5 %. The online device agreed well with the result determined by filter sampling coupled with inductively coupled plasma mass spectrometry (ICP-MS) and inductively coupled plasma atomic emission spectroscopy (ICP-AES).

Figure 1The topographic map of China indicating the location of Tangshan (a), sampling site (b), and some key industrial points (b). The population density of Tangshan is also depicted in (b). The red circle in (b) represents the industrial points, and the pink pentagram denotes the sampling site.
2.2 Deweathered model development
The air pollutants were influenced by the combined effects of meteorological conditions and emissions. In order to quantify the contributions of anthropogenic emissions, the impacts of meteorological conditions should be removed. In our study, a random forest (RF) approach was employed to serve as the site-specific modeling platform (Chen et al., 2018). All gaseous pollutants and chemical compositions in PM2.5 were regarded as the dependent variables. The meteorological parameters including wind speed (WS), wind direction (WD), air temperature (T), relative humidity (RH), precipitation (Prec), air pressure (P), and time predictors (year, day of year (DOY), day of week (DOW), hour) served as the independent variables. The original dataset was randomly classified into a training dataset (90 % of input dataset) for developing the RF model, and the remaining one was treated as the test dataset. After the building of the RF model, the deweathered technique was applied to predict the air pollutant level at a specific time point (e.g., 1 January 2020 at 12:00 local time). The differences in original pollutant concentrations and deweathered pollutant concentrations were regarded as the concentrations contributed by meteorology. Some statistical indicators including R2 value, RMSE, and MAE were regarded as the major criteria to evaluate the modeling performance. In our study, the RF model with the R2 value lower than 0.50 was treated as the unreliable result and cannot reflect the impacts of emission and meteorology on air pollutants accurately because more than 50 % of the variability in the training model cannot be appropriately explained. After the model evaluation, only the species with cross-validation R2 values larger than 0.50 were selected to assess the respective contributions of emission and meteorology to their concentrations.
2.3 Source apportionment
The positive matrix factorization (PMF 5.0) model version was used to perform the PM2.5 source apportionment. The deweathered gaseous pollutants and chemical compositions in PM2.5 were incorporated into the model. The objective of PMF is to resolve the issues of chemical mass balance between measured concentration of each species and its source contributions by decomposing the input matrix into factor contribution and factor profile. The detailed equation is shown in Eqs. (1) and (2). Briefly, the basic principle of PMF is to calculate the least object function Q when the gik must be a positive definite matrix based on Eq. (2) (Chen et al., 2014; Sharma et al., 2016).
where xij and eij represent the concentration and uncertainty in the jth species, respectively; gik represents the contribution ratio of the kth source to the ith sample; fkj represents the ratio of the jth species in the kth source; and eij indicates the residual of the jth species in the ith sample. The uncertainties associated with factor profiles were evaluated using three error calculation methods including the bootstraps (BS) method, displacement (DISP) analysis, and the combination method of DISP and BS (BS–DISP). For the BS method, 100 runs were performed, and the result has been believed to be valid since all of the factors showed a mapping of above 90 %. DISP analysis also confirmed that the solution was considered to be stable because the observed drop in the Q value was less than 0.1 %, and no factor swap occurred. For the BS–DISP analysis, the solution has been verified to be useful because the observed drop in the Q value was less than 0.5 %. Furthermore, both of the results from BS and BS–DISP did not suggest any asymmetry or rotational ambiguity for all of the factors (Manousakas et al., 2017; Brown et al., 2015).
3.1 The concentration changes in gaseous pollutants and PM2.5 chemical compositions
Figures 2–5 show the temporal variations in gaseous pollutants and chemical compositions in PM2.5 from 1 January–31 March, which could be divided into two periods including before and after the COVID-19 outbreak. In this study, 23 January was regarded as the breakpoint because China's government imposed a lockdown in Wuhan and surrounding cities. Before the COVID-19 outbreak, the average observed concentrations of SO2, NO2, CO, 8 h O3, and NH3 during 1–22 January were 34 µg m−3, 64 µg m−3, 2.0 mg m−3, 19 µg m−3, and 14 ppb, respectively. After the COVID-19 lockdown, the mean concentrations of these gaseous pollutants changed to 25 µg m−3, 39 µg m−3, 1.6 mg m−3, 49 µg m−3, and 18 ppb, respectively. Overall, CO, SO2, and NO2 concentrations decreased by 18 %, 27 %, and 39 %, respectively (p<0.05). However, the NH3 and O3 concentration increased by 35 % (p<0.05) and 160 % (p<0.01).
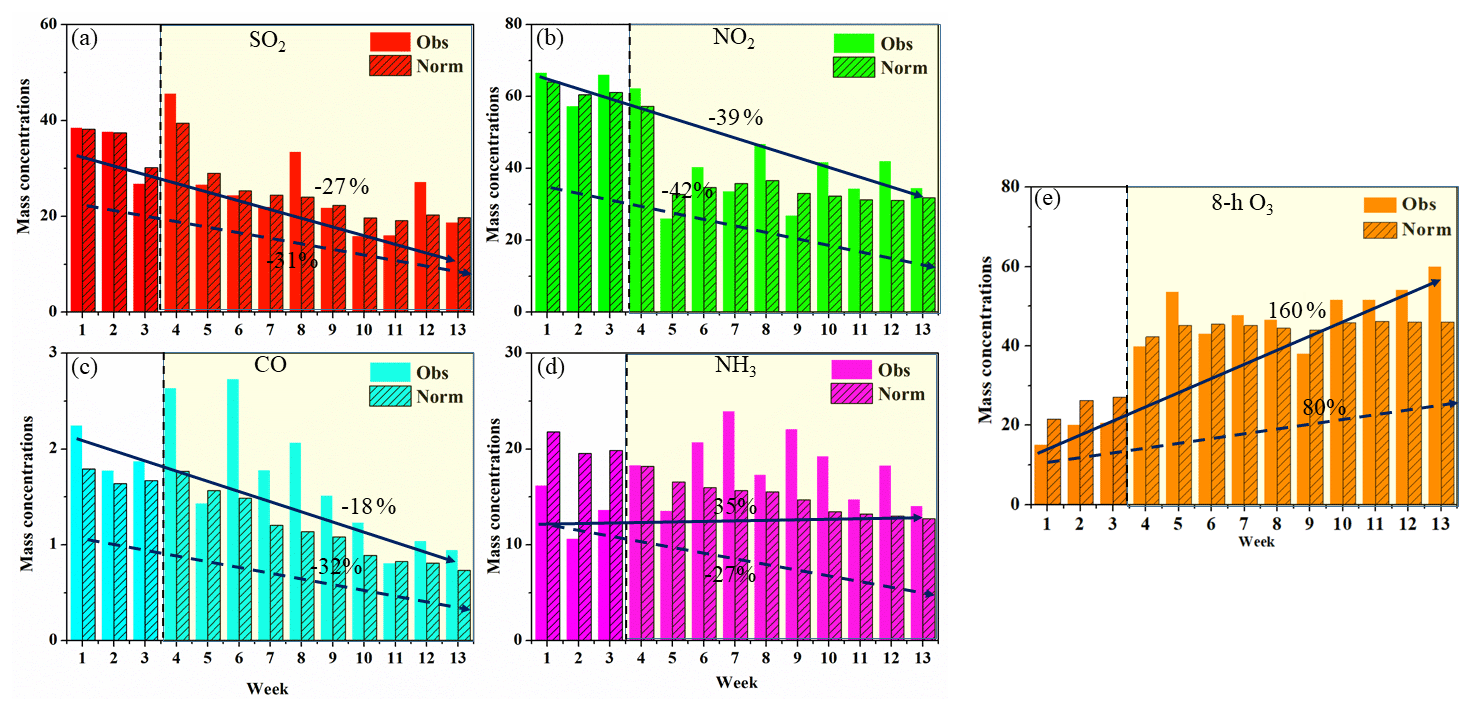
Figure 2Observed and deweathered weekly concentrations and changes in gaseous pollutants during 1 January–31 March. The solid black line and dotted line represent the decrease ratio of observed concentration and simulated concentration from pre-COVID to post-COVID, respectively. The white background denotes the changes in gaseous pollutants before COVID-19, while the faint yellow one represents the chemical components after the COVID-19 outbreak.
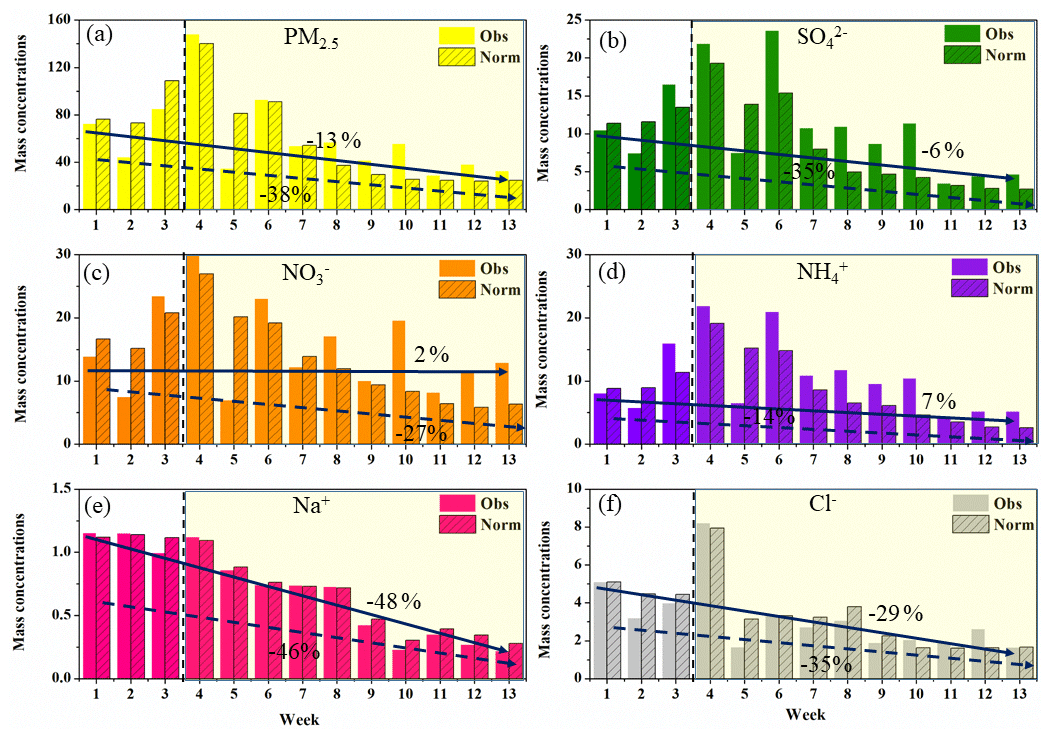
Figure 3Observed and deweathered weekly concentrations and changes in PM2.5 and water-soluble ions during 1 January–31 March. The solid black line and dotted line represent the decrease ratio of observed concentration and simulated concentration from pre-COVID to post-COVID, respectively. The white background denotes the changes in gaseous pollutants before COVID-19, while the faint yellow one represents the chemical components after the COVID-19 outbreak.
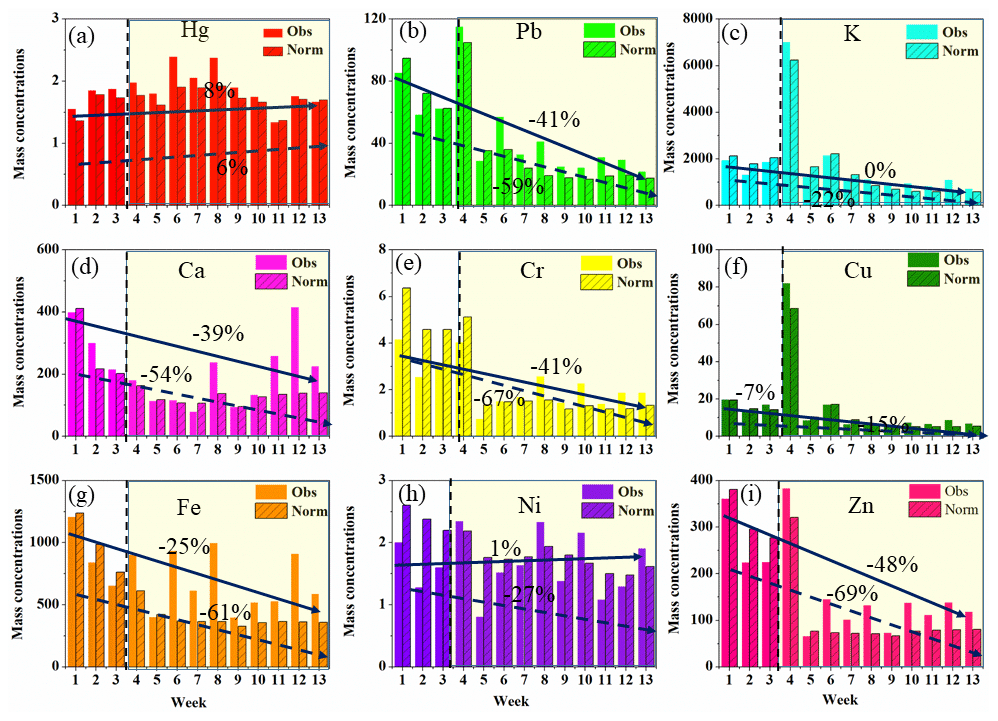
Figure 4Observed and deweathered weekly concentrations and changes in trace elements during 1 January–31 March. The solid black line and dotted line represent the decrease ratio of observed concentration and simulated concentration from pre-COVID to post-COVID, respectively. The white background denotes the changes in gaseous pollutants before COVID-19, while the faint yellow one represents the chemical components after the COVID-19 outbreak.
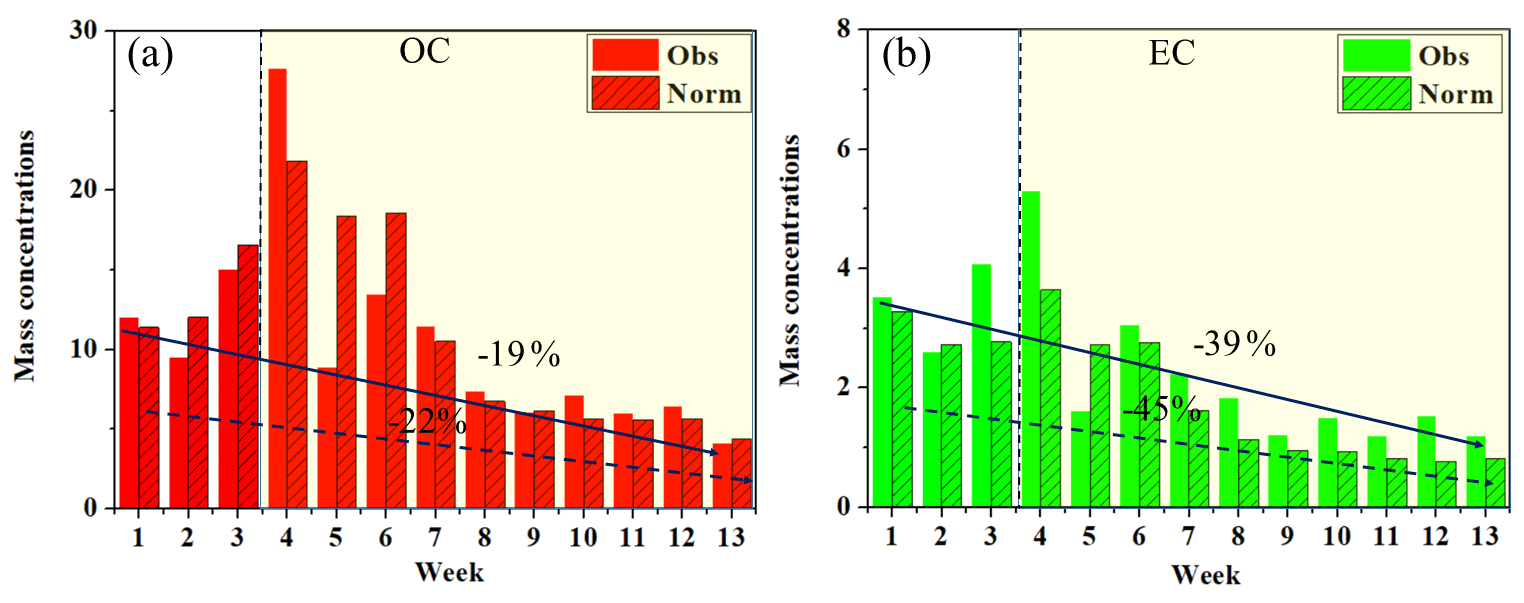
Figure 5Observed and deweathered weekly concentrations and changes in organic carbon (OC) and elemental carbon (EC) during 1 January–31 March. The solid black line and dotted line represent the decrease ratio of observed concentration and simulated concentration from pre-COVID to post-COVID, respectively. The white background denotes the changes in gaseous pollutants before COVID-19, while the faint yellow one represents the chemical components after the COVID-19 outbreak.
As shown in Fig. 2, the chemical compositions in PM2.5 also showed dramatic changes during 1 January–31 March due to the impact of the COVID-19 lockdown. The observed , PM2.5, Na+, and Cl− concentrations decreased by 6 % (p>0.05), 13 % (p>0.05), 29 % (p<0.05), and 48 % (p<0.01), respectively, while observed (2 %) and (7 %) levels showed slight increases (p>0.05). In Shanghai, Chen et al. (2020) revealed that and concentrations displayed significant decreases after the COVID-19 outbreak due to the obvious decreases in precursor concentrations (e.g., SO2, NOx). However, both observed and concentrations in Tangshan even showed slight increases, though the NO2 concentration suffered from a remarkable decrease. It was assumed that the adverse meteorological conditions might be beneficial to the pollutant accumulation (Zheng et al., 2019; Y. Zhang et al., 2019). Additionally, the concentrations of nine trace elements were also determined. The observed values of Fe (25 %), Ca (39 %), Pb (41 %), Cr (41 %), and Zn (48 %) suffered from dramatic decreases (p<0.05), while the K (0 %), Ni (1 %), and Hg (8 %) concentrations still displayed slight increases (p>0.05). As a whole, the temporal variability in these elements in Tangshan before and after the COVID-19 lockdown was in agreement with the result in Beijing (He et al., 2017). However, the K concentration in Beijing showed rapid decrease after the COVID-19 outbreak, which was not coincident with our study (He et al., 2017). It suggested that the slight increase in K in Tangshan might be linked with the unfavorable meteorological conditions (He et al., 2017). The observed concentrations of OC (−19 %) and EC (−39 %) also suffered from rapid decreases after the COVID-19 lockdown (Fig. 4) (p<0.05), which was in good agreement with the sea-salt ions (e.g., Na+, Cl−) and most trace elements (e.g., Zn, Pb).
3.2 The impact of emission reduction in air quality
Although the observed concentrations of air pollutants can be applied to analyze the impact of the COVID-19 lockdown, the role of emission reduction in air quality might not be clearly revealed because the meteorological factors were also important variables influencing the air pollutant concentrations. In order to accurately reflect the response of air quality to emission reduction during the COVID-19 lockdown period, the meteorological conditions were isolated by the machine-learning model. In our study, we developed a random forest model to remove the impacts of meteorological conditions on air pollutants. Based on the results in Figs. S1–S5 in the Supplement, the RF models for most of the species showed better performance because their R2 values were higher than 0.50, and the slope of all of the fitting curves was also close to the R2 values. However, some other species such as Ag, Cd, and Mg2+ showed worse predictive performances, and thus these data cannot be utilized to distinguish the impacts of meteorology and emission on the concentrations of these species. Based on the cross-validation R2 value, the species with an R2 value higher than 0.50 were applied to assess the contributions of meteorology and emission to the concentrations. The deweathered concentrations of gaseous pollutants and chemical compositions in PM2.5 are depicted in Figs. 2–5. Compared with the period before COVID-19, the deweathered NH3, SO2, CO, and NO2 concentrations decreased by 27 %, 31 %, 32 %, and 42 % after the COVID-19 lockdown period outbreak, respectively (p<0.05), while the deweathered 8 h O3 concentration increased by 80 % (p<0.01). Meanwhile, the normalized-meteorology , , , Cl−, PM2.5, and Na+ and concentrations decreased by 14 %, 27 %, 35 %, 35 %, 38 %, and 47 %, respectively. For trace elements, deweathered Cu, K, Ni, Ca, Pb, Fe, Cr, and Zn levels reduced by 15 %, 23 %, 27 %, 54 %, 59 %, 61 %, 67 %, and 69 %, respectively (p<0.05). Nevertheless, the deweathered Hg concentration still kept a stable increase at a rate of 6 % compared with the period before the COVID-19 outbreak (p>0.05).
The deweathered concentrations for most of the pollutants showed significant decreases after the COVID-19 outbreak compared with the period before COVID-19 (Figs. 2–5). It was assumed that many cities proposed the lockdown measures, which significantly minimized industrial, transportation, and commercial activities. Among all of the pollutants, the deweathered Zn, Cr, Fe, Pb, and Ca experienced decrease rates of more than 50 % due to the lockdown measures. It was well known that Zn, Cr, and Fe originated mainly from the metallurgical industry (Sun et al., 2018; Zhu et al., 2018), while Pb might be derived from coal-fired power plants (Cui et al., 2019; Meng et al., 2020). During the COVID-19 outbreak, most of the industries have been shut down, and energy production by coal-fired power plants was reduced by one-third (Chang et al., 2020). Based on the adjustment factor estimated by Doumbia et al. (2021), the contributions of industrial activity and the power sector have decreased by 40 % after the COVID-19 outbreak, which was close to the decrease ratios of Zn, Cr, Fe, and Pb concentrations. It should be noted that the deweathered Ca concentration also decreased by more than 50 %. It was well documented that the Ca was often associated with the dust resuspension (Chang et al., 2018). In fact, the Ca was known as one of the most abundant elements in the upper continental crust, which likely originated from the fugitive dust (Chang et al., 2018; Shen et al., 2016). A reduction of more than 70 % in vehicle transportation and domestic flights facilitated the rapid decrease in Ca concentration (Chang et al., 2020). Although the observed K concentration did not show a marked decrease after the COVID-19 lockdown, the deweathered K level suffered from rapid decrease (−22 %) (p<0.05). It was widely acknowledged that K was considered to be a key fingerprint of biomass burning (H. Zheng et al., 2020), and thus the result suggested that the open biomass burning was also restricted during the period. Both of the deweathered concentrations of OC (−22 %) and EC (−45 %) also experienced remarkable decreases. In our study, both OC and EC concentrations showed significant correlation with K level (p<0.05), indicating that the restriction of biomass burning also led to the decreases in OC and EC. Additionally, PM2.5 and some water-soluble ions including deweathered and concentrations experienced marked decreases after the COVID-19 lockdown, which was in good agreement with their gaseous precursors. It might be attributable to the rapid decreases in precursor emissions. B. Zheng et al. (2020) verified that the SO2 emission in the industrial sector and NOx emission in the transportation sector in Hebei Province have decreased by 19 % and 13 %, respectively. The deweathered Na+ concentration showed the rapid decrease after the COVID-19 lockdown, which suggested that the Na+ in the PM2.5 of Tangshan was probably derived from waste incineration rather than sea-salt aerosol (Deshmukh et al., 2016).
Although most pollutant concentrations suffered from remarkable decreases, the decrease ratios of deweathered NH3 and concentrations after the COVID-19 outbreak were far lower than those of many other gaseous pollutants and water-soluble ions. It was attributable to the fact that ambient NH3 was mainly sourced from the fertilizer application and livestock, which did not show significant decrease during the COVID-19 period (Kang et al., 2016; B. Zheng et al., 2020; Doumbia et al., 2021). Although the transportation volume suffered from dramatic decrease, the contribution of transportation to NH3 was generally less than 5 % (Kang et al., 2016). Furthermore, the contribution of urban waste sources slightly increased after the COVID-19 outbreak, offsetting the effect of traffic outage (Y. Zhang et al., 2020). Additionally, it should be noted that the normalized-meteorology 8 h O3 and Hg concentrations still maintained a stable increase. T. Liu et al. (2020) have confirmed that uncoordinated decreases in NOx and volatile organic compound (VOC) emissions (decrease ratio: NOx > VOCs) dominated the 8 h O3 increase in urban areas because most urban areas belonged to a VOC-limited region. Moreover, the excessive decrease in PM2.5 from primary emission significantly increased the HO2 radical concentration on the surface of aerosol, thereby promoting the O3 formation (Shi and Brasseur, 2020). The minor increase in deweathered Hg level was attributable to the fact that the coal combustion for domestic heating was not restricted during the COVID-19 lockdown period (Zhou et al., 2018). Based on the updated global anthropogenic emission adjustment factor during COVID-19, the contribution of the residential sector to air pollutants did not decrease after the COVID-19 lockdown (Doumbia et al., 2021).
3.3 The role of meteorology and potential chemical reactions on air quality
Compared with the observed values, the deweathered concentrations of most pollutants were significantly reduced. Meanwhile, the deweathered decrease ratios of pollutants were significantly higher than those of observed values (Fig. 6). The result suggested that the meteorology conditions during the COVID-19 lockdown period were not favorable to the pollutant dispersion, as evidenced by some recent studies (Chang et al., 2020; Huang et al., 2020). In our study, six meteorological parameters including WS, WD, T, RH, Prec, and P have been integrated into the random forest model to assess the response of each species to different meteorological variables. The variable importance of each meteorological parameter to all of the species is shown in Figs. 7–10.
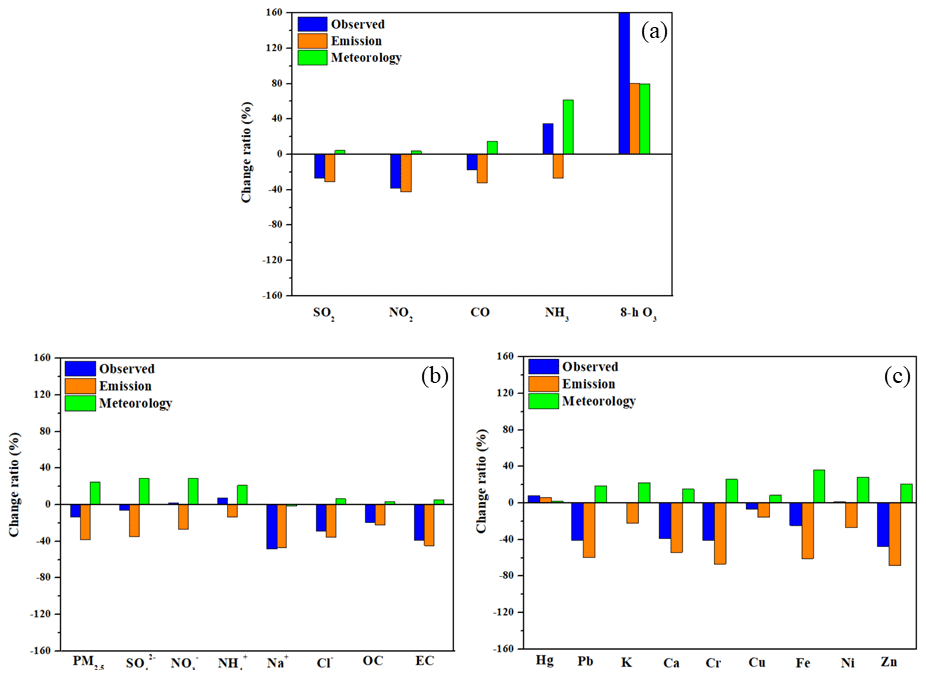
Figure 6The changes in observed concentrations of multiple components between pre-lockdown (week 1–3) and post-lockdown (week 4–13) against the changes derived from the emission and meteorological changes. The gaseous pollutants, water-soluble ions and carbonaceous aerosols, and trace metals are shown in (a–c), respectively.
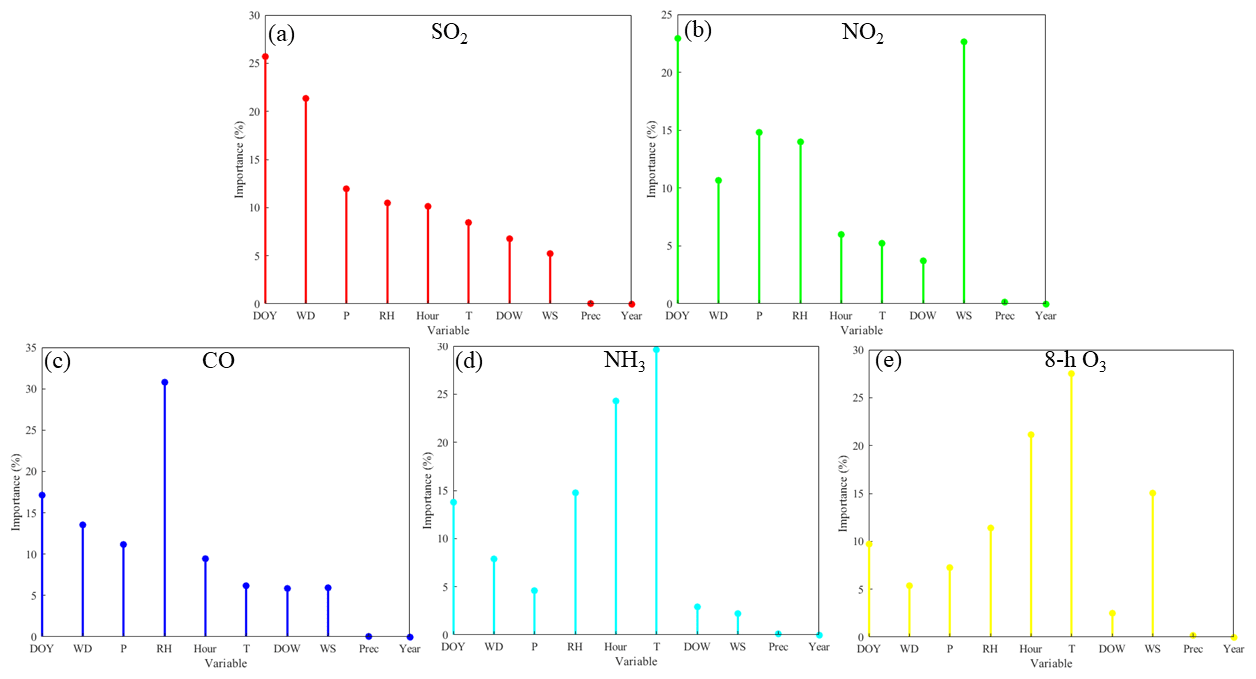
Figure 7Relative importance of the predictors for the prediction of gaseous pollutants. The match in the figure denotes the variable importance in RF models for various species. DOY, WD, P, RH, Hour, T, DOW, WS, Prec, and Year represent day of year, wind direction, air pressure, relative humidity, hour of the day, air temperature, day of week, wind speed, precipitation, and study year.
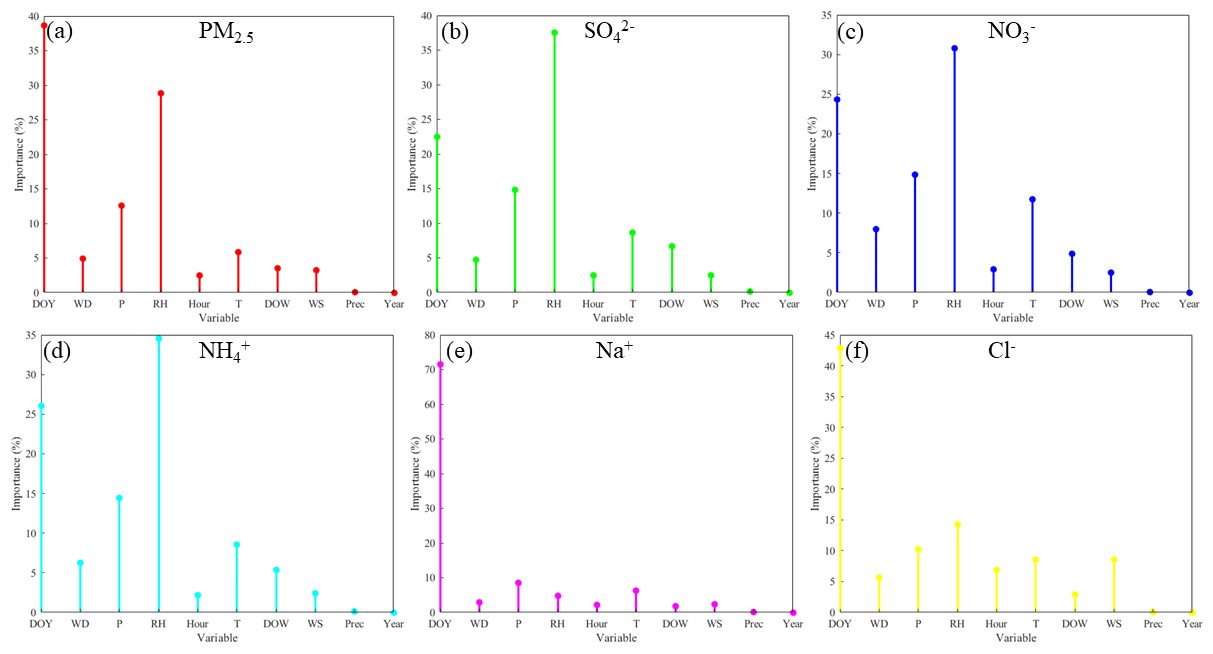
Figure 8Relative importance of the predictors for the prediction of water-soluble ions in PM2.5. The match in the figure denotes the variable importance in RF models for various species. DOY, WD, P, RH, Hour, T, DOW, WS, Prec, and Year represent day of year, wind direction, air pressure, relative humidity, hour of the day, air temperature, day of week, wind speed, precipitation, and study year.
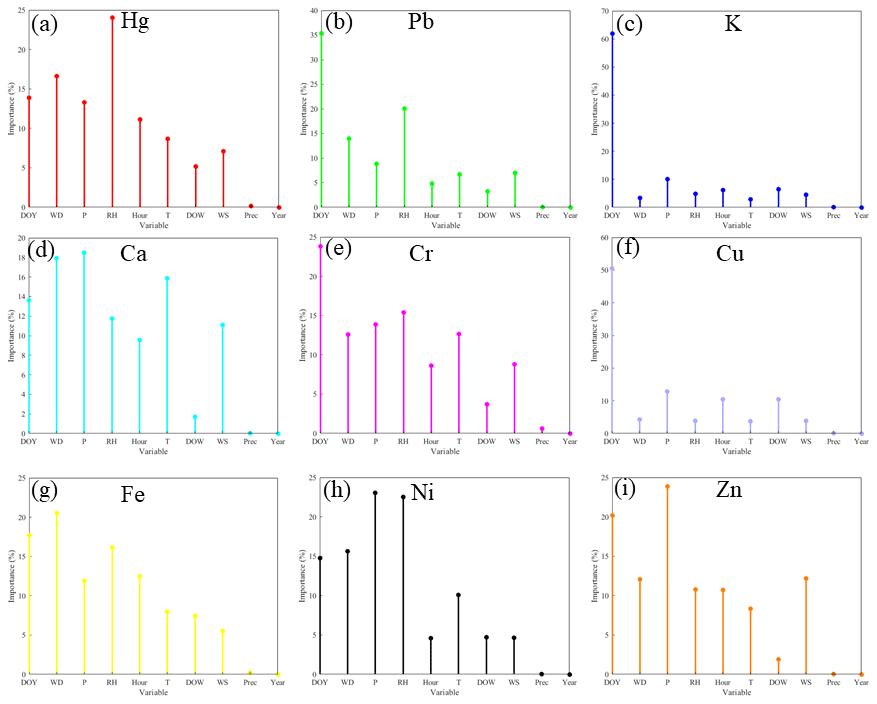
Figure 9Relative importance of the predictors for the prediction of trace elements in PM2.5. The match in the figure denotes the variable importance in RF models for various species. DOY, WD, P, RH, Hour, T, DOW, WS, Prec, and Year represent day of year, wind direction, air pressure, relative humidity, hour of the day, air temperature, day of week, wind speed, precipitation, and study year.
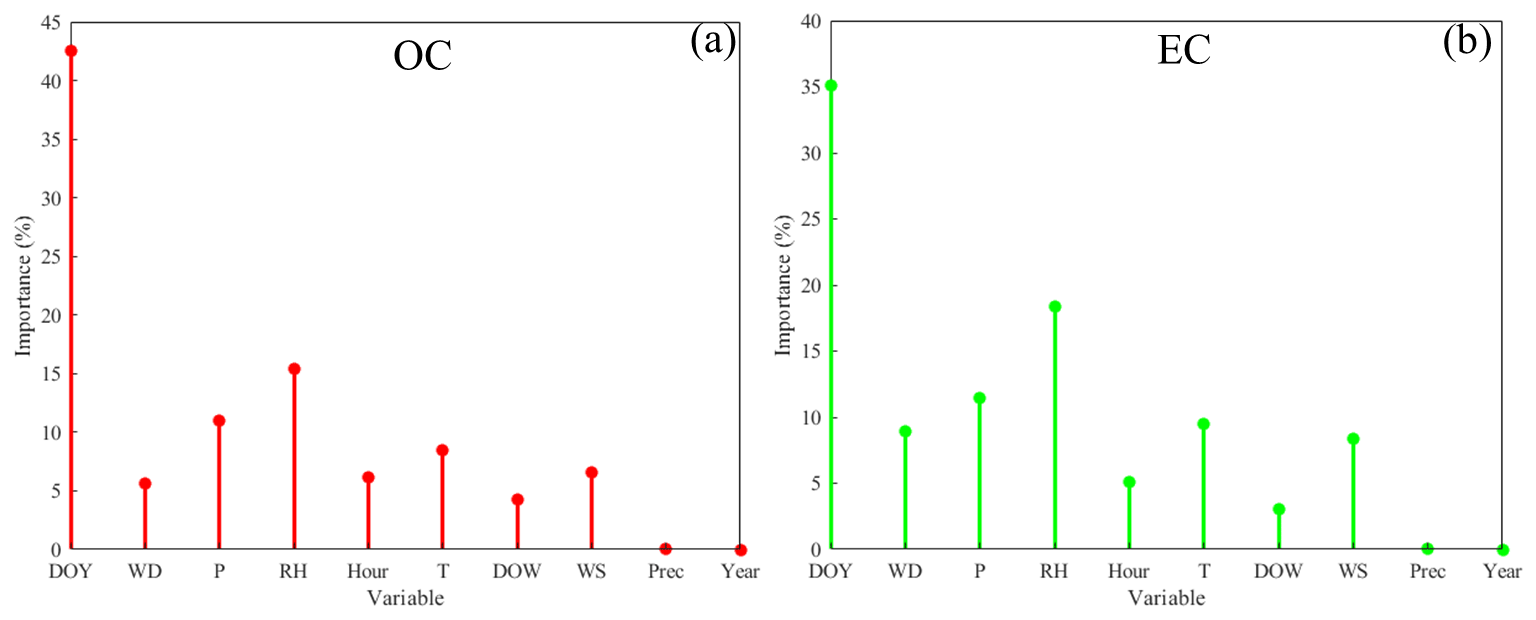
Figure 10Relative importance of the predictors for the prediction of OC and EC in PM2.5. The match in the figure denotes the variable importance in RF models for various species. DOY, WD, P, RH, Hour, T, DOW, WS, Prec, and Year represent day of year, wind direction, air pressure, relative humidity, hour of the day, air temperature, day of week, wind speed, precipitation, and study year.
Among all of the gaseous pollutants, the meteorological conditions played significantly positive roles in NH3 (62 %) and 8 h O3 concentrations (80 %) (Fig. 6). As shown in Fig. 7, T was the most important factor for the rapid elevation of NH3 concentration after the COVID-19 lockdown. It was assumed that the higher T enhanced the emissions of NH3 from soil and urban wastes and promoted the volatilization of NH3 from aerosol pools (Y. Zhang et al., 2020). In our study, the hourly mean air temperature increased from 0∘ before the COVID-19 outbreak to 5∘ after the COVID-19 lockdown, which strongly supported the inference. For 8 h O3 concentration (Fig. 7), T was also treated as the most important variable. On the one hand, the higher T generally enhanced biogenic isoprene emissions, which was the most abundant biogenic VOC and showed the highest ozone formation potential (Liu and Wang, 2020). On the other hand, high T often increased chemical reaction rates and accelerated the O3 formation (Shi et al., 2020). Additionally, WS also played an important role in the 8 h O3 concentration. Shi et al. (2020) have demonstrated that weaker winds often slowed down the advection and convection of NOx and VOCs, which was beneficial to O3 formation.
Moreover, the contributions of meteorological conditions to some secondary ions (e.g., (29 %), (29 %), and (21 %)) were remarkably higher than those to other ions and some trace elements, suggesting that the chemical reactions and formation pathways of these species were more sensitive to meteorological variations. Deshmukh et al. (2016) confirmed that the high RH promoted the aqueous-phase oxidation of SO2 and the production of sulfate. Tian et al. (2019) also demonstrated that RH-dependent heterogeneous reactions significantly contributed to the sulfate generation, and the high RH enhanced gas- to aqueous-phase dissolution of NH3 and HNO3. These pioneering experiments suggested that secondary aerosols were often formed under the condition of high RH. Very recently, Chang et al. (2020) observed that the nitrate concentration in the YRD experienced unusual increase during the COVID-19 period, while Xu et al. (2020) obtained the opposite result in Lanzhou. It was assumed that the persistent increase in T and decrease in RH in Lanzhou during this period was not beneficial to the generation of secondary aerosol, while the high RH in the YRD significantly elevated local nitrate level. Although air temperature in Tangshan suffered from an increase after the COVID-19 lockdown, RH displayed a rapid increase from 47 % to 57 % during this period. Moreover, the increased O3 could promote the secondary aerosol formation and partially offset the decreased PM2.5 compositions triggered by the primary emission reduction (Liu et al., 2020). Similar to secondary ions, both OC and EC were also sensitive to RH. It was supposed that high RH could increase the secondary organic aerosol (SOA) levels, which accounted for the major fraction of OC (H. Zheng et al., 2020).
In addition, some trace elements such as Fe, Ni, and Cr were also significantly affected by the meteorological conditions. As shown in Fig. 9, these element concentrations were mainly sensitive to WD. It was assumed that the neighboring industrial points including cement plants and coal-fired power plants could influence the concentrations of trace elements via long- or short-range transport, which was strongly dependent on WD. Following WD, RH was also an important factor for the variation in these trace elements. Under the condition of high RH, Fe and Cr could catalyze the heterogeneous generation of sulfate and nitrate on the mineral or soot surface (Hu et al., 2015).
Unlike the trace elements, water-soluble ions and OC were less sensitive to WD. Major water-soluble ions in PM2.5 including , , and were mainly derived from secondary formation rather than the direct emission (J. Feng et al., 2020; X. Zhang et al., 2020), and thus they were not very sensitive to WD.
3.4 The enhanced secondary aerosol formation during the COVID-19 lockdown period
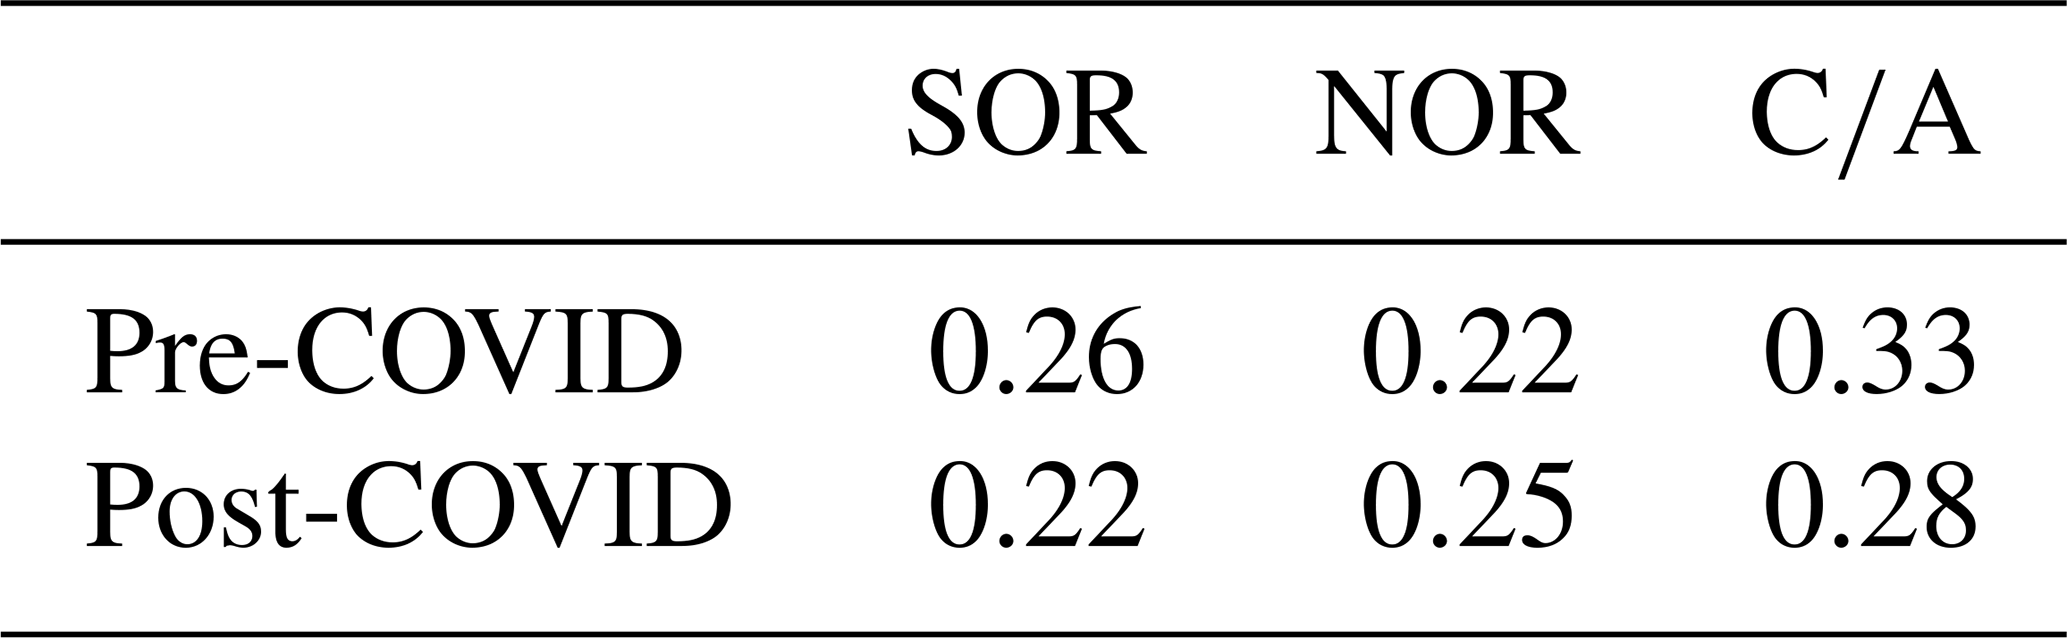
The deweathered chemical compositions suggested that the sulfate and nitrate chemistry changed slightly after the COVID-19 outbreak. The oxidation ratio of sulfate (SOR; the ratio of sulfate concentration and the sum of sulfate and SO2 concentrations) decreased from 0.26 to 0.22, while the oxidation ratio of nitrate (NOR; the ratio of nitrate concentration and the sum of nitrate and NO2 concentrations) increased from 0.22 to 0.25 (Table 1). The decreased SOR after the COVID-19 outbreak indicated that the decrease rate of sulfate is higher than that of SO2. In contrast, the increased NOR during the COVID-19 lockdown period revealed that the decrease rate of nitrate is lower than that of NO2. The increased NOR after the COVID-19 outbreak suggested the consecutive nitrate production, though the NOx emission experienced tremendous reduction, which was in good agreement with the result observed by Chang et al. (2020). It was assumed that the persistently higher observed NH3 concentration during this period promoted the ammonium nitrate formation though the lower NOx emission (Y. Zhang et al., 2020), which also partially explained the abnormal increases in observed concentrations of secondary ions after the COVID-19 outbreak. In general, NH3 firstly tends to react with H2SO4 to form ammonium sulfate, and then the excess NH3 participated in the reaction with HNO3 (Chen et al., 2019; Q. Zhang et al., 2019). However, sulfate concentration suffered from a more dramatic decrease compared with SO2, which might be associated with the aerosol acidity during the COVID-19 lockdown period. The ratio of and the sum of , , and Cl−, named CA, was regarded as an indicator to reflect the aerosol acidity. In our study, the CA value decreased from 0.33 to 0.28 after the COVID-19 outbreak, implicating that the aerosol acidity even showed slight increase during the COVID-19 lockdown period. It was well known that the higher aerosol acidity might prohibit the conversion from SO2 to sulfate (Liu et al., 2020; Shao et al., 2019), which yielded the lower SOR.
Table 1SOR, NOR, and CA values in pre-COVID and post-COVID (, ), ).
3.5 The impact of the COVID-19 lockdown on source apportionment
The emission control measures inevitably triggered the variation in source apportionment (Liu et al., 2017; Meng et al., 2020). In the present study, positive matrix factorization (PMF 5.0) was employed to identify the major sources of PM2.5 in Tangshan before and after the COVID-19 outbreak. About three- to nine-factor solutions were examined, and a five-factor solution obtained the lowest Q (robust) and Q (true) values. Additionally, the PMF analysis and error diagnostics also suggested that the result was robust (Tables S2–S4 in the Supplement).
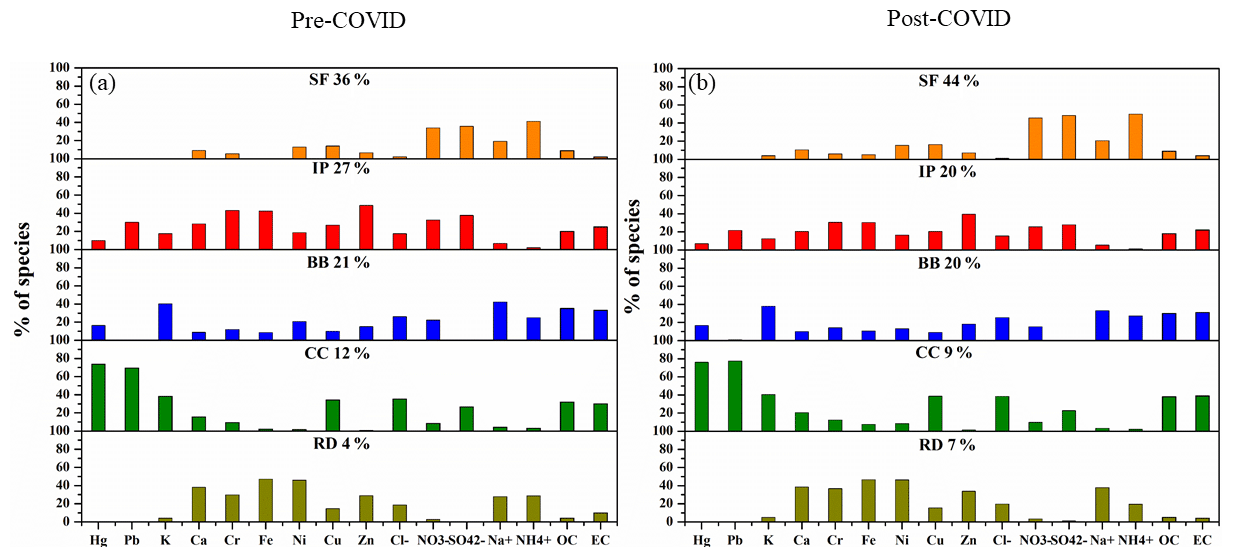
Figure 11The comparison of source apportionment for PM2.5 chemical compositions before (a) and after (b) the COVID-19 outbreak. In our study, five major sources were distinguished based on the PMF model. The color bar denotes the contributions of these sources to each species. SF, IP, BB, CC, and RD represent secondary formation, industrial process, biomass burning, coal combustion, and road dust, respectively.
The source apportionment profiles pre-COVID and post-COVID resolved by PMF are depicted in Fig. 11. For pre-COVID, the first factor contributed 36 % to the total species. The factor was characterized by high levels of (41 %), (35 %), and (33 %). and were generally produced by oxidation of SO2 and NOx, respectively. The was often formed through the heterogeneous reaction of NH3 and sulfate or HNO3. Thus, the factor was regarded as the secondary formation (SF). The second factor was characterized by high loadings of Zn (47 %), Cr (42 %), Fe (42 %), and Pb (31 %). Cr and Fe were mainly originated from fuel combustion and the metallurgical industry such as chrome plating and steel production (J. Liu et al., 2018), while Pb and Zn were derived from the roasting, sintering, and smelting process for the extraction of Pb and Zn ores (Wu et al., 2012). Therefore, the factor 2 was treated as the industrial process (IP) source. The predominant species in factor 3 included Na+ (42 %), K (40 %), OC (35 %), and EC (33 %). K was often regarded as the fingerprint of biomass burning (BB) (Chen et al., 2017; Zheng et al., 2019), whereas the Na+ was generally regarded as the tracer of waste incineration (Alam et al., 2019; Durlak et al., 1997). Hence, factor 3 was treated as the BB source. Tangshan suffered from remarkable increasing usage of biomass fuels for domestic heating in winter, which promoted the emissions of K and Na+ (Chen et al., 2017). The most abundant species in factor 4 were Hg (75 %), Pb (68 %), K (36 %), Cu (35 %), Cl− (33 %), and (27 %). Pb, Hg, and Cu were typical marker elements for coal combustion, and around 56 % of Pb and 47 % of Hg were released from coal combustion (Cheng et al., 2015; Zhu et al., 2020). In northern China, coal-based domestic heating was one of the most important sectors of coal consumption (K. Liu et al., 2018). Dai et al. (2019) also verified that the residential coal combustion was a major source of primary sulfate. Thus, factor 4 was regarded as the coal combustion (CC) source. The last factor was distinguished by high loadings of Fe (46 %), Ni (45 %), and Ca (38 %). Fe and Ca were main elements enriched in upper crust, and Ni was enriched in brake wear and tire wear dusts (Dehghani et al., 2017; Urrutia-Goyes et al., 2018). Thus, these elements in this factor were mainly sourced from traffic-related road dust (RD).
After the COVID-19 outbreak, the chemical compositions in PM2.5 were also classified into five sources including SF, IP, BB, CC, and RD. However, the contribution ratios of these sources varied greatly after the implementation of serious lockdown measures. The contribution ratio of IP experienced the largest decrease from 27 % to 20 %, whereas the apportionment of SF showed a marked increase from 36 % to 44 %. The contributions of the other three sources only suffered from slight variations. The rapid decrease in IP contribution might be associated with the shutdown of many industries during the COVID-19 period (Zheng et al., 2020), while the obvious increase in SF contribution was attributable to more heterogeneous or aqueous reactions of precursors (Chang et al., 2020). For nearly all of the species, the contribution ratios of IP suffered from remarkable decreases after the COVID-19 outbreak. Since the COVID-19 lockdown, the contribution ratios of SF to , , and increased from 35 %, 33 %, and 41 % to 48 %, 44 %, and 52 %, respectively. However, the contribution ratios of SF for other species remained relatively stable. It was assumed that , , and were mainly produced from secondary formation of precursors (Jiang et al., 2019; Yao et al., 2020), while other species, especially the trace elements, were mainly derived from the primary emission (Y. Wu et al., 2020). Although the COVID-19 pandemic led to the shutdown of many coal-fired power plants and industries and decreased the CC emissions from these sectors (Kraemer et al., 2020), the government-enforced home order might increase the electricity consumption (Venter et al., 2020), which offset the decreases in CC contributions to industrial activities. Therefore, the contribution ratios of CC did not experience dramatic variation after the COVID-19 outbreak.
The lockdown measures led to the shutdown of many industries, in turn resulting in significant decreases in primary components in PM2.5. We employed an RF model to determine the respective contributions of meteorology and emission reduction to the variations in gaseous pollutants and PM2.5 chemical compositions during the COVID-19 lockdown period. The deweathered levels of some trace elements (e.g., Pb (−59 %), Zn (−69 %)) derived from industrial emissions experienced decrease rates of more than 50 % due to the stringent lockdown measures. However, the higher relative humidity (RH) and lower air temperature (T) significantly prohibited the decreases in water-soluble ion concentrations because they were beneficial to the heterogeneous or aqueous reaction of sulfate and nitrate. Trace elements were very sensitive to wind direction (WD) due to the long-range transport of anthropogenic emissions. Additionally, the contributions of secondary formation to PM2.5 increased from 36 % to 44 % after the COVID-19 outbreak. The finding also explained that the opposite change trends of the secondary aerosols in East and West China found by previous studies were attributable not only to the large difference in meteorological conditions but also the discrepancy of NH3 concentration.
In future work, it will be necessary to seek multi-pollutant (e.g., VOC, NOx) emission control measures to reduce the concentrations of primary and secondary components simultaneously since adverse meteorological conditions coupled with slightly higher oxidation capability especially, in winter, still caused haze formation. Our results also highlight that more NH3 emission control measures are urgently needed because the excess NH3 could exacerbate the generation of secondary aerosols. Besides, the generation of primary pollutants was very sensitive to RH and WD. Thus, the primary pollutant emissions from the industries in the upwind direction should be strictly restricted.
In addition, the present study still suffered from some uncertainties. At first, only six meteorological factors were incorporated into the RF model to quantify the contributions of emission and meteorology of air pollutants. In particular, the missing solar radiation could affect the accuracy of 8 h O3 estimation. Besides, solar radiation could change the concentrations of hydroxyl radicals, thereby affecting the formation. In future work, the solar radiation should be integrated into the model. In addition, some temporal indicators such as hour and DOY were applied to reflect the COVID-19 lockdown intensity because an hourly emission inventory during this period was not available, which should be integrated into the RF model after the development of a real-time emission inventory.
The meteorological data are available at http://data.cma.cn/ (China Meteorological Administration, 2021). The website can be browsed in English http://data.cma.cn/en.
The supplement related to this article is available online at: https://doi.org/10.5194/acp-21-8677-2021-supplement.
MP and CW collected data and provided technical support. HF and JC designed the study. RL wrote the manuscript. YZ analyzed the data.
The authors declare that they have no conflict of interest.
This work was supported by the National Natural Science Foundation of China (grant nos. 91744205, 21777025, 21577022, 21177026) and the Chinese Postdoctoral Science Foundation (grant no. 2020M680589).
This research has been supported by the 13th Five-Year Weapons Innovation Foundation of China (grant no. 91744205).
This paper was edited by Veli-Matti Kerminen and reviewed by two anonymous referees.
Alam, Q., Hendrix, Y., Thijs, L., Lazaro, A., Schollbach, K., and Brouwers, H.: Novel low temperature synthesis of sodium silicate and ordered mesoporous silica from incineration bottom ash, J. Clean. Prod., 211, 874–883, https://doi.org/10.1016/j.jclepro.2018.11.173, 2019.
Brown, S. G., Eberly, S., Paatero, P., and Norris, G. A.: Methods for estimating uncertainty in PMF solutions: Examples with ambient air and water quality data and guidance on reporting PMF results, Sci. Total Environ., 518, 626–635, https://doi.org/10.1016/j.jclepro.2020.124667, 2015.
Chang, Y., Huang, K., Xie, M., Deng, C., Zou, Z., Liu, S., and Zhang, Y.: First long-term and near real-time measurement of trace elements in China's urban atmosphere: temporal variability, source apportionment and precipitation effect, Atmos. Chem. Phys., 18, 11793–11812, https://doi.org/10.5194/acp-18-11793-2018, 2018.
Chang, Y., Huang, R. J., Ge, X., Huang, X., Hu, J., Duan, Y., Zou, Z., Liu, X., and Lehmann, M. F.: Puzzling haze events in China during the coronavirus (COVID-19) shutdown, Geophy. Res. Lett., 47, e2020GL088533, https://doi.org/10.1029/2020GL088533, 2020.
Chen, G. B., Li, S. S., Knibbs, L. D., Hamm, N. A. S., Cao, W., Li, T. T., Guo, J. P., Ren, H. Y., Abramson, M. J., and Guo, Y. M.: A machine learning method to estimate PM2.5 concentrations across China with remote sensing, meteorological and land use information, Sci. Total Environ., 636, 52–60, https://doi.org/10.1016/j.scitotenv.2018.04.251, 2018.
Chen, H., Huo, J., Fu, Q., Duan, Y., Xiao, H., and Chen, J.: Impact of quarantine measures on chemical compositions of PM2.5 during the COVID-19 epidemic in Shanghai, China, Sci. Total Environ., 743, 140758, https://doi.org/10.1016/j.scitotenv.2020.140758, 2020.
Chen, J., Li, C., Ristovski, Z., Milic, A., Gu, Y., Islam, M. S., Wang, S., Hao, J., Zhang, H., and He, C.: A review of biomass burning: Emissions and impacts on air quality, health and climate in China, Sci. Total Environ., 579, 1000–1034, https://doi.org/10.1016/j.scitotenv.2016.11.025, 2017.
Chen, L., Gao, Y., Zhang, M., Fu, J. S., Zhu, J., Liao, H., Li, J., Huang, K., Ge, B., Wang, X., Lam, Y. F., Lin, C.-Y., Itahashi, S., Nagashima, T., Kajino, M., Yamaji, K., Wang, Z., and Kurokawa, J.: MICS-Asia III: multi-model comparison and evaluation of aerosol over East Asia, Atmos. Chem. Phys., 19, 11911–11937, https://doi.org/10.5194/acp-19-11911-2019, 2019.
Chen, W. T., Shao, M., Lu, S. H., Wang, M., Zeng, L. M., Yuan, B., and Liu, Y.: Understanding primary and secondary sources of ambient carbonyl compounds in Beijing using the PMF model, Atmos. Chem. Phys., 14, 3047–3062, https://doi.org/10.5194/acp-14-3047-2014, 2014.
Cheng, K., Wang, Y., Tian, H., Gao, X., Zhang, Y., Wu, X., Zhu, C., and Gao, J.: Atmospheric emission characteristics and control policies of five precedent-controlled toxic heavy metals from anthropogenic sources in China, Environ. Sci. Technol., 49, 1206–1214, 2015.
China Meteorological Administration: Hourly meteorological data of all of the sites in China, available at: http://data.cma.cn/, last access: 5 April 2021.
Cui, Y., Ji, D., Chen, H., Gao, M., Maenhaut, W., He, J., and Wang, Y.: Characteristics and sources of hourly trace elements in airborne fine particles in urban Beijing, China, J. Geophys. Res.-Atmos., 124, 11595–11613, https://doi.org/10.1029/2019JD030881, 2019.
Dai, Q., Bi, X., Song, W., Li, T., Liu, B., Ding, J., Xu, J., Song, C., and Yang, N., Schulze, B. C.: Residential coal combustion as a source of primary sulfate in Xi'an, China, Atmos. Environ., 196, 66–76, https://doi.org/10.1016/j.atmosenv.2018.10.002, 2019.
Dehghani, S., Moore, F., Keshavarzi, B., and Beverley, A. H.: Health risk implications of potentially toxic metals in street dust and surface soil of Tehran, Iran, Ecotox. Environ. Safe., 136, 92–103, https://doi.org/10.1016/j.ecoenv.2016.10.037, 2017.
Deshmukh, D. K., Kawamura, K., and Deb, M. K.: Dicarboxylic acids, ω-oxocarboxylic acids, α-dicarbonyls, WSOC, OC, EC, and inorganic ions in wintertime size-segregated aerosols from central India: Sources and formation processes, Chemosphere, 161, 27–42, https://doi.org/10.1016/j.chemosphere.2016.06.107, 2016.
Durlak, S. K., Biswas, P., and Shi, J.: Equilibrium analysis of the affect of temperature, moisture and sodium content on heavy metal emissions from municipal solid waste incinerators, J. Hazard. Mater., 56, 1–20, https://doi.org/10.1016/S0304-3894(97)00002-2, 1997.
Doumbia, T., Granier, C., Elguindi, N., Bouarar, I., Darras, S., Brasseur, G., Gaubert, B., Liu, Y., Shi, X., Stavrakou, T., Tilmes, S., Lacey, F., Deroubaix, A., and Wang, T.: Changes in global air pollutant emissions during the COVID-19 pandemic: a dataset for atmospheric chemistry modeling, Earth Syst. Sci. Data Discuss. [preprint], https://doi.org/10.5194/essd-2020-348, in review, 2021.
Feng, J., Chan, E., and Vet, R.: Air quality in the eastern United States and Eastern Canada for 1990–2015: 25 years of change in response to emission reductions of SO2 and NOx in the region, Atmos. Chem. Phys., 20, 3107–3134, https://doi.org/10.5194/acp-20-3107-2020, 2020.
Feng, S., Jiang, F., Wang, H., Wang, H., Ju, W., Shen, Y., Zheng, Y., Wu, Z., and Ding, A.: NOx emission changes over China during the COVID-19 epidemic inferred from surface NO2 observations, Geophys. Res. Lett., 47, e2020GL090080, https://doi.org/10.1029/2020GL088533, 2020.
Griffiths, J. and Woodyatt, A.: Wuhan coronavirus: Thousands of cases confirmed as China goes into emergency mode, CNN, Archived from the original on 28, 2020.
He, J., Gong, S., Yu, Y., Yu, L., Wu, L., Mao, H., Song, C., Zhao, S., Liu, H., and Li, X.: Air pollution characteristics and their relation to meteorological conditions during 2014–2015 in major Chinese cities, Environ. Pollut., 223, 484–496, https://doi.org/10.1016/j.envpol.2017.01.050, 2017.
Horowitz, R. I. and Freeman, P. R.: Three novel prevention, diagnostic, and treatment options for COVID-19 urgently necessitating controlled randomized trials, Med. Hypotheses, 143, 109851, https://doi.org/10.1016/j.mehy.2020.109851, 2020.
Hu, Y., Lin, J., Zhang, S., Kong, L., Fu, H., and Chen, J.: Identification of the typical metal particles among haze, fog, and clear episodes in the Beijing atmosphere, Sci. Total Environ., 511, 369–380, https://doi.org/10.1016/j.scitotenv.2014.12.071, 2015.
Huang, X., Ding, A., Gao, J., Zheng, B., Zhou, D., Qi, X., Tang, R., Wang, J., Ren, C., and Nie, W.: Enhanced secondary pollution offset reduction of primary emissions during COVID-19 lockdown in China, Natl. Sci. Rev., 8, nwaa137, https://doi.org/10.1093/nsr/nwaa137, 2020.
Jiang, F., Liu, F., Lin, Q., Fu, Y., Yang, Y., Peng, L., Lian, X., Zhang, G., Bi, X., and Wang, X.: Characteristics and formation mechanisms of sulfate and nitrate in size-segregated atmospheric particles from urban Guangzhou, China, Aerosol Air Qual. Res., 19, 1284–1293, https://doi.org/10.4209/aaqr.2018.07.0251, 2019.
Kang, Y., Liu, M., Song, Y., Huang, X., Yao, H., Cai, X., Zhang, H., Kang, L., Liu, X., Yan, X., He, H., Zhang, Q., Shao, M., and Zhu, T.: High-resolution ammonia emissions inventories in China from 1980 to 2012, Atmos. Chem. Phys., 16, 2043–2058, https://doi.org/10.5194/acp-16-2043-2016, 2016.
Kraemer, M. U., Yang, C.-H., Gutierrez, B., Wu, C.-H., Klein, B., Pigott, D. M., Du Plessis, L., Faria, N. R., Li, R., and Hanage, W. P.: The effect of human mobility and control measures on the COVID-19 epidemic in China, Science, 368, 493–497, https://doi.org/10.1126/science.abb4218, 2020.
Li, R., Cui, L., Li, J., Zhao, A., Fu, H., Wu, Y., Zhang, L., Kong, L., and Chen, J.: Spatial and temporal variation of particulate matter and gaseous pollutants in China during 2014–2016, Atmos. Environ., 161, 235–246, https://doi.org/10.1016/j.atmosenv.2017.05.008, 2017.
Li, R., Wang, Z. Z., Cui, L. L., Fu, H. B., Zhang, L. W., Kong, L. D., Chen, W. D., and Chen, J. M.: Air pollution characteristics in China during 2015-2016: spatiotemporal variations and key meteorological factors, Sci. Total Environ., 648, 902–915, https://doi.org/10.1016/j.scitotenv.2018.08.181, 2019.
Liu, B., Wu, J., Zhang, J., Wang, L., Yang, J., Liang, D., Dai, Q., Bi, X., Feng, Y., and Zhang, Y.: Characterization and source apportionment of PM2.5 based on error estimation from EPA PMF 5.0 model at a medium city in China, Environ. Pollut., 222, 10–22, https://doi.org/10.1016/j.envpol.2017.01.005, 2017.
Liu, J., Chen, Y., Chao, S., Cao, H., Zhang, A., and Yang, Y.: Emission control priority of PM2.5-bound heavy metals in different seasons: A comprehensive analysis from health risk perspective, Sci. Total Environ., 644, 20–30, https://doi.org/10.1016/j.scitotenv.2018.06.226, 2018.
Liu, K., Wang, S., Wu, Q., Wang, L., Ma, Q., Zhang, L., Li, G., Tian, H., Duan, L., and Hao, J.: A highly resolved mercury emission inventory of Chinese coal-fired power plants, Environ. Sci. Technol., 52, 2400–2408, https://doi.org/10.1021/acs.est.7b06209, 2018.
Liu, P., Ye, C., Xue, C., Zhang, C., Mu, Y., and Sun, X.: Formation mechanisms of atmospheric nitrate and sulfate during the winter haze pollution periods in Beijing: gas-phase, heterogeneous and aqueous-phase chemistry, Atmos. Chem. Phys., 20, 4153–4165, https://doi.org/10.5194/acp-20-4153-2020, 2020.
Liu, T., Wang, X. Y., Hu, J. L., Wang, Q., An, J. Y., Gong, K. J., Sun, J. J., Li, L., Qin, M. M., Li, J. Y., Tian, J. J., Huang, Y. W., Liao, H., Zhou, M., Hu, Q. Y., Yan, R. S., Wang, H. L., and Huang, C.: Driving Forces of Changes in Air Quality during the COVID-19 Lockdown Period in the Yangtze River Delta Region, China, Environ. Sci. Technol., 7, 779–786, https://doi.org/10.1021/acs.estlett.0c00511, 2020.
Liu, Y. and Wang, T.: Worsening urban ozone pollution in China from 2013 to 2017 – Part 1: The complex and varying roles of meteorology, Atmos. Chem. Phys., 20, 6305–6321, https://doi.org/10.5194/acp-20-6305-2020, 2020.
Luo, R., Han, Y., and Liu, Z.: The current status and factors of indoor PM2.5 in Tangshan, China. Procedia Engineer., 205, 3824–3829, https://doi.org/10.1016/j.proeng.2017.10.086, 2017.
Manousakas, M., Papaefthymiou, H., Diapouli, E., Migliori, A., Karydas, A., Bogdanovic-Radovic, I., and Eleftheriadis, K.: Assessment of PM2.5 sources and their corresponding level of uncertainty in a coastal urban area using EPA PMF 5.0 enhanced diagnostics, Sci. Total Environ., 574, 155–164, https://doi.org/10.1016/j.scitotenv.2016.09.047, 2017.
Marlier, M. E., Xing, J., Zhu, Y., and Wang, S.: Impacts of COVID-19 response actions on air quality in China, Environmental Research Communications, 28, 075003, https://doi.org/10.1088/2515-7620/aba425, 2020.
Meng, Y., Li, R., Zhao, Y., Cheng, H., Fu, H., Yan, Z., and Bing, H.: Chemical characterization and sources of PM2.5 at a high-alpine ecosystem in the Southeast Tibetan Plateau, China, Atmos. Environ., 235, 117645, https://doi.org/10.1016/j.atmosenv.2020.117645, 2020.
Miyazaki, K., Bowman, K., Sekiya, T., Jiang, Z., Chen, X., Eskes, H., Ru, M., Zhang, Y., and Shindell, D.: Air Quality Response in China Linked to the 2019 Novel Coronavirus (COVID-19) Lockdown, Geophys. Res. Lett., 47, e2020GL089252, https://doi.org/10.1029/2020GL089252, 2020.
Ren, Z., Zhang, B., Lu, P., Li, C., Gao, L., and Zheng, M.: Characteristics of air pollution by polychlorinated dibenzo-p-dioxins and dibenzofurans in the typical industrial areas of Tangshan City, China, J. Environ. Sci., 23, 228-235, https://doi.org/10.1016/S1001-0742(10)60425-1, 2011.
Shao, J., Chen, Q., Wang, Y., Lu, X., He, P., Sun, Y., Shah, V., Martin, R. V., Philip, S., Song, S., Zhao, Y., Xie, Z., Zhang, L., and Alexander, B.: Heterogeneous sulfate aerosol formation mechanisms during wintertime Chinese haze events: air quality model assessment using observations of sulfate oxygen isotopes in Beijing, Atmos. Chem. Phys., 19, 6107–6123, https://doi.org/10.5194/acp-19-6107-2019, 2019.
Sharma, S., Mandal, T., Jain, S., Sharma, A., and Saxena, M.: Source apportionment of PM2.5 in Delhi, India using PMF model, B. Environ. Contam. Tox., 97, 286–293, https://doi.org/10.1007/s00128-016-1836-1, 2016.
Shen, Z., Sun, J., Cao, J., Zhang, L., Zhang, Q., Lei, Y., Gao, J., Huang, R. J., Liu, S., and Huang, Y.: Chemical profiles of urban fugitive dust PM2.5 samples in Northern Chinese cities, Sci. Total Environ., 569, 619–626, https://doi.org/10.1016/j.scitotenv.2016.06.156, 2016.
Shi, X. and Brasseur, G. P.: The Response in Air Quality to the Reduction of Chinese Economic Activities during the COVID-19 Outbreak, Geophys. Res. Lett., 47, e2020GL088070, https://doi.org/10.1029/2020GL088070, 2020.
Shi, Z., Huang, L., Li, J., Ying, Q., Zhang, H., and Hu, J.: Sensitivity analysis of the surface ozone and fine particulate matter to meteorological parameters in China, Atmos. Chem. Phys., 20, 13455–13466, https://doi.org/10.5194/acp-20-13455-2020, 2020.
Sun, W., Shao, M., Granier, C., Liu, Y., Ye, C., and Zheng, J.: Long-term trends of anthropogenic SO2, NOx, CO, and NMVOCs emissions in China, Earths Future, 6, 1112–1133, https://doi.org/10.1029/2018EF000822, 2018.
Tian, M., Liu, Y., Yang, F., Zhang, L., Peng, C., Chen, Y., Shi, G., Wang, H., Luo, B., and Jiang, C.: Increasing importance of nitrate formation for heavy aerosol pollution in two megacities in Sichuan Basin, southwest China, Environ. Pollut., 250, 898–905, https://doi.org/10.1016/j.envpol.2019.04.098, 2019.
Urrutia-Goyes, R., Hernandez, N., Carrillo-Gamboa, O., Nigam, K., and Ornelas-Soto, N.: Street dust from a heavily-populated and industrialized city: Evaluation of spatial distribution, origins, pollution, ecological risks and human health repercussions, Ecotox. Environ. Safe., 159, 198–204, https://doi.org/10.1016/j.ecoenv.2018.04.054, 2018.
Venter, Z. S., Aunan, K., Chowdhury, S., and Lelieveld, J.: COVID-19 lockdowns cause global air pollution declines with implications for public health risk, 117, 18984–18990, https://doi.org/10.1073/pnas.2006853117, 2020.
Wang, Y., Ying, Q., Hu, J., and Zhang, H.: Spatial and temporal variations of six criteria air pollutants in 31 provincial capital cities in China during 2013–2014, Environ. Int., 73, 413–422, https://doi.org/10.1016/j.envint.2014.08.016, 2014.
Wu, F., Zhao, S., Yu, B., Chen, Y. M., Wang, W., Song, Z. G., Hu, Y., Tao, Z. W., Tian, J. H., and Pei, Y. Y.: A new coronavirus associated with human respiratory disease in China, Nature, 579, 265–269, https://doi.org/10.1038/s41586-020-2008-3, 2020.
Wu, L. Y., Tong, S. R., Wang, W. G., and Ge, M. F.: Effects of temperature on the heterogeneous oxidation of sulfur dioxide by ozone on calcium carbonate, Atmos. Chem. Phys., 11, 6593–6605, https://doi.org/10.5194/acp-11-6593-2011, 2011.
Wu, Q. R., Wang, S. X., Zhang, L., Song, J. X., Yang, H., and Meng, Y.: Update of mercury emissions from China's primary zinc, lead and copper smelters, 2000–2010, Atmos. Chem. Phys., 12, 11153–11163, https://doi.org/10.5194/acp-12-11153-2012, 2012.
Wu, Y., Lin, S., Tian, H., Zhang, K., Wang, Y., Sun, B., Liu, X., Liu, K., Xue, Y., and Hao, J.: A quantitative assessment of atmospheric emissions and spatial distribution of trace elements from natural sources in China, Environ. Pollut., 259, 113918, https://doi.org/10.1016/j.envpol.2020.113918, 2020.
Xu, J., Ge, X., Zhang, X., Zhao, W., Zhang, R., and Zhang, Y.: COVID-19 impact on the concentration and composition of submicron particulate matter in a typical city of Northwest China, Geophys. Res. Lett., 47, e2020GL089035, https://doi.org/10.1029/2020GL089035, 2020.
Yao, Q., Liu, Z., Han, S., Cai, Z., Liu, J., Hao, T., Liu, J., Huang, X., and Wang, Y.: Seasonal variation and secondary formation of size-segregated aerosol water-soluble inorganic ions in a coast megacity of North China Plain, Environ. Sci. Pollut. R, 27, 26750–26762, https://doi.org/10.1007/s11356-020-09052-0, 2020.
Zhang, K., Ma, Y., Xin, J., Liu, Z., Ma, Y., Gao, D., Wu, J., Zhang, W., Wang, Y., and Shen, P.: The aerosol optical properties and PM2.5 components over the world's largest industrial zone in Tangshan, North China, Atmos. Res., 201, 226–234, https://doi.org/10.1016/j.atmosres.2017.10.025, 2018.
Zhang, Q., Zheng, Y., Tong, D., Shao, M., Wang, S., Zhang, Y., Xu, X., Wang, J., He, H., and Liu, W.: Drivers of improved PM2.5 air quality in China from 2013 to 2017, P. Natl. Acad. Sci. USA, 116, 24463–24469, https://doi.org/10.1073/pnas.1907956116, 2019.
Zhang, X., Murakami, T., Wang, J., and Aikawa, M.: Sources, species and secondary formation of atmospheric aerosols and gaseous precursors in the suburb of Kitakyushu, Japan, Sci. Total. Environ., 763, 143001, https://doi.org/10.1016/j.scitotenv.2020.143001, 2020.
Zhang, Y., Vu, T. V., Sun, J., He, J., Shen, X., Lin, W., Zhang, X., Zhong, J., Gao, W., and Wang, Y.: Significant Changes in Chemistry of Fine Particles in Wintertime Beijing from 2007 to 2017: Impact of Clean Air Actions, Environ. Sci. Technol., 54, 1344–1352, https://doi.org/10.1021/acs.est.9b04678, 2019.
Zhang, Y., Liu, X., Fang, Y., Liu, D., Tang, A., and Collett, J. L.: Atmospheric Ammonia in Beijing during the COVID-19 Outbreak: Concentrations, Sources, and Implications, Environ. Sci. Tech. Let., 8, https://doi.org/10.1021/acs.estlett.0c00756, 2020.
Zheng, B., Zhang, Q., Geng, G., Shi, Q., Lei, Y., and He, K.: Changes in China's anthropogenic emissions during the COVID-19 pandemic, Earth Syst. Sci. Data Discuss. [preprint], https://doi.org/10.5194/essd-2020-355, in review, 2020.
Zheng, H., Kong, S., Yan, Q., Wu, F., Cheng, Y., Zheng, S., Wu, J., Yang, G., Zheng, M., and Tang, L.: The impacts of pollution control measures on PM2.5 reduction: Insights of chemical composition, source variation and health risk, Atmos. Environ., 197, 103–117, https://doi.org/10.1016/j.atmosenv.2018.10.023, 2019.
Zheng, H., Kong, S., Chen, N., Yan, Y., Liu, D., Zhu, B., Xu, K., Cao, W., Ding, Q., and Lan, B.: Significant changes in the chemical compositions and sources of PM2.5 in Wuhan since the city lockdown as COVID-19, Sci. Total Environ., 739, 140000, https://doi.org/10.1016/j.scitotenv.2020.140000, 2020.
Zhou, S., Davy, P. K., Huang, M., Duan, J., Wang, X., Fan, Q., Chang, M., Liu, Y., Chen, W., Xie, S., Ancelet, T., and Trompetter, W. J.: High-resolution sampling and analysis of ambient particulate matter in the Pearl River Delta region of southern China: source apportionment and health risk implications, Atmos. Chem. Phys., 18, 2049–2064, https://doi.org/10.5194/acp-18-2049-2018, 2018.
Zhu, C., Tian, H., Hao, Y., Gao, J., Hao, J., Wang, Y., Hua, S., Wang, K., and Liu, H.: A high-resolution emission inventory of anthropogenic trace elements in Beijing-Tianjin-Hebei (BTH) region of China, Atmos. Environ., 191, 452–462, https://doi.org/10.1016/j.atmosenv.2018.08.035, 2018.
Zhu, C., Tian, H., and Hao, J.: Global anthropogenic atmospheric emission inventory of twelve typical hazardous trace elements, 1995–2012, Atmos. Environ., 220, 117061, https://doi.org/10.1016/j.atmosenv.2019.117061, 2020.