the Creative Commons Attribution 4.0 License.
the Creative Commons Attribution 4.0 License.
 | 07 Jun 2021
Measurement report: Molecular composition, optical properties, and radiative effects of water-soluble organic carbon in snowpack samples from northern Xinjiang, China
Christopher P. West
Anusha P. S. Hettiyadura
Xiaoying Niu
Jiecan Cui
Tenglong Shi
Water-soluble organic carbon (WSOC) in the cryosphere has an important impact on the biogeochemistry cycling and snow–ice surface energy balance through changes in the surface albedo. This work reports on the chemical characterization of WSOC in 28 representative snowpack samples collected across a regional area of northern Xinjiang, northwestern China. We employed multimodal analytical chemistry techniques to investigate both bulk and molecular-level composition of WSOC and its optical properties, informing the follow-up radiative forcing (RF) modeling estimates. Based on the geographic differences and proximity of emission sources, the snowpack collection sites were grouped as urban/industrial (U), rural/remote (R), and soil-influenced (S) sites, for which average WSOC total mass loadings were measured as 1968 ± 953 ng g−1 (U), 885 ± 328 ng g−1 (R), and 2082 ± 1438 ng g−1 (S), respectively. The S sites showed the higher mass absorption coefficients at 365 nm (MAC365) of 0.94 ± 0.31 m2 g−1 compared to those of U and R sites (0.39 ± 0.11 m2 g−1 and 0.38 ± 0.12 m2 g−1, respectively). Bulk composition of WSOC in the snowpack samples and its basic source apportionment was inferred from the excitation–emission matrices and the parallel factor analysis featuring relative contributions of one protein-like (PRLIS) and two humic-like (HULIS-1 and HULIS-2) components with ratios specific to each of the S, U, and R sites. Additionally, a sample from site 120 showed unique pollutant concentrations and spectroscopic features remarkably different from all other U, R, and S samples. Molecular-level characterization of WSOC using high-resolution mass spectrometry (HRMS) provided further insights into chemical differences among four types of samples (U, R, S, and 120). Specifically, many reduced-sulfur-containing species with high degrees of unsaturation and aromaticity were uniquely identified in U samples, suggesting an anthropogenic source. Aliphatic/protein-like species showed the highest contribution in R samples, indicating their biogenic origin. The WSOC components from S samples showed high oxygenation and saturation levels. A few unique CHON and CHONS compounds with high unsaturation degree and molecular weight were detected in the 120 sample, which might be anthraquinone derivatives from plant debris. Modeling of the WSOC-induced RF values showed warming effects of 0.04 to 0.59 W m−2 among different groups of sites, which contribute up to 16 % of that caused by black carbon (BC), demonstrating the important influences of WSOC on the snow energy budget.
- Article
(4575 KB) - Full-text XML
-
Supplement
(1125 KB) - BibTeX
- EndNote


As the largest component of the terrestrial cryosphere (Brutel-Vuilmet et al., 2013), snow covers up to 40 % of Earth's land seasonally (Hall et al., 1995). Snowfall is a crucial fresh water, nutrient, and carbon source for land ecosystems (Jones, 1999; Mladenov et al., 2012), especially for barren regions such as northwestern China (Xu et al., 2010). Chemical deposits in the snowpack are highly photochemically and biologically active, which in turn influences biogeochemical cycles and the atmospheric environment (Grannas et al., 2007; Liu et al., 2009). With respect to the climate effects, the snow–ice surface has the highest albedo, which makes it the highest light reflecting surface on Earth and a key factor influencing the Earth's radiative balance. The deposition of light-absorbing particles (LAPs), primarily black carbon (BC), organic carbon (OC), mineral dust (MD), and microbes, on snow reduces the snow albedo significantly and increases the absorption of solar radiation (Hadley and Kirchstetter, 2012; Skiles et al., 2018). Consequently, deposits of LAPs accelerate snow melting (Hansen and Nazarenko, 2004) and affect the snow photochemistry (Zatko et al., 2013), further influencing the regional and global climate (Bond et al., 2013; Flanner et al., 2007; Jacobson, 2004). The albedo reduction and radiative forcing (RF) due to the BC and MD deposits in snow have been a subject of many field studies (Doherty et al., 2010; Huang et al., 2011; Pu et al., 2017; Shi et al., 2020; Wang et al., 2013, 2017b; Y. Zhang et al., 2018), remote sensing estimates (Painter et al., 2010; Pu et al., 2019), and climate model simulations (He et al., 2014; Qian et al., 2014; Zhao et al., 2014). Darkening of snow by biological organisms, like snow algae common in high-altitude and high-latitude snowpack, has also been investigated (Cook et al., 2017a, b; Ganey et al., 2017; Lutz et al., 2014). However, yet little is known about the chemical compositions, optical properties, and radiative effects of OC compounds in snow, which result from both deposition of organic aerosol from natural and anthropogenic sources, as well as deposits of the wind-blown soil organic matter (Pu et al., 2017; Wang et al., 2013).
Water-soluble OC (WSOC) contributes to a large portion (10 %–80 %) of organic aerosol (Kirillova et al., 2014; Y.-L. Zhang et al., 2018), and it is also widely distributed in the cryosphere. The polar ice sheets and mountain glaciers store large amounts of organic carbon, which provide approximately 1.04 ± 0.18 Tg C yr−1 of WSOC exported into proglacial aquatic environments (Hood et al., 2015), with a substantial part of it being highly bioavailable (Singer et al., 2012; Y. Zhou et al., 2019b). WSOC components that absorb solar radiation at ultraviolet to visible (UV–vis) wavelengths are collectively termed “brown carbon (BrC)” (Andreae and Gelencser, 2006) and have become the subject of many aerosol studies (Laskin et al., 2015). The optical properties of WSOC in snow started to receive attention because of its important role in initiating snow photochemistry (McNeill et al., 2012). Anastasio and Robles (2007) first quantified the light absorption of water-soluble chromophores in Arctic and Antarctic snow samples. They found that ∼ 50 % of absorption for wavelengths greater than 280 nm was attributed to organic chromophores. Subsequently, Beine et al. (2011) determined the light absorption of humic-like substances (HULISs) in snow at Barrow, Alaska. They found that HULISs account for nearly half of the total absorption by dissolved chromophores within the photochemically active wavelength region (300 to 450 nm), concluding that HULISs are a major type of light absorber in Barrow snow and that the HULIS-mediated photochemistry is probably important for the regional environment. Several recent works have reported the radiative absorption of snow WSOC. Yan et al. (2016) estimated the amount of the solar radiation absorbed by WSOC from snow collected in northern Tibetan Plateau (TP), which was 10 % relative to that absorbed by BC, indicating a non-negligible role of WSOC in accelerating snow and ice melting. Similar results were also reported for WSOC extracted from other high-mountain areas (Niu et al., 2018; Zhang et al., 2019). However, chemical characterization and optical properties of the light-absorbing WSOC (a.k.a. BrC) in the cryosphere are still an emerging topic. To date, no field study has evaluated yet the composition-specific influence of WSOC on the snow albedo reduction.
The fluorescence excitation–emission matrix (EEM) analysis is a sensitive, rapid, and non-destructive optical spectroscopy method (Birdwell and Valsaraj, 2010) that has been used to investigate the bulk composition and attribute potential sources of chromophoric WSOC in aquatic ecosystems (Jaffé et al., 2014) and more recently in aerosols (Chen et al., 2016b, 2020; Fu et al., 2015; Mladenov et al., 2011; G. Wu et al., 2019). Based on parallel factor (PARAFAC) analysis, contributions from main fluorescent components such as different fractions of HULIS and protein-like substances (PRLISs) can be quantitatively evaluated (Stedmon and Bro, 2008), indicating plausible sources of WSOC in aquatic (Murphy et al., 2008) and atmospheric samples (Wu et al., 2021). The chemical interpretations of PARAFAC-derived components are relatively well characterized for aquatic WSOC, but it may not be simply applied to WSOC in snow because their sources and geochemical processes are highly different (Wu et al., 2021).
High-resolution mass spectrometry (HRMS) interfaced with soft electrospray ionization (ESI) can help to decipher the complexity of WSOC, providing an explicit description of its individual molecular components (Qi et al., 2020). Thousands of individual organic species with unambiguously identified elemental compositions can be detected at once by ESI–HRMS due to its high mass resolving power, mass accuracy, and dynamic range (Nizkorodov et al., 2011; Noziere et al., 2015). Combined with a high-performance liquid chromatography (HPLC) separation stage and photodiode array (PDA) detector, the integrated HPLC–PDA–HRMS platform enables the separation of WSOC components into fractions with characteristic retention times, UV–vis spectra, and elemental composition. Correlative analysis of these multimodal data sets facilitates the comprehensive characterization of chromophores present in complex environmental mixtures (Laskin et al., 2015; Lin et al., 2016, 2018; Wang et al., 2020a). Presently, HRMS studies of WSOC existing in the cryosphere are still limited to the snow–ice in polar regions (Antony et al., 2014, 2017; Bhatia et al., 2010) and mountain glaciers in the Alps (Singer et al., 2012) and on the TP (Feng et al., 2016; Spencer et al., 2014; L. Zhou et al., 2019) with perennial snowpack. For the regions mentioned above, WSOC in snow–ice samples is dominated by protein- or lipid-like compounds from autochthonous microbial activity with high bioavailability, whereas snow in northwestern China is seasonal, the snowpack persists for 3–6 months annually, and its composition is substantially influenced by local soil dust and deposited aerosols from both natural and anthropogenic sources (Pu et al., 2017). Therefore, the chemical compositions and optical properties of WSOC from this area snowpack are likely different from those reported for the remote regions with more persistent snow coverage.

Figure 1(a) Sampling locations and site numbers with photographs for typical land use types of sampling sites. (b) Spatial distribution of WSOC concentrations in snow. Sampling sites are divided into four groups indicated by different colors. The bubble sizes are proportional to the WSOC concentrations. (d) Variations in BC and WSOC concentrations among four groups of sites. The boxes denote the 25th and 75th quantiles, the horizontal lines represent the medians, and the averages are shown as dots; the whiskers denote the maximum and minimum data within 1.5 times the interquartile range, and the data points out of this range are marked with crosses (+).
In this study, seasonal snow samples were collected across the northern Xinjiang region of China in January 2018. We investigate the optical and molecular characteristics of WSOC using a range of analytical techniques, including UV–vis absorption spectrophotometry, EEM, and HPLC–ESI–HRMS. Furthermore, based on the measured optical properties and concentrations of snow impurities, as well as the physical properties of snow at each site, we calculate for the first time extent of RF attributed to WSOC in snow.
2.1 Sample collection
A total of 28 surface and 8 subsurface snow samples were collected from 28 sites in Xinjiang, northwestern China, during a road trip in January 2018. The area map and sampling locations are shown in Fig. 1a. The sampling sites were numbered in chronological order and with a numbering scheme adopted from our previous campaigns (Pu et al., 2017; Wang et al., 2013, 2017b; Ye et al., 2012). The sampling sites were classified into four groups based on their geographical location and proximity to urban areas (Table S1 in the Supplement): urban/industrial (U) sites (nos. 106–118 and 131), rural/remote (R) sites (nos. 119, 121–125, and 127–130), soil-influenced (S) sites (nos. 104, 105, and 126), and site 120. The U sites were located north of the Tianshan Mountains, near major cities in Xinjiang area. These sites were more likely influenced by local anthropogenic emissions (Pu et al., 2017). The rest of the sites were assigned to R group, most of which were from desert areas or barren grasslands located at least ∼ 50–100 km from major cities; hence, they were mostly influenced by natural sources. The S sites are a subgroup of the R group, and they correspond to specific locations where the snowpack was visibly patchy and shallow, so local soil could be blown into snow by strong winds. For the S samples, the coarse mineral particles of yellow-brown color were clearly seen on the filters following snow water filtration (Fig. S1 in the Supplement), consistent with the expected high loadings of soils at these sites. From the R group, a sample from site 120 was considered separately because it showed compositional and optical characteristics inconsistent with all other samples. For instance, it had very low BC concentration but the highest WSOC concentration among all the samples; hence, it is discussed separately.
Details of the sampling procedures can be found elsewhere (Wang et al., 2013), and they are briefly described here. The snow sampling sites were selected at least 20 km from cities and villages and at least 1 km upwind of the approach road or railway such that the influence from single-point very local sources was minimized and the samples would rather reflect conditions of large regional areas. The snow samples were collected in sterile plastic bags (Whirl-Pak, Nasco, WI, USA) using clean, stainless steel utensils and by scooping ∼ 3 L of snow from the top 5 cm at each site, resulting in ∼ 600 mL volume of melted snow water. For several sites with snowpack deeper than 10 cm, subsurface snow (∼ 5–10 cm) was also collected. Snow depths, snow density, and snow temperature were also measured for each sampled snow layer (Shi et al., 2020). All collected samples were then stored in a freezer (< −20 ∘C) until further processing. A total of 28 surface samples were analyzed by the following analytical techniques.
2.2 Chemical species analysis
The snow samples were melted under room temperature and immediately filtered by polytetrafluoroethylene (PTFE) syringe filters with a pore size of 0.22 µm (Thermo Fisher, Inc.) to remove insoluble solids. Obtained filtrates were then used for the measurements of concentrations of soluble inorganic ions, mass loadings of WSOC, acquisition of bulk UV–vis absorption and EEM spectra, and molecular characterization using HPLC–ESI–HRMS platform.
The major inorganic ions (Na+, , K+, Mg2+, Ca2+, Cl−, , and ) were measured by an ion chromatography system (Dionex 600, Thermo Scientific, MA, USA) using an IonPac AS22 column for anions and an IonPac CS12A column for cations. The detection limits for all inorganic ions are greater than 0.05 mg L−1. The concentrations of WSOC were analyzed by a total organic carbon analyzer (Aurora 1030W, OI Analytical, TX, USA). Each measurement was done in triplicate, and the average concentrations of four groups of samples and the values for each sample after blank subtraction are presented in Tables S2 and S3, respectively. The detection limit and relative standard deviation of measurements were 2 ppb and 1 %, respectively.
The BC concentrations in snow were measured by a custom-developed two-sphere integration (TSI) spectrophotometer (Wang et al., 2020b) and have been reported by Shi et al. (2020). The distribution of BC concentrations in snow samples is also shown in Fig. S2.
2.3 UV–vis absorption and fluorescence EEM spectroscopic measurements
The UV–vis absorption and fluorescence EEM spectra were recorded simultaneously by an Aqualog spectrofluorometer (Horiba Scientific, NJ, USA) in a 1 cm quartz cuvette. The excitation wavelengths for EEM were 240 to 600 nm in intervals of 5 nm and were the same for UV–vis spectrum acquisition. The fluorescence emission range was 250 to 825 nm in 5 nm intervals with an integration time of 0.5 s. An ultrapure water (18.2 MΩ cm, Milli-Q purification system, Millipore, Bedford, MA, USA) was used for blank measurement, subtracted from all sample spectra.
The absorbance at 600 nm was subtracted from the whole spectrum to correct the scattering effects and baseline shifts of the instrument (Chen et al., 2019). The BrC mass absorption coefficients (MAC; m2 g−1) related to WSOC contributions were calculated by
where λ is the wavelength, A is the base-10 absorbance measured by the spectrophotometer, CWSOC (mg L−1) is the concentration of WSOC, and L is the cuvette path length (0.01 m). To characterize the wavelength dependence of MACBrC, absorption Ångström exponents (AAEs) were determined by a power-law regression (Kirchstetter et al., 2004):
where k is a constant related to WSOC concentrations. To exclude absorption due to inorganic chromophores (e.g., nitrate), the AAE values were derived from the power law fits limited to the range of 330–400 nm (AAE330−400) (Yan et al., 2016).
Processing the EEM data followed the protocols described elsewhere (Y. Zhou et al., 2019a). Briefly, the raw EEM data sets were first background subtracted to remove the water Raman scatter peaks, and then the inner filter effect was corrected (Kothawala et al., 2013). The fluorescence intensities were normalized to water Raman unit (RU) (Lawaetz and Stedmon, 2009). The processed EEM data were analyzed by the PARAFAC model in a manner similar to our previous report (Y. Zhou et al., 2019a). In this study, the PARAFAC modeling was conducted using the drEEM toolbox (version 0.2.0, http://models.life.ku.dk/drEEM, last access: 26 May 2021) (Murphy et al., 2013). According to the analysis of residual errors of two- to seven-component models and split-half analysis, a three-component model was selected. Only two- and three-component models have passed the split-half analysis with the “S4C6T3” split scheme (Fig. S3) (Murphy et al., 2013). Moreover, the sum of residual error decreased significantly when the number of components increased from two to three (Fig. S4). The spectra of derived fluorescent components appeared consistent with those commonly found in other studies (Table S4).
2.4 HPLC–ESI–HRMS molecular analysis and data processing
The WSOC extracts were desalted and concentrated through solid phase extraction (SPE) method using DSC18 cartridges (Supelco, Millipore Sigma, PA, USA). The cartridges were conditioned and equilibrated by one-column volume (∼ 3 mL) of acetonitrile (ACN; Optima, LC/MS grade, Fisher Scientific Inc.) and one-column volume of water (Optima, LC/MS grade, Fisher Scientific Inc.), respectively. To increase the efficiency of SPE, the sample was acidified to pH ≈ 2 using HCl (Lin et al., 2010), and 3 mL of acidified sample flowed through the cartridge at a low flow rate of 1–2 drops per second. Salts and other unretained compounds (e.g., small molecular acids and carbohydrates) were first washed out by one-column volume of water, and the analyte retained on the cartridge was then eluted by two-column volumes of ACN. The efficiency of SPE was evaluated by measuring the UV–vis absorption before and after elution and ensured the good recovery of analytes (Sect. S1 in the Supplement). The ACN eluents were concentrated to 150 µL under a gentle stream of pure N2 and then diluted by adding 150 µL of ultrapure water. Finally, the reconstituted extracts were further concentrated to 200 µL prior to HPLC analysis.
The obtained extracts were analyzed using a Vanquish HPLC system coupled to a Q Exactive HF-X Orbitrap HRMS with an Ion Max ESI source (all from Thermo Scientific Inc.). The HPLC separation was performed on a Phenomenex Luna C18 revised-phase column (2 mm × 150 mm, 5 µm particles, 100 Å pores). A gradient elution was performed at a flow rate of 200 µL min−1 by an A + B binary mobile phase system: (A) water with 0.05 % formic acid and (B) acetonitrile with 0.05 % formic acid (Optima, LC-MS grade, Fisher Scientific Inc.). The elution protocol was 0–3 min hold at 90 % A, 3–90 min linear gradient to 0 % A, 90–100 min hold at 0 % A, and then 100–130 min hold at 90 % A to recondition the column for the next sample. The column temperature was maintained at 25 ∘C, and the sample injection volume was 25 µL. The UV–vis absorption of eluted chromophores was recorded by a PDA detector over the wavelength range of 200 to 680 nm. Correlation analysis between PDA and MS peaks and relative absorption of different chromophore fractions will be discussed in an upcoming paper. For ESI–HRMS analysis, the following settings were used: 45 units of sheath gas, 10 units of auxiliary gas, 2 units of sweep gas, a spray voltage of 3.5 kV, and a capillary temperature of 250 ∘C, and a sweep cone was used. The mass spectra were acquired at a mass range of 80–1200 Da at mass resolving power of Δ = 240 000 at m/z 200. Mass calibration was performed using commercial calibration solutions (PI-88323 and PI-88324, Thermo Scientific) for ESI(+/−) modes.
The raw experimental data files were acquired by Xcalibur software (Thermo Scientific Inc.). The HPLC–ESI–HRMS data sets were preliminarily processed using an open-source software toolbox, MZmine 2 (http://mzmine.github.io/, last access: 26 May 2021), to perform peak deconvolution and chromatogram construction (Myers et al., 2017; Pluskal et al., 2010). The background subtraction and formula assignment were performed using customized Microsoft Excel macros (Roach et al., 2011). The formulas were assigned based on first- and second-order Kendrick mass defects and a MIDAS formula calculator (https://nationalmaglab.org/user-facilities/icr/icr-software, last access: 26 May 2021). , , and ions were assumed to identify products detected in ESI+ and ESI− modes, respectively. Moreover, adduct ions were also identified and removed using a homemade MATLAB script (Text S2). The molecular formulas were assigned using the following constraints: , , N≤5, O≤50, S≤1, and Na≤1 (ESI+ only) and mass tolerance of < 3.0 ppm. Furthermore, to eliminate the formulas not likely to be observed in nature, the elemental ratio limits of , , , (Lin et al., 2012; Wang et al., 2018) were applied. The double-bond equivalent (DBE) values of the neutral assigned species CcHhOoNnSs were calculated using the equation
The aromaticity index (AI) is a conservative criterion for the unequivocal identification of aromatic and condensed aromatic structures in natural organic matter calculated as (Koch and Dittmar, 2006, 2016)
AI > 0.5 and AI ≥ 0.67 are unambiguous minimum thresholds for the presence of aromatic and condensed aromatic structures in a molecule, respectively. If either the numerator or denominator in Eq. (4) equals 0, then AI is assigned a value of 0.
The intensity (I∗) weighted molecular weight (MWw) and other characteristic molecular parameters of (), (), DBE (DBEw), (), and AI (AIw) were calculated using Eq. (5):
where Xw represents any of the weighted parameters introduced above, and and Xi are the corresponding intensity and the molecular parameter values calculated for each assigned species i, respectively.
2.5 Snow albedo modeling and radiative forcing calculations
The spectral snow albedo was calculated by the snow, ice, and aerosol radiative (SNICAR) model (Flanner et al., 2007), which accounts for the radiative transfer in the snowpack based on the theory from Wiscombe and Warren (1980) and the two-stream, multilayer radiative approximation (Toon et al., 1989). The input parameters required for the SNICAR model are snow depth, snow density, effective snow grain size, solar zenith angle, and impurity concentrations. Snow depth and density were measured in the field. The effective snow grain size was retrieved from the spectral albedo measured in the field, and detailed information can be found in our previous study (Shi et al., 2020). The solar zenith angle was calculated using the site location and sampling date for each site. The input values of parameters for the SNICAR model, which are those for surface snow, are summarized in Table S5. For simplicity, a homogenous snowpack assumption was applied for both snow physical properties and pollutant concentrations.
To evaluate the influence of BrC attributed to WSOC on the snow albedo, optical properties of BrC material such as single scattering albedo (SSA), asymmetry factor (g), and mass extinction coefficient (MEC) are needed as inputs for simulation. These parameters were calculated by Mie theory, approximating WSOC as an ensemble of small BrC particles distributed evenly in the snowpack. The input variables required for Mie calculation are complex refractive index (RI = n−ik) and particle size parameter (). The diameter of individual particles (d), density (ρ), and the real part (n) of RI of WSOC were assumed to be 150 nm, 1.2 g cm−3, and 1.55 (constant in the UV–vis range), respectively (Chen and Bond, 2010; Z. Lu et al., 2015). The imaginary part (k) of RI was calculated as (Sun et al., 2007)
Then, SSA, g, and extinction cross section (Qext) were derived from Mie code (https://omlc.org/software/mie/, last access: 26 May 2021), and the obtained values were then used to calculate MEC (Seinfeld and Pandis, 2016):
The spectral albedo (αλ) was calculated for the scenarios of pure snow and BC- and BrC-contaminated snow. After that, the broadband albedo (α) of each scenario needs to be determined to calculate the broadband albedo reduction (Δα) and RF due to different types of impurities; α was derived by integration of αλ over the wavelength range of 300 to 1500 nm weighted by the incoming solar irradiance S(λ).
The incoming solar irradiances were simulated by the coupled ocean–atmosphere radiative transfer (COART) model (https://cloudsgate2.larc.nasa.gov/jin/coart.html, last access: 26 May 2021) (Jin et al., 2006) for each site under clear sky assumptions; therefore, the calculated RF can be considered as upper limits.
The RF resulting from either BC or BrC in snow (RFBC,BrC) was calculated by multiplying the downward shortwave solar radiation flux at the surface by ΔαBC,BrC (Painter et al., 2013):
where E is the average daily downward shortwave solar radiation flux acquired from NASA's Clouds and the Earth's Radiant Energy System (CERES) product “CERES SYN1deg” (https://ceres.larc.nasa.gov/products.php?product=SYN1deg, last access: 26 May 2021), and αpure snow and αBC,BrC are the broadband albedo of pure snow and BC or BrC contaminated snow, respectively.
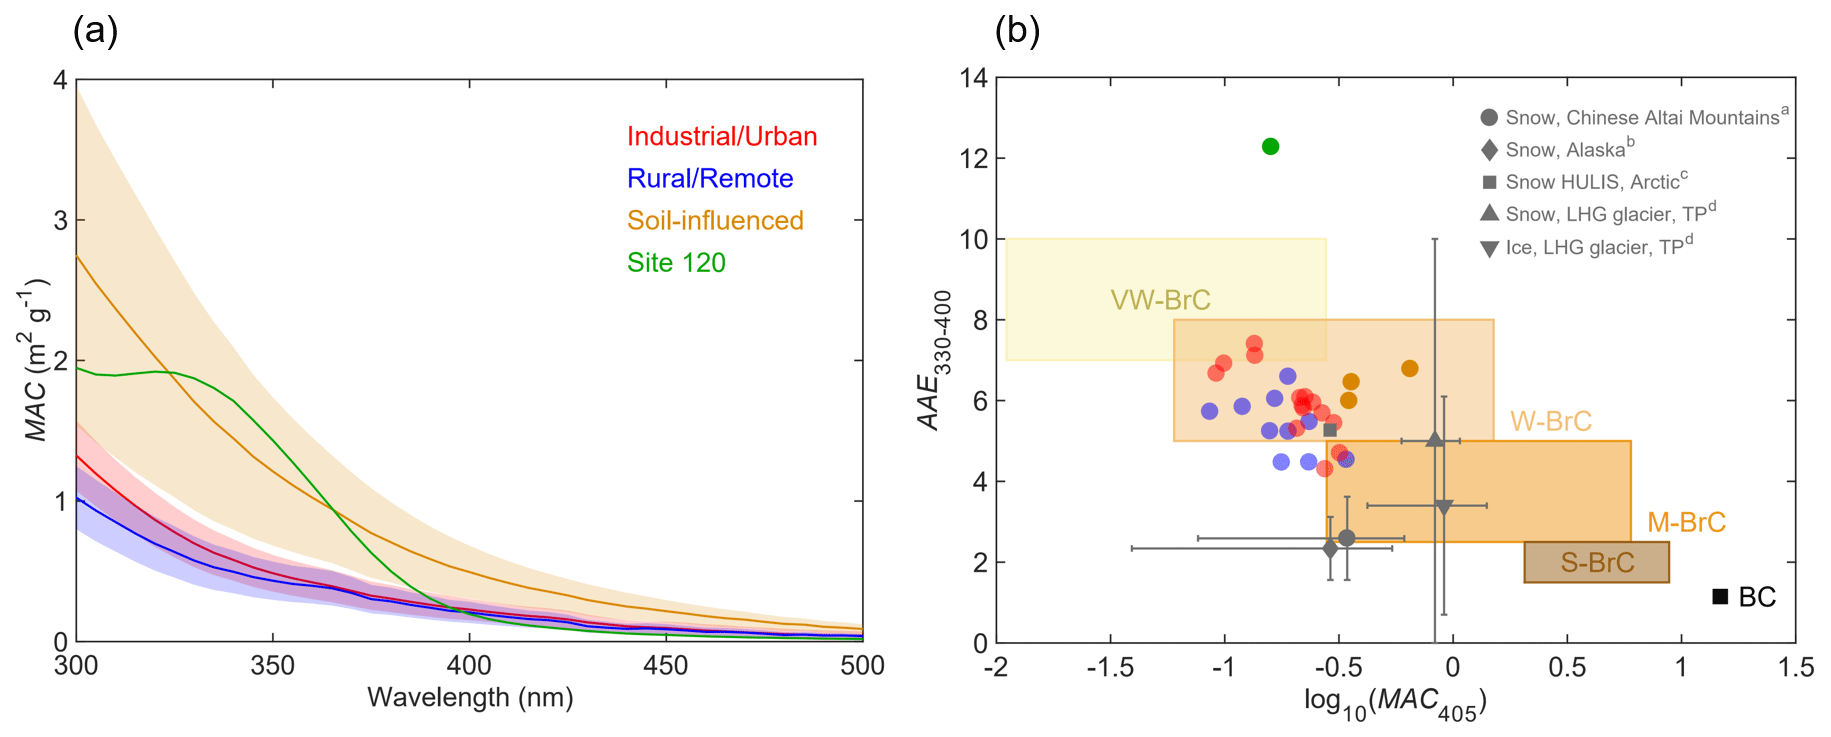
Figure 2(a) The average MAC spectrum of BrC attributed to WSOC in each group (solid lines, denoted by different colors); the shaded areas represent one-time standard deviations. (b) Plot of the optical-based BrC classification scheme (Saleh, 2020) in the log 10(MAC405)–AAE330−400 space. The shaded areas represent very weakly absorbing BrC (VW-BrC), weakly absorbing BrC (W-BrC), moderately absorbing BrC (M-BrC), and strongly absorbing BrC (S-BrC). BC is also shown for reference (Bond and Bergstrom, 2006). Grey marks indicate the data from the literature for snow–ice samples from the Chinese Altai Mountains (a Zhang et al., 2019), Alaska (b Zhang et al., 2020), Arctic (c Voisin et al., 2012; AAE is calculated for 300–400 nm), and LHG glacier on the TP (d Yan et al., 2016). Error bars denote the standard deviations of AAE and MAC values.
3.1 Characteristics of chemical species
Figure 1b shows mass concentrations of WSOC measured in the snow samples, illustrating their broad range from 478 to 7069 ng g−1 with an average of 1775 ± 1424 ng g−1 (arithmetic mean ± 1 standard deviation, and same below). The U and the S sites showed higher concentrations with averages of 1968 ± 953 and 2082 ± 1438 ng g−1, respectively, while the value of R sites (885 ± 328 ng g−1) was approximately a factor of 2 lower (Table S2). Of note is that the WSOC concentrations in U and S samples reported here are significantly higher than those found in the snow and ice from polar regions (∼ 40–500 ng g−1) (Fellman et al., 2015; Hagler et al., 2007a, b; Hood et al., 2015), glaciers in the European Alps (∼ 100–300 ng g−1) (Legrand et al., 2013; Singer et al., 2012), and the remote TP region (∼ 150–700 ng g−1) (Yan et al., 2016). However, our reported WSOC mass concentrations are in the same range as those in the fresh snow samples collected from Laohugou (LHG) glacier, northern TP (2000–2610 ng g−1) (Feng et al., 2018). It has been reported that glaciers and ice sheets from polar or alpine regions store a large amount of WSOC and discharge it to their downstream terrestrial ecosystems (Hood et al., 2009, 2015; Singer et al., 2012). Comparable or even higher concentrations of WSOC in our samples indicate that the seasonal snow in northern Xinjiang is also an important organic carbon source for the terrestrial ecosystems during spring meltdown.
As shown in Fig. 1c, the U sites were also associated with the highest BC concentrations among all four groups (mean: 707 ± 651 ng g−1). Furthermore, the mass contributions of sulfate ions at U sites (Table S2; mean: 33 %± 7 %), which is a commonly used marker for fossil fuel burning (Pu et al., 2017), were approximately twice as high as those from the other sites. All these results indicate a strong influence from anthropogenic pollution sources, explaining high WSOC loadings at U sites. For the S sites, HULISs from local soil may dominate the WSOC composition. For example, snow at site 104 was patchy and thin (Fig. 1a, grassland), and the local black soil can be lifted by winds and then redeposited and mixed with snow. The assumption of soil contributions agrees with the observed high mass contribution of calcium ions in S samples (mean: 50 %± 4 %, see Table S2). Although WSOC concentrations in R samples were relatively low (885 ± 328 ng g−1), they were still higher than most of the values from high-altitude or high-latitude regions of previous studies (∼ 40–700 ng g−1 as mentioned in the last paragraph). It might be explained by two reasons: (1) there were more intensive anthropogenic emissions in the northern Xinjiang region, or (2) there was little snowfall during 2018 campaign; therefore, WSOC had been potentially accumulated on the snow surface by sublimation and dry deposition (Doherty et al., 2010). The sample from site 120 is discussed separately as it exhibited the highest WSOC concentration (7069 ng g−1) and almost the lowest BC concentration (44 ng g−1) out of all samples analyzed in this work. The potential sources of WSOC from the site 120 sample will be discussed in section 3.3.
3.2 Bulk light-absorbing and fluorescence properties
The average MACBrC spectra of WSOC from different groups of samples are shown in Fig. 2a. The average MACBrC at 365 nm (MAC365) of S samples (0.94 ± 0.31 m2 g−1) was significantly higher than those of U (0.39 ± 0.11 m2 g−1) and R (0.38 ± 0.12 m2 g−1) samples (Table S2). The information on MACBrC related to WSOC in snow and ice is yet very scarce in literature. The MAC365 values of U and R samples are comparable to the results reported for continental snow collected across Alaska (0.37 ± 0.32 m2 g−1) (Zhang et al., 2020) but slightly lower than those for snow WSOC from the Chinese Altai Mountains, which show a wide range from ∼ 0.3 m2 g−1 for accumulation season to ∼ 1.0 m2 g−1 for ablation season with an average of 0.45 ± 0.35 m2 g−1 (Zhang et al., 2019), and HULISs extracted from Arctic snow (∼ 0.5 m2 g−1) (Voisin et al., 2012). The snow–ice samples from LHG glacier on the TP (Yan et al., 2016) presented a higher average MAC365 (1.3–1.4 m2 g−1) than the S samples; they also indicated a large contribution of dust-derived organics. The relative lower values of MAC365 measured for U samples might be explained by photobleaching of WSOC during aging on the snow surface (Yan et al., 2016; Zhang et al., 2019). Due to the stronger wavelength dependence of WSOC from U samples (AAE330−400: 6.0 ± 0.8 vs. 5.4 ± 0.7 for U and R sites, respectively), their MAC values at the shorter wavelength of 300 nm were higher compared to those of R samples. For example, the averages of MAC300 were 1.32 ± 0.24 m2 g−1 and 1.02 ± 0.21 m2 g−1 for U and R samples, respectively (Table S2). The AAE330−400 values of our samples were in the range of 4.3 to 12.3 (mean: 6.0 ± 1.5), and S sites had a higher average of 6.4 ± 0.3 than those corresponding to U and R samples. The highest AAE330−400 = 12. 3 was found for WSOC from the site 120 sample, and its UV–vis spectrum also exhibited an unusual spectral shape with a well-defined spectral feature observed between 300 and 350 nm. A similar feature was reported in (1) cryoconite samples collected from TP glaciers (Feng et al., 2016), which may be attributed to mycosporine-like amino acids (MAAs) produced by microorganisms (e.g., fungi, bacteria, and algae) (Elliott et al., 2015; Shick and Dunlap, 2002), and (2) plant-derived (e.g., corn, hairy vetch, or alfalfa) water-extractable organic matter containing phenolic carboxylic compounds (He et al., 2009).
Figure 2b shows MAC and AAE330−400 values measured for BrC attributed to WSOC from our samples in the context of an optical-based classification of BrC presented recently by Saleh (2020). The optical properties characterizing the BrC classes are expected to be associated with their corresponding physicochemical properties (i.e., molecular sizes, volatility, and solubility). Most of our samples and HULIS in Arctic snow (Voisin et al., 2012) fall into the region of weakly absorbing BrC (W-BrC). The WSOC in snow–ice from Alaska, the Chinese Altai Mountains, and LHG glacier was assigned to moderately absorbing BrC (M-BrC) but with broader ranges, likely indicating higher molecular variability. These results provide a useful data set of snow BrC light-absorbing properties which may inform climate models.
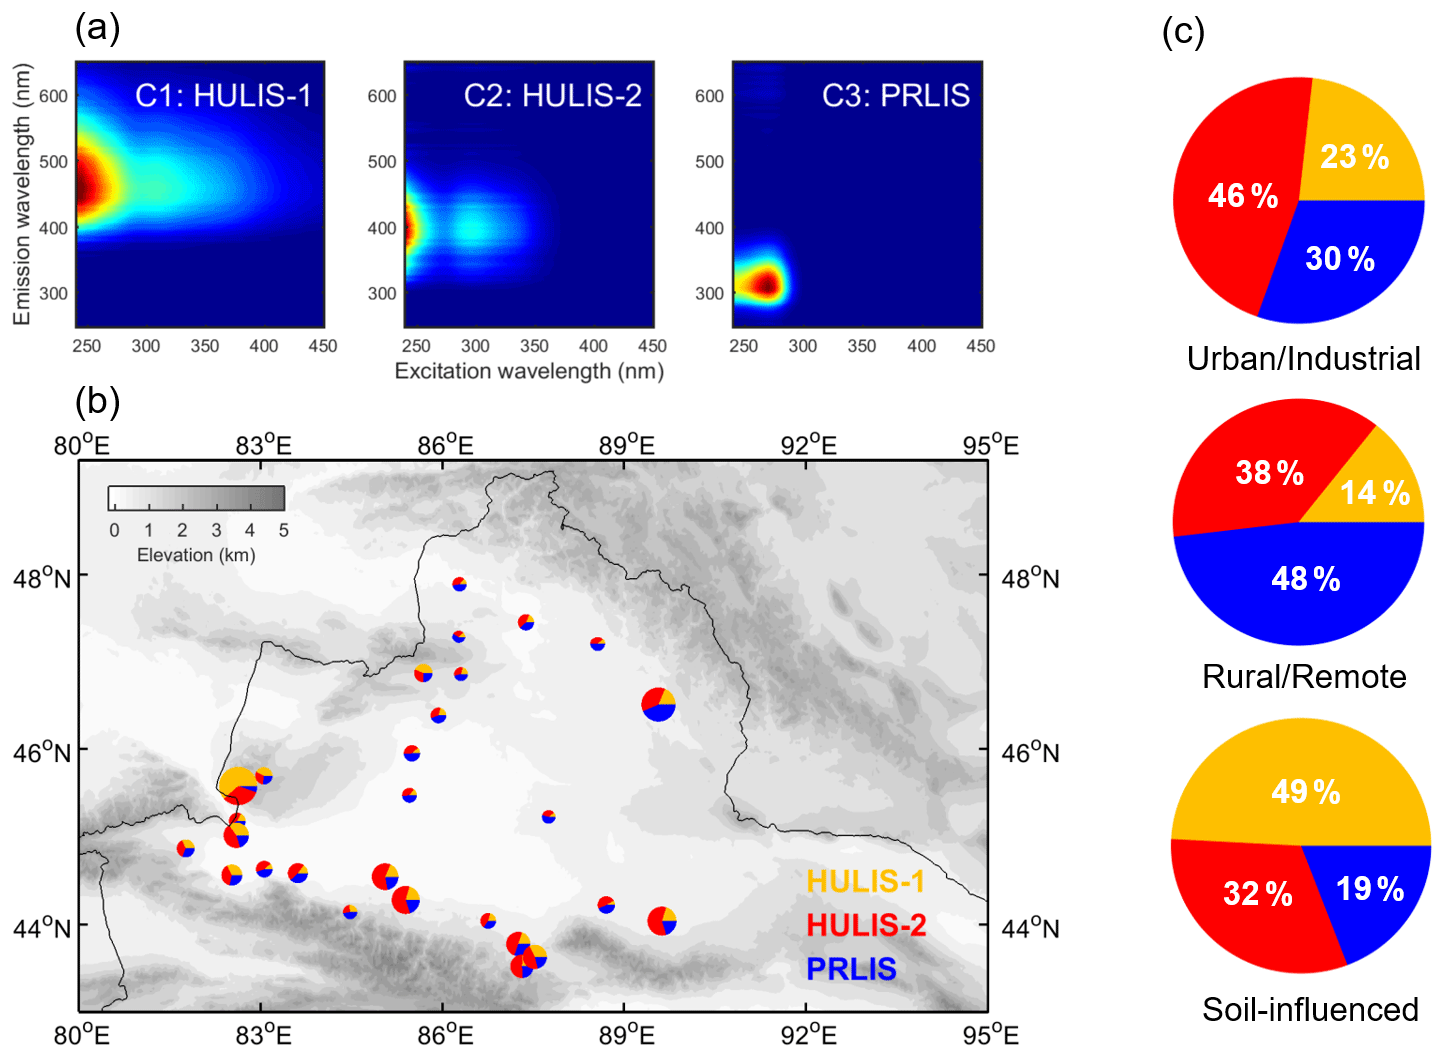
Figure 3(a) The fingerprints of three fluorescent components identified by PARAFAC analysis. (b) Relative contributions of three components to total fluorescence at each site. HULIS-1, HULIS-2, and PRLIS are represented in yellow, red, and blue, respectively. The size of each pie is proportional to the total fluorescence intensity at each site. (c) The average contributions of three components in different groups of samples.
Three fluorescent components (i.e., C1, C2, and C3) were identified by PARAFAC analysis (Fig. 3a). The peak positions of each component are summarized in Table S4. C1 (HULIS-1) is a type of terrestrial-derived humic fluorophore with long emission wavelengths, commonly reported for samples of terrestrial aquatic systems and highly oxygenated organic aerosols (Chen et al., 2016a; Stedmon et al., 2003). C2 (HULIS-2) is usually recognized as a HULIS from marine sources (Coble, 1996) or phytoplankton degradation in fresh water (Zhang et al., 2010), and it was also detected in anthropogenic wastewater (Stedmon and Markager, 2005) and industrial-sourced aerosol (Chen et al., 2020). C3 is a class of PRLIS (tyrosine-like) widely found in terrestrial organics (Wu et al., 2020; Zhang et al., 2010; Zhao et al., 2016) related to labile organic matter produced from microbial processes (Coble et al., 1998). Of note is that the fluorophores detected in our samples show the similar peak positions compared to the previous reports for aerosol or aquatic environments, but they do not necessarily have the same sources due to large differences in the physicochemical and geochemical processes (Chen et al., 2016b; Duarte et al., 2007).
As shown in Fig. 3b and c, the relative intensities of three fluorescent components were highly variable among different groups of samples, suggesting systematic substantial differences in their chemical compositions. HULIS-1 dominates in the S samples, where it accounts for ∼ 49 % of the total fluorescence (Table S2). In addition, the relative intensities of HULIS-1 are positively correlated with the mass fractions of calcium ions (r = 0.73, p < 0.01; Table S6). These results suggest a terrestrial origin (soil dust) of HULIS-1, which is consistent with previous studies of water systems and aerosols (Chen et al., 2016a, 2020; Stedmon et al., 2003). A strongly negative correlation between the contributions of HULIS-1 and nitrate mass fractions is found as well (r = −0.68, p < 0.01), reflecting the potentially important role of HULIS in snow nitrate photochemistry (Handley et al., 2007; Yang et al., 2018). For instance, Yang et al. (2018) found that HONO formation is significantly enhanced in the presence of humic acid from nitrate photolysis. HULIS-2 dominates U samples with an average contribution of ∼ 46 %. Given the significantly positive correlation between the contributions of HULIS-2 and mass fractions of sulfate ions (r = 0.51, p < 0.01), the primary relevance of anthropogenic emissions for HULIS-2 is confirmed. The R samples show a significant contribution of PRLIS fluorophore (mean: 48 %± 6 %), indicating an important role of microbial processes in the composition of WSOC in these samples. This observation is in line with previous studies showing that snow is not only an active photochemical site but also a biogeochemical reactor in the nitrogen cycling (Amoroso et al., 2010). Amoroso et al. (2010) found that nitrate and nitrite ions in snow collected from Ny-Ålesund, Norway, were most likely from microbial oxidation of ammonium ions. Therefore, the significant correlation (r = 0.78, p < 0.01) between relative intensities of PRLIS and nitrate mass fractions might be interpreted by (1) low anthropogenic emissions and local soil dust import (fewer contributions from sulfate and calcium ions) and (2) potential metabolic production of nitrate/nitrite in snow at R sites. Further research is needed to investigate this hypothesis in more detail. Of interest, EEM from the site 120 sample cannot be modeled well by PARAFAC (Fig. S5) because of the uncommon spectroscopic feature with emission and excitation wavelengths of 315 and 452 nm, respectively. This feature is possibly attributed to (1) NADH-like (nicotinamide adenine dinucleotide) compounds, which are an indicator for the metabolism of organisms (Pöhlker et al., 2012), or (2) plant-derived water-extractable organic matter (Hunt and Ohno, 2007), e.g., corn. This result suggests strong influence from either microbial activity or plant-sourced organics in snow at site 120, which is also consistent with the UV–vis spectrum shape.
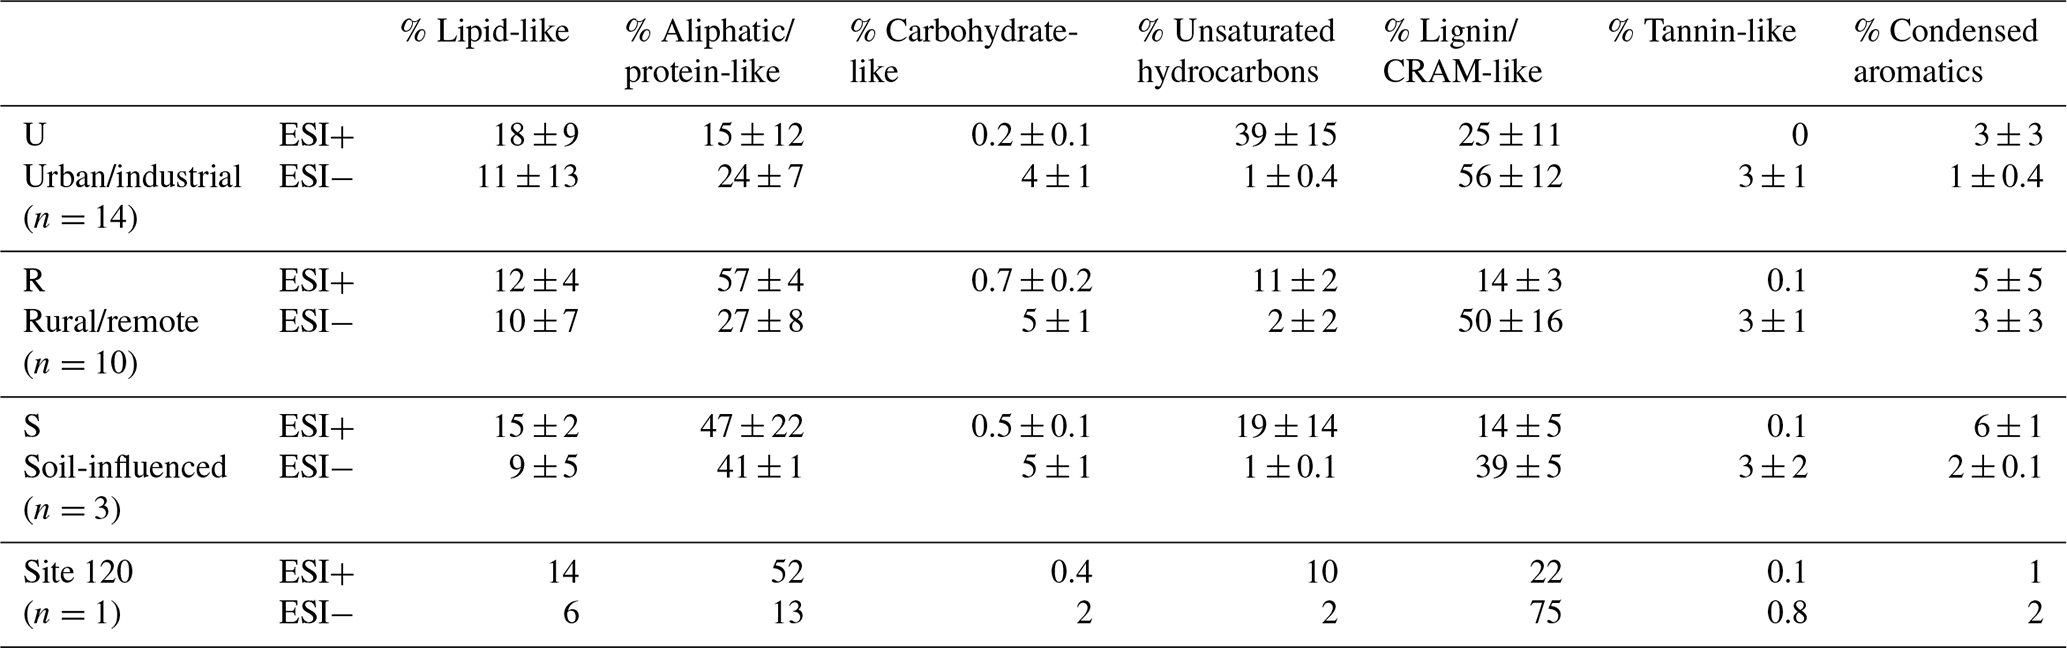
Table 1Averages (arithmetic mean ± standard deviation) of molecular characteristics in major formula categories detected in ESI+ mode for each group of sites. Numbers and percentages of formulas and intensity-weighted MWw, , , DBEw, , and AIw are given.

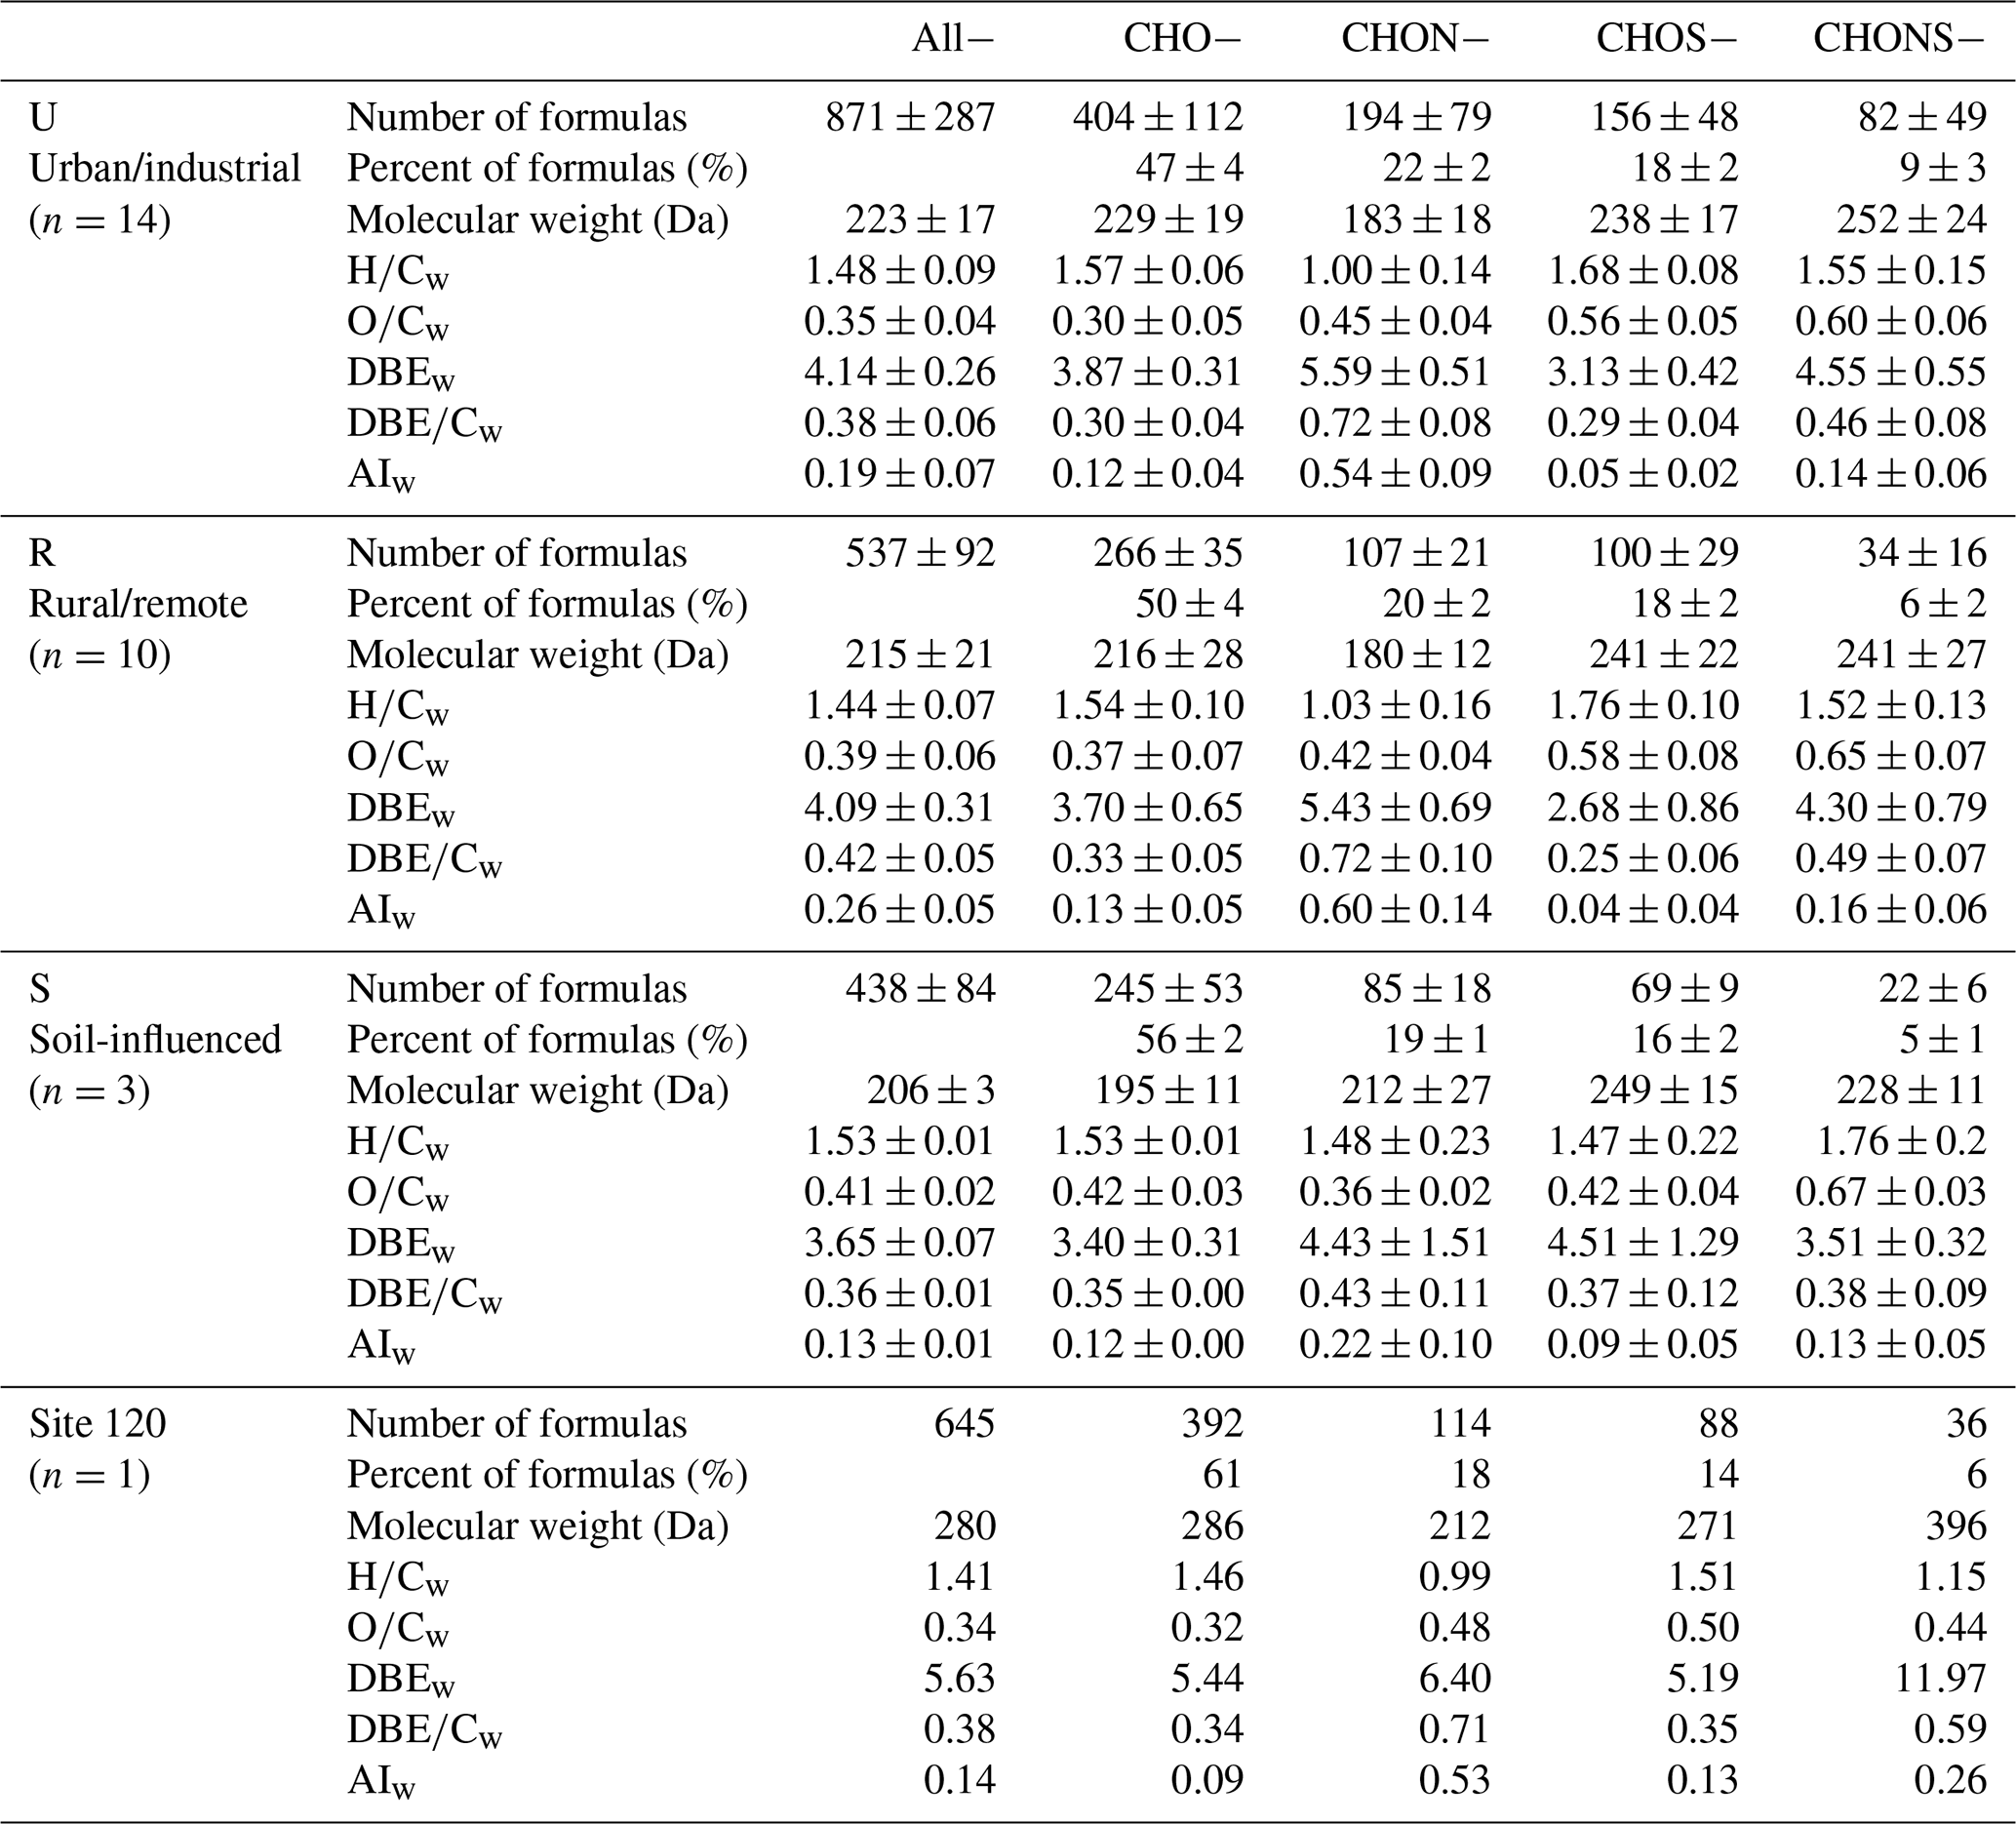
Table 2Averages (arithmetic mean ± standard deviation) of molecular characteristics in major formula categories detected in ESI− mode for each group of sites. Numbers and percentages of formulas and intensity-weighted MWw, , , DBEw, , and AIw are given.
3.3 Molecular-level insights into composition of WSOC from snow samples
3.3.1 General HRMS characteristics
Numbers of assigned species ranged from 561 to 1487 and from 339 to 1568 for ESI+ and ESI− modes, respectively, suggesting high variations in molecular components of WSOC in the snow samples from northern Xinjiang. The assigned peaks accounted for a majority (49 %–68 %) of all detected MS peaks. Due to the different ionization mechanisms between positive and negative ESI (Lin et al., 2012), only small amounts of compounds were detected in both modes, accounting for approximately 15 % of total assignments at each representative site (Fig. S6). The assigned formulas were classified into eight categories, i.e., CHO, CHON, CHOS, CHONS, CH, CHS, CHN, and CHS. CHONS referred to formulas containing carbon, hydrogen, oxygen, nitrogen, and sulfur elements, and other categories were defined analogously. The U samples had the highest number of assigned compounds among four groups of sites in both ESI+ and ESI− with averages of 1113 ± 203 and 871 ± 287, respectively (Tables 1 and 2), whereas the number of assigned species from S samples was lowest (mean: 727 ± 146 and 438 ± 84 for ESI+ and ESI− modes, respectively), reflecting the high molecular complexity of U samples. The numbers of assigned formulas in this study are comparable to the assignments reported for urban aerosol samples (∼ 800–1800) (Lin et al., 2012; Wang et al., 2017a) and WSOC of LHG glacier from the TP region (∼ 700–1900) (Feng et al., 2016, 2018), but they are lower than those of WSOC from the Antarctic (∼ 1400–2600) and Greenland ice sheets (∼ 1200–4400) (Antony et al., 2014; Bhatia et al., 2010).

Figure 4The reconstructed mass spectra of representative samples for four groups of sites: (a) site 114, (b) site 123, (c) site 104, and (d) site 120. The data measured by ESI+/− are plotted as positive/negative intensities, respectively. The pie charts show the number contributions from different formula categories indicated by different colors, and the sizes of pie charts are proportional to the total numbers of assigned formulas detected in each sample by ESI+/−. The percentages present the ratios of assigned formulas to total MS peaks. Unassigned peaks were converted into neutral mass by assuming that they were protonated in ESI+ and deprotonated in ESI−.
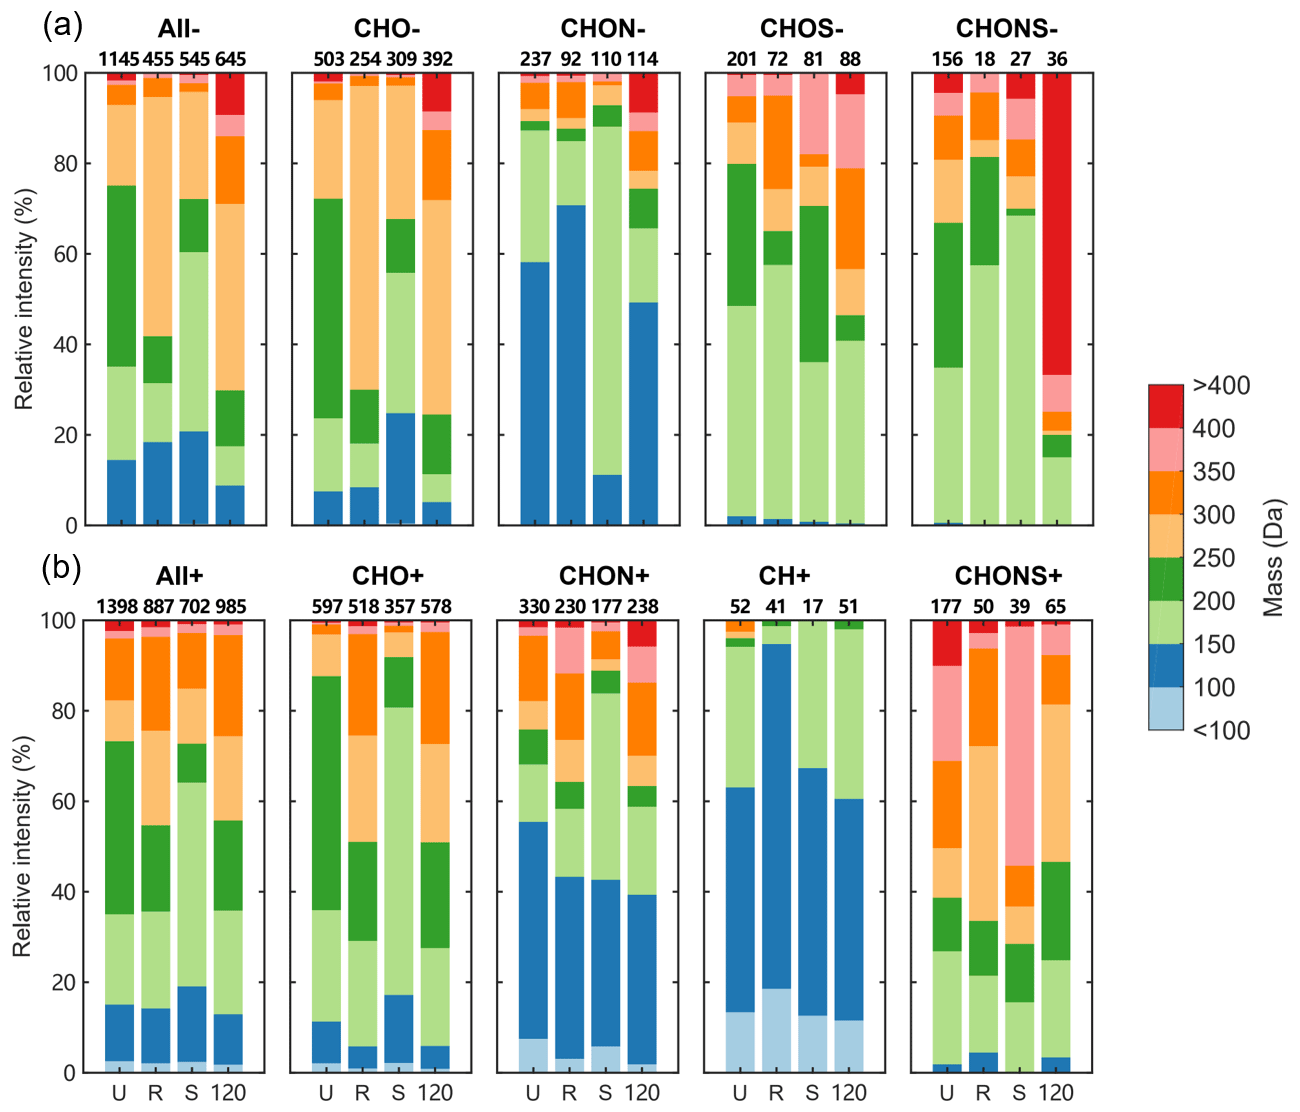
Figure 5The distributions for relative intensities of compounds in different mass ranges in (a) ESI− and (b) ESI+. The numbers on the top of bars indicate the number of assigned peaks in different formula categories of each sample.
The mass spectrum plots constructed from individual samples showing integrated composition of U, R, S, and site 120 samples along with the corresponding number contributions from different formula categories are shown in Fig. 4. Overall, the assigned formulas were mainly in the mass range of 100 to 450 Da for both ESI+ and ESI−, while there were more compounds with masses lower than 100 in the ESI+ mode. The relative intensities of MS features contributed by compounds in different mass ranges extract more information from the mass spectra, as shown in Fig. 5. In ESI− mode, the ion intensity was most abundant in the mass range of 200 to 250 Da for U samples, 250 to 300 Da for R and site 120 samples, and 150 to 200 Da for S samples, indicating different chemical constituents for samples from different groups. The variations in terms of relative intensities for CHO− compounds were like those of all species detected in ESI−. For CHON−, formulas with a mass of 150 to 200 Da were abundant in S samples, while other groups were dominated by formulas in the range of 100 to 150 Da. Sample from site 120 showed higher fractions of formulas with masses larger than 300 Da, especially for CHONS− compounds. The distributions of all detected compounds showed higher contributions from the mass range of 300 to 350 Da in ESI+ compared to ESI−. Although the detection of CH compounds in ESI is uncommon, some of them appear detectable in the ESI+ mode, and most were associated with aromatic species smaller than 150 Da (DBE ≥ 4). Furthermore, the CHONS+ species showed higher masses than CHONS−, except for the sample from site 120.
In ESI+ mode, CHO+ and CHON+ were the main components in all samples, accounting for 35 % to 61 % and 20 % to 28 % of total formulas, respectively (Table 1). The U samples showed the lowest CHO+ abundance (mean: 42 %± 5 %), while the sample from site 120 had the highest value (59 %). The fractions of CHON+ species in our samples were significantly lower than those of the aged firn and ice samples from the TP (∼ 40 %) (Feng et al., 2016, 2018, 2020; Spencer et al., 2014), which is mainly attributed to less microbial activities in our samples, but they were comparable with those of fresh snow (Feng et al., 2018, 2020) in which the major source of WSOC is aerosol wet/dry deposition. These results indicate that WSOC from the snowpack in northern Xinjiang was more likely from atmospheric aerosol depositions rather than from autochthonous sources. There were much higher contributions of S-containing compounds in the U samples, e.g., CHOS+ (11 %), CHONS+ (12 %), and CHS+ (4 %), which were less abundant in other samples. These species showed low oxidation levels (mean : 0.07 for CHOS+) and high unsaturation degree and aromaticity (mean DBEw of 10.1 and 8.7 and mean AIw of 0.42 and 0.48 for CHOS+ and CHS+, respectively), suggesting that they might be reduced S-containing species with aromatic structures from incomplete fossil fuel combustion (Mead et al., 2015; Wang et al., 2017a).
The abundance of CHO− was highest in ESI− with a range of 41 % to 61 %. The U samples and the site 120 sample showed the lowest (mean: 47 %± 4 %) and highest (61 %) fractions of CHO−. The CHON− and CHOS− compounds account for roughly equal contributions with ranges of 16 % to 27 % and 14 % to 22 %, respectively. The detected CHOS compounds were more abundant in ESI− than those in ESI+. Furthermore, CHOS− compounds show a much higher oxidation level and lower unsaturation degrees than CHOS+ (mean of 0.55 and 0.08 and mean DBE of 3.2 and 8.3 for CHOS− and CHOS+, respectively). These results are consistent with previous ambient aerosol characterization studies (Lin et al., 2012; Wang et al., 2017a, 2018), but the S-containing species were not abundantly detected in the glacier samples (Feng et al., 2016; Spencer et al., 2014), indicating a stronger influence from anthropogenic aerosols to WSOC in Xinjiang seasonal snow than those from remote areas.
The bulk molecular characteristics of compounds detected in ESI+ and ESI− are summarized in Tables 1 and 2, respectively. The MWw of all compounds detected in ESI+ mode was 231 ± 9, 229 ± 10, 218 ± 15, and 234 Da for U, R, S, and site 120 samples, respectively. These values are comparable to the MWw of urban aerosols (∼ 225 to 265 Da) (Lin et al., 2012; Wang et al., 2018) but significantly lower than those of glacier samples (∼ 360 to 420 Da) (Feng et al., 2018, 2020), suggesting different compositions between WSOC in the seasonal snow of our study and from the literature-reported glacier samples. DBE is used to infer the unsaturation degree of individual species (McLafferty et al., 1993), and AI is a more direct metric of their aromaticity (Koch and Dittmar, 2006, 2016). The U samples showed higher DBEw and AIw values than the other groups of samples mainly due to high fractions of S-containing compounds in ESI+ mode (Table 1). As for ESI− mode, the MWw of the site 120 sample was higher than the other samples (280 vs. ∼ 200–220 Da). Of note is that the average MWw values of CHO− and CHONS− compounds in the site 120 sample were 286 and 396 Da, respectively, which were approximately 70 and 150 Da higher than those from the other groups of samples. Accordingly, the DBEw of all formulas detected in the site 120 sample was the highest (5.8), and the values for CHO− and CHONS− were 5.4 and 12.0, respectively, which were approximately 1.5 and 3 times higher than in the other samples. These results indicate very unusual sources of WSOC in the site 120 sample. Additionally, the molecular characteristics of formulas detected in ESI− and ESI+ are different, e.g., higher average DBEw and AIw values of R samples for ESI− data (Tables 1 and 2). This results from the differences in ionization mechanisms between positive and negative modes. ESI+ is sensitive to protonatable compounds with basic functional groups, while acidic species are easily deprotonated and detected in ESI− mode (Cech and Enke, 2001). Therefore, using both positive and negative ESI modes provide a more complete molecular characterization of WSOC.
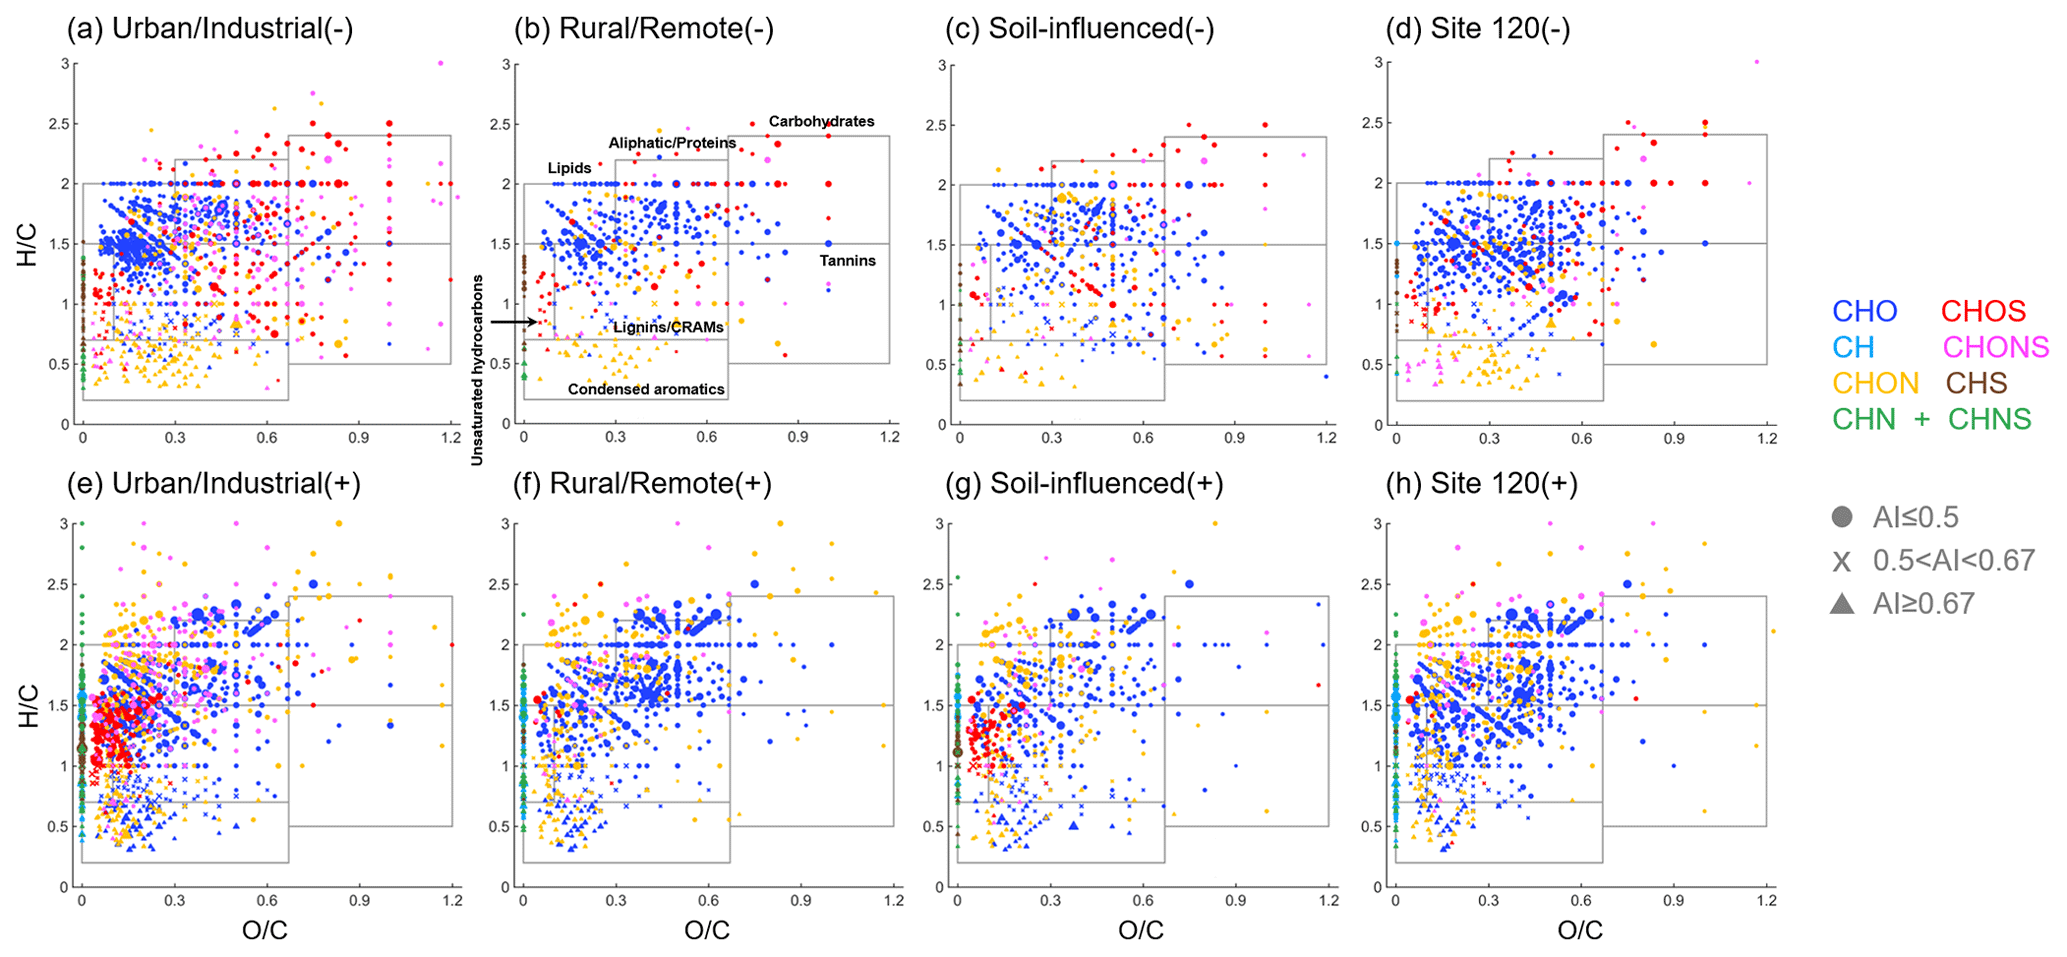
Figure 6Van Krevelen diagrams of representative samples for each subgroup in (a–d) ESI− and (e–h) ESI+. The boxes indicate the different classes of chemical species. Different formula categories are color coded. Dots, crosses, and triangles represent non-aromatic (AI ≤ 0.5), aromatic (0.5 < AI < 0.67), and condensed aromatic compounds (AI ≥ 0.67) (Koch and Dittmar, 2006), respectively. The sizes of the symbols are proportional to the intensities.
Table 3The relative abundance of different classes of molecular species in each group of sites.
3.3.2 Chemical species in snow WSOC
The Van Krevelen (VK) diagram is a frequently used graphical method which plots the ratios against the ratios in molecular formulas to qualitatively determine the major chemical species in complex organic mixtures and to explore their potential reaction pathways (Kim et al., 2003). The VK diagrams of four representative samples detected in ESI+ and ESI− modes are shown in Fig. 6. The VK space in this study was separated into seven regions according to previous studies (Feng et al., 2016; Ohno et al., 2010): (1) lipid-like ( = 0–0.3, = 1.5–2.0), (2) aliphatic/protein-like ( = 0.3–0.67, = 1.5–2.2), (3) carbohydrate-like ( = 0.67–1.2; = 1.5–2.4), (4) unsaturated hydrocarbons ( = 0–0.1, = 0.7–1.5), (5) lignins/carboxylic-rich alicyclic-molecule-like (CRAM) ( = 0.1–0.67, = 0.7–1.5), (6) tannin-like ( = 0.67–1.2, = 0.5–1.5), and (7) condensed aromatics ( = 0–0.67, = 0.2–0.7). In ESI+, the U samples showed the lowest ratios (mean: 0.19 ± 0.04) and ratios (mean: 1.51 ± 0.05) among four groups (Table 1), which indicates the low oxygenation and high unsaturation degree of WSOC from U samples, likely suggesting their primary emission sources (Kroll et al., 2011). Consequently, the unsaturated hydrocarbons were most abundant among seven classes of species (mean: 39 ± 15 %; Table 3), most of which were CHOS+ compounds (Fig. S7), then followed by lignin/CRAM-like species (mean: 25 ± 11 %). These results, again, support our assumption that anthropogenic pollution is a major source of snow organics in the U region. The R samples exhibited the highest fraction of aliphatic/protein-like species among four groups (mean: 57 %± 4 %,). This type of species is widely distributed in natural dissolved organic matter detected in terrestrial water systems (Y. Lu et al., 2015), glaciers and polar ice sheets (Antony et al., 2014; Feng et al., 2016), aerosols (Ning et al., 2019; C. Wu et al., 2019; Xie et al., 2021), and cloud water (Bianco et al., 2018). The aliphatic/protein-like species is commonly regarded as a marker of biological-related sources, such as in situ microbial activities (Antony et al., 2017) and primary bioaerosols (e.g., plant debris, fungal spores, and pollen) (Xie et al., 2021). The high contribution of aliphatic/protein-like species in R samples is consistent with the results of our EEM–PARAFAC analysis, which showed that PRLIS fluorophore is the most abundant. The U samples and the site 120 sample showed high contributions of lignin/CRAM-like species, but their sources might be different. The lignin/CRAM-like species are commonly attributed to terrestrial-sourced, vascular-plant-derived material (Antony et al., 2014), biomolecules with similar structures to sterols and hopanoids (Hertkorn et al., 2006), or secondary organic aerosols from biomass burning (Xie et al., 2021). These compounds in U samples were more likely from the combustion of biomass materials, but those in the site 120 sample might be from biogenetic sources. In addition, the S samples showed higher contributions of unsaturated hydrocarbons (mean: 19 %± 14 %) than the R samples and the site 120 sample (means of 11 %± 2 % and 10 %, respectively). This result is mainly due to the CHOS+ compounds detected in the site 104 sample from S group (Fig. 6g), indicating some influence by anthropogenic pollution at this site.
The relative abundances of seven chemical species to four major formula categories are shown in Fig. S7. Aliphatic/protein-like species dominated the CHO+ compounds in the R and the site 120 samples, while lignin/CRAM-like species were most abundant in the U sample. The contribution of condensed aromatics to CHO+ in the S sample was high, which might be from soil-derived humic acids (DiDonato et al., 2016; Ikeya et al., 2015). Lipid-like species were highly enriched in CHON+, except for the U samples in which significantly higher contributions from condensed aromatics were observed. The condensed aromatics have typical AI values > 0.67 and low ratios which might be indicative of nitrated polycyclic aromatic hydrocarbons (nitro-PAHs) (Bandowe and Meusel, 2017) or N-heterocyclic aromatics (Bandowe et al., 2016) from combustion sources. The CHOS+ compounds have mostly unsaturated hydrocarbon characteristics in representative U and S samples as discussed above but were rarely detected in the R and site 120 samples. The CHONS+ did not show distinct variations among investigated samples, but a higher fraction of aliphatic/protein-like species in the S samples was observed.
As for ESI−, the (mean: 0.41 ± 0.02) and (mean: 1.53 ± 0.01) ratios were highest for species identified in the S samples, reflecting their higher oxygenation and saturation levels. These values are similar to those of soil-water-extracted organic matter (Ohno et al., 2010). This feature is consistent with the results of EEM–PARAFAC, which showed that highly oxygenated HULIS-1 is dominant in S samples. Lignin/CRAM-like species detected in ESI− dominated the VK space rather than aliphatic/protein-like compounds detected in ESI+. The relative contributions of seven chemical classes did not change much between U and R samples (Table 3). In S samples, a lower fraction of lignin/CRAM-like species was found. Compared to the water-extracted organic matter from a pure soil sample (Ohno et al., 2010), our S samples showed a similar percentage of lignin/CRAM-like species (39 % vs. 44 %). An extremely high contribution of lignin/CRAM-like species (75 %) was observed for the site 120 sample, strongly suggesting an influence from biogenetic materials. As for the relative abundances in major formula categories, CHO− and CHON− were dominated by lignin/CRAM-like species, except CHON− of the S sample which exhibited the highest fraction of aliphatic/protein-like species. This highest CHON− fraction mainly resulted from a single compound with disproportionally high ion abundance, i.e., C9H17O3N, that might have been tentatively assigned as an amino acid which led to a high fraction of aliphatic/protein-like compounds in S samples (mean: 41 %± 1 %). Amino acids are widely distributed in soil and are important organic nitrogen sources of soil microorganisms and plants (Geisseler et al., 2010). Moreover, biomass burning is also a significant source of atmospheric amino acids (Laskin et al., 2009; Lin et al., 2012). Therefore, either the deposition of blowing soil or biomass burning aerosols may be responsible for the appearance of this high-abundance of amino acid species in the S sample. As for CHOS− and CHONS−, lignin/CRAM-like and carbohydrate-like species accounted for large portions of their total intensity. Only a few CHONS− compounds are apportioned as lignin/CRAM-like species for the S sample, and they are attributed mostly to carbohydrate-like species than anything else. One interesting note is that the contribution of condensed aromatics in the site 120 sample is highest among all samples. Specifically, there are some unique CHONS− compounds within the region of condensed aromatics, e.g., C29H14O4N2S (DBE = 24, AI = 0.77) and C26H14O5N2S (DBE = 21, AI = 0.72), which have high MW > 400 Da. They may contain the structure of anthraquinones, which are widely distributed in plants (Duval et al., 2016).
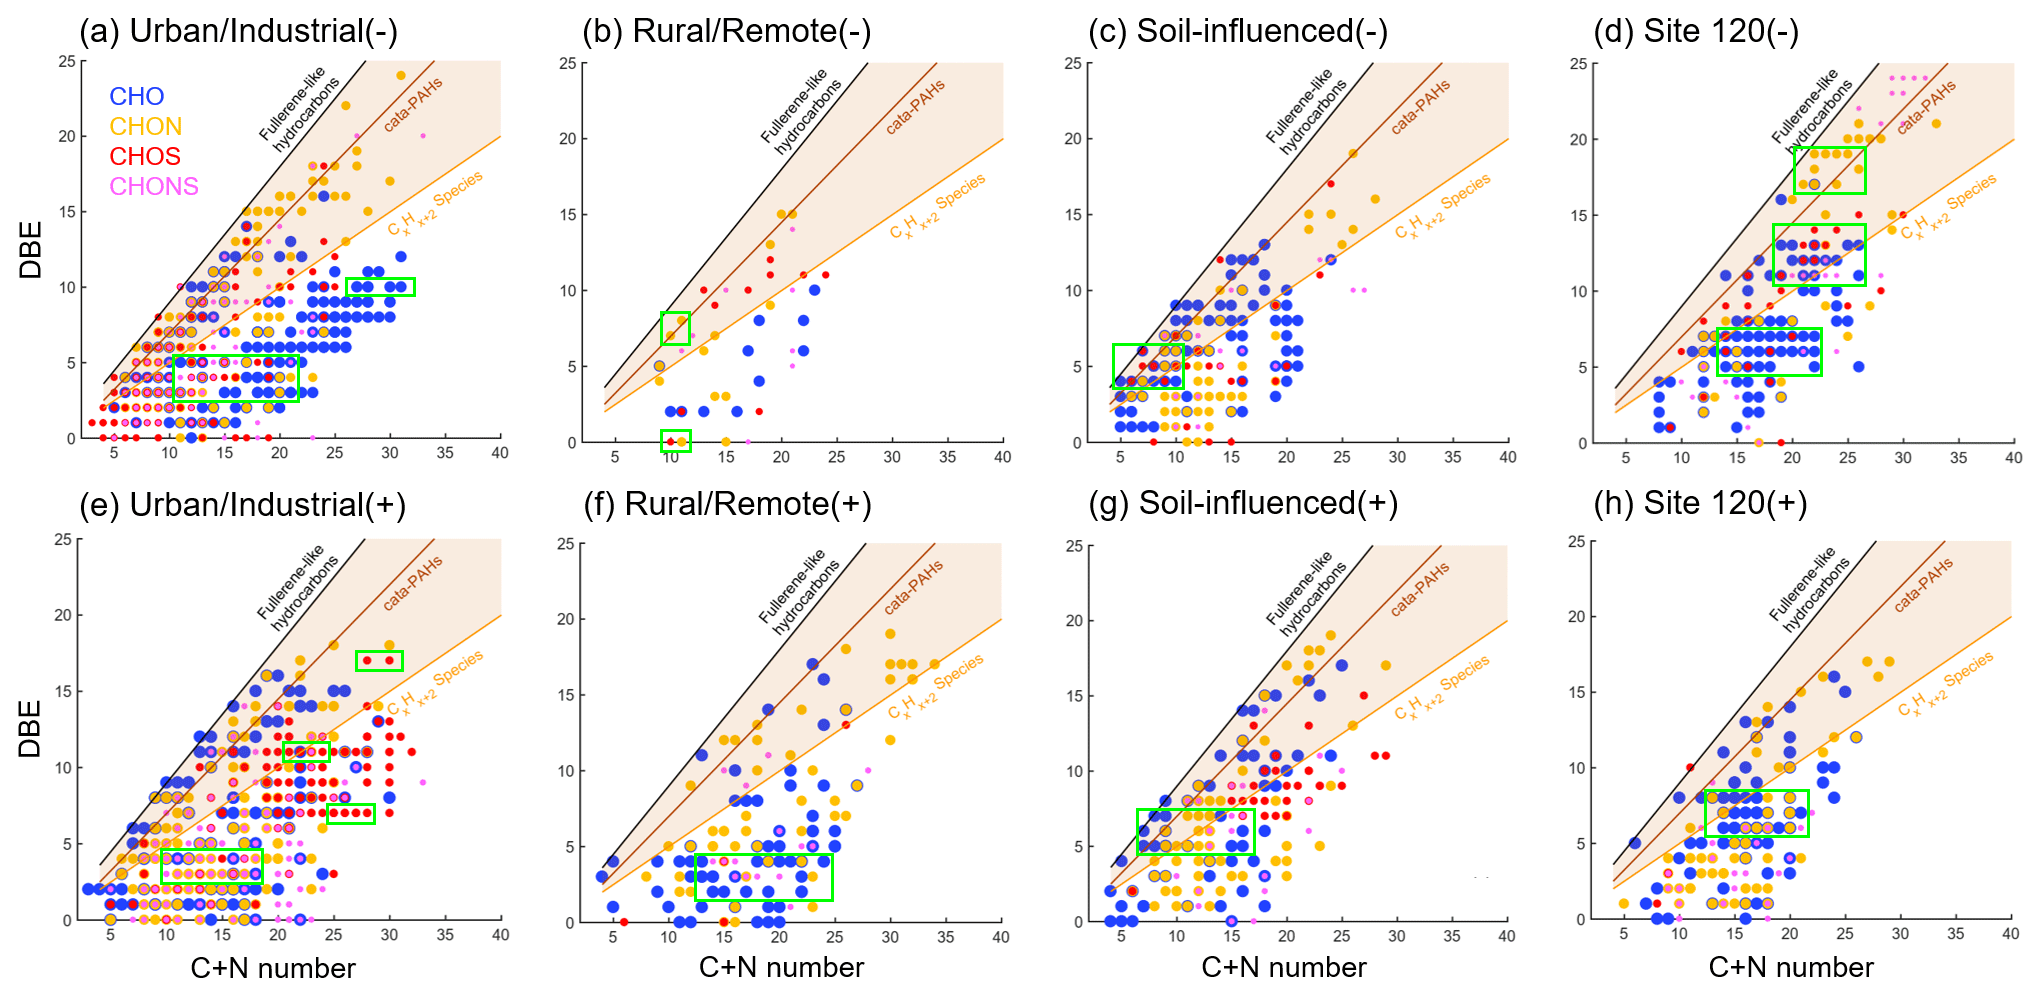
Figure 7DBE vs. C + N number for unique molecules in representative samples from different groups. (a–d) ESI− and (e–h) ESI+. The reference lines indicate linear polyenes (CxHx+2, DBE = 0.5 ⋅ C), cata-condensed PAHs (DBE = 0.75 ⋅ C − 0.5), and fullerene-like hydrocarbons (DBE = 0.9 ⋅ C). Markers in the shaded area are potential BrC chromophores. The green boxes denote the high-intensity compounds. Four major formula categories are shown in different colors and sizes to avoid overlapping.
To further illustrate the differences in chemical compositions and structures among four groups of the investigated samples, plots of DBE vs. C + N atomic number are shown in Fig. 7. The numbers of unique formulas in the U sample were highest both in ESI+ and ESI− with values of 578 and 618 (Fig. S8), respectively, which accounted for 44 % and 54 % of total assigned species in each of the modes. These values were lowest for the R sample, with only 17 % (145) and 11 % (51) in ESI+ and ESI−, respectively. These results reflect the very high chemical complexity of WSOC from U samples. The DBE plots of Fig. 7 are shown along with the reference lines depicting DBE values characteristic of (a) linear polyenes (CxHx+2, DBE = 0.5 ⋅ C) (Cain et al., 2014), (b) cata-condensed PAHs (DBE = 0.75 ⋅ C − 0.5) (Siegmann and Sattler, 2000), and (c) fullerene-like hydrocarbons (DBE = 0.9 ⋅ C) (Lobodin et al., 2012). Because efficient absorption of visible light by organic molecules requires conjugated group of bonds extended across a significant part of the molecule, the compounds with the ratio greater than that of linear polyenes might be potential chromophores (Lin et al., 2018). The DBE values of CHON and CHONS compounds shift 1–5 units to the right as the sum-total number of carbon and nitrogen atoms are accounted for. In ESI−, 266 formulas of the U sample were in the “BrC domain” region, which was much higher than the other samples (26, 106, and 115 for the R, S, and site 120 sample, respectively). Most of them are CHON−, CHOS−, and CHONS− compounds, accounting for 74 % of the total formulas assigned in the U sample. Their C numbers and DBE values were mainly in the ranges of 4–16 and 4–10, respectively. For the S and site 120 samples, CHO− and CHON− were abundant in the BrC domain region (70 % and 62 % for the S and site 120 samples, respectively). The frequency distributions of C numbers and DBE were similar between the U and S samples, but WSOC components in the S samples showed higher ratios for CHO− compounds (Fig. S9), again consistent with the soil organic matter (Ohno et al., 2010). However, the observations are quite different for the site 120 sample, where C numbers and DBE values gathered in broader ranges of 11–26 and 10–20, respectively, with higher medians. In addition, a few of the CHON− and CHONS− compounds with DBEs higher than 17 were detected. These CHONS− formulas have been identified as plant-related organics as discussed above. Similarly, the highly unsaturated CHON− compounds, e.g., C25H13O8N (DBE = 20, AI = 0.69), C26H15O8N (DBE = 20, AI = 0.65), and C26H15O9N (DBE = 20, AI = 0.63), showed high MW > 400 Da, and they may also be tentatively assigned as anthraquinone derivatives. All these unique compounds suggested that the biogenic organics from plants are major sources of WSOC from the site 120 sample. In ESI+, the numbers of formulas within BrC domain were 216, 43, 103, and 64 for the U, R, S, and site 120 samples, respectively. These potential BrC species were largely attributed to CHO+ and CHON+ compounds (54 %–75 %), whereas the S-containing compounds (34 %) were substantial in the U sample.
3.4 The radiative forcing by BrC attributed to WSOC in the snowpack
Inherent to the complexity of WSOC material and variability in its BrC optical properties, quantitative estimates of its RF in snowpack remain insufficiently studied. Yan et al. (2016) calculated the BrC-induced RF at LHG glacier from the TP region, which was 0.43 W m−2 and accounted for 10 % of RF due to BC. Most recently, Beres et al. (2020) described the spectral albedo and RF after artificial deposition of BrC aerosol proxies from peat burning onto ambient snow surface. They showed that the instantaneous RF efficiency due to total deposited aerosol was 1.23 W m−2 per parts per million of the deposited mass. However, in the real world, BrC concentrations may not be as high as in the proxy experiments. Also, daily averaged values of RF are more important for climate research. Here we contribute to this line of work by calculating the averaged daily RF due to BC and BrC (RFBC,BrC) deposits in snow based on the bulk characterization measurements over the samples of our study.
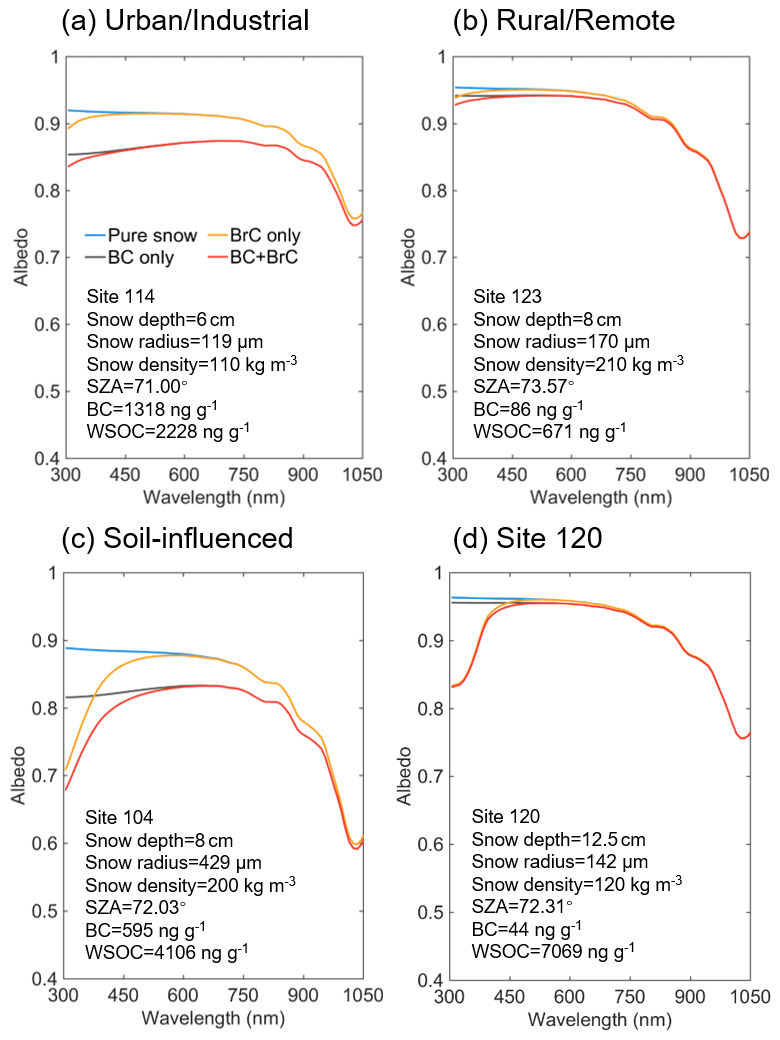
Figure 8Simulated snow spectral albedo under different contamination scenarios for representative samples from different groups. The blue, grey, yellow, and red lines exhibit the spectral albedos of pure snow, BC- or BrC-contaminated snow, and snow polluted by both BC and BrC, respectively. The input parameters of each site for the SNICAR model are also shown.

Figure 9The albedo reduction spectra for representative samples from different groups. The grey and yellow lines show the albedo reductions due to BC and BrC, respectively. The red lines show the ratios of albedo reductions by BrC to those by BC. The ΔαBC,BrC and RFBC,BrC of each site are also shown.
Table 4Simulated broadband albedo reduction due to BC and BrC within different wavelength ranges and the ratios between those of BrC and BC. The BC- and BrC-induced average daily radiative forcing is also shown.
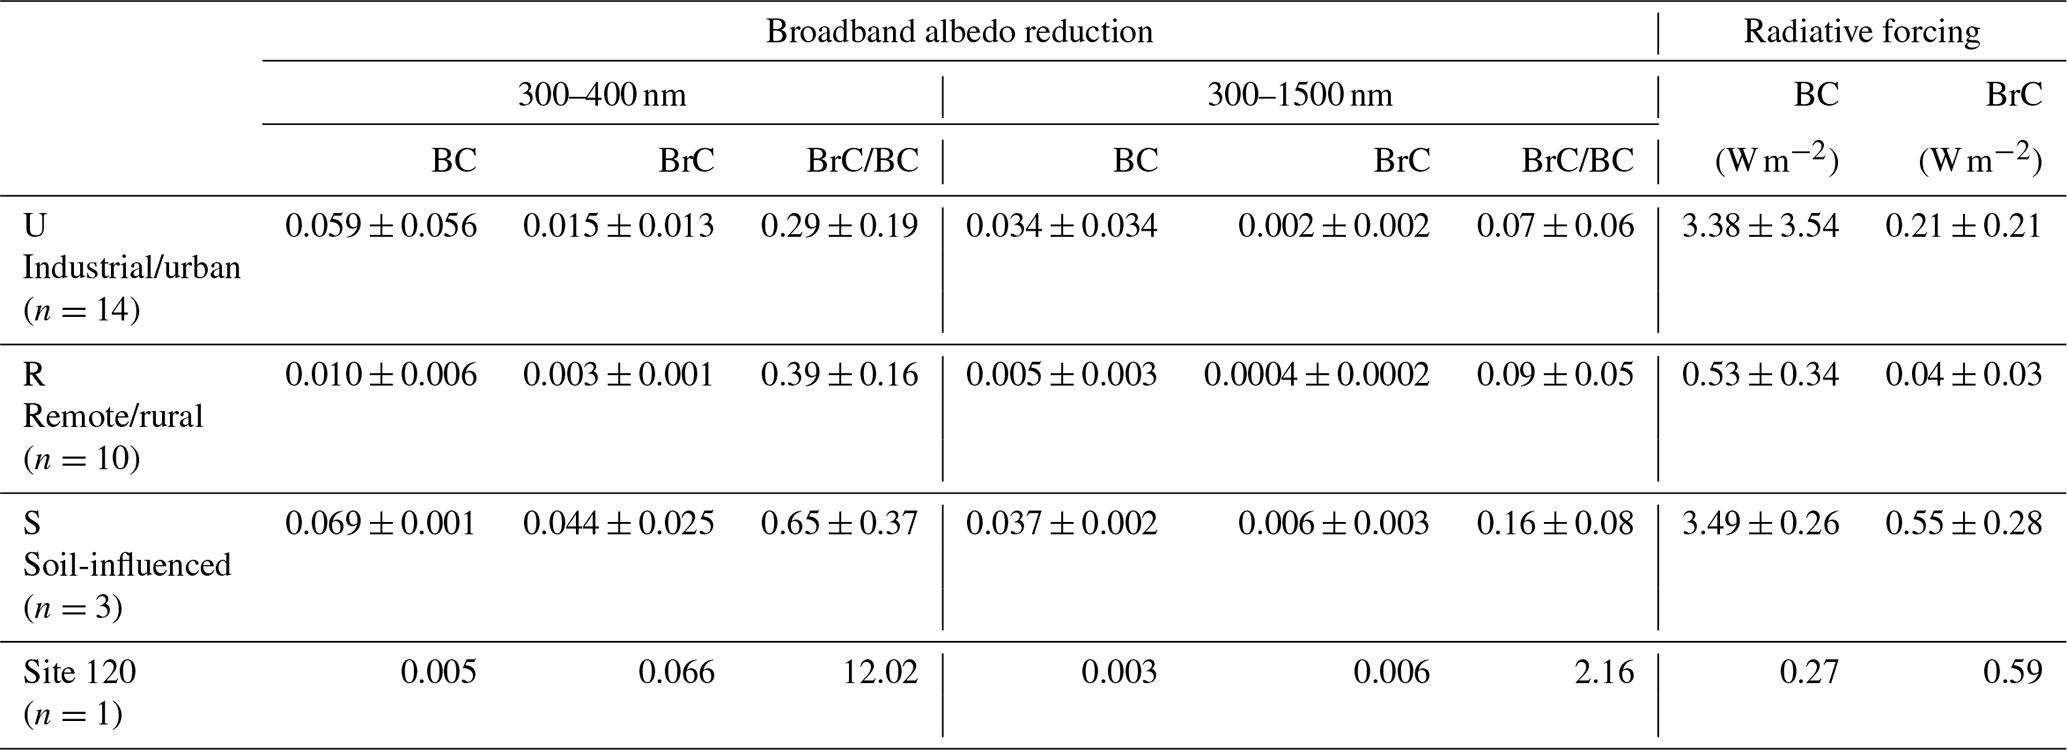
Figure 8 shows the snow spectral albedo (αλ) simulated for four different scenarios, comparing albedo changes in the snowpack containing levels of BC and WSOC measured in the samples. Because most of the snowpack was shallow during the campaign, the albedo of pure snow was influenced by the effects of dark ground surface (albedo assumed to be 0.2) underlaying the snow depth specific to each of the sites, as shown in Fig. 8. The average values of Δα and RF due to BC and BrC at different spectral ranges are summarized in Table 4. As expected, BC has a strong broadband impact on the snow albedo and corresponding RF effects. Specifically, U and S samples with high BC mass loadings (means of 707 and 440 ng g−1, respectively) show albedo reduction (ΔαBC) by 0.034 and 0.037 over the broad 300–1500 nm wavelength range, respectively, and the corresponding RFBC estimates are as high as 3.5 W m−2. In addition, S and site 120 samples with higher WSOC concentrations (means of 2082 and 7069 ng g−1, respectively) show a lower broadband albedo reduction (ΔαBrC) of ∼ 0.006 and the corresponding RFBrC of ∼ 0.6 W m−2. Notably, because of the low BC and high WSOC mass loadings in the site 120 sample, its RFBrC estimate is approximately 2 times higher than RFBC. For the other samples (U, R, and S), the RFBrC is still significant with the average ratios of being at the level of 0.07–0.16. These results indicated that BrC has a profound impact on the reduction of the snow albedo in northern Xinjiang. As shown in Fig. 9, due to the stronger wavelength dependence of BrC absorption, the spectral albedo reduction by BrC increased sharply at shorter wavelengths (300–400 nm), where ΔαBrC can be as large as 29 %–65 % of the ΔαBC (Table 4). Unlike graphitic-like components of BC, the water-soluble part of BrC can trigger photochemical reactions in snow forming reactive oxygen species (Fede and Grannas, 2015; Grannas et al., 2014), catalyzing reaction chemistry, and accelerating its kinetics at the snow–ice–air interface (Grannas et al., 2014; Hullar et al., 2020). Overall, these results emphasize important role of WSOC and its BrC components on tempering solar radiation balance and modulating the environmental chemistry of organics and their air–snow partitioning pertinent to midlatitude seasonal snowpack.
The concentrations, optical properties, and molecular compositions of WSOC in seasonal snow collected from 28 sampling sites in northern Xinjiang, northwestern China, were measured by multiple analytical techniques. The average concentrations of WSOC were 1968 ± 953, 885 ± 328, 2082 ± 1438, and 7069 ng g−1 for U, R, S, and site 120 samples, respectively, reflecting large variability in WSOC mass loadings among different groups of sites. These values were generally higher than those reported previously for samples from high-altitude or high-latitude regions. The site 120 sample showed the highest MAC365 (0.95 m2 g−1) along with an unusual shape of absorption spectrum, followed by samples from S (0.94 ± 0.31 m2 g−1), U (0.39 ± 0.11 m2 g−1), and R (0.38 ± 0.12 m2 g−1) sites. BrC components of our samples showed either comparable or somewhat lower light-absorbing properties compared to previous reports of polar or glacier snow and were identified as W-BrC according to the optical-based classification (Saleh, 2020).
The differences in bulk chemical composition among four groups of samples were elucidated by EEM spectroscopy assisted with PARAFAC analysis. The terrestrial-sourced HULIS-1 factor accounted for 49 % of the total fluorescence in S samples, indicating the significant contributions from soil organic material. The HULIS-2 factor dominated the fluorescence intensity of U samples (46 %). The anthropogenic sources of HULIS-2 were inferred from the significantly positive correlation with sulfate ions indicative of combustion-related sources. The PRLIS factor was abundant in R samples (48 %), reflecting a potential source of labile WSOC from microbial activities. The EEM map of site 120 showed a unique peak not found in any other samples, which might be from plant organics.
HPLC–ESI–HRMS provided further information on molecular composition and sources of WSOC. In total, 561 to 1487 and 339 to 1568 formulas were assigned in ESI+ and ESI− mass spectra, respectively. The mass distributions with respect to relative intensity were highly variable among representative samples of different groups in both ESI+ and ESI− modes, indicating a different composition for each of the samples. CHO+ and CHON+ were the major components detected in ESI+ mode for all samples. CHOS+ compounds were highly enriched in U samples. These species had low oxidation degree and high unsaturation level and aromaticity, suggesting S-containing aromatic organics presumably related to heavy fossil fuels. In the ESI− detection mode, CHO− compounds were still dominant, but the contribution from CHOS− was much higher, showing roughly equal abundance with CHON−. Through analysis of the VK diagrams, the major chemical species in snow WSOC were determined qualitatively. The unsaturated hydrocarbons were the most abundant species in U samples, and most of them were CHOS+ from anthropogenic emissions. The R samples showed the highest contribution from aliphatic/protein-like species, which is consistent with the results from EEM–PARAFAC analysis. The S samples showed high oxygenation and saturation degrees and indicated the similar values of and ratios and percentage of lignin/CRAM-like species compared to the soil organic matter (Ohno et al., 2010). An extremely high contribution of lignin/CRAM-like species was found at the site 120 sample, suggesting the biogenetic sources of WSOC. Furthermore, a few unique CHON− and CHONS− compounds with DBE higher than 17 and MW larger than 400 Da were found at site 120. The most possible candidates for them were species with anthraquinone structures. Therefore, the special spectroscopic features of BrC from the site 120 sample was attributed to biogenic organics from plants.
The RF due to BrC in snow was reported, for the first time, based on the field data and model simulations. In general, the RFBrC values were at the levels of 0.04 to 0.59 W m−2 among different groups of sites and contributed to 7 % to 16 % of RFBC. Therefore, we demonstrated the important influences of WSOC on the snow energy budget and potentially on triggering snow photochemistry. This study presents a comprehensively chemical characterization of WSOC and its BrC properties in collected seasonal snow samples from northern Xinjiang, northwestern China, which helps us to better understand their characteristics, sources, and climate effects.
Requests for all data in this study and any questions regarding the data can be directed to Alexander Laskin (alaskin@purdue.edu) or Xin Wang (wxin@lzu.edu.cn).
The supplement related to this article is available online at: https://doi.org/10.5194/acp-21-8531-2021-supplement.
YZ, CPW, AH, XN, and HW designed and conducted the lab experiments. YZ processed the data with the assistance of CPW and AH and wrote the paper. XW, YZ, XN, JC, TS, WP, and HW designed and conducted the field campaign, collected the snow samples, and discussed the results. AL and XW supervised this study. All co-authors commented on the paper and improved it.
The authors declare that they have no conflict of interest.
The Lanzhou University group acknowledges support from the National Science Fund for Distinguished Young Scholars and the National Natural Science Foundation of China. The Purdue group acknowledges support from the Purdue Climate Change Research Center and the US Department of Energy's (DOE) Atmospheric System Research program, Office of Biological and Environmental Research (OBER). Yue Zhou acknowledges support from the China Scholarship Council.
This research has been supported by the National Natural Science Foundation of China (grant nos. 42025102 and 41975157), the Purdue Climate Change Research Center, Purdue University, and the US Department of Energy (grant no. DE-SC0018948).
This paper was edited by Thorsten Bartels-Rausch and reviewed by Hans-Werner Jacobi and one anonymous referee.
Amoroso, A., Domine, F., Esposito, G., Morin, S., Savarino, J., Nardino, M., Montagnoli, M., Bonneville, J. M., Clement, J. C., Ianniello, A., and Beine, H. J.: Microorganisms in Dry Polar Snow Are Involved in the Exchanges of Reactive Nitrogen Species with the Atmosphere, Environ. Sci. Technol., 44, 714–719, https://doi.org/10.1021/es9027309, 2010.
Anastasio, C. and Robles, T.: Light absorption by soluble chemical species in Arctic and Antarctic snow, J. Geophys. Res.-Atmos., 112, D24304, https://doi.org/10.1029/2007JD008695, 2007.
Andreae, M. O. and Gelencsér, A.: Black carbon or brown carbon? The nature of light-absorbing carbonaceous aerosols, Atmos. Chem. Phys., 6, 3131–3148, https://doi.org/10.5194/acp-6-3131-2006, 2006.
Antony, R., Grannas, A. M., Willoughby, A. S., Sleighter, R. L., Thamban, M., and Hatcher, P. G.: Origin and Sources of Dissolved Organic Matter in Snow on the East Antarctic Ice Sheet, Environ. Sci. Technol., 48, 6151–6159, https://doi.org/10.1021/es405246a, 2014.
Antony, R., Willoughby, A. S., Grannas, A. M., Catanzano, V., Sleighter, R. L., Thamban, M., Hatcher, P. G., and Nair, S.: Molecular Insights on Dissolved Organic Matter Transformation by Supraglacial Microbial Communities, Environ. Sci. Technol., 51, 4328–4337, https://doi.org/10.1021/acs.est.6b05780, 2017.
Bandowe, B. A., Meusel, H., Huang, R., Hoffmann, T., Cao, J., and Ho, K.: Azaarenes in fine particulate matter from the atmosphere of a Chinese megacity, Environ. Sci. Pollut. Res. Int., 23, 16025–16036, https://doi.org/10.1007/s11356-016-6740-z, 2016.
Bandowe, B. A. M. and Meusel, H.: Nitrated polycyclic aromatic hydrocarbons (nitro-PAHs) in the environment – A review, Sci. Total Environ., 581–582, 237–257, https://doi.org/10.1016/j.scitotenv.2016.12.115, 2017.
Beine, H., Anastasio, C., Esposito, G., Patten, K., Wilkening, E., Domine, F., Voisin, D., Barret, M., Houdier, S., and Hall, S.: Soluble, light-absorbing species in snow at Barrow, Alaska, J. Geophys. Res.-Atmos., 116, D00R05, https://doi.org/10.1029/2011jd016181, 2011.
Beres, N. D., Sengupta, D., Samburova, V., Khlystov, A. Y., and Moosmüller, H.: Deposition of brown carbon onto snow: changes in snow optical and radiative properties, Atmos. Chem. Phys., 20, 6095–6114, https://doi.org/10.5194/acp-20-6095-2020, 2020.
Bhatia, M. P., Das, S. B., Longnecker, K., Charette, M. A., and Kujawinski, E. B.: Molecular characterization of dissolved organic matter associated with the Greenland ice sheet, Geochim. Cosmochim. Ac., 74, 3768–3784, https://doi.org/10.1016/j.gca.2010.03.035, 2010.
Bianco, A., Deguillaume, L., Vaitilingom, M., Nicol, E., Baray, J. L., Chaumerliac, N., and Bridoux, M.: Molecular Characterization of Cloud Water Samples Collected at the Puy de Dome (France) by Fourier Transform Ion Cyclotron Resonance Mass Spectrometry, Environ. Sci. Technol., 52, 10275–10285, https://doi.org/10.1021/acs.est.8b01964, 2018.
Birdwell, J. E. and Valsaraj, K. T.: Characterization of dissolved organic matter in fogwater by excitation–emission matrix fluorescence spectroscopy, Atmos. Environ., 44, 3246–3253, https://doi.org/10.1016/j.atmosenv.2010.05.055, 2010.
Bond, T. C. and Bergstrom, R. W.: Light absorption by carbonaceous particles: An investigative review, Aerosol Sci. Tech., 40, 27–67, https://doi.org/10.1080/02786820500421521, 2006.
Bond, T. C., Doherty, S. J., Fahey, D. W., Forster, P. M., Berntsen, T., DeAngelo, B. J., Flanner, M. G., Ghan, S., Karcher, B., Koch, D., Kinne, S., Kondo, Y., Quinn, P. K., Sarofim, M. C., Schultz, M. G., Schulz, M., Venkataraman, C., Zhang, H., Zhang, S., Bellouin, N., Guttikunda, S. K., Hopke, P. K., Jacobson, M. Z., Kaiser, J. W., Klimont, Z., Lohmann, U., Schwarz, J. P., Shindell, D., Storelvmo, T., Warren, S. G., and Zender, C. S.: Bounding the role of black carbon in the climate system: A scientific assessment, J. Geophys. Res.-Atmos., 118, 5380–5552, https://doi.org/10.1002/jgrd.50171, 2013.
Brutel-Vuilmet, C., Ménégoz, M., and Krinner, G.: An analysis of present and future seasonal Northern Hemisphere land snow cover simulated by CMIP5 coupled climate models, The Cryosphere, 7, 67–80, https://doi.org/10.5194/tc-7-67-2013, 2013.
Cain, J., Laskin, A., Kholghy, M. R., Thomson, M. J., and Wang, H.: Molecular characterization of organic content of soot along the centerline of a coflow diffusion flame, Phys. Chem. Chem. Phys., 16, 25862–25875, https://doi.org/10.1039/c4cp03330b, 2014.
Cech, N. B. and Enke, C. G.: Practical implications of some recent studies in electrospray ionization fundamentals, Mass Spectrom. Rev., 20, 362–387, https://doi.org/10.1002/mas.10008, 2001.
Chen, Q., Mu, Z., Song, W., Wang, Y., Yang, Z., Zhang, L., and Zhang, Y. L.: Size-Resolved Characterization of the Chromophores in Atmospheric Particulate Matter From a Typical Coal-Burning City in China, J. Geophys. Res.-Atmos., 124, 10546–10563, https://doi.org/10.1029/2019jd031149, 2019.
Chen, Q., Li, J., Hua, X., Jiang, X., Mu, Z., Wang, M., Wang, J., Shan, M., Yang, X., Fan, X., Song, J., Wang, Y., Guan, D., and Du, L.: Identification of species and sources of atmospheric chromophores by fluorescence excitation–emission matrix with parallel factor analysis, Sci. Total Environ., 718, 137322, https://doi.org/10.1016/j.scitotenv.2020.137322, 2020.
Chen, Q. C., Ikemori, F., and Mochida, M.: Light Absorption and Excitation–Emission Fluorescence of Urban Organic Aerosol Components and Their Relationship to Chemical Structure, Environ. Sci. Technol., 50, 10859–10868, https://doi.org/10.1021/acs.est.6b02541, 2016a.
Chen, Q. C., Miyazaki, Y., Kawamura, K., Matsumoto, K., Coburn, S., Volkamer, R., Iwamoto, Y., Kagami, S., Deng, Y. G., Ogawa, S., Ramasamy, S., Kato, S., Ida, A., Kajii, Y., and Mochida, M.: Characterization of Chromophoric Water-Soluble Organic Matter in Urban, Forest, and Marine Aerosols by HR-ToF-AMS Analysis and Excitation Emission Matrix Spectroscopy, Environ. Sci. Technol., 50, 10351–10360, https://doi.org/10.1021/acs.est.6b01643, 2016b.
Chen, Y. and Bond, T. C.: Light absorption by organic carbon from wood combustion, Atmos. Chem. Phys., 10, 1773–1787, https://doi.org/10.5194/acp-10-1773-2010, 2010.
Coble, P. G.: Characterization of marine and terrestrial DOM in seawater using excitation emission matrix spectroscopy, Mar. Chem., 51, 325–346, https://doi.org/10.1016/0304-4203(95)00062-3, 1996.
Coble, P. G., Del Castillo, C. E., and Avril, B.: Distribution and optical properties of CDOM in the Arabian Sea during the 1995 Southwest Monsoon, Deep-Sea Res. Pt. II, 45, 2195–2223, https://doi.org/10.1016/S0967-0645(98)00068-X, 1998.
Cook, J. M., Hodson, A. J., Gardner, A. S., Flanner, M., Tedstone, A. J., Williamson, C., Irvine-Fynn, T. D. L., Nilsson, J., Bryant, R., and Tranter, M.: Quantifying bioalbedo: a new physically based model and discussion of empirical methods for characterising biological influence on ice and snow albedo, The Cryosphere, 11, 2611–2632, https://doi.org/10.5194/tc-11-2611-2017, 2017a.
Cook, J. M., Hodson, A. J., Taggart, A. J., Mernild, S. H., and Tranter, M.: A predictive model for the spectral ”bioalbedo” of snow, J. Geophys. Res.-Earth, 122, 434–454, https://doi.org/10.1002/2016JF003932, 2017b.
DiDonato, N., Chen, H., Waggoner, D., and Hatcher, P. G.: Potential origin and formation for molecular components of humic acids in soils, Geochim. Cosmochim. Ac., 178, 210–222, https://doi.org/10.1016/j.gca.2016.01.013, 2016.
Doherty, S. J., Warren, S. G., Grenfell, T. C., Clarke, A. D., and Brandt, R. E.: Light-absorbing impurities in Arctic snow, Atmos. Chem. Phys., 10, 11647–11680, https://doi.org/10.5194/acp-10-11647-2010, 2010.
Duarte, R. M. B. O., Santos, E. B. H., Pio, C. A., and Duarte, A. C.: Comparison of structural features of water-soluble organic matter from atmospheric aerosols with those of aquatic humic substances, Atmos. Environ., 41, 8100–8113, https://doi.org/10.1016/j.atmosenv.2007.06.034, 2007.
Duval, J., Pecher, V., Poujol, M., and Lesellier, E.: Research advances for the extraction, analysis and uses of anthraquinones: A review, Ind. Crop. Prod., 94, 812–833, https://doi.org/10.1016/j.indcrop.2016.09.056, 2016.
Elliott, A., Mundy, C. J., Gosselin, M., Poulin, M., Campbell, K., and Wang, F.: Spring production of mycosporine-like amino acids and other UV-absorbing compounds in sea ice-associated algae communities in the Canadian Arctic, Mar. Ecol.-Prog. Ser., 541, 91–104, https://doi.org/10.3354/meps11540, 2015.
Fede, A. and Grannas, A. M.: Photochemical Production of Singlet Oxygen from Dissolved Organic Matter in Ice, Environ. Sci. Technol., 49, 12808–12815, https://doi.org/10.1021/acs.est.5b03600, 2015.
Fellman, J. B., Hood, E., Raymond, P. A., Stubbins, A., and Spencer, R. G. M.: Spatial Variation in the Origin of Dissolved Organic Carbon in Snow on the Juneau Icefield, Southeast Alaska, Environ. Sci. Technol., 49, 11492–11499, https://doi.org/10.1021/acs.est.5b02685, 2015.
Feng, L., Xu, J. Z., Kang, S. C., Li, X. F., Li, Y., Jiang, B., and Shi, Q.: Chemical Composition of Microbe-Derived Dissolved Organic Matter in Cryoconite in Tibetan Plateau Glaciers: Insights from Fourier Transform Ion Cyclotron Resonance Mass Spectrometry Analysis, Environ. Sci. Technol., 50, 13215–13223, https://doi.org/10.1021/acs.est.6b03971, 2016.
Feng, L., An, Y., Xu, J., and Kang, S.: Characteristics and sources of dissolved organic matter in a glacier in the northern Tibetan Plateau: differences between different snow categories, Ann. Glaciol., 59, 31–40, https://doi.org/10.1017/aog.2018.20, 2018.
Feng, L., An, Y., Xu, J., Li, X., Jiang, B., and Liao, Y.: Biochemical evolution of dissolved organic matter during snow metamorphism across the ablation season for a glacier on the central Tibetan Plateau, Sci. Rep., 10, 6123, https://doi.org/10.1038/s41598-020-62851-w, 2020.
Flanner, M. G., Zender, C. S., Randerson, J. T., and Rasch, P. J.: Present-day climate forcing and response from black carbon in snow, J. Geophys. Res.-Atmos., 112, D11202, https://doi.org/10.1029/2006jd008003, 2007.
Fu, P. Q., Kawamura, K., Chen, J., Qin, M. Y., Ren, L. J., Sun, Y. L., Wang, Z. F., Barrie, L. A., Tachibana, E., Ding, A. J., and Yamashita, Y.: Fluorescent water-soluble organic aerosols in the High Arctic atmosphere, Sci. Rep., 5, 9845, https://doi.org/10.1038/Srep09845, 2015.
Ganey, G. Q., Loso, M. G., Burgess, A. B., and Dial, R. J.: The role of microbes in snowmelt and radiative forcing on an Alaskan icefield, Nat. Geosci., 10, 754–759, https://doi.org/10.1038/ngeo3027, 2017.
Geisseler, D., Horwath, W. R., Joergensen, R. G., and Ludwig, B.: Pathways of nitrogen utilization by soil microorganisms – A review, Soil Biol. Biochem., 42, 2058–2067, https://doi.org/10.1016/j.soilbio.2010.08.021, 2010.
Grannas, A. M., Jones, A. E., Dibb, J., Ammann, M., Anastasio, C., Beine, H. J., Bergin, M., Bottenheim, J., Boxe, C. S., Carver, G., Chen, G., Crawford, J. H., Dominé, F., Frey, M. M., Guzmán, M. I., Heard, D. E., Helmig, D., Hoffmann, M. R., Honrath, R. E., Huey, L. G., Hutterli, M., Jacobi, H. W., Klán, P., Lefer, B., McConnell, J., Plane, J., Sander, R., Savarino, J., Shepson, P. B., Simpson, W. R., Sodeau, J. R., von Glasow, R., Weller, R., Wolff, E. W., and Zhu, T.: An overview of snow photochemistry: evidence, mechanisms and impacts, Atmos. Chem. Phys., 7, 4329–4373, https://doi.org/10.5194/acp-7-4329-2007, 2007.
Grannas, A. M., Pagano, L. P., Pierce, B. C., Bobby, R., and Fede, A.: Role of dissolved organic matter in ice photochemistry, Environ. Sci. Technol., 48, 10725–10733, https://doi.org/10.1021/es5023834, 2014.
Hadley, O. L. and Kirchstetter, T. W.: Black-carbon reduction of snow albedo, Nat. Clim. Change, 2, 437–440, https://doi.org/10.1038/Nclimate1433, 2012.
Hagler, G. S. W., Bergin, M. H., Smith, E. A., and Dibb, J. E.: A summer time series of particulate carbon in the air and snow at Summit, Greenland, J. Geophys. Res.-Atmos., 112, D21309, https://doi.org/10.1029/2007jd008993, 2007a.
Hagler, G. S. W., Bergin, M. H., Smith, E. A., Dibb, J. E., Anderson, C., and Steig, E. J.: Particulate and water-soluble carbon measured in recent snow at Summit, Greenland, Geophys. Res. Lett., 34, L16505, https://doi.org/10.1029/2007GL030110, 2007b.
Hall, D. K., Riggs, G. A., and Salomonson, V. V.: Development of Methods for Mapping Global Snow Cover Using Moderate Resolution Imaging Spectroradiometer Data, Remote Sens. Environ., 54, 127–140, https://doi.org/10.1016/0034-4257(95)00137-P, 1995.
Handley, S. R., Clifford, D., and Donaldson, D. J.: Photochemical Loss of Nitric Acid on Organic Films: a Possible Recycling Mechanism for NOx, Environ. Sci. Technol., 41, 3898–3903, https://doi.org/10.1021/es062044z, 2007.
Hansen, J. and Nazarenko, L.: Soot climate forcing via snow and ice albedos, P. Natl. Acad. Sci. USA, 101, 423–428, https://doi.org/10.1073/pnas.2237157100, 2004.
He, C. L., Li, Q. B., Liou, K. N., Takano, Y., Gu, Y., Qi, L., Mao, Y. H., and Leung, L. R.: Black carbon radiative forcing over the Tibetan Plateau, Geophys. Res. Lett., 41, 7806–7813, https://doi.org/10.1002/2014GL062191, 2014.
He, Z., Mao, J., Honeycutt, C. W., Ohno, T., Hunt, J. F., and Cade-Menun, B. J.: Characterization of plant-derived water extractable organic matter by multiple spectroscopic techniques, Biol. Fert. Soils, 45, 609–616, https://doi.org/10.1007/s00374-009-0369-8, 2009.
Hertkorn, N., Benner, R., Frommberger, M., Schmitt-Kopplin, P., Witt, M., Kaiser, K., Kettrup, A., and Hedges, J. I.: Characterization of a major refractory component of marine dissolved organic matter, Geochim. Cosmochim. Ac., 70, 2990–3010, https://doi.org/10.1016/j.gca.2006.03.021, 2006.
Hood, E., Fellman, J., Spencer, R. G. M., Hernes, P. J., Edwards, R., D'Amore, D., and Scott, D.: Glaciers as a source of ancient and labile organic matter to the marine environment, Nature, 462, 1044–1047, https://doi.org/10.1038/nature08580, 2009.
Hood, E., Battin, T. J., Fellman, J., O'Neel, S., and Spencer, R. G. M.: Storage and release of organic carbon from glaciers and ice sheets, Nat. Geosci., 8, 91–96, https://doi.org/10.1038/NGEO2331, 2015.
Huang, J. P., Fu, Q. A., Zhang, W., Wang, X., Zhang, R. D., Ye, H., and Warren, S. G.: Dust And Black Carbon In Seasonal Snow across Northern China, B. Am. Meteorol. Soc., 92, 175–181, https://doi.org/10.1175/2010BAMS3064.1, 2011.
Hullar, T., Bononi, F. C., Chen, Z., Magadia, D., Palmer, O., Tran, T., Rocca, D., Andreussi, O., Donadio, D., and Anastasio, C.: Photodecay of guaiacol is faster in ice, and even more rapid on ice, than in aqueous solution, Environ. Sci.-Proc. Imp., 22, 1666–1677, https://doi.org/10.1039/d0em00242a, 2020.
Hunt, J. F. and Ohno, T.: Characterization of Fresh and Decomposed Dissolved Organic Matter Using Excitation–Emission Matrix Fluorescence Spectroscopy and Multiway Analysis, J. Agr. Food. Chem., 55, 2121–2128, https://doi.org/10.1021/jf063336m, 2007.
Ikeya, K., Sleighter, R. L., Hatcher, P. G., and Watanabe, A.: Characterization of the chemical composition of soil humic acids using Fourier transform ion cyclotron resonance mass spectrometry, Geochim. Cosmochim. Ac., 153, 169–182, https://doi.org/10.1016/j.gca.2015.01.002, 2015.
Jacobson, M. Z.: Climate response of fossil fuel and biofuel soot, accounting for soot's feedback to snow and sea ice albedo and emissivity, J. Geophys. Res.-Atmos., 109, D21201, https://doi.org/10.1029/2004jd004945, 2004.
Jaffé, R., Cawley, K. M., and Yamashita, Y.: Applications of Excitation Emission Matrix Fluorescence with Parallel Factor Analysis (EEM-PARAFAC) in Assessing Environmental Dynamics of Natural Dissolved Organic Matter (DOM) in Aquatic Environments: A Review, in: Advances in the Physicochemical Characterization of Dissolved Organic Matter: Impact on Natural and Engineered Systems, ACS Symposium Series, 1160, American Chemical Society, Washington, DC, 27–73, 2014.
Jin, Z. H., Charlock, T. P., Rutledge, K., Stamnes, K., and Wang, Y. J.: Analytical solution of radiative transfer in the coupled atmosphere-ocean system with a rough surface, Appl. Optics, 45, 7443–7455, https://doi.org/10.1364/AO.45.007443, 2006.
Jones, H. G.: The ecology of snow-covered systems: a brief overview of nutrient cycling and life in the cold, Hydrol. Process., 13, 2135–2147, https://doi.org/10.1002/(SICI)1099-1085(199910)13:14/15<2135::AID-HYP862>3.0.CO;2-Y, 1999.
Kim, S., Kramer, R. W., and Hatcher, P. G.: Graphical method for analysis of ultrahigh-resolution broadband mass spectra of natural organic matter, the van Krevelen diagram, Anal. Chem., 75, 5336–5344, https://doi.org/10.1021/ac034415p, 2003.
Kirchstetter, T. W., Novakov, T., and Hobbs, P. V.: Evidence that the spectral dependence of light absorption by aerosols is affected by organic carbon, J. Geophys. Res.-Atmos., 109, D21208, https://doi.org/10.1029/2004jd004999, 2004.
Kirillova, E. N., Andersson, A., Han, J., Lee, M., and Gustafsson, Ö.: Sources and light absorption of water-soluble organic carbon aerosols in the outflow from northern China, Atmos. Chem. Phys., 14, 1413–1422, https://doi.org/10.5194/acp-14-1413-2014, 2014.
Koch, B. P. and Dittmar, T.: From mass to structure: an aromaticity index for high-resolution mass data of natural organic matter, Rapid Commun. Mass Sp., 20, 926–932, https://doi.org/10.1002/rcm.2386, 2006.
Koch, B. P. and Dittmar, T.: From mass to structure: an aromaticity index for high-resolution mass data of natural organic matter, Erratum, Rapid Commun. Mass Sp., 30, 250–250, https://doi.org/10.1002/rcm.7433, 2016.
Kothawala, D. N., Murphy, K. R., Stedmon, C. A., Weyhenmeyer, G. A., and Tranvik, L. J.: Inner filter correction of dissolved organic matter fluorescence, Limnol. Oceanogr.-Meth., 11, 616–630, https://doi.org/10.4319/Iom.2013.11.616, 2013.
Kroll, J. H., Donahue, N. M., Jimenez, J. L., Kessler, S. H., Canagaratna, M. R., Wilson, K. R., Altieri, K. E., Mazzoleni, L. R., Wozniak, A. S., Bluhm, H., Mysak, E. R., Smith, J. D., Kolb, C. E., and Worsnop, D. R.: Carbon oxidation state as a metric for describing the chemistry of atmospheric organic aerosol, Nat. Chem., 3, 133–139, https://doi.org/10.1038/nchem.948, 2011.
Laskin, A., Smith, J. S., and Laskin, J.: Molecular Characterization of Nitrogen-Containing Organic Compounds in Biomass Burning Aerosols Using High-Resolution Mass Spectrometry, Environ. Sci. Technol., 43, 3764–3771, https://doi.org/10.1021/es803456n, 2009.
Laskin, A., Laskin, J., and Nizkorodov, S. A.: Chemistry of Atmospheric Brown Carbon, Chem. Rev., 115, 4335–4382, https://doi.org/10.1021/cr5006167, 2015.
Lawaetz, A. J. and Stedmon, C. A.: Fluorescence Intensity Calibration Using the Raman Scatter Peak of Water, Appl. Spectrosc., 63, 936–940, https://doi.org/10.1366/000370209788964548, 2009.
Legrand, M., Preunkert, S., Jourdain, B., Guilhermet, J., Faïn, X., Alekhina, I., and Petit, J. R.: Water-soluble organic carbon in snow and ice deposited at Alpine, Greenland, and Antarctic sites: a critical review of available data and their atmospheric relevance, Clim. Past, 9, 2195–2211, https://doi.org/10.5194/cp-9-2195-2013, 2013.
Lin, P., Engling, G., and Yu, J. Z.: Humic-like substances in fresh emissions of rice straw burning and in ambient aerosols in the Pearl River Delta Region, China, Atmos. Chem. Phys., 10, 6487–6500, https://doi.org/10.5194/acp-10-6487-2010, 2010.
Lin, P., Rincon, A. G., Kalberer, M., and Yu, J. Z.: Elemental composition of HULIS in the Pearl River Delta Region, China: results inferred from positive and negative electrospray high resolution mass spectrometric data, Environ. Sci. Technol., 46, 7454–7462, https://doi.org/10.1021/es300285d, 2012.
Lin, P., Aiona, P. K., Li, Y., Shiraiwa, M., Laskin, J., Nizkorodov, S. A., and Laskin, A.: Molecular Characterization of Brown Carbon in Biomass Burning Aerosol Particles, Environ. Sci. Technol., 50, 11815–11824, https://doi.org/10.1021/acs.est.6b03024, 2016.
Lin, P., Fleming, L. T., Nizkorodov, S. A., Laskin, J., and Laskin, A.: Comprehensive Molecular Characterization of Atmospheric Brown Carbon by High Resolution Mass Spectrometry with Electrospray and Atmospheric Pressure Photoionization, Anal. Chem., 90, 12493–12502, https://doi.org/10.1021/acs.analchem.8b02177, 2018.
Liu, Y. Q., Yao, T. D., Jiao, N. Z., Kang, S. C., Xu, B. Q., Zeng, Y. H., Huang, S. J., and Liu, X. B.: Bacterial diversity in the snow over Tibetan Plateau Glaciers, Extremophiles, 13, 411–423, https://doi.org/10.1007/s00792-009-0227-5, 2009.
Lobodin, V. V., Marshall, A. G., and Hsu, C. S.: Compositional Space Boundaries for Organic Compounds, Anal. Chem., 84, 3410–3416, https://doi.org/10.1021/ac300244f, 2012.
Lu, Y., Li, X., Mesfioui, R., Bauer, J. E., Chambers, R. M., Canuel, E. A., and Hatcher, P. G.: Use of ESI-FTICR-MS to Characterize Dissolved Organic Matter in Headwater Streams Draining Forest-Dominated and Pasture-Dominated Watersheds, Plos One, 10, e0145639, https://doi.org/10.1371/journal.pone.0145639, 2015.
Lu, Z., Streets, D. G., Winijkul, E., Yan, F., Chen, Y., Bond, T. C., Feng, Y., Dubey, M. K., Liu, S., Pinto, J. P., and Carmichael, G. R.: Light absorption properties and radiative effects of primary organic aerosol emissions, Environ. Sci. Technol., 49, 4868–4877, https://doi.org/10.1021/acs.est.5b00211, 2015.
Lutz, S., Anesio, A. M., Villar, S. E. J., and Benning, L. G.: Variations of algal communities cause darkening of a Greenland glacier, FEMS Microbiol. Ecol., 89, 402–414, https://doi.org/10.1111/1574-6941.12351, 2014.
McLafferty, F. W., Tureček, F., and Turecek, F.: Interpretation of mass spectra, University science books, Sausalito, California, 1993.
McNeill, V. F., Grannas, A. M., Abbatt, J. P. D., Ammann, M., Ariya, P., Bartels-Rausch, T., Domine, F., Donaldson, D. J., Guzman, M. I., Heger, D., Kahan, T. F., Klán, P., Masclin, S., Toubin, C., and Voisin, D.: Organics in environmental ices: sources, chemistry, and impacts, Atmos. Chem. Phys., 12, 9653–9678, https://doi.org/10.5194/acp-12-9653-2012, 2012.
Mead, R. N., Felix, J. D., Avery, G. B., Kieber, R. J., Willey, J. D., and Podgorski, D. C.: Characterization of CHOS compounds in rainwater from continental and coastal storms by ultrahigh resolution mass spectrometry, Atmos. Environ., 105, 162–168, https://doi.org/10.1016/j.atmosenv.2015.01.057, 2015.
Mladenov, N., Alados-Arboledas, L., Olmo, F. J., Lyamani, H., Delgado, A., Molina, A., and Reche, I.: Applications of optical spectroscopy and stable isotope analyses to organic aerosol source discrimination in an urban area, Atmos. Environ., 45, 1960–1969, https://doi.org/10.1016/j.atmosenv.2011.01.029, 2011.
Mladenov, N., Williams, M. W., Schmidt, S. K., and Cawley, K.: Atmospheric deposition as a source of carbon and nutrients to an alpine catchment of the Colorado Rocky Mountains, Biogeosciences, 9, 3337–3355, https://doi.org/10.5194/bg-9-3337-2012, 2012.
Murphy, K. R., Stedmon, C. A., Waite, T. D., and Ruiz, G. M.: Distinguishing between terrestrial and autochthonous organic matter sources in marine environments using fluorescence spectroscopy, Mar. Chem., 108, 40–58, https://doi.org/10.1016/j.marchem.2007.10.003, 2008.
Murphy, K. R., Stedmon, C. A., Graeber, D., and Bro, R.: Fluorescence spectroscopy and multi-way techniques. PARAFAC, Anal. Methods-UK, 5, 6557–6566, https://doi.org/10.1039/c3ay41160e, 2013.
Myers, O. D., Sumner, S. J., Li, S., Barnes, S., and Du, X.: One Step Forward for Reducing False Positive and False Negative Compound Identifications from Mass Spectrometry Metabolomics Data: New Algorithms for Constructing Extracted Ion Chromatograms and Detecting Chromatographic Peaks, Anal. Chem., 89, 8696–8703, https://doi.org/10.1021/acs.analchem.7b00947, 2017.
Ning, C., Gao, Y., Zhang, H., Yu, H., Wang, L., Geng, N., Cao, R., and Chen, J.: Molecular characterization of dissolved organic matters in winter atmospheric fine particulate matters (PM2.5) from a coastal city of northeast China, Sci. Total Environ., 689, 312–321, https://doi.org/10.1016/j.scitotenv.2019.06.418, 2019.
Niu, H. W., Kang, S. C., Lu, X. X., and Shi, X. F.: Distributions and light absorption property of water soluble organic carbon in a typical temperate glacier, southeastern Tibetan Plateau, Tellus B, 70, 1–15, https://doi.org/10.1080/16000889.2018.1468705, 2018.
Nizkorodov, S. A., Laskin, J., and Laskin, A.: Molecular chemistry of organic aerosols through the application of high resolution mass spectrometry, Phys. Chem. Chem. Phys., 13, 3612–3629, https://doi.org/10.1039/c0cp02032j, 2011.
Noziere, B., Kalberer, M., Claeys, M., Allan, J., D'Anna, B., Decesari, S., Finessi, E., Glasius, M., Grgic, I., Hamilton, J. F., Hoffmann, T., Iinuma, Y., Jaoui, M., Kahnt, A., Kampf, C. J., Kourtchev, I., Maenhaut, W., Marsden, N., Saarikoski, S., Schnelle-Kreis, J., Surratt, J. D., Szidat, S., Szmigielski, R., and Wisthaler, A.: The molecular identification of organic compounds in the atmosphere: state of the art and challenges, Chem. Rev., 115, 3919–3983, https://doi.org/10.1021/cr5003485, 2015.
Ohno, T., He, Z., Sleighter, R. L., Honeycutt, C. W., and Hatcher, P. G.: Ultrahigh resolution mass spectrometry and indicator species analysis to identify marker components of soil- and plant biomass-derived organic matter fractions, Environ. Sci. Technol., 44, 8594–8600, https://doi.org/10.1021/es101089t, 2010.
Painter, T. H., Deems, J. S., Belnap, J., Hamlet, A. F., Landry, C. C., and Udall, B.: Response of Colorado River runoff to dust radiative forcing in snow, P. Natl. Acad. Sci. USA, 107, 17125–17130, https://doi.org/10.1073/pnas.0913139107, 2010.
Painter, T. H., Seidel, F. C., Bryant, A. C., McKenzie Skiles, S., and Rittger, K.: Imaging spectroscopy of albedo and radiative forcing by light-absorbing impurities in mountain snow, J. Geophys. Res.-Atmos., 118, 9511–9523, https://doi.org/10.1002/jgrd.50520, 2013.
Pluskal, T., Castillo, S., Villar-Briones, A., and Orešič, M.: MZmine 2: modular framework for processing, visualizing, and analyzing mass spectrometry-based molecular profile data, BMC Bioinformatics, 11, 395, https://doi.org/10.1186/1471-2105-11-395, 2010.
Pöhlker, C., Huffman, J. A., and Pöschl, U.: Autofluorescence of atmospheric bioaerosols – fluorescent biomolecules and potential interferences, Atmos. Meas. Tech., 5, 37–71, https://doi.org/10.5194/amt-5-37-2012, 2012.
Pu, W., Wang, X., Wei, H., Zhou, Y., Shi, J., Hu, Z., Jin, H., and Chen, Q.: Properties of black carbon and other insoluble light-absorbing particles in seasonal snow of northwestern China, The Cryosphere, 11, 1213–1233, https://doi.org/10.5194/tc-11-1213-2017, 2017.
Pu, W., Cui, J., Shi, T., Zhang, X., He, C., and Wang, X.: The remote sensing of radiative forcing by light-absorbing particles (LAPs) in seasonal snow over northeastern China, Atmos. Chem. Phys., 19, 9949–9968, https://doi.org/10.5194/acp-19-9949-2019, 2019.
Qi, Y., Fu, P., and Volmer, D. A.: Analysis of natural organic matter via fourier transform ion cyclotron resonance mass spectrometry: an overview of recent non-petroleum applications, Mass Spectrom. Rev., https://doi.org/10.1002/mas.21634, in press, 2020.
Qian, Y., Wang, H., Zhang, R., Flanner, M. G., and Rasch, P. J.: A sensitivity study on modeling black carbon in snow and its radiative forcing over the Arctic and Northern China, Environ. Res. Lett., 9, 064001, https://doi.org/10.1088/1748-9326/9/6/064001, 2014.
Roach, P. J., Laskin, J., and Laskin, A.: Higher-order mass defect analysis for mass spectra of complex organic mixtures, Anal. Chem., 83, 4924–4929, https://doi.org/10.1021/ac200654j, 2011.
Saleh, R.: From Measurements to Models: Toward Accurate Representation of Brown Carbon in Climate Calculations, Current Pollution Reports, 6, 90–104, https://doi.org/10.1007/s40726-020-00139-3, 2020.
Seinfeld, J. H. and Pandis, S. N.: Atmospheric chemistry and physics: from air pollution to climate change, 3rd Edn., John Wiley & Sons, Hoboken, New Jersey, 2016.
Shi, T., Pu, W., Zhou, Y., Cui, J., Zhang, D., and Wang, X.: Albedo of Black Carbon-Contaminated Snow Across Northwestern China and the Validation With Model Simulation, J. Geophys. Res.-Atmos., 125, e2019JD032065, https://doi.org/10.1029/2019jd032065, 2020.
Shick, J. M. and Dunlap, W. C.: Mycosporine-like amino acids and related Gadusols: biosynthesis, acumulation, and UV-protective functions in aquatic organisms, Annu. Rev. Physiol., 64, 223–262, https://doi.org/10.1146/annurev.physiol.64.081501.155802, 2002.
Siegmann, K. and Sattler, K.: Formation mechanism for polycyclic aromatic hydrocarbons in methane flames, J. Chem. Phys., 112, 698–709, https://doi.org/10.1063/1.480648, 2000.
Singer, G. A., Fasching, C., Wilhelm, L., Niggemann, J., Steier, P., Dittmar, T., and Battin, T. J.: Biogeochemically diverse organic matter in Alpine glaciers and its downstream fate, Nat. Geosci., 5, 710–714, https://doi.org/10.1038/NGEO1581, 2012.
Skiles, S. M., Flanner, M., Cook, J. M., Dumont, M., and Painter, T. H.: Radiative forcing by light-absorbing particles in snow, Nat. Clim. Change, 8, 964–971, https://doi.org/10.1038/s41558-018-0296-5, 2018.
Spencer, R. G. M., Guo, W. D., Raymond, P. A., Dittmar, T., Hood, E., Fellman, J., and Stubbins, A.: Source and biolability of ancient dissolved organic matter in glacier and lake ecosystems on the Tibetan Plateau, Geochim. Cosmochim. Ac., 142, 64–74, https://doi.org/10.1016/j.gca.2014.08.006, 2014.
Stedmon, C. A. and Markager, S.: Resolving the variability in dissolved organic matter fluorescence in a temperate estuary and its catchment using PARAFAC analysis, Limnol. Oceanogr., 50, 686–697, https://doi.org/10.4319/lo.2005.50.2.0686, 2005.
Stedmon, C. A. and Bro, R.: Characterizing dissolved organic matter fluorescence with parallel factor analysis: a tutorial, Limnol. Oceanogr.-Meth., 6, 572–579, https://doi.org/10.4319/lom.2008.6.572, 2008.
Stedmon, C. A., Markager, S., and Bro, R.: Tracing dissolved organic matter in aquatic environments using a new approach to fluorescence spectroscopy, Mar. Chem., 82, 239–254, https://doi.org/10.1016/S0304-4203(03)00072-0, 2003.
Sun, H. L., Biedermann, L., and Bond, T. C.: Color of brown carbon: A model for ultraviolet and visible light absorption by organic carbon aerosol, Geophys. Res. Lett., 34, L17813, https://doi.org/10.1029/2007gl029797, 2007.
Toon, O. B., Mckay, C. P., Ackerman, T. P., and Santhanam, K.: Rapid Calculation of Radiative Heating Rates and Photodissociation Rates in Inhomogeneous Multiple-Scattering Atmospheres, J. Geophys. Res.-Atmos., 94, 16287–16301, https://doi.org/10.1029/JD094iD13p16287, 1989.
Voisin, D., Jaffrezo, J. L., Houdier, S., Barret, M., Cozic, J., King, M. D., France, J. L., Reay, H. J., Grannas, A., Kos, G., Ariya, P. A., Beine, H. J., and Domine, F.: Carbonaceous species and humic like substances (HULIS) in Arctic snowpack during OASIS field campaign in Barrow, J. Geophys. Res.-Atmos., 117, D00r19, https://doi.org/10.1029/2011jd016612, 2012.
Wang, K., Zhang, Y., Huang, R.-J., Cao, J., and Hoffmann, T.: UHPLC-Orbitrap mass spectrometric characterization of organic aerosol from a central European city (Mainz, Germany) and a Chinese megacity (Beijing), Atmos. Environ., 189, 22–29, https://doi.org/10.1016/j.atmosenv.2018.06.036, 2018.
Wang, X., Doherty, S. J., and Huang, J.: Black carbon and other light-absorbing impurities in snow across Northern China, J. Geophys. Res.-Atmos., 118, 1471–1492, https://doi.org/10.1029/2012JD018291, 2013.
Wang, X., Hayeck, N., Brüggemann, M., Yao, L., Chen, H., Zhang, C., Emmelin, C., Chen, J., George, C., and Wang, L.: Chemical Characteristics of Organic Aerosols in Shanghai: A Study by Ultrahigh-Performance Liquid Chromatography Coupled With Orbitrap Mass Spectrometry, J. Geophys. Res.-Atmos., 122, 11703–11722, https://doi.org/10.1002/2017jd026930, 2017a.
Wang, X., Pu, W., Ren, Y., Zhang, X., Zhang, X., Shi, J., Jin, H., Dai, M., and Chen, Q.: Observations and model simulations of snow albedo reduction in seasonal snow due to insoluble light-absorbing particles during 2014 Chinese survey, Atmos. Chem. Phys., 17, 2279–2296, https://doi.org/10.5194/acp-17-2279-2017, 2017b.
Wang, X., Hayeck, N., Brüggemann, M., Abis, L., Riva, M., Lu, Y., Wang, B., Chen, J., George, C., and Wang, L.: Chemical characteristics and brown carbon chromophores of atmospheric organic aerosols over the Yangtze River channel: a cruise campaign, J. Geophys. Res.-Atmos., 125, e2020JD032497, https://doi.org/10.1029/2020jd032497, 2020a.
Wang, X., Zhang, X., and Di, W.: Development of an improved two-sphere integration technique for quantifying black carbon concentrations in the atmosphere and seasonal snow, Atmos. Meas. Tech., 13, 39–52, https://doi.org/10.5194/amt-13-39-2020, 2020b.
Wiscombe, W. J. and Warren, S. G.: A Model for the Spectral Albedo of Snow. I: Pure Snow, J. Atmos. Sci., 37, 2712–2733, https://doi.org/10.1175/1520-0469(1980)037<2712:AMFTSA>2.0.CO;2, 1980.
Wu, C., Yang, J., Fu, Q., Zhu, B., Ruan, T., and Jiang, G.: Molecular characterization of water-soluble organic compounds in PM2.5 using ultrahigh resolution mass spectrometry, Sci. Total Environ., 668, 917–924, https://doi.org/10.1016/j.scitotenv.2019.03.031, 2019.
Wu, G., Ram, K., Fu, P., Wang, W., Zhang, Y., Liu, X., Stone, E. A., Pradhan, B. B., Dangol, P. M., Panday, A. K., Wan, X., Bai, Z., Kang, S., Zhang, Q., and Cong, Z.: Water-Soluble Brown Carbon in Atmospheric Aerosols from Godavari (Nepal), a Regional Representative of South Asia, Environ. Sci. Technol., 53, 3471–3479, https://doi.org/10.1021/acs.est.9b00596, 2019.
Wu, G., Wan, X., Ram, K., Li, P., Liu, B., Yin, Y., Fu, P., Loewen, M., Gao, S., Kang, S., Kawamura, K., Wang, Y., and Cong, Z.: Light absorption, fluorescence properties and sources of brown carbon aerosols in the Southeast Tibetan Plateau, Environ. Pollut., 257, 113616, https://doi.org/10.1016/j.envpol.2019.113616, 2020.
Wu, G., Fu, P., Ram, K., Song, J., Chen, Q., Kawamura, K., Wan, X., Kang, S., Wang, X., Laskin, A., and Cong, Z.: Fluorescence characteristics of water-soluble organic carbon in atmospheric aerosol, Environ. Pollut., 268, 115906, https://doi.org/10.1016/j.envpol.2020.115906, 2021.
Xie, Q., Su, S., Chen, S., Zhang, Q., Yue, S., Zhao, W., Du, H., Ren, H., Wei, L., Dong, C., Xu, Y., Sun, Y., Wang, Z., and Fu, P.: Molecular Characterization of Size-Segregated Organic Aerosols in the Urban Boundary Layer in Wintertime Beijing by FT-ICR MS, Faraday Discuss., 226, 457, https://doi.org/10.1039/d0fd00084a, 2021.
Xu, C., Chen, Y., Yang, Y., Hao, X., and Shen, Y.: Hydrology and water resources variation and its response to regional climate change in Xinjiang, J. Geogr. Sci., 20, 599–612, https://doi.org/10.1007/s11442-010-0599-6, 2010.
Yan, F., Kang, S., Li, C., Zhang, Y., Qin, X., Li, Y., Zhang, X., Hu, Z., Chen, P., Li, X., Qu, B., and Sillanpää, M.: Concentration, sources and light absorption characteristics of dissolved organic carbon on a medium-sized valley glacier, northern Tibetan Plateau, The Cryosphere, 10, 2611–2621, https://doi.org/10.5194/tc-10-2611-2016, 2016.
Yang, W., Han, C., Yang, H., and Xue, X.: Significant HONO formation by the photolysis of nitrates in the presence of humic acids, Environ. Pollut., 243, 679–686, https://doi.org/10.1016/j.envpol.2018.09.039, 2018.
Ye, H., Zhang, R. D., Shi, J. S., Huang, J. P., Warren, S. G., and Fu, Q.: Black carbon in seasonal snow across northern Xinjiang in northwestern China, Environ. Res. Lett., 7, 044002, https://doi.org/10.1088/1748-9326/7/4/044002, 2012.
Zatko, M. C., Grenfell, T. C., Alexander, B., Doherty, S. J., Thomas, J. L., and Yang, X.: The influence of snow grain size and impurities on the vertical profiles of actinic flux and associated NOx emissions on the Antarctic and Greenland ice sheets, Atmos. Chem. Phys., 13, 3547–3567, https://doi.org/10.5194/acp-13-3547-2013, 2013.
Zhang, Y., Kang, S., Sprenger, M., Cong, Z., Gao, T., Li, C., Tao, S., Li, X., Zhong, X., Xu, M., Meng, W., Neupane, B., Qin, X., and Sillanpää, M.: Black carbon and mineral dust in snow cover on the Tibetan Plateau, The Cryosphere, 12, 413–431, https://doi.org/10.5194/tc-12-413-2018, 2018.
Zhang, Y., Kang, S., Gao, T., Schmale, J., Liu, Y., Zhang, W., Guo, J., Du, W., Hu, Z., Cui, X., and Sillanpaa, M.: Dissolved organic carbon in snow cover of the Chinese Altai Mountains, Central Asia: Concentrations, sources and light-absorption properties, Sci. Total Environ., 647, 1385–1397, https://doi.org/10.1016/j.scitotenv.2018.07.417, 2019.
Zhang, Y., Kang, S., Gao, T., Sprenger, M., Dou, T., Han, W., Zhang, Q., Sun, S., Du, W., Chen, P., Guo, J., Cui, X., and Sillanpää, M.: Dissolved organic carbon in Alaskan Arctic snow: concentrations, light-absorption properties, and bioavailability, Tellus B, 72, 1–19, https://doi.org/10.1080/16000889.2020.1778968, 2020.
Zhang, Y. L., Zhang, E. L., Yin, Y., van Dijk, M. A., Feng, L. Q., Shi, Z. Q., Liu, M. L., and Qin, B. Q.: Characteristics and sources of chromophoric dissolved organic matter in lakes of the Yungui Plateau, China, differing in trophic state and altitude, Limnol. Oceanogr., 55, 2645–2659, https://doi.org/10.4319/lo.2010.55.6.2645, 2010.
Zhang, Y.-L., El-Haddad, I., Huang, R.-J., Ho, K.-F., Cao, J.-J., Han, Y., Zotter, P., Bozzetti, C., Daellenbach, K. R., Slowik, J. G., Salazar, G., Prévôt, A. S. H., and Szidat, S.: Large contribution of fossil fuel derived secondary organic carbon to water soluble organic aerosols in winter haze in China, Atmos. Chem. Phys., 18, 4005–4017, https://doi.org/10.5194/acp-18-4005-2018, 2018.
Zhao, C., Hu, Z., Qian, Y., Ruby Leung, L., Huang, J., Huang, M., Jin, J., Flanner, M. G., Zhang, R., Wang, H., Yan, H., Lu, Z., and Streets, D. G.: Simulating black carbon and dust and their radiative forcing in seasonal snow: a case study over North China with field campaign measurements, Atmos. Chem. Phys., 14, 11475–11491, https://doi.org/10.5194/acp-14-11475-2014, 2014.
Zhao, Y., Song, K., Wen, Z., Li, L., Zang, S., Shao, T., Li, S., and Du, J.: Seasonal characterization of CDOM for lakes in semiarid regions of Northeast China using excitation–emission matrix fluorescence and parallel factor analysis (EEM–PARAFAC), Biogeosciences, 13, 1635–1645, https://doi.org/10.5194/bg-13-1635-2016, 2016.
Zhou, L., Zhou, Y., Hu, Y., Cai, J., Liu, X., Bai, C., Tang, X., Zhang, Y., Jang, K. S., Spencer, R. G. M., and Jeppesen, E.: Microbial production and consumption of dissolved organic matter in glacial ecosystems on the Tibetan Plateau, Water Res., 160, 18–28, https://doi.org/10.1016/j.watres.2019.05.048, 2019.
Zhou, Y., Wen, H., Liu, J., Pu, W., Chen, Q., and Wang, X.: The optical characteristics and sources of chromophoric dissolved organic matter (CDOM) in seasonal snow of northwestern China, The Cryosphere, 13, 157–175, https://doi.org/10.5194/tc-13-157-2019, 2019a.
Zhou, Y., Zhou, L., He, X., Jang, K. S., Yao, X., Hu, Y., Zhang, Y., Li, X., Spencer, R. G. M., Brookes, J. D., and Jeppesen, E.: Variability in Dissolved Organic Matter Composition and Biolability across Gradients of Glacial Coverage and Distance from Glacial Terminus on the Tibetan Plateau, Environ. Sci. Technol., 53, 12207–12217, https://doi.org/10.1021/acs.est.9b03348, 2019b.