the Creative Commons Attribution 4.0 License.
the Creative Commons Attribution 4.0 License.
 | 07 Jun 2021
Assessing the contribution of the ENSO and MJO to Australian dust activity based on satellite- and ground-based observations
Paul Ginoux
Despite Australian dust's critical role in the regional climate and surrounding marine ecosystems, the controlling factors of the spatiotemporal variations of Australian dust are not fully understood. Here we assess the connections between observed spatiotemporal variations of Australian dust with key modes of large-scale climate variability, namely the El Niño–Southern Oscillation (ENSO) and Madden–Julian Oscillation (MJO). Multiple dust observations from the Aerosol Robotic Network (AERONET), weather stations, and satellite instruments, namely the Moderate Resolution Imaging Spectroradiometer (MODIS) and Multi-angle Imaging SpectroRadiometer (MISR), are examined. The assessed multiple dust observations consistently identify the natural and agricultural dust hotspots in Australia, including the Lake Eyre basin, Lake Torrens basin, Lake Frome basin, Simpson Desert, Barwon–Darling basin, Riverina, Barkly Tableland, and the lee side of the Great Dividing Range, as well as a country-wide, austral spring-to-summer peak in dust activity. Our regression analysis of observed dust optical depth (DOD) upon an ocean Niño index confirms previous model-based findings on the enhanced dust activity in southern and eastern Australia during the subsequent austral spring and summer dust season following the strengthening of austral wintertime El Niño. Our analysis further indicates the modulation of the ENSO–dust relationship with the MJO phases. During sequential MJO phases, the dust-active center moves from west to east, associated with the eastward propagation of MJO, with the maximum enhancement in dust activity at about 120, 130, and 140∘ E, corresponding to MJO phases 1–2, 3–4, and 5–6, respectively. MJO phases 3–6 are favorable for enhanced ENSO modulation of dust activity, especially the occurrence of extreme dust events, in southeastern Australia, currently hypothesized to be attributed to the interaction between MJO-induced anomalies in convection and wind and ENSO-induced anomalies in soil moisture and vegetation.
- Article
(8537 KB) - Full-text XML
-
Supplement
(8950 KB) - BibTeX
- EndNote


Australia represents a major contributor of dust to the Southern Hemisphere (Tanaka and Chiba, 2006), influencing regional climate and the marine ecosystems of the surrounding ocean basins. The substantial aerosol loading in the atmosphere from dust storms in Australia exerts a direct effect on the radiation budget through the absorption and scattering of incoming shortwave radiation and the absorption and emission of outgoing longwave radiation (Choobari et al., 2013; Miller et al., 2004; Tegen and Lacis, 1996). Dust aerosols also produce an indirect effect by influencing the nucleation, microphysics, development, and optical properties of clouds, thereby altering rainfall patterns (DeMott et al., 2010). The deposition of transported dust over ocean affects ocean biogeochemistry through changes to the iron supply (Gabric et al., 2010; Jickells et al., 2005). Australia's arid and semiarid regions provide a key supply of iron to the Southern Ocean and Antarctica by dust, during the present (Li et al., 2010), glacial (Lamy et al., 2014), and interglacial (Revel-Rolland et al., 2006) periods. Since most of the Southern Ocean is iron-limited (Sunda and Huntsman, 1997), the transport and deposition of Australian dust affect its productivity and carbon uptake (Boyd et al., 2004; Gabric et al., 2002). Therefore, deeper understanding of the spatiotemporal variations in Australian dust emissions and their driving mechanisms will have broad implications on the regional and global climate.
The current understanding of Australian dust activity largely extends from interpretation of ground-based observations and satellite aerosol products, which have not been thoroughly intercompared over this region. Using a dust storm index (DSI) derived from dust storm and visibility observations made at Australian Bureau of Meteorology (BoM) stations (McTainsh et al., 1998), O'Loingsigh et al. (2014) assessed the spatial distribution of frequency and intensity of dust activity at 160 stations across Australia. Based on dust loading derived from the satellite aerosol optical depth (AOD), namely the Deep Blue algorithm applied to Moderate Resolution Imaging Spectroradiometer (MODIS) data from the polar-orbiting Terra and Aqua satellites, Ginoux et al. (2012) identified the Lake Eyre basin as the leading natural dust source in Australia, consistent with previous ground-based (McTainsh, 1989) and satellite-based (Bullard et al., 2008; Prospero et al., 2002) identification of dust sources. Ginoux et al. (2012) further identified agricultural dust sources in the Murray–Darling Basin in southeastern Australia, including the Victorian Big Desert, Riverina, and the Barwon–Darling basin, consistent with an earlier satellite-based dust source identification (Prospero et al., 2002) and model-based wind erodibility during dry years (Webb et al., 2006); however, these agricultural dust sources generated minimal dust storm frequency at nearby weather stations (McTainsh, 1989; McTainsh et al., 1989, 1998, 2007; O'Loingsigh et al., 2014). Ginoux et al. (2012) attributed the potential inconsistency in dust source maps among datasets to the various temporal coverage of each dataset. The apparent inconsistency between satellite- and ground-based spatial distribution of dust frequency and intensity could also be a result of the differential spatial coverage of these datasets. Therefore, it is critical to rigorously cross-validate these observations of dustiness in Australia.
Observations and general circulation models (GCMs) have shown substantial variability in the occurrence and intensity of dust emissions across Australia on interannual to decadal timescales, primarily driven by persistent anomaly in rainfall associated with Pacific sea surface temperature (SST) fluctuations, particularly El Niño-Southern Oscillation (ENSO) events (Bullard and Mctainsh, 2003; Evans et al., 2016; Lamb et al., 2009; Risbey et al., 2009; Strong et al., 2011; Webb et al., 2006). Corresponding to the ENSO-induced rainfall anomalies, during El Niño conditions, there is increased wind erosion in central and southeastern Australia, while during La Niña years the sources are shifted to the southwestern regions (Webb et al., 2006). Based on the Geophysical Fluid Dynamics Laboratory (GFDL) climate model (CM3), Evans et al. (2016) further uncovered the role of climate–vegetation interactions in amplifying and persisting ENSO's modulation on dust emission in southeastern Australia. The modulation on dust emission and loads was simulated to further amplify the ENSO-related rainfall variability across eastern Australia (Rotstayn et al., 2011). On longer timescales, Lamb et al. (2009) revealed a pronounced and consistent dust maximum during 1959 to 1973 and a much more dust-free period after 1977 across central eastern Australia, based on the frequency of dust events reported at weather stations. This regime shift in Australian dustiness was attributed to wind field changes associated with oscillations in the Pacific climate system, including the latitudinal displacement of the South Pacific Convergence Zone, and SST changes of the Pacific Decadal Oscillation and North Pacific Oscillation (Lamb et al., 2009). From the paleoclimate perspective, the geochemical characteristics of Australian dust deposition in New Zealand over the last 8000 years have been used to identify corresponding dust sources, thereby inferring patterns of aridity in eastern Australia and climate variability associated with ENSO during the Holocene (Marx et al., 2009).
On intraseasonal to interseasonal timescales, the variability in Australia's atmospheric and terrestrial states features the dominant signal from the Madden–Julian Oscillation (MJO) (Notaro, 2018; Risbey et al., 2009; Wheeler et al., 2009; Yu and Notaro, 2020); yet, the potential role of MJO on Australia's dust emission and transport remains understudied. The MJO is characterized by eastward-propagating, large-scale wave-like disturbances in the tropics, particularly across the tropical Indo-Pacific region, with a typical cycle of 30–60 d (Madden and Julian, 1971, 1972). During an MJO event, anomalous convection acts as a tropical heat source, emitting stationary Rossby waves that propagate into the extratropics and significantly modulate the extratropical circulation (Matthews et al., 2004; Seo and Son, 2012). Previous modeling and observational analyses have identified significant influence of MJO on rainfall and circulation across Australia (Marshall et al., 2013; Risbey et al., 2009; Wheeler et al., 2009). An observational study by Wheeler et al. (2009) identified rainfall responses across extratropical Australia to MJO-induced changes in vertical motion and meridional moisture transport during austral summer and other seasons, respectively. Marshall et al. (2013) uncovered that the observed probability of an upper decile heat event varies according to MJO phase and time of year, with the greatest impact of the MJO on extreme heat occurring over southern Australia in austral spring during phases 2–3. The convectively active MJO phases 5–6 are also responsible for anomalous vegetation growth in the northern Australian monsoon region (Notaro, 2018), which further supports circulation changes over a broader region across the continent (Yu and Notaro, 2020).
Furthermore, MJO may interact with ENSO on the modulation of Australian dust emission. First, surface westerly anomalies introduced by the MJO can force downwelling oceanic Kelvin waves and influence ENSO evolution (Kessler et al., 1995; McPhaden and Taft, 1988), thereby triggering ENSO's modulation on Australian dust emission. Second, ENSO modulates MJO's propagation, resulting in differentiated spatiotemporal evolution of MJO (Wei and Ren, 2019) and its influence on Australia's regional climate. Furthermore, the convection and circulation anomalies introduced by MJO can enhance or weaken the basic response of regional climate to ENSO events, depending on the phase of MJO, as demonstrated by an observational study on extreme precipitation over northern South America (Shimizu et al., 2017). Despite MJO's critical influence on the regional climate, its direct or indirect role in modulating dust emission or concentration in Australia has, to our knowledge, never been explicitly investigated in either observations or models.
Motivated by the current knowledge gap in the large-scale climate drivers of Australian dust activity, the present study first assesses the multiple satellite and ground-based observations of dustiness in Australia, and then establishes the connection between the observed spatiotemporal variations in Australian dust activity with ENSO and MJO. We further provide hypotheses regarding ENSO and MJO's modulation on Australian dust activity, through ENSO's cumulative influence on vegetation and soil properties and MJO's short-term perturbation on convection and extreme precipitation. Sections 2, 3, and 4 present the data and methods, results, and conclusions and discussion, respectively.
2.1 Dust optical depth proxies
Dust optical depth (DOD) is a column integration of extinction coefficient by mineral particles. The current study examines DOD proxies during 2000–2019 from MODIS onboard the polar-orbiting Terra and Aqua satellites, the Multiangle Imaging SpectroRadiometer (MISR) instrument (Diner et al., 1998) on Terra, and the ground-based AErosol RObotic NETwork (AERONET) (Holben et al., 1998) sun photometers, with distinct retrieval algorithms.
2.1.1 MODIS
Following Pu et al. (2020), daily DOD is retrieved from collection 6.1, level 2, MODIS Deep Blue aerosol products (Hsu et al., 2013; Sayer et al., 2013), including aerosol optical depth (AOD), single-scattering albedo (ω), and the Ångström exponent (α). All the daily variables are first interpolated to a grid using the algorithm described by Ginoux et al. (2010). To account for dust's absorption of solar radiation and separate dust from scattering aerosols, such as sea salt, we require the single-scattering albedo at 470 nm to be less than 0.99 for the retrieval of DOD. Based on the size distribution of dust towards the coarse range and to separate it from fine particles, DOD is retrieved as a continuous function of AOD and the Ångström exponent:
This retrieval of DOD is on the basis of the Ångström exponent's sensitivity to particle size, with smaller values of Ångström exponent indicating larger particles (Eck et al., 1999), and the previously established relationship between Ångström exponent and fine-mode AOD (Anderson et al., 2005). In short, MODIS DOD represents the optical depth of absorbing, coarse-mode aerosols that are often dust over bare ground or sparsely vegetated regions. Details about the retrieval process and estimated errors are summarized by Pu and Ginoux (2018a). MODIS DOD products have been widely used for the identification and characterization of dust sources (Baddock et al., 2009, 2016; Ginoux et al., 2012), as well as examination of variations in regional and global dustiness (Pu et al., 2019, 2020; Pu and Ginoux, 2017, 2018a). Following the recommendation from Baddock et al. (2016) and previous applications of MODIS DOD (Pu et al., 2019, 2020; Pu and Ginoux, 2017, 2018a), here we use DOD with a low-quality flag of QA = 1, under the assumptions that (1) dust sources are better detected using DOD with a low-quality flag and that (2) retrieved aerosol products are poorly flagged over dust source regions.
2.1.2 MISR
Benefiting from its multiangle observations, MISR data can be used to directly retrieve AOD and particle properties (Diner et al., 1998). In the current study, version 23, level 2, daily MISR 550 nm coarse-mode AOD (cmAOD) and nonspherical AOD (nsAOD) at 4.4 km resolution (Garay et al., 2020) are compared with MODIS DOD. The MISR nonspherical AOD fraction is often referred to as “fraction of total AOD due to dust”, as dust is the primary nonspherical aerosol particle in the atmosphere, especially over desert regions such as those found in the arid and semiarid regions in Australia (Kalashnikova et al., 2005). The MISR nonspherical AOD has been used to examine variations in dustiness in North Africa and the Middle East (Yu et al., 2013, 2016, 2018a, 2020). Similar to our use of MODIS DOD with a low-quality flag, here we analyze the raw MISR cmAOD and nsAOD retrieval without quality filtering. MISR cmAOD and nsAOD are also interpolated to a grid using the algorithm described by Ginoux et al. (2010). Due to its relatively narrow swath of ∼380 km, MISR samples the study region about every 10 d.
2.1.3 AERONET
The version 3, level 2 (cloud-screened and quality-assured), sub-daily AERONET coarse-mode AOD (cmAOD) at 500 nm obtained from 18 sun photometers across Australia (Giles et al., 2019) and retrieved by the Spectral Deconvolution Algorithm (SDA) (O'Neill et al., 2003) is analyzed here along with DOD from MODIS and cmAOD from MISR. In the analysis of annual mean and seasonal cycle, AERONET cmAOD monthly data are first screened by removing those months with fewer than 5 d of records. To calculate annual means, years with less than 5 months of records are removed. Annual mean and seasonal cycle are only analyzed for the 15 AERONET stations with at least 5 months of data for at least 3 years. Colocated cmAOD from AERONET and satellite products are further compared. Here a “collocated observation” is identified when there is available MODIS DOD or MISR cmAOD over the 0.1∘ grid covering the AERONET site within ±0.5 h of the corresponding AERONET site observation. Although further spatial smoothing may improve the consistency between AERONET and satellite measurements (Yu et al., 2013), here we keep the fine satellite pixels to evaluate the accuracy of satellite products at their original spatial resolution. At each AERONET site, one satellite observation is often associated with multiple AERONET observations in time. In this case, AERONET observations are temporally averaged, resulting in only one pair of colocated and averaged satellite–AERONET DOD observations for a given colocated incident at each AERONET site. Larger temporal averaging windows, such as ±1 h, do not improve the consistency between satellite and AERONET measurements, likely due to the fine spatial scale considered in the current study.
2.2 DSI from weather stations
The present study analyzes meteorological records of dust activity, based on nine weather codes that are related to dust events as defined by the World Meteorological Organization (WMO). The meteorological records are obtained from the National Climatic Data Center (NCDC) global and U.S. Integrated Surface hourly data set at 1489 weather stations in Australia. Following O'Loingsigh et al. (2014), the daily Dust Storm Index (DSI) at a specific station is a weighted sum of dust activity, calculated by
where severe dust storm (SDS) = 1 if a decreased (code 33), stable (code 34), or begun/increasing (code 35) severe dust storm with visibility <200 m is reported at least once and 0 otherwise; moderate dust storm (MDS) = 1 if a decreased (code 30), stable (code 31), or begun or increasing (code 32) slight or moderate sand or dust storm with visibility <1000 m is reported at least once and 0 otherwise; and local dust event (LDE) = 1 if raised dust or sand (code 07), well-developed dust whirls (i.e., “dust devils”, 08), or distant or past dust storm (code 09) is reported at least once and 0 otherwise. The credibility and temporal stability of DSI was evaluated in detail by O'Loingsigh et al. (2014). Similar to the AERONET data availability screening, annual mean and seasonal cycle are only analyzed for 182 weather stations with at least 5 months of effective data, namely with at least 5 d of DSI available during these months for at least 3 years during 2000–2019.
2.3 Seasonal cycle of dustiness
To achieve statistically meaningful analysis of the dustiness annual cycle, the peak month of each dustiness measure, namely DOD from MODIS, cmAOD and nsAOD from MISR, cmAOD from AERONET, and DSI from weather stations, is obtained via a two-step approach. First, a sinusoid function of month is fitted for each dustiness measure,
where i stands for the calendar month (1 for January, 2 for February, …, and 12 for December); D(i) is the 20-year average dustiness in month i; and α, β, and γ are estimated by minimizing the square error between the predicted and observed D(i)'s (i=1 to 12).
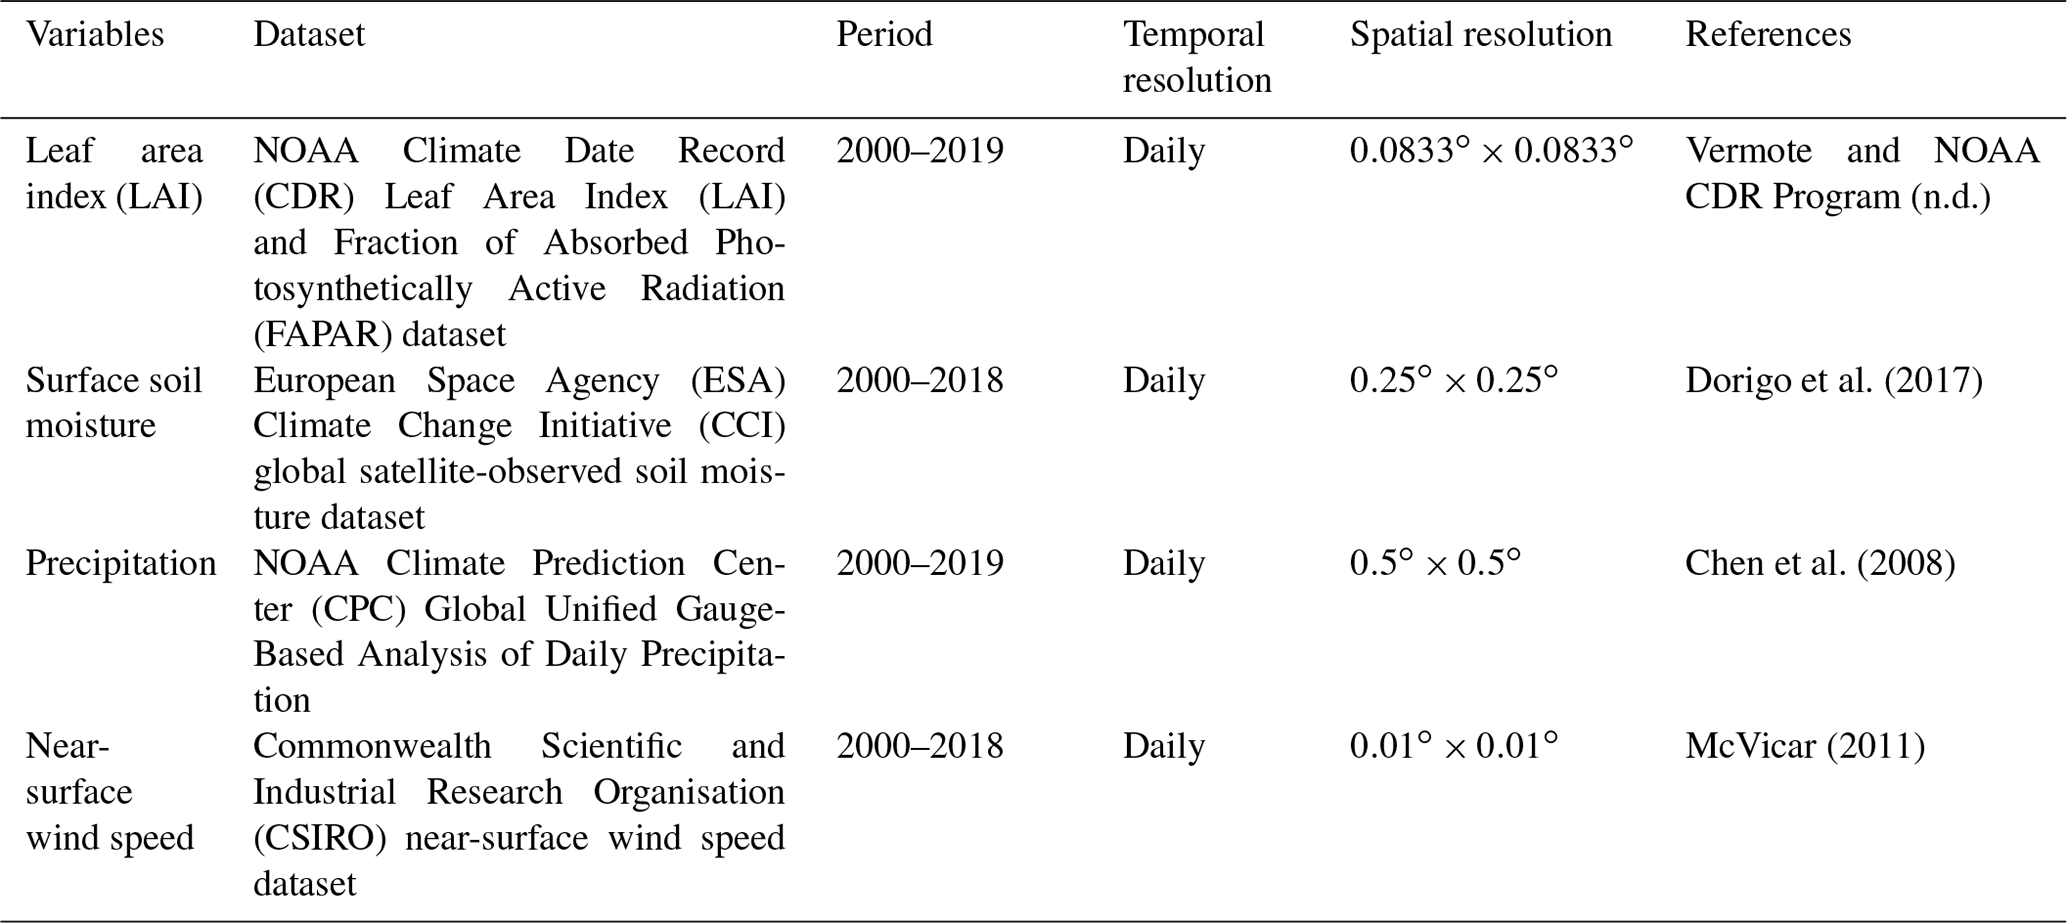
Table 1Summary of the observational datasets for environmental variables applied in the current analyses across Australia.
Following this, the peak month of dustiness is obtained from the predicted dustiness among 12 months. The peak month is regarded as statistically meaningful only if (1) the predicted and observed seasonal cycle of dustiness are significantly correlated with correlation exceeding 0.58 (n=12), based on the Student's t test at a significance level of 0.05, (2) the root-mean-square error between the predicted and observed dustiness is below a quarter of the annual mean dustiness, and (3) the amplitude of the predicted dustiness seasonal cycle (maximum minus minimum) exceeds half of the maximum value among 12 months.
2.4 Large-scale climate indices, environmental variables, and associated analysis
The connection between dust emission and large-scale climate indices is established here using MODIS DOD, which has both morning and afternoon coverage for almost all pixels in Australia, and station DSI during 2003–2019. Regression and composite analyses are conducted to assess the role of ENSO and MJO in regulating Australian dust emission by modulating soil and vegetation properties and perturbing convection and extreme precipitation activities, respectively.
2.4.1 Ocean Niño Index and regression analysis
To assess ENSO's modulation on Australian dustiness, an Ocean Niño Index (ONI) is analyzed. ONI is calculated as the 3-month running mean of Extended Reconstructed Sea Surface Temperature, version 5 (ERSSTv5) (Huang et al., 2017), SST anomalies in the Niño 3.4 region (5∘ N–5∘ S, 120–170∘ W), based on centered 30-year base periods updated every 5 years (Climate Prediction Center, 2020). The influence of ENSO on DOD and DSI is quantified based on regression of seasonal average of daily DOD and occurrence of extremely high daily DOD during December–February (DJF) and September–November (SON) upon antecedent 3-month-averaged Niño 3.4 (sample size = 17 based on 17 years of data). The regression analysis is performed with stations that have more than 2 weeks of daily DSI during the focal season (DJF or SON) of at least 12 out of the 17 years. Although regression analysis does not directly infer causality, the resultant identification of covariability between Australian dust and antecedent ENSO state indicates higher likelihood of the latter driving the former than the opposite. To account for the non-Gaussian distribution of DOD and DSI, here the significance of regression coefficient is obtained through a Monte Carlo permutation test with 1000 iterations, following Yu and Notaro (2020). In each iteration, the time series of DOD or DSI is randomly scrambled, leading to a random estimate of the regression coefficient on ONI. The probability distribution function (PDF) of the random regression coefficients is used to test if the regressions in the original, non-permutated data are statistically significant. In the current study, a significance level of 0.05 is used to indicate statistically significant results. Given the insignificant autocorrelation at a 1-year lag with all the dust and environmental variables across the major dusty regions in central and southeastern Australia (Fig. S1 in the Supplement), the current statistical significance test does not account for the potential problem with random scrambling caused by autocorrelation.
2.4.2 Real-time multivariate MJO index and composite and regression analysis
To assess the potential influence of MJO and its interaction with ENSO on Australian dust activity, the real-time multivariate MJO index (RMM) (Wheeler and Hendon, 2004) is examined. RMM is derived as the principal components (PCs) corresponding to the leading two empirical orthogonal functions (EOF) of the combined fields of near-equatorially averaged 850 hPa zonal wind, 200 hPa zonal wind, and satellite-observed outgoing longwave radiation (OLR) data. Longer-timescale variability resulting from ENSO and other interannual variations with periods longer than about 200 d is removed prior to the EOF analysis. The combination of PC1 (RMM1) and PC2 (RMM2) of RMM reflects the magnitude and phase of the MJO. When the amplitude is greater than 1, eight MJO phases are determined by the sign of RMM1 and RMM2. Phases 1 and 2 mark the time when the MJO's convective envelope is centered near the western Indian Ocean, and phases 5–6 mark the time when the envelope is near northern Australia (Wheeler et al., 2009).
Composite analysis is conducted for DOD, frequency of extremely high DOD, and DSI in each of the consecutive two MJO phases (phases 1–2, 3–4, 5–6, and 7–8) during the dust season of September–February. The results are expressed as the differences between the phase-specific DOD or DSI and the all-phase seasonal averages. The composite analysis is applied to stations that have more than 7 d of daily DSI in each MJO phase group during the dust season (September to February) of at least 12 out of the 17 years. A Monte Carlo bootstrap test with 1000 iterations is used to determine the significance of anomalies in dustiness during various MJO phases. In each iteration, daily dustiness measures are randomly sampled with the same size as a particular group of MJO phases. These randomly sampled dustiness measures are used to construct a PDF of sample mean dustiness and test if the mean dustiness during specific MJO phases is lower than the 2.5th or higher than the 97.5th percentile of the PDF.
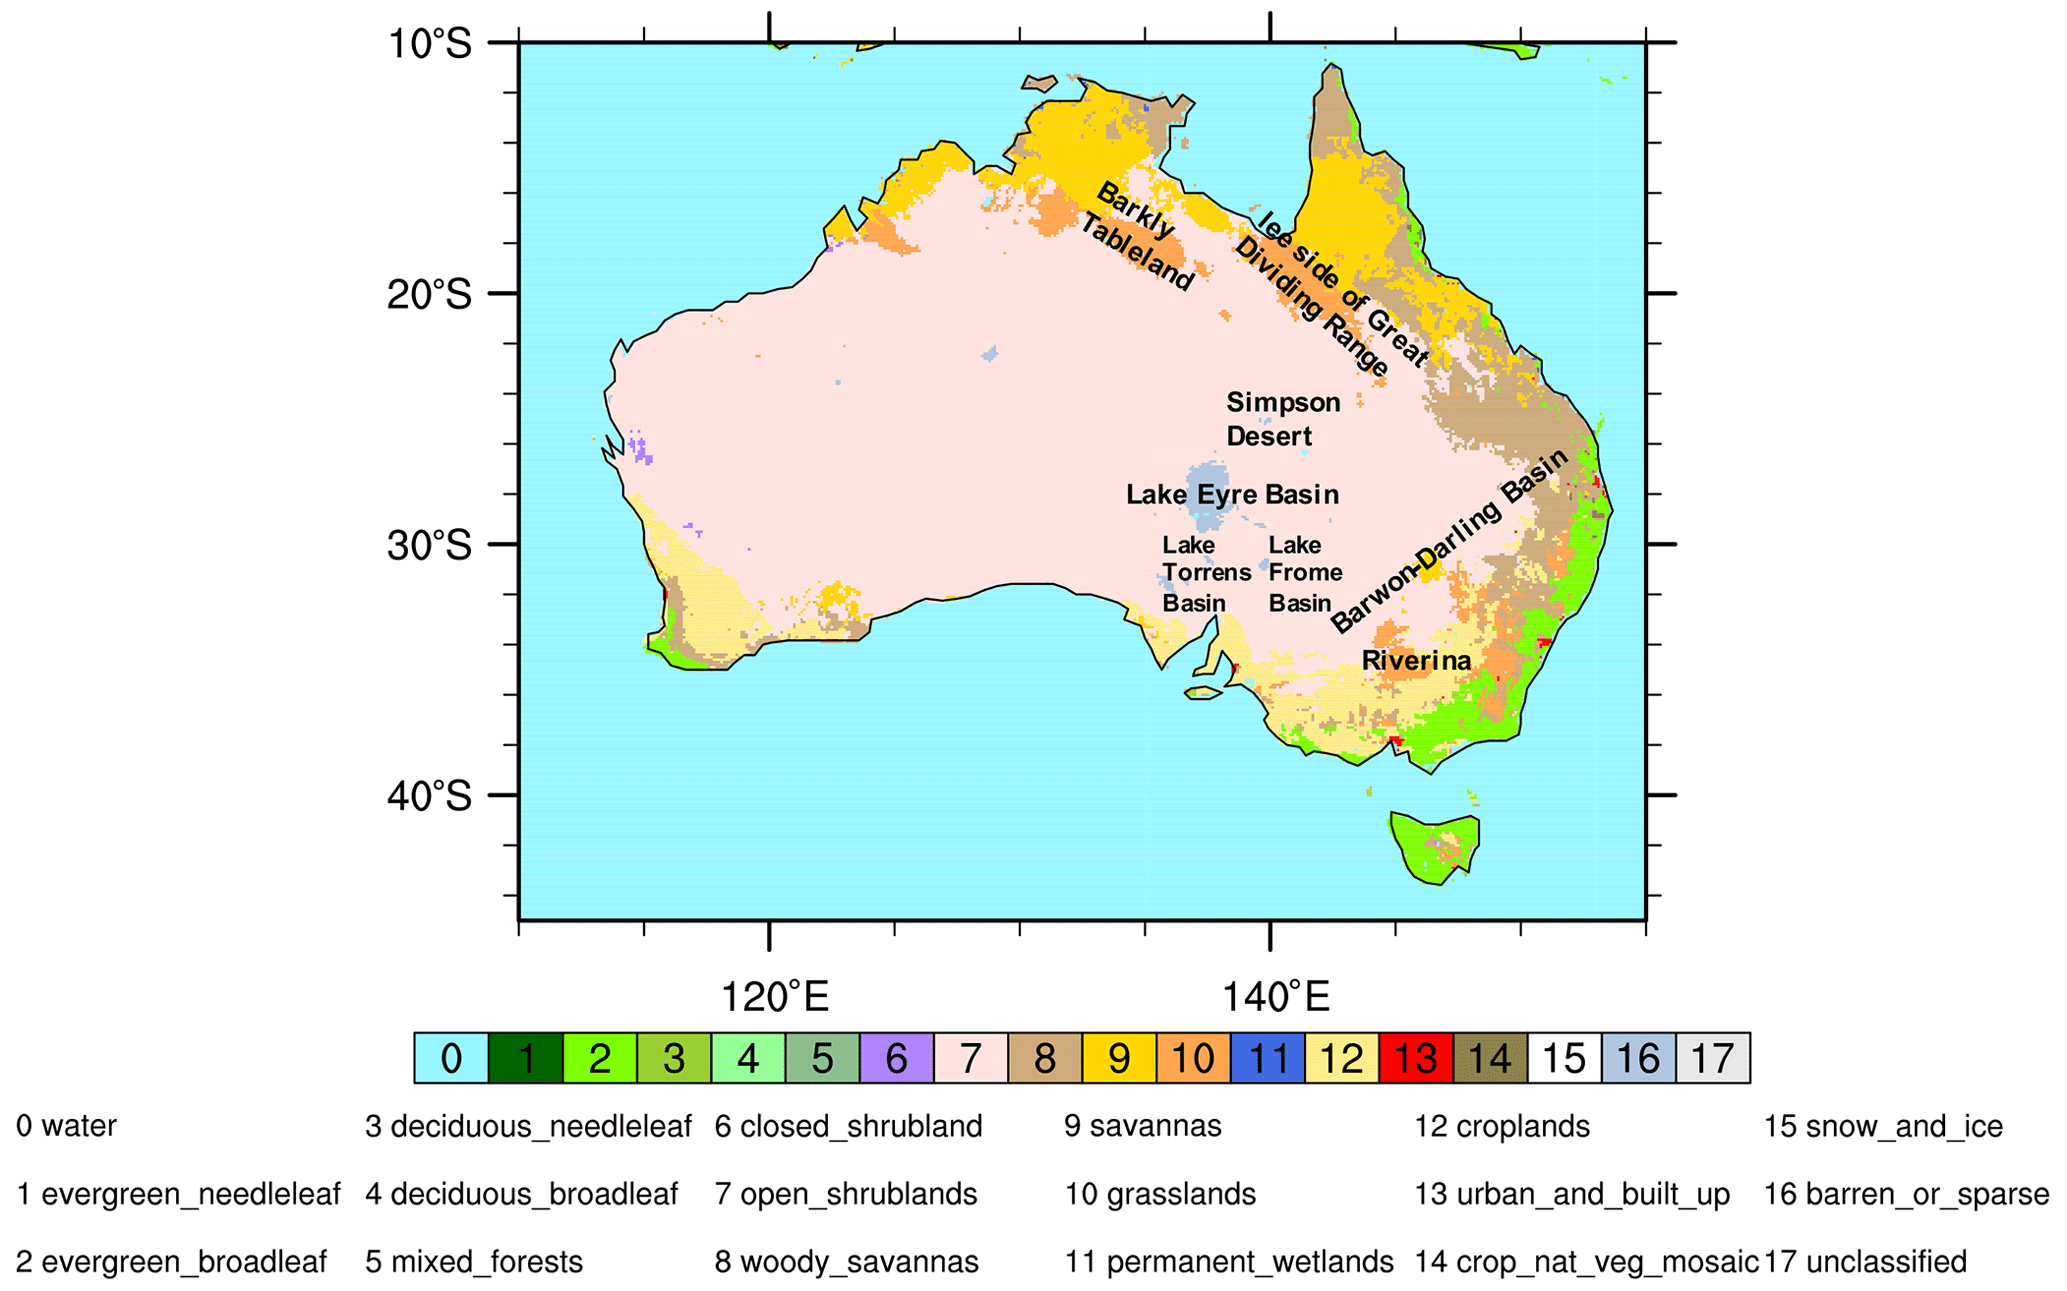
Figure 1Dominant land cover type across Australia in 2012, marked with key dust source regions. The land cover data is from MODIS, based on the International Geosphere-Biosphere Programme (IGBP) classification scheme (Sulla-Menashe and Friedl, 2018). The land cover fraction of 18 classes is interpolated from 0.05 to 0.1∘.
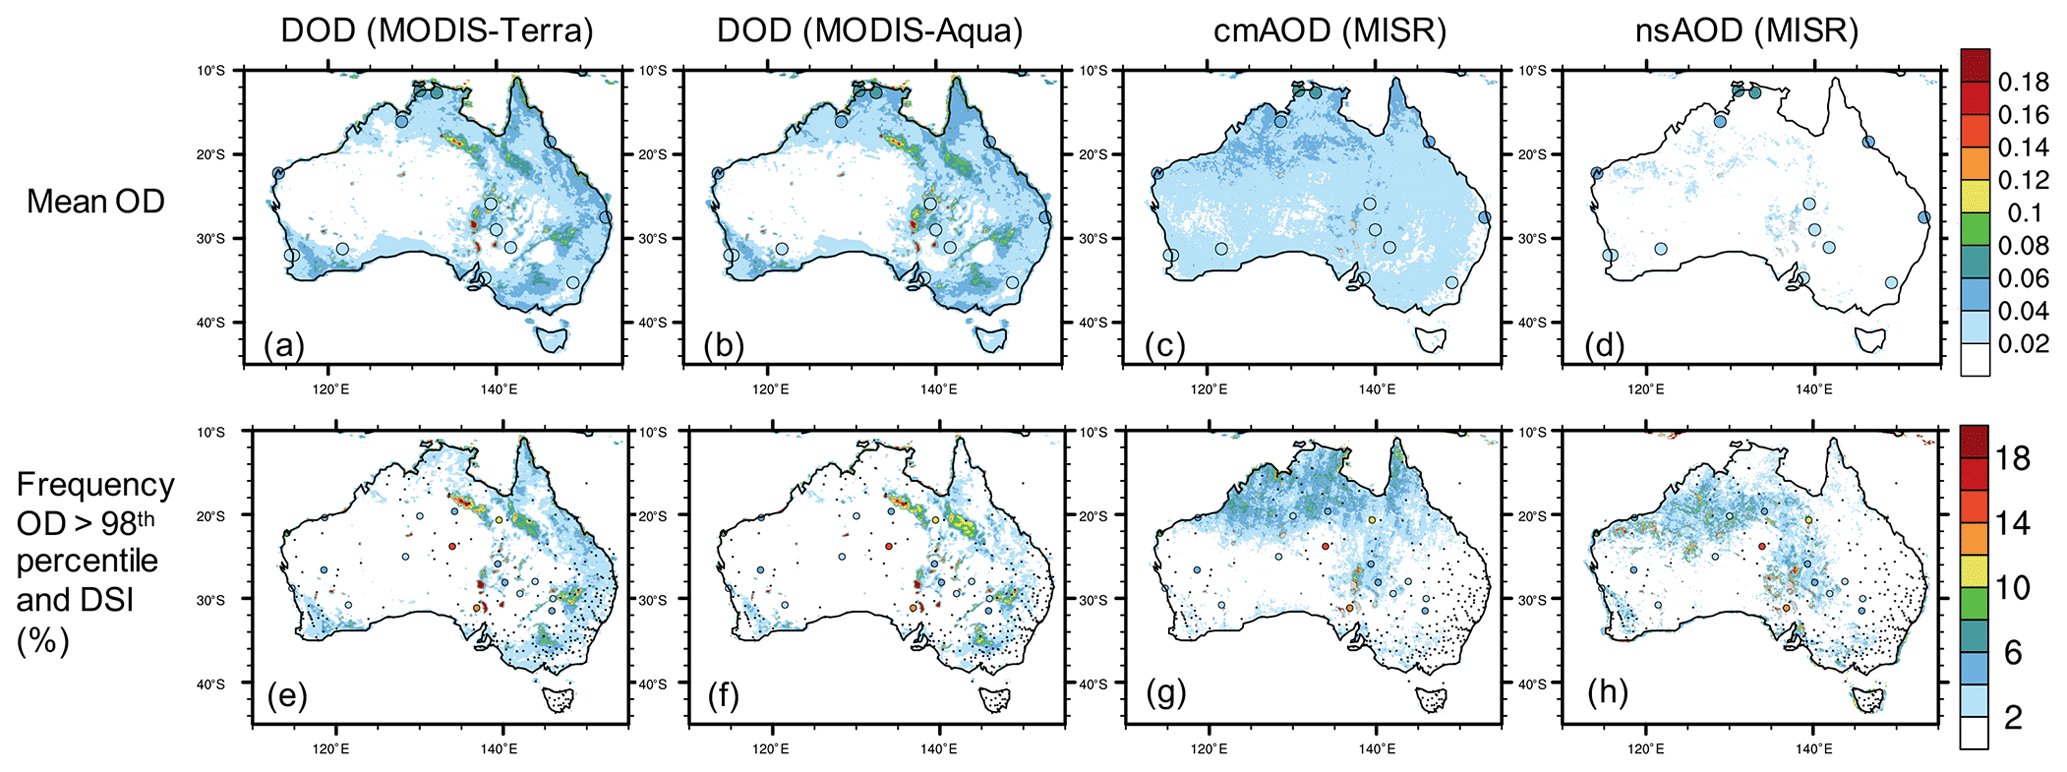
Figure 2Annual mean dust activity over Australia during 2000–2019. In (a–d), the map represents average DOD from (a) MODIS-Terra and (b) MODIS-Aqua and (c) coarse-mode AOD (cmAOD) and (d) non-sphere AOD (nsAOD) from MISR. Filled circles represent cmAOD from 15 AERONET sites, which are identical in (a–d). In (e–h), the map represents frequency of DOD proxies exceeding the 98th percentile of all observations from each instrument, namely 0.205 for DOD from MODIS-Terra, 0.198 for DOD from MODIS-Aqua, 0.095 for cmAOD from MISR, and 0.062 for nsAOD from MISR. Filled circles represent the Dust Storm Index (DSI, %) at 1489 weather stations, which is identical in (e–h). Dots in (e–h) represent stations with annual mean DSI smaller than 2 %. Grey indicates pixels with satellite sampling less than 10 d during the analyzed 20 years.
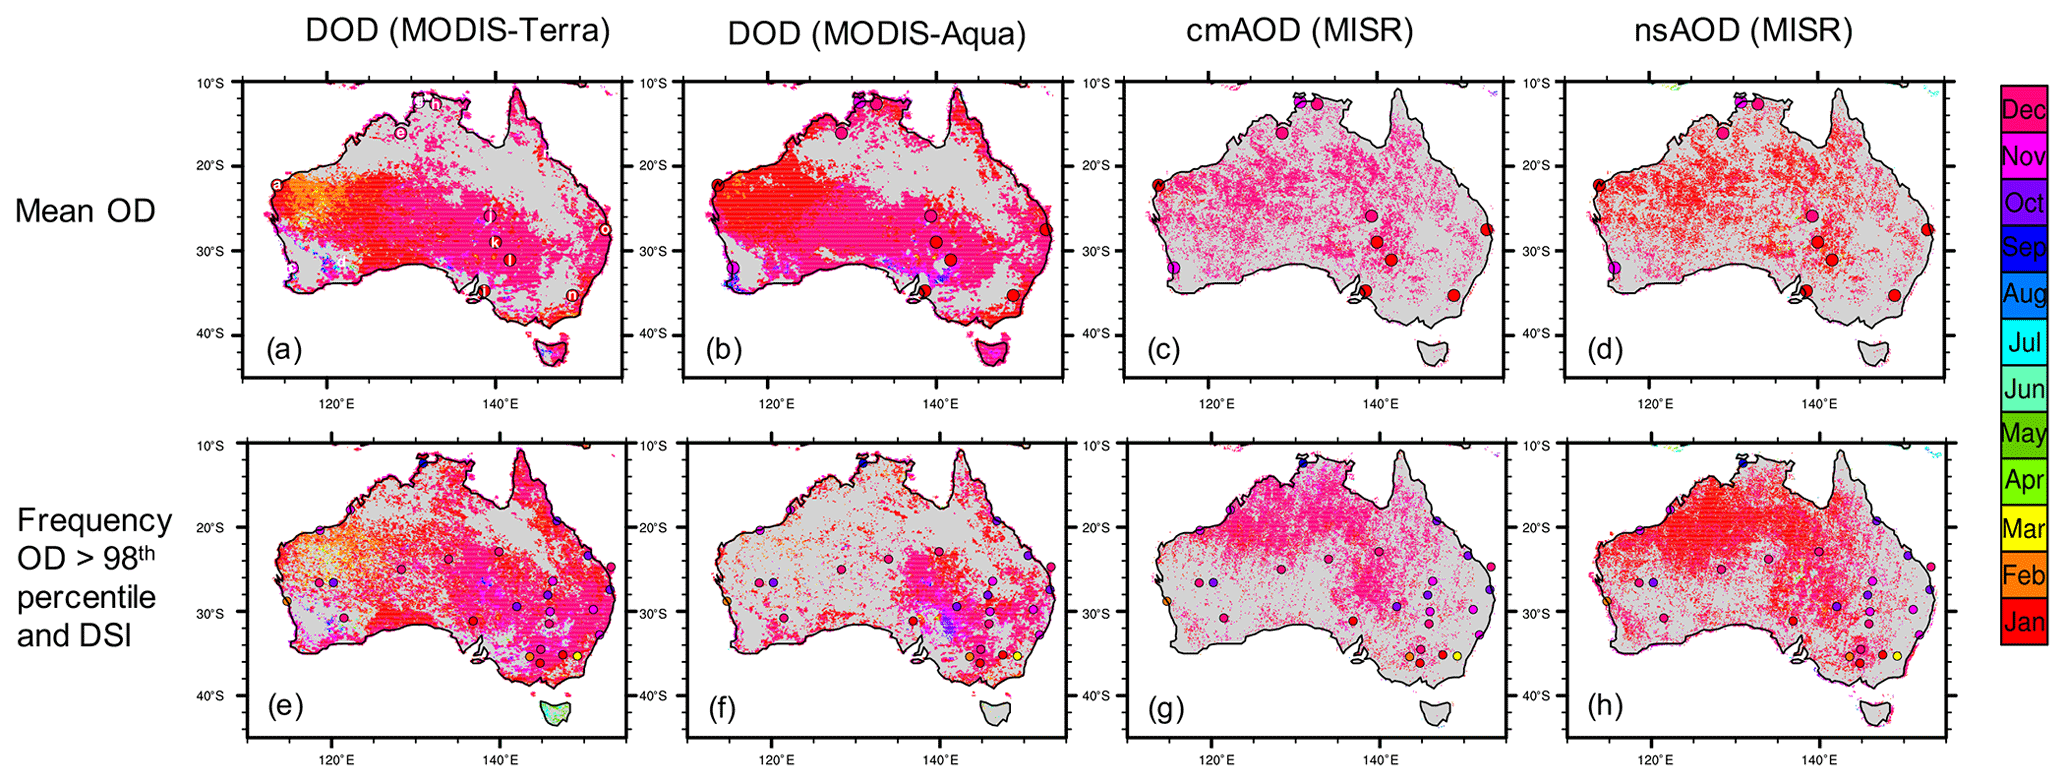
Figure 3Month of peak dust activity over Australia during 2000–2019. In (a–d), the map represents average DOD from MODIS-Terra and MODIS-Aqua and cmAOD and nsAOD from MISR. Filled circles represent DOD from 15 AERONET sites, which are identical in (a–d). In (e–h), the map represents frequency of DOD proxies exceeding the 98th percentile of all observations from each instrument. Filled circles represent DSI from 182 weather stations. Only statistically meaning seasonal cycle peak month is shown for each dustiness measure, as outlined in Sect. 2.3.
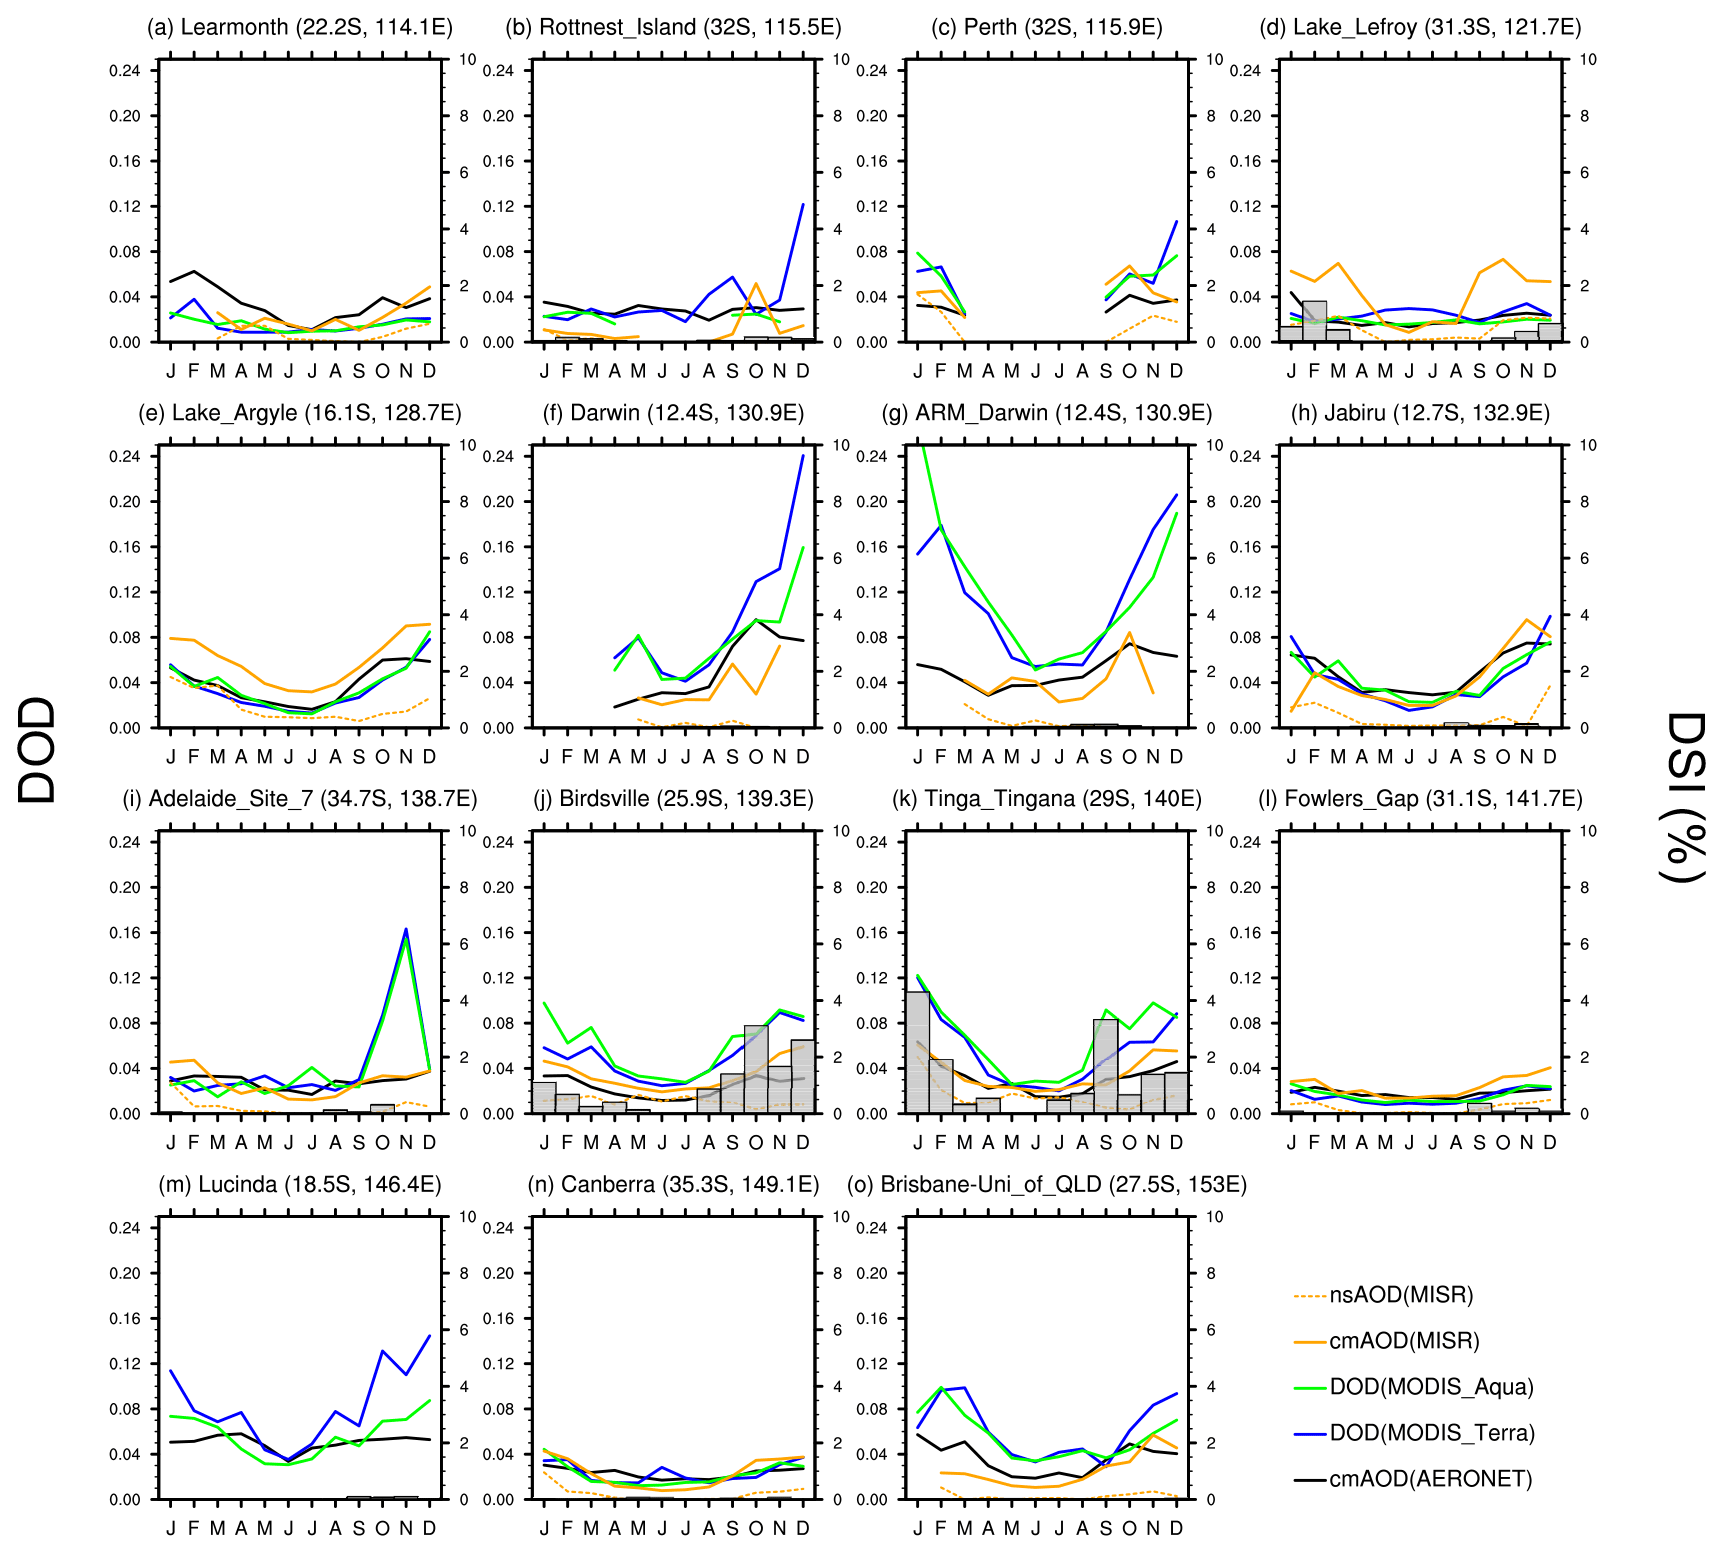
Figure 4Seasonal cycle of dust activity at 15 AERONET sites in Australia. Lines represent mean DOD from MODIS-Terra (blue) and MODIS-Aqua (green), cmAOD from MISR (solid orange) and nsAOD from MISR (dashed orange), and cmAOD from AERONET (black) by month, referring to the left y axis. Bars, referring to the right y axis, represent mean DSI over weather stations located within 100 km of each AERONET site. The seasonal cycle of dust activity from satellite and in-site observations is obtained from the active years of each AERONET site. The AERONET sites are presented by longitude from west to east, matching the letters in Fig. 3a.
Further, regression of dustiness upon ONI is performed for each MJO phase group to evaluate potential role of MJO in modulating ENSO's influence on Australian dustiness. Phase-specific, seasonal mean DOD and DSI are calculated before being regressed on antecedent ONI. For a specific station in specific MJO phases during the dust season, the phase-specific, seasonal mean DSI is only computed when daily DSI is available on at least 7 d, otherwise reported as missing value. The statistical significance of MJO's modulation on the ENSO–dust relationship is assessed by a Monte Carlo test with 1000 iterations. In each iteration, daily dustiness measures are randomly sampled from the entire dust season with the same size as a particular group of MJO phases and averaged to obtain a random-phase mean dustiness measure for each year. The time series of these random-phase mean dustiness measures is regressed on the antecedent ONI, resulting in a PDF of the regression coefficients to test if the regression coefficient from the realistic, phase-specific dustiness is lower than the 2.5th or higher than the 97.5th percentile of the PDF.
2.4.3 Other environmental variables
To examine the potential mechanisms underlying the modulation of ENSO and MJO on Australian dustiness, we assess the connection between these large-scale climate drivers and various environmental factors such as surface wind speed, precipitation, soil moisture, and leaf area index (LAI) across Australia. The data sources of these environmental variables are outlined in Table 1. Regression and composite analyses are applied to these environmental variables, similar to those applied to the dustiness observations. To account for the non-Gaussian distribution of these environmental variables, the statistical significance of the regression and composite signals are evaluated by the aforementioned non-parametric approaches.
3.1 Comparison of multiple observations of dustiness
MODIS DOD from both Terra and Aqua and station-based DSI consistently identify the natural and agricultural dust hotspots in Australia, including the Lake Eyre basin, Lake Torrens basin, Lake Frome basin, Simpson Desert, Barwon–Darling basin, Riverina, Barkly Tableland, and the lee side of the Great Dividing Range (Figs. 1 and 2). The annual mean MODIS DOD reaches 0.2 over Lake Eyre, Lake Torrens, and Lake Frome, where over 30 % of days observe a DOD exceeding 0.2, the 98th percentile of all MODIS DODs across Australia. MISR cmAOD and nsAOD are generally lower than MODIS DOD in magnitude and exhibit minimal spatial variation. Moreover, MISR only captures the margin of Lake Eyre basin and Barkly Tableland and shows relatively low dustiness over the Barwon–Darling basin and mostly invalid retrievals over the Lake Torrens and Lake Frome basins. The failure of MISR in capturing the agricultural dust hotspots in Australia is likely attributed to a lack of dust–smoke mixture in the look-up table involved in the operational MISR retrieving algorithm (Kahn et al., 2010). This shortage leads to less reliable retrievals of both cmAOD and nsAOD from MISR over the fire-prone dust hotspots in southeastern Australia (Garay et al., 2020). The spatial distribution of mean cmAOD from AERONET is largely consistent with the satellite observations. The apparently high DOD from MODIS and cmAOD from AERONET over the coastal region is likely caused by the abundance of sea salt aerosol and its mixture with dust and biomass burning aerosols.
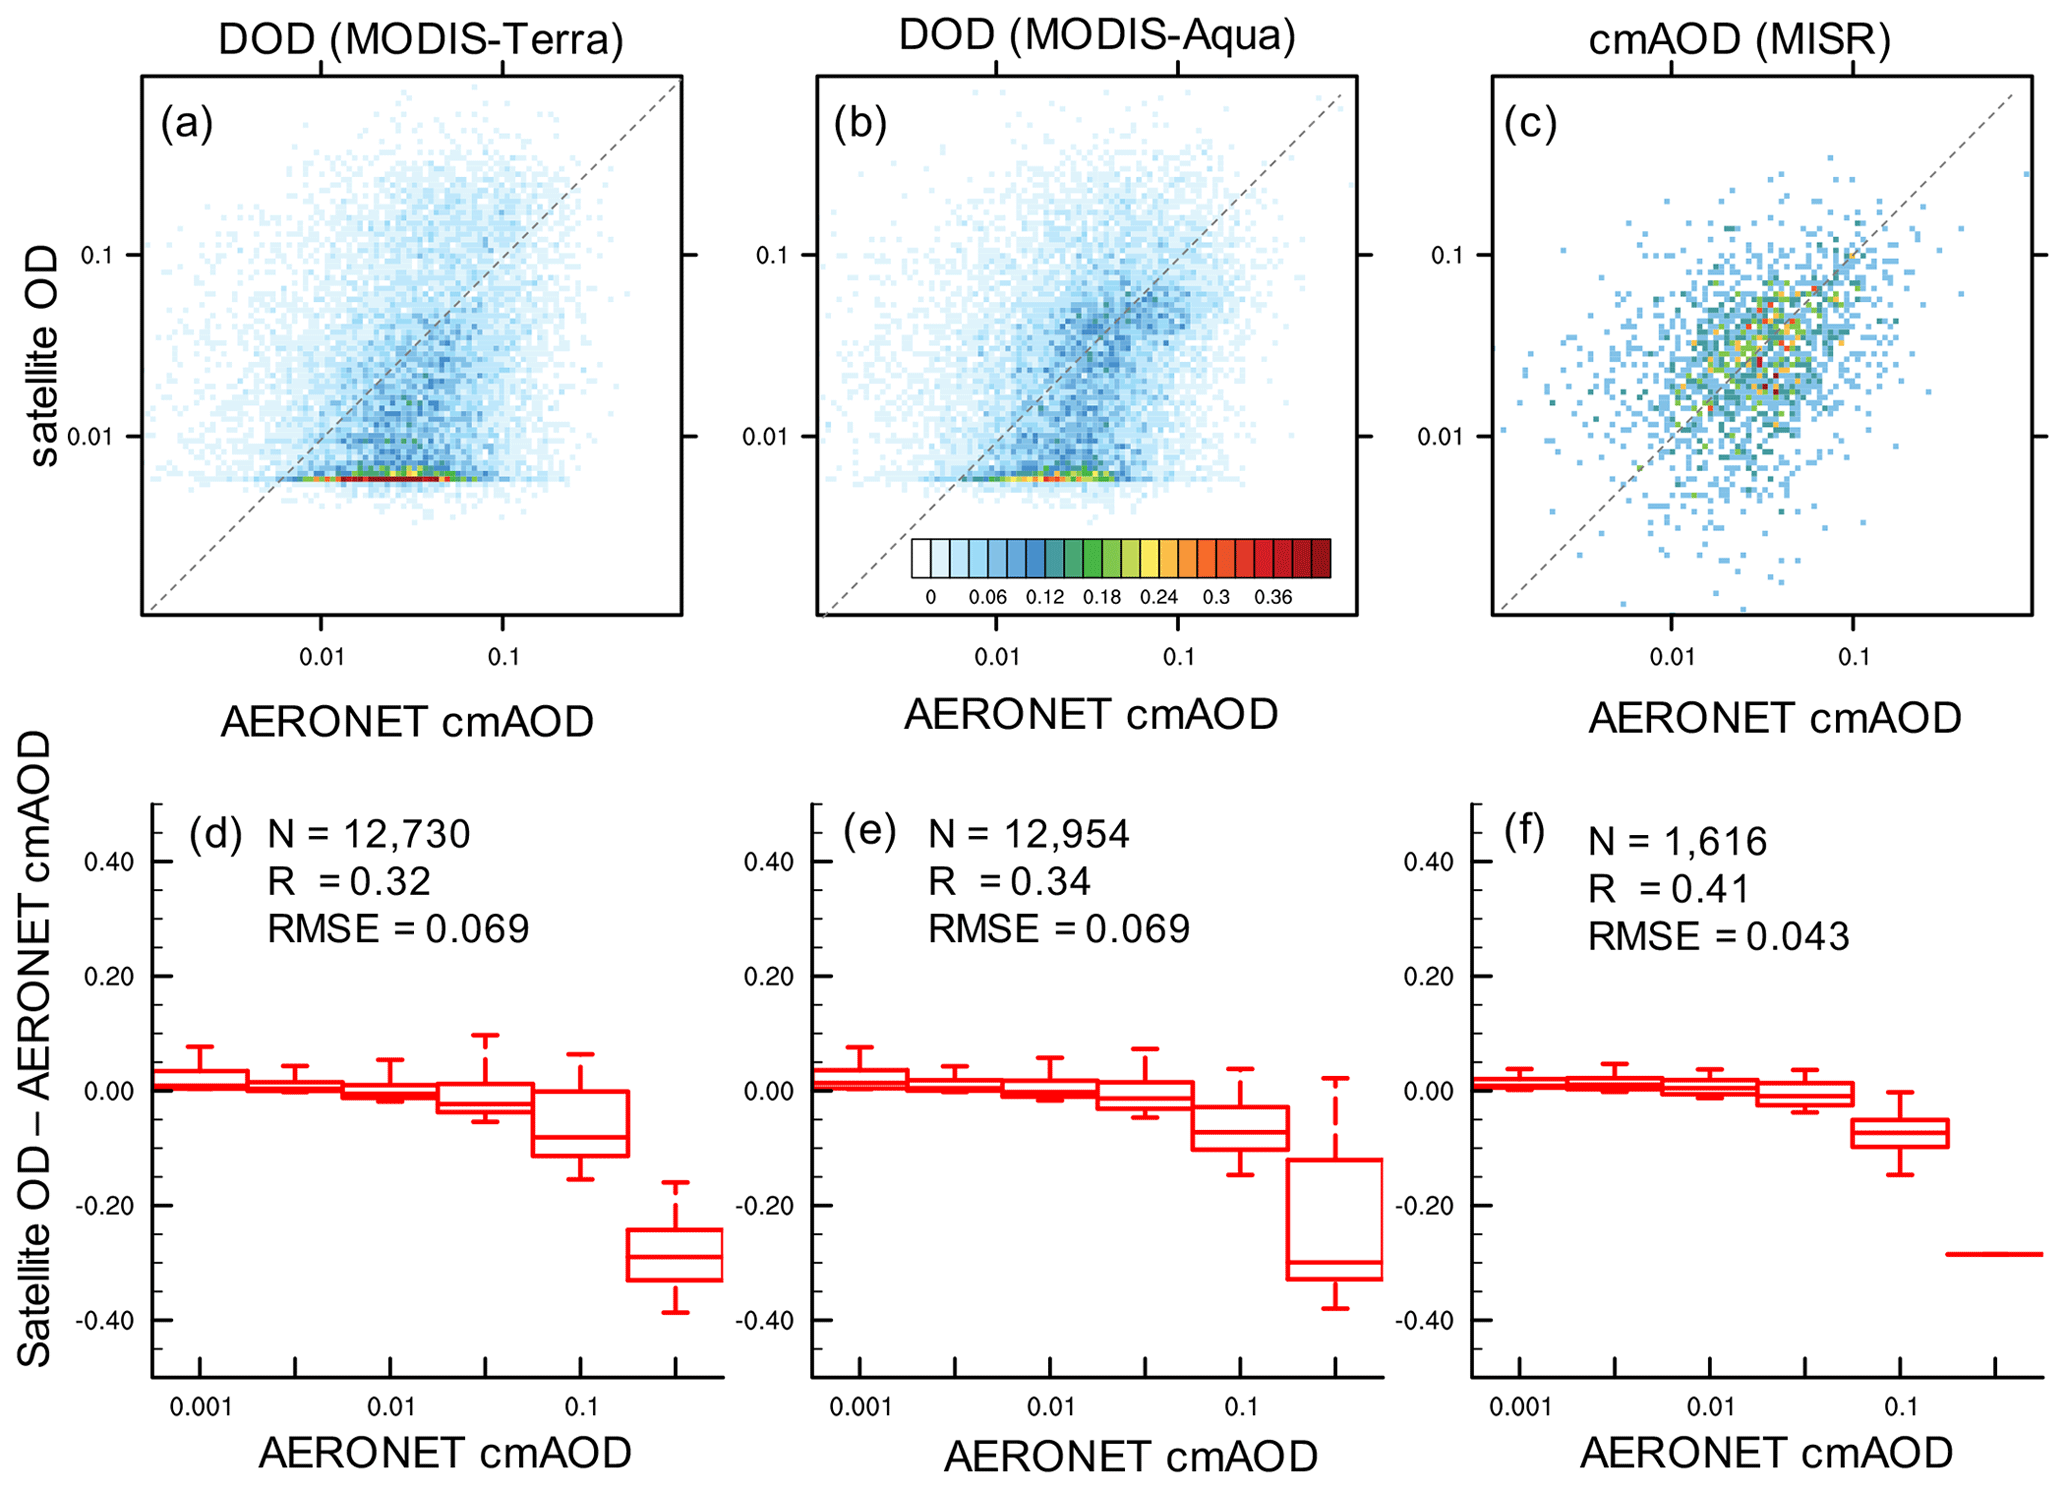
Figure 5Comparison of MODIS DOD and MISR cmAOD against colocated AERONET cmAOD. (a–c) Joint probability density (%) of colocated cmAOD from AERONET and (a) DOD from MODIS-Terra, (b) DOD from MODIS-Aqua, and (c) cmAOD from MISR. (d–f) Boxplot of the difference in colocated measurements between (d) DOD from MODIS-Terra, (b) DOD from MODIS-Aqua, and (c) cmAOD from MISR and cmAOD from AERONET, as a function of AERONET cmAOD. The boxplots show the 5th, 25th, 50th, 75th, and 95th percentiles of the DOD difference. The sample size (N), correlation coefficients (R), and root-mean-square error (RMSE) with colocated AERONET cmAOD are provided in (d–f) for the corresponding satellite product.
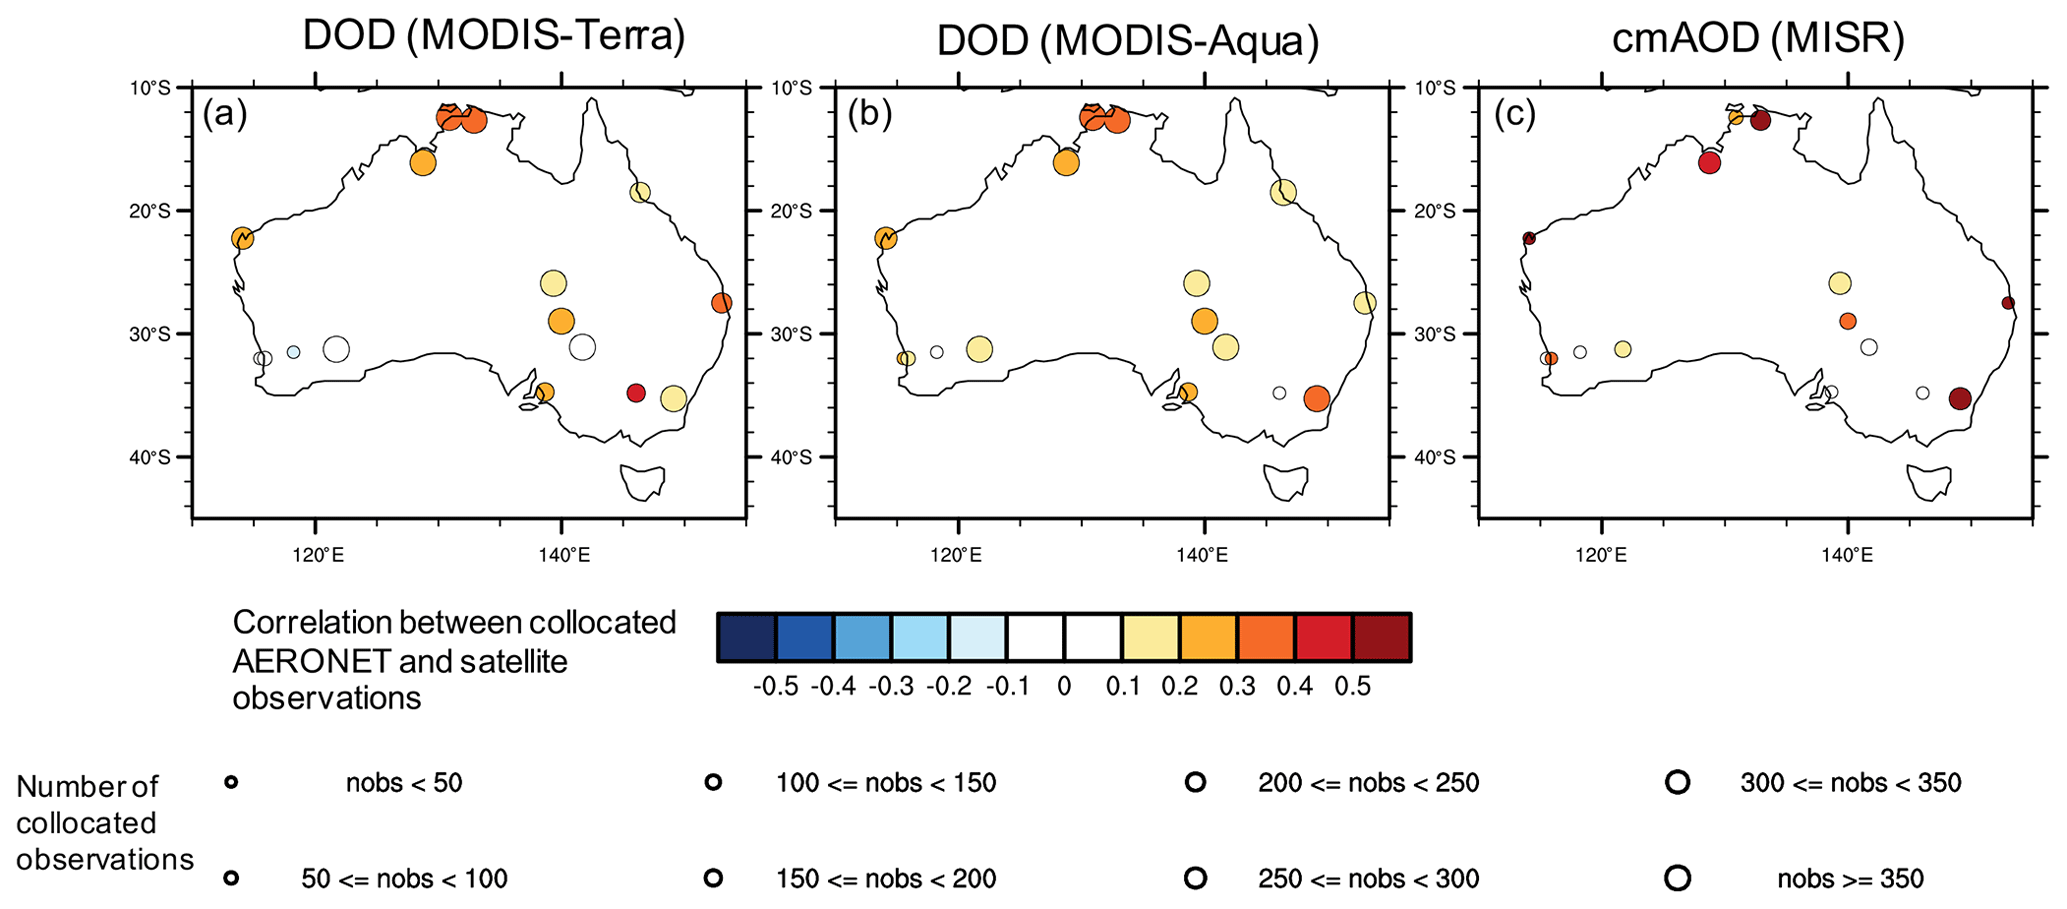
Figure 6Correlation between colocated hourly cmAOD from AERONET and satellite measurements at 18 AERONET sites in Australia. The satellite measurements include (a) DOD from MODIS-Terra, (b) DOD from MODIS-Aqua, and (c) cmAOD from MISR. The sizes of the dots indicate the number of colocated observations. A missing circle in (c) indicates no collocation between MISR and AERONET observations.
DOD from MODIS, cmAOD from AERONET and MISR, and nsAOD MISR exhibit a generally consistent seasonal cycle in dust activity, which peaks in austral spring to summer, namely November, December, and January, across most of the country (Figs. 3 and 4). In particular, the seasonal cycle in DOD proxies is generally consistent between all satellite instruments and AERONET at most sites in Australia. The seasonal cycle in DOD proxies and DSI are highly consistent in Birdsville and Tinga Tingana, located near the dust hotspots in Simpson Desert and Lake Eyre basin, respectively (Fig. 4). The largest disagreement between satellite and station-based observations of dustiness occurs over the Barwon–Darling basin and its northern downwind regions in eastern Australia, where MODIS DOD and station DSI indicate peak dustiness in November to December, while cmAOD and nsAOD from MISR indicates undetectable seasonal cycle peak. The inconsistency between MISR and other sources of dustiness measure is likely attributed to the uncertainty in MISR's retrieval of dust–smoke mixtures (Kahn et al., 2010). Over the Lake Eyre–Torrens–Frome basin, the morning satellite observations, namely MODIS-Terra and MISR, display a summertime peak in dustiness, while the afternoon satellite observation from MODIS-Aqua and all-day station observations indicate a springtime peak. This contrast between the seasonal cycles in morning and afternoon dustiness suggests a seasonally varying diurnal evolution of dust emission in southern central Australia.
The general comparison between colocated satellite DOD or cmAOD and AERONET cmAOD exhibits reasonable quality of satellite retrievals over the majority of Australia, but wider spreads of DOD from both MODIS-Terra and MODIS-Aqua, and cmAOD from MISR, especially corresponding to colocated high cmAOD from AERONET (Figs. 5 and 6). The wide spread of MISR cmAOD, compared with colocated AERONET cmAOD, is partly attributed to the limited spectral range of MISR. Very few MODIS DOD retrievals reach lower than 0.005, likely due to the numerical limits of retrieving algorithm. Furthermore, both MODIS and MISR display a wider spread at higher DOD or cmAOD and an overall underestimation, especially when AERONET DOD exceeds 0.1 (Fig. 5). This underestimation of high optical depth has been reported by previous global validations of total AOD from MODIS (Sayer et al., 2019; Wei et al., 2019) and MISR (Garay et al., 2020), as well as MODIS DOD (Pu and Ginoux, 2018b). The underestimation of high DOD potentially leads to the deteriorated correlations between colocated satellite DOD or cmAOD and AERONET DOD over the dustiest region near the Lake Eyre basin, compared with less dusty regions in Australia (Fig. 6). Given the distinct retrieval algorithms involved in the satellite DOD, cmAOD, and AERONET cmAOD, the moderate but significant correlations (p<0.001) between colocated, thousands-satellite DOD or cmAOD and AERONET cmAOD (Fig. 5) demonstrate the reliability of MODIS DOD and MISR cmAOD in representing coarse-mode aerosol loads.

Figure 7Correlation between colocated, daily MODIS-Terra DOD and MISR (a) cmAOD and (b) nsAOD. The number of collocations per pixel between MODIS and MISR during 2000–2019 generally varies from 100 to 800 for DOD and 20 to 200 for nsAOD. Grey indicates areas with fewer than 10 collocations per pixel.
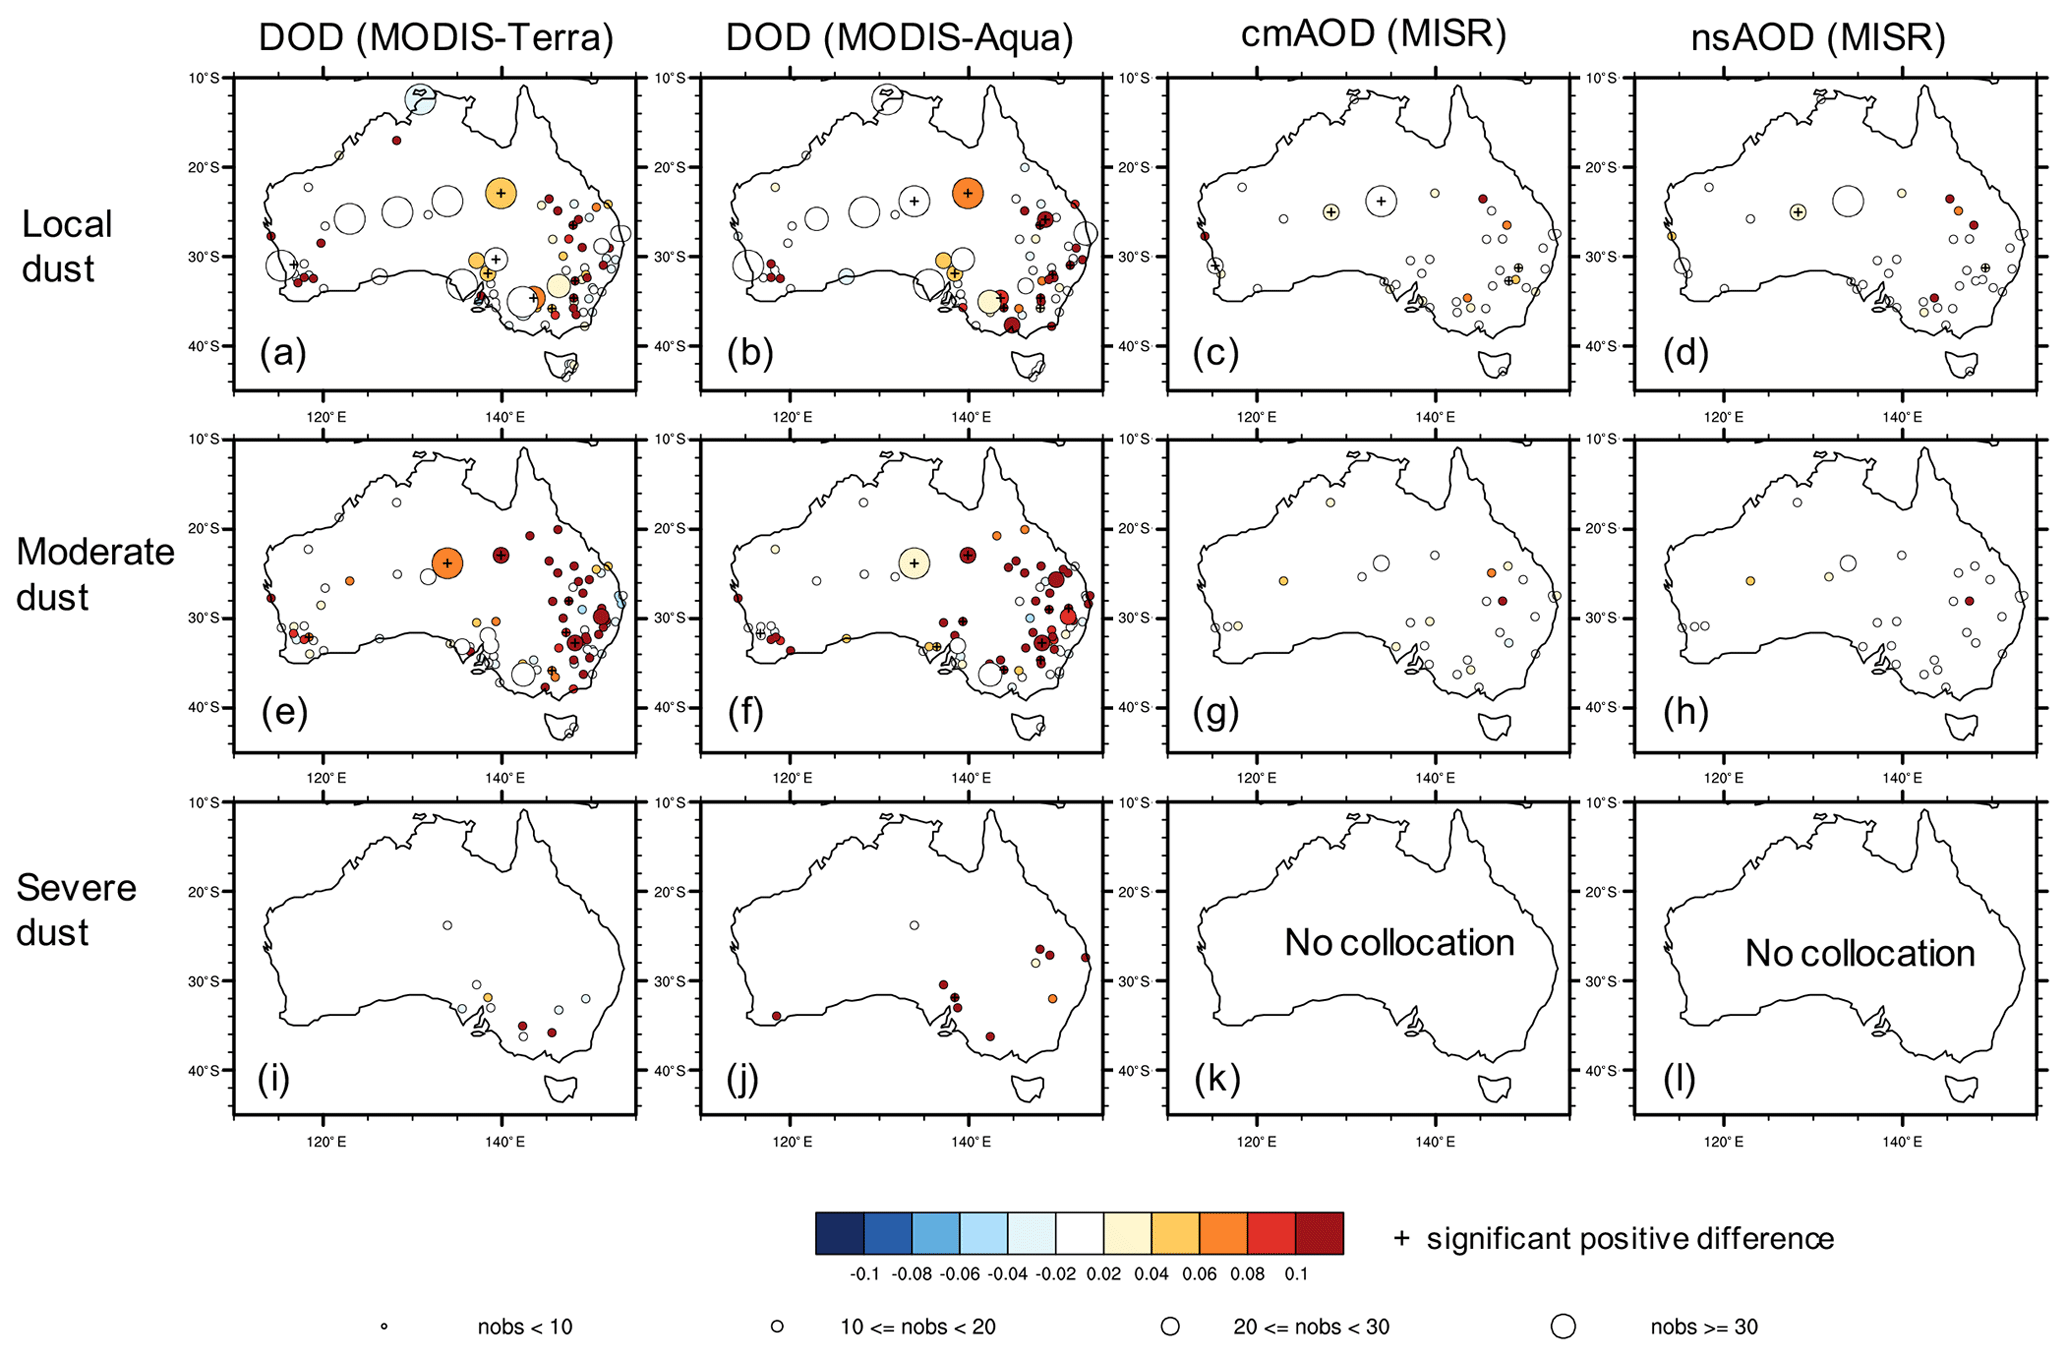
Figure 8Difference in satellite DOD proxies between dusty days and clear days at weather stations in Australia. The color of the filled dots represents the difference in (a, e, i) DOD from MODIS-Terra, (b, f, j) DOD from MODIS-Aqua, (c, g, k) cmAOD from MISR, and (d, h, i) nsAOD from MISR between days with no reported dust observation and days with reported (a–d) ”local dust”, (e–h) ”moderate dust”, and (i–l) “severe dust”. The size of the dots indicates number of days with both weather observations and valid satellite retrievals within 25 km at each station. A plus sign indicates a significant positive difference in DOD between dusty and clear days based on a Monte Carlo bootstrap test (p<0.05).
According to the comparison between colocated MODIS DOD and MISR cmAOD and nsAOD, as well as satellite DOD proxies versus station dust storm observations, coarse-mode AOD is an acceptable approximation of dustiness over the dust hotspots in central and southeastern Australia (Figs. 7 and 8). While the correlation between MODIS DOD and MISR cmAOD exceeds 0.4 across the majority of the country, even exceeding 0.6 over central eastern Australia, the correlation between MODIS DOD and MISR nsAOD reaches 0.6 only near the major dust source regions, e.g., the Lake Eyre–Torrens–Frome basin, the Simpson Desert, and northern downwind area of the Barwon–Darling basin. Furthermore, higher MODIS DOD is observed on reported dusty days at most stations in Australia, especially during country-wide local dust and moderate dust events, as well as severe dust events in the south and east with MODIS-Aqua (Fig. 8). Insufficient number of collocations between ground observations and MISR overpasses likely leads to the minimal signal in MISR cmAOD or nsAOD, as previously shown in the annual mean (Fig. 2).
Overall, the general consistency between MODIS DOD and colocated AERONET cmAOD, MISR cmAOD, and MISR nsAOD and qualitative consistency between MODIS DOD and station dust observations provides confidence in the credibility of MODIS DOD records in the representation of dustiness over the bare ground and sparsely vegetated regions of Australia. Considering the temporal and spatial coverage of each dataset, only results from MODIS DOD, represented by the average between the morning (Terra) and afternoon (Aqua) overpasses, and station DSI are presented in the following section of climatic modulation on Australian dustiness.
3.2 Modulation from ENSO and MJO on Australian dustiness
According to regression analysis applied to multiple dust observation data sets and Niño 3.4 at various antecedent time, austral wintertime El Niño supports enhanced dust activity in southern and eastern Australia during the subsequent austral summer dust season (Fig. 9). An SST anomaly of +1 ∘C in the Niño 3.4 region during July to September (JAS) leads to an increase in daily mean DOD of about 0.05 over the lee side of the Great Dividing Range, 0.04 over the Barwon–Darling basin, and 0.03 over Riverina during the subsequent December to February (DJF). The +1 ∘C warming in the Niño 3.4 region during JAS causes an increase in the frequency of extreme DOD of about 5 % over the lee side of the Great Dividing Range and 2 % over Riverina, and an increase in DSI of about 1 % over the Barwon–Darling basin and Riverina during the subsequent DJF. The El Niño condition in the austral autumn and winter also leads to enhanced dust emissions across the Simpson Desert and Barwon–Darling basin during the subsequent September–November (SON).
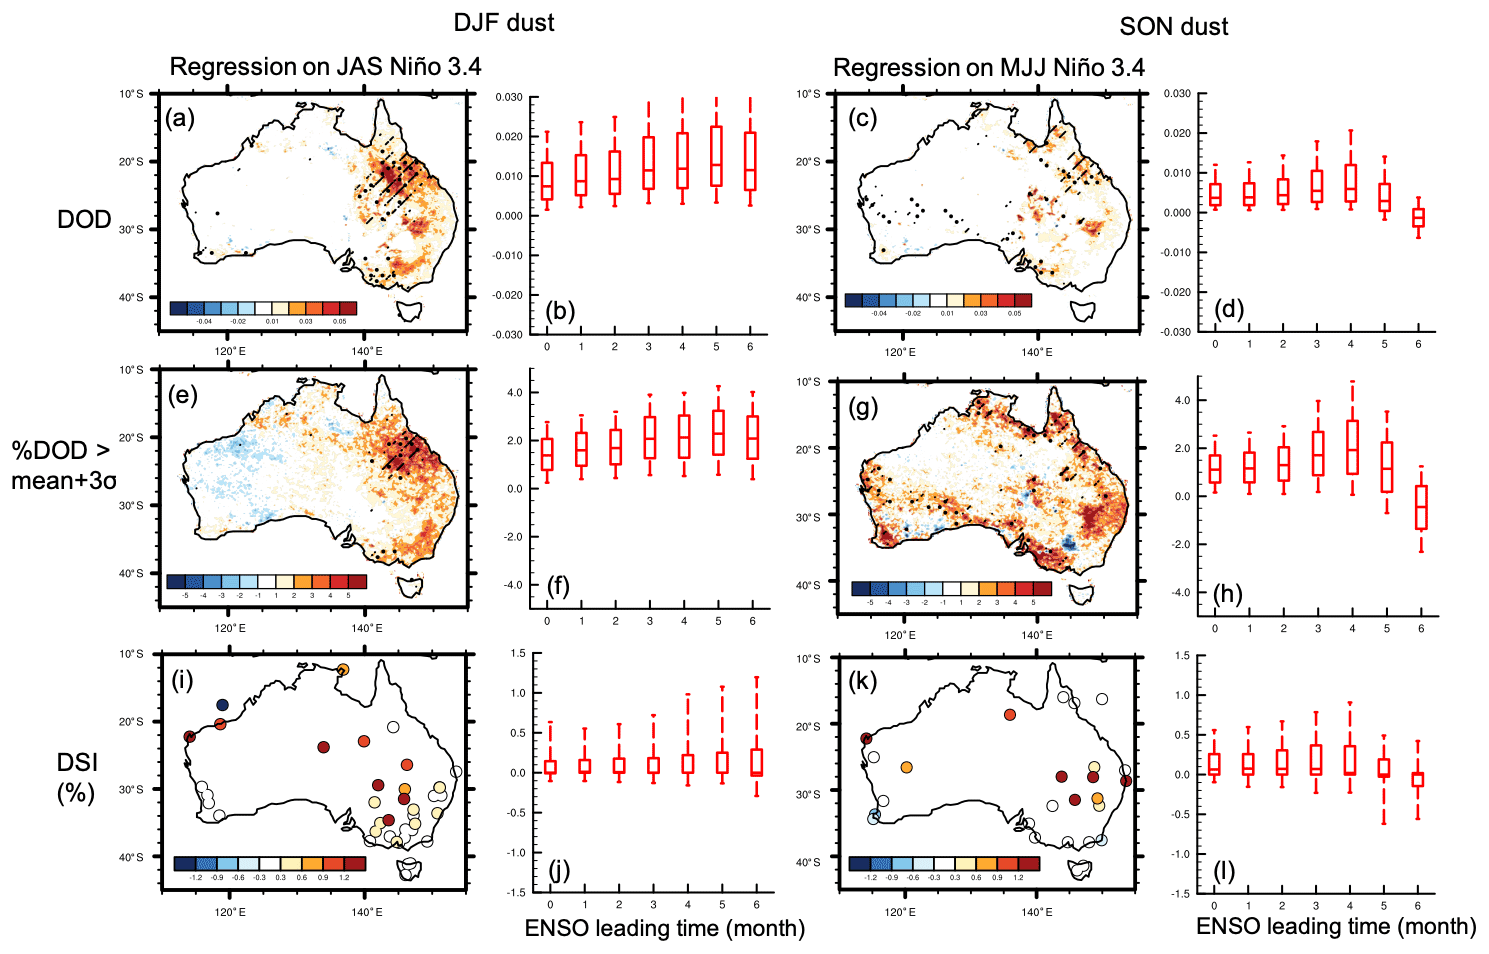
Figure 9Regression of anomalies in seasonal dust activity in (a, b, e, f, i, j) December–February (DJF) and (c, d, g, h, k, l) September–November (SON) upon antecedent Niño 3.4. Analyzed dust variables include seasonal (a–d) DOD averaged from MODIS-Terra and MODIS-Aqua, (e–h) frequency of daily DOD anomaly exceeding 3 times the interannual standard deviation, and (i–l) DSI. (a, c, e, g, i, k) Regression coefficient between (a, e, i) DJF dust and antecedent July–September (JAS) Niño 3.4 (ENSO leading dust for 5 months), and (c, g, k) SON dust and antecedent May–July (MJJ) Niño 3.4 (ENSO leading dust for 4 months). In (a, c, e, g), the stitches indicate regions with significant regression coefficient (p<0.05), based on Monte Carlo bootstrap test; and the slashes further denotes regions with significant positive correlation between MODIS DOD and MISR nsAOD. In (i, k), only statistically significant regression coefficients (p<0.05) are shown. (b, d, f, h, j, l) Boxplot of the regression coefficient of seasonal dustiness on Niño 3.4 at different antecedent times as a function of the leading time of Niño 3.4, showing the 5th, 25th, 50th, 75th, and 95th percentiles of regression coefficient at all pixels within the dust source region (25–35∘ S, 135–155∘ E).
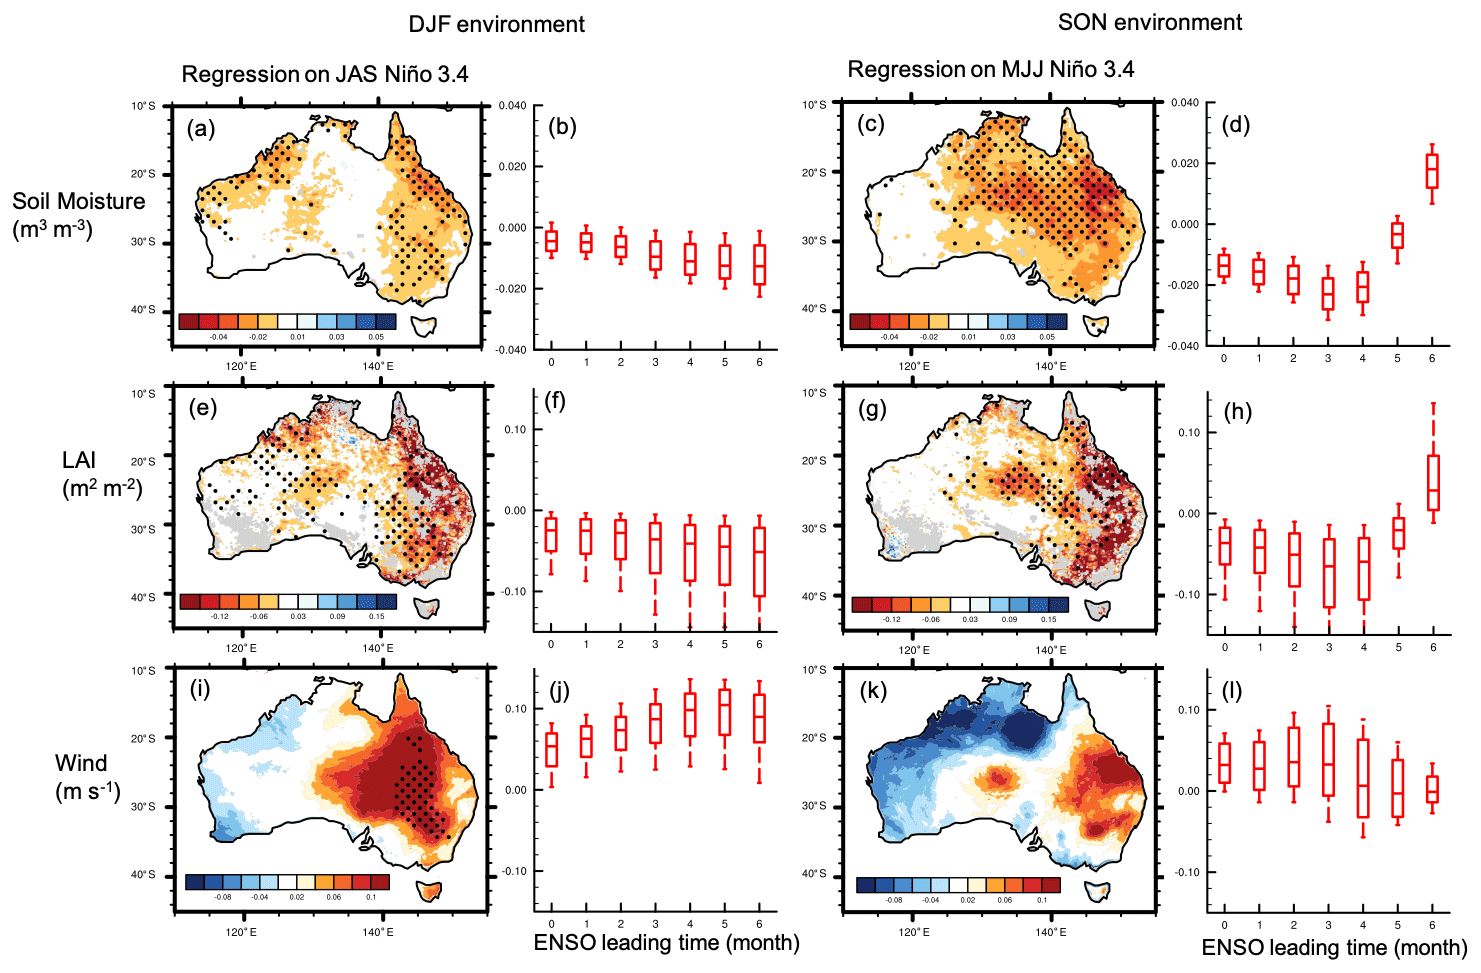
Figure 10Regression of anomalies in seasonal LAI, soil moisture, and surface wind speed in (a, b, e, f, i, j) December–February (DJF) and (c, d, g, h, k, l) September–November (SON) upon Niño 3.4. (a, c, e, g, i, k) Regression coefficient between (a) LAI, (e) soil moisture, and (i) surface wind speed during DJF and Niño 3.4 during antecedent July–September (JAS) (ENSO leading environmental conditions for 5 months), and SON (c) LAI, (g) soil moisture, and (k) surface wind speed during SON and Niño 3.4 during antecedent May–July (MJJ) (ENSO leading environmental conditions for 4 months). Figure elements are the same as Fig. 9a–h.
The lagged response in Australian dust activity to ENSO is attributed to ENSO's persistent and cumulative influence on the regional soil moisture and LAI (Fig. 10). The El Niño-induced inhibited rainfall across eastern and central Australia (e.g., Risbey et al., 2009) leads to the depletion of soil moisture and a resulting reduction in vegetation cover, thereby favoring dust emission. In austral summer, the El Niño-induced reduction in vegetation cover across eastern Australia likely causes a reduction in surface roughness and strengthened surface wind that further enhances dust emission. The response magnitude in soil moisture and LAI in austral summer and spring peaks after 3–6 months of the ENSO signal, supporting the 3–6 month lag in the dustiness response to ENSO. The currently identified importance of vegetation in the modulation of ENSO on dust emissions in Australia confirms the model-based finding about the role of climate–vegetation interactions in amplifying and persisting ENSO's modulation on dust emission in southeastern Australia by Evans et al. (2016).
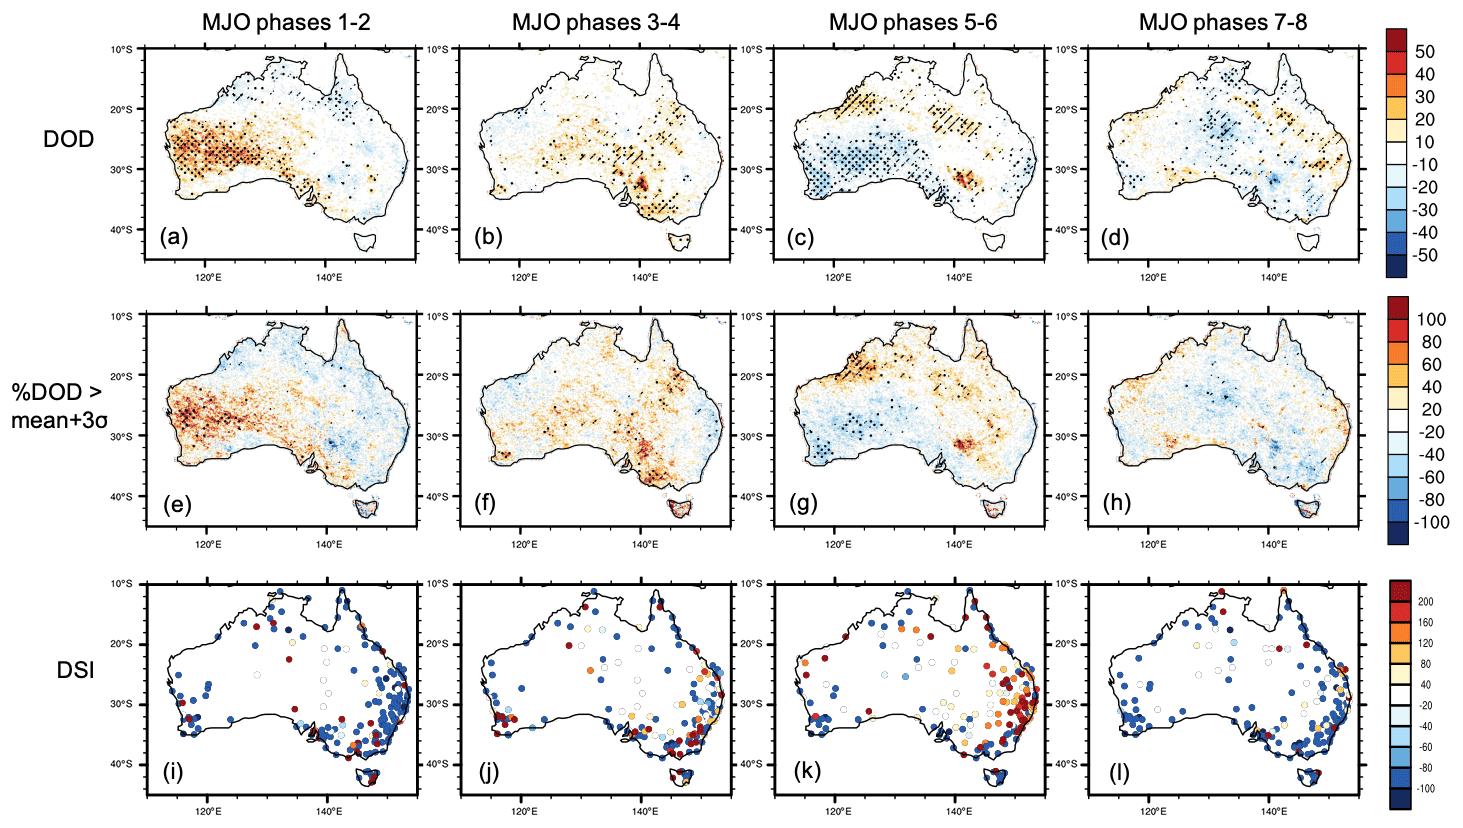
Figure 11Mean anomalies (% climatology) in dust activity by MJO phase in September–February. Analyzed dust variables include (a–d) DOD averaged from MODIS-Terra and MODIS-Aqua, (e–h) frequency of daily DOD anomaly exceeding 3 times the interannual standard deviation, and (i–l) DSI. The anomalies for each consecutive two MJO phases, namely phases 1–2, 3–4, 5–6, and 7–8, are calculated as the percentage differences between these two phases and the long-term average during September–February of 2003–2019. The composites consist of 376, 492, 613, and 450 d with RMM > 1 for phases 1–2, 3–4, 5–6, 7–8, respectively. In (a–h), the stitches indicate regions with significant percentage difference with the climatology (p<0.05), based on a Monte Carlo bootstrap test, and the slashes further denote regions with significant positive correlation between MODIS DOD and MISR nsAOD. In (i–l), only statistically significant percentage differences (p<0.05) are shown.
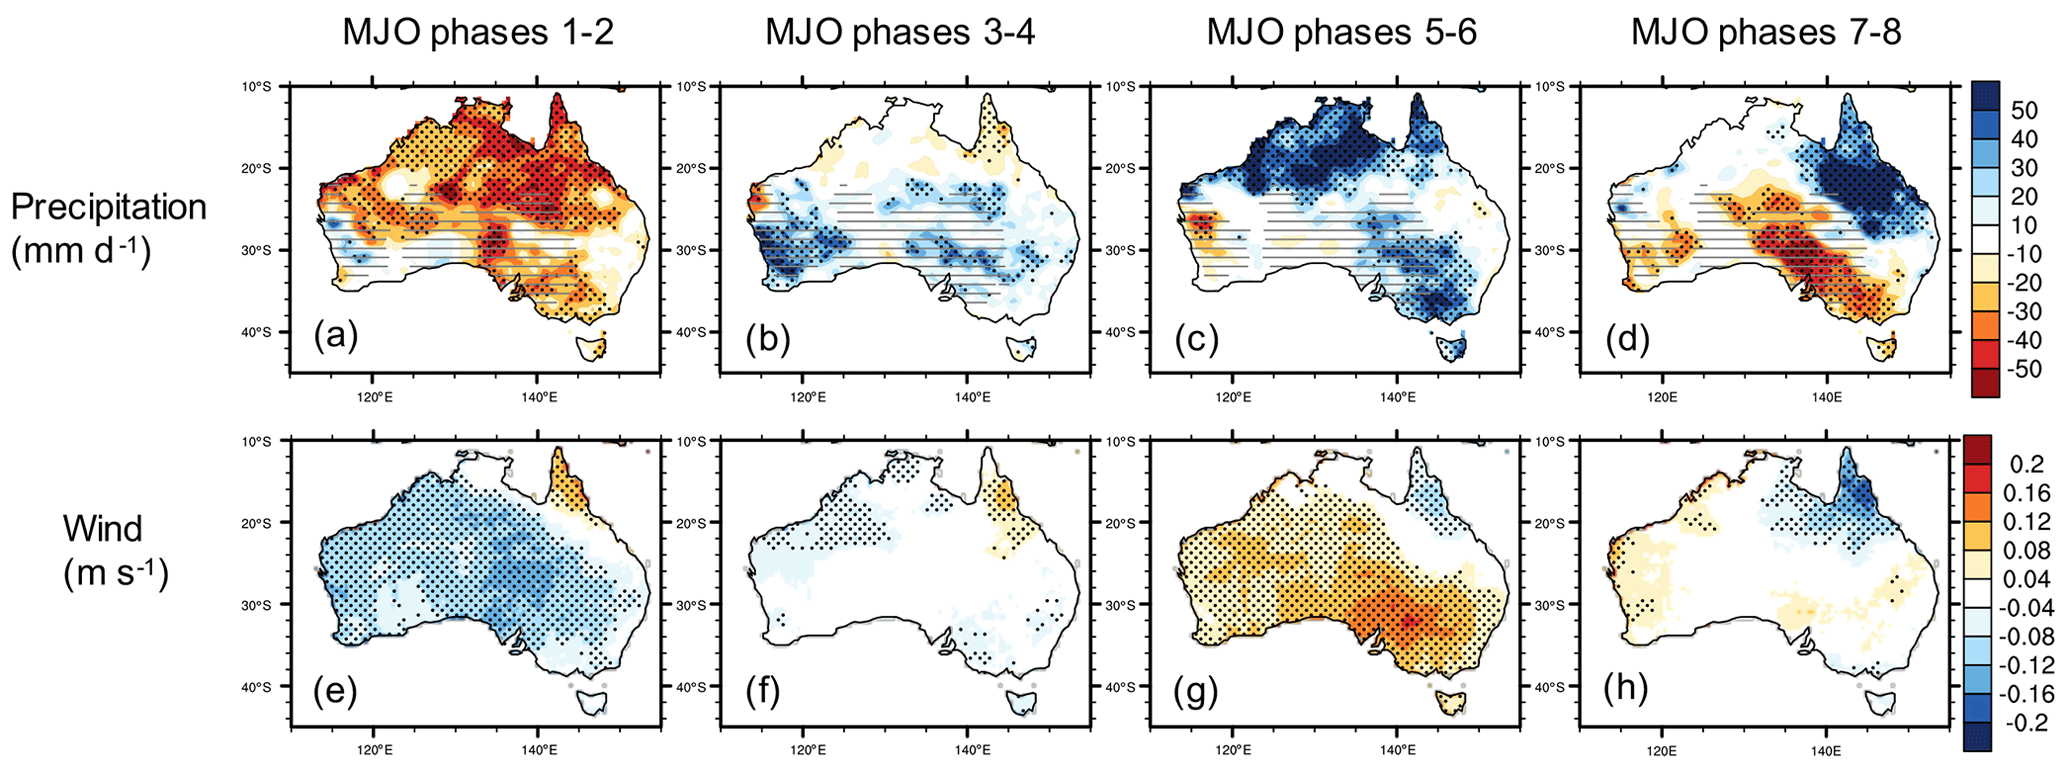
Figure 12Mean anomalies in daily precipitation and surface wind speed by MJO phase in September–February. Figure elements are the same as in Fig. 11a–h. Grey dashes indicates areas with seasonal mean rainfall less than 1 mm d−1.
According to the composite of DOD, frequency of extreme DOD, and station-based DSI, the dust-active center moves from west to east associated with the eastward propagation of MJO, with a maximum enhancement in dust activity at about 120, 130, and 140∘ E, corresponding to MJO phases 1–2, 3–4, and 5–6, respectively (Fig. 11). During MJO phases 5–6, i.e., the convection-active phases for Australia, the increased surface wind speed over the majority of the continent, especially over the dust hotspots in the Lake Eyre–Torrens–Frome basin and Riverina, appears responsible for the enhanced dustiness (Fig. 12). Surprisingly, the enhanced dustiness over the central and eastern Australian dust hotspots seems to be associated with anomalously wet conditions during all MJO phases. Given that central and southern Australia generally receive less than 1 mm of rainfall on an average day, we hypothesize that over these arid or semiarid regions, enhanced rainfall during the MJO phases 3–6 in austral spring and summer associated with enhanced convection and occurrence of thunderstorms supports higher occurrence of haboob type of dust events. Several case studies have reported haboob dust events in the central and eastern Australia (McTainsh et al., 2005; Shao et al., 2007). Strong et al. (2011) found that about 24 % of dust storms in the lower Lake Eyre basin during 2005–2006 are associated with thunderstorms. Our alternative hypothesis relies on the supply of fine particles by occasional flooding from MJO-induced storms. For supply-limited and/or transport-limited dust sources such as those in southeastern Australia, lack of occasional storms under drier conditions usually leads to the failure of sediment replenishment, thereby leading to anomalously inactive dust emission (Arcusa et al., 2020; Bullard and Mctainsh, 2003).
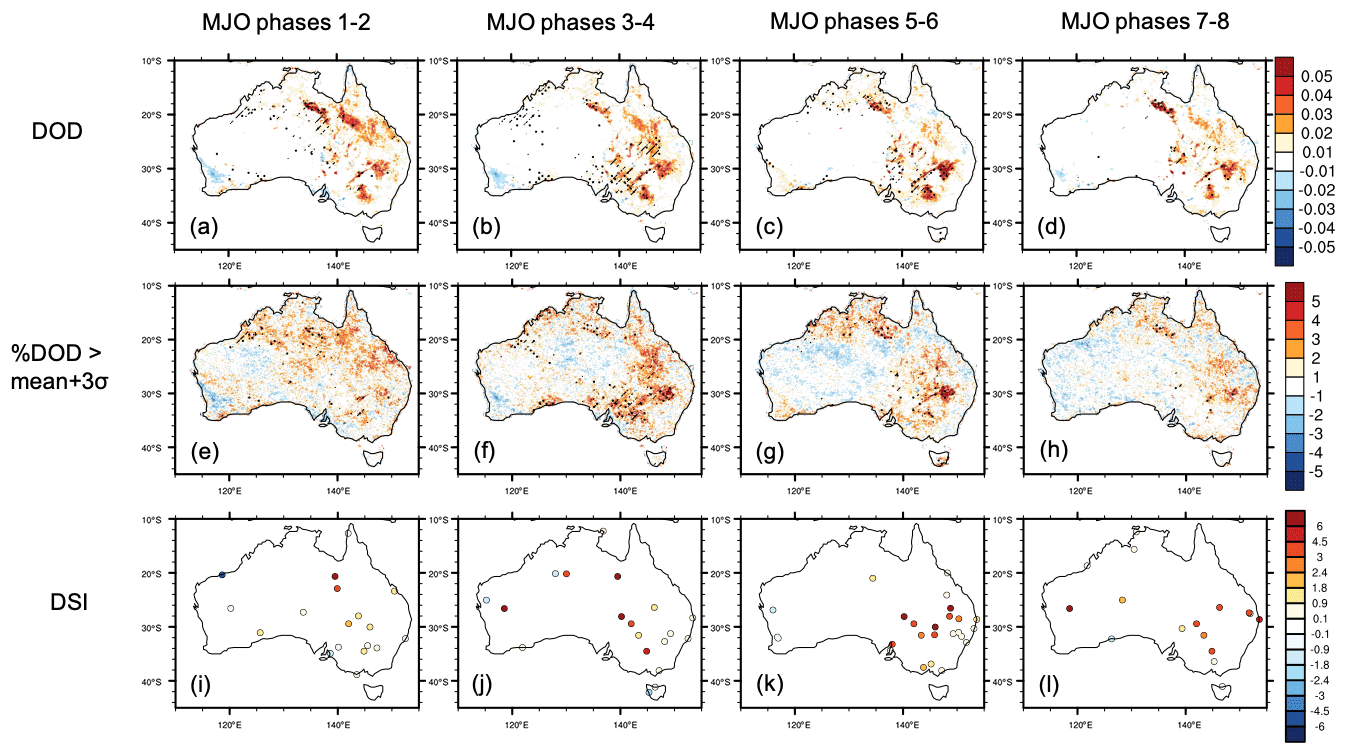
Figure 13Regression of anomalies in dust activity during each consecutive two MJO phases in September–February upon the antecedent June–August (JJA) Niño 3.4 by MJO phase. Analyzed dust variables include (a–d) DOD averaged from MODIS-Terra and MODIS-Aqua, (e–h) frequency of daily DOD anomaly exceeding 3 times the interannual standard deviation, and (i–l) DSI. The anomalies for each consecutive two MJO phases, namely phases 1–2, 3–4, 5–6, and 7–8, are calculated as the differences between these two phases and the long-term average during September–February of 2003–2019. In (a–h), the stitches indicate regions with significant regression coefficient (p<0.05), based on the Monte Carlo bootstrap test for the null hypothesis of a phase-invariant regression coefficient, and the slashes further denote regions with significant positive correlation between MODIS DOD and MISR nsAOD. In (i–l), only statistically significant regression coefficients (p<0.05) are shown.
ENSO's regulation of dust emission varies in magnitude by MJO phases, with MJO phases 3–6 favorable for enhanced ENSO regulation on dust activity, especially the occurrence of extreme dust events, in southeastern Australia (Fig. 13). An SST anomaly of +1 ∘C in the Niño 3.4 region in austral winter is associated with an increased DOD by over 0.05, an increased frequency of extreme DOD by over 5 %, and an increased DSI by 2 % over the Barwon–Darling basin and Riverina during MJO phases 5–6 in austral spring and summer. MJO phases 3–4 feature a moderately enhanced dustiness over the Lake Eyre–Torrens–Frome basin in response to antecedent El Niño. We hypothesize that the enhanced response in dustiness across southeastern Australia to ENSO during MJO phases 3–6 can be attributed to the interplay between MJO-induced anomalies in convection, rainfall, and wind and the ENSO-induced anomalies in soil moisture and vegetation. While the dry soils and diminished vegetation caused by El Niño provide favorable conditions for dust emission (Fig. 10), the active convections and elevated occurrence of extreme precipitation during MJO phases 3–6, as well as strengthened surface wind during MJO phases 5–6, likely trigger more dust emission and extreme dust events across southeastern Australia through either haboob type of dust events or additional sediment supply by occasional flooding (Fig. 12).
The current study investigates the contribution of large-scale climate variability represented by ENSO and MJO to the modulation of Australian dust activity on the intraseasonal to interannual time scales. Multiple sources of dustiness measurements, namely DOD from MODIS, cmAOD and nsAOD from MISR, cmAOD from AERONET, and DSI from weather stations, are intercompared in terms of their annual mean, seasonal cycle, and day-to-day variations over a 20-year period from 2000 to 2019. These assessed dust observations consistently identify the natural and agricultural dust hotspots in Australia, including the Lake Eyre–Torrens–Frome basin, Simpson Desert, Barwon–Darling basin, Riverina, Barkly Tableland, and the lee side the Great Dividing Range, and a country-wide dust peak during austral spring-to-summer, confirming the previous ground-based (McTainsh, 1989) and satellite-based (Bullard et al., 2008; Ginoux et al., 2012; Prospero et al., 2002) identification of dust sources. Furthermore, the intercomparison between the multiple dust observations demonstrates the credibility of MODIS DOD – a widely analyzed satellite dust observation with optimal temporal and spatial coverage – over the arid to semiarid regions in central and southeastern Australia. Regression analysis of MODIS DOD upon Niño 3.4 SST confirms the previous model-based findings by Evans et al. (2016) on the enhanced dust activity in southern and eastern Australia during the subsequent austral summer dust season following the strengthening of austral wintertime El Niño. Composites of dustiness during sequential MJO phases demonstrates the propagation of the dust-active center from west to east associated with the eastward movement of MJO, with maximum enhancement in dust activity at about 120, 130, and 140∘ E corresponding to MJO phases 1–2, 3–4, and 5–6, respectively. Our analysis further indicates the modulation of the ENSO–dust relationship with the MJO phases; MJO phases 3–6 are favorable for amplifying ENSO's modulation on dust activity, especially the occurrence of extreme dust events in southeastern Australia.
Although the current study demonstrates the general reliability of MODIS DOD over the arid and semiarid regions in Australia, uncertainties of this product should be noted. For example, the retrieval of MODIS DOD relies on the light-absorbing and coarse-mode nature of dust and is unable to distinguish between dust and the coarse-mode part of biomass burning aerosols (e.g., Noyes et al., 2020), leading to potential misrepresentation of dust and smoke aerosols over the wildfire hotspots in northern Australia (Van Der Werf et al., 2017). Given the potential contamination from biomass burning aerosols, our interpretation of the currently examined connection between dust and climatic drivers mainly focuses on central and southeastern Australia. In addition, for haboob dust events, which often occur with the presence of convective clouds, MODIS and MISR algorithms are unlikely to perform aerosol retrievals. Given the single assumption on dust particle shape involved in nsAOD, the MISR nsAOD is often regarded as a better proxy of DOD than coarse-mode AOD. But the limited temporal coverage of MISR makes it less useful for studying the day-to-day variations and extreme events of dust activity, especially corresponding to MJO. Typically, MISR only samples about 5 d during each MJO phase group (phases 1–2, 3–4, 5–6, and 7–8) per dust season (September to February) over most pixels in Australia. Furthermore, the retrieval of the dust–smoke mixtures, typically present over the southeastern shrublands and grasslands in Australia, is subject to huge uncertainty in the operational MISR aerosol product (Garay et al., 2020; Kahn et al., 2010). Therefore, MISR cmAOD and nsAOD are analyzed here only to support the reliability of MODIS DOD in representing dust activity. Overall, the optimal spatial and temporal coverage of MODIS aerosol products with an over 20-year record warrant its application for studying the spatiotemporal variations and environmental drivers of global aerosol loads.
The current analysis on the connection between environmental factors, such as LAI, soil moisture, wind, and precipitation, and ENSO and MJO leads to the hypothetical mechanisms underlying the identified modulation of ENSO and MJO on Australian dustiness. We hypothesize that the dry soils and diminished vegetation resulting from the El Niño-induced rainfall reduction provide favorable conditions for dust emission during the subsequent season; the enhanced convective activity and strengthened surface wind during MJO phases 3–6 likely triggers more dust emission and extreme dust events across southeastern Australia during the El Niño-associated dry years, thereby amplifying ENSO's modulation on dust emission. Under the hypothesized mechanism, we expect more pronounced MJO enhancement of ENSO's modulation on dust following El Niño than La Niña conditions. One explanatory hypothesis for this relationship builds partly on the occurrence of haboob dust storms and their connection with MJO-induced anomalies in deep convection over southeastern Australia. An alternative hypothesis relies on the supply of sediments by MJO-induced storms and their resulting occasional flooding. Our results shed light on a potential linkage between extreme precipitation and enhanced dust emission in Australia. These alternatives motivate further evaluation of these hypothesized mechanisms underlying the modulation of ENSO and MJO on dust emissions across Australia in an Earth system model. Furthermore, the current hypotheses regarding the influence of ENSO and MJO are established upon regression and composite analyses, which do not directly infer causality. Advanced statistical approaches, such as the Stepwise Generalized Equilibrium Feedback Assessment (SGEFA) (Yu et al., 2017, 2018b), will be useful to evaluate the role of large-scale climate modes and local environmental changes in the emission and transport of Australian dust. In addition, the present study focuses on the natural drivers of Australian dust activity, while anthropogenic dust emission from land use change is a key contributor to total dust emission in Australia (Ginoux et al., 2012; Tegen et al., 2004; Webb and Pierre, 2018). Indeed, disturbed soil and vegetation from land use, such as pastoral and agricultural activity in eastern Australia, have caused substantial increase in dust emission and deposition during the 20th century (Brahney et al., 2019; Cattle, 2016). The modulation of land use on dust emission and transport from Australia may also be quantified and compared with natural drivers through future Earth system modeling.
The MODIS Deep Blue aerosol products were acquired from the Level-1 and Atmosphere Archive and Distribution System (LAADS) Distributed Active Archive Center (DAAC), located at the Goddard Space Flight Center in Greenbelt, Maryland (https://ladsweb.modaps.eosdis.nasa.gov/; Wolfe, 2021). The MISR aerosol products were acquired from the NASA Langley Research Center Atmospheric Science Data Center (https://l0dup05.larc.nasa.gov/cgi-bin/MISR/main.cgi; Kusterer, 2021). The AERONET coarse-mode aerosol optical depth data were downloaded from https://aeronet.gsfc.nasa.gov (Holben, 2021). The NCDC Integrated Surface Hourly Database was accessed from ftp://ftp.ncdc.noaa.gov/pub/data/noaa/ (National Centers for Environmental Information, 2021a). NOAA CPC precipitation data were provided by the NOAA/OAR/ESRL PSD, Boulder, Colorado, USA, from their website at https://psl.noaa.gov/data/gridded/data.cpc.globalprecip.html (Physical Sciences Laboratory, 2021). NOAA CDR leaf area index was downloaded from https://data.nodc.noaa.gov/cgi-bin/iso?id=gov.noaa.ncdc:C00898 (National Centers for Environmental Information, 2021b). ESACCI soil moisture data were download from https://www.esa-soilmoisture-cci.org/node/238 (European Space Agency and Technische Universität Wien (TUW), 2021). The Australian near-surface wind speed data were downloaded from https://data.csiro.au/collections/collection/CI38391 (McVicar, 2021). The code used in this work can be obtained from the corresponding author.
The supplement related to this article is available online at: https://doi.org/10.5194/acp-21-8511-2021-supplement.
YY conceived the study, analyzed the data, and wrote the manuscript with contributions from PG. PG retrieved the MODIS DOD data from MODIS Deep Blue aerosol products.
The authors declare that they have no conflict of interest.
This research is supported by NOAA and Princeton University's Cooperative Institute for Climate Science. The authors thank John Dunne and Khaled Ghannam for their helpful comments on an early version of this paper. We thank the AERONET program for establishing and maintaining the sun photometer sites used in this study. We acknowledge the NCDC for collecting ground observations from global weather stations. We thank the MODIS and MISR teams for providing data and useful discussions. Comments from the editor and two anonymous reviewers are appreciated.
This paper was edited by Yves Balkanski and reviewed by two anonymous referees.
Anderson, T. L., Wu, Y., Chu, D. A., Schmid, B., Redemann, J., and Dubovik, O.: Testing the MODIS satellite retrieval of aerosol fine-mode fraction, J. Geophys. Res., 110, 1–16, https://doi.org/10.1029/2005JD005978, 2005.
Arcusa, S. H., McKay, N. P., Routson, C. C., and Munoz, S. E.: Dust-drought interactions over the last 15,000 years: A network of lake sediment records from the San Juan Mountains, Colorado, Holocene, 30, 559–574, https://doi.org/10.1177/0959683619875192, 2020.
Baddock, M. C., Bullard, J. E., and Bryant, R. G.: Dust source identification using MODIS: A comparison of techniques applied to the Lake Eyre Basin, Australia, Remote Sens. Environ., 113, 1511–1528, https://doi.org/10.1016/j.rse.2009.03.002, 2009.
Baddock, M. C., Ginoux, P., Bullard, J. E., and Gill, T. E.: Do MODIS-defined dust sources have a geomorphological signature?, Geophys. Res. Lett., 43, 2606–2613, https://doi.org/10.1002/2015GL067327, 2016.
Boyd, P. W., McTainsh, G., Sherlock, V., Richardson, K., Nichol, S., Ellwood, M., and Frew, R.: Episodic enhancement of phytoplankton stocks in New Zealand subantarctic waters: Contribution of atmospheric and oceanic iron supply, Global Biogeochem. Cy., 18, 1–23, https://doi.org/10.1029/2002gb002020, 2004.
Brahney, J., Ballantyne, A. P., Vandergoes, M., Baisden, T., and Neff, J. C.: Increased Dust Deposition in New Zealand Related to Twentieth Century Australian Land Use, J. Geophys. Res.-Biogeo., 124, 1181–1193, https://doi.org/10.1029/2018JG004627, 2019.
Bullard, J., Baddock, M., McTainsh, G., and Leys, J.: Sub-basin scale dust source geomorphology detected using MODIS, Geophys. Res. Lett., 35, 1–6, https://doi.org/10.1029/2008GL033928, 2008.
Bullard, J. E. and Mctainsh, G. H.: Aeolian–fluvial interactions in dryland environments: examples, concepts and Australia case study, Prog. Phys. Geog., 4, 471–501, 2003.
Cattle, S. R.: The case for a southeastern Australian Dust Bowl, 1895–1945, Aeolian Res., 21, 1–20, 2016.
Chen, M., Shi, W., Xie, P., Silva, V. B. S., Kousky, V. E., Higgins, R. W., and Janowiak, J. E.: Assessing objective techniques for gauge-based analyses of global daily precipitation, J. Geophys. Res., 113, D04110, 1–13, https://doi.org/10.1029/2007JD009132, 2008.
Choobari, O. A., Zawar-Reza, P., and Sturman, A.: Simulation of the spatial distribution of mineral dust and its direct radiative forcing over Australia, Tellus B, 65, 19856–19869, https://doi.org/10.3402/tellusb.v65i0.19856, 2013.
Climate Prediction Center: Historical El Nino/La Nina episodes (1950-present), available at: https://origin.cpc.ncep.noaa.gov/products/analysis_monitoring/ensostuff/ONI_v5.php, last access: 10 July 2020.
DeMott, P. J., Prenni, A. J., Liu, X., Kreidenweis, S. M., Petters, M. D., Twohy, C. H., Richardson, M. S., Eidhammer, T., and Rogers, D. C.: Predicting global atmospheric ice nuclei distributions and their impacts on climate, P. Natl. Acad. Sci. USA, 107, 11217–11222, https://doi.org/10.1073/pnas.0910818107, 2010.
Diner, D. J., Beckert, J. C., Reilly, T. H., Bruegge, C. J., Conel, J. E., Kahn, R. A., Martonchik, J. V, Ackerman, T. P., Davies, R., Gerstl, S. A. W., Gordon, H. R., Muller, J. P., Myneni, R. B., Sellers, P. J., Pinty, B., and Verstraete, M. M.: Multi-angle Imaging SpectroRadiometer (MISR) instrument description and experiment overview, IEEE T. Geosci. Remote, 36, 1072–1087, 1998.
Dorigo, W., Wagner, W., Albergel, C., Albrecht, F., Balsamo, G., Brocca, L., Chung, D., Ertl, M., Forkel, M., Gruber, A., Haas, E., Hamer, P. D., Hirschi, M., Ikonen, J., de Jeu, R., Kidd, R., Lahoz, W., Liu, Y. Y., Miralles, D., Mistelbauer, T., Nicolai-Shaw, N., Parinussa, R., Pratola, C., Reimer, C., van der Schalie, R., Seneviratne, S. I., Smolander, T., and Lecomte, P.: ESA CCI Soil Moisture for improved Earth system understanding: State-of-the art and future directions, Remote Sens. Environ., 203, 185–215, https://doi.org/10.1016/j.rse.2017.07.001, 2017.
Eck, T. F., Holben, B. N., Reid, J. S., Dubovik, O., Smirnov, A., O'Neill, N. T., Slutsker, I., and Kinne, S.: Wavelength dependence of the optical depth of biomass burning, urban, and desert dust aerosols, J. Geophys. Res.-Atmos., 104, 31333–31349, https://doi.org/10.1029/1999JD900923, 1999.
European Space Agency and Technische Universität Wien (TUW): ESA CCI Soil Moisture Product New Version Release (v04.7), available at: https://www.esa-soilmoisture-cci.org/node/238, last access: 3 June 2021.
Evans, S., Ginoux, P., Malyshev, S., and Shevliakova, E.: Climate-vegetation interaction and amplification of Australian dust variability, Geophys. Res. Lett., 43, 11823–11830, https://doi.org/10.1002/2016GL071016, 2016.
Gabric, A. J., Cropp, R., Ayers, G. P., McTainsh, G., and Braddock, R.: Coupling between cycles of phytoplankton biomass and aerosol optical depth as derived from SeaWiFS time series in the Subantarctic Southern Ocean, Geophys. Res. Lett., 29, 16-1–16–4, https://doi.org/10.1029/2001GL013545, 2002.
Gabric, A. J., Cropp, R. A., McTainsh, G. H., Johnston, B. M., Butler, H., Tilbrook, B., and Keywood, M.: Australian dust storms in 2002–2003 and their impact on Southern Ocean biogeochemistry, Global Biogeochem. Cy., 24, GB2005, https://doi.org/10.1029/2009GB003541, 2010.
Garay, M. J., Witek, M. L., Kahn, R. A., Seidel, F. C., Limbacher, J. A., Bull, M. A., Diner, D. J., Hansen, E. G., Kalashnikova, O. V., Lee, H., Nastan, A. M., and Yu, Y.: Introducing the 4.4 km spatial resolution Multi-Angle Imaging SpectroRadiometer (MISR) aerosol product, Atmos. Meas. Tech., 13, 593–628, https://doi.org/10.5194/amt-13-593-2020, 2020.
Giles, D. M., Sinyuk, A., Sorokin, M. G., Schafer, J. S., Smirnov, A., Slutsker, I., Eck, T. F., Holben, B. N., Lewis, J. R., Campbell, J. R., Welton, E. J., Korkin, S. V., and Lyapustin, A. I.: Advancements in the Aerosol Robotic Network (AERONET) Version 3 database – automated near-real-time quality control algorithm with improved cloud screening for Sun photometer aerosol optical depth (AOD) measurements, Atmos. Meas. Tech., 12, 169–209, https://doi.org/10.5194/amt-12-169-2019, 2019.
Ginoux, P., Garbuzov, D., and Hsu, N. C.: Identification of anthropogenic and natural dust sources using moderate resolution imaging spectroradiometer (MODIS) deep blue level 2 data, J. Geophys. Res., 115, 1–10, https://doi.org/10.1029/2009JD012398, 2010.
Ginoux, P., Prospero, J. M., Gill, T. E., Hsu, N. C., and Zhao, M.: Global-scale attribution of anthropogenic and natural dust sources and their emission rates based on MODIS Deep Blue aerosol products, Rev. Geophys., 50, RG3005, https://doi.org/10.1029/2012RG000388, 2012.
Holben, B. N.: Aerosol Robotic Network, available at: https://aeronet.gsfc.nasa.gov/, last access: 3 June 2021.
Holben, B. N., Eck, T. F., Slutsker, I., Tanre, D., Buis, J. P., Setzer, A., Vermote, E., Reagan, J. A., Kaufman, Y. J., Nakajima, T., Lavenu, F., Jankowiak, I., and Smirnov, A.: AERONET, A Federated Instrument Network and Data Archive for Aerosol Characterization, Remote Sens. Environ., 66, 1–16, https://doi.org/10.1016/S0034-4257(98)00031-5, 1998.
Hsu, N. C., Jeong, M. J., Bettenhausen, C., Sayer, A. M., Hansell, R., Seftor, C. S., Huang, J., and Tsay, S. C.: Enhanced Deep Blue aerosol retrieval algorithm: The second generation, J. Geophys. Res.-Atmos., 118, 9296–9315, https://doi.org/10.1002/jgrd.50712, 2013.
Huang, B., Thorne, P. W., Banzon, V. F., Boyer, T., Chepurin, G., Lawrimore, J. H., Menne, M. J., Smith, T. M., Vose, R. S., and Zhang, H. M.: Extended reconstructed Sea surface temperature, Version 5 (ERSSTv5): Upgrades, validations, and intercomparisons, J. Climate, 30, 8179–8205, https://doi.org/10.1175/JCLI-D-16-0836.1, 2017.
Jickells, T. D., An, Z. S., Andersen, K. K., Baker, A. R., Bergametti, G., Brooks, N., Cao, J. J., Boyd, P. W., Duce, R. A., Hunter, K. A., Kawahata, H., Kubilay, N., laRoche, J., Liss, P. S., Mahowald, N., Prospero, J. M., Ridgwell, A. J., Tegen, I., and Torres, R.: Global Iron Connections Between Desert Dust, Ocean Biogeochemistry, and Climate, Science, 308, 67–71, https://doi.org/10.1126/science.1105959, 2005.
Kahn, R. A., Gaitley, B. J., Garay, M. J., Diner, D. J., Eck, T. F., Smirnov, A., and Holben, B. N.: Multiangle Imaging SpectroRadiometer global aerosol product assessment by comparison with the Aerosol Robotic Network, J. Geophys. Res.-Atmos., 115, https://doi.org/10.1029/2010JD014601, 2010.
Kalashnikova, O. V., Kahn, R., Sokolik, I. N., and Li, W.-H.: Ability of multiangle remote sensing observations to identify and distinguish mineral dust types: Optical models and retrievals of optically thick plumes, J. Geophys. Res., 110, D18S14, https://doi.org/10.1029/2004jd004550, 2005.
Kessler, W. S., McPhaden, M. J., and Weickmann, K. M.: Forcing of intraseasonal Kelvin waves in the equatorial Pacific, J. Geophys. Res., 100, 10613–10631, https://doi.org/10.1029/95jc00382, 1995.
Kusterer, J. M.: NASA Langley Research Center Atmospheric Science Data Center, available at: https://l0dup05.larc.nasa.gov/cgi-bin/MISR/main.cgi, last access: 3 June 2021.
Lamb, P. J., Leslie, L. M., Timmer, R. P., and Speer, M. S.: Multidecadal variability of eastern Australian dust and northern New Zealand sunshine: Associations with pacific climate system, J. Geophys. Res.-Atmos., 114, 1–12, https://doi.org/10.1029/2008JD011184, 2009.
Lamy, F., Gersonde, R., Winckler, G., Esper, O., Jaeschke, A., Kuhn, G., Ullermann, J., Martinez-Garcia, A., Lambert, F., and Kilian, R.: Increased dust deposition in the Pacific Southern Ocean during glacial periods, Science, 343, 403–408, https://doi.org/10.4159/harvard.9780674430501.c21, 2014.
Li, F., Ginoux, P., and Ramaswamy, V.: Transport of Patagonian dust to Antarctica, J. Geophys. Res.-Atmos., 115, 1–9, https://doi.org/10.1029/2009JD012356, 2010.
Madden, R. A. and Julian, P. R.: Detection of a 40–50 day oscillation in the zonal wind in the tropical Pacific, J. Atmos. Sci., 28, 702–708, 1971.
Madden, R. A. and Julian, P. R.: Description of global-scale circulation celss in the tropics with a 40–50 day period, J. Atmos. Sci., 29, 1109–1123, 1972.
Marshall, A. G., Hudson, D., Wheeler, M. C., Alves, O., Hendon, H. H., Pook, M. J., and Risbey, J. S.: Intra-seasonal drivers of extreme heat over Australia in observations and POAMA-2, Clim. Dynam., 43, 1915–1937, https://doi.org/10.1007/s00382-013-2016-1, 2013.
Marx, S. K., McGowan, H. A., and Kamber, B. S.: Long-range dust transport from eastern Australia: A proxy for Holocene aridity and ENSO-type climate variability, Earth Planet. Sc. Lett., 282, 167–177, https://doi.org/10.1016/j.epsl.2009.03.013, 2009.
Matthews, A. J., Hoskins, B. J., and Masutani, M.: The global response to tropical heating in the Madden-Julian oscillation during the northern winter, Q. J. Roy. Meteor. Soc., 130, 1991–2011, https://doi.org/10.1256/qj.02.123, 2004.
McPhaden, M. J. and Taft, B. A.: Dynamics of seasonal and intraseasonal variability in the Eastern Equatorial Pacific, J. Phys. Oceanogr., 18, 1713, https://doi.org/10.1175/1520-0485(1988)018<1713:DOSAIV>2.0.CO;2, 1988.
McTainsh, G., Chan, Y. C., McGowan, H., Leys, J., and Tews, K.: The 23rd October 2002 dust storm in eastern Australia: Characteristics and meteorological conditions, Atmos. Environ., 39, 1227–1236, https://doi.org/10.1016/j.atmosenv.2004.10.016, 2005.
McTainsh, G. H.: Quaternary aeolian dust processes and sediments in the Australian region, Quaternary Sci. Rev., 8, 235–253, 1989.
McTainsh, G. H., Burgess, R., and Pitblado, J. R.: Aridity, drought and dust storms in Australia (1960–84), J. Arid Environ., 16, 11–22, https://doi.org/10.1016/s0140-1963(18)31042-5, 1989.
McTainsh, G. H., Lynch, A. W., and Tews, E. K.: Climatic controls upon dust storm occurrence in eastern Australia, J. Arid Environ., 39, 457–466, https://doi.org/10.1006/jare.1997.0373, 1998.
McTainsh, G., Tews, K., Leys, J., and Bastin, G.: Spatial and temporal trends in wind erosion of Australian rangelands during 1960 to 2005 using the Dust Storm Index (DSI), available at: http://citeseerx.ist.psu.edu/viewdoc/download?doi=10.1.1.400.1914&rep=rep1&type=pdf (last access: 3 June 2021), 2007.
McVicar, T.: Near-Surface Wind Speed, v10, CSIRO [data collection], https://doi.org/10.25919/5c5106acbcb02, 2011.
McVicar, T.: Australian Near-Surface Wind Speed, available at: https://data.csiro.au/collections/collection/CI38391, last access: 3 June 2021.
Miller, R. L., Perlwitz, J., and Tegen, I.: Feedback upon dust emission by dust radiative forcing through the planetary boundary layer, J. Geophys. Res.-Atmos., 109, 1–17, https://doi.org/10.1029/2004JD004912, 2004.
National Centers for Environmental Information: NCDC Integrated Surface Hourly Database, available at: ftp://ftp.ncdc.noaa.gov/pub/data/noaa, last access: 3 June 2021a.
National Centers for Environmental Information: NOAA Climate Data Record (CDR) of Leaf Area Index (LAI) and Fraction of Absorbed Photosynthetically Active Radiation (FAPAR), Version 4, available at: https://data.nodc.noaa.gov/cgi-bin/iso?id=gov.noaa.ncdc:C00898, last access: 3 June 2021b.
Notaro, M.: Enhancement of vegetation-rainfall feedbacks on the Australian summer monsoon by the Madden–Julian Oscillation, Clim. Dynam., 51, 3093–3109, https://doi.org/10.1007/s00382-018-4067-9, 2018.
Noyes, K. J., Kahn, R., Sedlacek, A., Kleinman, L., Limbacher, J., and Li, Z.: Wildfire smoke particle properties and evolution, from space-based multi-angle imaging, Remote Sens.-Basel, 12, p. 769, https://doi.org/10.3390/rs12050769, 2020.
O'Loingsigh, T., McTainsh, G. H., Tews, E. K., Strong, C. L., Leys, J. F., Shinkfield, P., and Tapper, N. J.: The Dust Storm Index (DSI): A method for monitoring broadscale wind erosion using meteorological records, Aeolian Res., 12, 29–40, https://doi.org/10.1016/j.aeolia.2013.10.004, 2014.
O'Neill, N. T., Eck, T. F., Smirnov, A., Holben, B. N., and Thulasiraman, S.: Spectral discrimination of coarse and fine mode optical depth, J. Geophys. Res.-Atmos., 108, 1–15, https://doi.org/10.1029/2002jd002975, 2003.
Physical Sciences Laboratory: Data Management NOAA/ESRL/PSL, CPC Global Unified Gauge-Based Analysis of Daily Precipitation, available at: https://psl.noaa.gov/data/gridded/data.cpc.globalprecip.html, last access: 3 June 2021.
Prospero, J. M., Ginoux, P., Torres, O., Nicholson, S. E., and Gill, T. E.: Environmental characterization of global sources of atmospheric soil dust identified with the Nimbus 7 Total Ozone Mapping Spectrometer (TOMS) absorbing aerosol product, Rev. Geophys., 40, 1002, https://doi.org/10.1029/2000rg000095, 2002.
Pu, B. and Ginoux, P.: Projection of American dustiness in the late 21st century due to climate change, Sci. Rep.-UK, 7, 1–10, https://doi.org/10.1038/s41598-017-05431-9, 2017.
Pu, B. and Ginoux, P.: Climatic factors contributing to long-term variations in surface fine dust concentration in the United States, Atmos. Chem. Phys., 18, 4201–4215, https://doi.org/10.5194/acp-18-4201-2018, 2018a.
Pu, B. and Ginoux, P.: How reliable are CMIP5 models in simulating dust optical depth?, Atmos. Chem. Phys., 18, 12491–12510, https://doi.org/10.5194/acp-18-12491-2018, 2018b.
Pu, B., Ginoux, P., Kapnick, S. B., and Yang, X.: Seasonal Prediction Potential for Springtime Dustiness in the United States, Geophys. Res. Lett., 46, 9163–9173, https://doi.org/10.1029/2019GL083703, 2019.
Pu, B., Ginoux, P., Guo, H., Hsu, N. C., Kimball, J., Marticorena, B., Malyshev, S., Naik, V., O'Neill, N. T., Pérez García-Pando, C., Paireau, J., Prospero, J. M., Shevliakova, E., and Zhao, M.: Retrieving the global distribution of the threshold of wind erosion from satellite data and implementing it into the Geophysical Fluid Dynamics Laboratory land–atmosphere model (GFDL AM4.0/LM4.0), Atmos. Chem. Phys., 20, 55–81, https://doi.org/10.5194/acp-20-55-2020, 2020.
Revel-Rolland, M., De Deckker, P., Delmonte, B., Hesse, P. P., Magee, J. W., Basile-Doelsch, I., Grousset, F., and Bosch, D.: Eastern Australia: A possible source of dust in East Antarctica interglacial ice, Earth Planet. Sc. Lett., 249, 1–13, https://doi.org/10.1016/j.epsl.2006.06.028, 2006.
Risbey, J. S., Pook, M. J., McIntosh, P. C., Wheeler, M. C., and Hendon, H. H.: On the Remote Drivers of Rainfall Variability in Australia, Mon. Weather Rev., 137, 3233–3253, https://doi.org/10.1175/2009MWR2861.1, 2009.
Rotstayn, L. D., Collier, M. A., Mitchell, R. M., Qin, Y., Campbell, S. K., and Dravitzki, S. M.: Simulated enhancement of ENSO-related rainfall variability due to Australian dust, Atmos. Chem. Phys., 11, 6575–6592, https://doi.org/10.5194/acp-11-6575-2011, 2011.
Sayer, A. M., Hsu, N. C., Bettenhausen, C., and Jeong, M. J.: Validation and uncertainty estimates for MODIS Collection 6 “deep Blue” aerosol data, J. Geophys. Res.-Atmos., 118, 7864–7872, https://doi.org/10.1002/jgrd.50600, 2013.
Sayer, A. M., Hsu, N. C., Lee, J., Kim, W. V., and Dutcher, S. T.: Validation, Stability, and Consistency of MODIS Collection 6.1 and VIIRS Version 1 Deep Blue Aerosol Data Over Land, J. Geophys. Res.-Atmos., 124, 4658–4688, https://doi.org/10.1029/2018JD029598, 2019.
Seo, K. H. and Son, S. W.: The global atmospheric circulation response to tropical diabatic heating associated with the Madden-Julian oscillation during northern winter, J. Atmos. Sci., 69, 79–96, https://doi.org/10.1175/2011JAS3686.1, 2012.
Shao, Y., Leys, J. F., McTainsh, G. H., and Tews, K.: Numerical simulation of the October 2002 dust event in Australia, J. Geophys. Res.-Atmos., 112, 1–13, https://doi.org/10.1029/2006JD007767, 2007.
Shimizu, M. H., Ambrizzi, T., and Liebmann, B.: Extreme precipitation events and their relationship with ENSO and MJO phases over northern South America, Int. J. Climatol., 37, 2977–2989, https://doi.org/10.1002/joc.4893, 2017.
Strong, C. L., Parsons, K., McTainsh, G. H., and Sheehan, A.: Dust transporting wind systems in the lower Lake Eyre Basin, Australia: A preliminary study, Aeolian Res., 2, 205–214, 2011.
Sulla-Menashe, D. and Friedl, M. A.: User guide to collection 6 MODIS land cover (MCD12Q1 and MCD12C1) product, USGS, Reston, VA, USA, 1–18, 2018.
Sunda, W. G. and Huntsman, S. A.: Interrelated influence of iron, light and cell size on marine phytoplankton growth, Nature, 390, 389–392, 1997.
Tanaka, T. Y. and Chiba, M.: A numerical study of the contributions of dust source regions to the global dust budget, Global Planet. Change, 52, 88–104, https://doi.org/10.1016/j.gloplacha.2006.02.002, 2006.
Tegen, I. and Lacis, A. A.: Modeling of particle size distribution and its influence on the radiative properties of mineral dust aerosol, J. Geophys. Res., 101, 19237–19244, https://doi.org/10.1029/95jd03610, 1996.
Tegen, I., Werner, M., Harrison, S. P., and Kohfeld, K. E.: Relative importance of climate and land use in determining present and future global soil dust emission, Geophys. Res. Lett., 31, L05105, https://doi.org/10.1029/2003gl019216, 2004.
van der Werf, G. R., Randerson, J. T., Giglio, L., van Leeuwen, T. T., Chen, Y., Rogers, B. M., Mu, M., van Marle, M. J. E., Morton, D. C., Collatz, G. J., Yokelson, R. J., and Kasibhatla, P. S.: Global fire emissions estimates during 1997–2016, Earth Syst. Sci. Data, 9, 697–720, https://doi.org/10.5194/essd-9-697-2017, 2017.
Vermote, E. and NOAA CDR Program: NOAA Climate Data Record (CDR) of AVHRR Leaf Area Index (LAI) and Fraction of Absorbed Photosynthetically Active Radiation (FAPAR), Version 5, https://doi.org/10.7289/V5TT4P69, n.d.
Webb, N. P. and Pierre, C.: Quantifying Anthropogenic Dust Emissions, Earths Futur, 6, 286–295, https://doi.org/10.1002/2017EF000766, 2018.
Webb, N. P., McGowan, H. A., Phinn, S. R., and McTainsh, G. H.: AUSLEM (AUStralian Land Erodibility Model): A tool for identifying wind erosion hazard in Australia, Geomorphology, 78, 179–200, 2006.
Wei, J., Li, Z., Peng, Y., and Sun, L.: MODIS Collection 6.1 aerosol optical depth products over land and ocean: validation and comparison, Atmos. Environ., 201, 428–440, https://doi.org/10.1016/j.atmosenv.2018.12.004, 2019.
Wei, Y. and Ren, H.-L.: Modulation of ENSO on Fast and Slow MJO Modes during Boreal Winter, J. Climate, 32, 7483–7506, https://doi.org/10.1175/JCLI-D-19-0013.1, 2019.
Wheeler, M. C. and Hendon, H. H.: An all-season real-time multivariate MJO index: Development of an index for monitoring and prediction, Mon. Weather Rev., 132, 1917–1932, https://doi.org/10.1175/1520-0493(2004)132{<}1917:AARMMI{>}2.0.CO;2, 2004.
Wheeler, M. C., Hendon, H. H., Cleland, S., Meinke, H., and Donald, A.: Impacts of the Madden-Julian oscillation on australian rainfall and circulation, J. Climate, 22, 1482–1498, https://doi.org/10.1175/2008JCLI2595.1, 2009.
Wolfe, R.: Level-1 and Atmosphere Archive and Distribution System (LAADS) Distributed Active Archive Center (DAAC), available at: https://ladsweb.modaps.eosdis.nasa.gov/, last access: 3 June 2021.
Yu, Y. and Notaro, M.: Observed land surface feedbacks on the Australian monsoon system, Clim. Dynam., 54, 3021–3040, https://doi.org/10.1007/s00382-020-05154-0, 2020.
Yu, Y., Notaro, M., Liu, Z., Kalashnikova, O., Alkolibi, F., Fadda, E., and Bakhrjy, F.: Assessing temporal and spatial variations in atmospheric dust over Saudi Arabia through satellite, radiometric, and station data, J. Geophys. Res.-Atmos., 118, 13253–13264, https://doi.org/10.1002/2013JD020677, 2013.
Yu, Y., Notaro, M., Kalashnikova, O. V., and Garay, M. J.: Climatology of summer Shamal wind in the Middle East, J. Geophys. Res.-Atmos., 121, 289–305, https://doi.org/10.1002/2014JD022963, 2016.
Yu, Y., Notaro, M., Wang, F., Mao, J., Shi, X., and Wei, Y.: Observed positive vegetation-rainfall feedbacks in the Sahel dominated by a moisture recycling mechanism, Nat. Commun., 8, 1873, https://doi.org/10.1038/s41467-017-02021-1, 2017.
Yu, Y., Kalashnikova, O. V., Garay, M. J., Lee, H., and Notaro, M.: Identification and Characterization of Dust Source Regions Across North Africa and the Middle East Using MISR Satellite Observations, Geophys. Res. Lett., 45, 6690–6701, https://doi.org/10.1029/2018GL078324, 2018a.
Yu, Y., Notaro, M., Wang, F., Mao, J., Shi, X., and Wei, Y.: Validation of a statistical methodology for extracting vegetation feedbacks: focus on North African ecosystems in the Community Earth System Model, J. Climate, 31, 1565–1586, https://doi.org/10.1175/JCLI-D-17-0220.1, 2018b.
Yu, Y., Kalashnikova, O. V., Garay, M. J., Lee, H., Notaro, M., Campbell, J. R., Marquis, J., Ginoux, P. and Okin, G. S.: Disproving the Bodélé Depression as the Primary Source of Dust Fertilizing the Amazon Rainforest, Geophys. Res. Lett., 47, 1–12, https://doi.org/10.1029/2020GL088020, 2020.