the Creative Commons Attribution 4.0 License.
the Creative Commons Attribution 4.0 License.
 | 28 May 2021
Aerosol above-cloud direct radiative effect and properties in the Namibian region during the AErosol, RadiatiOn, and CLOuds in southern Africa (AEROCLO-sA) field campaign – Multi-Viewing, Multi-Channel, Multi-Polarization (3MI) airborne simulator and sun photometer measurements
Aurélien Chauvigné
Fabien Waquet
Frédérique Auriol
Luc Blarel
Cyril Delegove
Oleg Dubovik
Cyrille Flamant
Marco Gaetani
Philippe Goloub
Rodrigue Loisil
Marc Mallet
Jean-Marc Nicolas
Frédéric Parol
Fanny Peers
Benjamin Torres
Paola Formenti
We analyse the airborne measurements of above-cloud aerosols from the AErosol, RadiatiOn, and CLOuds in southern Africa (AEROCLO-sA) field campaign performed in Namibia during August and September 2017. The study aims to retrieve the aerosol above-cloud direct radiative effect (DRE) with well-defined uncertainties. To improve the retrieval of the aerosol and cloud properties, the airborne demonstrator of the Multi-Viewing, Multi-Channel, Multi-Polarization (3MI) satellite instrument, called the Observing System Including PolaRisation in the Solar Infrared Spectrum (OSIRIS), was deployed on-board the SAFIRE (Service des Avions Français Instrumentés pour la Rechercheen Environnement) Falcon 20 aircraft during 10 flights performed over land, over the ocean, and along the Namibian coast. The airborne instrument OSIRIS provides observations at high temporal and spatial resolutions for aerosol above clouds (AACs) and cloud properties. OSIRIS was supplemented with the Photomètre Léger Aéroporté pour la surveillance des Masses d'Air version 2 (PLASMA2). The combined airborne measurements allow, for the first time, the validation of AAC algorithms previously developed for satellite measurements. The variations in the aerosol properties are consistent with the different atmospheric circulation regimes observed during the deployment. Airborne observations typically show strong aerosol optical depth (AOD; up to 1.2 at 550 nm) of fine-mode particles from biomass burning (extinction Ångström exponent varying between 1.6 and 2.2), transported above bright stratocumulus decks (mean cloud top around 1 km above mean sea level), with cloud optical thickness (COT) up to 35 at 550 nm. The above-cloud visible AOD retrieved with OSIRIS agrees within 10 % of the PLASMA2 sun photometer measurements in the same environment.
The single scattering albedo (SSA) is one of the most influential parameters on the AAC DRE calculation that remains largely uncertain in models. During the AEROCLO-sA campaign, the average SSA obtained by OSIRIS at 550 nm is 0.87, which is in agreement within 3 %, on average, with previous polarimetric-based satellite and airborne retrievals. The strong absorption of the biomass burning plumes in the visible range is generally consistent with the observations from the Aerosol Robotic Network (AERONET) ground-based sun photometers. This, however, shows a significant increase in the particles' absorption at 440 nm in northern Namibia and Angola, which indicates more absorbing organic species within the observed smoke plumes. Biomass burning aerosols are also vertically collocated, with significant amounts of water content up to the top of the plume at around 6 km height in our measurements.
The detailed characterization of aerosol and cloud properties, water vapour, and their uncertainties obtained from OSIRIS and PLASMA2 measurements allows us to study their impacts on the AAC DRE. The high-absorbing load of AAC, combined with high cloud albedo, leads to unprecedented DRE estimates, which are higher than previous satellite-based estimates. The average AAC DRE calculated from the airborne measurements in the visible range is +85 W m−2 (standard deviation of 26 W m−2), with instantaneous values up to +190 W m−2 during intense events. These high DRE values, associated with their uncertainties, have to be considered as new upper cases in order to evaluate the ability of models to reproduce the radiative impact of the aerosols over the southeastern Atlantic region.
- Article
(3974 KB) - Full-text XML
- BibTeX
- EndNote


Aerosols from natural and anthropogenic sources impact the climate directly, by interacting with solar and terrestrial radiations, and indirectly, through interactions with cloud properties (IPCC, 2013). According to their origin and the atmospheric transport, aerosol particles are unequally distributed in the troposphere where they can reside for several days or weeks. As a consequence, their chemical, optical, and microphysical properties also present a strong variability (Lagzi et al., 2014).
Aerosol particles significantly impact the radiative budget of the Earth. However, due to the high variability in aerosol properties and their distributions in the atmosphere, the accurate quantification of their direct radiative effects (DREs) remains uncertain. Climate models require several assumptions to represent aerosols, clouds, and their interactions, resulting in a large diversity of aerosol DRE. The Aerosol Comparisons between Observations and Models (AeroCom) experiment shows biases between the most recent observations and models (Myhre et al., 2013; Samset et al., 2014). Significant biases are notably observed in particular in the southeastern Atlantic (SEA) region where highly absorbing particles coexist with low-level stratocumulus cloud (Zuidema et al., 2016).
The SEA region presents, therefore, a unique opportunity to study aerosol–cloud–radiation interactions and the impact of highly absorbing particles from biomass burning in central Africa, which are still debated (Bellouin and the Ringberg 2018 review team, 2020). The AeroCom study (Zuidema et al., 2016) demonstrates a net aerosol DRE from cooling to warming in this region. Indeed, aerosol above cloud (AAC) highly contributes to climate uncertainties, and very few methods currently allow the retrieval of a detailed model of their properties (Waquet et al., 2013b; Knobelspiesse et al., 2011; Peers et al., 2015). Peers et al. (2016) reported disagreements between five AeroCom models and satellite observations of AAC from the Polarization and Directionality of the Earth's Reflectances (POLDER) instrument. Most models do not reproduce the large aerosol load measured above the clouds by POLDER. This study also demonstrated that large discrepancies exist between these climate models in terms of AAC absorption and load. The authors explained these differences in the models by using different parameterizations for the aerosol injection heights, vertical transport, and absorption properties. De Graaf et al. (2014) demonstrated significant biases between the above-cloud DRE estimated from satellite observations and modelled DRE in the SEA region. The modelled instantaneous DRE was estimated to be 5 times lower than the ones calculated with the measurements provided by the SCanning Imaging Absorption SpectroMeter for Atmospheric CHartographY (SCIAMACHY) sensor (i.e. 30–35 W m−2 for SCIAMACHY retrievals versus 6 W m−2 for the DRE computed with a global model). The authors explained that these differences could be partially explained by an underestimation of the aerosol absorption in the visible and UV part of the spectrum. Mallet et al. (2020) also studied the sensitivity of the DRE to the absorption property of biomass burning aerosols in the SEA region using two regional climate models. Their work demonstrated a low bias in the modelled above-cloud AOD of about 40 % (in relative units) between modelled and observed (Moderate Resolution Imaging Spectroradiometer, MODIS, and POLDER) above-cloud aerosol optical depth (AOD) in the region, which is necessarily reflected in an underestimate of the modelled DRE.
In order to retrieve aerosol DRE above the clouds in the SEA region with well-defined uncertainties which is needed to evaluate climate models, one needs first to characterize aerosols and cloud optical and microphysical properties. Because the simultaneous retrieval of aerosol and cloud properties is still challenging (Cochrane et al., 2019), the European Space Agency (ESA) and the European Organisation for the Exploitation of Meteorological Satellites (EUMETSAT) developed a new spaceborne Multi-Viewing, Multi-Channel, Multi-Polarization imager (3MI) to be launched in 2022 on board the Meteorological Operational Satellite Second Generation (MetOp-SG) satellite. To evaluate the next generation of retrieval algorithms, a 3MI airborne prototype, Observing System Including PolaRisation in the Solar Infrared Spectrum (OSIRIS; Auriol et al., 2008), has been developed at Laboratoire d'Optique Atmospheric (LOA; France). The total and polarized radiances sampled by OSIRIS are between 440 and 2200 nm, and the new retrieval algorithms developed by Waquet et al. (2013a) and Peers et al. (2015), allow us to simultaneously retrieve the aerosol and the cloud properties in case of AACs. Additionally, polarimetric measurements constitute a promising opportunity for the simultaneous retrieval of the aerosol and the surface properties (Dubovik et al., 2011, 2019).
In addition to the aerosol–cloud interaction, the SEA region also represents a unique opportunity to study the direct radiative effects of highly absorbing particles transported above the clouds. In this region, smoke aerosol plumes can reach high altitudes (up to 6 km) and can be transported for several days in the atmosphere (Samset et al., 2014; Marenco et al., 2016) and overlay low-level clouds which are persistent over water. These considerations have motivated a significant number of intensive field campaigns between 1992 and 2018 (Formenti et al., 2019). Pistone et al. (2019) obtain single scattering albedo (SSA) values for biomass burning aerosols from both airborne in situ and remote sensing methods during the ObseRvations of Aerosols above CLouds and their intEractionS (ORACLES) airborne campaign performed close to the Namibian coast in August–September 2016. From a sweeping-view-mode imager (the Airborne Multiangle SpectroPolarimetric Imager, AirMSPI), mean SSA values at 550 nm were observed between 0.83 and 0.89 in August–September 2016. Mean SSAs ranging between 0.82 and 0.92 (from June to October 2006) were also retrieved at 550 nm over a large region centred on the southeastern Atlantic Ocean using POLDER (Peers et al., 2016). A previous study based on Aerosol Robotic Network (AERONET) retrievals (Eck et al., 2013) has shown similar SSA values during the fire season. The latter study demonstrated that the seasonal trend of SSA in this region was mainly due to a change in aerosol composition and, particularly, in the black carbon fraction.
Therefore, the new observation capabilities proposed by the airborne instrument OSIRIS give an interesting opportunity to characterize both cloud and absorbing particles in order to retrieve the aerosol DRE with high accuracy. Results are beneficial for constraining climate models and satellite retrievals in a climate-sensitive region (Mallet et al., 2019).
In this paper, we present aerosol and cloud retrievals performed over the SEA region essential for the calculation of the aerosol DRE. Measurements are performed by the OSIRIS and the PLASMA2 airborne instruments deployed during the AErosol, RadiatiOn, and CLOuds in southern Africa (AEROCLO-sA) field campaign in Namibia during the biomass burning period in 2017 (Formenti et al., 2019). Section 2 describes the flight trajectories and the main meteorological conditions encountered during the campaign. In Sect. 3, the OSIRIS, airborne and ground-based sun photometer, and airborne lidar Leandre New Generation (LNG) retrieval methods are described. Section 4 reports the mean aerosol and cloud properties retrieved in the Namibian region essential for aerosol DRE retrievals. Finally, the results are summarized and discussed in Sect. 5.
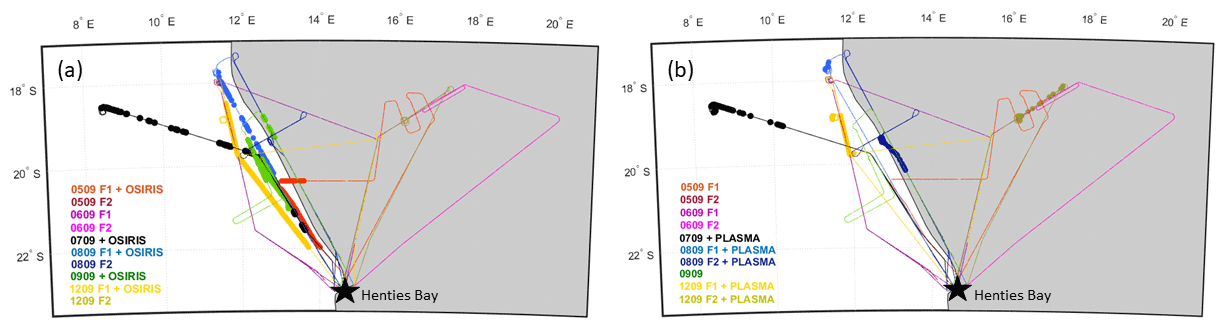
Figure 1Flight tracks of the 10 flights of the AEROCLO-sA campaign over the Namibian coast in September 2017. Circles indicate the (a) OSIRIS inversion locations and (b) PLASMA-2 measurement locations at low flight altitudes.
The AEROCLO-sA deployment comprised the measurements from the ground-based station of Henties Bay, Namibia (22∘6′ S, 14∘30′ E; 20 m above sea level – a.s.l.) from 23 August to 12 September 2017 (Formenti et al., 2019).
The airborne component was conducted by the SAFIRE (Service des Avions Français Instrumentés pour la Recherche en Environnement) Falcon 20 aircraft from 5 to 12 September 2017. A total of 10 flights were performed over the ocean and land in the area from 7∘30′ E to 20∘ E and from 17∘ S to 22∘30′ S (Fig. 1). There were also two pre-campaign flights (not presented here) performed over the Mediterranean Sea during summer 2017. Those flights correspond to pristine conditions over both clear and cloudy ocean scenes and were used for instrumental calibration.
The locations of the OSIRIS observations used in the present study are shown in Fig. 1a. Several filters are applied to the OSIRIS measurements to ensure optimum conditions for the retrieval (i.e. homogeneous cloud fields and stable flight conditions). As a first quality assurance, only stable flight conditions at a high altitude (higher than 8 km a.s.l.) are selected. In addition, high-altitude clouds and heterogeneous cloud scenes are rejected. The selected cases for OSIRIS inversions for AAC represent 76 % of cloudy measurements at high altitude (>7 km). In these conditions, a total of 2 h and 15 min of OSIRIS measurements were processed. Figure 1b also represents the PLASMA2 measurements, used in the present study, which correspond to low flight levels and stable flight conditions.
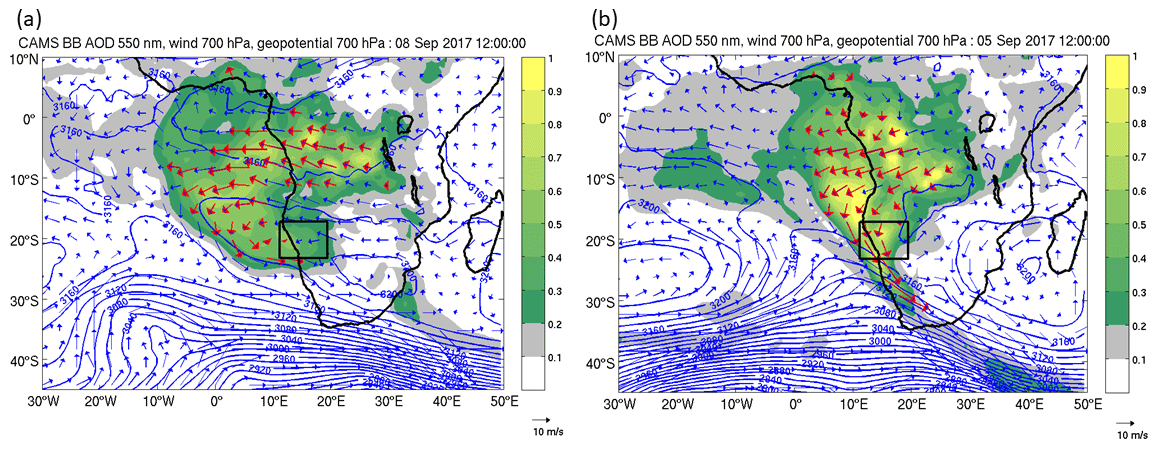
Figure 2Regional atmospheric circulation and aerosol for (a) 8 September 2017 and (b) 5 September 2017 at 12:00 UTC. Geopotential height (contours) and wind (arrows) at 700 hPa and biomass burning AOD at 550 nm (shading) from CAMS reanalysis are displayed. Red arrows highlight wind vectors at grid points where the AOD is higher than the 90th percentile of the regional AOD. The AEROCLO-sA campaign region is shown with a black rectangle in the Namibian region.
Data from the Copernicus Atmospheric Monitoring System (CAMS) reanalysis (Flemming et al., 2017) allow us to obtain the biomass burning plume trajectory at 6 h resolution at a 0.75∘ × 0.75∘ spatial resolution. In Fig. 2, the atmospheric circulation and the associated biomass burning plume during the field campaign are represented by the geopotential height and wind at 700 hPa and the biomass burning Aerosol optical depth (AOD) at 550 nm. The plume path is displayed by highlighting the wind vectors at grid points with AOD higher than the 90th percentile of the AOD in the region (red arrows).
The regional atmospheric circulation on 8 September (Fig. 2a) represents the mean circulation during this period, with air masses coming from tropical Africa, moving westward until Ascension Island, which are then deflected to the southeast due to the anticyclone centred over southern Africa. These conditions were observed during most of the AEROCLO-sA campaign, except on 5 September (Fig. 2b) when the anticyclone was centred over the Indian Ocean between the South African coast and Madagascar. During this specific day, air masses were mostly transported over the continent, and dust emissions were reported from both the climate model and the airborne lidar measurements (Formenti et al., 2019).
3.1 The 3MI airborne prototype – OSIRIS
The OSIRIS imager provides both total and polarized radiances measurements. The airborne instrument is characterized by two optical systems, i.e. one for the visible and near-infrared range (VIS-NIR; from 440 to 940 nm) with a wide field of view of 114∘ and one for the shortwave infrared range (SWIR; from 940 to 2200 nm) with a field of view of 105∘. The 2D detectors, which are respectively a charge-coupled device (CCD) matrix of 1392×1040 pixels and a mercury cadmium telluride (MCT) focal plane array of 320×256 pixels, allow us to obtain very high-resolution images with a spatial resolution of 20 m for the VIS-NIR detector and around 60 m for the SWIR one at a height of 10 km. This high resolution allows us to record the same scene up to 16 times (at 10 km height) from different viewing angles. Polarized measurements are available at 440, 490, 670, 870, 1020, 1600, and 2200 nm. Measurements without polarization capabilities are also performed in molecular absorption bands (763, 765, 910, 940, and 1365 nm), and for a channel centred at 1240 nm, in addition to the channels previously listed.
The aerosol and cloud retrievals are performed using the OSIRIS measurements at 670 and 870 nm. A moving average is applied on measurements over a few pixels before the retrieval is achieved. The related radiometric noise is then estimated to be lower than and for the total and polarized normalized radiances, respectively. After all radiometric and geometric treatments are applied to the data (Auriol et al., 2008), the errors due to absolute calibration are expected to be lower than 3 % for these channels. The absolute calibration accuracy was improved for the visible radiances using in-flight calibration technics (Hagolle et al., 1999) applied to OSIRIS measurements acquired over the Mediterranean Sea.
The algorithm used to retrieve the AAC properties with OSIRIS is based on an optimal estimation method (OEM) developed for the POLDER instrument (Waquet et al., 2013a). This method allows us to simultaneously retrieve the aerosol and the cloud properties (Waquet et al., 2013b; Peers et al., 2015). Here, the aerosol retrieval is performed using the measurements in the solar plane of each image. The aerosol properties are then assumed to be spatially homogenous over the entire OSIRIS visible image (of about 20×20 km2). Finally, the cloud properties are retrieved pixel by pixel over the entire image. As demonstrated in Waquet et al. (2013a), this procedure increases the sensitivity of the algorithm to the aerosol properties.
The algorithm mainly provides AOD, SSA, extinction Ångström exponent (α), and the cloud optical thickness (COT). SSA is defined as the ratio of the scattering to the extinction coefficient and primarily depends on the aerosol absorption (i.e. the imaginary part of the complex refractive index) and also the particle size (Dubovik et al., 1998; Redemann et al., 2001). The Ångström exponent is indicative of the particle size (Reid et al., 1999; Schuster et al., 2006). The retrieved quantities are used to compute the instantaneous DRE over the solar spectrum, considering the following two main assumptions on the aerosol microphysics: (1) the complex refractive index of aerosols is assumed to be spectrally invariant, i.e. the imaginary part is retrieved and the real part value is fixed to 1.51, which is a reasonable average value for biomass burning aerosols, (Dubovik et al., 2000) and (2) the particle size is retrieved only for the fine mode (particle diameters below 1 µm). Moreover, the polarized measurements acquired for scattering angles larger than 130∘ are sensitive to the 3D cloud geometry effects on radiative transfer (Cornet et al., 2018). Since clouds are assumed to be plane parallel in the simulations, the method is simply applied to observations acquired for scattering angles smaller than 130∘.
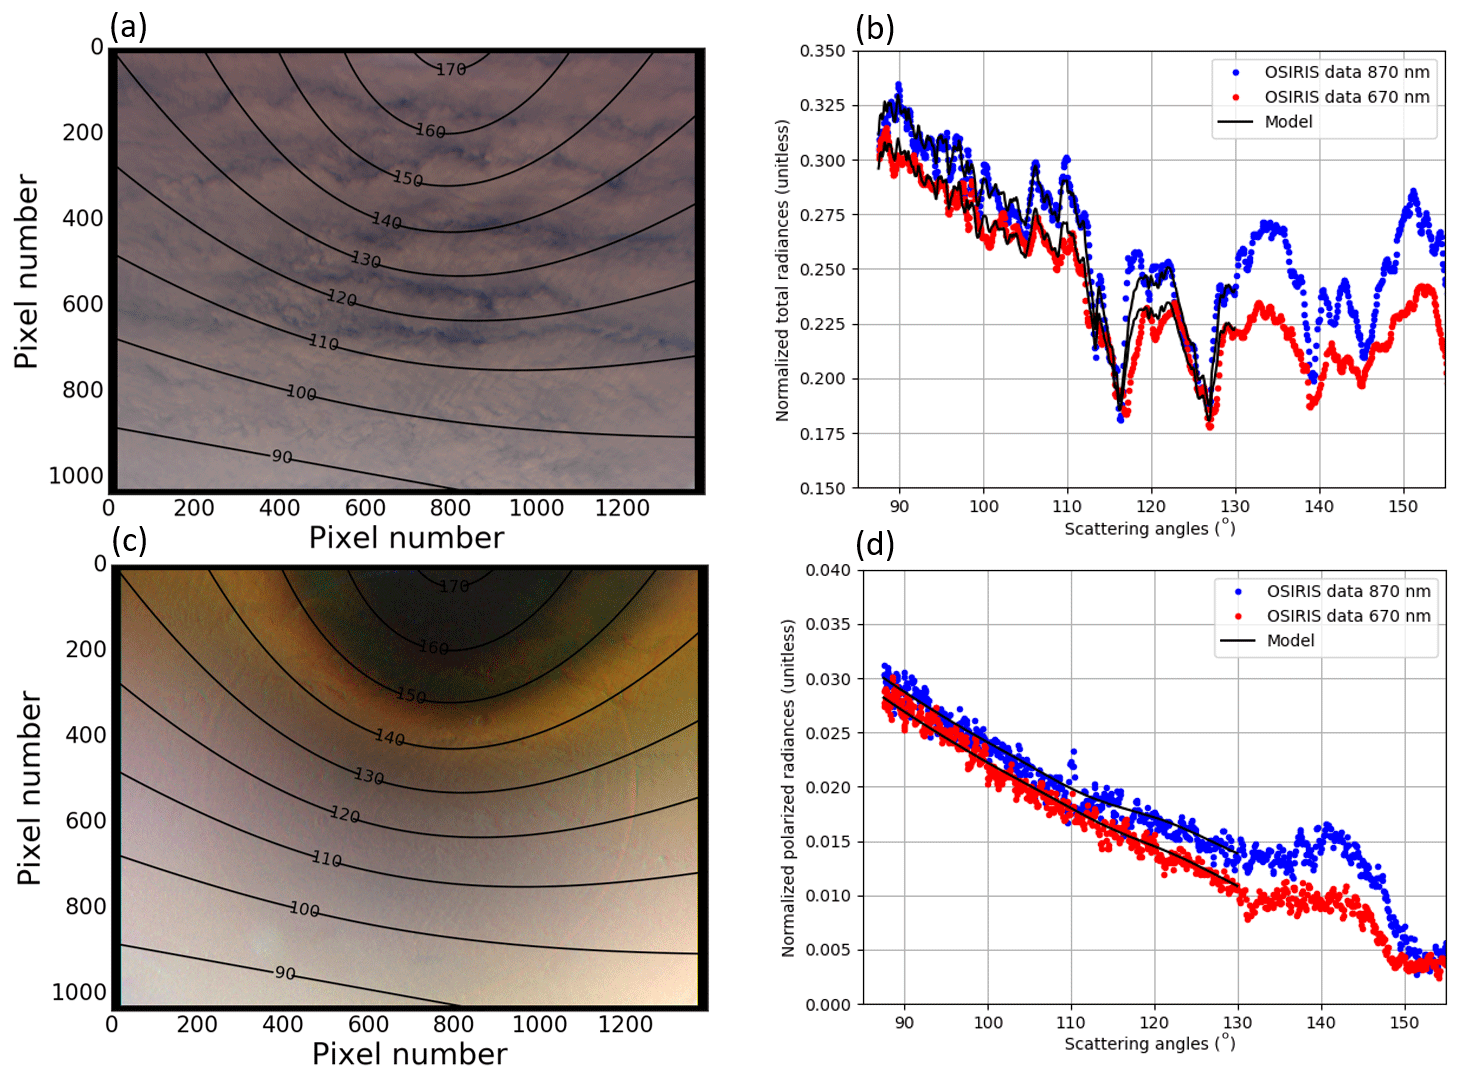
Figure 3Total and polarized radiances measured by OSIRIS during 8 September 2017. Panels (a) and (c) represent the total, on the top, and the polarized, on the bottom, recomposed RGB radiances for the full OSIRIS image. Panels (b) and (d) represent the corresponding principle planes at 670 (red) and 870 nm (blue), respectively. OEM simulations, according Waquet et al. (2013a), of the total and polarized radiances for scattering angles below 130∘ are represented with black lines in the panels (b) and (d). The main aerosol properties retrieved for this case are AOD equal to 0.74 at 670 nm, , and SSA equal to 0.87 at 670 nm.
Figure 3 shows an example of the measured and modelled radiances after the convergence is reached. It shows that the method allows us to robustly model the selected data within the measurement noise. For these values of scattering angles, the sensitivity of polarization to cloud microphysics is minimized and the cloud droplet effective radius is assumed to be equal to 10 µm, which is the mean value for the stratocumulus clouds observed over the domain of interest (Deaconu et al., 2019).
3.2 The airborne sun photometer – PLASMA2
PLASMA 2 (Photomètre Léger Aéroporté pour la surveillance des Masses d'Air version 2; Karol et al., 2013) is an airborne sun tracking photometer (referred to no. 950 on AERONET) which was on board the SAFIRE Falcon 20 during the AEROCLO-sA campaign. The AOD of the atmospheric column above the aircraft is retrieved at nine wavelengths (340, 379, 440, 500, 532, 674, 871, 1020, and 1641 nm) from the PLASMA2 measurements. PLASMA (versions 1 and 2) observations have been validated against in situ AERONET and satellite measurements (Mallet et al., 2016; Rivellini et al., 2017; Torres et al., 2017; Formenti et al., 2018; Hu et al., 2019), indicating that the accuracy of the AOD retrievals is of the order of 0.01, regardless of the wavelength. During AEROCLO-sA, several low-level flights were performed, typically near the cloud top, when measurements were performed over the ocean, and near the ground under clear sky conditions, when the low-level flights were performed over desert sites. PLASMA2 measurements performed at high altitudes allowed us to characterize the residual columnar AOD above the aircraft. This quantity was subtracted from PLASMA2 AODs measurements performed at low altitude for the sake of comparison with OSIRIS retrievals. Because PLASMA2 does not allow us to perform almucantar measurements as AERONET sun photometers, the fractions of fine- and coarse-mode AOD were derived from the PLASMA2 spectral AOD measurements using the Generalized Retrieval of Atmosphere and Surface Properties (GRASP) algorithm (Dubovik et al., 2014). GRASP also allows us to retrieve the volume size distribution from spectral AODs (Torres et al., 2017), assuming a complex refractive index (i.e. 1.50+0.025) and a bimodal log-normal particle size distribution with fixed modal widths.
3.3 Airborne lidar LNG
The vertical structure of the aerosol and cloud layers below the aircraft was obtained from the nadir pointing airborne lidar LNG. The signal backscattered to the LNG system telescope at 1064 nm is range square corrected to produce atmospheric reflectivity. The total attenuated backscatter coefficient (ABC) profiles are derived from atmospheric reflectivity profiles by normalizing the atmospheric reflectivity above the aerosol layers to the molecular backscatter coefficient profiles. Hence, the slope of the lidar reflectivity above 6.5 km a.s.l. matched that of the molecular backscatter derived from dropsonde measurements of pressure and temperature. The vertical resolution of the ABC profiles is 30 m, and profiles are averaged over 5 s, yielding a horizontal resolution of 1 km for an aircraft flying at 200 m s−1 on average. It is worth noting that ABC as observed with LNG is sensitive to both aerosol concentration and aerosol hygroscopicity. Indeed, relative humidity in excess of 60 % modifies the size and the complex refractive index of aerosol and, hence, their optical properties, enhancing the ABC (e.g. Randriamiarisoa et al., 2006).
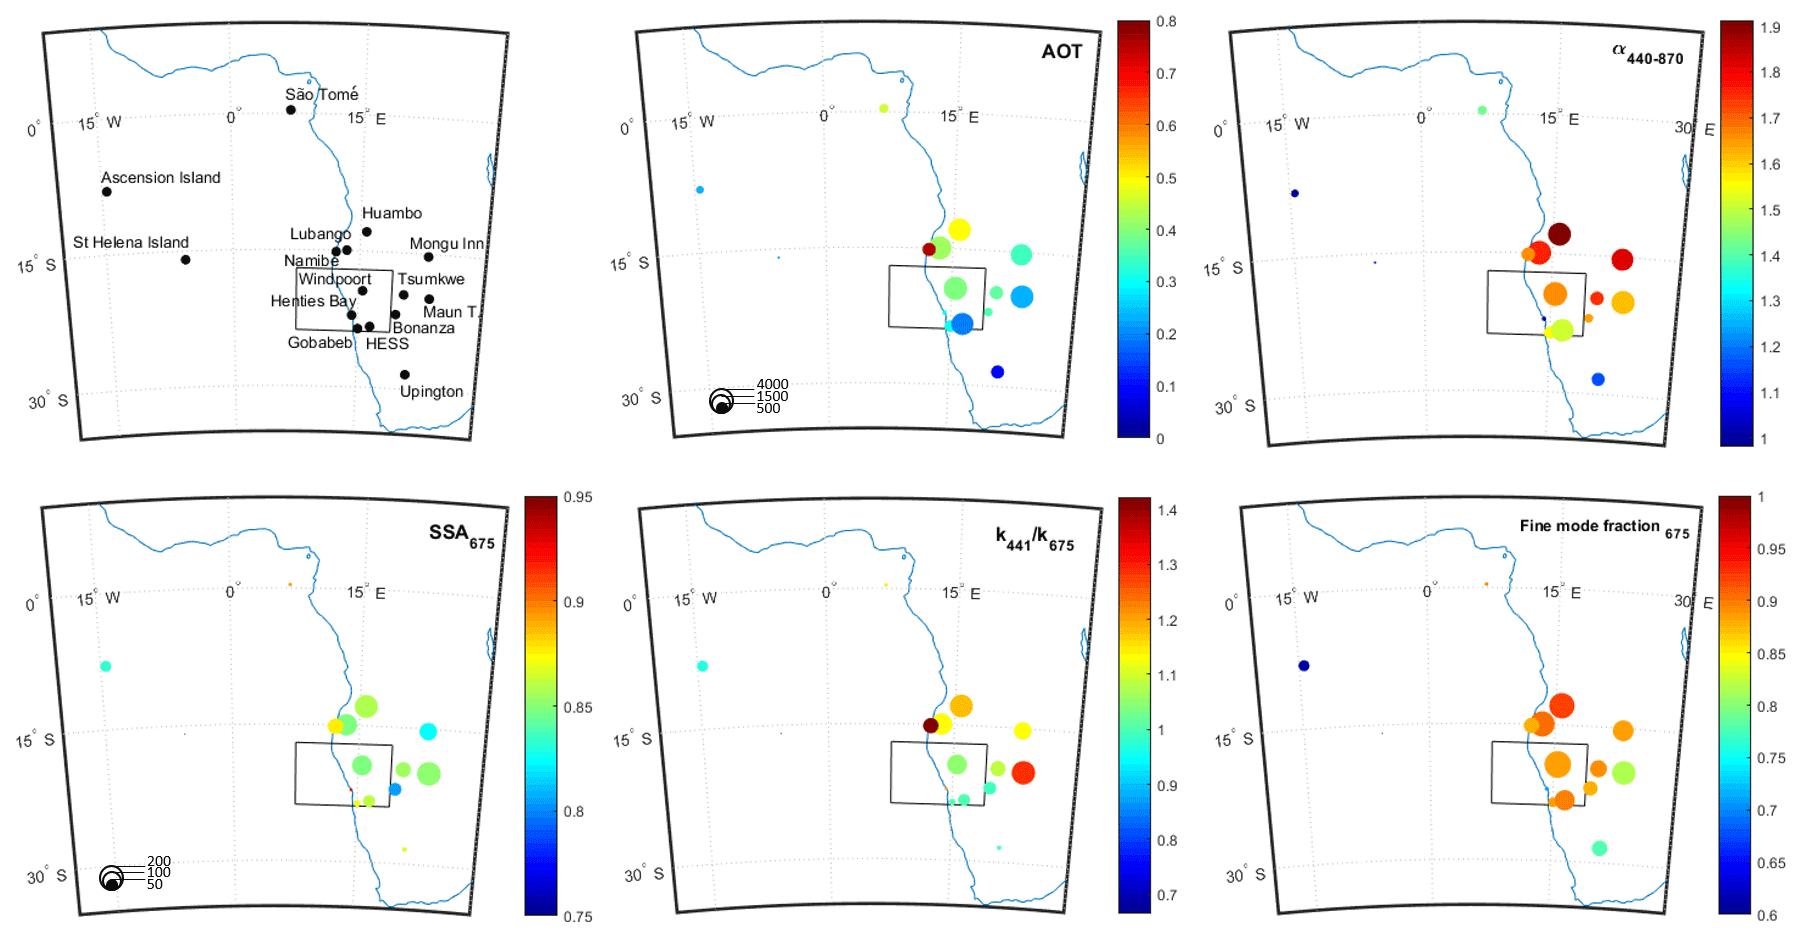
Figure 4Mean values of AOD at 550 nm, α440−870, SSA at 675 nm, ratio of the imaginary part of the refractive index (k) between 441 and 675 nm, and the fine- to coarse-mode fraction of the aerosol volume concentration from 15 AERONET sites in the southeastern Atlantic region. The selected period is from 15 August to 15 September 2017. The black box corresponds to the AEROCLO-sA flight domain. Circle size is linked to the availability of the data in the number of measurements.
3.4 Ground-based AERONET sun photometer measurements
To put the aircraft observations into context, we analysed observations from 15 August to 15 September 2017 from the 15 AERONET stations located in the southeastern Atlantic region. The full column-integrated properties (i.e. AOD, complex refractive index, extinction Ångström exponent, SSA, and AOD fine-mode fraction) have been averaged for each site and are shown in Fig. 4. A total of four AERONET stations are located in the AEROCLO-sA flight domain, namely Windpoort, Henties Bay, Gobabeb, and HESS, located in the southern part of the domain, 200 km southeast of Henties Bay, and outside of the flight tracks. During the campaign, and due to the persistent cloud cover, the measurements available at Henties Bay and Gobabeb were sparse. Therefore, the Windpoort station, located at 250 km from the Namibian Coast, is a more suitable station for monitoring the aerosol evolution during the campaign. Additional interesting comparison data are provided by the Namibe station, located in the northern part of the AEROCLO-sA region, and more influenced by biomass burning emissions from central Africa than the Windpoort site (therefore exhibiting higher AODs). Outside the AEROCLO-sA domain, and as shown by the atmospheric circulation patterns in Fig. 2, biomass burning plumes were often transported towards Ascension Island. This remote location (i.e. 3000 km offshore of the Angola coast) gives an opportunity to study the evolution of the biomass burning aerosols during their transport and ageing (Zuidema et al., 2016; Mallet et al., 2019).
4.1 Aerosol extinction optical thickness
The primary parameter influencing the AAC DRE is the aerosol optical depth (AOD) of the aerosol layer lofted above the clouds. Above-cloud AODs were measured directly with the sun photometer PLASMA2 during specific parts of the AEROCLO-sA flights. These highly accurate AOD measurements allow for the validation of OSIRIS above-clouds AODs as a first step of the study. AERONET measurements are also used in this section to depict the general AOD variability observed during the field campaign.

Figure 5AOD time series measured at 550 nm at Namibe, Windpoort, Ascension Island, and São Tomé AERONET sites from 13 August to 16 September 2017. The grey zone represents the flight period of the AEROCLO-sA campaign.
Figure 5 reports the AERONET AODs measured at the Namibe, Windpoort, Ascension Island, and São Tomé sites during the biomass burning period (from 15 August to 15 September 2017). A moderate aerosol loading is observed at the São Tomé and Namibe sites at the beginning of the selected period, with mean AOD of 0.76 and 0.48 at 550 nm, respectively, whereas the Windpoort and Ascension Island sites record mean AOD of 0.10 and 0.19 at 550 nm, respectively. A first increase in the aerosol loading is observed between 27 August and 1 September 2017 at the Namibe and Windpoort sites (AOD up to 0.88 and 0.73 at 550 nm, respectively), a second increase between 3 and 8 September at the Namibe, Windpoort, and São Tomé sites (AOD up to 1.80, 1.54 and 1.72 at 550 nm, respectively), and a third increase starting on 13 September at the Namibe and Windpoort sites (AOD up to 1.45 and 0.84 at 550 nm, respectively). During the AEROCLO-sA flight period, the strongest aerosol loadings in the AEROCLO-sA region were observed on 5 September and the lowest on 12 September from the AERONET data set. This variation in the aerosol loading is mainly explained by the changes in the atmospheric circulation as demonstrated in Sect. 2.
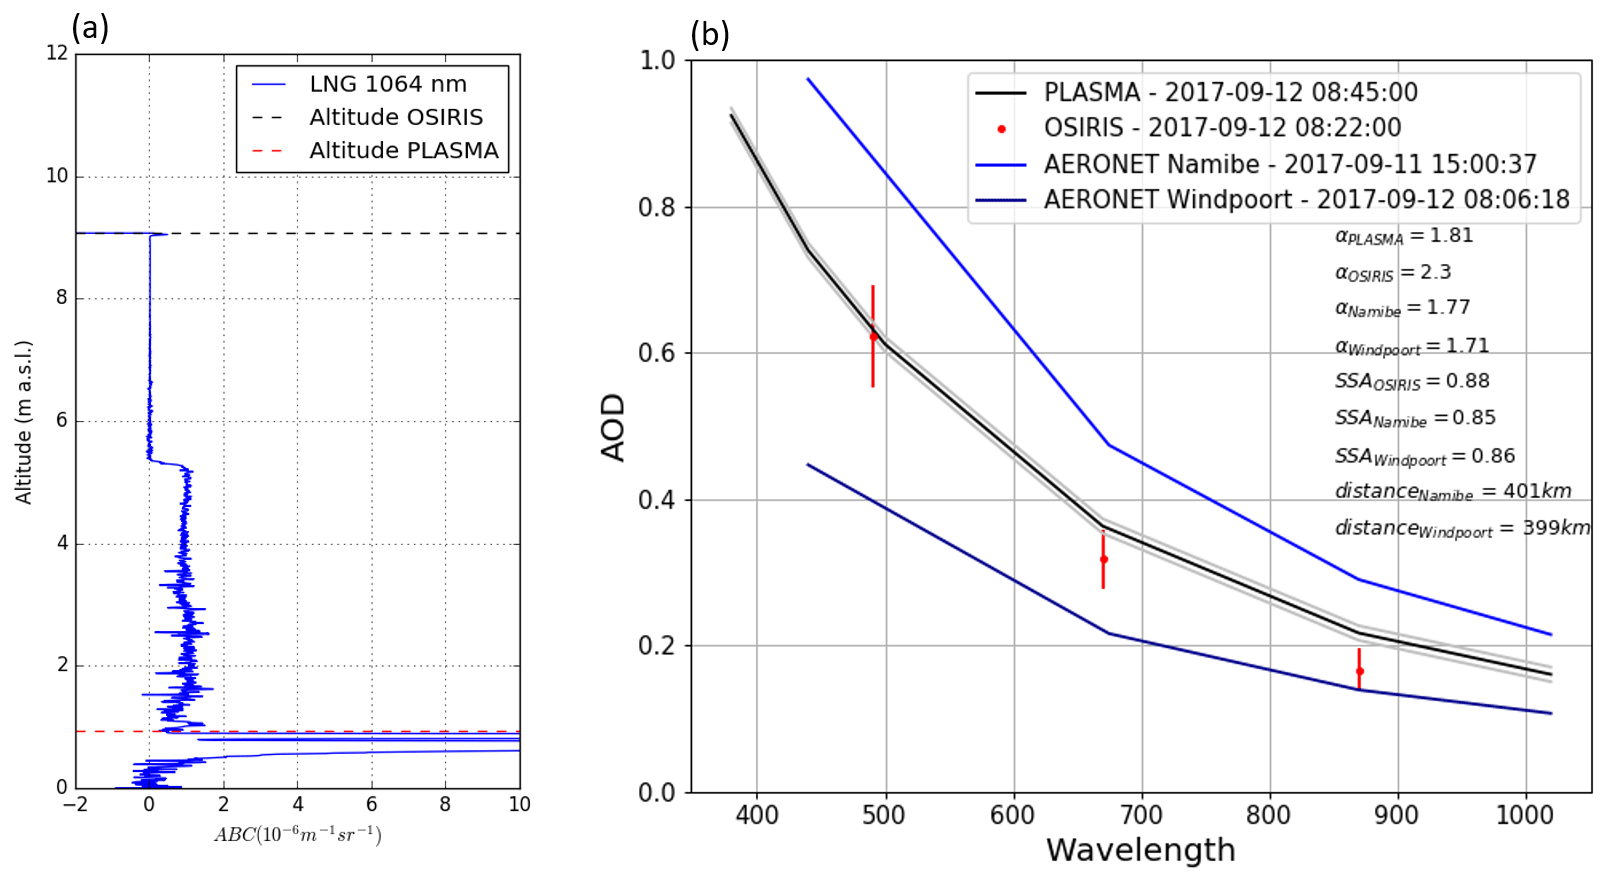
Figure 6(a) Vertical profile of the aerosol backscatter coefficient (ABC) measured at 1064 nm by the airborne lidar LNG before a loop descent performed on 12 September 2017. (b) Wavelength dependences of AOD measured at Namibe and Windpoort AERONET ground-based stations, compared to OSIRIS and PLASMA2 above-cloud AODs, estimated before and after the descent in the loop. Estimated error bars for AODs are also reported for OSIRIS (red bars) and PLASMA (grey zone).
The aerosol backscatter coefficient (ABC) at 1064 nm on 12 September 2017 obtained from the airborne lidar is shown in Fig. 6a. The aerosol signal is mainly concentrated between the stratocumulus top at around 1 and 6 km height. This vertical distribution represents the general condition during the AEROCLO-sA campaign well (Chazette et al., 2019). For this same day, Fig. 6b shows the spectral AOD measured by OSIRIS, PLASMA2, and the ground-based Windpoort and Namibe AERONET stations. The OSIRIS above-cloud retrievals were performed using measurements at an altitude of about 9 km a.s.l., corresponding to the top of the descent in the loop. Contrary to the configuration of OSIRIS on the SAFIRE Falcon 20 aircraft, PLASMA2 is an upward-looking instrument. Therefore, the AAC properties from PLASMA2 were obtained from the measurements at the bottom of the descent in the loop, above the cloud top. AOD retrieved from OSIRIS and PLASMA2 measurements agree within ±10 % at 670 nm (Fig. 6b; Table 1), and are in between the measurements of the two AERONET stations. Bias betweenPLASMA2 and AERONET AODs are around 70 % for every wavelength, whereas OSIRIS measurements agree with AERONET AODs from 20 % with Windpoort measurements at 870 nm to 67 % with Namibe measurements at 670 nm.
Table 1Aerosol optical properties from AERONET, OSIRIS, and PLASMA2 measurements for four different descents in a loop during the AEROCLO-sA campaign.
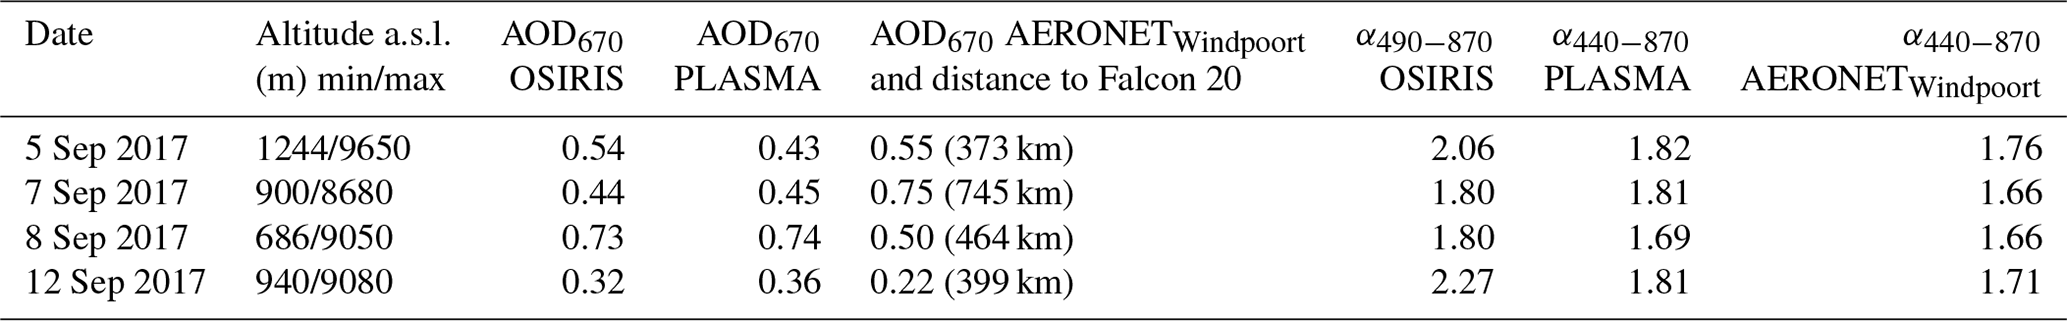
Table 1 shows this same comparison from four loops, with a very good agreement between OSIRIS and PLASMA2 for moderate to high aerosol loading (AODs from 0.36 and 0.74 at 670 nm). Note that, on 5 September, the aircraft did not reach the cloud top level at the end of the loop, which caused a higher bias (30 %) between the AOD from PLASMA2 and OSIRIS. OSIRIS AOD is slightly lower than the PLASMA one on 12 September by 0.04 for the aerosol optical thickness (AOT) at 670 nm. This low bias can mainly be attributed to the neglect of coarse-mode particles in the OSIRIS algorithm, which only considers fine-mode particles for modelling the radiative properties of the aerosol biomass burning aerosols lofted above the clouds. Indeed, for the 12 September measurements, PLASMA2 inversion of the particle size distribution shows higher coarse-mode particle concentrations (not shown) than for other flight measurements. This is probably due to some increase in the wind speed at the surface that uplifted some dust for this day and also because the concerned flight was performed straight along the Namibian coast. Thanks to PLASMA retrievals, we estimated the AAC coarse-mode AOT to be equal to 0.04 at 670 nm during the loop performed above the clouds on 12 September. For the flights performed on 7 and 8 September, the departures observed between OSIRIS and PLASMA for the AOT at 670 nm are of about 0.01 (see Table 1), which is the sun photometer measurement's accuracy. So, there is no systematic bias in the OSIRIS AOT retrievals. Based on the PLASMA and AERONET retrievals, we can affirm that the AAC coarse-mode AOT can be safely neglected for the DRE calculations for all the flights of AEROCLO-sA, except on 12 September. The coarse-mode AOD measured on 12 September limits the relative accuracy of our OSIRIS AOT retrievals at 670 nm to 10 %. For the calculation of the DRE uncertainties, we increased our AOT retrieval error to account for this observation (see Appendix B).
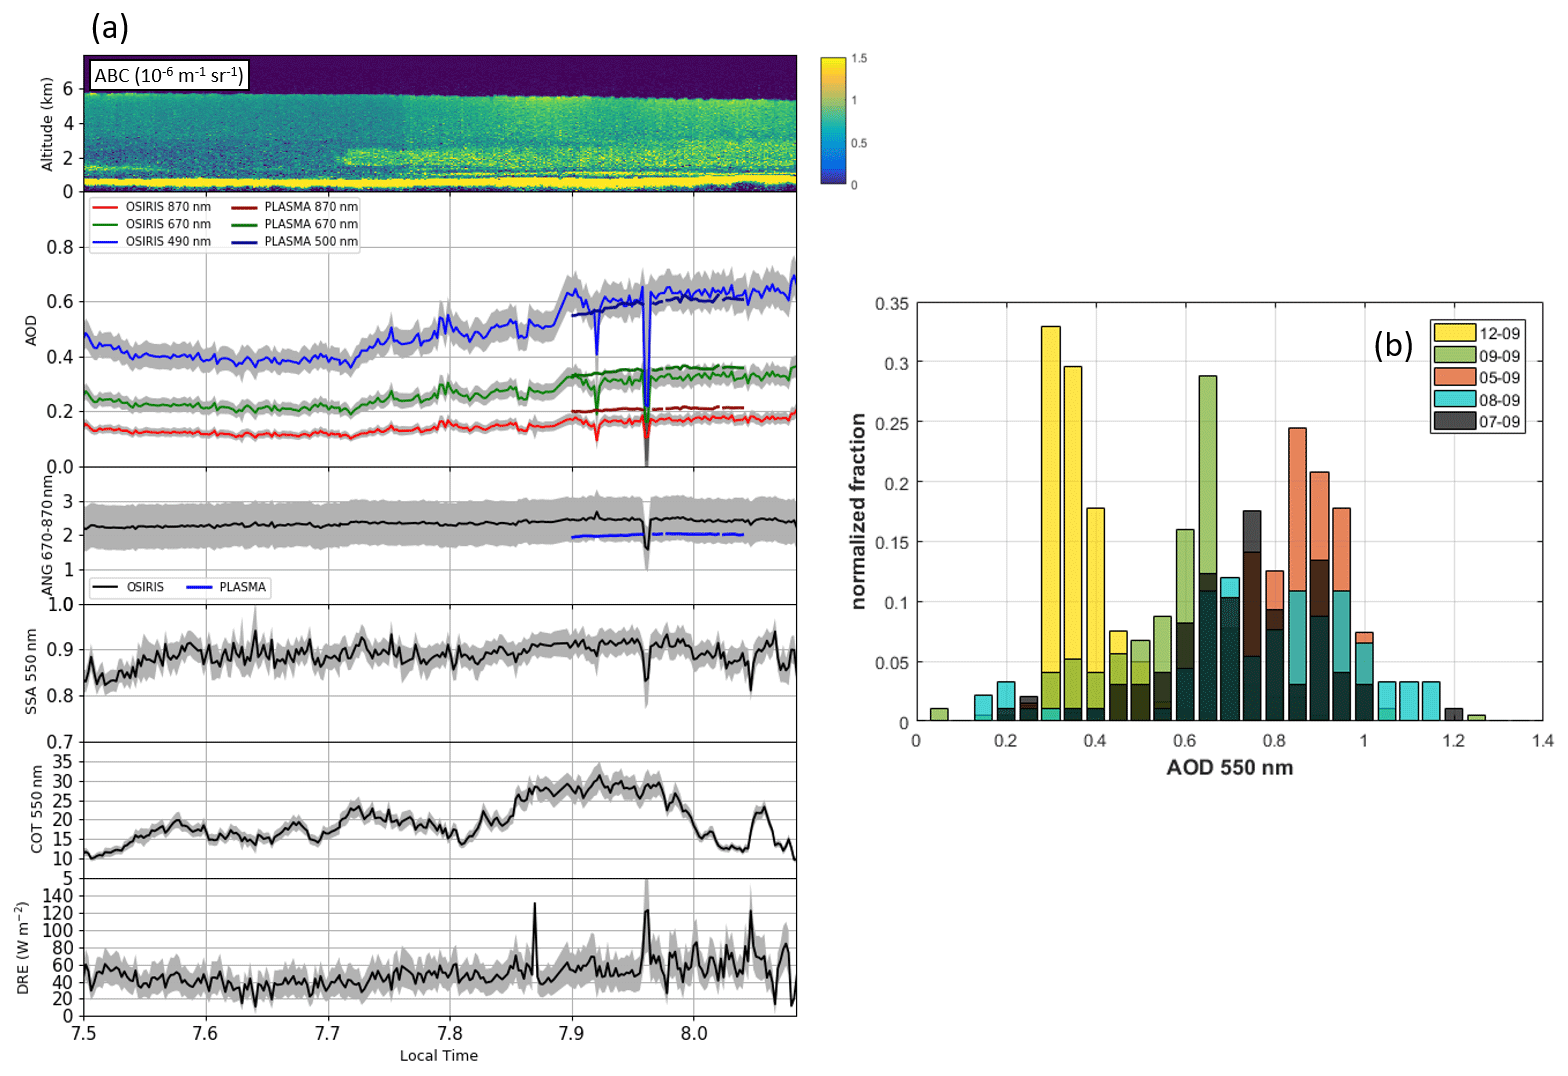
Figure 7(a) Time series of the ABC profiles measured at 1064 nm by the lidar LNG, above-cloud AODs, Ångström exponents (670–870 nm), aerosol SSA, cloud optical depth and direct radiative effect estimated on 12 September 2017, and associated errors. (b) AOD histograms from OSIRIS measurements for the five selected flights.
Figure 7a shows a time series of the OSIRIS above-cloud AOD at 490, 670, and 870 nm on 12 September 2017. The grey zones correspond to the OSIRIS retrieval uncertainty (as described in Appendices A and B). The 40 min slot represents a transect of about 400 km along the coastline (in yellow Fig. 1a) with a northbound heading. A slight variability is observed in the AOD with a south–north gradient. A total of 30 min after the segment at high altitude, the collocated observations from PLASMA2 at low altitude are consistent with OSIRIS, with the AOD from PLASMA2 being larger by 10 % compared to OSIRIS. Again, the low bias in the OSIRIS AOD retrievals (at 870 nm) is likely due to the presence of a few coarse-mode particles, as previously discussed. Parallel measurements of the airborne lidar LNG demonstrate the small spatial variability observed on 12 September, with the homogeneous distribution of aerosols in the troposphere and low aerosol signal for the region and the season.
Figure 7b shows a histogram of the above-cloud AOD from OSIRIS at 550 nm for each flight of the campaign. The retrieved AODs range from 0.2 to 1.2. The mean AOD depends on the flight, with a maximum of 0.94 on 8 September and a minimum of 0.39 on 12 September. The 5, 7, and 9 September have a mean AOD values of 0.86, 0.73, and 0.60, respectively. These high AODs are consistent with the large values typically observed close to the coast by satellites (0.6 at 550 nm; Peers et al., 2016) and aircraft polarimeter measurements in the southeastern Atlantic (around 0.75 at 550 nm; Pistone et al., 2019).
4.2 Ångström exponent and particle size distribution
Aerosol size can have a significant impact on DRE calculation since it mainly controls the spectral dependency of the aerosol optical thickness. The Ångström exponent is a parameter primarily indicative of the particles size. The Ångström exponent retrieved with OSIRIS is evaluated against PLASMA measurements and particles size retrievals in this section.
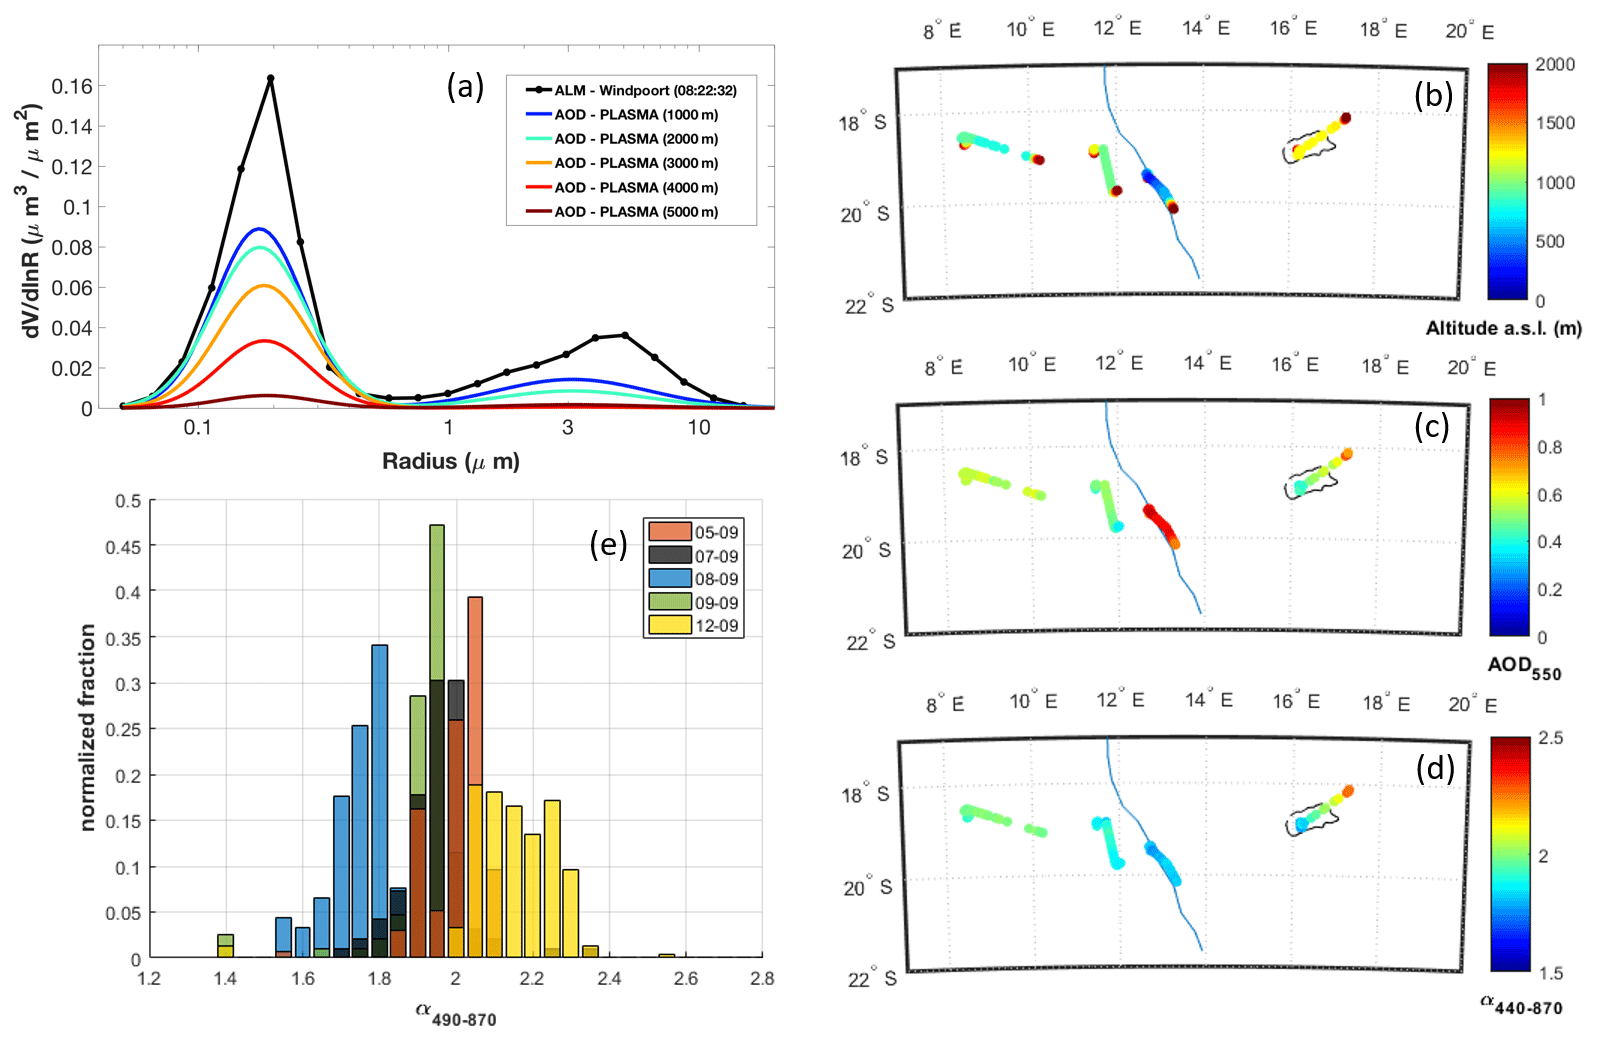
Figure 8(a) Retrieved volume particle size distributions at different altitudes from PLASMA2 measurements and from the AERONET station at Windpoort, Namibia, for the descent in the loop on 7 September 2017. Flight altitude (b), AOD (c), and Ångström exponent (d) measured by PLASMA2 during AEROCLO-sA. The black line corresponds to the Etosha Pan. Only low-altitude flights are presented. (e) Extinction Ångström exponent from OSIRIS measurements histograms for the five selected flights.
Figure 8a describes the volume particle size distributions retrieved from PLASMA2 measurements at different altitudes during the descent in the loop on 7 September 2017. The AERONET particle size retrievals from the Windpoort station are also shown. The size distribution is generally characterized by a dominant fine mode between 500 and 5000 m. This is consistent with the dominant fine mode typically observed in previous studies at an altitude of 1 to 6 km in this region (Toledano et al., 2007; Russell et al., 2010; Kumar et al., 2013). Measurements show a rather constant fine–coarse-mode ratio within the aerosol plume. For the descent in the loop over cloud on 7 September 2017, fine-mode particles contributed to 97 % of the total AOD at 670 nm between 1000 and 4000 m. The mean Ångström exponent value obtained from PLASMA2 measurements is about 1.9, with an accuracy of 0.1. According to AERONET measurements, during the campaign period, the number of coarse-mode particles is also extremely weak and does not exceed 5 % of the columnar AOD (Fig. 4). The smallest particles (Ångström exponent larger than 2) are generally observed in the northern part of the Namibian region (Fig. 4).
Figure 8b, c, and d show the altitude, the AOD, and the extinction Ångström exponent measured by PLASMA2 for straight levelled runs below 2000 m a.s.l. The second flight, on 12 September, over the Etosha Pan (black line) presents a strong AOD gradient between 0.30 and 0.82 and a strong Ångström exponent gradient between 1.55 and 2.27, which is not correlated to altitude variations. During this specific flight, the measurements over the Etosha Pan were performed at around 1300 m a.s.l. The Etosha Pan is the main source of dust emissions in this region, and it is characterized by an extremely dry surface at this time of year. In these conditions, the particle size distribution retrieved by PLASMA2 over the southwestern part of the flight path over the Etosha Pan is characterized by a significant additional contribution of coarse-mode particles (). Toward the northeastern part of the flight path, the aerosol properties retrieved by PLASMA2 are less influenced by the dust emissions from the pan and are more representative of the properties of fine-mode particles from biomass burning ().
The values of Ångström exponents retrieved above the clouds from OSIRIS and PLASMA2 are around 2.0±0.2. In agreement with the PLASMA2 analysis, the α490−870 histogram shown in Fig. 8e indicates different aerosol types. The maximum α490−870 is observed on 12 September (median of 2.15) and the minimum on 8 September (median of 1.75). α670−870 values are generally constant during every flight, as in the case on 12 September (Fig. 7a). The lowest α490−870 values, around 1.7, are found less than 50 km away from the Namibian coast and were observed during the flight on 8 September. This behaviour might be explained by the influence of dust particles generated on the continent with higher coarse-mode particle fraction. The hygroscopic growth of biomass burning particles potentially occurring during their transport over the ocean might also explain the differences observed in the aerosol optical properties from one flight to another. The aerosols observed on 5 September were directly transported from central Africa without a long transport over the Atlantic Ocean (Fig. 2b). This specific circulation might explain the higher α490−870 (mean of 2.00) observed above the clouds during this flight, which indicates smaller particles than the ones observed, for instance, on 8 September. These changes in the fine-mode size are also suggested from the analysis of the volume of fine-mode properties obtained from PLASMA2 inversions. Lower values of the volume mean radius of the fine-mode particles are retrieved on 5 and 12 September (rv=0.18 and 0.15 µm, respectively) rather than on 8 September (rv=0.20 µm).
AERONET Ångström exponents are around 5 % lower than PLASMA2 measurements and between 8 % and 25 % lower than OSIRIS inversions (Table 1). The bias between AERONET and OSIRIS Ångström exponents can mainly be explained by the presence of coarse-mode particles that are not explicitly considered in the POLDER algorithm when biomass burning layers are detected above the clouds (Waquet et al., 2013a). This is particularly observed for the flight on 12 September due to a slightly less dominant fine mode compared to other flights (i.e. mean fine-mode fraction of 90 % on 12 September instead of 95 % on average for the field campaign). This neglected coarse mode could also explain why OSIRIS slightly underestimated AOD compared to PLASMA 2 on 12 September (Fig. 7a).
4.3 Complex refractive index and single scattering albedo
The SSA is one of the three most important parameters influencing aerosol DRE calculation with the above-cloud AOD and the cloud albedo (Peers et al., 2015). The retrieval of this parameter is still subject to large uncertainties in this region (Peers et al., 2016; Pistone et al., 2019). The retrieval of the SSA from passive remote sensing techniques depends on the microphysical assumption. This parameter is primarily driven by the aerosol absorption (i.e. imaginary part of the complex refractive index) and, to a lesser extent, by the particles size. The analysis of AERONET measurements over the biomass burning period also provides us with a spatially distributed view of the aerosol complex refractive index and SSA. Values of SSA at 675 nm (hereafter SSA675) are generally spatially homogeneous over land, with a mean value of 0.85 (25th and 75th percentiles of 0.84 and 0.86, respectively). The highest SSA675 is observed at the Namibe station (Fig. 4), with a mean value of 0.87, while the lowest values are observed at the Bonanza and Mongu Inn stations (mean SSA675 of 0.82). In correspondence, a mean refractive index of 1.51+0.027i at 675 nm is retrieved. The real part of the refractive index at 675 nm ranges from 1.41 at Henties Bay to 1.54 at Bonanza, and the imaginary part at 675 nm ranges from 0.008 at Henties Bay to 0.032 at Bonanza. The known environmental characteristics of Henties Bay, a coastal site with high content of sea salt and sulfate aerosols, frequent fog, and a persistent and elevated relative humidity (Formenti et al., 2019; Klopper et al., 2020), support the low values of the real and imaginary refractive indices. Figure 4 also shows different behaviours of the spectral variation in the imaginary part of the refractive index k in the southeastern region. k441 is higher than k675 (up to 43 %) on the northern part of the region and lower (up to 10 %) on the southern part of the region. The largest ratio between k441 and k675 is observed at the Namibe station, with k441 higher than k675 by more than 40 %.
The SSA of AAC can also be observed from OSIRIS inversions for the entire AEROCLO-sA flight campaign. Figure 9a shows the SSA box plots of each analysed AEROCLO-sA flight. Results show the absorbing property in this region, with a mean SSA of 0.87 at 550 nm for the full campaign. SSA values below 0.82 at 550 nm can be considered as outliers in our study. The highest and lowest absorption (and conversely the lowest and highest SSA) are retrieved, respectively, on 9 September (mean SSA of 0.86 at 550 nm) and on 5 September (mean SSA of 0.89 at 550 nm). This low variation in the measured particles absorption suggests rather uniform sources of biomass burning aerosol (BBA) emissions during the AEROCLO-sA campaign timescale.
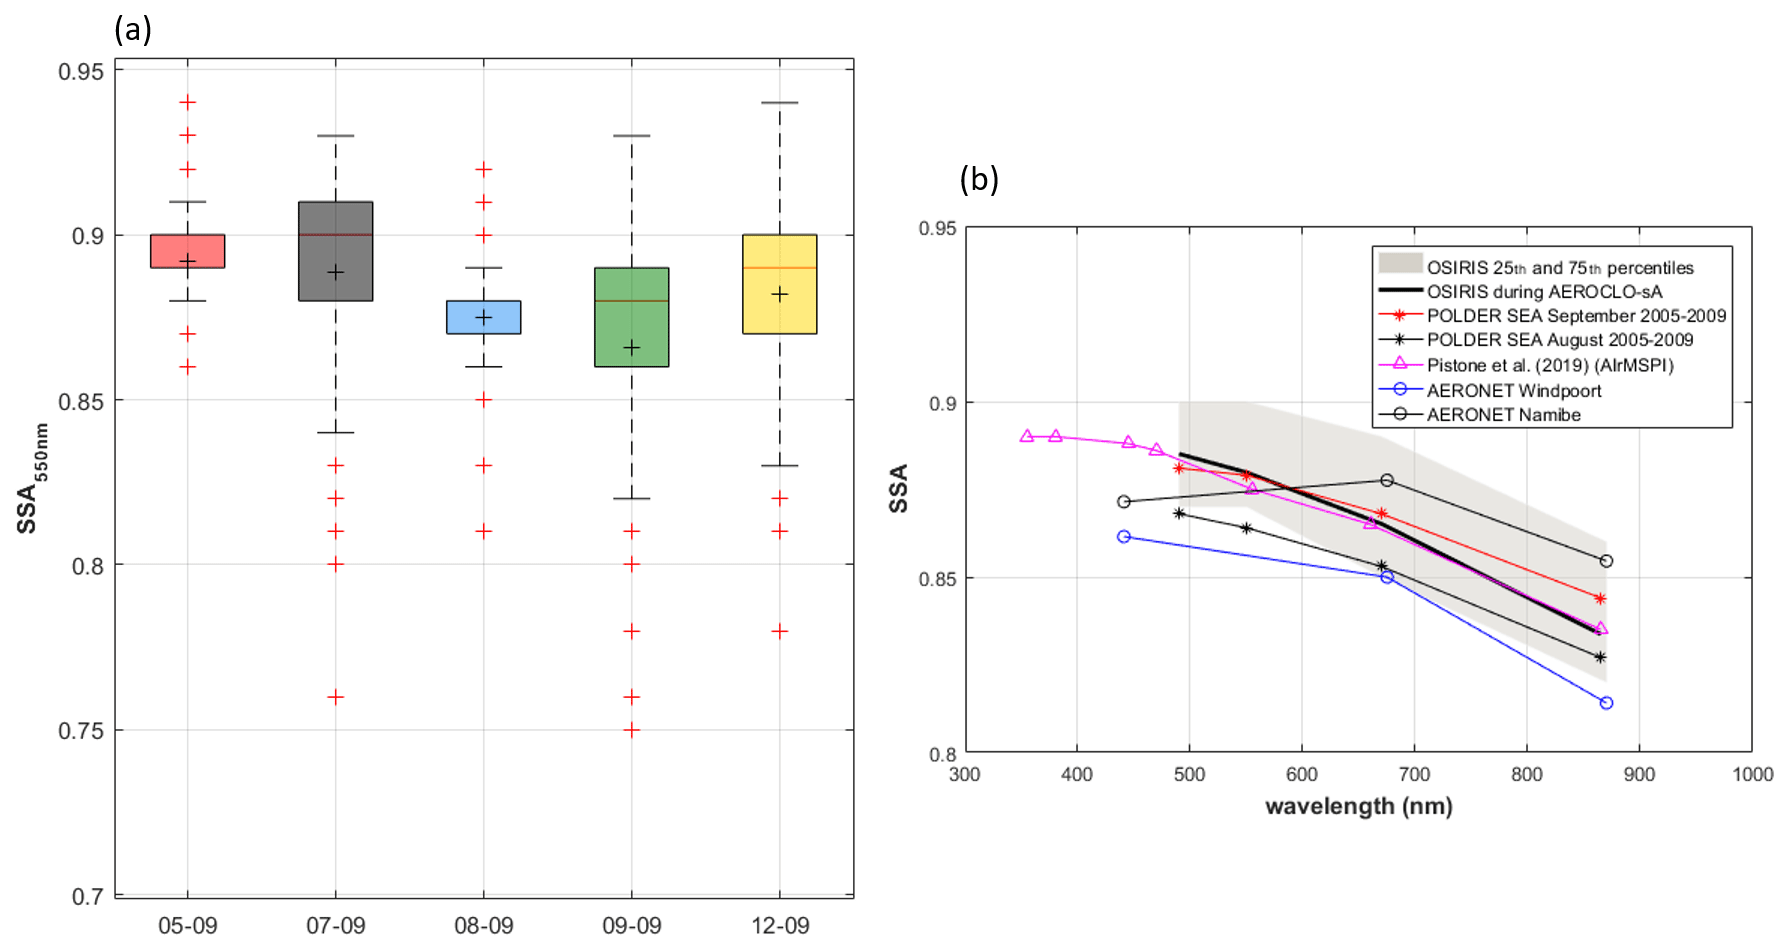
Figure 9Box plot of the SSA from OSIRIS measurements at 550 nm for the five selected flights and mean wavelength dependency retrieved from OSIRIS, Windpoort, and Namibe AERONET sites during the AEROCLO-sA campaign and AirMSPI during the ORACLES campaign in 2016 and POLDER between 2005 and 2009 during the fire season.
Figure 9b compares the spectral variation in the SSA from OSIRIS during the full campaign to various complementary measurements, namely the concurrent ground-based AERONET at the Windpoort and Namibe sites, the retrievals of the airborne imager AirMSPI during ORACLES 2016 (Pistone et al., 2019), and the mean POLDER retrievals above the clouds for the southeastern region from 2005 to 2009 during the fire season (Peers et al., 2016). The SSA from OSIRIS is less than 1 % different from the ORACLES 2016 AirMSPI observations. Both measurements are consistent with the multi-year average SSA from POLDER during the biomass burning period (less than 2 % difference), as expected, as these estimates are all based on polarimetric measurements. A higher bias (about 3 %) compared to OSIRIS inversion is observed with AERONET retrievals at Windpoort, where the SSA is lower, irrespective of the wavelength. On the other hand, the measurements at the Namibe AERONET station are consistent with our retrievals at 670 nm but not at 440 nm, where the SSA is significantly lower. This trend does not appear in the ORACLES measurements from AirMSPI, which were performed farther from the coast over the ocean. According to Kirchstetter et al. (2004), a decrease i the SSA at 440 nm can be partly explained by the presence of light-absorbing organic carbon (brown carbon). Unlike at the Namibe site, the SSA at Windpoort, located farther from the fire sources, was generally found to decrease from 440 to 875 nm.

Figure 10Column water vapour in a function of AOD at 550 nm, both measured by the PLASMA2 sun photometer during the AEROCLO-sA campaign.
4.4 Integrated water content
The biomass burning aerosol layers transported in the studied region are typically accompanied by water vapour, with potential significant effects on the radiative budget (Deaconu et al., 2019). It is, therefore, necessary to consider the contribution of water vapour in our study in order to establish an accurate estimate of the aerosol DRE and related uncertainties. The integrated water vapour can be derived from the PLASMA extinction measurements performed at 940 nm (Halthore et al., 1997). In Fig. 10, one can note, in general, a linear relationship between the water vapour content and the AOD at 550 nm from PLASMA2, especially for the higher range of water vapour concentration. The highest column concentrations of water vapour (up to 2.4 g cm−2) are observed for the two flights of 8 September. This correlation could be explained by the meteorological conditions, which would be responsible for the simultaneous transport of aerosols and water vapour, as suggested by previous studies (Adebiyi et al., 2015; Deaconu et al., 2019). This correlation might also be the result of the direct emissions of water vapour due to the fires themselves (Betts and Silva Dias, 2010; Sena et al., 2013). The water vapour amount is quite variable from one flight to another and varies between 0.7 and 2.7 g cm−2. We estimated the mean water vapour amount to be equal to 1.7 g cm−2 for the AAC scenes sampled during AEROCLO-sA. Note that dropsonde measurements were used to supplement the PLASMA2 data in order to estimate the amount of water vapour within the cloud layer. Finally, one can note that there is no correlation, for the second flight of 12 September, between AODs and water vapour measurements. A low water vapour amount (below 1 g cm−2) and high AOD values (>0.7) were observed together for this flight. We do not have a full explanation for this contradictory observation. These observations were obtained for an in-land location (Etosha Pan), and we assume that this area could be associated with drier air masses than the ones sampled over the oceanic regions. Based on aircraft measurements and model simulations in the southeastern Atlantic region, a recent study demonstrates that the water vapour concentration, which is linearly correlated with CO concentration, may not originate from biomass burning (BB) emissions (Pistone et al., 2021). Hence, the meteorology seems to mainly drive the amount of water vapour in the atmosphere in this region.
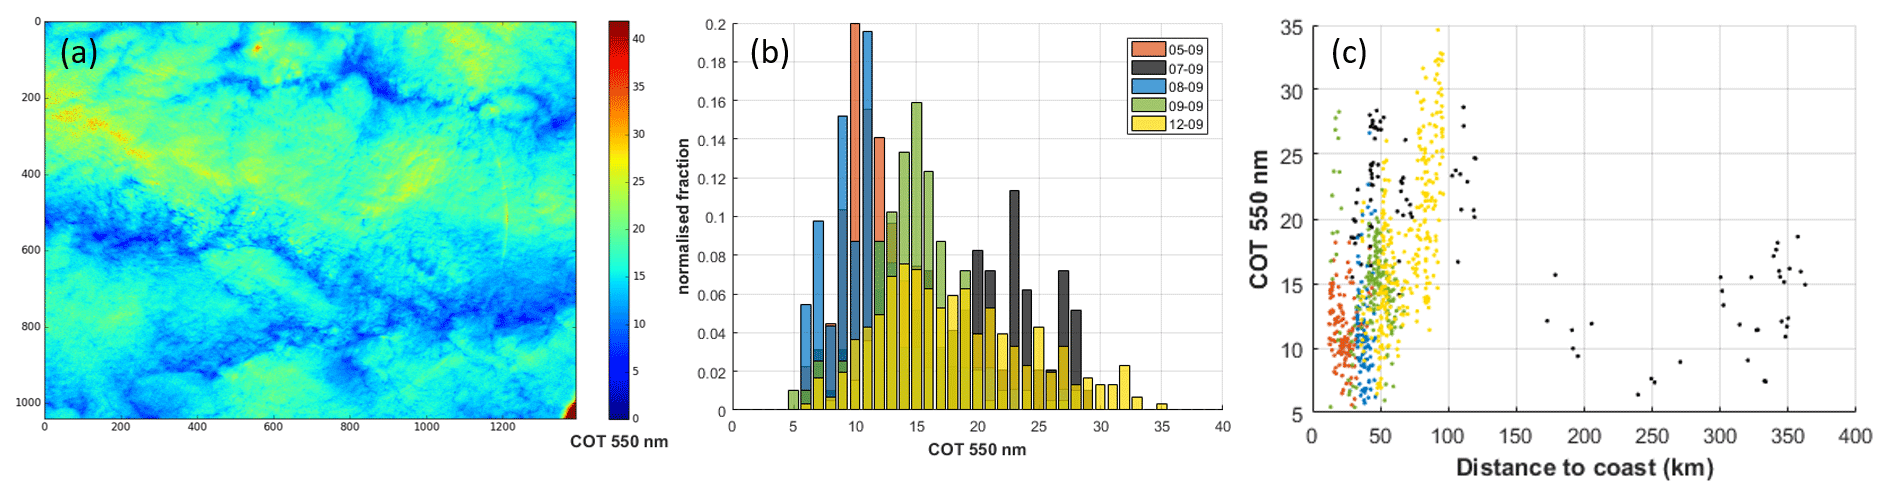
Figure 11(a) Full OSIRIS image cloud optical depth at 550 nm retrieved on 7 September at 09:37 UTC from OSIRIS measurements. (b) COT histogram for the five selected flights. (c) Relation between COT and the distance from the measurement to the coastline.
4.5 Cloud properties
The OSIRIS measurements also provide us with the optical properties of clouds with a high spatial resolution. For each pixel of the OSIRIS CCD matrix, the COT can be retrieved at a spatial resolution reaching 20 m for a flight altitude around 10 000 m a.s.l. Figure 11a shows a retrieved field of COT on 7 September, at 09:37 UTC, at the top of the first ascent of the flight close to the coast. COT values at 550 nm range from 5 to 30, with a mean value of 16.
To analyse the full AEROCLO-sA data set, we chose to select the central pixel of every OSIRIS CCD matrix. This selection allows us to remove the scene details of each OSIRIS measurement and is well representative of the COT distribution in the region. As all the flights were performed between 08:00 and 11:00 local time, measurements refer to similar atmospheric thermodynamics and sun conditions. Figure 11b shows the distribution of COT values at 550 nm for the whole campaign. The COT at 550 nm ranges from 5 to 35. On 5 and 8 September, a mean COT of 12 is obtained while the mean COT is 15 on 9 September and 19 on 7 and 12 September. Particularly high values are observed on 7 and 12 September. As shown in Fig. 11c, COT can be related to the distance from the coastline. An increase from 10 to 30 is observed from the Namibian coast up to 100 km off the coast. On 7 September, measurements were performed up to 350 km away from the coastline. For this flight, a maximum value of COT is observed around 100 km away from the coast, and then the COT decreases down to 10 at around 250 km. It was noted, during the field campaign, that the clouds were generally optically less thick in the vicinity of the Namibian coast and more difficult to forecast.
4.6 Direct radiative effect
The direct radiative effect (DRE) calculations are performed over the solar spectrum (0.2–4 µm) with the radiative transfer code GAME (Global Atmospheric Model; Dubuisson et al., 1996). The DRE calculations are performed online and are based on OSIRIS retrievals performed in the visible and near-infrared spectral bands. The DRE for AACs is primarily driven by the (spectral) AOT, SSA, and cloud albedo, with this latter parameter being mainly controlled by the COT. The AAC DRE increases with increasing AOT and COT and decreasing SSA (or increasing aerosol absorption). To a lesser extent, the AAC DRE also depends on the water vapour and cloud droplet size. Increasing the amount of water vapour in the atmosphere tends to reduce the upwelling fluxes computed at the top of the atmosphere and, consequently, the DRE. Reducing the cloud droplets effective radius increases the cloud albedo, which increases the DRE. Our DRE uncertainty budget is based on the observational uncertainty previously determined for each aerosol parameter. Based on the comparisons made between OSIRIS and PLASMA, we estimated the uncertainties on the AOT and Ångström exponent for the BBAs lofted above the clouds to be, respectively, equal to 10 % of the AOT at 550 nm and 0.2 (for an Ångström exponent computed between 670 and 865 nm). For the spectral SSA of the BBA, we considered a relative uncertainty of 5 %, which encompasses the departures observed between the different airborne and spaceborne retrievals of this parameter (see Fig. 9). Considering the time period and location, a midlatitude summer model was assumed to model the vertical profiles of the thermodynamical quantities (McClatchey, 1972). The total amount of columnar water vapour was fixed to a value of 1.7 g cm−2. We assume an error of ±1 g cm−2 in accordance with the PLASMA observations for this quantity. We assumed a cloud droplets effective radius of 10 µm and perturbated this quantity by 2 µm in the calculations for the DRE uncertainty (see Appendix B).

Figure 12DRE histogram retrieved from OSIRIS's aerosol and cloud retrievals for the five selected flights. Circles and error bars correspond to mean DRE and calculated DRE uncertainties following the description in Appendix B.
The distribution of the observation-based, instantaneous, and 1D AAC DRE in the solar spectrum from OSIRIS measurements is shown in Fig. 12 for every flight during AEROCLO-sA. Calculations show positive DRE, which is in agreement with above-cloud observations from Zhang et al. (2016) in regions influenced by biomass burning emissions. Keil and Haywood (2003) also estimated a mean value of above-cloud DRE of +11.5 W m−2 above the clouds and of −13 W m−2 in clear-sky conditions (mean SSA of 0.90 at 550 nm).
The above-cloud instantaneous DRE obtained from OSIRIS measurements ranges from +10 to +190 W m−2, with mean values between +65 W m−2 on 12 September and +106 W m−2 on 7 September. The mean DRE for the full campaign is +85 W m−2, with a mean DRE uncertainty of 24 W m−2. These mean DRE are higher than previous retrievals in the region. De Graaf et al. (2019, 2020) and Peers et al. (2015) retrieved a mean DRE around +40 W m−2 from combined estimates made from satellite retrievals based on POLDER and SCIAMACHY sensors. In these previous studies, the region of interest was larger (10∘ N–20∘ S, 10∘ W–20∘ E) than the one covered during the AEROCLO-sA aircraft campaign, and these previous works may have included lower local values of DRE observed in the western part of the region.
These differences can be also explained by sampling issues due to the differences in the spatial resolution of the satellite and airborne sensors. Spatial resolution used by observations also have significant impacts on the retrievals of cloud properties and, consequently, the estimate of the AAC DRE (de Graaf et al., 2020). The so-called plane parallel bias arises due to cloud subpixel heterogeneities and to the nonlinear relationship of the radiance on the cloud optical thickness. For a coarse satellite data resolution (>1 km2), the known result is a low bias in the cloud optical thickness that increases as the spatial resolution of the sensor increases (Davis et al., 1997). This effect is necessarily reflected in an underestimation of the AAC DRE. For the spaceborne radiometers POLDER and SCIAMACHY, the resolutions are, respectively, 6×6 km2 and 60×30 km2. This likely explains why the POLDER DRE was estimated as being higher than the ones retrieved from SCIAMACHY (de Graaf et al., 2020). The cloud fraction can also be overestimated for coarse-resolution satellite data, since the subpixel variability in the cloud properties cannot be sampled (Loeb and Davies, 1996; Di Girolamo and Davies, 1997). This effect also leads to lower estimates of cloud albedo and AAC DRE. We recall that the cloud optical thicknesses retrieved with OSIRIS were performed at a high spatial resolution (20×20 m2) and often associated with full cloudy scenes at the scale of the OSIRIS image (20×20 km2). Altogether, these differences in the data sampling explain why the OSIRIS AAC DRE are larger than previous satellite-based estimates performed for this region.
The exceptional atmospheric conditions sampled during the flights also largely explain why these retrieved high DRE values. The high local DRE values observed during AEROCLO-sA are linked to the strong absorption properties and high aerosol loading typically measured during the field campaign. As demonstrated by Cochrane et al. (2019), based on the ORACLES campaigns in 2016 and 2017, the DRE also strongly depends on the cloud scene, particularly on the cloud albedo and cloud fraction. The stratocumulus cloud observed during AEROCLO-sA were generally optically thick ( at 550 nm) and associated with a geometrical cloud fraction of 1 at the scale of the OSIRIS image. For instance, despite the moderate aerosol loading observed on 7 September (mean AOD of 0.73 at 550 nm), the combination of absorbing particles and high cloud albedo (mean COT of 19 at 550 nm) led to the largest local DRE being measured during the AEROCLO-sA field campaign ( on average). The relatively low aerosol loading observed on 12 September (AOD of 0.12–0.18 at 865 nm) is still associated with significant values of DRE ( W m−2 on average), mainly because of the high COT (20–30 at 550 nm) retrieved on 12 September.
A new data set of cloud and above-cloud aerosol properties allows us to retrieve local AAC DRE in the southeastern Atlantic region, where important biases persist between climate models for both the amplitude and the sign of the aerosol radiative perturbation. The detailed characterization of the atmospheric particles content achieved from the polarimetric imager OSIRIS allowed us to study the sensitivity of the local radiative budget to the main optical aerosol and cloud parameters.
Measurements were acquired during the AEROCLO-sA campaign over Namibia, during the biomass burning period of 2017, by the OSIRIS radiometer deployed during 10 scientific flights from 5 to 12 September 2017. A total of five flights are selected for OSIRIS analyses presenting stable cloud conditions. Aerosol and cloud properties at a 20 m horizontal resolution, with well-quantified uncertainties, were retrieved from radiometric observations.
Measurements were performed in the highest range of retrieved AOD observed in this region and above a semi-permanent stratocumulus cloud deck. The high aerosol load (above-cloud AOD around 0.7 at 550 nm) retrieved from OSIRIS measurements matches the direct AOD measurements of the airborne sun photometer PLASMA2 within 0.05, or within 10 % in relative units, which contributes to validating the application of AAC algorithms developed for POLDER (Waquet et al., 2020). Consistent (visible, near-infrared) Ångström exponents values are retrieved from OSIRIS, with values varying between 1.6 and 2.2, which is typical of BB aerosols that are typically associated with submicronic particles. The PLASMA sun-photometer-based retrievals suggest that changes in the fine-mode particles size distribution are responsible for this variation in the Ångström exponent. Ground-based AERONET measurements on the continent generally show slightly lower values of the Ångström exponent (close to 1.7 on average), which is likely due to the presence of additional coarse particles located in the boundary layer.
Biomass burning aerosols transported over the southeastern Atlantic Ocean represent a high absorbing effect, which significantly impacts the direct radiative effect. Mean above-cloud SSA of 0.87 at 550 nm were obtained from OSIRIS measurements. The SSA estimate is in excellent agreement with previous (NASA) airborne and (CNES – Centre national d'études spatiales) spaceborne polarimetric retrievals performed over the same region (Peers et al., 2015; Pistone et al., 2019), giving more confidence to the retrieval of this key parameter. Rather constant aerosol absorbing properties were observed in the Namibian region during the campaign in the visible range of OSIRIS. This suggests that the BBA aerosols sampled were associated with rather homogenous sources, at least at the timescale of the AEROCLO-sA airborne campaign. AERONET retrievals indicate an increase in the aerosol absorption at 440 nm over some specific sites, closer to the northern part of Namibia, which were largely dominated by the contribution of fine-mode particles, indicating the presence of BBA aerosols. This result indicates a non-negligible concentration of UV light-absorbing organic matter (brown carbon) within the plumes, at least for the areas located closer to the fire regions.
As already noted by previous studies (Deaconu et al., 2019; Pistone et al., 2019), water vapour concentration and aerosol loading estimated above the clouds are generally correlated in this region. These observations are confirmed by the sun photometer measurements performed by the airborne PLASMA. So, our observations do not contradict previous studies, indicating that both BBA aerosols and water vapour have to be considered together to investigate the total radiative impacts of smoke plume.
A significant part of climate uncertainty in the southeastern Atlantic region is also explained by the lack of measurements of stratocumulus cloud properties. The characteristics of the airborne imager OSIRIS give the opportunity to retrieve cloud properties with a high spatial resolution. During the AEROCLO-sA campaign, a mean COT of 10 at 550 nm was observed. Measurements up to 350 km off the coastline allow us to probe stratocumulus properties in different conditions. Results showed that a maximum COT of 30 was reached at 100 km off the coastline. As a result of the elevated above-cloud AODs, the strong absorption by aerosols, and the high cloud albedo, significant positive instantaneous aerosol direct radiative effects in the solar spectrum were observed close to the Namibian coast. The mean AEROCLO-sA instantaneous DRE value is +85 W m−2 for AAC with mean uncertainties of ±24 W m−2. We performed a detailed error budget for the DRE. Errors for the aerosol parameters (AOT, Ångström exponent, and SSA) were controlled, based on comparisons of data from various sensors. This approach allowed a realistic calculation of the DRE uncertainties. This error budget also accounts for the variability observed in the water vapour during the flights and the potential changes in the cloud particle microphysics. Our DRE estimates agree with previous studies indicating a strong positive aerosol forcing over the region (de Graaf et al., 2020). Obtained DRE is generally higher than previous satellites ones, mainly because of the exceptional atmospheric conditions encountered during the flight (i.e. combination of high-absorbing aerosol loads with high cloud albedo). As compared to previous satellite and modelled DRE obtained in the region, the airborne polarimeter used in the present study demonstrates high accuracy on the retrieved above-cloud AOD, the absorption property, and the COT in the visible near-infrared domain. These well-defined aerosol and cloud properties have to be considered for the evaluation of the ability of models and satellites to locally reproduce high instantaneous DRE.
In conclusion, the airborne 3MI measurements in the region allow us to obtain aerosol and cloud properties with well-characterized uncertainties and their sensitivity to AAC DRE. Such findings are valuable for constraining climate models and also for evaluating satellite retrievals as future 3MI measurements (Marbach et al., 2015). The high spatial resolutions, offered by the airborne polarimeter OSIRIS, will allow us to accurately estimate the DRE and the cloud properties and variability within regional model grids. A spectral extension of the OSIRIS algorithm will incorporate additional UV data from the airborne MICROwavelength POLarimeter (MICROPOL), also operated on the SAFIRE Falcon 20 during AEROCLO-sA, and additional spectral bands in the middle infrared (up to 2.2 µm). These will benefit the characterization of the spectral absorption of the aerosol, linked to their chemical composition, and the retrieval of the cloud microphysics, which is crucial for the study of aerosol and cloud interactions. Lidar LNG profiles combined with OSIRIS data will allow us to further evaluate the heating rate profiles of AACs and to study the cases of interaction when aerosol and clouds are in contact at the cloud top. Further investigation based on the combination of this new set of observations and regional models, as described in Formenti et al. (2019), will be of great interest for such studies led in the SEA region.
The optimal estimation method (OEM) provides an error diagnostic of the retrieved parameters (Waquet et al., 2009). The square roots of the diagonal elements of the error retrieval covariance matrix Cx give the standard deviation associated with the retrieved parameters contained in the vector X. The OEM can also be used to estimate the standard deviation for other parameters that are not included in this vector. For instance, for the SSA, the equation is given by the following:
where the N retrieved parameters contained in the vector X are the aerosol optical thickness, the imaginary part of the particles complex refractive index (aerosol absorption), the particles mean geometric radius, and the cloud optical thickness.
For the DRE, the standard deviation is computed with the equation given by the following:
where correspond to the standard deviation associated with the parameters that control the DRE. The terms related to aerosol properties were estimated based on observations to provide a more realistic error budget for the DRE. We considered a standard deviation of 10 % to perturb the DRE calculations for the AOT at 550 nm (in a relative value), a standard deviation of 0.005 for the aerosol absorption, and a standard deviation of 0.02 µm for the particle's radius, corresponding to errors of 5 % for the visible near-infrared SSA and 0.2 for the Ångström exponent computed between 670 and 865 nm, respectively. Additional error terms were also added to account for the variability in the water vapour amount (standard deviation of 1 g cm−2) and for the cloud droplet effective radius (standard deviation of 2 µm). These last two errors terms were assumed uncorrelated and added to the single sum term appearing in the equation above.
We thank the AERONET principal investigators (PIs) Brent Holben, Jens Redemann, Carlos Ribeiro, Nichola Knox, Stuart Piketh, and their staff for establishing and maintaining the AERONET sites used in this investigation.
The AEROCLO-sA data are available from the BAOBAB platform at https://baobab.sedoo.fr/AEROCLO/ (last access: 11 May 2021) and are maintained by the French national data centre Data Terra/AERIS. In particular, the data sets used in this paper are OSIRIS (https://doi.org/10.6096/AEROCLO.1802; Waquet and Chauvigné, 2019), LNG (https://doi.org/10.6096/AEROCLO.1774; Flamant, 2018), and PLASMA2 (https://doi.org/10.6096/AEROCLO.1807; Blarel, 2020).
CAMS reanalysis data are available from the Copernicus Atmosphere Data Store, https://ads.atmosphere.copernicus.eu/#!/home (last access: 11 May 2021). Maps displaying the synoptic evolution of biomass burning aerosol optical depth at 550 nm over southern Africa and the southern Atlantic during the AEROCLO-sA campaign are available at https://baobab.sedoo.fr/Data-Search/?datsId=1782&project_name=AEROCLO (last access: 11 May 2021; Gaetani, 2019).
Above-cloud POLDER data, called the AERO-AC products, are available from the ICARE website at https://www.icare.univ-lille.fr/aero-ac/ (last access: 11 May 2021).
Algorithms used for OSIRIS inversions are based on the AERO-AC code available from the ICARE website at https://www.icare.univ-lille.fr/aero-ac/ (last access: 26 May 2021).
AC performed the simulations and analyses of the airborne and AERONET data and wrote the paper under the supervision of FW. PF, FW, CF, and MM, designed the original AEROCLO-sA observational concept and co-led the 5-year investigation. FA, LB, CD, RL, and JMN developed, calibrated, and did the high-quality measurements of the OSIRIS instrument during the campaign. LB did the PLASMA2 calibration, settings, and data processing. CD did PLASMA2 measurements during the campaign. FW and FaP developed the POLDER algorithms. PG and FrP co-led the development of the OSIRIS and PLASMA2 instruments. OD and BT developed and allowed access to the GRASP algorithm. MG analysed the CAMS reanalysis data. CF provided LNG extinction profiles. Every co-author contributed to the scientific analysis and to the writing of the paper.
Paola Formenti is the guest editor of the Atmospheric Chemistry and Physics Special Issue “New observations and related modelling studies of the aerosol–cloud–climate system in the Southeast Atlantic and southern Africa regions (ACP/AMT inter-journal SI)”. The remaining authors declare that they have no conflicts of interests.
This article is part of the special issue “New observations and related modelling studies of the aerosol–cloud–climate system in the Southeast Atlantic and southern Africa regions (ACP/AMT inter-journal SI)”. It is not associated with a conference.
Airborne data were obtained using the aircraft managed by SAFIRE (http://www.safire.fr, last access: 11 May 2021), the French facility for airborne research, and infrastructure of the French National Centre for Scientific Research (CNRS), Météo-France, and the French National Centre for Space Studies (CNES). The AEROCLO-sA database is maintained by the French national data centre for atmospheric data and services, AERIS. The strong diplomatic assistance of the French Embassy in Namibia, the administrative support of the Service Partnership and Valorisation of the Regional Delegation of the Paris–Villejuif region of the CNRS, and the cooperation of the Namibian National Commission on Research, Science, and Technology (NCRST) were invaluable in making the project happen.
The AEROCLO-sA project has been supported by the French National Research Agency (grant no. ANR-15-CE01-0014-01), the French national program LEFE/INSU, the Programme national de Télédetection Spatiale (PNTS; http://www.insu.cnrs.fr/pnts, last access: 11 May 2021; grant no. PNTS-2016-14), the French National Agency for Space Studies (CNES), and the South African National Research Foundation (NRF; grant no. 105958). The research leading to these results has received funding from the European Union's Seventh Framework Programme (FP7/2014-2018) under the EUFAR2 (grant no. 312609). Aurélien Chauvigné and Fabien Waquet acknowledge the additional financial support provided by the Programme national de Télédétection Spatial (PNTS; grant no. PNTST-2020-06). Fabien Waquet also acknowledges support from the CaPPA project (Chemical and Physical Properties of the Atmosphere), which is funded by the French National Research Agency (ANR) through the PIA (Programme d'Investissement d'Avenir; grant 80 no. ANR-11-LABX-0005-01) and by the Conseil Régional Hauts-de-France and the European Funds for Regional Economic Development (FEDER).
This paper was edited by Matthias Tesche and reviewed by two anonymous referees.
Adebiyi, A. A., Zuidema, P., and Abel, S. J.: The convolution of dynamics and moisture with the presence of shortwave absorbingaerosols over the southeast Atlantic, J. Climate, 28, 1997–2024, https://doi.org/10.1175/JCLI-D-14-00352.1, 2015.
Auriol, F., Léon, J.-F., Balois, J.-Y., Verwaerde, C., François, P., Riedi, J., Parol, F., Waquet, F., Tanré, D., and Goloub, P.: Multidirectional visible and shortwave infrared polarimeter for atmospheric aerosol and cloud observation: OSIRIS (Observing System Including PolaRisation in the Solar Infrared Spectrum), in Multispectral, Hyperspectral, and Ultraspectral Remote Sensing Technology, Techniques, and Applications II, International Society for Optics and Photonics, 7149, 71491D, 2008.
Bellouin, N. and the Ringberg 2018 review team: Bounding global aerosol radiative forcing of climate change, EGU General Assembly 2020, Online, 4–8 May 2020, EGU2020-7745, https://doi.org/10.5194/egusphere-egu2020-7745, 2020.
Betts, A. K. and Silva Dias, M. A. F.: Progress in understanding land-surface-atmosphere coupling from LBA research, J. Adv. Model. Earth Sy., 2, 20 pp., 2010.
Blarel, L.: AEROCLO-sA F20 PLASMA2, Baobab Database, https://doi.org/10.6096/AEROCLO.1807, 2020.
Chazette, P., Flamant, C., Totems, J., Gaetani, M., Smith, G., Baron, A., Landsheere, X., Desboeufs, K., Doussin, J.-F., and Formenti, P.: Evidence of the complexity of aerosol transport in the lower troposphere on the Namibian coast during AEROCLO-sA, Atmos. Chem. Phys., 19, 14979–15005, https://doi.org/10.5194/acp-19-14979-2019, 2019.
Cochrane, S. P., Schmidt, K. S., Chen, H., Pilewskie, P., Kittelman, S., Redemann, J., LeBlanc, S., Pistone, K., Kacenelenbogen, M., Segal Rozenhaimer, M., Shinozuka, Y., Flynn, C., Platnick, S., Meyer, K., Ferrare, R., Burton, S., Hostetler, C., Howell, S., Freitag, S., Dobracki, A., and Doherty, S.: Above-cloud aerosol radiative effects based on ORACLES 2016 and ORACLES 2017 aircraft experiments, Atmos. Meas. Tech., 12, 6505–6528, https://doi.org/10.5194/amt-12-6505-2019, 2019.
Cornet, C., C.-Labonnote, L., Waquet, F., Szczap, F., Deaconu, L., Parol, F., Vanbauce, C., Thieuleux, F., and Riédi, J.: Cloud heterogeneity on cloud and aerosol above cloud properties retrieved from simulated total and polarized reflectances, Atmos. Meas. Tech., 11, 3627–3643, https://doi.org/10.5194/amt-11-3627-2018, 2018.
Davis, A., Marshak, A., Cahalan, R., and Wiscombe, W.: The Landsat Scale Break in Stratocumulus as a Three-Dimensional Radiative Transfer Effect: Implications for Cloud Remote Sensing, J. Atmos. Sci., 54, 241–260, https://doi.org/10.1175/1520-0469(1997)054<0241:TLSBIS>2.0.CO;2, 1997.
Deaconu, L. T., Waquet, F., Josset, D., Ferlay, N., Peers, F., Thieuleux, F., Ducos, F., Pascal, N., Tanré, D., Pelon, J., and Goloub, P.: Consistency of aerosols above clouds characterization from A-Train active and passive measurements, Atmos. Meas. Tech., 10, 3499–3523, https://doi.org/10.5194/amt-10-3499-2017, 2017.
Deaconu, L. T., Ferlay, N., Waquet, F., Peers, F., Thieuleux, F., and Goloub, P.: Satellite inference of water vapour and above-cloud aerosol combined effect on radiative budget and cloud-top processes in the southeastern Atlantic Ocean, Atmos. Chem. Phys., 19, 11613–11634, https://doi.org/10.5194/acp-19-11613-2019, 2019.
de Graaf, M., Bellouin, N., Tilstra, L. G., Haywood, J., and Stammes, P.: Aerosol direct radiative effect of smoke over clouds over the southeast Atlantic Ocean from 2006 to 2009, Geophys. Res. Lett., 41, 7723–7730, https://doi.org/10.1002/2014GL061103, 2014.
de Graaf, M., Tilstra, L. G., and Stammes, P.: Aerosol direct radiative effect over clouds from a synergy of Ozone Monitoring Instrument (OMI) and Moderate Resolution Imaging Spectroradiometer (MODIS) reflectances, Atmos. Meas. Tech., 12, 5119–5135, https://doi.org/10.5194/amt-12-5119-2019, 2019.
de Graaf, M., Schulte, R., Peers, F., Waquet, F., Tilstra, L. G., and Stammes, P.: Comparison of south-east Atlantic aerosol direct radiative effect over clouds from SCIAMACHY, POLDER and OMI–MODIS, Atmos. Chem. Phys., 20, 6707–6723, https://doi.org/10.5194/acp-20-6707-2020, 2020.
Di Girolamo, L. and Davies, R.: Cloud fraction errors caused by finite resolution measurements, J. Geophys. Res.-Atmos., 102, 1739–1756, 1997.
Dubovik, O., Holben, B. N., Kaufman, Y. J., Yamasoe, M., Smirnov, A., Tanré, D., and Slutsker, I.: Single-scattering albedo of smoke retrieved from the sky radiance and solar transmittance measured from ground, J. Geophys. Res., 103, 31903–31923, https://doi.org/10.1029/98JD02276, 1998.
Dubovik, O., Smirnov, A., Holben, B. N., King, M. D., Kaufman, Y. J., Eck, T. F., and Slutsker, I.: Accuracy assessments of aerosol optical properties retrieved from Aerosol Robotic Network (AERONET) Sun and sky radiance measurements, J. Geophys. Res., 105, 9791–9806, https://doi.org/10.1029/2000JD900040, 2000.
Dubovik, O., Herman, M., Holdak, A., Lapyonok, T., Tanré, D., Deuzé, J. L., Ducos, F., Sinyuk, A., and Lopatin, A.: Statistically optimized inversion algorithm for enhanced retrieval of aerosol properties from spectral multi-angle polarimetric satellite observations, Atmos. Meas. Tech., 4, 975–1018, https://doi.org/10.5194/amt-4-975-2011, 2011.
Dubovik, O., Lapyonok, T., Litvinov, P., Herman, M., Fuertes, D., Ducos, F., Torres, B., Derimian, Y., Huang, X., Lopatin, A., Chaikovsky, A., Aspetsberger, M., and Federspiel, C.: GRASP: a versatile algorithm for characterizing the atmosphere, SPIE Newsroom, https://doi.org/10.1117/2.1201408.005558, 2014.
Dubovik, O., Li, Z., Mishchenko, M. I., Tanré, D., Karol, Y., Bojkov, B., Cairns, B., Diner, D. J., Espinosa, W. R., and Goloub, P.: Polarimetric remote sensing of atmospheric aerosols: Instruments, methodologies, results, and perspectives, J. Quant. Spectrosc. Ra., 224, 474–511, 2019.
Dubuisson, P., Buriez, J. C., and Fouquart, Y.: High spectral resolution solar radiative transfer in absorbing and scattering media: Application to the satellite simulation, J. Quant. Spectrosc. Ra., 55, 103–126, 1996.
Eck, T. F., Holben, B. N., Reid, J. S., Mukelabai, M. M., Piketh, S. J., Torres, O., Jethva, H. T., Hyer, E. J., Ward, D. E., Dubovik, O., Sinyuk, A., Schafer, J. S., Giles, D. M., Sorokin, M., Smirnov, A., and Slutsker, I.: A seasonal trend of single scattering albedo in southern African biomass-burning particles: Implications for satellite products and estimates of emissions for the world's largest biomass-burning source: TREND IN PARTICLE SSA IN SOUTHERN AFRICA, J. Geophys. Res., 118, 6414–6432, https://doi.org/10.1002/jgrd.50500, 2013.
Flamant, C.: AEROCLO-sA F20 Lidar LNG aerosols, Baobab Database, https://doi.org/10.6096/AEROCLO.1774, 2018.
Flemming, J., Benedetti, A., Inness, A., Engelen, R. J., Jones, L., Huijnen, V., Remy, S., Parrington, M., Suttie, M., Bozzo, A., Peuch, V.-H., Akritidis, D., and Katragkou, E.: The CAMS interim Reanalysis of Carbon Monoxide, Ozone and Aerosol for 2003–2015, Atmos. Chem. Phys., 17, 1945–1983, https://doi.org/10.5194/acp-17-1945-2017, 2017.
Formenti, P., Piketh, S. J., Namwoonde, A., Klopper, D., Burger, R., Cazaunau, M., Feron, A., Gaimoz, C., Broccardo, S., Walton, N., Desboeufs, K., Siour, G., Hanghome, M., Mafwila, S., Omoregie, E., Junkermann, W., and Maenhaut, W.: Three years of measurements of light-absorbing aerosols over coastal Namibia: seasonality, origin, and transport, Atmos. Chem. Phys., 18, 17003–17016, https://doi.org/10.5194/acp-18-17003-2018, 2018.
Formenti, P., D'Anna, B., Flamant, C., Mallet, M., Piketh, S. J., Schepanski, K., Waquet, F., Auriol, F., Brogniez, G., Burnet, F., Chaboureau, J., Chauvigné, A., Chazette, P., Denjean, C., Desboeufs, K., Doussin, J., Elguindi, N., Feuerstein, S., Gaetani, M., Giorio, C., Klopper, D., Mallet, M. D., Nabat, P., Monod, A., Solmon, F., Namwoonde, A., Chikwililwa, C., Mushi, R., Welton, E. J., and Holben, B.: The Aerosols, Radiation and Clouds in Southern Africa Field Campaign in Namibia: Overview, illustrative observations, and way forward, B. Am. Meteorol. Soc., 100, 1277–1298, https://doi.org/10.1175/BAMS-D-17-0278.1, 2019.
Gaetani, M.: AEROCLO-sA CAMS biomass burning aerosol, Baobab Database, available at: https://baobab.sedoo.fr/Data-Search/?datsId=1782&project_name=AEROCLO (last access: 19 May 2021), 2019.
Hagolle, O., Goloub, P., Deschamps, P.-Y., Cosnefroy, H., Briottet, X., Bailleul, T., Nicolas, J.-M., Parol, F., Lafrance, B., and Herman, M.: Results of POLDER in-flight calibration, IEEE T. Geosci. Remote S., 37, 1550–1566, 1999.
Halthore, R. N., Eck, T. F., Holben, B. N., and Markham, B. L.: Sun photometric measurements of atmospheric water vapor column abundance in the 940-nm band, J. Geophys. Res., 102, 4343–4352, https://doi.org/10.1029/96JD03247, 1997.
Hu, Q., Goloub, P., Veselovskii, I., Bravo-Aranda, J.-A., Popovici, I. E., Podvin, T., Haeffelin, M., Lopatin, A., Dubovik, O., Pietras, C., Huang, X., Torres, B., and Chen, C.: Long-range-transported Canadian smoke plumes in the lower stratosphere over northern France, Atmos. Chem. Phys., 19, 1173–1193, https://doi.org/10.5194/acp-19-1173-2019, 2019.
IPCC: Climate Change 2013: The Physical Science Basis. Contribution of Working Group I to the Fifth Assessment Report of the Intergovern-mental Panel on Climate Change, edited by: Stocker, T. F., Qin, D., Plattner, G.-K., Tignor, M., Allen, S. K., Boschung, J., Nauels, A., Xia, Y., Bex, V. and Midgley, P. M., Cambridge University Press, Cambridge, United Kingdom and New York, NY, USA, 1535 pp., 2013.
Karol, Y., Tanré, D., Goloub, P., Vervaerde, C., Balois, J. Y., Blarel, L., Podvin, T., Mortier, A., and Chaikovsky, A.: Airborne sun photometer PLASMA: concept, measurements, comparison of aerosol extinction vertical profile with lidar, Atmos. Meas. Tech., 6, 2383–2389, https://doi.org/10.5194/amt-6-2383-2013, 2013.
Keil, A. and Haywood, J. M.: Solar radiative forcing by biomass burning aerosol particles during SAFARI 2000: A case study based on measured aerosol and cloud properties, J. Geophys. Res., 108, 8467, https://doi.org/10.1029/2002JD002315, 2003.
Kirchstetter, T. W., Novakov, T., and Hobbs, P. V.: Evidence that the spectral dependence of light absorption by aerosols is affected by organic carbon, J. Geophys. Res., 109, D21208, https://doi.org/10.1029/2004JD004999, 2004.
Klopper, D., Formenti, P., Namwoonde, A., Cazaunau, M., Chevaillier, S., Feron, A., Gaimoz, C., Hease, P., Lahmidi, F., Mirande-Bret, C., Triquet, S., Zeng, Z., and Piketh, S. J.: Chemical composition and source apportionment of atmospheric aerosols on the Namibian coast, Atmos. Chem. Phys., 20, 15811–15833, https://doi.org/10.5194/acp-20-15811-2020, 2020.
Knobelspiesse, K., Cairns, B., Redemann, J., Bergstrom, R. W., and Stohl, A.: Simultaneous retrieval of aerosol and cloud properties during the MILAGRO field campaign, Atmos. Chem. Phys., 11, 6245–6263, https://doi.org/10.5194/acp-11-6245-2011, 2011.
Kumar, K. R., Sivakumar, V., Reddy, R. R., Gopal, K. R., and Adesina, A. J.: Inferring wavelength dependence of AOD and Ångström exponent over a sub-tropical station in South Africa using AERONET data: Influence of meteorology, long-range transport and curvature effect, Sci. Total Environ., 461–462, 397–408, https://doi.org/10.1016/j.scitotenv.2013.04.095, 2013.
Lagzi, I., Meszaros, R., Gelybo, G., and Leelossy, A.: Atmospheric chemistry, available at: http://hgpu.org/?p=11960 (last access: 19 May 2021), 2014.
Loeb, N. G. and Davies, R.: Observational evidence of plane parallel model biases: Apparent dependence of cloud optical depth on solar zenith angle, J. Geophys. Res.-Atmos., 101, 1621–1634, 1996.
Mallet, M., Dulac, F., Formenti, P., Nabat, P., Sciare, J., Roberts, G., Pelon, J., Ancellet, G., Tanré, D., Parol, F., Denjean, C., Brogniez, G., di Sarra, A., Alados-Arboledas, L., Arndt, J., Auriol, F., Blarel, L., Bourrianne, T., Chazette, P., Chevaillier, S., Claeys, M., D'Anna, B., Derimian, Y., Desboeufs, K., Di Iorio, T., Doussin, J.-F., Durand, P., Féron, A., Freney, E., Gaimoz, C., Goloub, P., Gómez-Amo, J. L., Granados-Muñoz, M. J., Grand, N., Hamonou, E., Jankowiak, I., Jeannot, M., Léon, J.-F., Maillé, M., Mailler, S., Meloni, D., Menut, L., Momboisse, G., Nicolas, J., Podvin, T., Pont, V., Rea, G., Renard, J.-B., Roblou, L., Schepanski, K., Schwarzenboeck, A., Sellegri, K., Sicard, M., Solmon, F., Somot, S., Torres, B., Totems, J., Triquet, S., Verdier, N., Verwaerde, C., Waquet, F., Wenger, J., and Zapf, P.: Overview of the Chemistry-Aerosol Mediterranean Experiment/Aerosol Direct Radiative Forcing on the Mediterranean Climate (ChArMEx/ADRIMED) summer 2013 campaign, Atmos. Chem. Phys., 16, 455–504, https://doi.org/10.5194/acp-16-455-2016, 2016.
Mallet, M., Nabat, P., Zuidema, P., Redemann, J., Sayer, A. M., Stengel, M., Schmidt, S., Cochrane, S., Burton, S., Ferrare, R., Meyer, K., Saide, P., Jethva, H., Torres, O., Wood, R., Saint Martin, D., Roehrig, R., Hsu, C., and Formenti, P.: Simulation of the transport, vertical distribution, optical properties and radiative impact of smoke aerosols with the ALADIN regional climate model during the ORACLES-2016 and LASIC experiments, Atmos. Chem. Phys., 19, 4963–4990, https://doi.org/10.5194/acp-19-4963-2019, 2019.
Mallet, M., Solmon, F., Nabat, P., Elguindi, N., Waquet, F., Bouniol, D., Sayer, A. M., Meyer, K., Roehrig, R., Michou, M., Zuidema, P., Flamant, C., Redemann, J., and Formenti, P.: Direct and semi-direct radiative forcing of biomass-burning aerosols over the southeast Atlantic (SEA) and its sensitivity to absorbing properties: a regional climate modeling study, Atmos. Chem. Phys., 20, 13191–13216, https://doi.org/10.5194/acp-20-13191-2020, 2020.
Marenco, F., Johnson, B., Langridge, J. M., Mulcahy, J., Benedetti, A., Remy, S., Jones, L., Szpek, K., Haywood, J., Longo, K., and Artaxo, P.: On the vertical distribution of smoke in the Amazonian atmosphere during the dry season, Atmos. Chem. Phys., 16, 2155–2174, https://doi.org/10.5194/acp-16-2155-2016, 2016.
McClatchey, R. A.: Optical properties of the atmosphere, Air Force Cambridge Research Laboratories, Office of Aerospace Research, AFCRL- 72–0497, 108 pp., 1972.
Myhre, G., Samset, B. H., Schulz, M., Balkanski, Y., Bauer, S., Berntsen, T. K., Bian, H., Bellouin, N., Chin, M., Diehl, T., Easter, R. C., Feichter, J., Ghan, S. J., Hauglustaine, D., Iversen, T., Kinne, S., Kirkevåg, A., Lamarque, J.-F., Lin, G., Liu, X., Lund, M. T., Luo, G., Ma, X., van Noije, T., Penner, J. E., Rasch, P. J., Ruiz, A., Seland, Ø., Skeie, R. B., Stier, P., Takemura, T., Tsigaridis, K., Wang, P., Wang, Z., Xu, L., Yu, H., Yu, F., Yoon, J.-H., Zhang, K., Zhang, H., and Zhou, C.: Radiative forcing of the direct aerosol effect from AeroCom Phase II simulations, Atmos. Chem. Phys., 13, 1853–1877, https://doi.org/10.5194/acp-13-1853-2013, 2013.
Peers, F., Waquet, F., Cornet, C., Dubuisson, P., Ducos, F., Goloub, P., Szczap, F., Tanré, D., and Thieuleux, F.: Absorption of aerosols above clouds from POLDER/PARASOL measurements and estimation of their direct radiative effect, Atmos. Chem. Phys., 15, 4179–4196, https://doi.org/10.5194/acp-15-4179-2015, 2015.
Peers, F., Bellouin, N., Waquet, F., Ducos, F., Goloub, P., Mollard, J., Myhre, G., Skeie, R. B., Takemura, T., and Tanré, D.: Comparison of aerosol optical properties above clouds between POLDER and AeroCom models over the South East Atlantic Ocean during the fire season, Geophys. Res. Lett., 43, 3991–4000, 2016.
Pistone, K., Redemann, J., Doherty, S., Zuidema, P., Burton, S., Cairns, B., Cochrane, S., Ferrare, R., Flynn, C., Freitag, S., Howell, S. G., Kacenelenbogen, M., LeBlanc, S., Liu, X., Schmidt, K. S., Sedlacek III, A. J., Segal-Rozenhaimer, M., Shinozuka, Y., Stamnes, S., van Diedenhoven, B., Van Harten, G., and Xu, F.: Intercomparison of biomass burning aerosol optical properties from in situ and remote-sensing instruments in ORACLES-2016, Atmos. Chem. Phys., 19, 9181–9208, https://doi.org/10.5194/acp-19-9181-2019, 2019.
Pistone, K., Zuidema, P., Wood, R., Diamond, M., da Silva, A. M., Ferrada, G., Saide, P., Ueyama, R., Ryoo, J.-M., Pfister, L., Podolske, J., Noone, D., Bennett, R., Stith, E., Carmichael, G., Redemann, J., Flynn, C., LeBlanc, S., Segal-Rozenhaimer, M., and Shinozuka, Y.: Exploring the elevated water vapor signal associated with the free-tropospheric biomass burning plume over the southeast Atlantic Ocean, Atmos. Chem. Phys. Discuss. [preprint], https://doi.org/10.5194/acp-2020-1322, in review, 2021.
Randriamiarisoa, H., Chazette, P., Couvert, P., Sanak, J., and Mégie, G.: Relative humidity impact on aerosol parameters in a Paris suburban area, Atmos. Chem. Phys., 6, 1389–1407, https://doi.org/10.5194/acp-6-1389-2006, 2006.
Redemann, J., Russell, P. B., and Hamill, P.: Dependence of aerosol light absorption and single-scattering albedo on ambient relative humidity for sulfate aerosols with black carbon cores, J. Geophys. Res.-Atmos., 106, 27485–27495, https://doi.org/10.1029/2001JD900231, 2001.
Reid, J. S., Eck, T. F., Christopher, S. A., Hobbs, P. V., and Holben, B.: Use of the \AAngstrom exponent to estimate the variability of optical and physical properties of aging smoke particles in Brazil, J. Geophys. Res., 104, 27473–27489, 1999.
Rivellini, L.-H., Chiapello, I., Tison, E., Fourmentin, M., Féron, A., Diallo, A., N'Diaye, T., Goloub, P., Canonaco, F., Prévôt, A. S. H., and Riffault, V.: Chemical characterization and source apportionment of submicron aerosols measured in Senegal during the 2015 SHADOW campaign, Atmos. Chem. Phys., 17, 10291–10314, https://doi.org/10.5194/acp-17-10291-2017, 2017.
Russell, P. B., Bergstrom, R. W., Shinozuka, Y., Clarke, A. D., DeCarlo, P. F., Jimenez, J. L., Livingston, J. M., Redemann, J., Dubovik, O., and Strawa, A.: Absorption Angstrom Exponent in AERONET and related data as an indicator of aerosol composition, Atmos. Chem. Phys., 10, 1155–1169, https://doi.org/10.5194/acp-10-1155-2010, 2010.
Samset, B. H., Myhre, G., Herber, A., Kondo, Y., Li, S.-M., Moteki, N., Koike, M., Oshima, N., Schwarz, J. P., Balkanski, Y., Bauer, S. E., Bellouin, N., Berntsen, T. K., Bian, H., Chin, M., Diehl, T., Easter, R. C., Ghan, S. J., Iversen, T., Kirkevåg, A., Lamarque, J.-F., Lin, G., Liu, X., Penner, J. E., Schulz, M., Seland, Ø., Skeie, R. B., Stier, P., Takemura, T., Tsigaridis, K., and Zhang, K.: Modelled black carbon radiative forcing and atmospheric lifetime in AeroCom Phase II constrained by aircraft observations, Atmos. Chem. Phys., 14, 12465–12477, https://doi.org/10.5194/acp-14-12465-2014, 2014.
Schuster, G. L., Dubovik, O., and Holben, B. N.: Angstrom exponent and bimodal aerosol size distributions, J. Geophys. Res., 111, D07207, https://doi.org/10.1029/2005JD006328, 2006.
Sena, E. T., Artaxo, P., and Correia, A. L.: Spatial variability of the direct radiative forcing of biomass burning aerosols and the effects of land use change in Amazonia, Atmos. Chem. Phys., 13, 1261–1275, https://doi.org/10.5194/acp-13-1261-2013, 2013.
Toledano, C., Cachorro, V. E., Berjon, A., de Frutos, A. M., Sorribas, M., de la Morena, B. A., and Goloub, P.: Aerosol optical depth and Ångström exponent climatology at El Arenosillo AERONET site (Huelva, Spain), Q. J. Roy. Meteor. Soc., 133, 795–807, https://doi.org/10.1002/qj.54, 2007.
Torres, B., Dubovik, O., Fuertes, D., Schuster, G., Cachorro, V. E., Lapyonok, T., Goloub, P., Blarel, L., Barreto, A., Mallet, M., Toledano, C., and Tanré, D.: Advanced characterisation of aerosol size properties from measurements of spectral optical depth using the GRASP algorithm, Atmos. Meas. Tech., 10, 3743–3781, https://doi.org/10.5194/amt-10-3743-2017, 2017.
Waquet, F. and Chauvigné, A.: AEROCLO-sA F20 OSIRIS L2, Baobab Database, https://doi.org/10.6096/AEROCLO.1802, 2019.
Waquet, F., Cairns, B., Knobelspiesse, K., Chowdhary, J., Travis, L. D., Schmid, B., and Mishchenko, M. I.: Polarimetric remote sensing of aerosols over land, J. Geophys. Res.-Atmos., 114, D01206, https://doi.org/10.1029/2008JD010619, 2009.
Waquet, F., Cornet, C., Deuzé, J.-L., Dubovik, O., Ducos, F., Goloub, P., Herman, M., Lapyonok, T., Labonnote, L. C., Riedi, J., Tanré, D., Thieuleux, F., and Vanbauce, C.: Retrieval of aerosol microphysical and optical properties above liquid clouds from POLDER/PARASOL polarization measurements, Atmos. Meas. Tech., 6, 991–1016, https://doi.org/10.5194/amt-6-991-2013, 2013a.
Waquet, F., Peers, F., Ducos, F., Goloub, P., Platnick, S., Riedi, J., Tanré, D., and Thieuleux, F.: Global analysis of aerosol properties above clouds, Geophys. Res. Lett., 40, 5809–5814, https://doi.org/10.1002/2013GL057482, 2013b.
Waquet, F., Peers, F., Ducos, F., Thieuleux, F., Deaconu, L., Chauvigné, A., and Riedi, J.: Aerosols above clouds products from POLDER/PARASOL satellite observations (AERO-AC products), Icare, https://doi.org/10.25326/82, 2020.
Zhang, J., Reid, J. S., Christensen, M., and Benedetti, A.: An evaluation of the impact of aerosol particles on weather forecasts from a biomass burning aerosol event over the Midwestern United States: observational-based analysis of surface temperature, Atmos. Chem. Phys., 16, 6475–6494, https://doi.org/10.5194/acp-16-6475-2016, 2016.
Zuidema, P., Redemann, J., Haywood, J., Wood, R., Piketh, S., Hipondoka, M., and Formenti, P.: Smoke and Clouds above the Southeast Atlantic: Upcoming Field Campaigns Probe Absorbing Aerosol's Impact on Climate, B. Am. Meteorol. Soc., 97, 1131–1135, https://doi.org/10.1175/BAMS-D-15-00082.1, 2016.