the Creative Commons Attribution 4.0 License.
the Creative Commons Attribution 4.0 License.
 | 27 May 2021
The role of coarse aerosol particles as a sink of HNO3 in wintertime pollution events in the Salt Lake Valley
Amy Hrdina
Jennifer G. Murphy
Anna Gannet Hallar
John C. Lin
Alexander Moravek
Ryan Bares
Ross C. Petersen
Alessandro Franchin
Ann M. Middlebrook
Lexie Goldberger
Ben H. Lee
Munkh Baasandorj
Steven S. Brown
Wintertime ammonium nitrate (NH4NO3) pollution events burden urban mountain basins around the globe. In the Salt Lake Valley of Utah in the United States, such pollution events are often driven by the formation of persistent cold-air pools (PCAPs) that trap emissions near the surface for several consecutive days. As a result, secondary pollutants including fine particulate matter less than 2.5 µm in diameter (PM2.5), largely in the form of NH4NO3, build up during these events and lead to severe haze. As part of an extensive measurement campaign to understand the chemical processes underlying PM2.5 formation, the 2017 Utah Winter Fine Particulate Study, water-soluble trace gases and PM2.5 constituents were continuously monitored using the ambient ion monitoring ion chromatograph (AIM-IC) system at the University of Utah campus. Gas-phase NH3, HNO3, HCl, and SO2 along with particulate NH, Na+, K+, Mg2+, Ca2+, NO, Cl−, and SO were measured from 21 January to 21 February 2017. During the two PCAP events captured, the fine particulate matter was dominated by secondary NH4NO3. The comparison of total nitrate (HNO3 + PM2.5 NO) and total NHx (NH3 + PM2.5 NH) showed NHx was in excess during both pollution events. However, chemical composition analysis of the snowpack during the first PCAP event revealed that the total concentration of deposited NO was nearly 3 times greater than that of deposited NH. Daily snow composition measurements showed a strong correlation between NO and Ca2+ in the snowpack. The presence of non-volatile salts (Na+, Ca2+, and Mg2+), which are frequently associated with coarse-mode dust, was also detected in PM2.5 by the AIM-IC during the two PCAP events, accounting for roughly 5 % of total mass loading. The presence of a significant particle mass and surface area in the coarse mode during the first PCAP event was indicated by size-resolved particle measurements from an aerodynamic particle sizer. Taken together, these observations imply that atmospheric measurements of the gas-phase and fine-mode particle nitrate may not represent the total burden of nitrate in the atmosphere, implying a potentially significant role for uptake by coarse-mode dust. Using the NO : NH ratio observed in the snowpack to estimate the proportion of atmospheric nitrate present in the coarse mode, we estimate that the amount of secondary NH4NO3 could double in the absence of the coarse-mode sink. The underestimation of total nitrate indicates an incomplete account of the total oxidant production during PCAP events. The ability of coarse particles to permanently remove HNO3 and influence PM2.5 formation is discussed using information about particle composition and size distribution.
- Article
(2221 KB) - Full-text XML
- BibTeX
- EndNote


Episodes with high particulate matter (PM) pollution occur frequently in urban air basins across the globe during winter months when a stable boundary layer persists for multiple days, including in the mountain valleys in the western USA (Baasandorj et al., 2017; Bares et al., 2018; Green et al., 2015; Silcox et al., 2012; Whiteman et al., 2014), the Po Valley in Italy (Bernardoni et al., 2017; Vecchi et al., 2018), and the Sichuan (Tian et al., 2019) and Twin-Hu (Gao et al., 2019) basins in China. These mountain basins, including the Salt Lake Valley (SLV) in northern Utah, experience strong temperature inversions that develop into persistent cold-air pools (PCAPs), which suppress vertical mixing and trap emissions within a shallow boundary layer (Lareau et al., 2013; Whiteman et al., 2014). Under these conditions, mass loadings of fine particles smaller than 2.5 µm (PM2.5) often reach values of 60–80 µg m−3 in the western USA, which are far above the US National Ambient Air Quality Standard (35 µg m−3, 24 h average) (Lareau et al., 2013; Silcox et al., 2012; Whiteman et al., 2014). Along with environmental impacts such as haze and localized deposition, mass loadings of PM2.5 that exceed this standard have been associated with increased risk of mortality, especially cardiopulmonary or cardiovascular disease mortality (Pope et al., 2003, 2017). However, despite significant societal concerns about the impact on human health from these PM2.5 pollution episodes and their common occurrence around the world, the major chemical processes that drive PM formation in these regions are still uncertain.
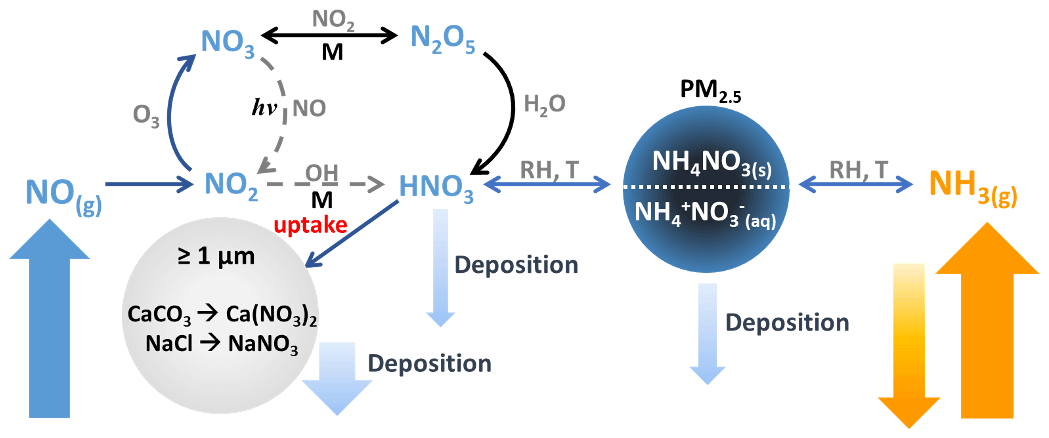
Figure 1Processes influencing the concentrations of NH3, NOx, HNO3, and NH4NO3. Pathways that occur during the day are shown in dashed grey arrows, while pathways that occur during the night are shown in black. The rate of uptake of HNO3 to coarse particles, ≥ PM1, composed of CaCO3 and/or NaCl is unknown.
Several studies conducted in northern Utah have shown that PM2.5 during these PCAP episodes is predominantly composed of ammonium nitrate (NH4NO3), accounting for roughly 60 %–80 % of the total dry particle mass (Baasandorj et al., 2017; Franchin et al., 2018; Hansen et al., 2013; Kelly et al., 2013; Kuprov et al., 2014; Long et al., 2002, 2003; Mangelson et al., 1997). NH4NO3 formation is thermodynamically favorable under conditions with low temperatures and high relative humidity based on equilibrium partitioning with gas-phase ammonia (NH3) and nitric acid (HNO3) (Mozurkewich, 1993; Nowak et al., 2010; Seinfeld and Pandis, 2006), illustrated in the right-hand portion of Fig. 1.
NH3 emissions are often associated with agricultural activities and waste disposal; however, in recent years automotive emissions and industrial processes have become increasingly important sources in urban areas (Behera et al., 2013; Bishop et al., 2010, 2016; Livingston et al., 2009; Nowak et al., 2012; Roth et al., 2019; Suarez-Bertoa et al., 2014; Sun et al., 2017). In contrast, HNO3 is formed in the atmosphere and is a major sink of nitrogen oxides, which are emitted primarily through fossil fuel combustion. The two dominant mechanisms highlighted in Fig. 1 that lead to HNO3 occur either (1) from oxidation of NO2 via reaction with OH (in orange), which is photochemically driven during the day, or (2) through heterogenous uptake of N2O5 (in black), which typically occurs at night. Gas-phase HNO3 and NH3 and particulate NH4NO3 are removed from the atmosphere through dry and wet deposition under typical atmospheric conditions. However, under PCAP conditions, the stably stratified boundary layer reduces convective mixing, which in turn allows pollutants to accumulate. In addition, HNO3 can also be lost through heterogenous reaction with dust and sea salt components, such as CaCO3 and NaCl (Beichert and Finlayson-Pitts, 1996; Dasgupta et al., 2007; Fenter et al., 1994; Liu et al., 2008a). When the loss of HNO3 to deposition is suppressed under PCAP conditions, the loss to reactive uptake to airborne dust and sea salt can potentially become more important.
To formulate effective control strategies that reduce wintertime PM2.5 in northern Utah, measurement campaigns have been conducted to improve our understanding of fine particulate formation during these PCAP episodes (Baasandorj et al., 2017; Bares et al., 2018; Hansen et al., 2010; Kelly et al., 2013; Kuprov et al., 2014; Lareau et al., 2013; Malek et al., 2006; Mangelson et al., 1997; Silcox et al., 2012; Whiteman et al., 2014). Several analyses of the PM build-up in cold-air pool events in the SLV have been published, all based on measurements from one or several ground sites (Baasandorj et al., 2017; Kuprov et al., 2014; Long et al., 2003; Silcox et al., 2012). Long-term PM2.5 composition measurements in the SLV are made using filter samples (Kelly et al., 2013; Kuprov et al., 2014; Long et al., 2003; Mangelson et al., 1997; Silcox et al., 2012; Whiteman et al., 2014), with PM2.5 speciation carried out on filter extracts in accordance with the US Environmental Protection Agency (EPA) Speciation Trends Network (STN) protocol. Kuprov et al. (2014) were the first to report the gas and PM2.5 composition during pollution events in northern Utah using an ambient ion monitoring ion chromatograph (AIM-IC) system; however, this study only measured anionic species, providing HNO3 and particle nitrate (pNO) concentrations at an hourly resolution. Ambient NH3 concentrations were monitored using a chemiluminescence-based NH3 analyzer, but particulate ammonium (pNH) had to be inferred based on the assumption that both pNO and particulate sulfate (pSO) were in the form of their respective ammonium salts. Particle mass fractions of crustal and carbonaceous material in PM2.5 were calculated on 24 h average measurements of Al, Si, and elemental and organic carbon in fine particles from the NCore program (US EPA, 2010).
Recent research in the SLV has focused on determining whether ammonium nitrate mass loading is most sensitive to reductions in NH3 or HNO3 to inform PM2.5 reduction strategies (Kuprov et al., 2014). Baasandorj et al. (2017) recently proposed that PM2.5 forms overnight in the upper layers of the PCAP and mixes down to the surface, enhancing the total PM2.5 loading experienced in the SLV. This explanation of stratified particulate nitrate chemistry throughout PCAP events suggests a complex coupling of a HNO3-limited surface layer with a NH3-limited elevated layer (Baasandorj et al., 2017). Aircraft measurements during the 2017 Utah Winter Fine Particulate Study (UWFPS) provided the first detailed vertically resolved chemical composition of these PCAP episodes in the SLV. Analysis presented in McDuffie et al. (2019) confirms that the formation of NH4NO3 during these pollution events is largely limited by HNO3 but with more frequent periods approaching NH3-limited conditions in the upper boundary layer over time (McDuffie et al., 2019). Regimes of both NH3-limited and HNO3-limited conditions are also consistent with an aerosol thermodynamic model sensitivity study of the same data by Franchin et al. (2018), who found simulations of non-refractory PM1 mass were sensitive to reductions in both total ammonium and total nitrate (Franchin et al., 2018). Box model studies of the odd oxygen budget during UWFPS by Womack et al. (2019) assumed that NH4NO3 formation during PCAP episodes is HNO3-limited, and found full episodes tend to be NOx-saturated. In conditions where pNO production is HNO3-limited, it is often assumed that reduction in NOx would directly lead to reductions in HNO3. However, Womack et al. (2019) showed the production of HNO3, and therefore, NH4NO3 formation, is sensitive to changes in VOC concentrations emphasizing the complexity of chemical processes involved in PM formation under these conditions.
The balance of factors influencing HNO3 formation are still being understood. Modelling results from both McDuffie et al. (2019) and Womack et al. (2019) predict that up to ∼ 50 % of HNO3 production is from the heterogeneous N2O5 pathway in the residual layer. This is in line with ground-based measurements of N2O5 by Baasandorj et al. (2017) highlighting the importance of nighttime pathway (Baasandorj et al., 2017). Less attention has been paid to the possibility that alternate sinks for HNO3 may also significantly limit the amount of nitrate that can contribute to PM2.5 formation.
Here, results are presented from ground site observations in Salt Lake City from a moderately elevated site at the edge of the SLV during the UWFPS campaign in January and February 2017. Atmospheric concentrations of inorganic trace gases and water-soluble PM2.5 constituents were measured by an AIM-IC, equipped with both cation and anion ion chromatographs. During PCAP episodes, we observed the formation and build-up of NH4NO3 over several days. Between the hours of 08:00 and 18:00 mountain standard time (MST) on several PCAP days, we also observed the presence of elevated levels of non-volatile cations in PM2.5. To investigate the role of mineral–coarse-mode aerosols in limiting the availability of HNO3 during these events, the final section presents estimates of HNO3 lifetime against reactive uptake onto mineral–coarse-mode dust based on aerodynamic particle sizer (APS) data and estimates of the total nitrate budget using the chemical composition of the snowpack measured during UWFPS.
2.1 Site description
The SLV (1300 km2) is a mountain basin in northern Utah surrounded by steep mountain ranges with the Great Salt Lake sitting to the northwest. The Wasatch Mountains (peak at 3636 m a.s.l.) span the entire eastern border of the valley with the Oquirrh Mountains (peak at 3235 m a.s.l.) to the west. There is a narrow passage in the southern Traverse Range (1878 m a.s.l.) that creates a small opening into the Utah Valley. Salt Lake City sits at the base of the valley (1288 m a.s.l.), making a vast elevation difference between the metropolis and the surrounding mountains. Measurements were conducted from the rooftop of the William Brown Building 33 m above ground level at the University of Utah (UU) located 40∘45′58.7′′ N, 111∘50′51.6′′ W, in Salt Lake City. The UU site is located 155 m above the valley floor along the northeast sidewall of the SLV. The site is impacted by local traffic that enters the university on the north side of campus.
2.2 Instrumentation
Hourly averages of PM2.5 chemical composition and gas-phase precursors were measured using an online continuous AIM-IC instrument (Model 9000D, URG Corp, Chapel Hill, NC). Briefly, gases and particles are sampled from the same airflow by passing through a short inlet with elements for size selection (PM2.5 impactor), gas collection (wet parallel plate denuder), and particle capture (saturation chamber) at a flow rate of 3 L min−1. Aqueous solutions containing analytes originally in the gas and particle phases are separately transferred through 22 m inlet lines into 5 mL glass syringes that are subsequently analyzed by ion chromatographs (ICs) following hour-long collection periods. More in-depth details about the AIM-IC system, including important adaptations from the standard commercial system, can be found in Markovic et al. (2012). During the UWFPS campaign, the components of the inlet assembly were housed in a small weatherproof box 2 m above the roof of the UU site and the IC systems were housed in a laboratory below. Standard calibrations of the ICs were performed offline using mixed ion standard solutions before and after the measurement period. Charged species (Na+, NH, K+, Mg2+, Ca2+, NH3, amines, Cl−, NO, NO, and SO) were measured using a Dionex ICS-2000 equipped with concentrator columns (TCC-ULP1 and TAC-ULP1), guard columns (CG17 and AG19), and 4 mm analytical columns (CS17 and AS19). Gradient elution methods, using methanesulfonic acid (MSA) and potassium hydroxide (KOH), were carried out using electrolytically regenerated suppressors to reduce the influence of the eluent in the conductivity detection. Carbonate salts are never quantified in the anion IC due to the natural presence of carbonate in the distilled deionized water reservoir that sustains the IC systems. Background measurements of the entire AIM-IC system were conducted by overflowing the sampling inlet using high-purity zero air to determine the method zero and detection limits of each species. The limits of detection (LODs), based on 3σ of the background, for trace gases were found to be 150, 20, 40, and 10 ppt for NH3, HCl, HNO3, and SO2, respectively. The LODs for PM2.5 chemical constituents were 0.2, 0.1, 0.1, 0.04, and 0.4 µg m−3, for pNH, pNa+, pK+, pMg2+, and pCa2+ and 0.03, 0.03, and 0.01 µg m−3 for pCl−, pNO, and pSO. Traces gases and PM2.5 constituents measured as cations are reported from 21 January to 21 February 2017. Due to technical difficulties, anionic constituents measured from 21 January to 8 February were compromised. Therefore, PM2.5 anionic components are only reported from 13 to 21 February and the trace gases measured as anions during the former period may be less reliable.
Continuous measurements of total PM2.5 mass concentrations were also captured at the site using the Filter Dynamics Measurement System (FDMS) with a tapered element oscillating microbalance (TEOM) ambient particulate monitor (FDMS TEOM 1400ab, Thermo Fisher Scientific) provided by the Utah Division of Air Quality (UDAQ). Ambient air was sampled at ∼ 1.5 m above the roof through a ∼ 7 m long o.d. PFA line with a volumetric flow rate of 20 L min−1. A custom-made inertial PM impactor was connected to the entrance of the sampling inlet to remove coarse PM and water from the sample flow. A critical orifice was installed downstream of the PM impactor to restrict the sample flow, maintaining a pressure below 200 mbar. The air sample was sent through an additional filter to remove particles larger than 2.5 µm. An aerodynamic particle sizer (APS; TSI Inc, Model 3321) was operated from 26 January to 10 February to size and detect particles with an aerodynamic diameter of between 0.54 and 19.81 µm based on the time of flight of the particle between two (633 nm) He-Ne lasers. This instrument was attached to an aerosol inlet that included a 2.54 cm diameter stainless-steel tube connected to a stainless-steel rain cap with approximately a 10 cm diameter. Aerosol mass was calculated using the Aerosol Instrument Manager (AIM) software for the APS Model 3321. The particle density used for calculating the aerosol mass concentration was 1.0 g cm−3, and particles were assumed to be spherical. The APS was attached to this inlet system via a custom-made stainless-steel pickoff. To improve aerosol transmission through the inlet, an external pump was attached to the system. The pump pulled at approximately 7.2 L min−1. The calculated transmission shows a 50 % cutoff at approximately 7 µm for this inlet system (Skiles et al., 2018).
2.3 Snow sampling and analysis
The inorganic chemical composition (Na+, NH, K+, Mg2+, Ca2+, NH3, Cl−, NO, NO, and SO) of the snowpack was monitored throughout the campaign during periods of snow cover. The snowpack composition and depth were measured daily within a 2 m radius around the AIM-IC inlet atop UU using a clean graduated 5 cm diameter beveled snow corer. Samples were collected in triplicate along with a field blank to account for any contamination during sampling. Collected samples were melted in sealed containers. The resulting snowmelt solution was measured for total melt volume and pH (Hach sensION+ PH1 Portable pH Meter). Snowmelt samples were then filtered through 0.25 µm PTFE filters (Whatman, VWR International) before analysis utilizing ion chromatography.
2.4 Aerosol thermodynamic modelling using ISORROPIA
Thermodynamic modelling was used to examine the expected gas and particle partitioning of semi-volatile constituents based on the local meteorological conditions and the observed concentrations of gas and particle constituents. These models carry out bulk calculations to estimate the gas-phase and particle-phase composition of inorganic species, in which all particles are assumed to have the same chemical composition. To examine how the presence of non-volatile particle components observed during this period may affect nitrate partitioning, ISORROPIA v2.1 (Nenes et al., 1998; Fountoukis and Nenes, 2007) was used. Model calculations were run in forward mode, with observed total ammonia (NH3 + pNH), particulate sulfate (pSO), total nitrate (HNO3 + pNO), total chloride (HCl + pCl−), and non-volatile particulate species (pK+, pNa+, pCa2+, and pMg2+), along with ambient relative humidity and temperature, as inputs. Model runs were conducted using the metastable state option, which prevents solid formation by forcing all particulate components to remain in an aqueous state.
3.1 Trace gas and PM2.5 composition in the Salt Lake Valley
The AIM-IC measurement period included two PCAP pollution episodes, 27 January to 3 February 2017 (episode 1) and 13 to 17 February 2017 (episode 2), defined by the meteorological conditions that stabilize the boundary layer and by the total observed PM2.5 mass, separated by a relatively clean period from 5 to 12 February 2017. The PCAP episodes can be clearly seen in the build-up of PM2.5 mass and the inorganic constituents measured by the AIM-IC as shown in Fig. 2. Pollution periods with a total 24 h average PM2.5 mass > 17.5 µg m−3 are deemed PCAP periods, while periods with a 24 h average PM2.5 mass ≤ 2 µg m−3 are considered clean periods, as previously defined by Whiteman et al. (2014). The pollution period from 27 January to 3 February 2017 (episode 1) was the most persistent and severe during the UWFPS measurement campaign.
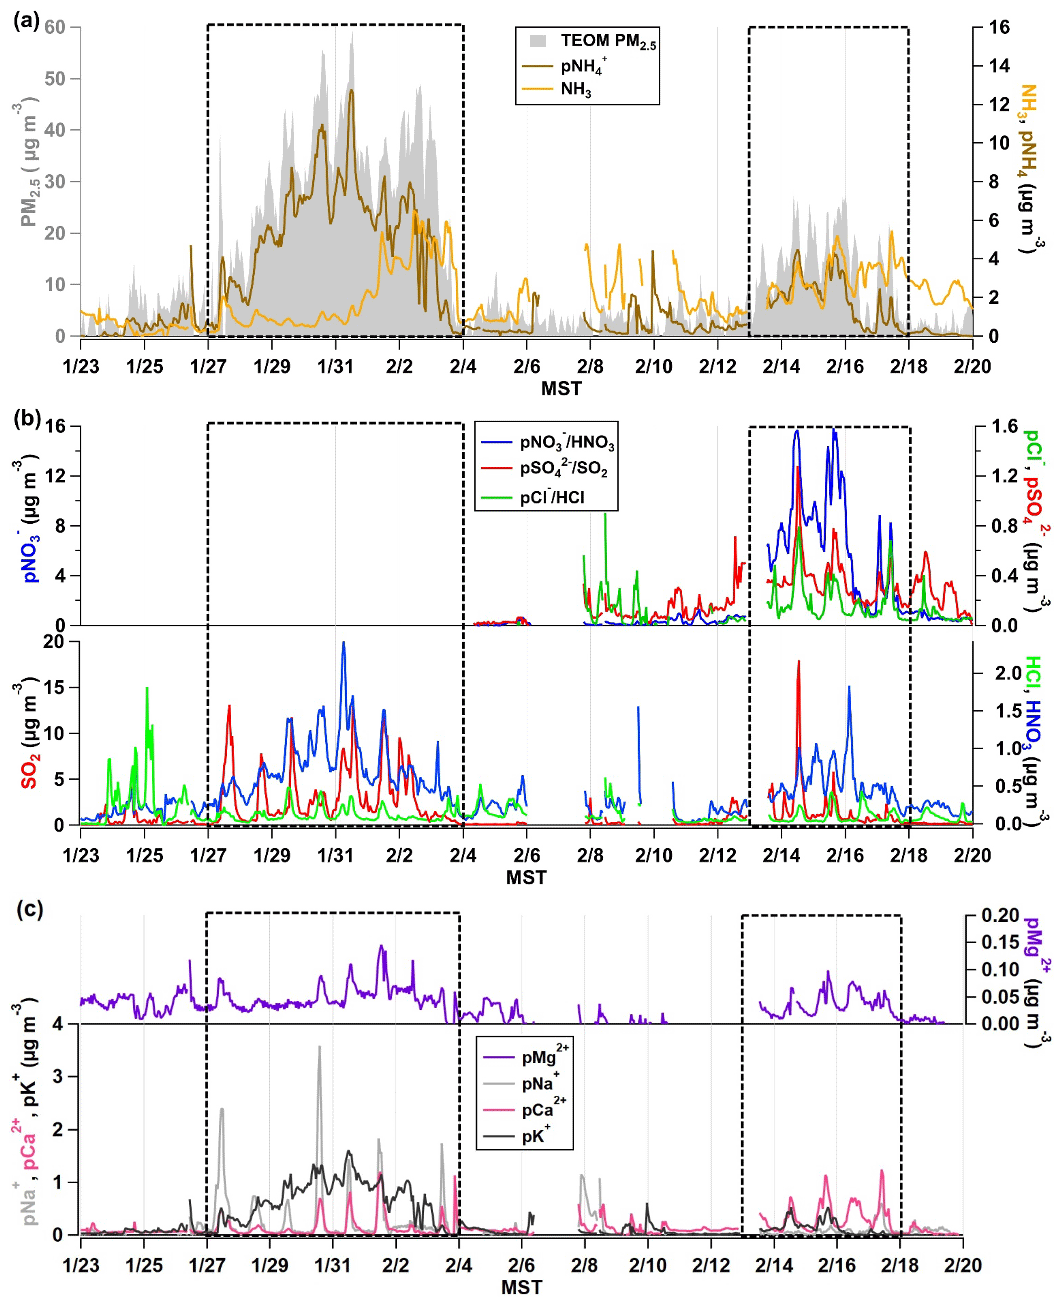
Figure 2(a) The time series of NH3 and pNH observed by the AIM-IC and total PM2.5 mass loading (µg m−3) measured by the TEOM from 23 January to 19 February 2017. (b) The AIM-IC observations of inorganic gases HCl, HNO3, and SO2 and PM2.5 components pCl−, pNO, pNO, and pSO present in PM2.5. (c) The AIM-IC observations of the non-volatile inorganic cations pNa+, pK+, pMg2+, and pCa2+ measured in PM2.5 for the entire campaign period. The two PCAP pollution episodes captured during the campaign are emphasized by the dotted black line. Time is expressed in mountain standard time (MST).
Both pollution events are marked in Fig. 2, while the full suite of inorganic gases and PM2.5 components was measured by the AIM-IC only from 8 to 19 February 2017. The increase in total PM2.5 mass at the onset of episode 1 on 27 January coincides with a rise in pNH, seen in Fig. 2a, while there is an initial drop in ambient NH3 concentration before it plateaus at a mixing ratio of ∼ 1 ppb as the PCAP progresses. The HNO3 and pNO3 data, depicted in Fig. 2b for the second pollution event, confirm the major water-soluble component of PM2.5 in the SLV is NH4NO3, as previously reported (Hansen et al., 2010; Kelly et al., 2013; Kuprov et al., 2014; Long et al., 2003). Compared to the pCl− and pSO mass loadings measured during that event, Fig. 2b shows the total mass of pNO is an order of magnitude larger. Particularly at midday, the majority of the PM2.5 mass is NH4NO3. It is important to note the organic fraction of PM2.5 was not measured by the AIM-IC. Based on TEOM total mass and AIM-IC-measured mass fractions, the AIM-IC captured 75 % of the total PM2.5 mass.
The distinction between PCAP episodes 1 and 2 is important to note because the stability of the cold-air pool and its persistence influences the intensity of PM2.5 build-up in the SLV. Episode 1 was the most severe, persisting for 9 d and allowing PM2.5 daily averages to reach the highest observed through the measurement period, a maximum hourly average of 60 µg m−3. The episode occurred a few days after a storm deposited roughly 22 cm of snow across the SLV and Wasatch front. Ambient temperatures remained below freezing, between 263 and 273 K, sustaining the snowpack throughout the event. This in turn increased the surface albedo, limiting the strength of convection that can disrupt the stable boundary layer (Whiteman et al., 2014). Winds during this episode were light, averaging 1 m s−1, with gusts under 7 m s−1 during the most stable and calm cold pool period from 31 January to 2 February.
The second PCAP observed during the campaign was much shorter-lived with moderate cold pool conditions only present from 13 through 17 February. This episode was distinctly different than episode 1, having no snow cover and much warmer conditions, with temperatures ranging from 270 to 284 K. The winter snowpack in the surrounding mountain range showed signs of spring melt, which extended the surface area of exposed ground. Winds were slightly stronger, averaging 1.6 m s−1 with stronger gusts averaging around 8 m s−1 caused by stronger convection. The hourly PM2.5 average at the UU site peaked at 28 µg m−3, and elevated PM levels only persisted for 2 to 3 full days, so the intensity and duration of episode 2 was about half that of episode 1.
The presence of non-volatile cations (pCa2+, pMg2+, pK+, and pNa+), seen in Fig. 2c, was also observed during PCAP events. Of all the non-volatile cations observed, only potassium increases with the same pattern as the increase in pNH and total PM2.5 mass measured by the TEOM. Potassium salts are often found in primary aerosols formed from biomass or biofuel burning (Pósfai et al., 2003; Rissler et al., 2006). Wood burning is still a commonly used source of heat during the winter months in the SLV and could be the source of pK+ observed during the severe PCAP episode 1. Aerosol mass spectrometer (AMS) data from Franchin et al. (2018) showed traces of levoglucosan, a known marker for wood combustion, during the pollution episode. However, levoglucosan was typically measured at close to background values. Overall, the data reported from AMS measurements indicated the organic material from wood combustion is not a dominant mass fraction on the regional scale (Franchin et al., 2018). Recent radiocarbon analysis from ground sites in the SLV indicates that fossil fuels were the dominant sources of carbonaceous aerosols during winter, contributing to 88 % (80 % to 98 %) of the black carbon in aerosols and 58 % (48 % to 69 %) of the organic carbon in aerosols (Mouteva et al., 2017). Similarly, the AIM-IC data also suggest that pK+ salts generally compose a small fraction of the total PM2.5 mass.
The alkali and alkaline metal components pCa2+, pMg2+ and pNa+ are commonly found in larger primary particles often emitted from the lofting of mineral dust and salts. These species are often found in mineral aerosols, which typically range from 0.1 to more than 10 µm, partially contributing to PM2.5 (Zender, 2003). The coarse-mode fraction of these primary particles, with diameters greater than 2.5 µm, has sufficiently large settling velocities that the particles have much shorter lifetimes in the atmosphere compared to PM2.5. If the non-volatile cations observed in PM2.5 are present in the largest fine particles, then their lifetime in the atmosphere is considerably shorter than NH4NO3 found in the accumulation mode. This may be the explanation for the more pronounced diel pattern of pCa2+, pMg2+, and pNa+ during the PCAP periods. It is also possible that because vertical mixing is suppressed during PCAP episodes, the UU site is in contact with air from the mineral dust source region to a measurable degree only at midday. During the clean periods, the concentrations of these ions measured by the AIM-IC are very close to their respective detection limits. pNa+, pCa2+ and pMg2+ PM2.5 components peak at midday during pollution events, suggesting similar and/or co-located sources. Concentrations of pMg2+, which is an effective tracer for mineral dust along with pCa2+ (Maxwell-Meier et al., 2004), are present throughout the entire measurement period, averaging 0.02 µg m−3 and reaching a maximum of 0.15 µg m−3. It is known that sea salt is the most common source of pNa+, so examining the Ca-to-Na ratios can suggest the predominant source. Particularly for the SLV region, the Great Salt Lake can also be a source of sea salt. In PCAP episode 1, Ca-to-Na ratios were below 1, suggesting the presence of sea salts. In contrast, in episode 2 ratios of Ca-to-Na were above 1, suggesting the sources of these particulate components differ between the two PCAP periods. Due to the heavy snowfall during episode 1, road salt was continuously applied to all major roads and walkways throughout the UU campus, which may act as a local source of Na salts during periods of heavy traffic. The lack of snow cover during the latter episode and higher temperatures may suggest some influence of mineral dust from the surrounding ground surface areas, where sediments and weathered minerals are often Ca-rich (Chesselet et al., 1972; Kassomenos et al., 2012; Kuo et al., 2005). Recent studies have found the Great Salt Lake is quickly receding, suggesting the exposed the lake bed could act as a source of dust and sea salt (Hahnenberger and Nicoll, 2012; Skiles et al., 2018; Wurtsbaugh et al., 2017). However, the bulk PM2.5 chemical composition measured by the AIM-IC is not detailed enough to unambiguously identify the source of non-volatile cations observed during PCAP events.
3.2 Estimating HNO3 loss to coarse-mode particles
Gas-phase HNO3 exists in equilibrium with semi-volatile nitrate in PM2.5, and the extent of gas-to-particle partitioning depends on temperature, relative humidity, and NH3, via the formation of NH4NO3(s) in dry particles or its influence on particle acidity in deliquesced particles. At the same time, HNO3 may undergo net uptake by primary particles when it reacts with their constituents, for example CaCO3 or NaCl, to form non-volatile nitrate salts. The rate of HNO3 loss can be impacted by the composition of the reactive salt and the reactive surface area available (Seinfeld and Pandis, 2006). During the two PCAP episodes, we observed elevated midday concentrations of pNa+, pCa2+, and pMg2+ in PM2.5 using the AIM-IC.
3.2.1 Inferences from aerodynamic particle sizing
Coarse-mode particles (diameters > 2.5 µm) were not speciated during the UWFPS campaign. There are very few reports of coarse-mode nitrate in winter conditions that could offer an approximation of how much HNO3 may have been taken up by coarse-mode particles in the SLV. The study of Hansen et al. (2010) is the only one commenting on coarse-mode nitrate in northern Utah region, in Lindon, ∼ 50 km located south of the SLV, during January to February 2007. The authors observed high mass loadings, up to 80 µg m−3 of coarse aerosols (PM10–PM2.5), during PCAP events, based on measurements from two GRIMM optical particle counters (Hansen et al., 2010). The authors did not report any quantification of the chemical components of the coarse aerosols collected by integrated filter samples, although they commented that the nitrate levels were relatively low.
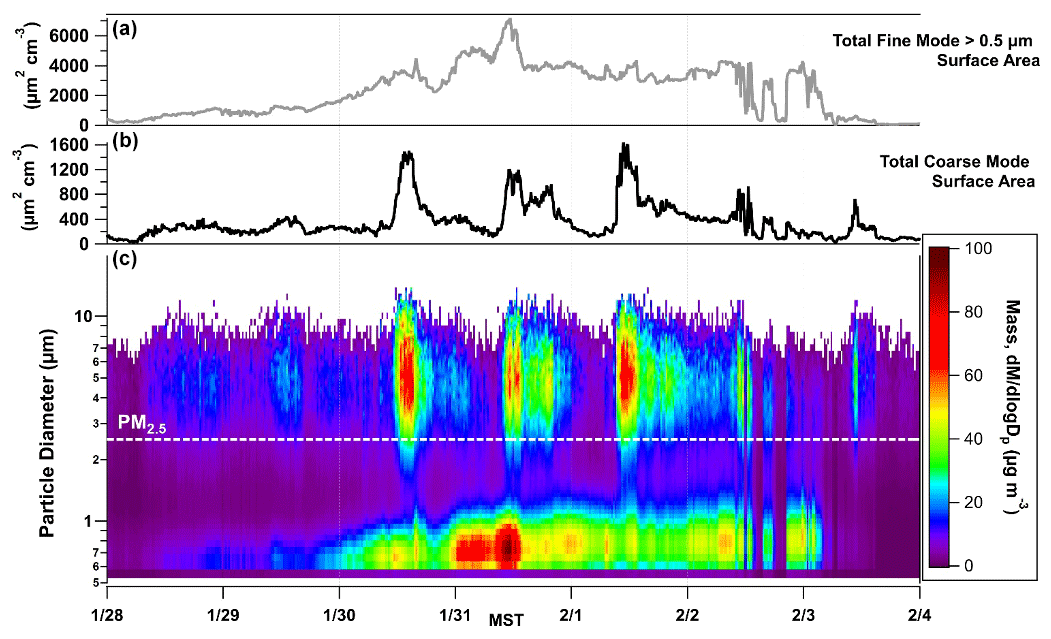
Figure 3(a, b) The total fine-mode (PM2.5) and coarse-mode (> PM2.5) surface area calculated in µm2 cm−3 from APS data. (c) The particle size distribution as a function of time, 28 January to 4 February, with particle size displayed along the y axis and color contours representing mass that is normalized by size bin (). The population of particles that the AIM-IC captures is below the labelled PM2.5 line.
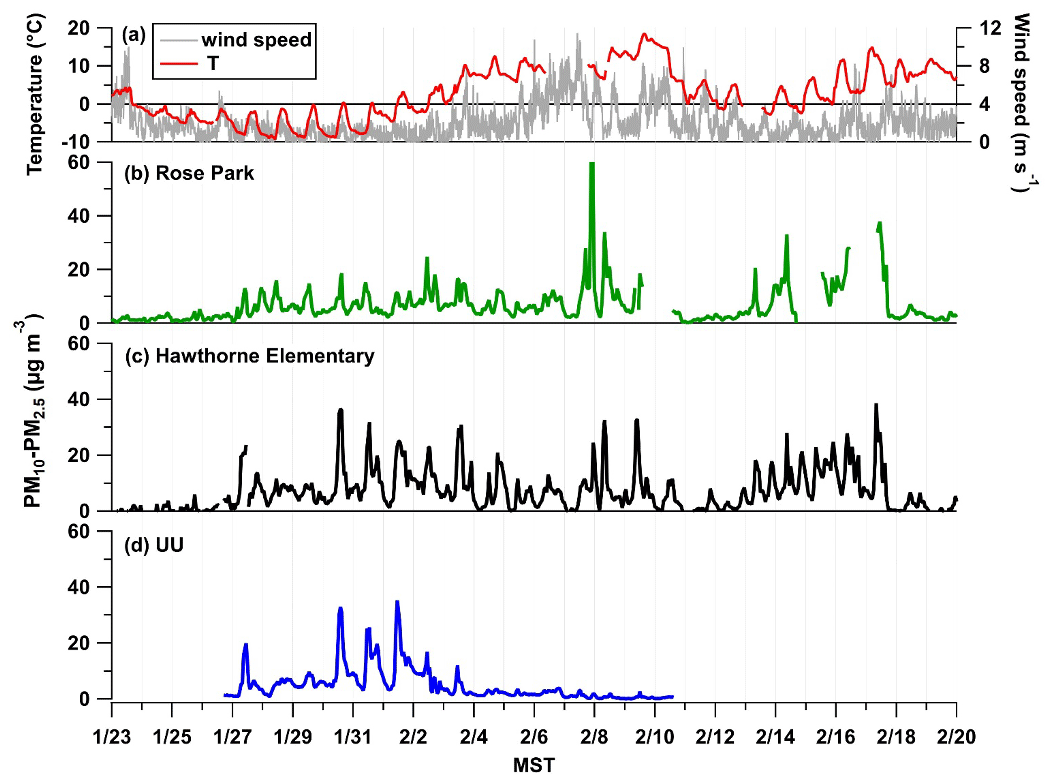
Figure 4(a) Wind speed and temperature (∘C) measured at UU. The coarse particle (PM10–PM2.5) mass loading in µg m−3 as a function of time, 28 January to 4 February 2017, at three separate ground-based sites: Rose Park (b) shown in green and Hawthorne Elementary (c) shown in black, which are EPA monitoring sites, and the UU site (d) in blue.
To obtain information about the coarse-mode loadings during PCAP events in UWFPS, APS data collected during the pollution episode from 28 January to 3 February are displayed in Fig. 3. The particle size bins are colored by mass normalized to the size bin (), clearly showing elevated midday burdens of coarse-mode particles, which become more pronounced during the intensive cold-air pool period from 30 January to 2 February 2017. This is consistent with the midday increases in coarse-mode mass observed across the SLV, shown in Fig. 4. The coarse fraction of PM10 measured at Hawthorne Elementary (the air quality regulatory site at the base of the SLV operated by UDAQ) shows a similar trend to the APS mass loading of PM10–PM2.5 observed at UU. In contrast, the Rose Park site (another UDAQ site), which is close to Great Salt Lake, exhibits moderate increases in coarse-mode mass compared to UU and Hawthorne. This difference is more evident during the calmest period of the pollution event, when the lowest wind speeds were observed, which suggests the sources of coarse particles are highly localized during PCAP events. An analysis of coarse particles by Li et al. (2013) found only moderate correlation between PM10–2.5 mass loadings and wind speed at several sites across the USA (Li et al., 2013).
The time series of the total surface area of PM larger than 2.5 µm in µm2 cm−3 (Fig. 3) shows the available coarse-mode surface area exceeds 1500 µm2 cm−3 for several hours on each of the 3 most severe pollution days, 30 January to 1 February 2017. For comparison, the total surface area of the fine-mode particles is also shown, which is roughly 3 times the maximum surface area of the coarse fraction but with less diurnal variability. However, the fine-mode aerosol nitrate is assumed to be in equilibrium with gas-phase HNO3, in contrast to the coarse-mode surface area, which could be viewed as a reactive sink allowing net uptake. The midday increases in coarse-particle surface area, therefore, could represent an important permanent sink for HNO3 if the particles are composed of reactive salts such as CaCO3 or NaCl.
A lower limit to the lifetime of HNO3 with respect to uptake by the coarse aerosol surface can be calculated to infer the potential importance of mineral–coarse aerosol particles during these heavy pollution events. The approximate first-order removal rate of HNO3 due to the heterogeneous reaction with coarse aerosols, khet, depends on its average molecular speed, c; the surface area density of coarse aerosols, SA; and the uptake coefficient, γ, given in the following expression (Ammann et al., 2013; Crowley et al., 2010; Kolb et al., 2010; Tang et al., 2017):
The variation in mineralogy of coarse-mode particles can influence the efficiency in HNO3 reactive uptake via the uptake coefficient, γ. This is represented in the range of reported uptake coefficients of HNO3 to CaCO3 (γ=0.07 at RH = 50 %) and NaCl (γ=0.11 at RH = 55 %) (Liu et al., 2008a; Saul et al., 2006). The average RH at peak coarse-mode loading was 54 %; therefore, the reported uptake coefficients close to this RH value were used in our calculations. Literature reports have shown RH significantly enhances the reaction probability of HNO3 uptake with mineral dust and sea salts (Liu et al., 2008a; Saul et al., 2006; Vlasenko et al., 2006). The detailed kinetics of HNO3 reacting with CaCO3 particles in a flow reactor by Liu et al. (2008a) found low uptake values of γ≤0.003 at 10 % RH, while at 80 % RH, γ can be ≥ 0.21. This agrees with reports from Vlasenko et al. (2006), in which HNO3 uptake on dust aerosols containing ∼ 5 % CaCO3 was also enhanced by an increase in RH. Saul et al. (2006) also found RH affects the uptake of HNO3 onto pure NaCl showing a maximum γ of 0.12 at 50 % RH, while at 85 % RH, γ is 0.05. They also observed an increase in reactivity with the presence of MgCl2 in NaCl powder. The greater reactivity of MgCl2 is consistent with the hygroscopic character of magnesium salts that facilitate the increase in adsorbed water at the particle surface, which can in turn increase the effective uptake of HNO3.
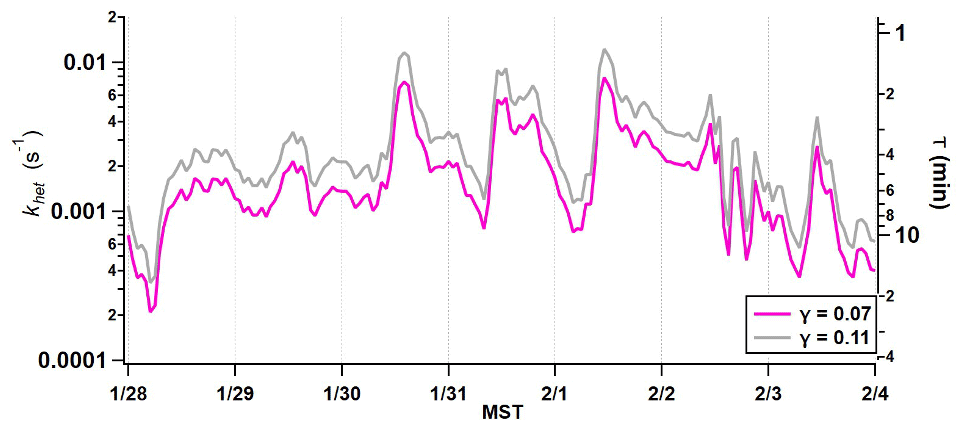
Figure 5Predicted HNO3 loss rate to coarse-particle surface area concentration measured by the APS from 28 January to 4 February 2017.
Because pNa+ and pCa2+ were the dominant non-volatile species that showed common behavior with the coarse-mode mass loading, the rates of uptake with respect to NaCl and CaCO3 were calculated to approximate how quickly HNO3 might be sequestered. Literature values for the uptake coefficients of HNO3 on NaCl (0.11 at 55 % RH) and CaCO3 (0.07 at 50 % RH) were used to estimate a lifetime against reactive uptake based on the measured coarse-mode surface area (Fenter et al., 1994; Liu et al., 2008a; Vlasenko et al., 2006). The time series of khet from 27 January to 4 February 2017 is presented in Fig. 5. The effective lifetime of HNO3 against reactive uptake to CaCO3 during episode 1 ranges from 2 to 90 min with the shortest lifetimes during periods of peak coarse-mode loading. The lifetime against NaCl (0.11) ranges from 1.3 to 57 min. These lifetime calculations assume that the entire surface is reactive and do not account for any mass transfer limitations that may occur on the particle surface. Therefore, the time range is an estimate of the upper limit to the rate of HNO3 uptake, or how quickly the reaction could potentially occur.
Under high-RH conditions, which often occur during PCAP events, it is also possible coarse particles may be deliquesced, allowing exchange between surface and bulk ions within a particle. This would result in an increased loss of nitrate if uptake were not limited to the surface. If the total mass of coarse particles measured during episode 1 were assumed to be composed of Ca(NO3)2, in which carbonate has been completely displaced, that would amount to an average of 6.2 µg m−3 of HNO3 sequestered with a maximum of 32 µg m−3 during midday. This assumes HNO3 can react with the bulk particle components, thereby representing an upper estimate of HNO3 mass loss to PM10. However, due to the size cutoff of the APS, with significant transmission losses above 10 µm, it is possible that the mass of coarse-mode particles is underestimated under some conditions.
The calculations of the removal rate do not include changes in reactive uptake associated with the changes in hygroscopicity of the resulting nitrate salts formed. The presence of calcium or magnesium nitrate salts can enhance the absorbance of water, which has been shown to increase the relative uptake of HNO3 because it is no longer limited to the particle surface, so the estimation of HNO3 loss can also be highly variable (Beichert and Finlayson-Pitts, 1996; Goodman et al., 2000). This is dependent on the deliquescence relative humidity (DRH) of the nitrate salt formed, in which DRH of Ca(NO3)2 is 10 % at 298 K (Liu et al., 2008b; Sullivan et al., 2009a, b) and NaNO3 is 81 % at 273 K (Seinfeld and Pandis, 2006). The DRH is also temperature-dependent and tends to increase with decreasing temperature. The temperatures during episode 1 were consistently below 273 K; therefore, it is assumed DRH would be higher. The inference from the heterogeneous uptake calculation suggests that the loss of HNO3 can be very rapid. The question of how this loss in HNO3 to coarse aerosols could be shifting the gas-to-particle equilibrium that exists between HNO3, NH3, and NH4NO3 is still unknown. Therefore, further investigation of time-resolved coarse-aerosol chemical composition, in addition to PM2.5 composition, is needed to better quantify how much coarse aerosols may be limiting HNO3 availability during these PCAP pollution events and elucidate their effect on NH4NO3 formation.
Studies from coastal sites provide evidence that the uptake of nitrate to coarse-model aerosols can be substantial. For example, single particle measurements of sea salt particles using an aerosol time-of-flight mass spectrometer (ATOFMS) in California found that the chloride mole fraction could decrease from 0.3 to 0, while the nitrate mole fraction could increase from 0 to 0.5 following exposure of sea salt to urban air pollution (Gard et al., 1998). In coastal Florida, measurements using an online ion chromatographic technique showed that deliquesced sea salt particles could have more than 50 % of the chloride content replaced by nitrate (Dasgupta et al., 2007). Measurements from a size-resolved integrated sampler showed that nitrate peaked in the coarse mode, where its concentration was close to that of chloride (on a molar basis) and half that of sodium. Size-resolved particle composition measurements near the coast in British Columbia during the summer showed that during the day, nitrate was only present in coarse-mode particles (corresponding to a deficiency in chloride), whereas during the night, nitrate could also be measured in accumulation mode particles (Anlauf et al., 2006). In addition, Lee et al. (2018) identify that coarse-mode nitrate particles, formed from acid displacement, are more important in national park areas in Arizona and Tennessee. Measurements were taken during spring and summer, respectively, so did not have competing NH4NO3 formation; however, they do highlight the fact coarse particle nitrate extends into the PM2.5 regime and not all nitrate in this regime is associated with NH4.
3.2.2 Evidence from snow analysis
During the campaign period, a snow event occurred prior to the first PCAP episode (21 January), in which the snow remained on the surface until 3 February. This provided a snowpack that was subjected to the first pollution event, providing a record of chemical composition changes caused by PCAP exposure. A snow event that happened later in the season occurred during clean conditions (23 February to 2 March 2017), when no PCAP was observed, thus providing a representative example of chemical composition changes in snow not associated with PCAP exposure.
Chemical analysis of the snowpack exposed to PCAP episode 1 reflects a combination of cloud water composition and the atmospheric gas and particle composition of species scavenged by snowfall or later deposited to the snow, including particles larger than the PM2.5 cutoff monitored by the AIM-IC. Figure 6 shows a scatter plot of the NH versus NO measured in the snowpack, where each data point is representative of the averaged chemical composition of the entire snowpack (sampling area 0.008 m2) on a single day, and in the atmosphere by the AIM-IC (gas phase + PM2.5), where PM2.5 NO is assumed to be equivalent to 90 % of PM2.5 NH on a molar basis, and by a Twin Otter aircraft (gas phase + PM1). Aerosol particle measurements from the aircraft do not include non-volatile cations and their associated nitrates, which the AMS does not measure (Franchin et al., 2018). Gas-phase HNO3 measurements collected on the aircraft are from the University of Washington high-resolution time-of-flight chemical ionization mass spectrometer (HR-ToF-CIMS) instrument operated similarly to the method described in Lee et al. (2018). Gas-phase NH3 measurements from the Twin Otter were taken using a quantum cascade tunable infrared differential absorption spectrometer (QC-TILDAS) instrument (Aerodyne Research Inc, MA, USA) and are described in Moravek et al. (2019). Based on aircraft data (Franchin et al., 2018) and AIM-IC measurements at the ground site, the sum of nitrate in the gas phase and particle phases, or total NO3 (TNO3) per cubic metre of ambient air, is less than the sum of ammonia in the gas phase and particle phases, total NHx per cubic metre of ambient air. Therefore, we might expect that there would be more ammonium depositing into the snow compared to nitrate. However, in Fig. 6, it is clear that the deposition of NHx is less than half that of total NO3 on a molar basis for the highest deposition amounts. The average TNO3 : NHx molar ratio of 3 : 1 measured in the snowpack is significantly different compared to what is observed in the atmospheric measurements. This implies that there could be another source of nitrate being deposited to the snow that is not reflected in the atmospheric measurements of the gas-phase and fine-mode particles. Therefore, there is a missing portion of the overall nitrate budget that is connected to how much NH4NO3 can be formed.
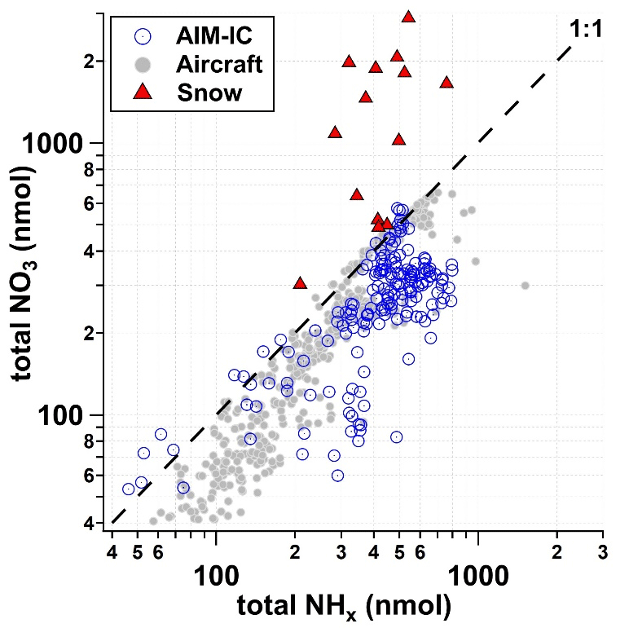
Figure 6Total NO3 (pNO + HNO3) with respect to total NHx measured and predicted from AIM-IC data (grey circles), aircraft measurements (open blue circles) per cubic metre of ambient air and snow (red triangles) within 0.008 m2 sampling area from 21 January to 3 February 2017.
Further investigation into the composition of the snowpack reveals there is a strong correlation between the amount of NO and the amount of Ca2+ (r2=0.836), seen in Fig. 7. Both Na+ and Ca2+ are also found in the snowpack in higher abundances than NH, despite being present at much lower levels in PM2.5. The larger concentrations of pNa+ relative to pCa2+ seen in the AIM-IC PM2.5 data are consistent with the larger concentrations of Na+ measured in the snowpack relative to Ca2+ concentrations.
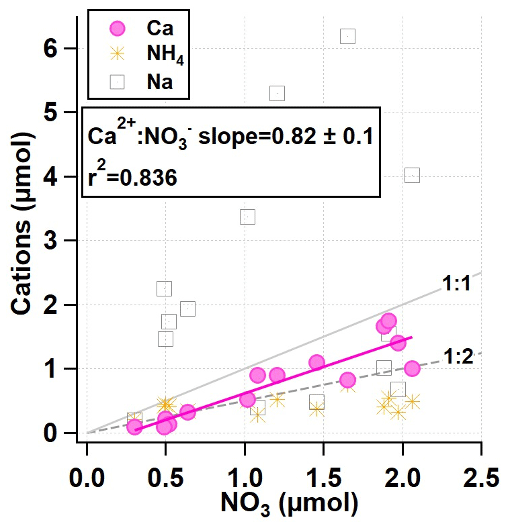
Figure 7Daily total micromoles of NH4, Ca, and Na vs. NO3 within the snow from 21 January to 3 February 2017, leading into the most severe PCAP period from 27 January to 4 February 2017.
This suggests the coarse-mode aerosols during this PCAP event were Na-rich. Due to the large excess of micromoles of Na+ when compared to NO, the amount of Cl− was examined to determine whether Na-rich particles came in the form of NaCl salt. The snowpack showed the highest concentrations of Cl− out of all of the inorganic anions measured, over 10 times more than NO and SO combined. The total water-soluble ion balance measured in the snowpack shows a slight excess of anions, partially due to the high Cl− content. However, the concentrations of Cl− measured in the snow were greater than what can be accounted for by observed Na+. The low concentrations of Mg2+ in the snowpack had no noticeable correlation with Cl−. A closer look at the daily inorganic composition changes and decrease in snowpack height reveals Ca2+ and NO exhibit similar trends throughout the lifetime of the snowpack. This is also true for changes in K+ and Cl− total snow column concentrations.
The proportions of non-volatile cations, where K+ > Na+ > Ca2+ > Mg2+, found in the snow exhibit a similar distribution to that observed in PM2.5 composition. We infer that our measurements of these constituents in PM2.5 also reflect a larger unmeasured contribution of these non-volatile cations in the coarse mode. In addition, the nitrate present in the snow appears to have a strong correlation with Ca2+, suggesting there could be a significant amount of particle nitrate in the coarse mode that is not accounted for in PM2.5 measurements. This underestimation of particle nitrate during peak coarse-mode periods that occur during the day could lead to an underestimation in the production rate of nitrate due to photochemistry. This could impact estimates of the sensitivity of PM2.5 to NH3 and NOx emissions reductions.
3.2.3 ISORROPIA analysis
The comparison of ISORROPIA model runs of predicted NH4NO3 (µg m−3) with and without non-volatile components measured by the AIM-IC are depicted in Fig. 8 through pollution episode 2 from 13 to 19 February 2017 when both anion and cation gas and particle data were available. ISORROPIA calculates the equilibrium concentrations of the NH–SO–NO–Na+–Cl−–K+–Mg2+–Ca2+–H2O system. Overall, the difference in model outputs for these two input conditions demonstrates how influential the presence of non-volatiles (pNa+, pCa2+, pMg2+, and pK+) is on the thermodynamic equilibrium between HNO3 and its particulate counterpart pNO.
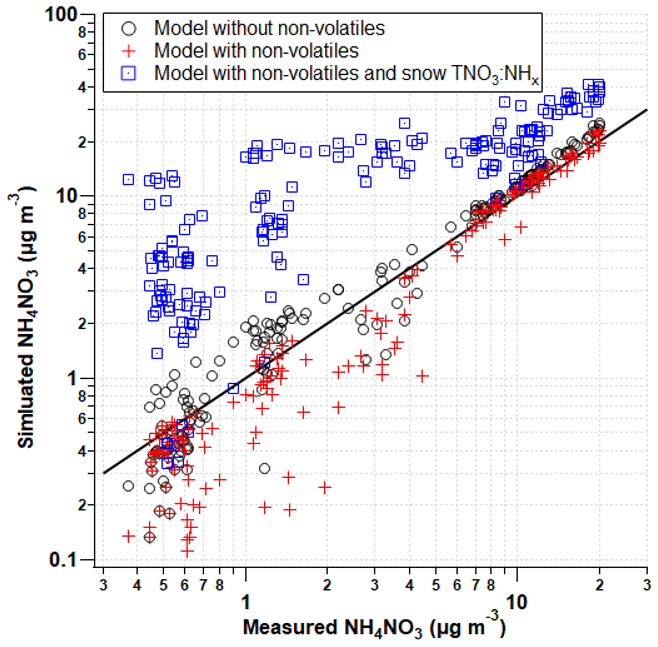
Figure 8Predicted concentrations (ISORROPIA) with respected to measured (AIM-IC) ambient concentrations of NH4NO3 in µg m−3 through the second pollution event from 13 to 19 February 2017. The model was run in three separate conditions: (1) with (red cross) and (2) without (open black circle) the addition of pK+, pCa2+, and pMg2+ and (3) with non-volatiles and the increase in total nitrate based on the ratio of NH to NO measured in the snow.
Previous studies have shown the inclusion of non-volatile cations in thermodynamic models can more accurately reproduce gas-particle partitioning observations by correctly reflecting the ion balance and the ammonium : sulfate ratio (Guo et al., 2018). With the addition of pCl−, pNa+, pCa2+, pMg2+, and pK+ in ISORROPIA model runs, the model consistently underpredicts the concentrations of NH4NO3 observed. This underestimation is expected because the implicit assumption in the ISORROPIA run is that all the non-volatile cations are associated with particle nitrate, which is unlikely to be the case. The model also does not accommodate the presence of carbonate, nor does the AIM-IC measure particulate carbonate, which can also associate with non-volatile cations. Therefore, the model runs represent an upper limit of how much nitrate could be permanently trapped in the particulate phase. The model outputs imply that some non-zero fraction of the nitrate in the gas + PM2.5 system is associated with non-volatile cations. Based on the strong relationship ISORROPIA predicts between non-volatile cations and particle nitrate, the next step is to determine how sensitive NH4NO3 formation is to this portion of missing nitrate. Figure 8 demonstrates how much more NH4NO3 could be formed if HNO3 was not sequestered by the coarse particles, depicted in blue squares. Based on measured gas-phase NH3 and pNH, it is assumed there is a very little coarse-mode NH in the atmosphere. To estimate the missing nitrate budget associated with coarse particles, assuming the total concentration of snow nitrate is derived from coarse particles is unrealistic. Therefore, with ambient NHx measurements as a point of reference, the total NH in the snow was used to estimate the fraction of snow nitrate potentially from coarse particles, in the absence of any other direct coarse-mode measurements. The total nitrate input into ISORROPIA was calculated using the NO-to-NH ratio observed in the snowpack during the first PCAP event. This serves as an upper limit of the missing nitrate budget and the impact this HNO3 loss has on NH4NO3 formation. As seen in Fig. 6, the TNO concentration was on average 2.5 times greater than the TNH concentration measured in the snowpack. This ratio is strictly for the concentrations measured during the PCAP event. When averaging TNO : TNH molar ratios for the full lifetime of the snowpack, the average ratio is slightly greater (3). This average ratio estimates the relative amount of TNO that may come from coarse particles. This does not account for HNO3 dry deposition loss; therefore, the ratio of NO to NH is an overestimate. However, with the combination of stable PCAP conditions, in which the vertical mixing is suppressed, and relatively low ambient concentrations of HNO3 (< 1 ppb), the dry deposition velocities would be relatively small. Therefore, this overestimate is within reason. This average molar ratio of 2.5 measured during the pollution event was applied to the total NHx measured by the AIM-IC and used as the total nitrate input into ISORROPIA along with pCl−, pNa+, pCa2+, pMg2+, and pK+ concentrations observed by the AIM-IC. Overall, the model predicts greater amounts of NH4NO3 and, therefore, PM2.5 will form. Based on the upper-limit estimates of the missing nitrate, the increased amounts of NH4NO3 modelled also represent an upper limit of how much more PM could potentially form. When observed NH4NO3 concentrations are above 10 µg m−3, the model predicts roughly 2 times more NH4NO3 mass will form when nitrate lost to coarse particles is accounted for. The additional modelled pNO3 mass is on average 6.8 µg m−3 with a maximum of 18 µg m−3, which is within the upper-limit range of total nitrate loss predicted when assuming uptake to the entire bulk of the aerosol particle. This simple analysis also shows how strongly HNO3-limited the PCAP event in the SLV was, when additional nitrate led to increases in NH4NO3. This suggests the coarse particles have the potential to control NH4NO3 formation indirectly by acting as a permanent sink for HNO3, thereby reducing the amount of available HNO3 to form PM2.5. Therefore, future campaign studies should also include coarse particle speciation, especially in systems involving semi-volatile nitrate salts.
The AIM-IC measurements confirmed the dominance of NH4NO3 in wintertime PM2.5 pollution events in the SLV. The detection of non-volatile cations (pNa+, pK+, pCa2+, and pMg2+) in PM2.5 by the AIM-IC suggests the presence of mineral dust and/or salt during PCAP pollution events, which can potentially impact the availability of HNO3. This is due to the reactive uptake of HNO3 onto NaCl- and CaCO3-containing particles, which can be predominantly found in the coarse mode. This can introduce a permanent sink for HNO3. Due to the lack of coarse-mode speciation, auxiliary data were used to estimate the amount of HNO3 potentially lost to reactive uptake. The APS surface area data were used to calculate a lifetime for HNO3 with respect to uptake that was on the order of minutes, depending on the uptake coefficient used, which is influenced by particle composition (Fenter et al., 1994; Liu et al., 2008b; Vlasenko et al., 2006). The potential presence of coarse-mode nitrate was also supported by the strong correlation between total Ca2+ and total NO observed in the snowpack. Total NO in the snowpack was 2.8 times larger than the total NH, implying there is additional NO that is not observed by PM2.5 pNO and gas-phase HNO3 measurements alone.
The equilibrium dynamics were explored by thermodynamic modelling of trace gas and PM2.5 composition, during episode 2. Despite the discrepancies between observed and modelled NH4NO3 concentrations during PCAP episode 2, the inclusion of coarse nitrate, from snowpack estimates, into the model shows that coarse particles could be limiting a significant portion of the HNO3 being generated, preventing its reaction with NH3 to form NH4NO3. The extent to which coarse-mode aerosols are limiting PM2.5 formation remains unanswered and warrants further investigation of coarse-mode composition and the role these particles play in the atmospheric chemistry during pollution events.
Ground site and aircraft data from UWFPS can be found here: https://csl.noaa.gov/groups/csl7/measurements/2017uwfps/ (NOAA, 2017).
AH performed the measurements and analysis of snowpack and inorganic gas and particles and wrote the paper. JGM provided input at all stages regarding the measurements, analysis, and discussion of the results. AM collected and analyzed aircraft NH3 data. AF and AMM obtained and analyzed the aircraft-based AMS data. JCL provided TOEM and NOx instrumentation. RB collected and processed TEOM data. AGH and RCP collected and processed APS data. LG collected HR-ToF-CIMS aircraft data. BHL provided processed HR-ToF-CIMS data. SSB and MB planned and organized the UWFPS measurement campaign. All authors discussed the results and contributed to the final paper.
The authors declare that they have no conflict of interest.
The authors would like to thank all the members of the UWFPS campaign. The authors would also like to thank many members from the University of Utah in the Atmospheric Sciences department for their support. We would especially like to thank Catherine Chachere and Lauren Zuromski for processing the APS data. The authors acknowledge the funding support from the Michael Smith Foreign Study Supplements Program awarded by the Natural Sciences and Engineering Research Council of Canada. NOAA acknowledges support for Twin Otter flights from the Utah Division of Air Quality under agreement number 16-049696.
This research has been supported by the Natural Sciences and Engineering Research Council of Canada (Michael Smith Foreign Study Supplements Program) and the Utah Division of Air Quality (agreement no. 16-049696).
This paper was edited by Ryan Sullivan and reviewed by two anonymous referees.
Ammann, M., Cox, R. A., Crowley, J. N., Jenkin, M. E., Mellouki, A., Rossi, M. J., Troe, J., and Wallington, T. J.: Evaluated kinetic and photochemical data for atmospheric chemistry: Volume VI – heterogeneous reactions with liquid substrates, Atmos. Chem. Phys., 13, 8045–8228, https://doi.org/10.5194/acp-13-8045-2013, 2013.
Anlauf, K., Li, S. M., Leaitch, R., Brook, J., Hayden, K., Toom-Sauntry, D., and Wiebe, A.: Ionic composition and size characteristics of particles in the Lower Fraser Valley: Pacific 2001 field study, Atmos. Environ., 40, 2662–2675, https://doi.org/10.1016/j.atmosenv.2005.12.027, 2006.
Baasandorj, M., Hoch, S. W., Bares, R., Lin, J. C., Brown, S. S., Millet, D. B., Martin, R., Kelly, K., Zarzana, K. J., Whiteman, C. D., Dube, W. P., Tonnesen, G., Jaramillo, I. C., and Sohl, J.: Coupling between Chemical and Meteorological Processes under Persistent Cold-Air Pool Conditions: Evolution of Wintertime PM2.5 Pollution Events and N2O5Observations in Utah's Salt Lake Valley, Environ. Sci. Technol., 51, 5941–5950, https://doi.org/10.1021/acs.est.6b06603, 2017.
Bares, R., Lin, J. C., Hoch, S. W., Baasandorj, M., Mendoza, D. L., Fasoli, B., Mitchell, L., Catharine, D., and Stephens, B. B.: The Wintertime Covariation of CO2 and Criteria Pollutants in an Urban Valley of the Western United States, J. Geophys. Res.-Atmos., 123, 2684–2703, https://doi.org/10.1002/2017JD027917, 2018.
Behera, S. N., Sharma, M., Aneja, V. P., and Balasubramanian, R.: Ammonia in the atmosphere: A review on emission sources, atmospheric chemistry and deposition on terrestrial bodies, Environ. Sci. Pollut. Res., 20, 8092–8131, https://doi.org/10.1007/s11356-013-2051-9, 2013.
Beichert, P. and Finlayson-Pitts, B. J.: Knudsen Cell Studies of the Uptake of Gaseous HNO 3 and Other Oxides of Nitrogen on Solid NaCl: The Role of Surface-Adsorbed Water, J. Phys. Chem., 100, 15218–15228, https://doi.org/10.1021/jp960925u, 1996.
Bernardoni, V., Elser, M., Valli, G., Valentini, S., Bigi, A., Fermo, P., Piazzalunga, A., and Vecchi, R.: Size-segregated aerosol in a hot-spot pollution urban area: Chemical composition and three-way source apportionment, Environ. Pollut., 231, 601–611, https://doi.org/10.1016/j.envpol.2017.08.040, 2017.
Bishop, G. A., Peddle, A. M., Stedman, D. H., Air, C., Board, R., Street, I., and Box, P. O.: On-Road Emission Measurements of Reactive Nitrogen Compounds from Three California Cities, Environ. Sci. Technol., 44, 3616–3620, 2010.
Bishop, G. A., Stedman, D. H., Burgard, D. A., and Atkinson, O.: High-Mileage Light-Duty Fleet Vehicle Emissions: Their Potentially Overlooked Importance, Environ. Sci. Technol., 50, 5405–5411, https://doi.org/10.1021/acs.est.6b00717, 2016.
Chesselet, R., Morelli, J., and Buat-Menard, P.: Variations in ionic ratios between reference sea water and marine aerosols, J. Geophys. Res., 77, 5116–5131, https://doi.org/10.1029/JC077i027p05116, 1972.
Crowley, J. N., Ammann, M., Cox, R. A., Hynes, R. G., Jenkin, M. E., Mellouki, A., Rossi, M. J., Troe, J., and Wallington, T. J.: Evaluated kinetic and photochemical data for atmospheric chemistry: Volume V – heterogeneous reactions on solid substrates, Atmos. Chem. Phys., 10, 9059–9223, https://doi.org/10.5194/acp-10-9059-2010, 2010.
Dasgupta, P. K., Campbell, S. W., Al-Horr, R. S., Ullah, S. M. R., Li, J., Amalfitano, C., and Poor, N. D.: Conversion of sea salt aerosol to NaNO3and the production of HCl: Analysis of temporal behavior of aerosol chloride/nitrate and gaseous HCl/HNO3 concentrations with AIM, Atmos. Environ., 41, 4242–4257, https://doi.org/10.1016/j.atmosenv.2006.09.054, 2007.
Fenter, F. F., Caloz, F., and Rossi, M. J.: Kinetics of nitric acid uptake by salt, J. Phys. Chem., 98, 9801–9810, https://doi.org/10.1021/j100090a014, 1994.
Fountoukis, C. and Nenes, A.: ISORROPIA II: a computationally efficient thermodynamic equilibrium model for K+–Ca2+–Mg2+––Na+–––Cl−–H2O aerosols, Atmos. Chem. Phys., 7, 4639–4659, https://doi.org/10.5194/acp-7-4639-2007, 2007.
Franchin, A., Fibiger, D. L., Goldberger, L., McDuffie, E. E., Moravek, A., Womack, C. C., Crosman, E. T., Docherty, K. S., Dube, W. P., Hoch, S. W., Lee, B. H., Long, R., Murphy, J. G., Thornton, J. A., Brown, S. S., Baasandorj, M., and Middlebrook, A. M.: Airborne and ground-based observations of ammonium-nitrate-dominated aerosols in a shallow boundary layer during intense winter pollution episodes in northern Utah, Atmos. Chem. Phys., 18, 17259–17276, https://doi.org/10.5194/acp-18-17259-2018, 2018.
Gao, Z., Wang, X., Shen, L., Xiang, H., and Wang, H.: Observation and Source Apportionment of Trace Gases, Water-Soluble Ions and Carbonaceous Aerosol During a Haze Episode in Wuhan, Atmosphere, 10, 397, https://doi.org/10.3390/atmos10070397, 2019.
Gard, E. E., Kleeman, M. J., Gross, D. S., Hughes, L. S., Allen, J. O., Morrical, B. D., Fergenson, D. P., Dienes, T., Gälli, M. E., Johnson, R. J., Cass, G. R., and Prather, K. A.: Direct observation of heterogeneous chemistry in the atmosphere, Science, 279, 1184–1187, https://doi.org/10.1126/science.279.5354.1184, 1998.
Goodman, A. L., Underwood, G. M., and Grassian, V. H.: A laboratory study of the heterogeneous reaction of nitric acid on calcium carbonate particles, J. Geophys. Res., 105, 29053–29064, 2000.
Green, M. C., Chow, J. C., Watson, J. G., Dick, K., and Inouye, D.: Effects of snow cover and atmospheric stability on winter PM2.5concentrations in western U.S. Valleys, J. Appl. Meteorol. Climatol., 54, 1191–1201, https://doi.org/10.1175/JAMC-D-14-0191.1, 2015.
Guo, H., Nenes, A., and Weber, R. J.: The underappreciated role of nonvolatile cations in aerosol ammonium-sulfate molar ratios, Atmos. Chem. Phys., 18, 17307–17323, https://doi.org/10.5194/acp-18-17307-2018, 2018.
Hahnenberger, M. and Nicoll, K.: Meteorological characteristics of dust storm events in the eastern Great Basin of Utah, U.S.A., Atmos. Environ., 60, 601–612, https://doi.org/10.1016/j.atmosenv.2012.06.029, 2012.
Hansen, J. C., Woolwine, W. R., Bates, B. L., Clark, J. M., Kuprov, R. Y., Mukherjee, P., Murray, J. A., Simmons, M. A., Waite, M. F., Eatough, N. L., Eatough, D. J., Long, R., and Grover, B. D.: Semicontinuous PM2.5 and PM10 mass and composition measurements in Lindon, Utah, during winter 2007, J. Air Waste Manag. Assoc., 60, 346–355, https://doi.org/10.3155/1047-3289.60.3.346, 2010.
Hansen, K., Sørensen, L. L., Hertel, O., Geels, C., Skjøth, C. A., Jensen, B., and Boegh, E.: Ammonia emissions from deciduous forest after leaf fall, Biogeosciences, 10, 4577–4589, https://doi.org/10.5194/bg-10-4577-2013, 2013.
Kassomenos, P., Vardoulakis, S., Chaloulakou, A., Grivas, G., Borge, R., and Lumbreras, J.: Levels, sources and seasonality of coarse particles (PM10–PM2.5) in three European capitals – Implications for particulate pollution control, Atmos. Environ., 54, 337–347, https://doi.org/10.1016/j.atmosenv.2012.02.051, 2012.
Kelly, K. E., Kotchenruther, R., Kuprov, R., and Silcox, G. D.: Receptor model source attributions for Utah's Salt Lake City airshed and the impacts of wintertime secondary ammonium nitrate and ammonium chloride aerosol, J. Air Waste Manag. Assoc., 63, 575–590, https://doi.org/10.1080/10962247.2013.774819, 2013.
Kolb, C. E., Cox, R. A., Abbatt, J. P. D., Ammann, M., Davis, E. J., Donaldson, D. J., Garrett, B. C., George, C., Griffiths, P. T., Hanson, D. R., Kulmala, M., McFiggans, G., Pöschl, U., Riipinen, I., Rossi, M. J., Rudich, Y., Wagner, P. E., Winkler, P. M., Worsnop, D. R., and O' Dowd, C. D.: An overview of current issues in the uptake of atmospheric trace gases by aerosols and clouds, Atmos. Chem. Phys., 10, 10561–10605, https://doi.org/10.5194/acp-10-10561-2010, 2010.
Kuo, C. Y., Chen, H. H., Shih, J. F., and Wong, R. H.: Variations of nitrate and sulfate in the atmosphere on days of high and low particulate matters, Environ. Toxicol. Chem., 24, 846–851, https://doi.org/10.1897/04-198R.1, 2005.
Kuprov, R., Eatough, D. J., Cruickshank, T., Olson, N., Cropper, P. M., and Hansen, J. C.: Composition and secondary formation of fine particulate matter in the Salt Lake Valley: Winter 2009, J. Air Waste Manag. Assoc., 64, 957–969, https://doi.org/10.1080/10962247.2014.903878, 2014.
Lareau, N. P., Crosman, E., Whiteman, C. D., Horel, J. D., Hoch, S. W., Brown, W. O. J., and Horst, T. W.: The persistent cold-air pool study, Bull. Am. Meteorol. Soc., 94, 51–63, https://doi.org/10.1175/BAMS-D-11-00255.1, 2013.
Lee, B. H., Lopez-Hilfiker, F. D., Veres, P. R., McDuffie, E. E., Fibiger, D. L., Sparks, T. L., Ebben, C. J., Green, J. R., Schroder, J. C., Campuzano-Jost, P., Iyer, S., D'Ambro, E. L., Schobesberger, S., Brown, S. S., Wooldridge, P. J., Cohen, R. C., Fiddler, M. N., Bililign, S., Jimenez, J. L., Kurtén, T., Weinheimer, A. J., Jaegle, L., and Thornton, J. A.: Flight Deployment of a High-Resolution Time-of-Flight Chemical Ionization Mass Spectrometer: Observations of Reactive Halogen and Nitrogen Oxide Species, J. Geophys. Res.-Atmos., 123, 7670–7686, https://doi.org/10.1029/2017JD028082, 2018.
Li, R., Wiedinmyer, C., Baker, K. R., and Hannigan, M. P.: Characterization of coarse particulate matter in the western United States: a comparison between observation and modeling, Atmos. Chem. Phys., 13, 1311–1327, https://doi.org/10.5194/acp-13-1311-2013, 2013.
Liu, Y., Gibson, E. R., Cain, J. P., Wang, H., Grassian, V. H., and Laskin, A.: Kinetics of heterogeneous reaction of CaCO3 particles with gaseous HNO3 over a wide range of humidity, J. Phys. Chem. A, 112, 1561–1571, https://doi.org/10.1021/jp076169h, 2008a.
Liu, Y. J., Zhu, T., Zhao, D. F., and Zhang, Z. F.: Investigation of the hygroscopic properties of Ca(NO3)2 and internally mixed Ca(NO3)2 CaCO3 particles by micro-Raman spectrometry, Atmos. Chem. Phys., 8, 7205–7215, https://doi.org/10.5194/acp-8-7205-2008, 2008b.
Livingston, C., Rieger, P., and Winer, A.: Ammonia emissions from a representative in-use fleet of light and medium-duty vehicles in the California South Coast Air Basin, Atmos. Environ., 43, 3326–3333, https://doi.org/10.1016/j.atmosenv.2009.04.009, 2009.
Long, R. W., Smith, R., Smith, S., Eatough, N. L., Mangelson, N. F., Eatough, D. J., Pope, C. A., and Wilson, W. E.: Sources of fine particulate material along the wasatch front, Energ. Fuel., 16, 282–293, https://doi.org/10.1021/ef010168l, 2002.
Long, R. W., Eatough, N. L., Mangelson, N. F., Thompson, W., Fiet, K., Smith, S., Smith, R., Eatough, D. J., Pope, C. A., and Wilson, W. E.: The measurement of PM2.5, including semi-volatile components, in the EMPACT program: results from the Salt Lake City Study, Atmos. Environ., 37, 4407–4417, https://doi.org/10.1016/s1352-2310(03)00585-5, 2003.
Malek, E., Davis, T., Martin, R. S., and Silva, P. J.: Meteorological and environmental aspects of one of the worst national air pollution episodes (January, 2004) in Logan, Cache Valley, Utah, USA, Atmos. Res., 79, 108–122, https://doi.org/10.1016/j.atmosres.2005.05.003, 2006.
Mangelson, N. F., Lewis, L., Joseph, J. M., Cui, W., Machir, J., Eatough, D. J., Rees, L. B., Wilkerson, T., and Jensen, D. T.: The contribution of sulfate and nitrate to atmospheric fine particles during winter inversion fogs in cache valley, utah, J. Air Waste Manag. Assoc., 47, 167–175, https://doi.org/10.1080/10473289.1997.10464429, 1997.
Markovic, M. Z., VandenBoer, T. C., and Murphy, J. G.: Characterization and optimization of an online system for the simultaneous measurement of atmospheric water-soluble constituents in the gas and particle phases, J. Environ. Monit., 14, 1872–84, https://doi.org/10.1039/c2em00004k, 2012.
Maxwell-Meier, K., Weber, R., Song, C., Orsini, D., Ma, Y., Carmichael, G. R., and Streets, D. G.: Inorganic composition of fine particles in mixed mineral dust-pollution plumes observed from airborne measurements during ACE-Asia, J. Geophys. Res.-Atmos., 109, 1–20, https://doi.org/10.1029/2003JD004464, 2004.
McDuffie, E. E., Womack, C. C., Fibiger, D. L., Dube, W. P., Franchin, A., Middlebrook, A. M., Goldberger, L., Lee, B. H., Thornton, J. A., Moravek, A., Murphy, J. G., Baasandorj, M., and Brown, S. S.: On the contribution of nocturnal heterogeneous reactive nitrogen chemistry to particulate matter formation during wintertime pollution events in Northern Utah, Atmos. Chem. Phys., 19, 9287–9308, https://doi.org/10.5194/acp-19-9287-2019, 2019.
Moravek, A., Murphy, J. G., Hrdina, A., Lin, J. C., Pennell, C., Franchin, A., Middlebrook, A. M., Fibiger, D. L., Womack, C. C., McDuffie, E. E., Martin, R., Moore, K., Baasandorj, M., and Brown, S. S.: Wintertime spatial distribution of ammonia and its emission sources in the Great Salt Lake region, Atmos. Chem. Phys., 19, 15691–15709, https://doi.org/10.5194/acp-19-15691-2019, 2019.
Mouteva, G. O., Randerson, J. T., Fahrni, S. M., Bush, S. E., Ehleringer, J. R., Xu, X., Santos, G. M., Kuprov, R., Schichtel, B. A., and Czimczik, C. I.: Using radiocarbon to constrain black and organic carbon aerosol sources in Salt Lake City, J. Geophys. Res.-Atmos., 122, 9843–9857, https://doi.org/10.1002/2017JD026519, 2017.
Mozurkewich, M.: The dissociation constant of ammonium nitrate and its dependence on temperature, relative humidity and particle size, Atmos. Environ. Part A, Gen. Top., 27, 261–270, https://doi.org/10.1016/0960-1686(93)90356-4, 1993.
National Oceanic and Atmospheric Administration (NOAA): Utah Winter Fine Particulate Study 2017, available at: https://csl.noaa.gov/groups/csl7/measurements/2017uwfps/ (last access: 5 October 2019), 2017.
Nenes, A., Pandis, S. N., and Pilinis, C.: ISORROPIA: A new thermodynamic equilibrium model for multiphase multicomponent inorganic aerosols, Aquat. Geoch., 4, 123–152, https://doi.org/10.1023/A:1009604003981, 1998.
Nowak, J. B., Neuman, J. A., Bahreini, R., Brock, C. A., Middlebrook, A. M., Wollny, A. G., Holloway, J. S., Peischl, J., Ryerson, T. B., and Fehsenfeld, F. C.: Airborne observations of ammonia and ammonium nitrate formation over Houston, Texas, J. Geophys. Res.-Atmos., 115, 1–12, https://doi.org/10.1029/2010JD014195, 2010.
Nowak, J. B., Neuman, J. A., Bahreini, R., Middlebrook, A. M., Holloway, J. S., McKeen, S. A., Parrish, D. D., Ryerson, T. B., and Trainer, M.: Ammonia sources in the California South Coast Air Basin and their impact on ammonium nitrate formation, Geophys. Res. Lett., 39, 6–11, https://doi.org/10.1029/2012GL051197, 2012.
Pope, C. A., Hansen, M. L., Long, R. W., Nielsen, K. R., Eatough, N. L., Wilson, W. E., and Eatough, D. J.: Ambient Particulate Air Pollution, Heart Rate Variability, and Blood Markers of Inflammation in a Panel of Elderly Subjects, Environ. Health Perspect., 112, 339–345, https://doi.org/10.1289/ehp.6588, 2003.
Pope, C. A., Krewski, D., Gapstur, S. M., Turner, M. C., Jerrett, M., and Burnett, R. T.: Fine Particulate Air Pollution and Mortality: Response to Enstrom's Reanalysis of the American Cancer Society Cancer Prevention Study II Cohort, Dose-Response, 15, 1–5, https://doi.org/10.1177/1559325817746303, 2017.
Pósfai, M., Simonics, R., Li, J., Hobbs, P. V., and Buseck, P. R.: Individual aerosol particles from biomass burning in southern Africa: 1. Compositions and size distributions of carbonaceous particles, J. Geophys. Res.-Atmos., 108, 1–13, https://doi.org/10.1029/2002jd002291, 2003.
Rissler, J., Vestin, A., Swietlicki, E., Fisch, G., Zhou, J., Artaxo, P., and Andreae, M. O.: Size distribution and hygroscopic properties of aerosol particles from dry-season biomass burning in Amazonia, Atmos. Chem. Phys., 6, 471–491, https://doi.org/10.5194/acp-6-471-2006, 2006.
Roth, P., Yang, J., Fofie, E., Cocker, D. R., Durbin, T. D., Brezny, R., Geller, M., Asa-Awuku, A., and Karavalakis, G.: Catalyzed Gasoline Particulate Filters Reduce Secondary Organic Aerosol Production from Gasoline Direct Injection Vehicles, Environ. Sci. Technol., 53, 3037–3047, https://doi.org/10.1021/acs.est.8b06418, 2019.
Saul, T. D., Tolocka, M. P., and Johnston, M. V.: Reactive uptake of nitric acid onto sodium chloride aerosols across a wide range of relative humidities, J. Phys. Chem. A, 110, 7614–7620, https://doi.org/10.1021/jp060639a, 2006.
Seinfeld, J. H. and Pandis, S. N.: Atmospheric Chemistry and Physics: From Air Pollution to Climate Change, 2nd edn., Wile-Interscience, Hoboken, New Jersey, USA, 2006.
Silcox, G. D., Kelly, K. E., Crosman, E. T., Whiteman, C. D., and Allen, B. L.: Wintertime PM2.5 concentrations during persistent, multi-day cold-air pools in a mountain valley, Atmos. Environ., 46, 17–24, https://doi.org/10.1016/j.atmosenv.2011.10.041, 2012.
Skiles, S. M. K., Mallia, D. V., Hallar, A. G., Lin, J. C., Lambert, A., Petersen, R., and Clark, S.: Implications of a shrinking Great Salt Lake for dust on snow deposition in the Wasatch Mountains, UT, as informed by a source to sink case study from the 13-14 April 2017 dust event, Environ. Res. Lett., 13, 1–9, https://doi.org/10.1088/1748-9326/aaefd8, 2018.
Suarez-Bertoa, R., Zardini, A. A., and Astorga, C.: Ammonia exhaust emissions from spark ignition vehicles over the New European Driving Cycle, Atmos. Environ., 97, 43–53, https://doi.org/10.1016/j.atmosenv.2014.07.050, 2014.
Sullivan, R. C., Moore, M. J. K., Petters, M. D., Kreidenweis, S. M., Roberts, G. C., and Prather, K. A.: Effect of chemical mixing state on the hygroscopicity and cloud nucleation properties of calcium mineral dust particles, Atmos. Chem. Phys., 9, 3303–3316, https://doi.org/10.5194/acp-9-3303-2009, 2009a.
Sullivan, R. C., Moore, M. J. K., Petters, M. D., Kreidenweis, S. M., Roberts, G. C., and Prather, K. A.: Timescale for hygroscopic conversion of calcite mineral particles through heterogeneous reaction with nitric acid, Phys. Chem. Chem. Phys., 11, 7759, https://doi.org/10.1039/b916865f, 2009b.
Sun, K., Tao, L., Miller, D. J., Pan, D., Golston, L. M., Zondlo, M. A., Griffin, R. J., Wallace, H. W., Leong, Y. J., Yang, M. M., Zhang, Y., Mauzerall, D. L., and Zhu, T.: Vehicle Emissions as an Important Urban Ammonia Source in the United States and China, Environ. Sci. Technol., 51, 2472–2481, https://doi.org/10.1021/acs.est.6b02805, 2017.
Tang, M., Huang, X., Lu, K., Ge, M., Li, Y., Cheng, P., Zhu, T., Ding, A., Zhang, Y., Gligorovski, S., Song, W., Ding, X., Bi, X., and Wang, X.: Heterogeneous reactions of mineral dust aerosol: implications for tropospheric oxidation capacity, Atmos. Chem. Phys., 17, 11727–11777, https://doi.org/10.5194/acp-17-11727-2017, 2017.
Tian, M., Liu, Y., Yang, F., Zhang, L., Peng, C., Chen, Y., Shi, G., Wang, H., Luo, B., Jiang, C., Li, B., Takeda, N., and Koizumi, K.: Increasing importance of nitrate formation for heavy aerosol pollution in two megacities in Sichuan Basin, southwest China, Environ. Pollut., 250, 898–905, https://doi.org/10.1016/j.envpol.2019.04.098, 2019.
United States Environmental Protection Agency (US EPA): NCore multipollutant monitoring network, available at: https://www3.epa.gov/ttn/amtic/ncore.html (last access: 19 November 2018), 2010.
Vecchi, R., Bernardoni, V., Valentini, S., Piazzalunga, A., Fermo, P., and Valli, G.: Assessment of light extinction at a European polluted urban area during wintertime: Impact of PM1 composition and sources, Environ. Pollut., 233, 679–689, https://doi.org/10.1016/j.envpol.2017.10.059, 2018.
Vlasenko, A., Sjogren, S., Weingartner, E., Stemmler, K., Gäggeler, H. W., and Ammann, M.: Effect of humidity on nitric acid uptake to mineral dust aerosol particles, Atmos. Chem. Phys., 6, 2147–2160, https://doi.org/10.5194/acp-6-2147-2006, 2006.
Whiteman, C. D., Hoch, S. W., Horel, J. D., and Charland, A.: Relationship between particulate air pollution and meteorological variables in Utah's Salt Lake Valley, Atmos. Environ., 94, 742–753, https://doi.org/10.1016/j.atmosenv.2014.06.012, 2014.
Womack, C. C., McDuffie, E. E., Edwards, P. M., Bares, R., Gouw, J. A. A., Docherty, K. S., Dubé, W. P., Fibiger, D. L., Franchin, A., Gilman, J. B., Goldberger, L., Lee, B. H., Lin, J. C., Long, R., Middlebrook, A. M., Millet, D. B., Moravek, A., Murphy, J. G., Quinn, P. K., Riedel, T. P., Roberts, J. M., Thornton, J. A., Valin, L. C., Veres, P. R., Whitehill, A. R., Wild, R. J., Warneke, C., Yuan, B., Baasandorj, M., and Brown, S. S.: An Odd Oxygen Framework for Wintertime Ammonium Nitrate Aerosol Pollution in Urban Areas: NOx and VOC Control as Mitigation Strategies, Geophys. Res. Lett., 46, 4971–4979, https://doi.org/10.1029/2019GL082028, 2019.
Wurtsbaugh, W. A., Miller, C., Null, S. E., Justin De Rose, R., Wilcock, P., Hahnenberger, M., Howe, F., and Moore, J.: Decline of the world's saline lakes, Nat. Geosci., 10, 816–821, https://doi.org/10.1038/NGEO3052, 2017.
Zender, C. S.: Mineral Dust Entrainment and Deposition (DEAD) model: Description and 1990s dust climatology, J. Geophys. Res., 108, 1–19, https://doi.org/10.1029/2002jd002775, 2003.