the Creative Commons Attribution 4.0 License.
the Creative Commons Attribution 4.0 License.
 | 26 May 2021
Molecular characterization of gaseous and particulate oxygenated compounds at a remote site in Cape Corsica in the western Mediterranean Basin
Vincent Michoud
Elise Hallemans
Laura Chiappini
Eva Leoz-Garziandia
Aurélie Colomb
Sébastien Dusanter
Isabelle Fronval
François Gheusi
Jean-Luc Jaffrezo
Thierry Léonardis
Nadine Locoge
Nicolas Marchand
Stéphane Sauvage
Jean Sciare
Jean-François Doussin
The characterization of the molecular composition of organic carbon in both gaseous and aerosol is key to understanding the processes involved in the formation and aging of secondary organic aerosol. Therefore a technique using active sampling on cartridges and filters and derivatization followed by analysis using a thermal desorption–gas chromatography–mass spectrometer (TD–GC–MS) has been used. It is aimed at studying the molecular composition of organic carbon in both gaseous and aerosol phases (PM2.5) during an intensive field campaign which took place in Corsica (France) during the summer of 2013: the ChArMEx (Chemistry and Aerosol Mediterranean Experiment) SOP1b (Special Observation Period 1B) campaign.
These measurements led to the identification of 51 oxygenated (carbonyl and or hydroxyl) compounds in the gaseous phase with concentrations between 21 and 3900 ng m−3 and of 85 compounds in the particulate phase with concentrations between 0.3 and 277 ng m−3. Comparisons of these measurements with collocated data using other techniques have been conducted, showing fair agreement in general for most species except for glyoxal in the gas phase and malonic, tartaric, malic and succinic acids in the particle phase, with disagreements that can reach up to a factor of 8 and 20 on average, respectively, for the latter two acids.
Comparison between the sum of all compounds identified by TD–GC–MS in the particle phase and the total organic matter (OM) mass reveals that on average 18 % of the total OM mass can be explained by the compounds measured by TD–GC–MS. This number increases to 24 % of the total water-soluble OM (WSOM) measured by coupling the Particle Into Liquid Sampler (PILS)-TOC (total organic carbon) if we consider only the sum of the soluble compounds measured by TD–GC–MS. This highlights the important fraction of the OM mass identified by these measurements but also the relative important fraction of OM mass remaining unidentified during the campaign and therefore the complexity of characterizing exhaustively the organic aerosol (OA) molecular chemical composition.
The fraction of OM measured by TD–GC–MS is largely dominated by di-carboxylic acids, which represent 49 % of the PM2.5 content detected and quantified by this technique. Other contributions to PM2.5 composition measured by TD–GC–MS are then represented by tri-carboxylic acids (15 %), alcohols (13 %), aldehydes (10 %), di-hydroxy-carboxylic acids (5 %), monocarboxylic acids and ketones (3 % each), and hydroxyl-carboxylic acids (2 %). These results highlight the importance of polyfunctionalized carboxylic acids for OM, while the chemical processes responsible for their formation in both phases remain uncertain. While not measured by the TD–GC–MS technique, humic-like substances (HULISs) represent the most abundant identified species in the aerosol, contributing for 59 % of the total OM mass on average during the campaign.
A total of 14 compounds were detected and quantified in both phases, allowing the calculation of experimental partitioning coefficients for these species. The comparison of these experimental partitioning coefficients with theoretical ones, estimated by three different models, reveals large discrepancies varying from 2 to 7 orders of magnitude. These results suggest that the supposed instantaneous equilibrium being established between gaseous and particulate phases assuming a homogeneous non-viscous particle phase is questionable.
- Article
(5468 KB) - Full-text XML
-
Supplement
(6112 KB) - BibTeX
- EndNote


It is now recognized that aerosols have an impact on human health, climate and ecosystems. However, large uncertainties still exist on their effects, especially on climate (Fiore et al., 2015). One of the key solutions to reducing these uncertainties is to study the chemical composition of the aerosol organic fraction since organic matter represents a large fraction of fine particles (Jimenez et al., 2009) whose impacts are compound-dependent. Molecular characterization of organic aerosol is therefore crucial.
The organic aerosol (OA) fraction has been widely studied (e.g., De Gouw and Jimenez, 2009; Fuzzi et al., 2006; Glasius and Goldstein, 2016; Jacobson et al., 2000; Jimenez et al., 2009; Kanakidou et al., 2005; Pöschl, 2005; Robinson et al., 2007; Samaké et al., 2019; Seinfeld and Pankow, 2003), and many studies allowed us to improve our understanding of their molecular composition (e.g., Gallimore et al., 2017; Nguyen et al., 2013; Nozière et al., 2015; Zhang et al., 2011), their sources (e.g., Alves et al., 2012; Jiang et al., 2019; Shrivastava et al., 2007; Woody et al., 2016), and their formation and evolution processes (e.g., Chacon-Madrid and Donahue, 2011; Donahue et al., 2012; Heald et al., 2010; Li et al., 2016; Ng et al., 2011). Organic aerosol can be primary or secondary. Primary organic aerosols (POAs) are directly emitted in the atmosphere, whereas secondary organic aerosols (SOAs) are formed after oxidation of gaseous organic precursors such as volatile organic compounds (VOCs). These gaseous compounds, coming from anthropogenic or natural sources, are progressively oxidized by atmospheric oxidants (OH, O3 and NO3). During this multi-step oxidation process, the ratio of the product formed rises, and their volatility decreases, allowing them to condense on existing particles or to form new particles through nucleation processes (Kulmala et al., 2013), leading to SOA formation. Some of the semi-volatile organic compounds (SVOCs) formed during the process can be split between the particulate and gaseous phases. Hamilton et al. (2004) have studied the chemical composition of PM2.5 collected in the urban atmosphere of London using a TD–GCxGC–ToF-MS (thermal desorption–comprehensive two-dimensional gas chromatography–time-of-flight mass spectrometer) instrument, highlighting the presence of more than 10 000 different organic compounds in their samples. In the same study, 130 oxygenated volatile organic compounds (OVOCs) were also identified, while the total number of different VOCs in the atmosphere is estimated to be between 10 000 and 100 000 (Goldstein and Galbally, 2007). The large number of species composing the gaseous and particulate phases makes an exhaustive characterization of the atmospheric organic matter challenging.
For this reason, analysis of only the principal components is often used to describe aerosol composition. Positive matrix factorization (PMF) applied to aerosol mass spectrometer (AMS) spectra allows the retrieval of more information on the sources and nature of organic aerosol. Although this classification allows insight to be gained into the oxidation state of OA, it is not possible to identify chemical processes involved in SOA formation and aging.
It is therefore essential to perform molecular characterization of organic aerosol. This can be achieved using several techniques, for example making use of offline analyses of filter samplings or online analysis following direct sampling. Coupling the Particle Into Liquid Sampler (PILS) to ion chromatography allows for example the measurement of organic species such as acetate, formate, oxalate and methane sulfonic acid (MSA) (Orsini et al., 2003; Sciare et al., 2011). Parshintsev et al. (2009) also coupled PILS with gas chromatography mass spectrometry (GC–MS), which allowed the measurement of species such as alpha-pinene, pinonaldehyde, cis-pinonic and pinic acids. More recently, PILS was coupled to ultra-high-performance liquid chromatography–electrospray ionization quadrupole time-of-flight mass spectrometry (UPLC–ESI-Q-TOF-MS), allowing the measurement of species as diverse as adenine, adonitol, sorbitol, adipic acid, vanillic acid, azelaic acid cis-pinonic acid and palmitic acid (Zhang et al., 2016). Several studies also use tandem mass spectrometry (MS–MS or MSn) to get some structural information on compounds present in the organic aerosol thanks to multiple fragmentation (e.g., Fujiwara et al., 2014; Kitanovski et al., 2011; Liu et al., 2015; Nguyen et al., 2011). This technique has led to the identification of species such as carboxylic acids, polycyclic aromatic hydrocarbon (PAH) oxy and nitro-PAH but also oligomers from isoprene photo-oxidation experiments in the presence of low or high NOx concentrations. Development of two-dimensional chromatography (GCxGC or LCxLC, two-dimensional gas chromatography and liquid chromatography, respectively) allows a lower detection limit separation capacity to be reached and allows a larger range of compounds to be measured (Hamilton et al., 2004; Parshintsev and Hyötyläinen, 2015). Online chromatographic systems also exist to analyze the composition of the particulate phase. However, difficulties in particle sampling made this type of development challenging. Williams et al. (2006) developed a thermo-desorption aerosol GC–MS–flame ionization detector (FID), allowing the online measurement of compounds of low polarity and with a small number of chemical functions. GC analysis is usually restricted to compounds of low polarity, which excludes many secondary components of OA. A derivatization step is therefore often used before the analysis or even during the sampling to perform OA chemical characterization. For example, O-(2,3,4,5,6-pentafluorobenzyl) hydroxylamine (PFBHA) can be used for measurements of carbonyl compounds, and N,O-bis(trimethylsilyl)-trifluoroacetamide (BSTFA) is used to reduce the polarity of hydroxyl compounds (Chiappini et al., 2006; El Haddad et al., 2013; Flores and Doskey, 2015; Pietrogrande et al., 2009; Schoene et al., 1994).
In addition to sample preparation and detection systems, different types of extraction systems exist to avoid multiple steps prior to analysis. For example, Chiappini et al. (2006) have developed a technique using supercritical fluid extraction (SFE)–GC–MS. With this technique, compounds are extracted from the filter by supercritical CO2 including a derivatization step with BSTFA as reagent inside the extraction cell. Extraction efficiency depends on compound solubilities in the supercritical CO2, which has a very high solvation power. Thermal desorption (TD) is another technique allowing the preparation steps prior to analysis to be bypassed. This technique relies on the volatilization of collected compounds and is suitable for semi-volatile constituents of SOA. It has the advantage of being commercially available with fully automatized systems, and its high sensibility allows the analysis of a very low quantity of aerosol, while the low preparation time requirement limits the risk of loss or contamination of analyzed samples (Hays and Lavrich, 2007; Parshintsev and Hyötyläinen, 2015). This technique has been used by Bates et al. (2008) and van Drooge et al. (2009) to quantify particulate PAH, while Ding et al. (2009) used it to measure PAH, alkanes, hopanes and steranes in PM2.5.
Although numerous analytical methods exist for SOA chemical characterization, the multiphasic state of lots of compounds is rarely studied. Indeed, gaseous-phase chemical characterization is often studied separately using techniques such as proton transfer reaction (PTR)-MS (Hansel et al., 1995; de Gouw and Warneke, 2007; Holzinger et al., 2019) or online or offline GC techniques coupled to various detectors (e.g., FID, MS) (e.g., Barreira et al., 2015; Kajos et al., 2015; Valach et al., 2014). Despite this disconnected treatment between aerosol and gaseous phases, understanding mechanisms controlling the partitioning of SVOCs between both phases is key to understanding the formation and fate of SOA. A partition coefficient is defined according to the thermodynamic equilibrium to calculate the mass transfer of SVOCs into the particulate phase (Pankow, 1994). This equilibrium is thought to be dominated by absorption phenomena (Liang et al., 1997), and the partition coefficient is therefore calculated accordingly in models. However, the validity of the instantaneous equilibrium between both phases as well as the predominance of absorption processes in the mass transfer process is questionable (Bateman et al., 2015; Fridlind et al., 2000; Healy et al., 2008; Rossignol et al., 2012; Virtanen et al., 2010). It is therefore crucial to test the theoretical partition coefficient against values measured in the field for which in situ measurements of organic compounds in both phases are needed.
The Mediterranean Basin is an excellent location to study organic aerosol formation and aging since it experiences intensive natural and anthropogenic emissions as well as strong photochemistry (Lelieveld, 2002). The ChArMEx (Chemistry and Aerosols Mediterranean Experiments) project aimed at assessing the present and future state of the atmosphere in the Mediterranean Basin. In this framework, an intensive field campaign was performed at Cape Corsica for 3 weeks during summer of 2013, employing numerous instruments to investigate the chemical composition of aerosol and gaseous phases.
As part of this project, this study aims to characterize the molecular composition of organic carbon in both the gaseous and aerosol phases during the campaign using TD–GC–MS measurements. These measurements were first compared to measurements performed with other techniques (offline cartridge analysis using high-performance liquid chromatography (HPLC) and GC–FID–MS as well as PTR-MS for gaseous measurements and filter analysis using ion chromatography, GC–MS and HPLC). These measurements were used to assess the composition of organic carbon and to estimate the experimental partition coefficient of compounds measured in both phases to be compared with theoretical values.
2.1 Description of the Cape Corsica ground site
The ChArMEx field campaign took place from 15 July to 5 August 2013 at Ersa in Cape Corsica (France) (42.97∘ N, 9.38∘ E) at the top of a hill (533 m above sea level). The site is located at the northern tip of a thin peninsula, a few kilometers from the sea in all directions (between 2.5 and 6 km) and approximately 30 km north from the nearest urban area (Bastia). Mountains (peaking between 1000 and 1500 m) limit transport of urban air masses to the sampling site. The site is surrounded by typical vegetation of Mediterranean areas (maquis shrubland). Apart from this local biogenic influence, the site is mainly influenced by marine and other natural (e.g., dust) emissions and by continental and aged air masses due to long-range transport. During summer, recirculation of air masses favors secondary aerosol and ozone buildup (Millán et al., 1997). More details about the site, atmospheric conditions encountered during the campaign and air mass origin can be found in Michoud et al. (2017).
2.2 Sampling devices and TD–GC–MS analysis for the molecular characterization of multiphase organic carbon
Simultaneous sampling of gas and particulate phases has been conducted using a parallel sampling system with two independent pumps, allowing the selection of flow rates specifically adjusted for each phase.
Following the sampling, the molecular characterization of gaseous and particulate oxygenated organic compounds, targeting carbonyl compounds and hydroxyl compounds and carboxylic acids, sampled during the campaign, has been made using a TD–GC–MS analysis after derivatization steps following the method developed by Rossignol et al. (2012). A detailed description of the gaseous- and particulate-phase sampling as well as the sample preparation, analytical system, and internal and external calibration protocol can be found in the Supplement (Supplement Sect. S1).
Overall uncertainties have been determined taking into account precision, detection limit and systematic errors (including uncertainties in standard concentrations, in calibration, in blank determination and in sampling volume, following Gaussian error propagation). Overall uncertainties have therefore been estimated to be 35 % and 54 % on average in the gas phase for carbonyls and hydroxyls and carboxylic acids, respectively, and to be 41 % and 47 % on average in the particulate phase for carbonyls and hydroxyls and carboxylic acids, respectively.
2.3 Ancillary measurements
An important set of complementary instruments, dedicated to the measurement of both the gaseous and particulate phase, has been deployed at the supersite, supporting the interpretation and validation of the TD–GC–MS dataset.
2.3.1 Gaseous ancillary measurements
During the campaign, NO and NO2 were measured by a commercial ozone chemiluminescence analyzer (Cranox II, Eco Physics®) with a time resolution of 5 min. NO was measured directly, while NO2 was converted into NO using a photolytic converter. O3 was measured using a commercial analyzer (TEI 49i, Thermo Environmental Instruments Inc®) using UV absorption with a time resolution of 5 min.
Measurements of VOCs and OVOCs were performed by online techniques (proton-transfer-reaction time-of-flight mass spectrometer (PTR-ToF-MS) and GC–FID–MS) and offline method (active sampling on DNPH, 2,4-dinitrophenylhydrazine, cartridges followed by analysis with high-performance liquid chromatography (HPLC) with UV detection). Description of the VOC and OVOC measurement techniques can be found in Supplement Sect. S2.
2.3.2 Particulate ancillary measurements
Mass concentrations of PM10 and PM1 were measured during the campaign using two tapered-element oscillating microbalances (TEOMs) equipped with a filter dynamic measurement system (FDMS) (Thermo Scientific™). In addition, aerosol chemical composition was measured by an online technique (aerosol chemical speciation monitor – ACSM, PILS-TOC) and an offline method (ion chromatography, GC–MS and HPLC) on filters collected daily with two high-volume samplers (30 m3 h−1) equipped with PM1 and PM2.5 inlets. A description of the aerosol chemical composition measurement techniques can be found in Supplement Sect. S3.
3.1 Main conditions during the campaign
3.1.1 Meteorological conditions
Meteorological and environmental conditions are presented in Table 1. Relatively high temperatures were monitored during the campaign (up to 32 ∘C), coinciding with high biogenic emissions from local vegetation and strong photochemistry (Michoud et al., 2017). These conditions led to high ozone concentrations (65 pbbv on average for the overall sampling period and up to 111 ppbv for 5 min measurements), typical of this region during summer (e.g., Lelieveld, 2002; Di Biagio et al., 2015). High relative humidity was encountered at night, with values reaching 100 %, coinciding with foggy conditions observed during several nights at the site. High wind speeds were monitored, with a maximum reached on 30 July 2013 (13.2 m s−1). During the campaign, almost 40 % of air masses came from the southwestern sector and 20 % from the western sector (see Fig. 1). Winds coming from the southwestern sector are predominant during daytime and nighttime and correspond to wind speed maxima. Winds from the west and northeast are also recorded but during daytime only. Low NOx concentrations were observed during the campaign (0.57 ppbv on average), with a few spikes above 1 ppbv, corresponding to local influence from traffic, especially when air masses came from the south (e.g., 27 July).
Table 1Meteorological conditions, environmental parameters and mass concentrations of PM10, PM1 and organic fraction in PM1 during the ChArMEx campaign at Ersa.
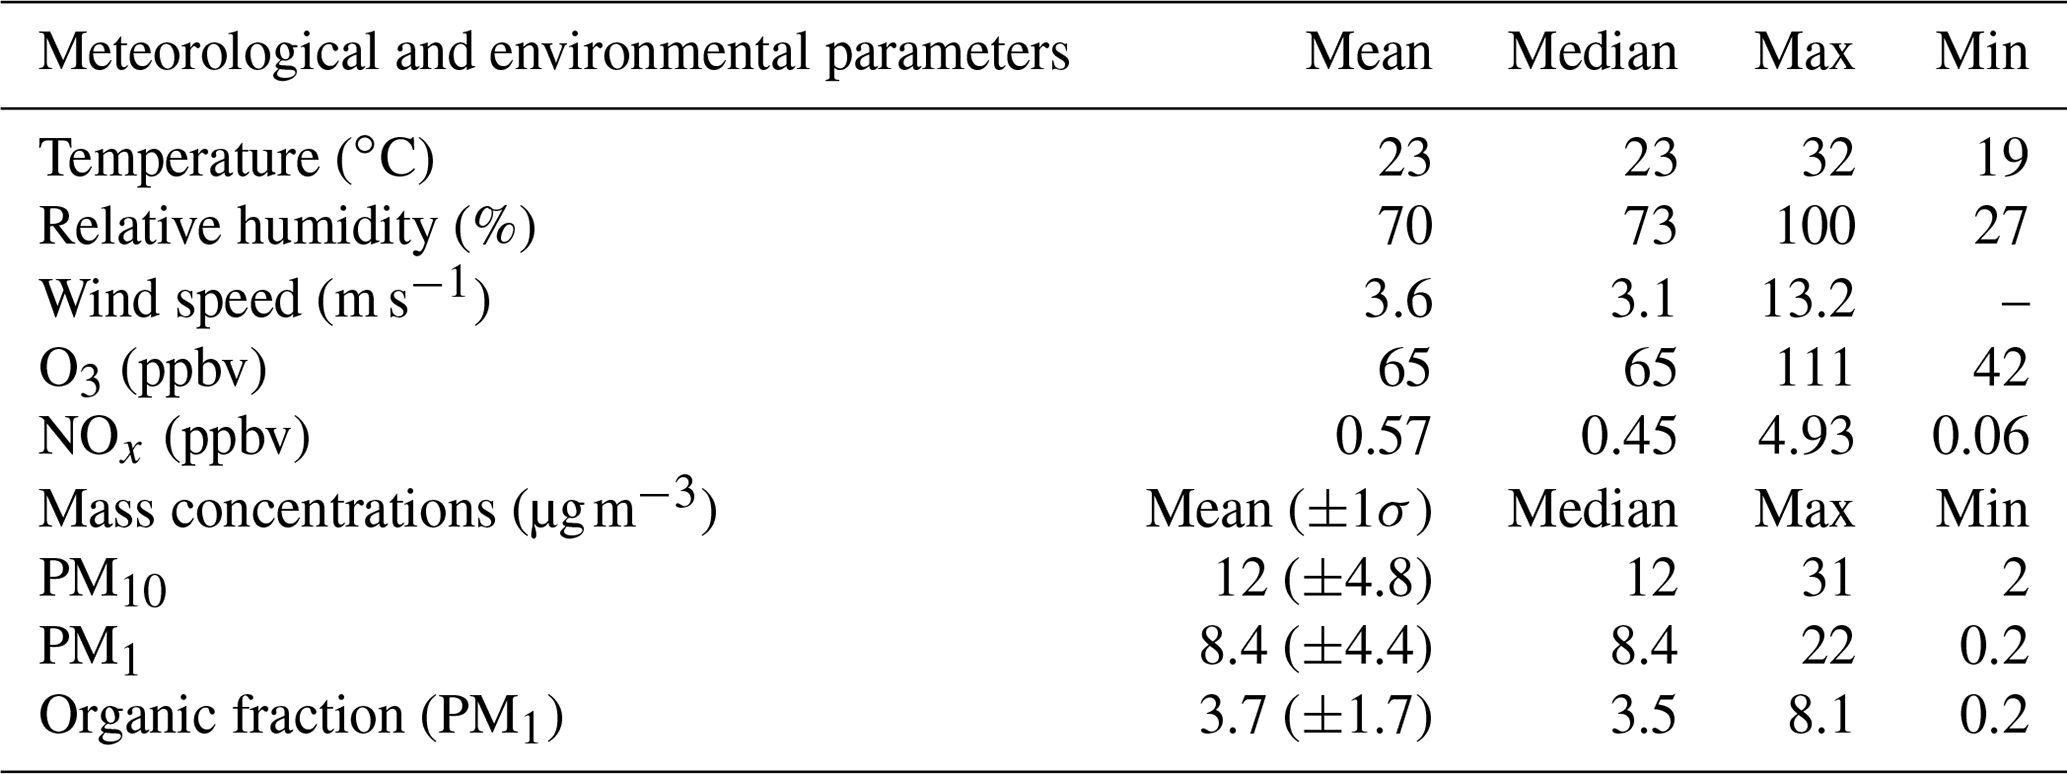
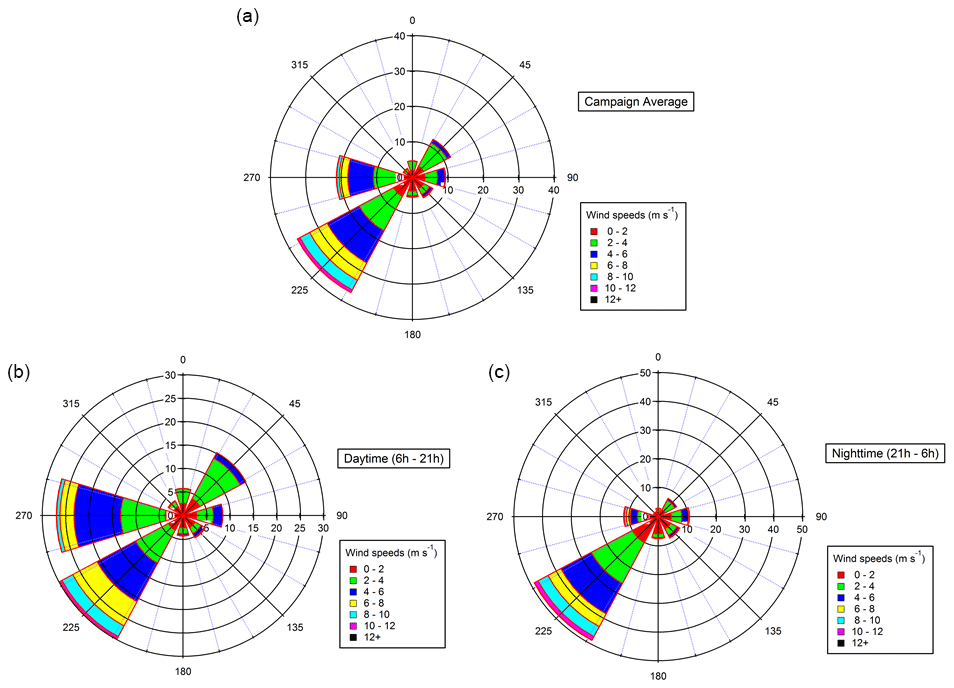
Figure 1Wind roses from 15 July to 5 August 2013 (a) during daytime only (b) and during nighttime only (c). Wind direction is expressed in degrees, and radial axes express the relative occurrence of wind in each 30∘ sector (%).
3.1.2 Particles and organic fraction
Mean, median, maximum and minimum of mass concentrations of PM10, PM1 and organic fraction in NR-PM1 (non-refractory PM1) are summarized in Table 1 for the whole campaign. The averaged mass concentrations for PM10 is 12.0 µg m−3, comparable to observations performed at other remote sites located in the western Mediterranean Basin (e.g., 15.5 µg m−3 at Montseny, Spain; 11.5 µg m−3 between 2010 and 2013 at Montsec, Spain; 14.6 µg m−3 at Monte Martano, Italy; 13 µg m−3 between 2010 and 2013 at Venaco, France; Moroni et al., 2015; Nicolas, 2013; Querol et al., 2009a, b; Ripoll et al., 2015). The averaged mass concentrations for PM1 was 8.3 µg m−3 during the campaign and represented an important fraction of PM10 (69 % on average). The amount of PM1 at Ersa is also comparable to what has been previously measured at other remote sites in the western Mediterranean Basin (e.g., 8.2 µg m−3 at Montseny, Spain; 7.1 µg m−3 between 2010 and 2013 at Montsec, Spain; Minguillón et al., 2015; Ripoll et al., 2015). During the campaign, the organic fraction represented between 40 and 55 % of PM1 mass concentrations (mean of 3.7 µg m−3, 44 % of PM1 on average).
Time series of mass concentrations of PM10, PM1 and organic fraction in PM1 are presented in Fig. 2. The highest mass concentrations for PM10 and PM1 are observed between 12 and 21 July (15.7 and 11.0 µg m−3 on average, respectively, for PM10 and PM1). According to back trajectory analysis (Michoud et al., 2017), this period corresponds to low wind speed and hence stationary air masses. A decrease in PM10 concentrations is observed from 21 to 25 July (12.0 µg m−3 on average), while the ratios PM1 PM10 and organic PM1 are the highest (between 0.5 and 1 and between 0.3 and 0.7, respectively). During this second period, the PM10 and PM1 fractions are almost the same. This period is also characterized by higher wind speed and air masses coming from the northeastern sector and therefore includes potential anthropogenic influence from northern Italy. From 26 to 29 July, a rise in PM10 mass concentrations is observed, coinciding with the warmest temperature of the campaign and air masses coming from the south and characterized by biogenic influence (see Michoud et al., 2017). From 29 July to 3 August, PM1 concentrations strongly decrease (from 9.3 to 2.6 µg m−3 on average), coinciding with higher wind speed and relative humidity, while winds came from northwestern and northeastern directions (see Michoud et al., 2017). During the last period (3–5 August), an increase in PM10 and PM1 concentrations is observed, and a clear diurnal cycle is monitored for both fractions, corresponding to a rise in temperatures. Overall, the organic-fraction evolution follows the one of the PM1 mass fraction.
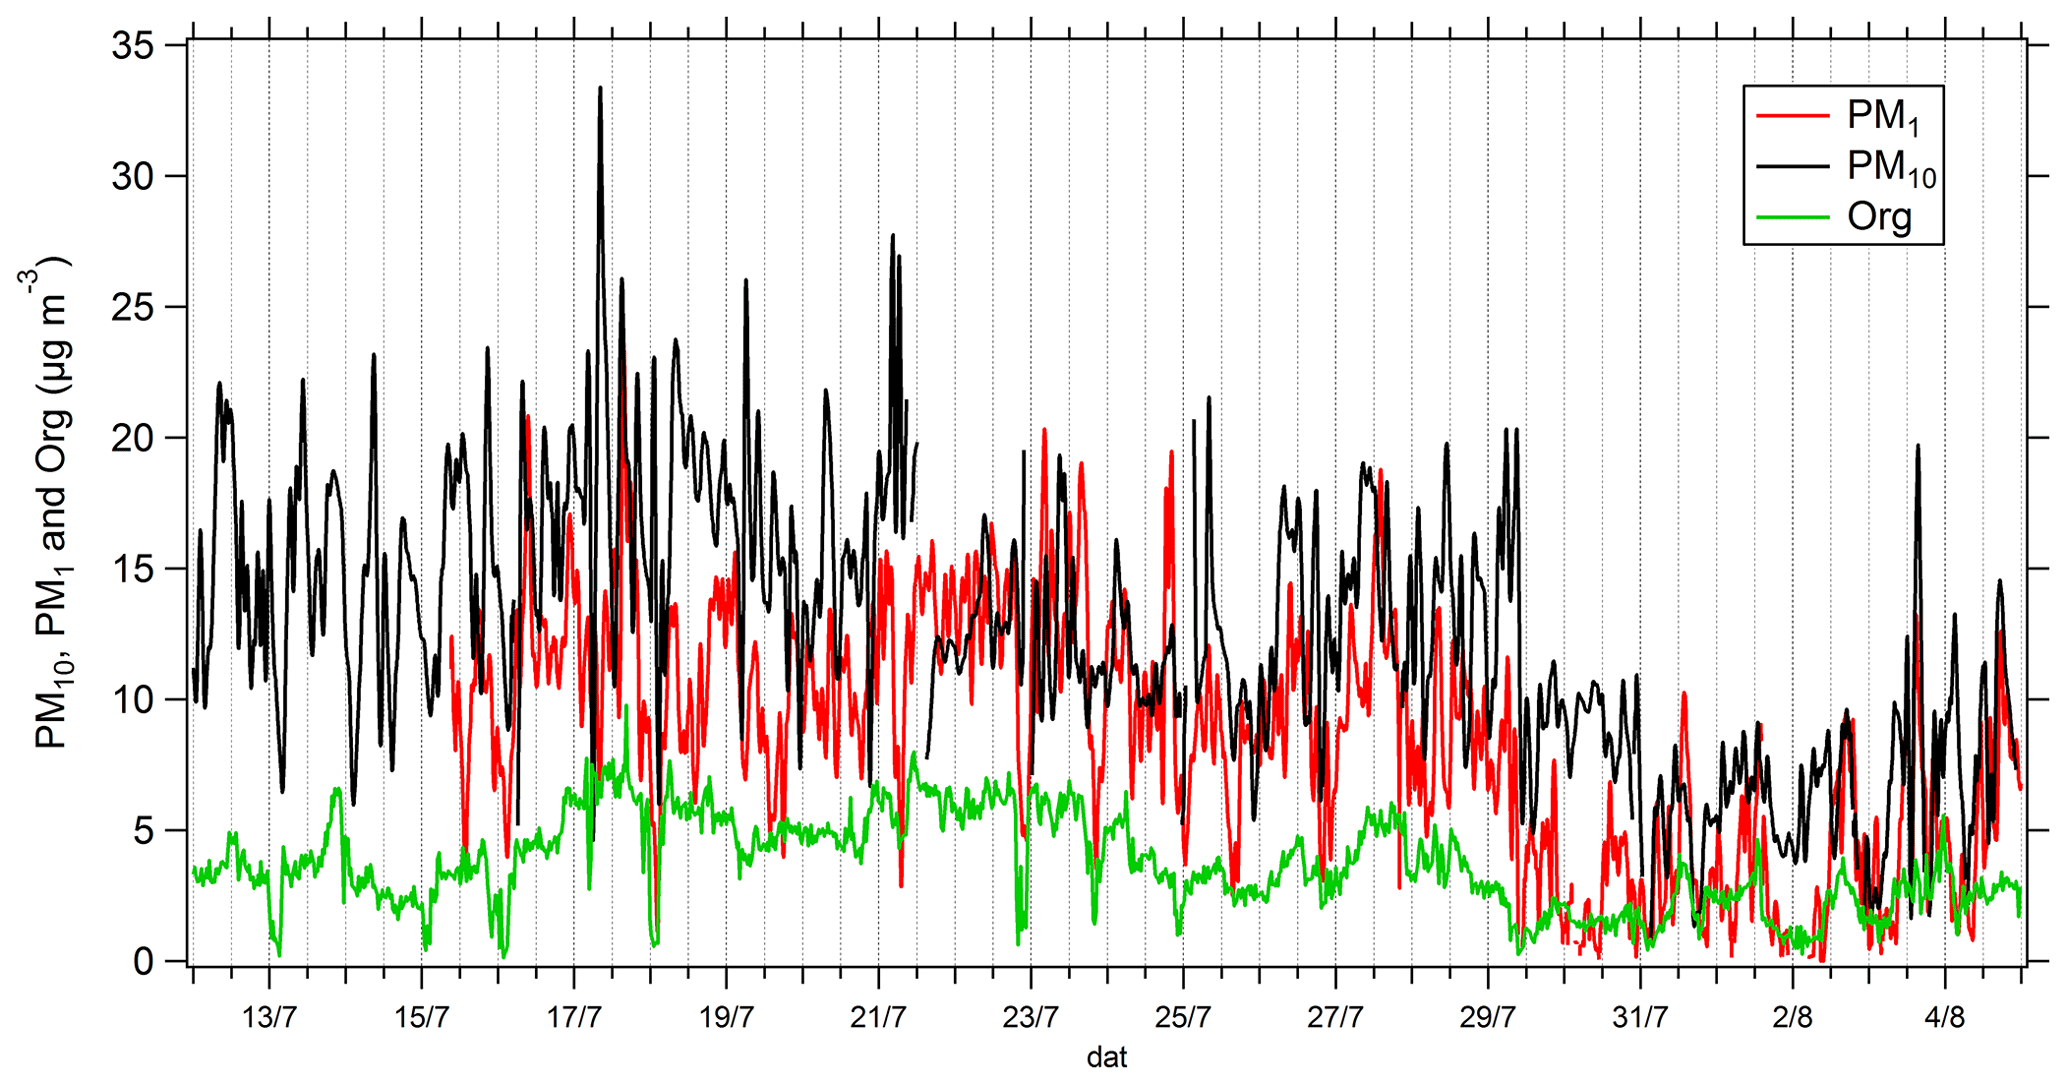
Figure 2Time series of mass concentrations of PM10 (black line), PM1 (red line) and organic fraction in NR-PM1 (green line).
3.2 Results from the TD–GC–MS analysis
3.2.1 Compound identification
Detection of functionalized compounds led to the identification of 23 carbonyl compounds and 28 hydroxyl compounds and carboxylic acids in the gaseous phase and of 30 carbonyl compounds and 55 hydroxyl compounds and carboxylic acids in the particulate phase. The entire list of these 97 compounds is presented in Supplement Sect. S4 together with their retention time, their ratio, their calculated saturation vapor pressure, the main fragments of their mass spectra, the method used for their identification, the substitute used to account for the derivatization efficiency, the external standard used for their quantification, the fragment used for quantification, the averaged concentrations measured in both phases, their limits of detection and quantification, and the averaged overall uncertainties. An example chromatogram is also shown in Supplement Sect. S5. For the carbonyl compounds, the mono-functionalized compounds identified contained between 3 (e.g., propanal) and 10 (e.g., decanal) carbon atoms and between 2 (e.g., glyoxal) and 5 (e.g., 4-oxopentanal) carbon atoms for the bi-functionalized compounds. For the hydroxyl compounds and the carboxylic acids, the mono-functionalized compounds identified contained between 3 (e.g., propanoic acid) and 18 (e.g., octadecanoic acid) carbon atoms. Several poly-functionalized compounds have also been identified: hydroxy-acids and di-acids containing between three (e.g., glycolic acid) and eight (e.g., mandelic acid) carbon atoms; triols, di-hydroxy-acids, hydroxyl-di-acids and tri-acids containing between three (e.g., glycerol) and nine (e.g., 2-hydroxy-4-isopropyl-hexanedioic acid) carbon atoms; and two tetra-functionalized compounds (methyl-tetrols and citric acid).
It is worth noting that several compounds exhibited very close quantities in the air sample and in the blank (designed as “blank” in the Supplement Sect. S4). Therefore, the presence of these compounds in the air sampled cannot be certain. For the compounds that have been quantified successfully and present concentrations significantly above the quantification limit (10σ above averaged blank measurements), higher levels are observed in the gas phase. The averaged concentrations ranged from 21 ng m−3 (mandelic acid) to 1600 ng m−3 (glycerol) for hydroxyl compounds in the gas phase and from 0.3 (pyruvic acid) to 277 (oxalic acid) ng m−3 in the particulate phase. For the carbonyl compounds, the averaged concentrations ranged from 85 ng m−3 (hexanone) to 3900 ng m−3 (4-oxopentanal) in the gas phase and from 1 ng m−3 (e.g., methylpropanal or glyoxal) to 20 ng m−3 (4-methylpentanal) in the particulate phase. Figure 3 presents the distribution of all quantified compounds along their saturation vapor pressure and their ratio. The phases in which these compounds were identified are also shown in Fig. 3. While compounds only present in the gas or aerosol phase exhibit high and low saturation vapor pressure, respectively, some exceptions are noticeable. Indeed, some gaseous compounds have low vapor pressure (down to 10−8.6 atm), such as long-chain linear monocarboxylic acids (up to 15 carbon atoms), and some compounds only found in the particle phase have high vapor pressure (up to 10−0.8 atm), normally incompatible with their presence in such a phase, such as small monocarbonyls (e.g., methylpropanal, methylbutanone, 2-methylbutanal). We also found compounds in both phases exhibiting high vapor pressure (up to 10−0.4 atm), which is normally incompatible with their presence in aerosol phase, such as small carbonyls (e.g., propanal, acrolein, methacrolein, MVK – methyl vinyl ketone). This latest point is discussed further in Sect. 4.3.

Figure 3Distribution of compounds identified by TD–GC–MS during the ChArMEx campaign according to the logarithm of their saturation vapor pressure (horizontal axis) and of their ratio (vertical axis). The phase in which they are detected is color-coded: blue for compounds only detected in the gas phase, red for aerosol phase only and orange for compounds detected in both phases. Each dot represents a single compound, and the dot area is proportional to the sum of concentrations if detected in both phases from 0.3 ng m−3 for the smallest dot to 3.9 µg m−3 for the biggest one. The names of some noticeable compounds are also given.
3.2.2 Data intercomparison
A comparison of data measured by TD–GC–MS with other techniques available on-site has been performed for both phases to test the reliability of these measurements.
Gas phase
Comparisons of TD–GC–MS data with PTR-ToF-MS and GC–FID–MS data averaged over the same sampling duration at a similar time step have been performed and are shown in Figs. 4 and 5. Fair agreement is found for nopinone (relative differences observed from 1 % to 133 %), the sum of methacrolein and methyl vinyl ketone (2 %–155 %), propanoic acid (3 %–107 %), and methyl ethyl ketone (0 %–140 %) between TD–GC–MS measurements and measurements performed by PTR-ToF-MS. Good agreement is also found for methyl vinyl ketone (3 %–168 %) and 2-hexanone (3 %–99 %) between TD–GC–MS measurements and measurements performed by GC–FID–MS. Ranges of measured concentrations are similar between these techniques as well as the temporal variation.
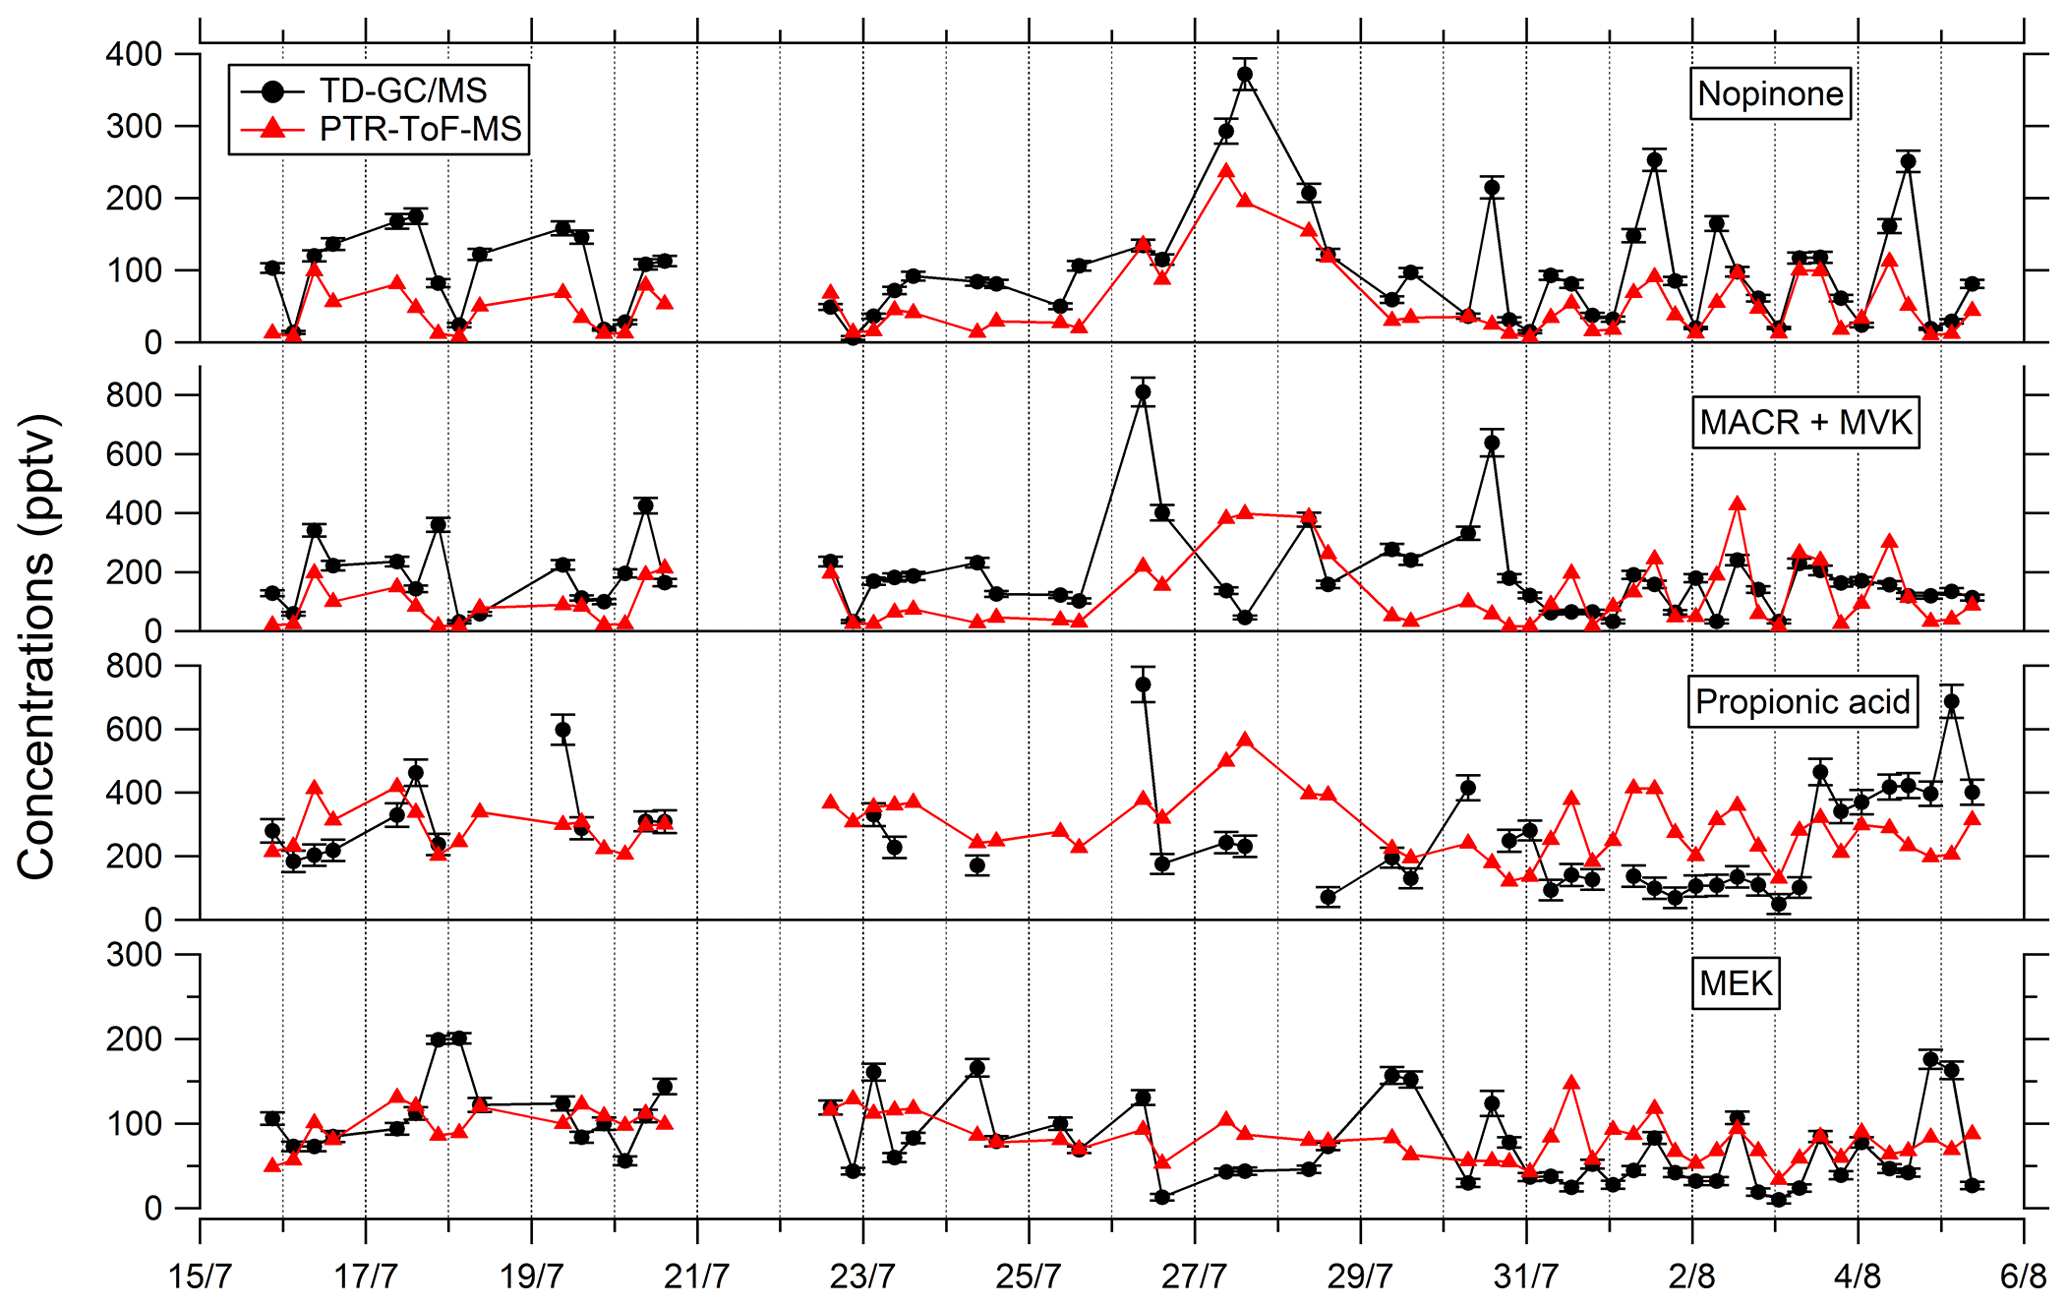
Figure 4Comparison of ATD–GC–MS (automatic thermal desorption–gas chromatography–mass spectrometer) data with PTR-ToF-MS data averaged over the same time step for nopinone, the sum of methacrolein and methyl vinyl ketone, propionic acid, and methyl ethyl ketone. Error bars correspond to the 1σ uncertainties in TD–GC–MS measurements.
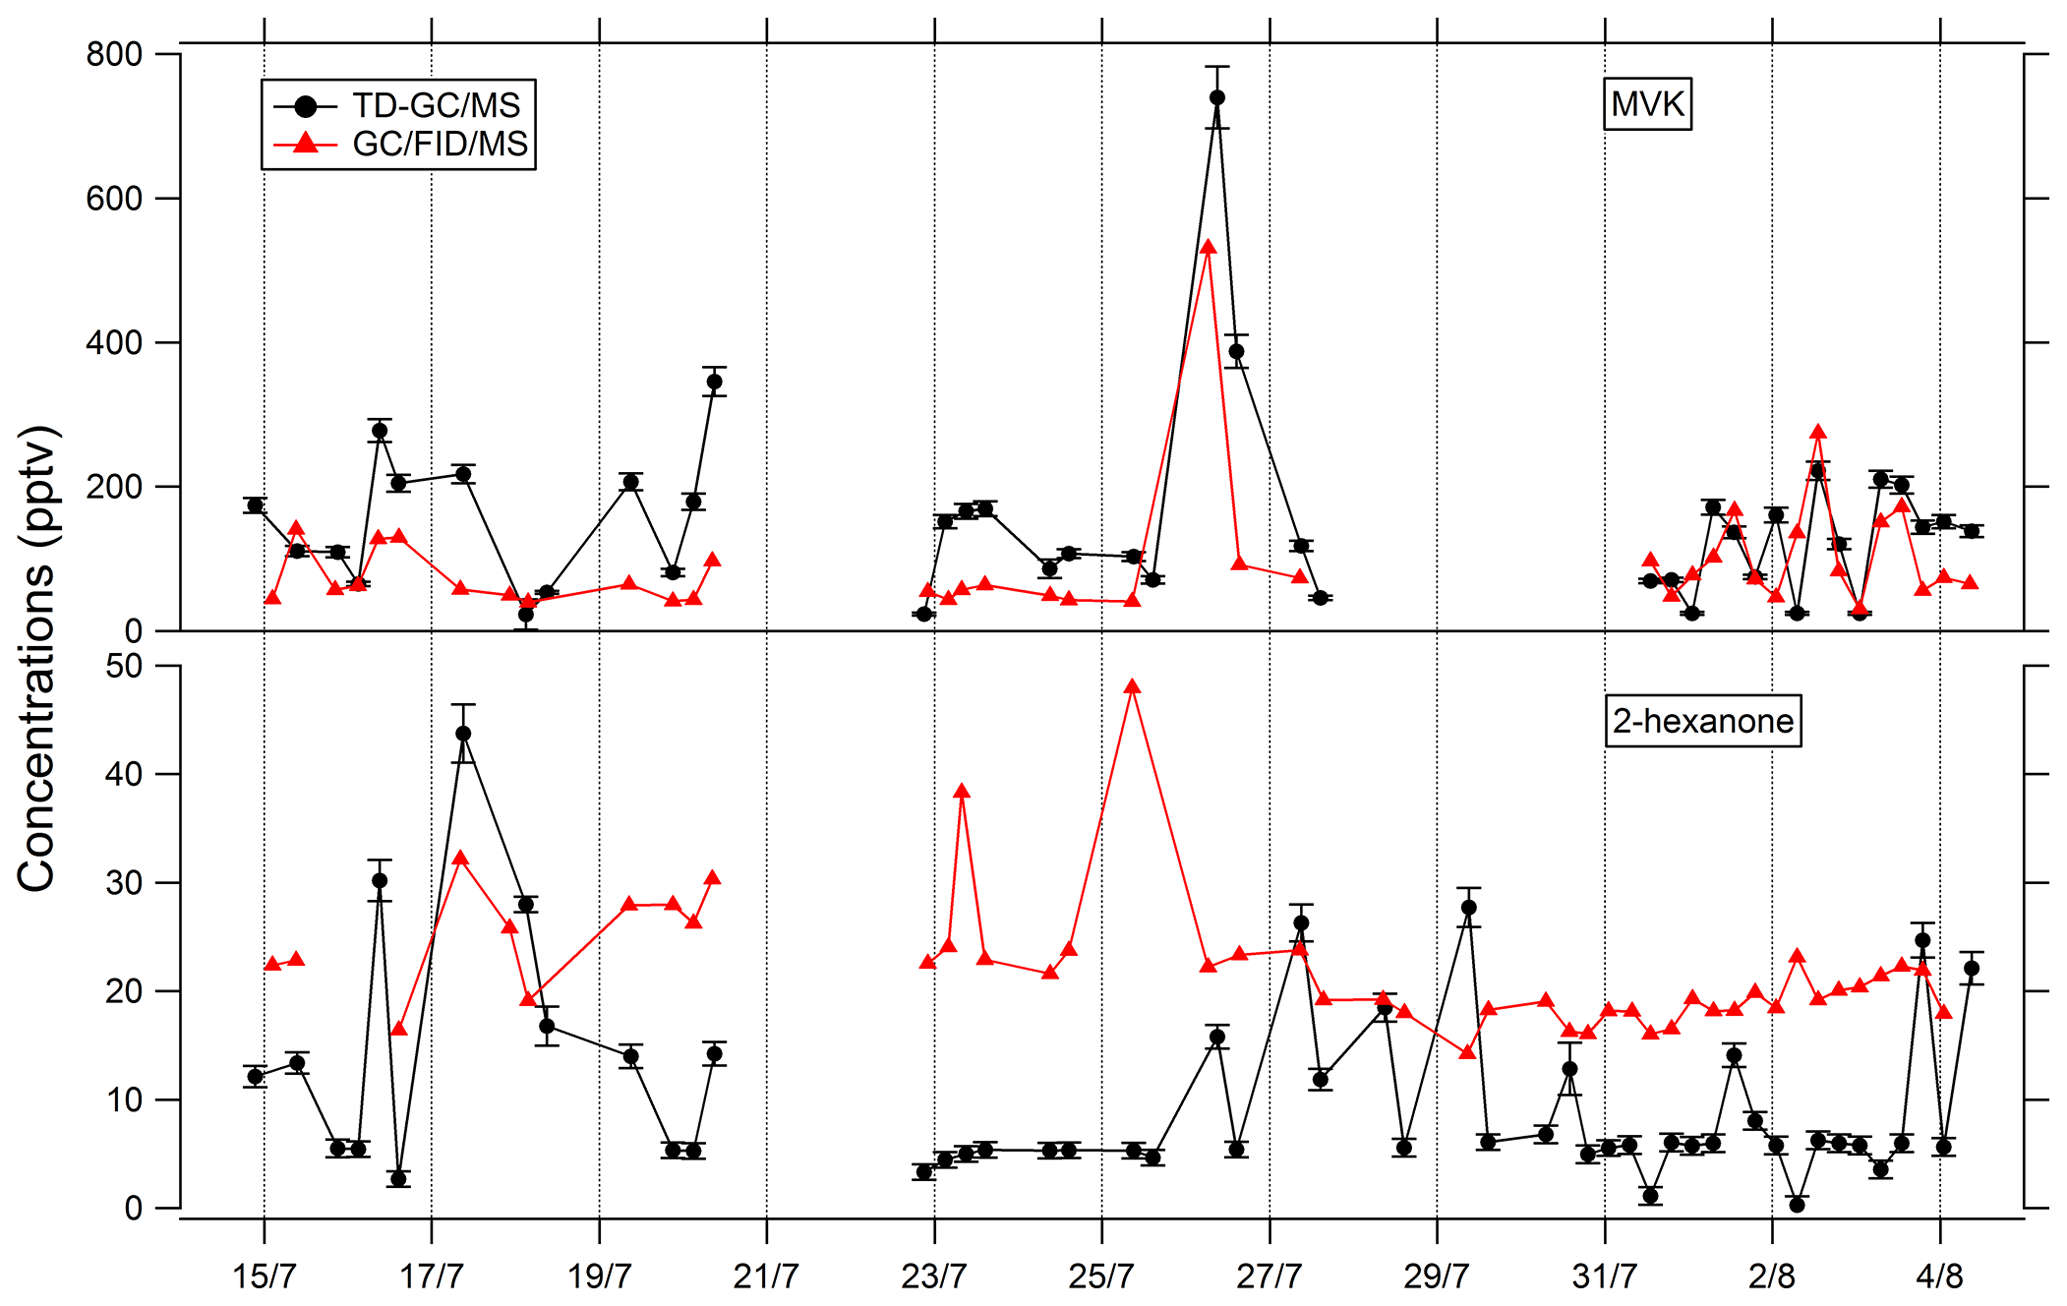
Figure 5Comparison of ATD–GC–MS data with GC–FID–MS data averaged over the same time step for methyl vinyl ketone and 2-hexanone. Error bars correspond to the 1σ uncertainties in TD–GC–MS measurements.
Comparisons of TD–GC–MS measurements with DNPH cartridge analysis are presented in Fig. 6. For these latter measurements, only the first 10 d of the campaign have been validated because of a leak issue in the sampling system of DNPH cartridges after that period (see Michoud et al., 2017, 2018). Ranges of concentrations are of the same order of magnitude between these two techniques for propanal (5 %–93 %), acrolein (18 %–90 %), methacrolein (8 %–83 %), methyl ethyl ketone (17 %–87 %), methylglyoxal (19 %–99 %), hexanal (1 %–73 %) and benzaldehyde (10 %–115 %) even though it is difficult to reach a conclusion on their co-variation regarding the small number of data available and the low time resolution for these two techniques. However, glyoxal and methyl vinyl ketone present large differences between the two techniques (factor of 15 and 12, respectively). For glyoxal, Matsunaga (2004) recorded maximum concentrations of 154 ng m−3 (≈ 65 pptv) at a forested site at Moshiri on Hokkaido island in summer. Washenfelder et al. (2011) recorded maximum glyoxal concentrations of 500 pptv at an urban site in Los Angeles in summer, while numerous glyoxal precursors exist in urban environments. Therefore, the concentrations measured by TD–GC–MS seem overestimated, and measurements from DNPH cartridge analysis seem more consistent with these previous observation. Thermo-degradation of other heavier compounds adsorbed on the Tenax cartridges, leading to glyoxal, could be a hypothesis for this overestimation. In the case of methyl vinyl ketone, the good agreement observed between TD–GC–MS measurements and GC–FID–MS ones (see Fig. 5) tends to indicate that the disagreement observed here is related to an underestimation of the concentrations measured by DNPH cartridge analysis. Furthermore, recent studies on humidity dependence of the DNPH–HPLC–UV method for some ketone compounds revealed that the collection efficiency is inversely related to relative humidity, with up to 35 %–80 % of the ketones being lost for RH values higher than 50 % at 22 ∘C (Ho et al., 2014). Furthermore, dimerization issues for MVK during analyses using the DNPH method have also been identified during more recent measurements that can cause strong underestimation of this technique (> 50 %).
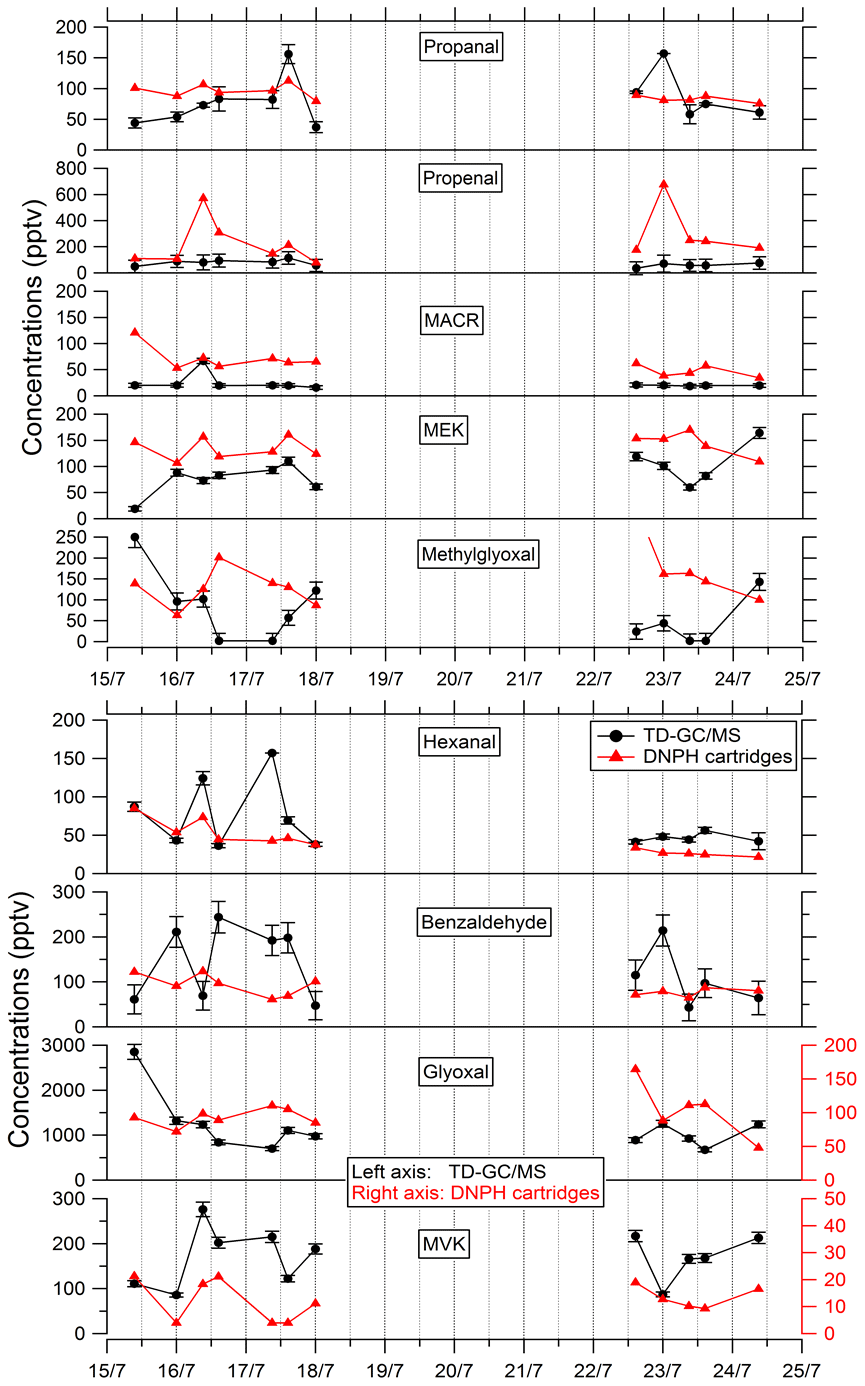
Figure 6Comparison of ATD–GC–MS data with DNPH cartridge analysis for nine OVOCs. Error bars correspond to the 1σ uncertainties in TD–GC–MS measurements.
Particulate phase
Comparisons of results from filter analysis by TD–GC–MS and by ion chromatography, GC–MS and HPLC have been performed and are shown in Figs. 7 and 8. The range of concentrations between TD–GC–MS analysis and other techniques are of the same order of magnitude for oxalic acid (relative differences observed from 1 % to 111 %), pinic acid (13 %–136 %), 2-methylglyceric acid (15 %–87 %), MBTCA (12 %–95 %), glycolic acid (16 %–104 %) and phthalic acid (3 %–90 %). However, a discrepancy is found for malonic acid and tartaric acid, whose measurements both differ by a factor of 4 on average, between TD–GC–MS and HPLC analyses. For methyl-tetrols, the analysis performed by TD–GC–MS did not allow the two isomers to be distinguished. Temporal evolution of compounds shown in Figs. 7 and 8 is also similar from one technique to another, especially for oxalic acid and pinic acid.
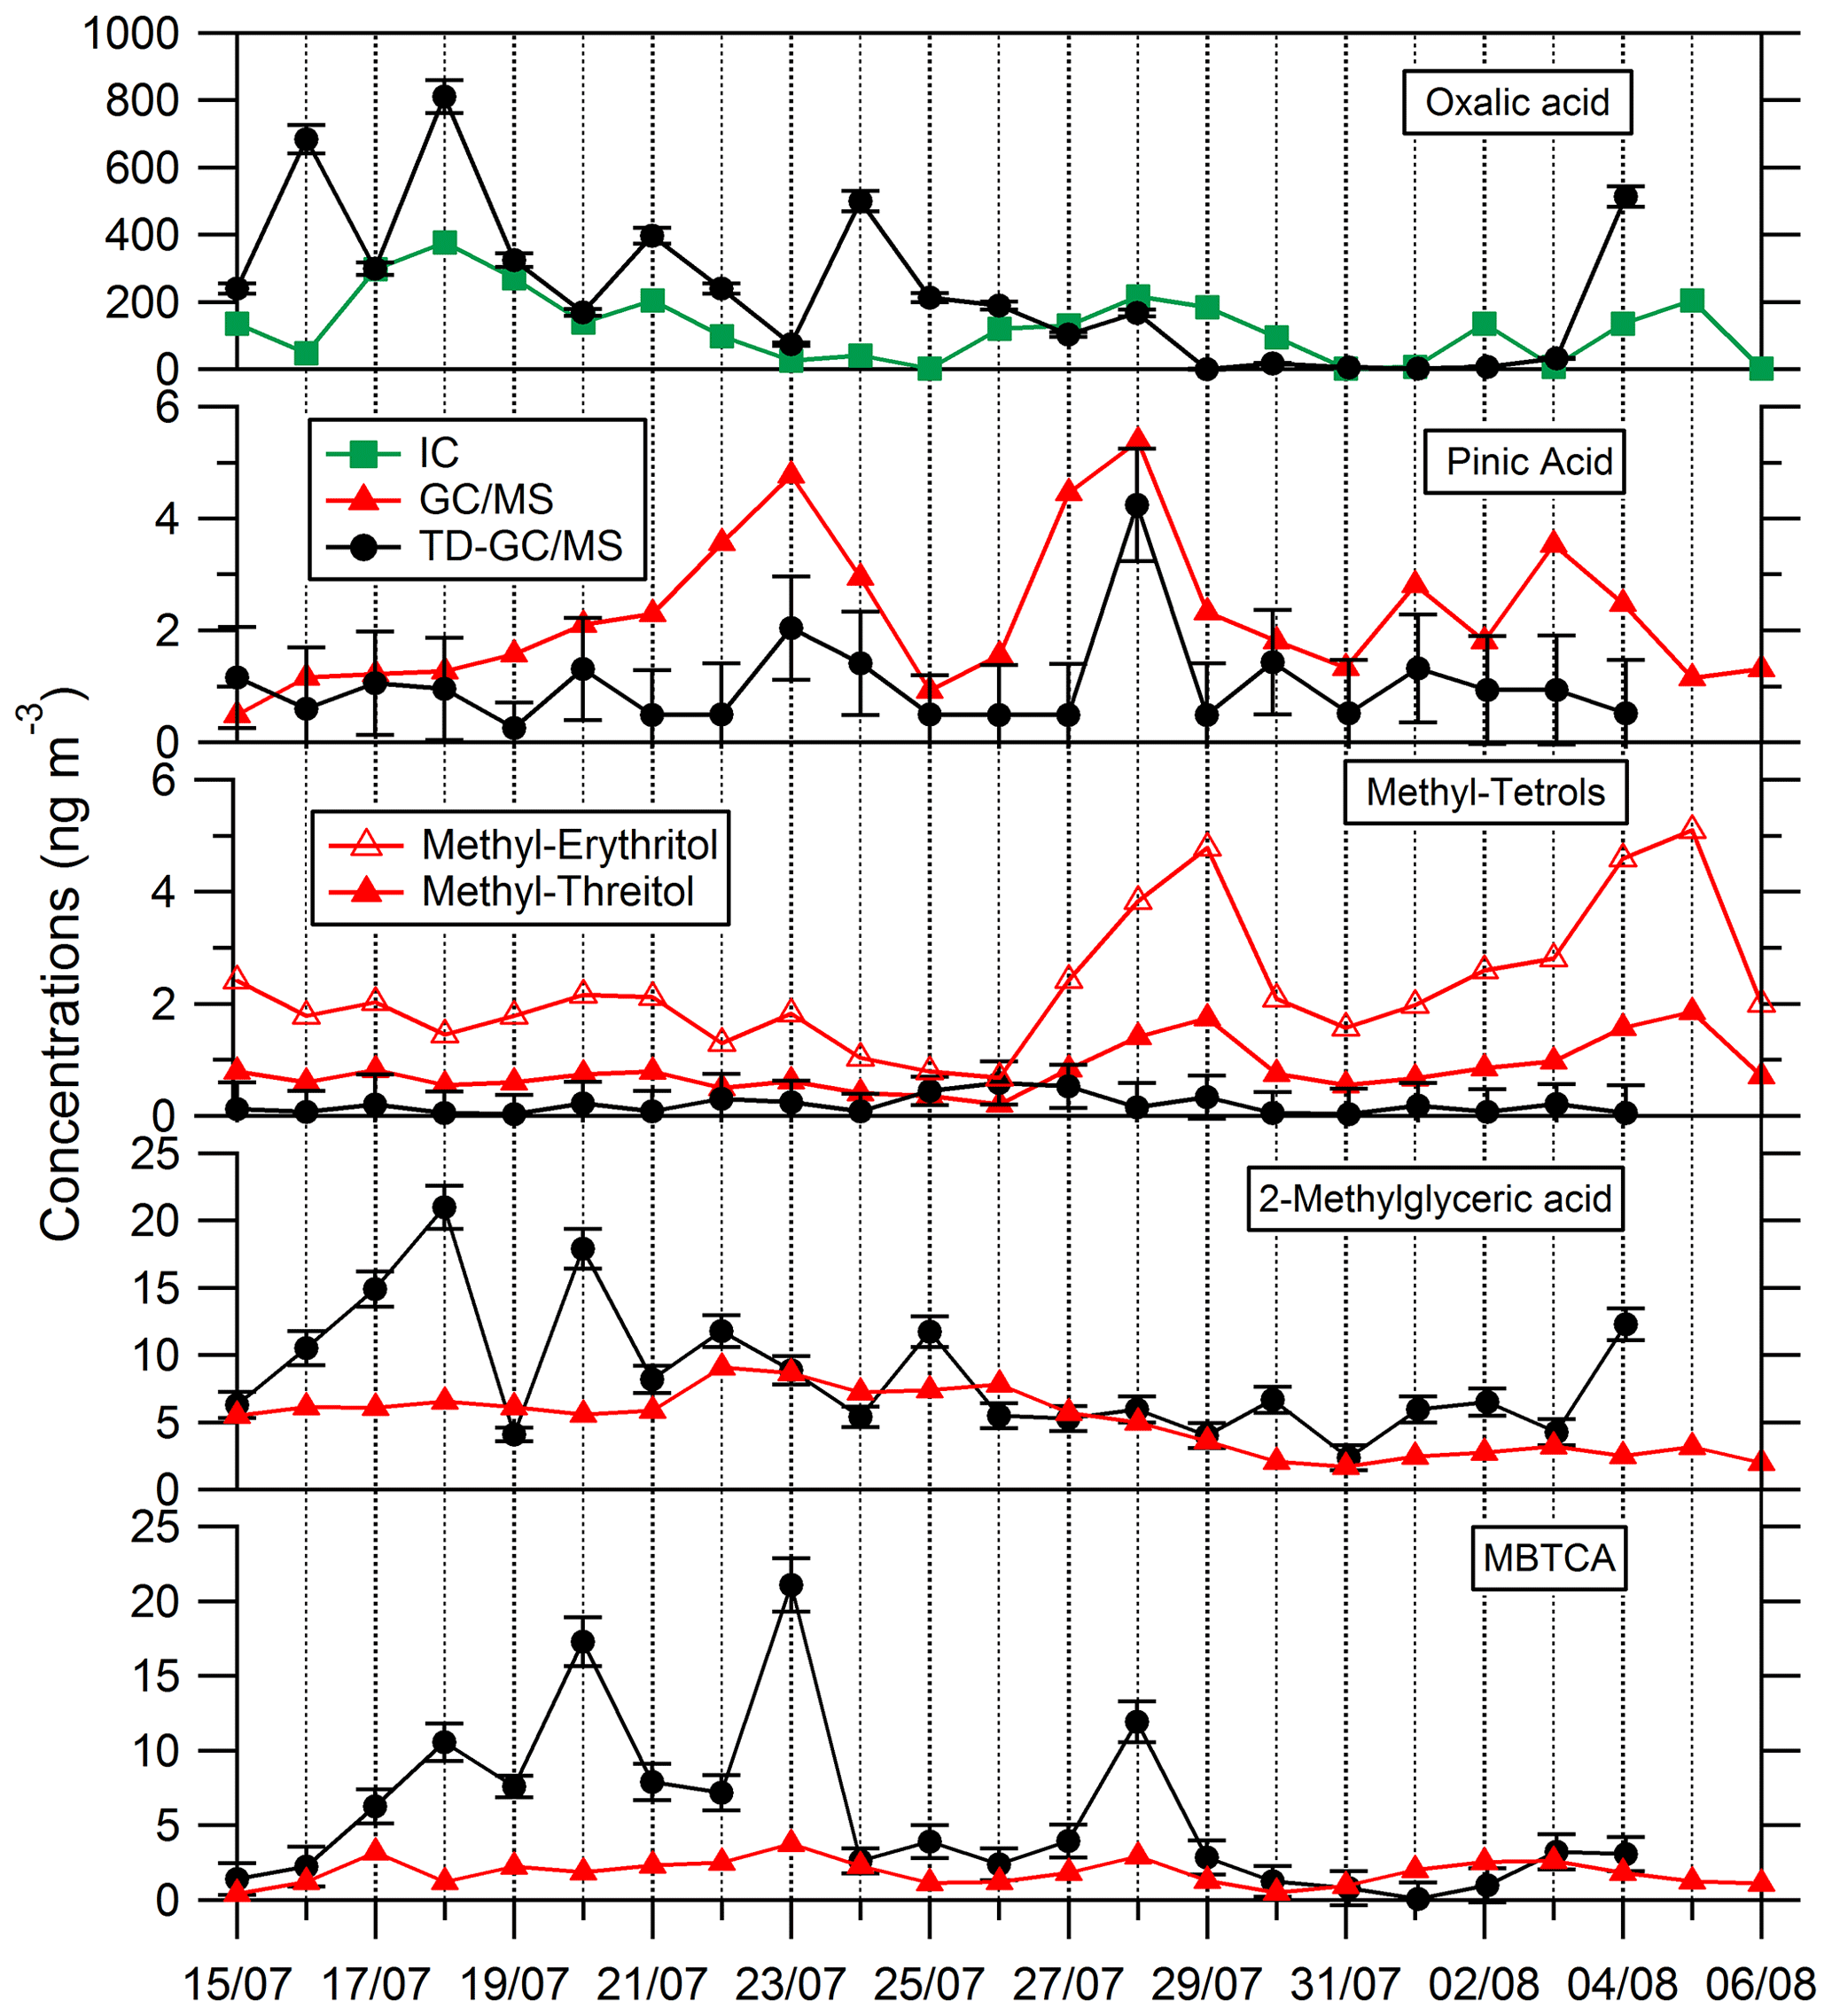
Figure 7Comparison of ATD–GC–MS data with ion chromatography and GC–MS analysis for particulate oxalic acid, pinic acid, methyl tetrols, 2-methylglyceric acid and MBTCA (3-Methyl-1,2,3-tricarboxylic acid). Error bars correspond to the 1σ uncertainties in TD–GC–MS measurements.
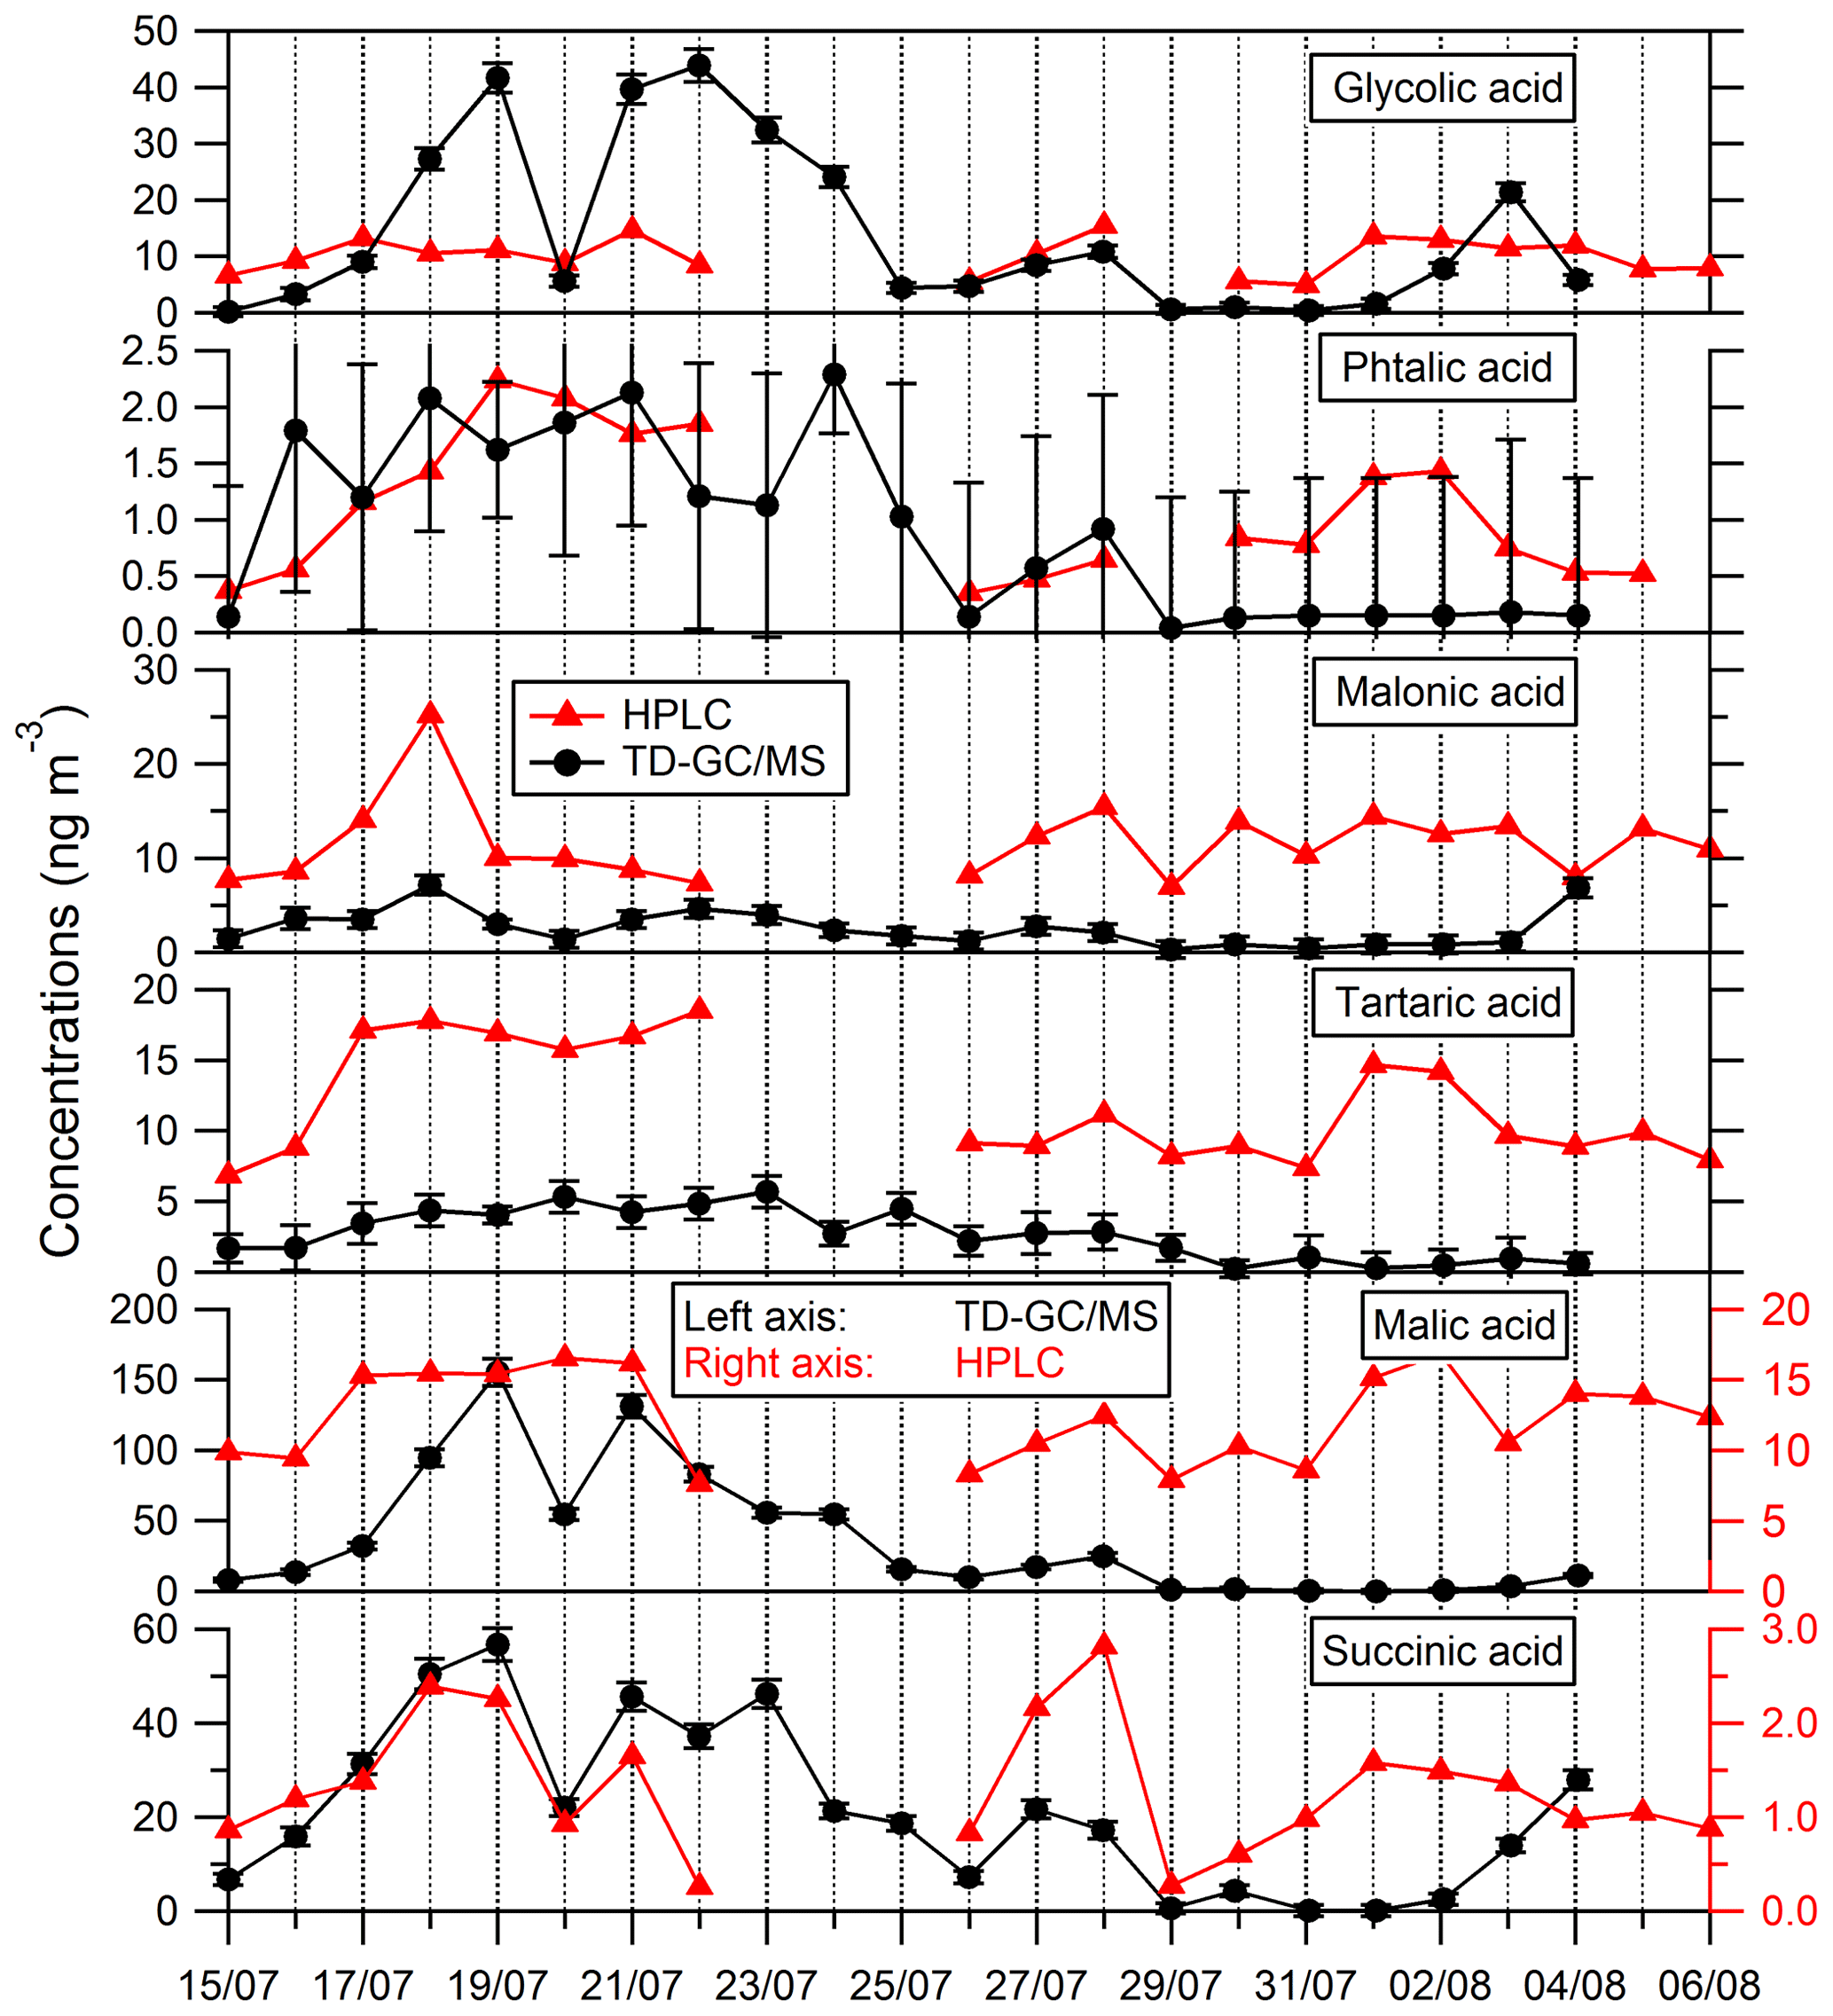
Figure 8Comparison of ATD–GC–MS data with HPLC analysis for particulate glycolic acid, phthalic acid, malonic acid, tartaric acid, malic acid and succinic acid. Error bars correspond to the 1σ uncertainties in TD–GC–MS measurements.
Nevertheless, larger disagreements have been observed for some compounds (see Fig. 8). An overestimation of TD–GC–MS analysis compared to HPLC analysis of a factor of 8 and 20 on average, respectively, for malic acid and succinic acid is observed. For malic acid, the external standard used for the estimation of the response factor (glycolic acid) is maybe not appropriate, which may explain this discrepancy. As a test, succinic acid and glutaric acid (two other di-acids) have been used as an external standard for malic acid quantification, with no improvement in the agreement observed. For succinic acid, the authentic standard has been used, and such a problem cannot explain the discrepancy observed. No interference in the peak region is observed, and this cannot explain the differences observed.
On the whole, comparisons of TD–GC–MS with other techniques deployed during the campaign are satisfactory for both phases, with results at least of the same order of magnitude for the measured absolute concentrations, except for some compounds. Therefore, these observations allow us to use TD–GC–MS data in both the gas and aerosol phase to further study the behavior of organic carbon at a molecular level at Cape Corsica during the ChArMEx campaign, keeping in mind however the potential biases revealed during this data comparison exercise.
4.1 Description of organic compound behavior during the campaign
Time series of every compound measured by TD–GC–MS in both phases are presented in the Supplement Sect. S6.
Concerning the gaseous phase, several linear mono-aldehydes (C3 to C10) have been detected and quantified in the same range of concentrations as what has been previously reported by the same technique at another site in Corsica (Rossignol et al., 2016). These compounds are mainly primary compounds emitted by vegetation under stress conditions. For propanal and butanal, some chemical processes and anthropogenic primary sources (especially ship emission) can also be involved (Agrawal et al., 2008). During the campaign, these compounds in the gaseous phase are characterized by daily maxima during daytime and daily minima during nighttime, confirming the predominance of biogenic sources. This diurnal cycle is also found when these compounds are also measured in the particulate phase, which may indicate a thermodynamic equilibrium for these compounds between both phases. Their concentrations are higher at the end of the campaign (30 July), coinciding with the warmest period, suggesting higher local biogenic emission.
At the end of the campaign, an elevation of concentrations is also observed for nopinone, 4-oxopentanal, 2-propenoic acid, methacrylic acid, mandelic acid, glycolic acid and levulinic acid (see Supplement Sect. S6), all known as oxidation products of biogenic compounds (e.g., Fruekilde et al., 1998; Matsunaga et al., 2004; Rossignol et al., 2012). During this period, air masses were coming from the southern sector and traveled during a short period of time (12 to 24 h) above Corsica and Sardinia (Michoud et al., 2017; Zannoni et al., 2017). An increase in concentrations is also observed for some monocarboxylic acids such as propanoic acid, pentanoic acid, hexanoic acid, tridecanoic acid, tetradecanoic acid and pentadecanoic acid (see Supplement Sect. S6). Several sources are possible for these compounds that can be either primary or secondary and either biogenic or anthropogenic, especially for small carboxylic acids (C3 to C6; Chebbi and Carlier, 1996). Longer-chain carboxylic acids are often considered to be primary compounds from both biogenic and anthropogenic sources. Nevertheless, the results we obtained here underline the ubiquitous nature of organic acids (including long chains) in the atmosphere. It is remarkable to observe that despite their widespread detection, the knowledge of their sources (including chemical processes) remains scarce. Ozonolysis of alkenes, reactions between aldehydes and HO2, or hydrolysis of oligomers could be involved.
At the beginning of the campaign (from 13 to 15 July) we observed a rise in concentrations of 4-oxopentanal, 2-hexanone, glycolic acid, 2-propenoic acid and monocarboxylic acids from C3 to C7 (see Supplement Sect. S6). A spike of methacrolein is also observed on 13 July, highlighting local emission of biogenic precursors as it is during the calm, low-wind cluster period (Michoud et al., 2017).
Concerning particulate compounds, observations are different than for gaseous compounds. Indeed, an important peak of concentrations is observed for many compounds from 17 to 19 July, e.g., 3-isopropylglutaric acid, 3-hydroxy-4,4-dimethylglutaric acid, ketonorlimonic acid, ketolimonic acid, tricarballylic acid and methyltartronic acid (see Supplement Sect. S6). The four first compounds correspond to oxidation products of biogenic precursors such as pinenes and limonene. ratios for these compounds are high, varying from 0.5 (3-isopropylglutaric acid) to 1.3 (methyltartronic acid). This period corresponds to a rise in aerosol mass concentration (see Fig. 2), with stagnant air masses and very low wind speed (Michoud et al., 2017). Associated with strong photochemistry, this favored chemical processing and the formation of secondary products with a high ratio. Other compounds also show a rise in their concentrations at this time (see Supplement Sect. S6): unsaturated carboxylic acids (crotonic acid, 2-hydroxy-3methyl-2-pentenoic acid), long-chain monocarboxylic acids (hexadecanoic acid and octadecanoic acid), dicarboxylic acids (malonic acid, succinic acid, glutaric acid), unsaturated dicarboxylic acids (maleic acid, fumaric acid, 3-methyl-2-pentanedioic acid), erythrose (a triol compound), 2,3-dihydroxypropanoic acid (a dihydroxy acid) and hydroxy-diacids (2-hydroxyglutaric acid, 2-hydroxy-4-isopropyl-hexanedioic acid, 3-hydroxy-2-pentanedioic acid, 3-hydroxy-3-methylglutaric acid, 3-hydroxyhexanedioic acid, malic acid) as well as 2-MGA, 3-MBTCA and DHOPA (2-methylglyceric acid, 4-oxo-2,3-dihydroxypentanoic acid and 3-hydroxyglutaric acid, respectively).
Higher concentrations for DHOPA, 2-MGA, MBTCA and HGA are observed from 20 to 24 July (see Supplement Sect. S6); 2-MGA is formed, in the presence of NOx (Ding et al., 2014; Fu et al., 2009; Giorio et al., 2017), through the oxidation of methacrolein and methacrylic acid, both oxidation products of isoprene. This period is characterized by the highest NOx concentrations of the campaign (averaged concentrations of 1 ppbv against 0.6 ppbv for the rest of the campaign). Some dicarboxylic acids (e.g., malonic acid, succinic acid and glutaric acid) also show a rise in their concentrations during this period. This suggests strong photochemical activity with an important aging of the air masses collected and an advanced photochemical age for this period, also characterized by high OH missing reactivity (up to 56 % of OH reactivity unexplained) observed at the site (Zannoni et al., 2017). In contrast, from 27 July to the end of the campaign, levels of concentrations for these compounds decrease (see Supplement Sect. S6), suggesting less aged air masses. This is also revealed by the higher (cis-pinonic acid + pinic acid) MBTCA ratio observed during this last period (see Supplement Sect. S6). Indeed, this ratio allows the evaluation of the oxidation state of air masses since cis-pinonic acid and pinic acid are first-generation oxidation products of monoterpenes, while MBTCA is known to be a higher-generation oxidation product (Ding et al., 2014).
Observations of MSA (methanesulfonic acid, CH3SO3H) and water-soluble HULISs are reported in Supplement Sect. S7. MSA is an oxidation product of dimethyl sulfide (DMS), a gaseous compound emitted by marine phytoplankton activity, and is mostly present in the particulate phase. MSA can therefore be used to identify the influence of marine chemistry on aerosol composition. Higher MSA concentrations are observed from 23 to 28 July and on 4 August, when air masses were coming from the western sectors and spent days above sea (see Michoud et al., 2017), and the first period of the campaign (15–18 July), when air masses were stagnant, with very low wind speed (see Michoud et al., 2017). In summer, HULISs are mostly formed through secondary oligomerization processes in the particulate phase (Baduel et al., 2010). Higher water-soluble HULIS concentrations are observed from 20–21 July, when air masses are originating from the northeastern sector, bringing continental aged air-masses (Michoud et al., 2017), and on 27 July, when air masses were coming from the southern sector, with large biogenic influence (Michoud et al., 2017). This is consistent with the formation of HULISs through secondary oligomerization processes in summer from both anthropogenic and biogenic precursors (Srivastava et al., 2018).
4.2 Molecular characterization of particulate matter
A time series of total mass quantified by TD–GC–MS in PM2.5 is presented in Fig. 9. This sum has been calculated using the QL/2 (quantification limit) value when data were below the limit of quantification. The sum of all the compounds measured by TD–GC–MS represents an average of 630 ng m−3 for the whole campaign, with a minimum of 54 ng m−3 and a maximum of 2400 ng m−3 measured on 17 July.
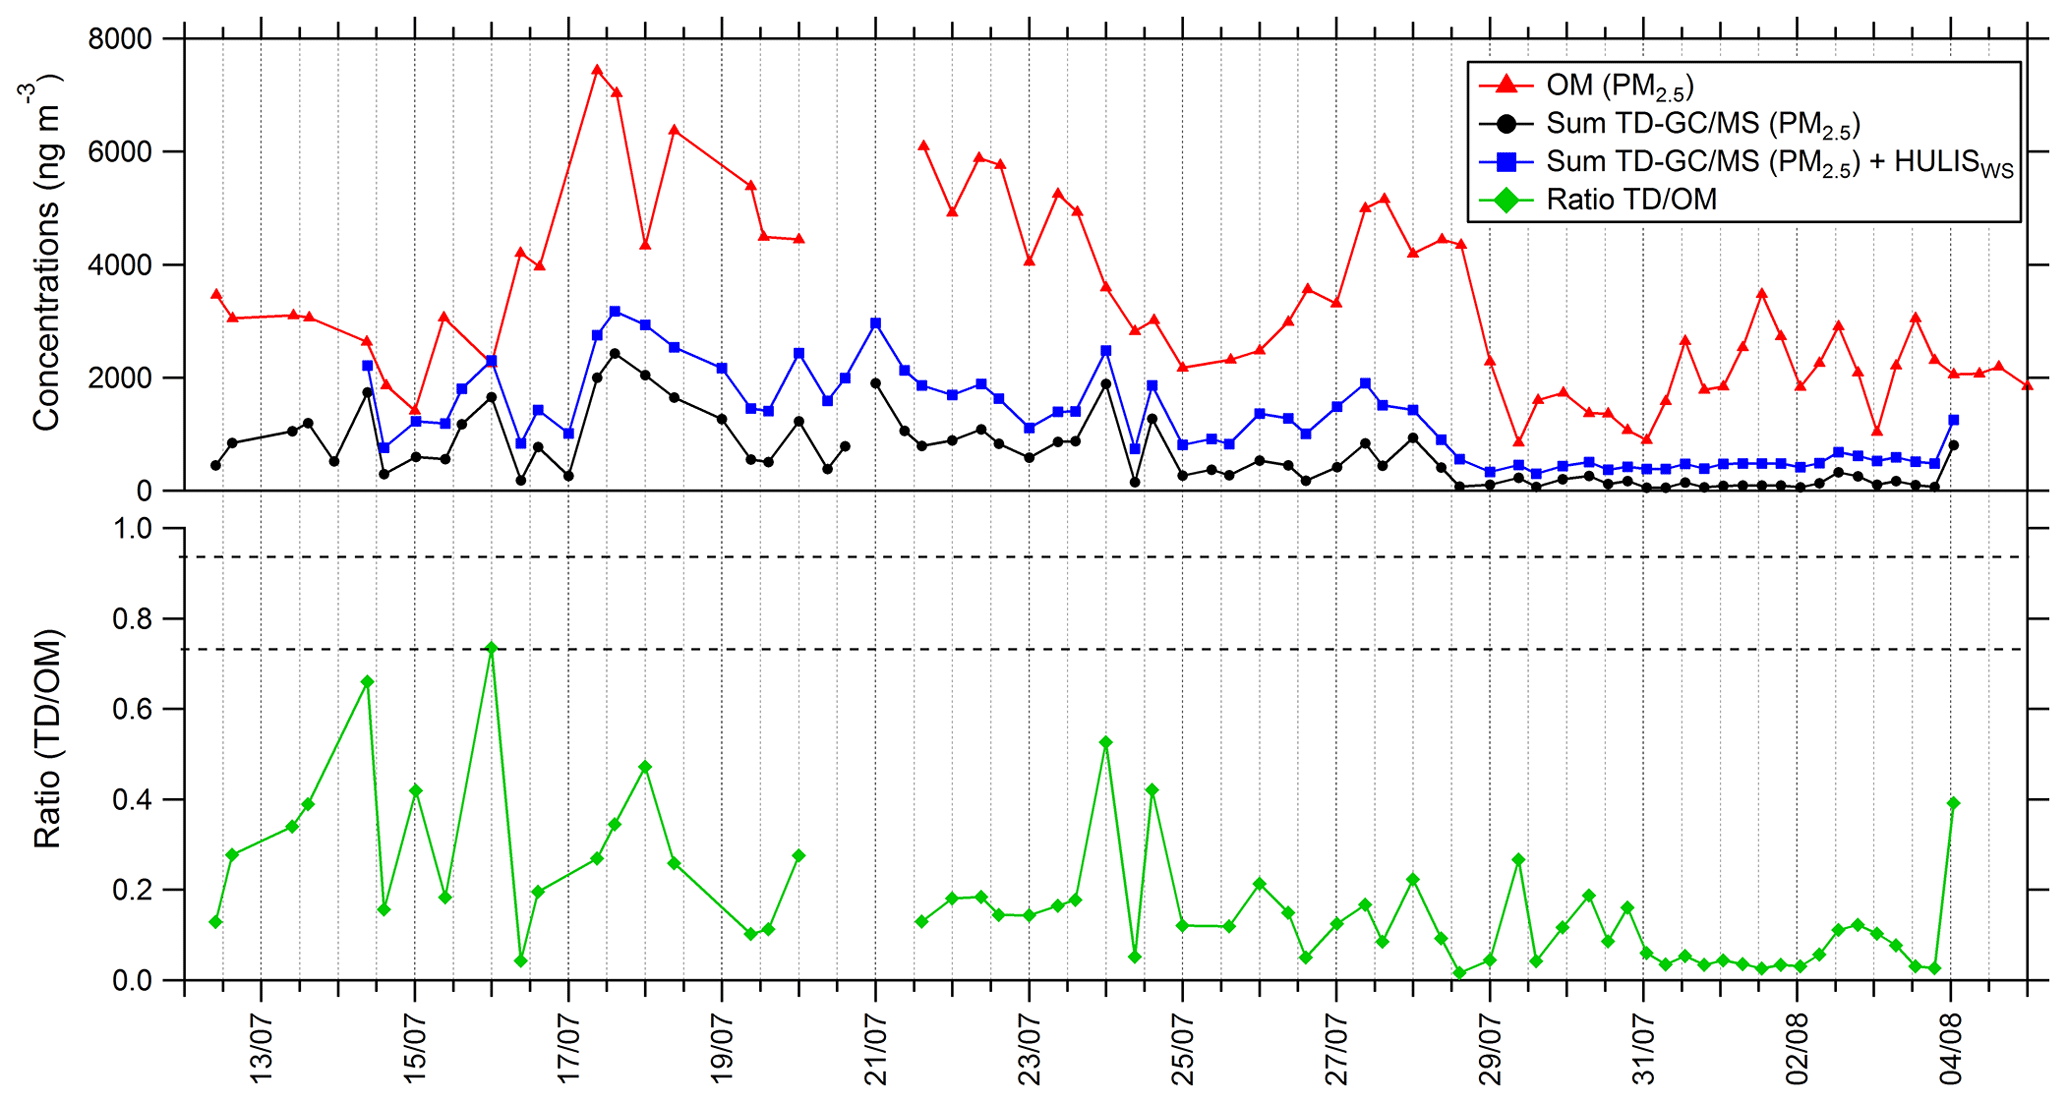
Figure 9Time series of organic matter in PM2.5 (red line), total sum of PM2.5 from TD–GC–MS analysis (black line), total sum of PM2.5 from TD–GC–MS analysis and water-soluble HULIS analysis (blue line), and ratio of these two measurements (green line).
This sum is also compared to the organic matter mass concentration in PM2.5 (see Fig. 9). Organic matter (OM) is calculated using the organic carbon (OC) concentration measured by the SUNSET field instrument, with a ratio between OC and OM of 1.9 for Cape Corsica as proposed by Michoud et al. (2017). On average 18 % of the total OM mass can be explained by the compounds measured by TD–GC–MS for the whole campaign. From 12 to 29 July, oxygenated compounds measured by TD–GC–MS represent more than 20 % on average of measured OM, while they represented less than 10 % between 29 July and 4 August. If measured water-soluble HULISs are added to these compounds, analyzed compounds represent 36 % of measured OM on average and up to 100 % on 16 July.
Some of the compounds identified and quantified by TD–GC–MS, especially carboxylic acids, are soluble in the aqueous phase, and their presence in the aerosol phase could proceed through the transfer from the gas phase to deliquescent aerosol. To allow a comparison between TD–GC–MS measurements and WSOC (water-soluble organic carbon) measurements conducted by PILS-TOC, only soluble compounds measured by TD–GC–MS have been selected (see Fig. 10). Indeed, we considered only the compounds having a Henry's law constant higher than 104 M atm−1. For every compound measured by TD–GC–MS, the Henry's law constants have been determined by the structure–activity relationship (SAR) developed by Raventos-Duran et al. (2010) using the online platform of the GECKO-A model (Aumont et al., 2005; http://geckoa.lisa.u-pec.fr/generateur_form.php, last access: 21 May 2021). At the end, 39 different compounds have been selected for the calculation of this sum, and no aldehyde or ketone was kept in this selection.
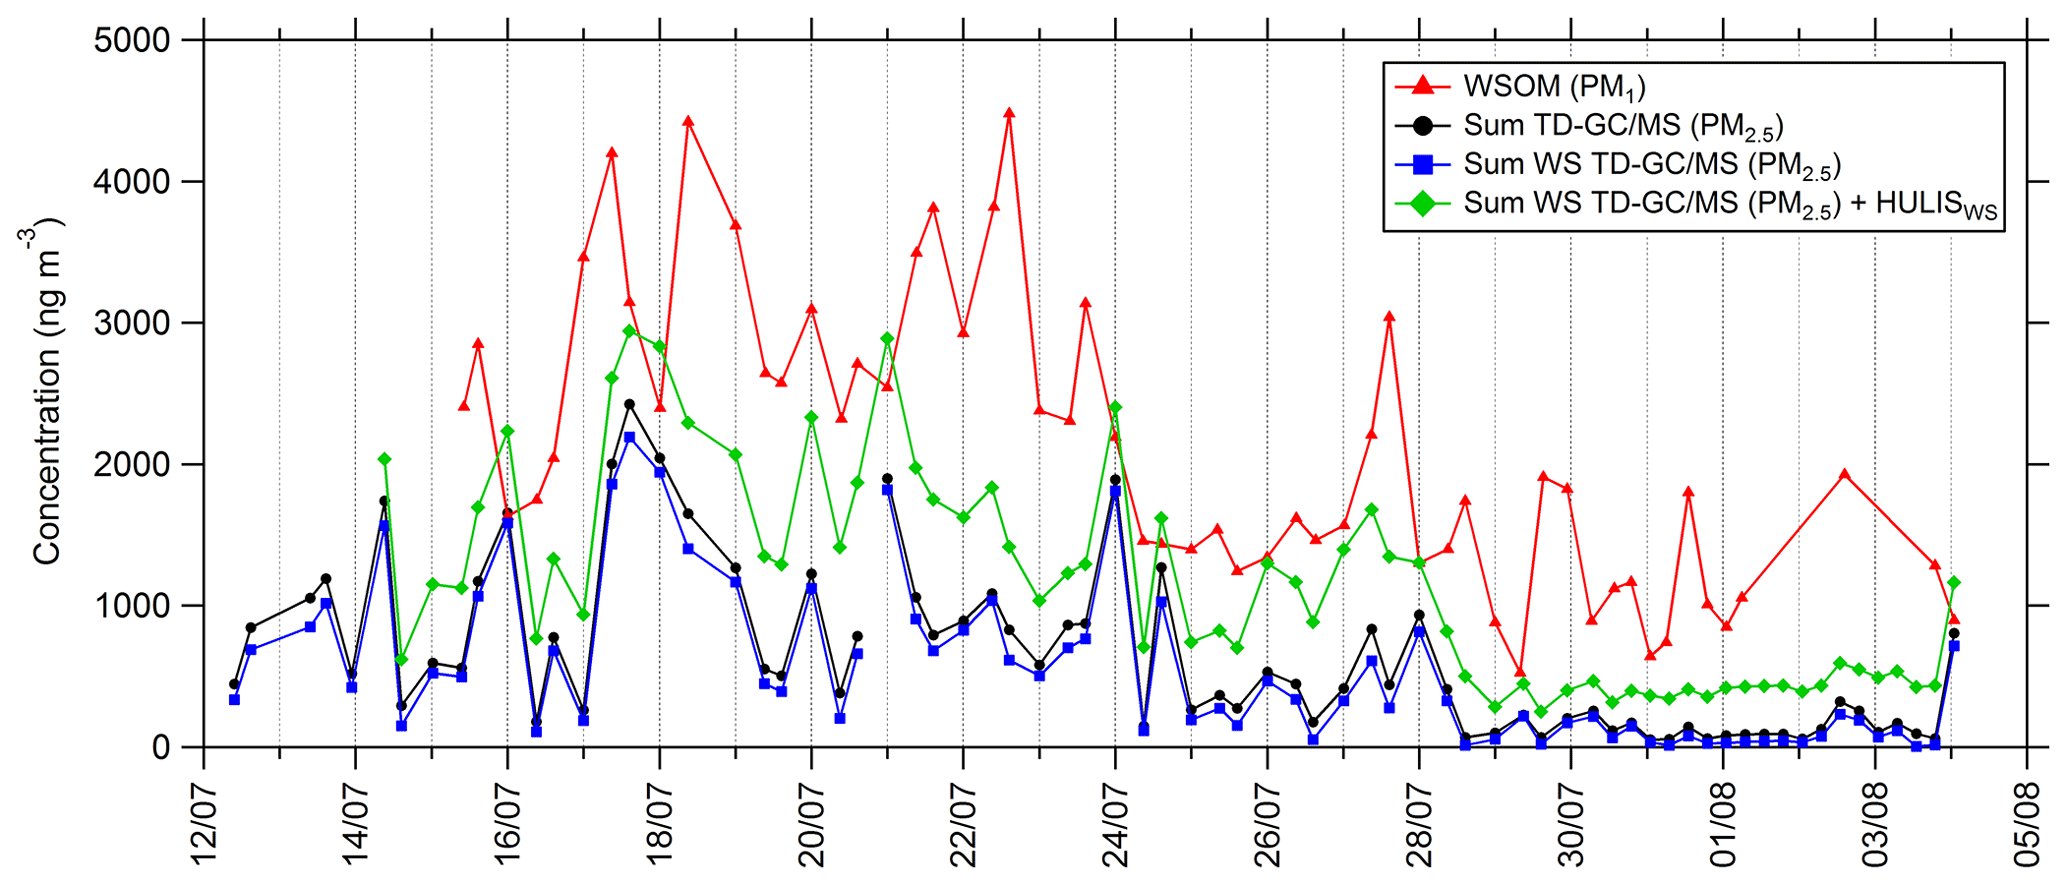
Figure 10Time series of PM1 water-soluble organic matter (WSOM; red line), total sum of PM2.5 measured by TD–GC–MS (black line), total sum of compounds measured by TD–GC–MS and having Henry's law constant higher than 104 M atm−1 measured by TD–GC–MS (water-soluble TD–GC–MS; blue line), and total sum of water-soluble compounds measured by TD–GC–MS and water-soluble HULISs (green line).
Comparing the sums of compounds measured by TD–GC–MS considering only soluble ones or considering all of them reveals very similar behaviors and levels of concentrations (see Fig. 10). On average, soluble compounds represent 72 % of the total concentration of PM measured by TD–GC–MS despite the important number of compounds not considered to be soluble (26 compounds over 58 not considered). Time series of soluble compounds measured by TD–GC–MS and of WSOM have similar behaviors, with higher concentrations during the period between 17 and 23 July and smaller concentrations at the end of the campaign. It is worth noting that WSOM corresponds to PM1, while TD–GC–MS measurements concern PM2.5. On average, the sum of the soluble compounds measured by TD–GC–MS represented 24 % of the total WSOM measured by PILS-TOC. If measured water-soluble HULISs are added to these soluble compounds, analyzed water-soluble compounds represent 58 % of measured WSOM on average and up to 100 % on 15 and 17 July.
Time series and average composition of the PM2.5 measured by TD–GC–MS are presented, respectively, in Figs. 11 and 12. Almost half of the PM2.5 measured by TD–GC–MS is characterized by di-carboxylic acid (49 %), with oxalic acid being the most important by far. Other contributors to PM2.5 composition measured by TD–GC–MS are tri-carboxylic acids (15 %), alcohols (13 %), aldehydes (10 %), di-hydroxy-carboxylic acids (5 %), monocarboxylic acids and ketones (3 % each), and hydroxyl-carboxylic acids (2 %). High concentrations of di-carboxylic acids are observed from 13 to 28 July (441 ng m−3 on average; 51 % of the total OM measured by TD–GC–MS). After 29 July, the contribution of di-carboxylic acids decreases significantly to reach 30 %. The end of the campaign is characterized by intense fresh local biogenic emissions leading to less processed air masses and OM composed mostly of mono-functionalized compounds. On a general basis, organic acids constitute the principal contributors to the fraction of organic aerosol measured by TD–GC–MS during this campaign, while only few chemical processes are known to lead to their formation (see Sect. 4.1). The identification of many di-carboxylic acids implies the existence of unknown chemical processes both in the gaseous phase and even more probably in the particulate phase to explain their formation (Hammes et al., 2019). These missing processes in the chemical mechanism included in models might contribute to their inability to reproduce correctly the formation and aging of SOA. If considered, HULISs represent 59 % of the total identified OM mass on average, ranging from 21 % of the contribution at the beginning of the campaign to more than 80 % at the end of the campaign (from 31 July to 3 August).
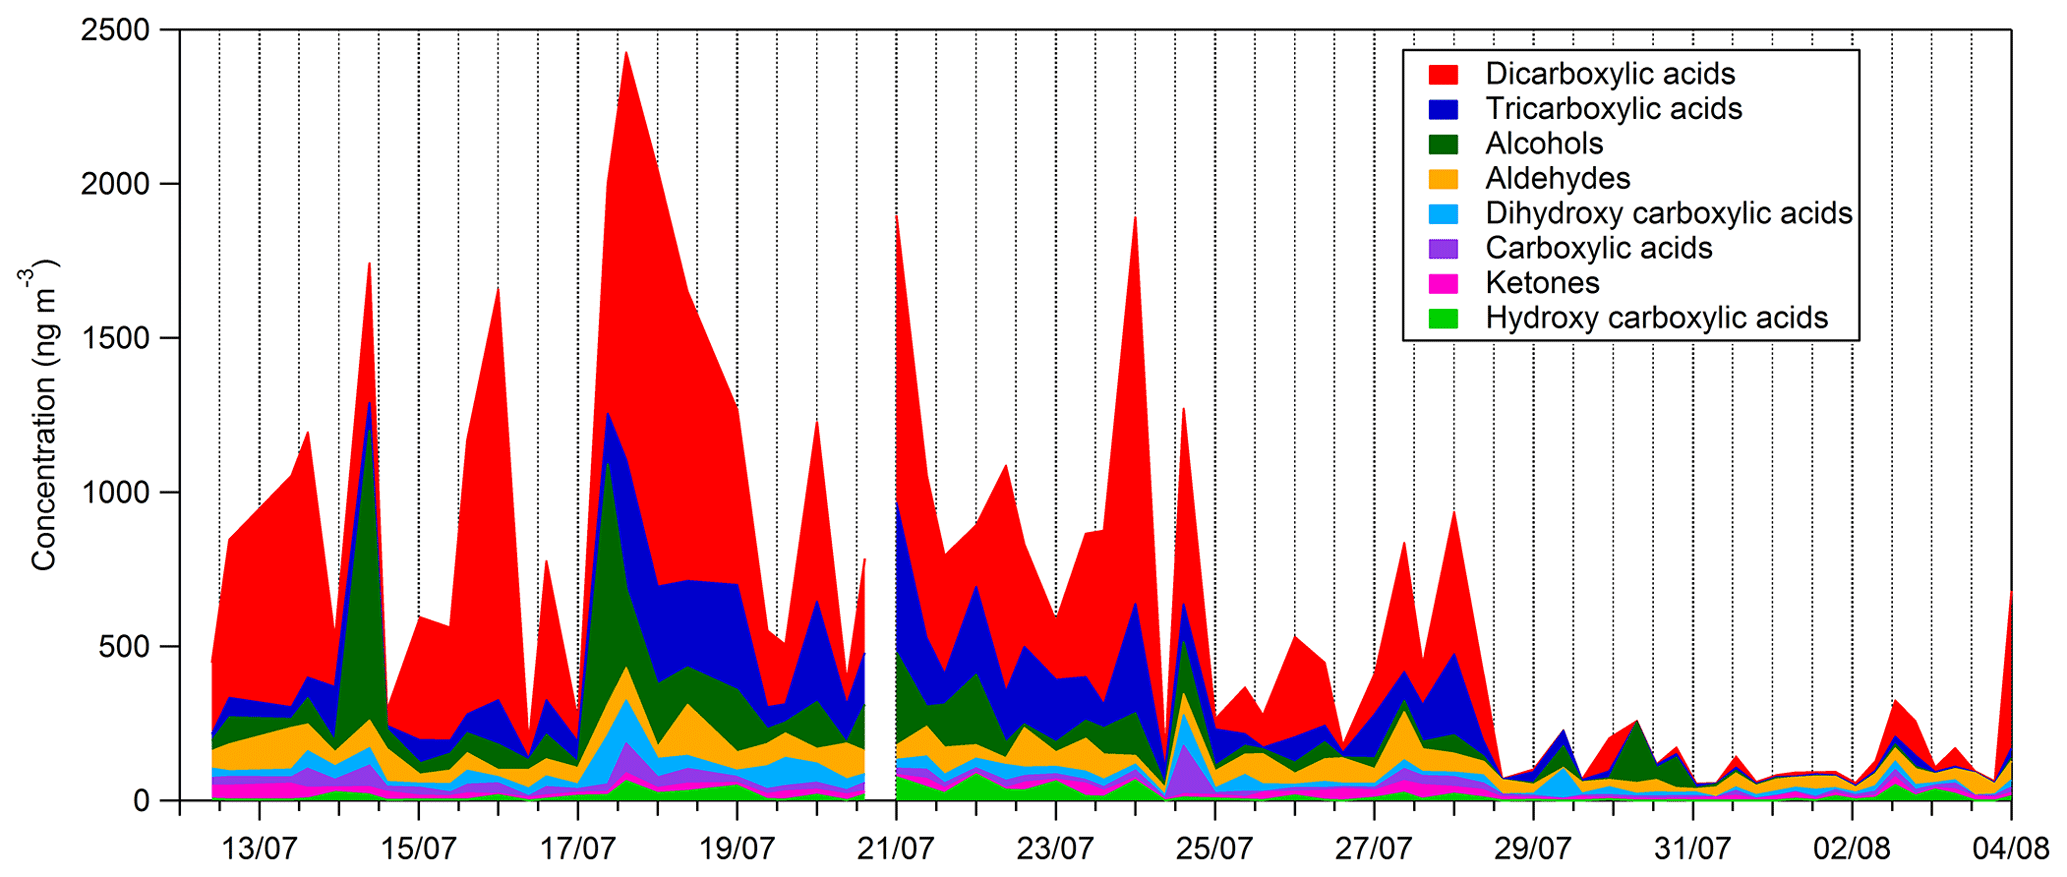
Figure 11Time series of the composition of the sum of all compound concentrations measured by TD–GC–MS.
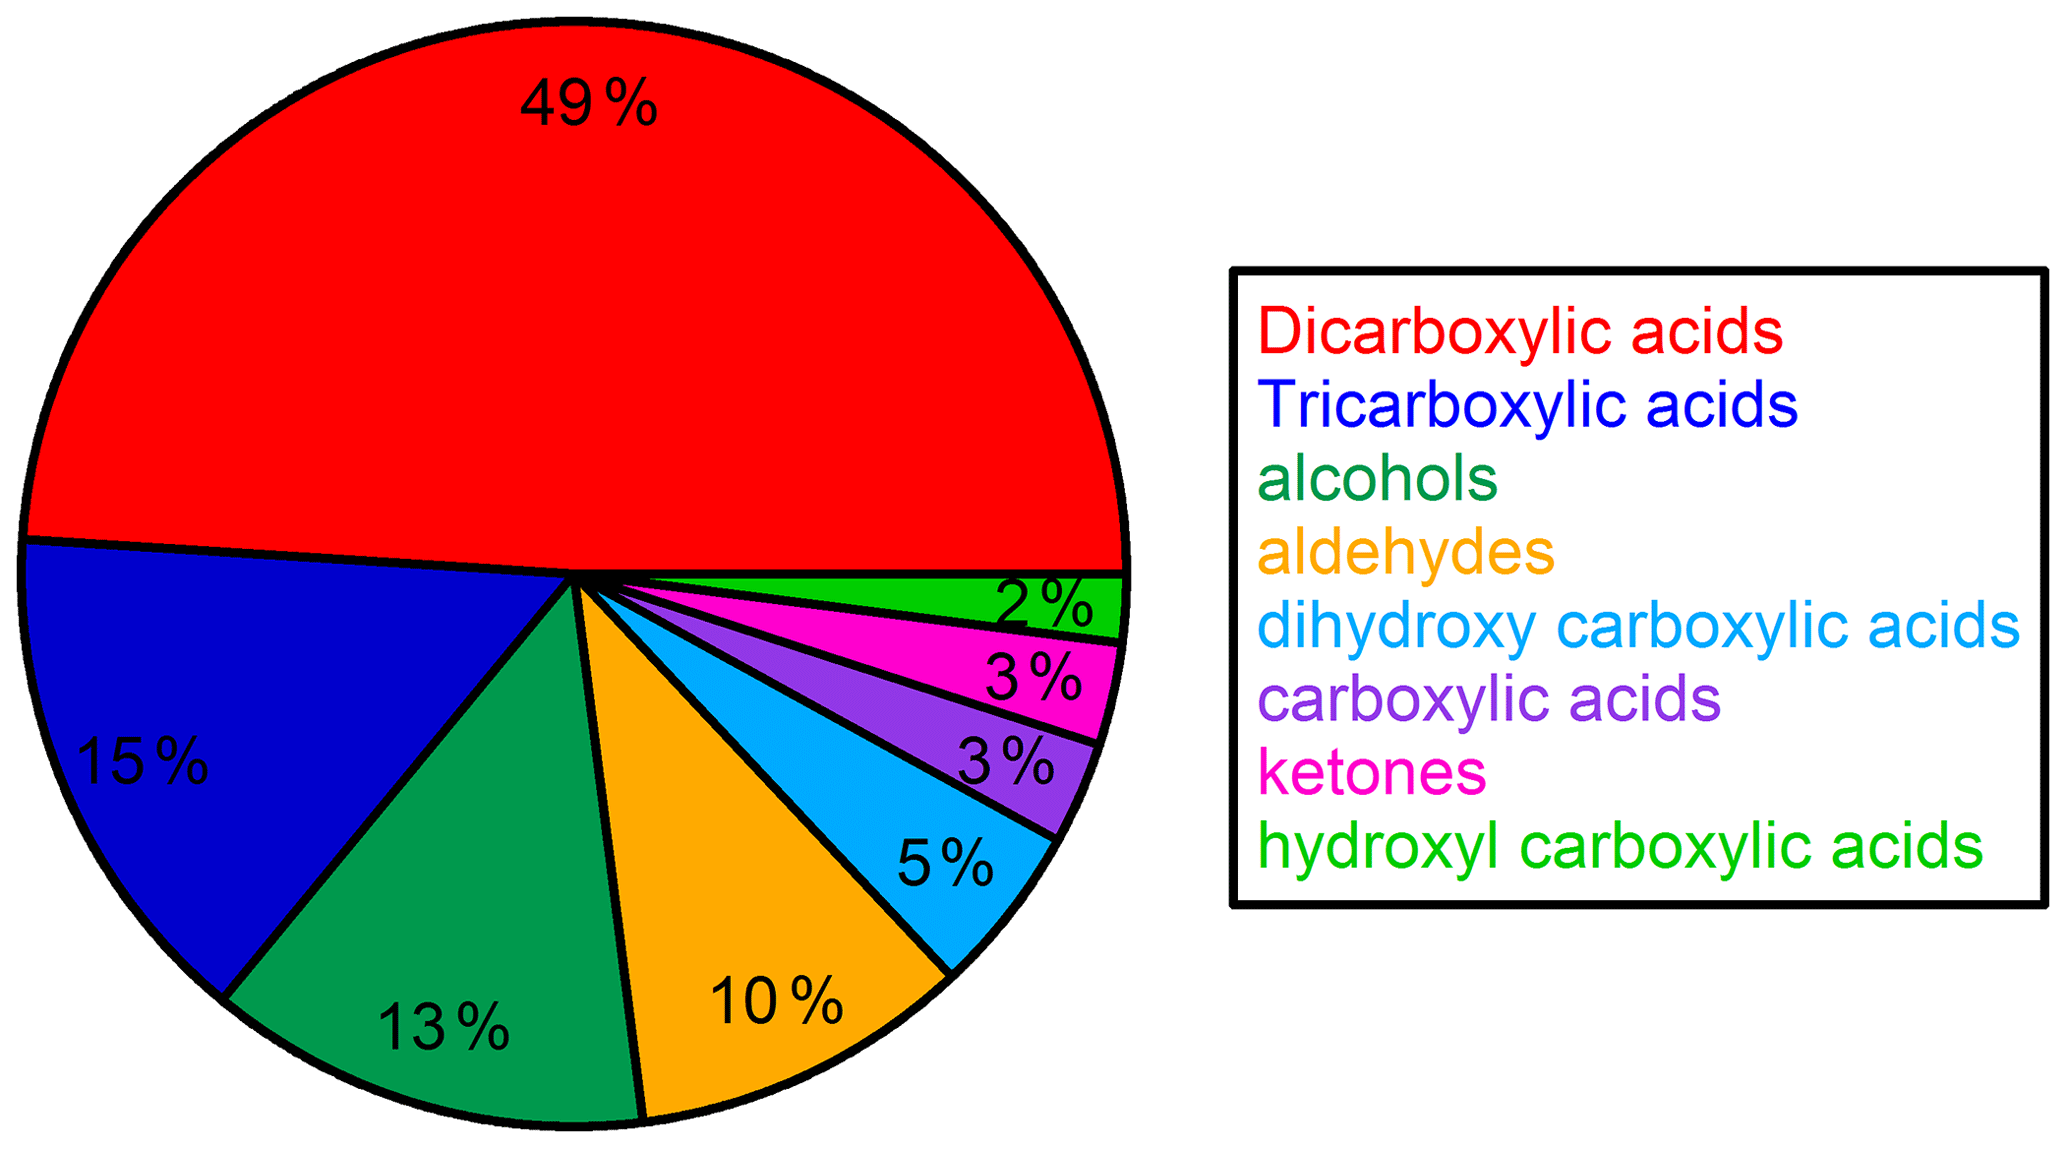
Figure 12Campaign-averaged relative composition of the sum of all compounds measured by TD–GC–MS in the organic aerosol phase (hydroxyl-carboxylic acid: light-green area; ketone: pink area; carboxylic acid: purple area; dihydroxy carboxylic acid: light-blue area; aldehyde: orange area; alcohol: dark-green area; tricarboxylic acid: dark-blue area; dicarboxylic acid: red area).
4.3 Partitioning of organic carbon between gaseous and particulate phases
Many of the compounds identified during the campaign are present in both the gas and aerosol phases. The partitioning coefficient is therefore key to understanding processes governing the equilibrium between both phases. For the compounds present in both phases, an experimental partitioning coefficient can be determined following Eq. (1) relying on the Pankow equilibrium.
Kpe,i corresponds to the experimental partitioning coefficient for the compounds i, Fi corresponds to the concentration in the particulate phase, Ai corresponds to the concentration in the gaseous phase, and TSP (total suspended particulate matter) corresponds to the total mass concentration of particles measured by TEOM–FDMS for PM10 (µg m−3). Uncertainties for experimental partitioning coefficients take into account uncertainties in the measurement of concentrations in both phases (see Sect. 2.2) and in the TEOM measurement (estimated to be 25 %).
Further, another expression of the Pankow equilibrium allows for the determination of theoretical partitioning coefficients using Eq. (2).
Kpt,i corresponds to the theoretical partitioning coefficient for the compounds I, R to the ideal gas constant, T to the temperature in Kelvin, fom to the OM mass fraction, MWom to the averaged molar mass of compounds constituting organic particulate matter (g mol−1), ζi to the activity coefficient and to the saturation vapor pressure (Torr). Saturation vapor pressures have been determined at 295 K (averaged temperature of the campaign) using three different models (Moller et al., 2008; Myrdal and Yalkowsky, 1997; Nannoolal et al., 2008); fom has been set to 0.8 using the averaged (TC signifies total carbon) ratio measured by the SUNSET field instrument, and ζi has been set to 1.27 as suggested by Rossignol (2012).
Experimental (averaged over the campaign) and theoretical partitioning coefficients obtained for compounds identified in both phases are presented in Table 2 and Fig. 13 and are compared to experimental coefficients obtained in a previous field study in Corsica and a chamber study in the EUPHORE (EUropean PHOtoREactor) simulation chamber (Rossignol et al., 2016). For most of the compounds, experimental partitioning coefficients obtained for the three campaigns are relatively close to each other, with some differences that can however reach up to an order of magnitude (e.g., dimethylglyoxal or acrolein, even 2 orders of magnitude for glyoxal). These observed differences are small compared to the differences recorded between experimental and theoretical coefficients, with an observed underestimation of theoretical coefficients varying from 1 to 7 orders of magnitude. It is worth noting that the three models used for theoretical coefficient determination are in good agreement. Higher differences between experimental and theoretical coefficients are observed for hydroxyl compounds and carboxylic acids, with a shift in the equilibrium toward the particulate phase for experimental partitioning coefficients. It is worth noting that a denuder is used upstream of the filter collection to avoid overestimation of particulate organic matter due to adsorption of semi-volatile compounds onto the filter, therefore excluding potential positive artifacts for concentrations of compounds in the particulate phase that could have led to overestimation of experimental partitioning coefficients. Furthermore, underestimation of gaseous concentrations for these compounds in such a high proportion is unlikely, especially when we look at the comparisons performed for OVOCs with other measurement techniques (see “Gas phase” section), even for compounds that show strong disagreement between various analytical methods (e.g., glyoxal).
Table 2Experimental (averaged over the campaign, with ±XX % representing the 1σ standard deviation over the campaign) and theoretical partitioning coefficients determined for this study and compared to previous field and chamber campaigns.
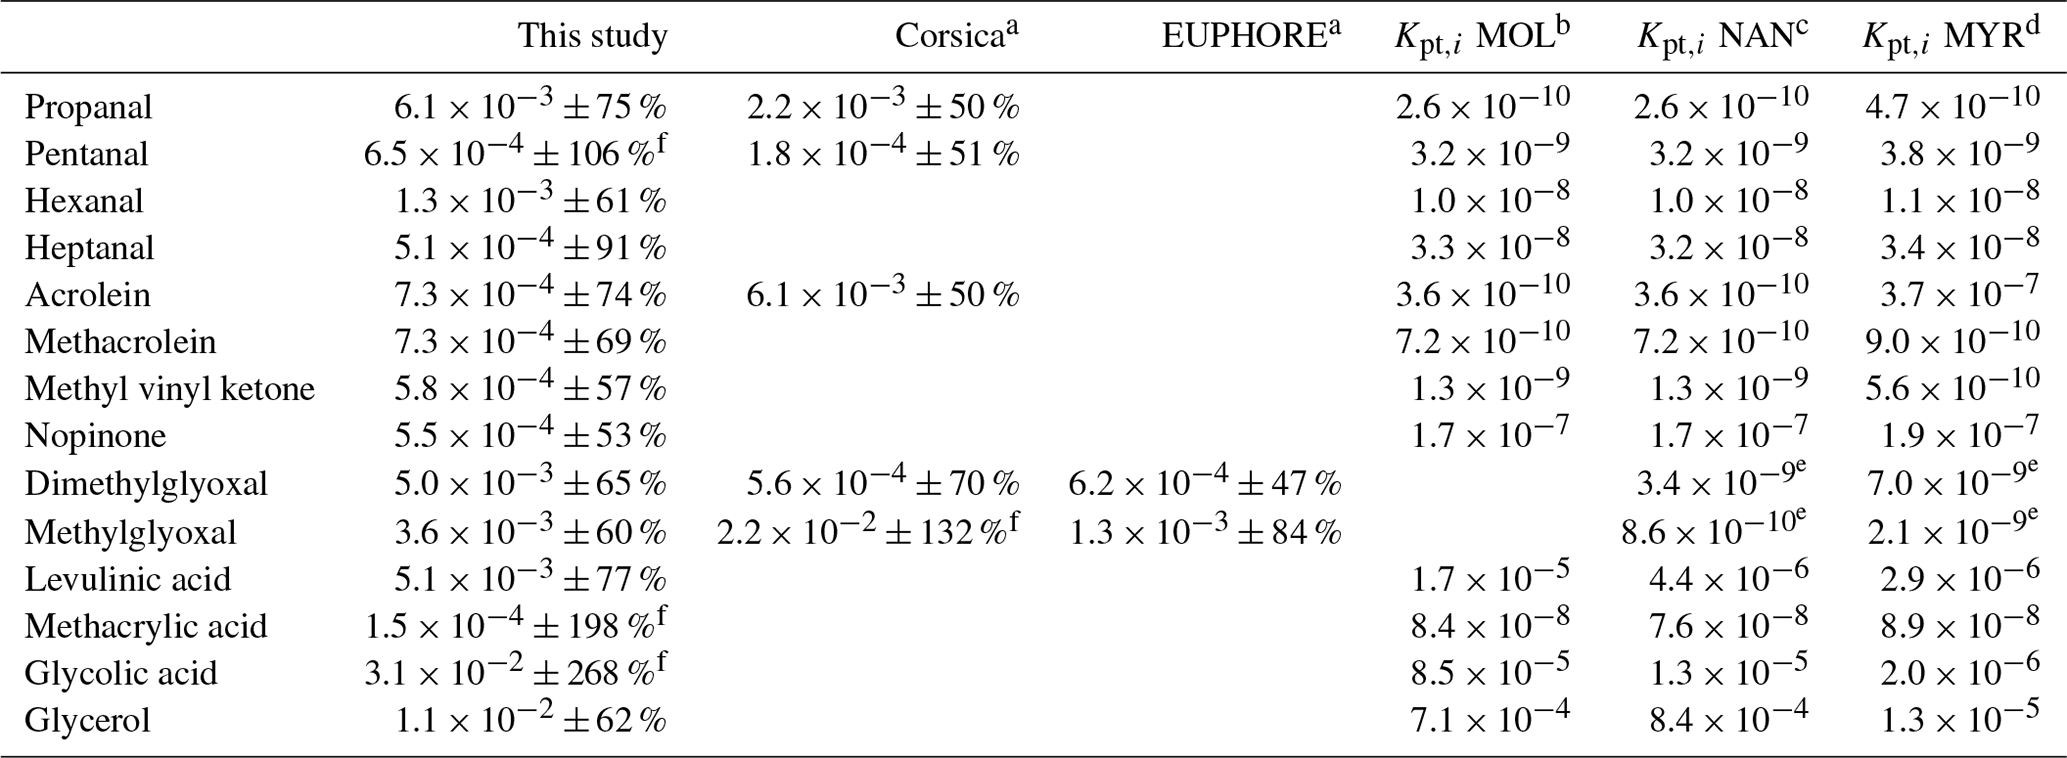
a Rossignol et al. (2016), b Moller et al. (2008) (coupled with the Nannoolal et al., 2004, method for boiling point determination), c Nannoolal et al. (2008) (coupled with the Nannoolal et al., 2004, method for boiling point determination), d Myrdal and Yalkowsky (1997) (coupled with the Nannoolal et al., 2004, method for boiling point determination). e Coefficients extracted from Rossignol (2012) at temperature of 300 K, with other parameters (MWom and ζi) kept similar. f Partitioning coefficients are between 0 and 1. Experimental uncertainties greater than 100 % mean that the experimental value is between 0 and more than twice its values.
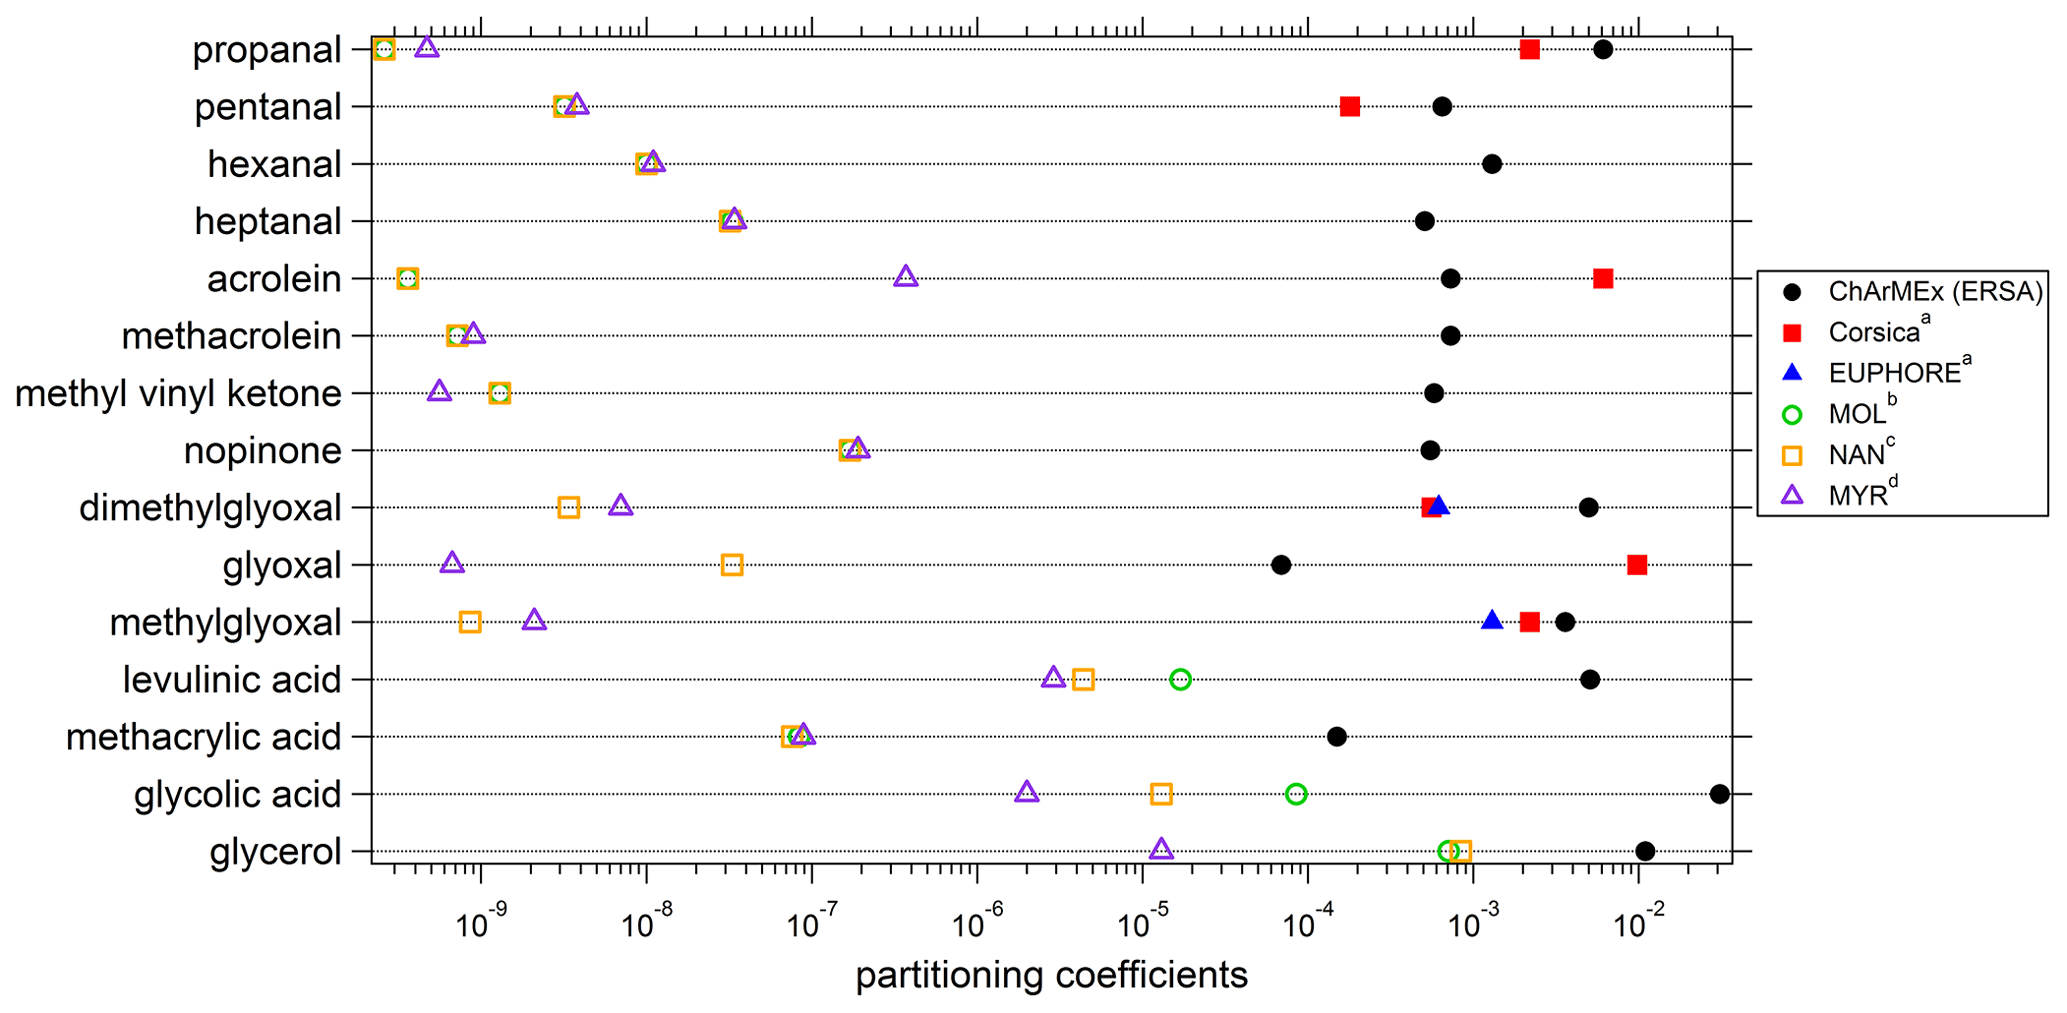
Figure 13Experimental and theoretical partitioning coefficients determined for this study and compared to previous field and chamber campaigns. a Rossignol et al. (2016), b Moller et al. (2008) (coupled with the Nannoolal et al., 2004, method for boiling point determination), c Nannoolal et al. (2008) (coupled with the Nannoolal et al., 2004, method for boiling point determination), d Myrdal and Yalkowsky (1997) (coupled with the Nannoolal et al., 2004, method for boiling point determination).
The differences observed between experimental and theoretical partitioning coefficient may be explained by the high-humidity conditions encountered during the campaign (mean RH value of 70 %; see Table 1). Indeed, the theoretical partitioning coefficient as described by the Pankow equilibrium does not take into account the presence of an aqueous phase or a deliquescent aerosol, while soluble organic compounds can split between gaseous, aqueous and particulate phase. Concerning the partitioning between the gaseous and aqueous phases, the Henry law's constant and the activity coefficients are considered to calculate the thermodynamic equilibrium.
These differences could also be explained by the fact that the equilibrium between both phases is not reached. This could be due to the viscosity of particles. Some studies showed that organic aerosol can be found in various states, from liquid to semi-solid (viscous) (Bateman et al., 2016; Booth et al., 2014; Shiraiwa et al., 2011; Virtanen et al., 2010). The viscosity of the particle can limit the diffusion inside the particle, which can lead to an inhomogeneity in the composition with the formation of a gradient of concentrations between the surface and the center of the particle (Chan et al., 2014; Davies and Wilson, 2015; Zobrist et al., 2011). The equilibrium could therefore only concern an external layer of the particle and the gaseous phase (Davies and Wilson, 2015), or in contrast a semi-solid external layer, caused by the aging of the particle, could prevent the equilibrium from settling between the particulate bulk and the gaseous phase.
Furthermore, Soonsin et al. (2010) showed that the physical state of the particle can influence the activity coefficient of some compounds and especially of dicarboxylic acids. Partitioning coefficients are calculated considering a liquid phase for aerosols. Considering a solid or semi-solid phase for aerosols would lead to a decrease in the vapor pressure estimation for such compounds and therefore to higher theoretical partitioning coefficients.
In addition, polymerization and oligomerization processes in the particulate phase have been highlighted in previous studies through the identification of compounds with high masses (Hallquist et al., 2009; Kalberer et al., 2004; Lim et al., 2010; Tolocka et al., 2004). The formation of oligomers increases the viscosity of the particle during its aging (Abramson et al., 2013). These reactions could also explain the presence of semi-volatile compounds in the particulate phase in such a high proportion, especially for carbonyls that have high vapor pressure and which should not be detected in the aerosol phase based on the theory. Indeed, numerous studies reveal the possibility of formation of oligomers inside the particle from carbonyls such as α-di-carbonyls, for example glyoxal or methylglyoxal (Gao et al., 2004a, b; Hastings et al., 2005; Iinuma et al., 2004; Jang et al., 2002, 2003; Jang and Kamens, 2001; Liggio et al., 2005a, b; Lim et al., 2010; Tolocka et al., 2004). These reactions are favored under low water content in the particles even though oligomer production from other reactions can also happen at high relative humidity and in the aqueous phase. In contrast, under higher-humidity conditions, oligomers can form back monomer compounds, which in case of viscous particles can be trapped in the particulate phase. It is worth noting that higher experimental partitioning coefficients are found for most compounds on 20 July and from 26–27 July, while water-soluble HULIS concentrations are at their maximum. HULISs are known to be formed through secondary oligomerization processes in summer (Baduel et al., 2010), supporting the hypothesis that these kinds of processes might be partly responsible for the disagreement between the experimental and theoretical partitioning coefficient.
Even if an analytical artifact cannot be ruled out, for example a fragmentation of oligomers to form back the monomer compounds during the analysis, ample evidence supports the experimental results presented here and suggests that the instantaneous equilibrium being established between gaseous and particulate phases assuming a homogeneous non-viscous particle phase is not fully representative of the real atmosphere.
A multiphasic molecular characterization of oxygenated compounds has been carried out during the ChArMEx SOP 1b field campaign held in Ersa, Corsica, during July 2013 using an analytical technique based on multi-support sampling (filters and adsorbent containing cartridges), a derivatization procedure and TD–GC–MS analysis. The deployment of this analytical technique in the field allows the identification of 97 different compounds in the gas (24 different compounds) and aerosol (50 different compounds) phases, some of them being present in both phases (23 different compounds). These compounds include simple carbonyls, alcohols or carboxylic acids as well as multi-functional compounds from two and up to four functional groups. Among all the quantified compounds, the important contribution of organic acids (67 % of the organic aerosol concentration measured by TD–GC–MS) emphasizes the existence of unknown chemical processes in the gaseous phase and even more probably in the particulate and/or aqueous phases to explain their formation. The absence of such processes in chemical mechanisms may contribute to the inability of models to correctly reproduce the formation and aging of SOA.
Comparisons of these measurements with other measurements performed at the site when available reveal fair agreement on the whole for almost all compounds experiencing redundant measurement in both phases, with concentrations at least of the same order of magnitude. Noticeable disagreements (larger than a factor of 8 and up to a factor of 15) have however been found for glyoxal in the gas phase between TD–GC–MS measurements and DNPH cartridge analysis and for malic and succinic acid in the particulate phase between TD–GC–MS measurements and HPLC analysis. Nevertheless, comparisons of TD–GC–MS with other techniques deployed during the campaign are in general agreement, validating their use to conduct further analysis.
While the data obtained are very valuable to provide additional insight into the composition of organic matter for air masses encountered during the campaign, it is worth noting that it represents only a fraction of the total mass of organic matter. Indeed, an attempt to close the mass budget of organic aerosol using the TD–GC–MS measurements reveals that the sum of all particulate oxygenated organic compounds measured by this technique account for 18 % of the total OM mass on average for the whole campaign. This portion of OM identified at the molecular scale is not constant and mostly depends on the oxidation state of the sampled air masses. If we only consider the soluble compounds measured by TD–GC–MS, they represent 24 % of the total WSOM on average. Therefore, a sizable fraction of the OM mass was identified by TD–GC–MS analysis, but a very large fraction of OM mass remained unidentified during the campaign, highlighting the complexity of an exhaustive characterization of the OA chemical composition at the molecular scale. An important fraction of this unidentified OM mass is due to HULISs.
Finally, for the compounds quantified in both the gas and the aerosol phases, a comparison between experimental and theoretical partitioning coefficients has been performed, revealing in most cases a large underestimation by the theory reaching 1 to 7 orders of magnitude. It indicates that the partitioning theory is most often inappropriate since it is based on the instantaneous equilibrium being established between gaseous and particulate phases, assuming a homogeneous non-viscous particle phase. Furthermore, the partitioning of semi-volatile compounds is influenced by meteorological conditions (humidity, temperature) and inherent properties of particles (viscosity, water content, organic-fraction concentrations, acidity, etc.). In addition, the way these conditions impact the partitioning of semi-volatile compounds strongly depends on the physico-chemical properties of the considered compounds (solubility, saturation vapor pressure, reactivity, etc.).
Access to the data used for this publication is restricted to registered users following the data and publication policy of the ChArMEx program (http://mistrals.sedoo.fr/ChArMEx/Data-Policy/ChArMEx_DataPolicy.pdf, last access: 21 May 2021).
The supplement related to this article is available online at: https://doi.org/10.5194/acp-21-8067-2021-supplement.
VM and EH participated in the field campaign and prepared the paper with input from all co-authors. LC, ELG and JFD were involved in TD–GC–MS measurements and supervised this work. SD, IF, TL, NL and SS participated in the field campaign and were in charge of VOC measurements (GC–FID–MS, PTR-MS, active sampling on DNPH cartridges). AC and FG were in charge of inorganic trace gas measurements (NOx and O3). JS participated in the field campaign and was in charge of aerosol measurements by ACSM, the OCEC instrument, PILS-TOC and IC. JLJ and NM were in charge of aerosol speciation measurements during the campaign through filter analysis (IC, GC–MS, HPLC, HULIS measurements).
The authors declare that they have no conflict of interest.
This article is part of the special issue “CHemistry and AeRosols Mediterranean EXperiments (ChArMEx) (ACP/AMT inter-journal SI)”. It is not associated with a conference.
The authors want to thank Eric Hamonou and François Dulac for logistical help during the campaign and all the participants of the ChArMEx SOP1b field campaign. This paper is dedicated to the memory of our friend and colleague Laura Chiappini, who passed away shortly after the campaign. Laura Chiappini conceived the original idea for this work and created the conditions to have this experimental work done. Analyses at IGE were performed on the Air O Sol platform partly funded with the Labex OSUG@2020 (ANR10 LABX56).
This research has been supported by MISTRALS and ChArMEx programs, ADEME, the French Environmental Ministry, and the Communauté Territoriale de Corse (CORSiCA project). This research has also been supported by the CaPPA project (Chemical and Physical Properties of the Atmosphere), funded by the French National Research Agency (ANR) through the PIA (Programme d'Investissement d'Avenir) under contract ANR-11-LABX-0005-01 and by the Regional Council Nord-Pas de Calais and the European Funds for Regional Economic Development (FEDER).
This paper was edited by Andreas Hofzumahaus and reviewed by two anonymous referees.
Abramson, E., Imre, D., Beránek, J., Wilson, J., and Zelenyuk, A.: Experimental determination of chemical diffusion within secondary organic aerosol particles, Phys. Chem. Chem. Phys., 15, 2983–2991, https://doi.org/10.1039/C2CP44013J, 2013.
Agrawal, H., Welch, W. A., Miller, J. W., and Cocker, D. R.: Emission Measurements from a Crude Oil Tanker at Sea, Environ. Sci. Technol., 42, 7098–7103, https://doi.org/10.1021/es703102y, 2008.
Alves, C., Vicente, A., Pio, C., Kiss, G., Hoffer, A., Decesari, S., Prevôt, A. S. H., Minguillón, M. C., Querol, X., Hillamo, R., Spindler, G., and Swietlicki, E.: Organic compounds in aerosols from selected European sites – biogenic versus anthropogenic sources, Atmos. Environ., 59, 243–255, https://doi.org/10.1016/j.atmosenv.2012.06.013, 2012.
Aumont, B., Szopa, S., and Madronich, S.: Modelling the evolution of organic carbon during its gas-phase tropospheric oxidation: development of an explicit model based on a self generating approach, Atmos. Chem. Phys., 5, 2497–2517, https://doi.org/10.5194/acp-5-2497-2005, 2005.
Baduel, C., Voisin, D., and Jaffrezo, J.-L.: Seasonal variations of concentrations and optical properties of water soluble HULIS collected in urban environments, Atmos. Chem. Phys., 10, 4085–4095, https://doi.org/10.5194/acp-10-4085-2010, 2010.
Barreira, L. M. F., Parshintsev, J., Kärkkäinen, N., Hartonen, K., Jussila, M., Kajos, M., Kulmala, M., and Riekkola, M.-L.: Field measurements of biogenic volatile organic compounds in the atmosphere by dynamic solid-phase microextraction and portable gas chromatography-mass spectrometry, Atmos. Environ., 115, 214–222, https://doi.org/10.1016/j.atmosenv.2015.05.064, 2015.
Bateman, A. P., Bertram, A. K., and Martin, S. T.: Hygroscopic influence on the semisolid-to-liquid transition of secondary organic materials, J. Phys. Chem. A, 119, 4386–4395, https://doi.org/10.1021/jp508521c, 2015.
Bateman, A. P., Gong, Z., Liu, P., Sato, B., Cirino, G., Zhang, Y., Artaxo, P., Bertram, A. K., Manzi, A. O., Rizzo, L. V., Souza, R. A. F., Zaveri, R. A., and Martin, S. T.: Sub-micrometre particulate matter is primarily in liquid form over Amazon rainforest, Nat. Geosci., 9, 34–37, https://doi.org/10.1038/ngeo2599, 2016.
Bates, M., Bruno, P., Caputi, M., Caselli, M., de Gennaro, G., and Tutino, M.: Analysis of polycyclic aromatic hydrocarbons (PAHs) in airborne particles by direct sample introduction thermal desorption GC/MS, Atmos. Environ., 42, 6144–6151, https://doi.org/10.1016/j.atmosenv.2008.03.050, 2008.
Booth, A. M., Murphy, B., Riipinen, I., Percival, C. J., and Topping, D. O.: Connecting bulk viscosity measurements to kinetic limitations on attaining equilibrium for a model aerosol composition, Environ. Sci. Technol., 48, 9298–9305, https://doi.org/10.1021/es501705c, 2014.
Chacon-Madrid, H. J. and Donahue, N. M.: Fragmentation vs. functionalization: chemical aging and organic aerosol formation, Atmos. Chem. Phys., 11, 10553–10563, https://doi.org/10.5194/acp-11-10553-2011, 2011.
Chan, M. N., Zhang, H., Goldstein, A. H., and Wilson, K. R.: Role of Water and Phase in the Heterogeneous Oxidation of Solid and Aqueous Succinic Acid Aerosol by Hydroxyl Radicals, J. Phys. Chem. C, 118, 28978–28992, https://doi.org/10.1021/jp5012022, 2014.
Chebbi, A. and Carlier, P.: Carboxylic acids in the troposphere, occurrence, sources, and sinks: A review, Atmos. Environ., 30, 4233–4249, https://doi.org/10.1016/1352-2310(96)00102-1, 1996.
Chiappini, L., Perraudin, E., Durand-Jolibois, R., and Doussin, J. F.: Development of a supercritical fluid extraction–gas chromatography–mass spectrometry method for the identification of highly polar compounds in secondary organic aerosols formed from biogenic hydrocarbons in smog chamber experiments, Anal. Bioanal. Chem., 386, 1749–1759, https://doi.org/10.1007/s00216-006-0744-3, 2006.
Davies, J. F. and Wilson, K. R.: Nanoscale interfacial gradients formed by the reactive uptake of OH radicals onto viscous aerosol surfaces, Chem. Sci., 6, 7020–7027, https://doi.org/10.1039/C5SC02326B, 2015.
De Gouw, J. and Jimenez, J. L.: Organic Aerosols in the Earth's Atmosphere, Environ. Sci. Technol., 43, 7614–7618, https://doi.org/10.1021/es9006004, 2009.
de Gouw, J. and Warneke, C.: Measurements of volatile organic compounds in the earth's atmosphere using proton-transferreaction mass spectrometry, Mass. Spectrom. Rev., 26, 223–257, https://doi.org/10.1002/mas.20119, 2007.
Di Biagio, C., Doppler, L., Gaimoz, C., Grand, N., Ancellet, G., Raut, J.-C., Beekmann, M., Borbon, A., Sartelet, K., Attié, J.-L., Ravetta, F., and Formenti, P.: Continental pollution in the western Mediterranean basin: vertical profiles of aerosol and trace gases measured over the sea during TRAQA 2012 and SAFMED 2013, Atmos. Chem. Phys., 15, 9611–9630, https://doi.org/10.5194/acp-15-9611-2015, 2015.
Ding, L. C., Ke, F., Wang, D. K. W., Dann, T., and Austin, C. C.: A new direct thermal desorption-GC/MS method: Organic speciation of ambient particulate matter collected in Golden, BC, Atmos. Environ., 43, 4894–4902, https://doi.org/10.1016/j.atmosenv.2009.07.016, 2009.
Ding, X., He, Q.-F., Shen, R.-Q., Yu, Q.-Q., and Wang, X.-M.: Spatial distributions of secondary organic aerosols from isoprene, monoterpenes, β-caryophyllene, and aromatics over China during summer, J. Geophys. Res.-Atmos., 119, 2014JD021748, https://doi.org/10.1002/2014JD021748, 2014.
Donahue, N. M., Robinson, A. L., Trump, E. R., Riipinen, I., and Kroll, J. H.: Volatility and Aging of Atmospheric Organic Aerosol, in: Atmospheric and Aerosol Chemistry, vol. 339, edited by: McNeill, V. F. and Ariya, P. A., Springer-Verlag Berlin, Berlin, 97–143, 2012.
El Haddad, I., D'Anna, B., Temime-Roussel, B., Nicolas, M., Boreave, A., Favez, O., Voisin, D., Sciare, J., George, C., Jaffrezo, J.-L., Wortham, H., and Marchand, N.: Towards a better understanding of the origins, chemical composition and aging of oxygenated organic aerosols: case study of a Mediterranean industrialized environment, Marseille, Atmos. Chem. Phys., 13, 7875–7894, https://doi.org/10.5194/acp-13-7875-2013, 2013.
Fiore, A. M., Naik, V., and Leibensperger, E. M.: Air Quality and Climate Connections, J. Air Waste Manage., 65, 645–685, https://doi.org/10.1080/10962247.2015.1040526, 2015.
Flores, R. M. and Doskey, P. V.: Evaluation of multistep derivatization methods for identification and quantification of oxygenated species in organic aerosol, J. Chromatogr. A, 1418, 1–11, https://doi.org/10.1016/j.chroma.2015.09.041, 2015.
Fridlind, A. M., Jacobson, M. Z., Kerminen, V. M., Hillamo, R. E., Ricard, V., and Jaffrezo, J. L.: Analysis of gas-aerosol partitioning in the Arctic: Comparison of size-resolved equilibrium model results with field data, J. Geophys. Res., 105, 19891–19903, 2000.
Fruekilde, P., Hjorth, J., Jensen, N. R., Kotzias, D., and Larsen, B.: Ozonolysis at vegetation surfaces: a source of acetone, 4-oxopentanal, 6-methyl-5-hepten-2-one, and geranyl acetone in the troposphere, Atmos. Environ., 32, 1893–1902, 1998.
Fu, P., Kawamura, K., Chen, J., and Barrie, L. A.: Isoprene, monoterpene, and sesquiterpene oxidation products in the high Arctic aerosols during late winter to early summer, Environ. Sci. Technol., 43, 4022–4028, https://doi.org/10.1021/es803669a, 2009.
Fujiwara, F., Guiñez, M., Cerutti, S., and Smichowski, P.: UHPLC-(+)APCI-MS/MS determination of oxygenated and nitrated polycyclic aromatic hydrocarbons in airborne particulate matter and tree barks collected in Buenos Aires city, Microchem. J., 116, 118–124, https://doi.org/10.1016/j.microc.2014.04.004, 2014.
Fuzzi, S., Andreae, M. O., Huebert, B. J., Kulmala, M., Bond, T. C., Boy, M., Doherty, S. J., Guenther, A., Kanakidou, M., Kawamura, K., Kerminen, V.-M., Lohmann, U., Russell, L. M., and Pöschl, U.: Critical assessment of the current state of scientific knowledge, terminology, and research needs concerning the role of organic aerosols in the atmosphere, climate, and global change, Atmos. Chem. Phys., 6, 2017–2038, https://doi.org/10.5194/acp-6-2017-2006, 2006.
Gallimore, P. J., Giorio, C., Mahon, B. M., and Kalberer, M.: Online molecular characterisation of organic aerosols in an atmospheric chamber using extractive electrospray ionisation mass spectrometry, Atmos. Chem. Phys., 17, 14485–14500, https://doi.org/10.5194/acp-17-14485-2017, 2017.
Gao, S., Keywood, M., Ng, N. L., Surratt, J., Varutbangkul, V., Bahreini, R., Flagan, R. C., and Seinfeld, J. H.: Low-Molecular-Weight and Oligomeric Components in Secondary Organic Aerosol from the Ozonolysis of Cycloalkenes and α-Pinene, J. Phys. Chem. A, 108, 10147–10164, https://doi.org/10.1021/jp047466e, 2004a.
Gao, S., Ng, N. L., Keywood, M., Varutbangkul, V., Bahreini, R., Nenes, A., He, J., Yoo, K. Y., Beauchamp, J. L., Hodyss, R. P., Flagan, R. C., and Seinfeld, J. H.: Particle Phase Acidity and Oligomer Formation in Secondary Organic Aerosol, Environ. Sci. Technol., 38, 6582–6589, https://doi.org/10.1021/es049125k, 2004b.
Giorio, C., Monod, A., Brégonzio-Rozier, L., DeWitt, H. L., Cazaunau, M., Temime-Roussel, B., Gratien, A., Michoud, V., Pangui, E., Ravier, S., Zielinski, A. T., Tapparo, A., Vermeylen, R., Claeys, M., Voisin, D., Kalberer, M., and Doussin, J.-F.: Cloud Processing of Secondary Organic Aerosol from Isoprene and Methacrolein Photooxidation, J. Phys. Chem. A, 121, 7641–7654, https://doi.org/10.1021/acs.jpca.7b05933, 2017.
Glasius, M. and Goldstein, A. H.: Recent discoveries and future challenges in atmospheric organic chemistry, Environ. Sci. Technol., 50, 2754–2764, https://doi.org/10.1021/acs.est.5b05105, 2016.
Goldstein, A. H. and Galbally, I. E.: Known and unexplored organic constituents in the earth's atmosphere, Environ. Sci. Technol., 41, 1514–1521, 2007.
Hallquist, M., Wenger, J. C., Baltensperger, U., Rudich, Y., Simpson, D., Claeys, M., Dommen, J., Donahue, N. M., George, C., Goldstein, A. H., Hamilton, J. F., Herrmann, H., Hoffmann, T., Iinuma, Y., Jang, M., Jenkin, M. E., Jimenez, J. L., Kiendler-Scharr, A., Maenhaut, W., McFiggans, G., Mentel, Th. F., Monod, A., Prévôt, A. S. H., Seinfeld, J. H., Surratt, J. D., Szmigielski, R., and Wildt, J.: The formation, properties and impact of secondary organic aerosol: current and emerging issues, Atmos. Chem. Phys., 9, 5155–5236, https://doi.org/10.5194/acp-9-5155-2009, 2009.
Hamilton, J. F., Webb, P. J., Lewis, A. C., Hopkins, J. R., Smith, S., and Davy, P.: Partially oxidised organic components in urban aerosol using GCXGC-TOF/MS, Atmos. Chem. Phys., 4, 1279–1290, https://doi.org/10.5194/acp-4-1279-2004, 2004.
Hansel, A., Jordan, A., Holzinger, R., Prazeller, P., Vogel, W., and Lindinger, W.: Proton transfer reaction mass spectrometry: on-line trace gas analysis at the ppb level, Int. J. Mass Spectrom., 149–150, 609–619, https://doi.org/10.1016/0168-1176(95)04294-U, 1995.
Hammes, J., Lutz, A., Mentel, T., Faxon, C., and Hallquist, M.: Carboxylic acids from limonene oxidation by ozone and hydroxyl radicals: insights into mechanisms derived using a FIGAERO-CIMS, Atmos. Chem. Phys., 19, 13037–13052, https://doi.org/10.5194/acp-19-13037-2019, 2019.
Hastings, W. P., Koehler, C. A., Bailey, E. L., and De Haan, D. O.: Secondary Organic Aerosol Formation by Glyoxal Hydration and Oligomer Formation: Humidity Effects and Equilibrium Shifts during Analysis, Environ. Sci. Technol., 39, 8728–8735, https://doi.org/10.1021/es050446l, 2005.
Hays, M. D. and Lavrich, R. J.: Developments in direct thermal extraction gas chromatography-mass spectrometry of fine aerosols, TrAC Trends Anal. Chem., 26, 88–102, https://doi.org/10.1016/j.trac.2006.08.007, 2007.
Heald, C. L., Kroll, J. H., Jimenez, J. L., Docherty, K. S., DeCarlo, P. F., Aiken, A. C., Chen, Q., Martin, S. T., Farmer, D. K., and Artaxo, P.: A simplified description of the evolution of organic aerosol composition in the atmosphere: Van Krevelen Diagram of organic aerosol, Geophys. Res. Lett., 37, L08803, https://doi.org/10.1029/2010GL042737, 2010.
Healy, R. M., Wenger, J. C., Metzger, A., Duplissy, J., Kalberer, M., and Dommen, J.: Gas/particle partitioning of carbonyls in the photooxidation of isoprene and 1,3,5-trimethylbenzene, Atmos. Chem. Phys., 8, 3215–3230, https://doi.org/10.5194/acp-8-3215-2008, 2008.
Ho, S. S. H., Chow, J. C., Watson, J. G., Ip, H. S. S., Ho, K. F., Dai, W. T., and Cao, J.: Biases in ketone measurements using DNPHcoated solid sorbent cartridges, Anal. Methods-UK, 6, 967–974, https://doi.org/10.1039/C3AY41636D, 2014.
Holzinger, R., Acton, W. J. F., Bloss, W. J., Breitenlechner, M., Crilley, L. R., Dusanter, S., Gonin, M., Gros, V., Keutsch, F. N., Kiendler-Scharr, A., Kramer, L. J., Krechmer, J. E., Languille, B., Locoge, N., Lopez-Hilfiker, F., Materić, D., Moreno, S., Nemitz, E., Quéléver, L. L. J., Sarda Esteve, R., Sauvage, S., Schallhart, S., Sommariva, R., Tillmann, R., Wedel, S., Worton, D. R., Xu, K., and Zaytsev, A.: Validity and limitations of simple reaction kinetics to calculate concentrations of organic compounds from ion counts in PTR-MS, Atmos. Meas. Tech., 12, 6193–6208, https://doi.org/10.5194/amt-12-6193-2019, 2019.
Iinuma, Y., Böge, O., Gnauk, T., and Herrmann, H.: Aerosol-chamber study of the α-pinene/O3 reaction: influence of particle acidity on aerosol yields and products, Atmos. Environ., 38, 761–773, https://doi.org/10.1016/j.atmosenv.2003.10.015, 2004.
Jacobson, M. C., Hansson, H.-C., Noone, K. J., and Charlson, R. J.: Organic atmospheric aerosols: Review and state of the science, Rev. Geophys., 38, 267–294, https://doi.org/10.1029/1998RG000045, 2000.
Jang, M. and Kamens, R. M.: Atmospheric secondary aerosol formation by heterogeneous reactions of aldehydes in the presence of a sulfuric acid aerosol catalyst, Environ. Sci. Technol., 35, 4758–4766, https://doi.org/10.1021/es010790s, 2001.
Jang, M., Czoschke, N. M., Lee, S., and Kamens, R. M.: Heterogeneous Atmospheric Aerosol Production by Acid-Catalyzed Particle-Phase Reactions, Science, 298, 814–817, https://doi.org/10.1126/science.1075798, 2002.
Jang, M., Carroll, B., Chandramouli, B., and Kamens, R. M.: Particle growth by acid-catalyzed heterogeneous reactions of organic carbonyls on preexisting aerosols, Environ. Sci. Technol., 37, 3828–3837, https://doi.org/10.1021/es021005u, 2003.
Jiang, J., Aksoyoglu, S., El-Haddad, I., Ciarelli, G., Denier van der Gon, H. A. C., Canonaco, F., Gilardoni, S., Paglione, M., Minguillón, M. C., Favez, O., Zhang, Y., Marchand, N., Hao, L., Virtanen, A., Florou, K., O'Dowd, C., Ovadnevaite, J., Baltensperger, U., and Prévôt, A. S. H.: Sources of organic aerosols in Europe: a modeling study using CAMx with modified volatility basis set scheme, Atmos. Chem. Phys., 19, 15247–15270, https://doi.org/10.5194/acp-19-15247-2019, 2019.
Jimenez, J. L., Canagaratna, M. R., Donahue, N. M., Prevot, A. S. H., Zhang, Q., Kroll, J. H., DeCarlo, P. F., Allan, J. D., Coe, H., Ng, N. L., Aiken, A. C., Docherty, K. S., Ulbrich, I. M., Grieshop, A. P., Robinson, A. L., Duplissy, J., Smith, J. D., Wilson, K. R., Lanz, V. A., Hueglin, C., Sun, Y. L., Tian, J., Laaksonen, A., Raatikainen, T., Rautiainen, J., Vaattovaara, P., Ehn, M., Kulmala, M., Tomlinson, J. M., Collins, D. R., Cubison, M. J., E., Dunlea, J., Huffman, J. A., Onasch, T. B., Alfarra, M. R., Williams, P. I., Bower, K., Kondo, Y., Schneider, J., Drewnick, F., Borrmann, S., Weimer, S., Demerjian, K., Salcedo, D., Cottrell, L., Griffin, R., Takami, A., Miyoshi, T., Hatakeyama, S., Shimono, A., Sun, J. Y., Zhang, Y. M., Dzepina, K., Kimmel, J. R., Sueper, D., Jayne, J. T., Herndon, S. C., Trimborn, A. M., Williams, L. R., Wood, E. C., Middlebrook, A. M., Kolb, C. E., Baltensperger, U., and Worsnop, D. R.: Evolution of Organic Aerosols in the Atmosphere, Science, 326, 1525–1529, https://doi.org/10.1126/science.1180353, 2009.
Kajos, M. K., Rantala, P., Hill, M., Hellén, H., Aalto, J., Patokoski, J., Taipale, R., Hoerger, C. C., Reimann, S., Ruuskanen, T. M., Rinne, J., and Petäjä, T.: Ambient measurements of aromatic and oxidized VOCs by PTR-MS and GC-MS: intercomparison between four instruments in a boreal forest in Finland, Atmos. Meas. Tech., 8, 4453–4473, https://doi.org/10.5194/amt-8-4453-2015, 2015.
Kalberer, M., Paulsen, D., Sax, M., Steinbacher, M., Dommen, J., Prevot, A. S. H., Fisseha, R., Weingartner, E., Frankevich, V., Zenobi, R., and Baltensperger, U.: Identification of Polymers as Major Components of Atmospheric Organic Aerosols, Science, 303, 1659–1662, https://doi.org/10.1126/science.1092185, 2004.
Kanakidou, M., Seinfeld, J. H., Pandis, S. N., Barnes, I., Dentener, F. J., Facchini, M. C., Van Dingenen, R., Ervens, B., Nenes, A., Nielsen, C. J., Swietlicki, E., Putaud, J. P., Balkanski, Y., Fuzzi, S., Horth, J., Moortgat, G. K., Winterhalter, R., Myhre, C. E. L., Tsigaridis, K., Vignati, E., Stephanou, E. G., and Wilson, J.: Organic aerosol and global climate modelling: a review, Atmos. Chem. Phys., 5, 1053–1123, https://doi.org/10.5194/acp-5-1053-2005, 2005.
Kitanovski, Z., Grgić, I., and Veber, M.: Characterization of carboxylic acids in atmospheric aerosols using hydrophilic interaction liquid chromatography tandem mass spectrometry, J. Chromatogr. A, 1218, 4417–4425, https://doi.org/10.1016/j.chroma.2011.05.020, 2011.
Kulmala, M., Kontkanen, J., Junninen, H., Lehtipalo, K., Manninen, H. E., Nieminen, T., Petäjä, T., Sipilä M., M., Schobesberger, S., Rantala, P., Franchin, A., Jokinen, T., Järvinen, E., Äijälä, M., Kangasluoma, J., Hakala, J., Aalto, P. P., Paasonen, P., Mikkilä, J., Vanhanen, J., Aalto, J., Hakola, H., Makkonen, U., Ruuskanen, T., Mauldin, R. L., Duplissy, J., Vehkamäki, H., Bäck, J., Kortelainen, A., Riipinen, I., Kurtén, T., Johnston, M. V, Smith, J. N., Ehn, M., Mentel, T. F., Lehtinen, K. E. J., Laaksonen, A., Kerminen, V.-M., and Worsnop, D. R.: Direct Observations of Atmospheric Aerosol Nucleation, Science, 339, 943–946, https://doi.org/10.1126/science.1227385, 2013.
Lelieveld, J.: Global Air Pollution Crossroads over the Mediterranean, Science, 298, 794–799, https://doi.org/10.1126/science.1075457, 2002.
Li, Y., Pöschl, U., and Shiraiwa, M.: Molecular corridors and parameterizations of volatility in the chemical evolution of organic aerosols, Atmos. Chem. Phys., 16, 3327–3344, https://doi.org/10.5194/acp-16-3327-2016, 2016.
Liang, C., Pankow, J. F., Odum, J. R., and Seinfeld, J. H.: Gas/Particle Partitioning of Semivolatile Organic Compounds To Model Inorganic, Organic, and Ambient Smog Aerosols, Environ. Sci. Technol., 31, 3086–3092, https://doi.org/10.1021/es9702529, 1997.
Liggio, J., Li, S.-M., and McLaren, R.: Heterogeneous reactions of glyoxal on particulate matter: identification of acetals and sulfate esters, Environ. Sci. Technol., 39, 1532–1541, https://doi.org/10.1021/es048375y, 2005a.
Liggio, J., Li, S.-M., and McLaren, R.: Reactive uptake of glyoxal by particulate matter, J. Geophys. Res.-Atmos., 110, D10304, https://doi.org/10.1029/2004JD005113, 2005b.
Lim, Y. B., Tan, Y., Perri, M. J., Seitzinger, S. P., and Turpin, B. J.: Aqueous chemistry and its role in secondary organic aerosol (SOA) formation, Atmos. Chem. Phys., 10, 10521–10539, https://doi.org/10.5194/acp-10-10521-2010, 2010.
Liu, F., Duan, F.-K., Li, H.-R., Ma, Y.-L., He, K.-B., and Zhang, Q.: Solid Phase Microextraction/Gas Chromatography-Tandem Mass Spectrometry for Determination of Polycyclic Aromatic Hydrocarbons in Fine Aerosol in Beijing, Chin. J. Anal. Chem., 43, 540–546, https://doi.org/10.1016/S1872-2040(15)60818-0, 2015.
Matsunaga, S.: Variation on the atmospheric concentrations of biogenic carbonyl compounds and their removal processes in the northern forest at Moshiri, Hokkaido Island in Japan, J. Geophys. Res., 109, D04302, https://doi.org/10.1029/2003JD004100, 2004.
Michoud, V., Sciare, J., Sauvage, S., Dusanter, S., Léonardis, T., Gros, V., Kalogridis, C., Zannoni, N., Féron, A., Petit, J.-E., Crenn, V., Baisnée, D., Sarda-Estève, R., Bonnaire, N., Marchand, N., DeWitt, H. L., Pey, J., Colomb, A., Gheusi, F., Szidat, S., Stavroulas, I., Borbon, A., and Locoge, N.: Organic carbon at a remote site of the western Mediterranean Basin: sources and chemistry during the ChArMEx SOP2 field experiment, Atmos. Chem. Phys., 17, 8837–8865, https://doi.org/10.5194/acp-17-8837-2017, 2017.
Michoud, V., Sauvage, S., Léonardis, T., Fronval, I., Kukui, A., Locoge, N., and Dusanter, S.: Field measurements of methylglyoxal using proton transfer reaction time-of-flight mass spectrometry and comparison to the DNPH–HPLC–UV method, Atmos. Meas. Tech., 11, 5729–5740, https://doi.org/10.5194/amt-11-5729-2018, 2018.
Millán, M. M., Salvador, R., Mantilla, E., and Kallos, G.: Photooxidant dynamics in the Mediterranean basin in summer: Results from European research projects, J. Geophys. Res.-Atmos., 102, 8811–8823, https://doi.org/10.1029/96JD03610, 1997.
Minguillón, M. C., Ripoll, A., Pérez, N., Prévôt, A. S. H., Canonaco, F., Querol, X., and Alastuey, A.: Chemical characterization of submicron regional background aerosols in the western Mediterranean using an Aerosol Chemical Speciation Monitor, Atmos. Chem. Phys., 15, 6379–6391, https://doi.org/10.5194/acp-15-6379-2015, 2015.
Moller, B., Rarey, J., and Ramjugernath, D.: Estimation of the vapour pressure of non-electrolyte organic compounds via group contributions and group interactions, J. Mol. Liq., 143, 52–63, https://doi.org/10.1016/j.molliq.2008.04.020, 2008.
Moroni, B., Castellini, S., Crocchianti, S., Piazzalunga, A., Fermo, P., Scardazza, F., and Cappelletti, D.: Ground-based measurements of long-range transported aerosol at the rural regional background site of Monte Martano (Central Italy), Atmos. Res., 155, 26–36, https://doi.org/10.1016/j.atmosres.2014.11.021, 2015.
Myrdal, P. B. and Yalkowsky, S. H.: Estimating Pure Component Vapor Pressures of Complex Organic Molecules, Ind. Eng. Chem. Res., 36, 2494–2499, https://doi.org/10.1021/ie950242l, 1997.
Nannoolal, Y., Rarey, J., Ramjugernath, D., and Cordes, W.: Estimation of pure component properties: Part 1. Estimation of the normal boiling point of non-electrolyte organic compounds via group contributions and group interactions, Fluid Phase Equilibr., 226, 45–63, https://doi.org/10.1016/j.fluid.2004.09.001, 2004.
Nannoolal, Y., Rarey, J., and Ramjugernath, D.: Estimation of pure component properties: Part 3. Estimation of the vapor pressure of non-electrolyte organic compounds via group contributions and group interactions, Fluid Phase Equilibr., 269, 117–133, https://doi.org/10.1016/j.fluid.2008.04.020, 2008.
Ng, N. L., Canagaratna, M. R., Jimenez, J. L., Chhabra, P. S., Seinfeld, J. H., and Worsnop, D. R.: Changes in organic aerosol composition with aging inferred from aerosol mass spectra, Atmos. Chem. Phys., 11, 6465–6474, https://doi.org/10.5194/acp-11-6465-2011, 2011.
Nguyen, T. B., Laskin, J., Laskin, A., and Nizkorodov, S. A.: Nitrogen-Containing Organic Compounds and Oligomers in Secondary Organic Aerosol Formed by Photooxidation of Isoprene, Environ. Sci. Technol., 45, 6908–6918, https://doi.org/10.1021/es201611n, 2011.
Nguyen, T. B., Nizkorodov, S. A., Laskin, A., and Laskin, J.: An approach toward quantification of organic compounds in complex environmental samples using high-resolution electrospray ionization mass spectrometry, Anal. Methods, 5, 72–80, https://doi.org/10.1039/c2ay25682g, 2013.
Nicolas, J. B.: Caractérisation physico-chimique de l'aérosol troposphérique en Méditerranée: sources et devenir, Université de Versailles Saint-Quentin-en-Yvelines (UVSQ), available at: http://www.uvsq.fr/caracterisation-physico-chimique-de-l-aerosol-tropospherique-en-mediterranee-sources-et-devenir-par-jose-nicolas-303880.kjsp (last access: 2 February 2016), 2013.
Nozière, B., Kalberer, M., Claeys, M., Allan, J., D'Anna, B., Decesari, S., Finessi, E., Glasius, M., Grgić, I., Hamilton, J. F., Hoffmann, T., Iinuma, Y., Jaoui, M., Kahnt, A., Kampf, C. J., Kourtchev, I., Maenhaut, W., Marsden, N., Saarikoski, S., Schnelle-Kreis, J., Surratt, J. D., Szidat, S., Szmigielski, R., and Wisthaler, A.: The molecular identification of organic compounds in the atmosphere: state of the art and challenges, Chem. Rev., 115, 3919–3983, https://doi.org/10.1021/cr5003485, 2015.
Orsini, D. A., Ma, Y., Sullivan, A., Sierau, B., Baumann, K., and Weber, R. J.: Refinements to the particle-into-liquid sampler (PILS) for ground and airborne measurements of water soluble aerosol composition, Atmos. Environ., 37, 1243–1259, https://doi.org/10.1016/S1352-2310(02)01015-4, 2003.
Pankow, J. F.: An absorption model of gas/particle partitioning of organic compounds in the atmosphere, Atmos. Environ., 28, 185–188, 1994.
Parshintsev, J. and Hyötyläinen, T.: Methods for characterization of organic compounds in atmospheric aerosol particles, Anal. Bioanal. Chem., 407, 5877–5897, https://doi.org/10.1007/s00216-014-8394-3, 2015.
Parshintsev, J., Rasanen, R., Hartonen, K., Kulmala, M., and Riekkola, M.-L.: Analysis of organic compounds in ambient aerosols collected with the particle-into-liquid sampler, Boreal Environ. Res., 14, 630–640, 2009.
Pietrogrande, M. C., Bacco, D., and Mercuriali, M.: GC–MS analysis of low-molecular-weight dicarboxylic acids in atmospheric aerosol: comparison between silylation and esterification derivatization procedures, Anal. Bioanal. Chem., 396, 877–885, https://doi.org/10.1007/s00216-009-3212-z, 2009.
Pöschl, U.: Atmospheric Aerosols: composition, transformation, climate and health effects, Angew. Chem. Int. Edit., 44, 7520–7540, https://doi.org/10.1002/anie.200501122, 2005.
Querol, X., Pey, J., Pandolfi, M., Alastuey, A., Cusack, M., Pérez, N., Moreno, T., Viana, M., Mihalopoulos, N., Kallos, G., and Kleanthous, S.: African dust contributions to mean ambient PM10 mass-levels across the Mediterranean Basin, Atmos. Environ., 43, 4266–4277, https://doi.org/10.1016/j.atmosenv.2009.06.013, 2009a.
Querol, X., Alastuey, A., Pey, J., Cusack, M., Pérez, N., Mihalopoulos, N., Theodosi, C., Gerasopoulos, E., Kubilay, N., and Koçak, M.: Variability in regional background aerosols within the Mediterranean, Atmos. Chem. Phys., 9, 4575–4591, https://doi.org/10.5194/acp-9-4575-2009, 2009b.
Raventos-Duran, T., Camredon, M., Valorso, R., Mouchel-Vallon, C., and Aumont, B.: Structure-activity relationships to estimate the effective Henry's law constants of organics of atmospheric interest, Atmos. Chem. Phys., 10, 7643–7654, https://doi.org/10.5194/acp-10-7643-2010, 2010.
Ripoll, A., Minguillón, M. C., Pey, J., Pérez, N., Querol, X., and Alastuey, A.: Joint analysis of continental and regional background environments in the western Mediterranean: PM1 and PM10 concentrations and composition, Atmos. Chem. Phys., 15, 1129–1145, https://doi.org/10.5194/acp-15-1129-2015, 2015.
Robinson, A. L., Donahue, N. M., Shrivastava, M. K., Weitkamp, E. A., Sage, A. M., Grieshop, A. P., Lane, T. E., Pierce, J. R., and Pandis, S. N.: Rethinking organic aerosols: semivolatile emissions and photochemical aging, Science, 315, 1259–1262, https://doi.org/10.1126/science.1133061, 2007.
Rossignol, S.: Développement d'une méthode de prélèvement simultané et d'analyse chimique des phases gazeuse et particulaire atmosphériques pour une approche multiphasique de l'aérosol organique secondaire, Paris 7, available at: http://www.theses.fr/2012PA077208 (last access: 14 February 2016), 2012.
Rossignol, S., Chiappini, L., Perraudin, E., Rio, C., Fable, S., Valorso, R., and Doussin, J. F.: Development of a parallel sampling and analysis method for the elucidation of gas/particle partitioning of oxygenated semi-volatile organics: a limonene ozonolysis study, Atmos. Meas. Tech., 5, 1459–1489, https://doi.org/10.5194/amt-5-1459-2012, 2012.
Rossignol, S., Couvidat, F., Rio, C., Fable, S., Grignion, G., Savelli, Pailly, O., Leoz-Garziandia, E., Doussin, J.-F., and Chiappini, L.: Organic aerosol molecular composition and gas–particle partitioning coefficients at a Mediterranean site (Corsica), J. Environ. Sci., 40, 92–104, https://doi.org/10.1016/j.jes.2015.11.017, 2016.
Samaké, A., Jaffrezo, J.-L., Favez, O., Weber, S., Jacob, V., Albinet, A., Riffault, V., Perdrix, E., Waked, A., Golly, B., Salameh, D., Chevrier, F., Oliveira, D. M., Bonnaire, N., Besombes, J.-L., Martins, J. M. F., Conil, S., Guillaud, G., Mesbah, B., Rocq, B., Robic, P.-Y., Hulin, A., Le Meur, S., Descheemaecker, M., Chretien, E., Marchand, N., and Uzu, G.: Polyols and glucose particulate species as tracers of primary biogenic organic aerosols at 28 French sites, Atmos. Chem. Phys., 19, 3357–3374, https://doi.org/10.5194/acp-19-3357-2019, 2019.
Schoene, K., Bruckert, H.-J., Steinhanses, J., and König, A.: Two stage derivatization with N-(tert.-butyldimethylsilyl)-N-methyl-trifluoroacetamide (MTBSTFA) and N-methyl-bis-(trifluoroacetamide)(MBTFA) for the gas-chromatographic analysis of OH-, SH-and NH-compounds, Fresenius J. Anal. Chem., 348, 364–370, 1994.
Sciare, J., d'Argouges, O., Sarda-Estève, R., Gaimoz, C., Dolgorouky, C., Bonnaire, N., Favez, O., Bonsang, B., and Gros, V.: Large contribution of water-insoluble secondary organic aerosols in the region of Paris (France) during wintertime, J. Geophys. Res.-Atmos., 116, D22203, https://doi.org/10.1029/2011JD015756, 2011.
Seinfeld, J. H. and Pankow, J. F.: Organic atmospheric particulate material, Annu. Rev. Phys. Chem., 54, 121–140, https://doi.org/10.1146/annurev.physchem.54.011002.103756, 2003.
Shiraiwa, M., Ammann, M., Koop, T., and Pöschl, U.: Gas uptake and chemical aging of semisolid organic aerosol particles, P. Natl. Acad. Sci. USA, 108, 11003–11008, 2011.
Shrivastava, M. K., Subramanian, R., Rogge, W. F., and Robinson, A. L.: Sources of organic aerosol: positive matrix factorization of molecular marker data and comparison of results from different source apportionment models, Atmos. Environ., 41, 9353–9369, https://doi.org/10.1016/j.atmosenv.2007.09.016, 2007.
Soonsin, V., Zardini, A. A., Marcolli, C., Zuend, A., and Krieger, U. K.: The vapor pressures and activities of dicarboxylic acids reconsidered: the impact of the physical state of the aerosol, Atmos. Chem. Phys., 10, 11753–11767, https://doi.org/10.5194/acp-10-11753-2010, 2010.
Srivastava, D., Tomaz, S., Favez, O., Lanzafame, G. M., Golly, B., Besombes, J.-L., Alleman, L. Y., Jaffrezo, J.-L., Jacob, V., Perraudin, E., Villenave, E., and Albinet, A.: Speciation of organic fraction does matter for source apportionment. Part 1: A one-year campaign in Grenoble (France), Sci. Total Environ., 624, 1598–1611, 2018.
Tolocka, M. P., Jang, M., Ginter, J. M., Cox, F. J., Kamens, R. M., and Johnston, M. V.: Formation of oligomers in secondary organic aerosol, Environ. Sci. Technol., 38, 1428–1434, https://doi.org/10.1021/es035030r, 2004.
Valach, A. C., Langford, B., Nemitz, E., MacKenzie, A. R., and Hewitt, C. N.: Concentrations of selected volatile organic compounds at kerbside and background sites in central London, Atmos. Environ., 95, 456–467, https://doi.org/10.1016/j.atmosenv.2014.06.052, 2014.
van Drooge, B. L., Nikolova, I., and Ballesta, P. P.: Thermal desorption gas chromatography–mass spectrometry as an enhanced method for the quantification of polycyclic aromatic hydrocarbons from ambient air particulate matter, J. Chromatogr. A, 1216, 4030–4039, https://doi.org/10.1016/j.chroma.2009.02.043, 2009.
Virtanen, A., Joutsensaari, J., Koop, T., Kannosto, J., Yli-Pirilä, P., Leskinen, J., Mäkelä, J. M., Holopainen, J. K., Pöschl, U., Kulmala, M., Worsnop, D. R., and Laaksonen, A.: An amorphous solid state of biogenic secondary organic aerosol particles, Nature, 467, 824–827, https://doi.org/10.1038/nature09455, 2010.
Washenfelder, R. A., Young, C. J., Brown, S. S., Angevine, W. M., Atlas, E. L., Blake, D. R., Bon, D. M., Cubison, M. J., de Gouw, J. A., Dusanter, S., Flynn, J., Gilman, J. B., Graus, M., Griffith, S., Grossberg, N., Hayes, P. L., Jimenez, J. L., Kuster, W. C., Lefer, B. L., Pollack, I. B., Ryerson, T. B., Stark, H., Stevens, P. S., and Trainer, M. K.: The glyoxal budget and its contribution to organic aerosol for Los Angeles, California, during CalNex 2010, J. Geophys. Res., 116, D00V02, https://doi.org/10.1029/2011JD016314, 2011.
Williams, B. J., Goldstein, A. H., Kreisberg, N. M., and Hering, S. V.: An In-Situ Instrument for Speciated Organic Composition of Atmospheric Aerosols: Thermal Desorption Aerosol GC/MS-FID (TAG), Aerosol Sci. Technol., 40, 627–638, https://doi.org/10.1080/02786820600754631, 2006.
Woody, M. C., Baker, K. R., Hayes, P. L., Jimenez, J. L., Koo, B., and Pye, H. O. T.: Understanding sources of organic aerosol during CalNex-2010 using the CMAQ-VBS, Atmos. Chem. Phys., 16, 4081–4100, https://doi.org/10.5194/acp-16-4081-2016, 2016.
Zannoni, N., Gros, V., Sarda Esteve, R., Kalogridis, C., Michoud, V., Dusanter, S., Sauvage, S., Locoge, N., Colomb, A., and Bonsang, B.: Summertime OH reactivity from a receptor coastal site in the Mediterranean Basin, Atmos. Chem. Phys., 17, 12645–12658, https://doi.org/10.5194/acp-17-12645-2017, 2017.
Zhang, H., Surratt, J. D., Lin, Y. H., Bapat, J., and Kamens, R. M.: Effect of relative humidity on SOA formation from isoprene/NO photooxidation: enhancement of 2-methylglyceric acid and its corresponding oligoesters under dry conditions, Atmos. Chem. Phys., 11, 6411–6424, https://doi.org/10.5194/acp-11-6411-2011, 2011.
Zhang, X., Dalleska, N. F., Huang, D. D., Bates, K. H., Sorooshian, A., Flagan, R. C., and Seinfeld, J. H.: Time-resolved molecular characterization of organic aerosols by PILS + UPLC/ESI-Q-TOFMS, Atmos. Environ., 130, 180–189, https://doi.org/10.1016/j.atmosenv.2015.08.049, 2016.
Zobrist, B., Soonsin, V., Luo, B. P., Krieger, U. K., Marcolli, C., Peter, T., and Koop, T.: Ultra-slow water diffusion in aqueous sucrose glasses, Phys. Chem. Chem. Phys., 13, 3514–3526, https://doi.org/10.1039/C0CP01273D, 2011.