the Creative Commons Attribution 4.0 License.
the Creative Commons Attribution 4.0 License.
 | 26 May 2021
Properties and emission factors of cloud condensation nuclei from biomass cookstoves – observations of a strong dependency on potassium content in the fuel
Thomas Bjerring Kristensen
John Falk
Robert Lindgren
Christina Andersen
Vilhelm B. Malmborg
Axel C. Eriksson
Kimmo Korhonen
Ricardo Luis Carvalho
Christoffer Boman
Joakim Pagels
Birgitta Svenningsson
Residential biomass combustion is a significant source of aerosol particles on regional and global scales influencing climate and human health. The main objective of the current study was to investigate the properties of cloud condensation nuclei (CCN) emitted from biomass burning of solid fuels in different cookstoves mostly of relevance to sub-Saharan east Africa.
The traditional three-stone fire and a rocket stove were used for combustion of wood logs of Sesbania and Casuarina with birch used as a reference. A natural draft and a forced-draft pellet stove were used for combustion of pelletised Sesbania and pelletised Swedish softwood alone or in mixtures with pelletised coffee husk, rice husk or water hyacinth. The CCN activity and the effective density were measured for particles with mobility diameters of ∽65, ∽100 and ∽200 nm, respectively, and occasionally for 350 nm particles. Particle number size distributions were measured online with a fast particle analyser. The chemical composition of the fuel ash was measured by application of standard protocols.
The average particle number size distributions were by number typically dominated by an ultrafine mode, and in most cases a soot mode was centred around a mobility diameter of ∽150 nm. The CCN activities decreased with increasing particle size for all experiments and ranged in terms of the hygroscopicity parameter, κ, from ∽0.1 to ∽0.8 for the ultrafine mode and from ∽0.001 to ∽0.15 for the soot mode. The CCN activity (κ) of the ultrafine mode increased (i) with increasing combustion temperature for a given fuel, and (ii) it typically increased with increasing potassium concentration in the investigated fuels. The primary CCN and the estimated particulate matter (PM) emission factors were typically found to increase significantly with increasing potassium concentration in the fuel for a given stove. In order to link CCN emission factors to PM emission factors, knowledge about stove technology, stove operation and the inorganic fuel ash composition is needed. This complicates the use of ambient PM levels alone for estimation of CCN concentrations in regions dominated by biomass combustion aerosol, with the relation turning even more complex when accounting for atmospheric ageing of the aerosol.
- Article
(1822 KB) - Full-text XML
- BibTeX
- EndNote


Residential biomass burning comprises a significant source of atmospheric aerosol particles and trace gases on a global scale (Ludwig et al., 2003). Biomass burning emissions pose a human health risk (e.g. Fullerton et al., 2008; Bølling et al., 2009) and influence atmospheric chemistry (e.g. Crutzen and Andreae, 1990) and climate (e.g. Penner et al., 1992; Bond et al., 2004). Ludwig et al. (2003) estimated residential biomass burning to account for about 17 % of the total global CO2 emissions in the mid-1990s, while the absolute emissions have grown significantly in recent decades (Fernandes et al., 2007). The emitted aerosol particles may scatter or absorb solar/terrestrial radiation directly, and they may also act as cloud condensation nuclei (CCN) and thus influence climate indirectly through an impact on cloud optical properties and lifetimes (Albrecht, 1989; Penner et al., 1992; Kaufman and Fraser, 1997). Huang et al. (2018) reported an annually averaged global radiative forcing of mW m−2 due to the “warm” cloud indirect climate effects of CCN emitted from residential solid fuel cookstoves. Hence, this global indirect aerosol cloud climate impact is likely to be significant.
Biomass-fuelled cookstove emissions of particulate matter (PM) per mass of combusted dry fuel depend on the stove (combustion conditions) and fuel type used. The PM emissions from the traditional three-stone (3S) stove have been reported to be significantly higher than those from the rocket-type stoves (Jetter and Kariher, 2009; MacCarty et al., 2010; Just et al., 2013), which was further pronounced when atmospheric ageing and secondary organic aerosol (SOA) were taken into account (Reece et al., 2017). Forced-draft stoves emit relatively lower amounts of PM per mass unit of combusted dry fuel (e.g. Jetter and Kariher, 2009; MacCarty et al., 2010), and the SOA emissions are also relatively lower (Reece et al., 2017). The particles emitted from residential biomass burning are typically comprised of elemental carbon (EC), organic and inorganic compounds depending on the composition of the fuel, the combustion conditions, and ageing of the emissions (e.g. Bølling et al., 2009; Lamberg et al., 2011; Reece et al., 2017). Among inorganic species, elements such as K, Na, S, Cl and Zn dominate the fine-mode particles (particle diameter<2.5 µm) present mainly as different alkali salts (e.g. KCl and K2SO4), while more refractory elements like Ca, Mg and Si are preferably found in the coarse fraction (particle diameter>2.5 µm) (Boman et al., 2004; Joeller et al., 2005; Obernberger et al., 2006).
Studies of atmospheric particles sampled over different biomass burning areas in Africa have also shown that the fine particles emitted from burning of vegetation are dominated by S, Cl, Zn, K and P (Gaudichet et al., 1995). Furthermore, the major fraction of the Si, Ca and Mn found in the atmospheric particles could be attributed to the burning of vegetation, although present in the coarse mode. Gaudichet et al. (1995) also suggested that Ca and Si, together with, e.g., Fe, Al and Ti, can be present as soil-derived particles. Still, in another study on atmospheric particles in smoke plumes from biomass burning, some fine-mode Ca-bearing particles were also present, in parallel with the dominating alkali salts, soot and organic tar balls (Li et al., 2003).
In this paper, the CCN activity will be presented in terms of the hygroscopicity parameter κ in a similar fashion as introduced by Petters and Kreidenweis (2007). It is challenging to assess the CCN properties of biomass burning aerosol emissions in general due to significant variability with varying fuels and combustion conditions. In addition, ageing is potentially of great importance. The CCN activity of aerosol particles related to various simulated wildfire emissions has been reported to range from a κ=0.04 to κ=0.8, with a tendency of decreasing κ with increasing particle size and often externally mixed particles (Petters et al., 2009). Engelhart et al. (2012) reported κ to range from 0.06 to 0.6 for similar fresh emissions, with the κ values converging towards 0.2±0.1 due to photochemical ageing and formation of SOA with an average . Martin et al. (2013) investigated aged and freshly emitted aerosol from combustion of beech in a residential log wood burner. They reported a CCN activity ranging from an apparent κ=0.03 to κ=0.39 depending on the burning phase and decreasing with increasing particle size from 50 to 200 nm. They also reported an increasing CCN activity up to κ≈0.16 due to photo-chemical ageing over some hours for a given particle size with lower initial CCN activity. Photo-chemical ageing of biomass burning aerosol may also result in new particle formation with a potential significant increase in the number concentration of CCN (Hennigan et al., 2012; Engelhart et al., 2012).
Emission factors of CCN for biomass combustion have to our knowledge not been previously studied in detailed experiments. The emission factors of CCN for wildfire biomass combustion have been estimated to be on the order of 0.8×10¹⁵ to 1.7×10¹⁵ kg−1 relative to the dry mass of various fuels and assuming a supersaturation of 0.5 % (Andreae, 2019). Mena et al. (2017) modelled the CCN properties of a residential biomass combustion plume, and they concluded that coagulation limits the CCN emission factor for a supersaturation of 1.0 % to a maximum of ∽1016 per kilogram of fuel.
The main objective of the Salutary Umeå STudy of Aerosols IN biomass cookstove Emissions (SUSTAINE) campaign was to study sustainable approaches to residential solid biomass combustion in cookstoves relevant for sub-Saharan east Africa. In this context, fuel sustainability, combustion conditions and aerosol emissions were studied. The main part of the SUSTAINE campaign was carried out in the autumn of 2016, when a wide range of properties related to aerosol emissions were studied under well-controlled laboratory conditions. The four investigated cookstoves represented technologies ranging from very simple (3S) to advanced (forced-draft) systems. The tested biomass fuels are either currently in use or potentially more sustainable options relevant to sub-Saharan east Africa, with softwood pellets used in co-combustion and as reference along with birch wood logs. The approach allowed us to study how aerosol emissions depend on the stove technology and the fuel. A number of studies with different foci were carried out during the campaign, and the ice-nucleating ability of the aerosol has been presented in a separate study (Korhonen et al., 2020).
Numerous previous studies have focused on bulk PM emissions from biomass stoves, whereas few studies have been carried out on the emitted particle number size distributions and the associated CCN properties, which are very important parameters in a climatic context. The present study focuses on the CCN activity and CCN emission factors for a range of current and potentially future aerosol emissions from household cooking solutions involving biomass combustion. Fresh emissions were generally studied, but the influence of atmospheric ageing was also investigated on a qualitative basis for selected experiments.
The CCN activity will be expressed by use of the hygroscopicity parameter κ. κ was introduced by Petters and Kreidenweis (2007) and is approximated well by
where SSc is the critical supersaturation in percent, Mw is the molar mass of water, ρw is the density of water, σ is the surface tension, R=8.314 J (K mol)−1 is the universal gas constant, T is the absolute temperature and Dp is the dry particle mobility diameter.
A very useful aspect of the κ framework is that the hygroscopicity parameter of internally mixed particles can be estimated by volume-weighted addition of the κ values of the pure compounds (Petters and Kreidenweis, 2007; Frosch et al., 2011; Kristensen et al., 2014):
where κi is related to species i, and εi is the corresponding volume fraction of species i in the dry particles.
The effective particle density (ρeff) versus particle mobility diameter of soot agglomerates can be modelled by
where K is an empirical constant and ϵm is the mass-mobility exponent. K and ϵm can be determined empirically from least-squares fits to measured data as described by Rissler et al. (2013).
3.1 Stoves and fuels
Four different stoves and seven different fuels were selected for this study in order to cover a wide range of combustion technologies and associated aerosol emissions. The simple 3S and a more advanced rocket stove (RS) were used for combustion of wood logs of Sesbania sesban (ses) and Casuarina equisetifolia (cas) with Swedish birch (Betula pendula, bir) used for comparison. A natural draft stove (NDS) and a forced-draft stove (FDS) were used to combust pelletised biomass of Sesbania sesban, coffee husk (ch), rice husk (rh), water hyacinth (wh) and with commercially produced softwood pellets (sw) of a pine–spruce mixture used for comparison. The coffee and rice husk as well as water hyacinth pellets were combusted in 50 %–50 % mixtures by mass with the softwood pellets in order to ensure comparable combustion conditions for those pelletised fuels.
The African fuels were all collected in western Kenya in the vicinity of Lake Victoria. Casuarina equisetifolia and the faster-growing Sesbania sesban are nitrogen-fixing tree species with a density similar to and lower than birch, respectively. Coffee and rice husk are industrial residues, which are currently treated as waste. Water hyacinth is fast growing and poses an environmental problem related to the eutrophication of Lake Victoria. Hence, application of such fuels in gasifier cookstoves may be relevant from a sustainability and circular economy perspective. Furthermore, the selected fuels represent diverse properties with significantly varying ash content and chemical composition, which is presented and discussed further below in Sect. 4.3.2 in context with the inferred CCN activity. The wood logs had a triangular cross section with base and height of 2.6 and 2.5±0.2 cm, respectively, and with lengths of 21 and 17 cm for the 3S and the RS, respectively. The pellets were all 3 mm in diameter with a length of 8 mm. The humidity of the pelletised fuels was in the range of 7 %–10 %. The humidities of the wood logs of birch, Casuarina and Sesbania were about 16, 10 and 14 %, respectively. Additional information about the fuels has been presented by Korhonen et al. (2020).
3.2 Experimental approach
Several campaigns on biomass combustion have previously been carried out in the Thermochemical Energy Conversion (TEC) laboratory at Umeå University, Sweden. The basic experimental aerosol measurement setup and ageing procedure are very similar to previous studies carried out at the same facility (e.g. Martinsson et al., 2015). The experiments were carried out as a modified version of the standardised water boiling test 4.2.3 described by the Clean Cooking Alliance (https://www.cleancookingalliance.org, last access: 9 April 2021). In short, a pot containing 5.0 L of water initially at a temperature of 20 ∘C was placed on top of the respective stove and heated up during all experiments to ensure controlled standard cooking conditions. A schematic of the experimental setup is presented in Fig. 1. The combustion was carried out under a hood with a flue-gas fan maintaining a constant flow rate of 2.4 m3 min−1 and ensuring the emitted aerosol was transported through the sampling system. Water vapour from the pot was directed away from the sampling system. Some aerosol measurements were carried out directly in the flue gas, while others including the CCN measurements were carried out on samples emitted into a stainless-steel aerosol storage chamber.
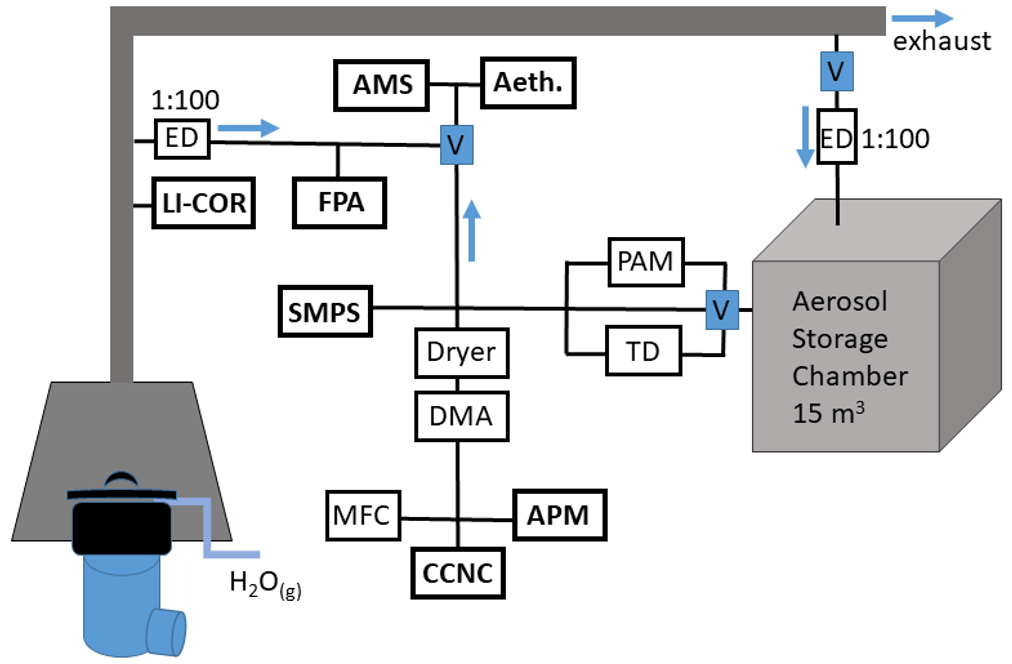
Figure 1A schematic of the experimental setup with the rocket stove. Abbreviations in bold indicate measurement instruments. The flow directions are indicated with blue arrows. The LI-COR and the fast particle analyser (FPA) always sampled from the flue gas. The aerosol mass spectrometer (AMS) and the aethalometer (Aeth.) always sampled in the flue gas during combustion, and sampling was switched to the storage chamber once the combustion was over in cases with chamber filling. The scanning mobility particle sizer (SMPS), the cloud condensation nuclei counter (CCNc) and the aerosol particle mass analyser (APM) generally sampled from the aerosol storage chamber for the results presented. Additional abbreviations are ED: ejector diluter, V: valve, PAM: potential aerosol mass reactor, TD: thermodenuder, DMA: differential mobility analyser, and MFC: mass flow controller.
The more advanced stoves using pellets were initially loaded with 1.0 kg of fuel, and ignition was aided by addition of 12 g of ethanol. After the initial combustion phase of ∽5 min, the intermediate combustion phase was characterised by a constant fuel conversion rate for about 50 min before entering the burnout phase. The chamber fillings for the pellet stoves relevant to the current study were generally carried out during the intermediate combustion phase.
The 3S and the RS experiments would typically last until the boiling point of water was reached, and boiling was maintained through 45 min. Also here, the ignition was aided by addition of 12 g of ethanol, which was followed by an intermediate phase with flaming combustion. Wood logs (about 0.2 kg) were added when the flame intensity decreased or burnout combustion dominated. An experiment would typically include more than five fuel additions. A chamber injection would typically represent roughly one full cycle for a hot stove including (i) fuel addition, (ii) the intermediate phase (flaming combustion) and (iii) burnout combustion. The intermediate combustion phase would typically dominate the time window during injection into the chamber. The aerosol associated with that combustion phase was by number highly dominated by the ultrafine particles. The particle mode centred near 150 nm, in this study referred to as the soot mode, was typically relatively more pronounced for the burnout phase and the fuel addition.
3.3 Instrumentation and measurements
A wide range of online aerosol particle measurements were carried out. Only the instrumentation relevant to the current study will be presented here, and it is included in Fig. 1. The stoves were operated on a scale logging the change in mass of the fuel with a 5 s time resolution. For selected experiments, aerosol emissions were injected into a 15 m3 stainless-steel chamber from which the CCN counter (CCNc, CCN-100, Droplet Measurement Technologies) sampled. The injections into the chamber typically lasted for 10–40 min depending on the experiment. For the pellet stoves, the injections represented the relatively constant emissions from the bulk of the combustion phase of the experiments. Chamber injections related to the 3S and the RS typically represented an average of different burning phases as described above. The temperature inside the aerosol storage chamber was approximately 20 ∘C and the relative humidity (RH) was about 20 %–25 %. Chamber conditions were intended to be kept constant with as little dilution as possible during experiments. The chamber was flushed with filtered air in between experiments. In addition, prior to selected experiments involving simulated photochemical aerosol ageing, the chamber was cleaned with ozone in order to minimise the concentration of potential secondary aerosol precursors not originating from the current stove emission. An overview of the experiments involving chamber fillings and CCN measurements is included in Table 1.
Table 1The experiments involving CCN measurements. For the three-stone (3S), the rocket stove (RS), the natural draft stove (NDS) and the forced-draft stove (FDS) in combinations with wood logs of birch (bir), Casuarina (cas) and Sesbania (ses), and pellets of softwood (sw), coffee husk (ch), rice husk (rh) and water hyacinth (wh). The numbers in the table refer to the number of experiments carried out for the respective combination of stoves and fuels.
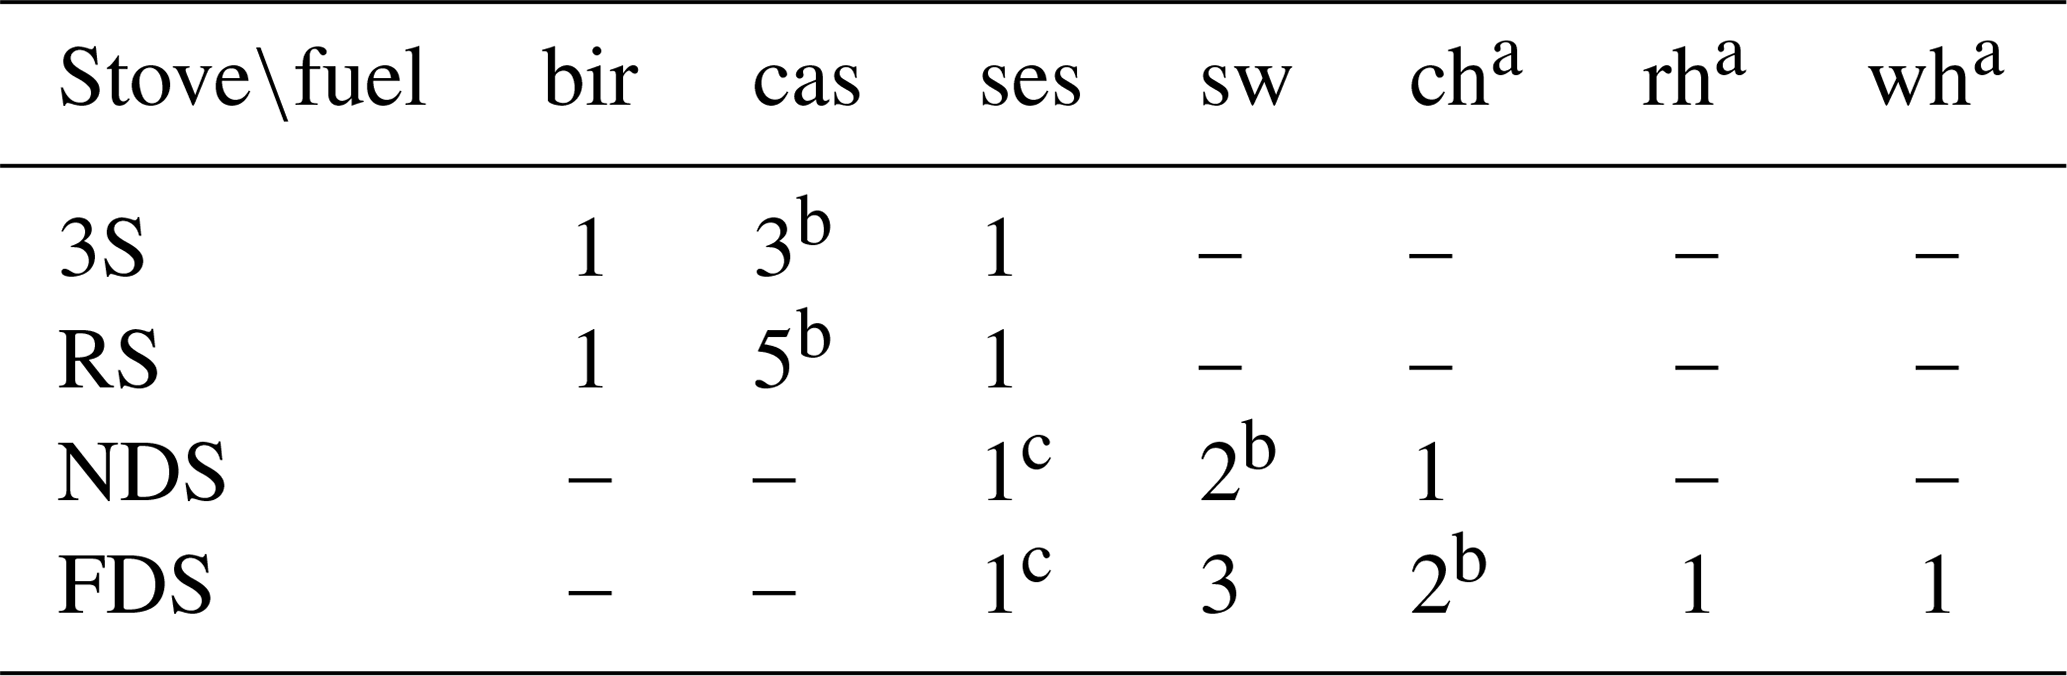
a In 50 %–50 % mixtures with sw by mass. b Including sampling through PAM. c Pelletised.
The CCNc was operated in flow scan mode (Moore and Nenes, 2009) in a similar fashion as described by Wittbom et al. (2014). The total flow rate (Qt) of the CCNc was controlled during repeated cycles. Qt increased at a constant rate from 0.2 to 1.0 over 120 s followed by a constant Qt=1.0 for 20 s and a rapid decrease in Qt down to 0.2 . Qt was kept constant at 0.2 for 20 s before the cycle was repeated. Only the part of the cycle with increasing Qt was used in the data analysis. A mass flow controller (MFC) was operated in parallel with the CCNc with the flow rate continuously adjusted so that the total flow rate of the CCNc and the MFC added up to 1.0 .
The CCNc and the MFC sampled in parallel with an aerosol particle mass analyser (APM, Kanomax) downstream of a differential mobility analyser (DMA, TSI-3071), which was operated with a sheath flow rate of 8.0 and a sample flow rate of 2.0 . The voltage of the DMA was systematically alternated between three (or four) set points for sampling of quasi-monodisperse aerosol particles with mobility diameters of ∽65, ∽100, ∽200 and occasionally ∽350 nm. The DMA voltage was typically kept at a constant set point for ∽7 min, which allowed for obtaining an APM spectrum and one to two full CCN flow scan cycles. The DMA and the APM were calibrated during the campaign by use of polystyrene latex (PSL) spheres with nominal diameters of 0.1 and 0.2 µm, respectively. The APM suffered from minor leaks for the higher rotation speeds during parts of the campaign, which resulted in a limited data set of high quality.
Three different constant temperature gradients (dT) were applied along the CCNc column (4, 10, 18 K) – which allowed for a coverage of supersaturations ranging from ∽0.1 to ∽1.5 %. During an experiment, the dT was changed manually in order to obtain reasonable CCN activation spectra for the different particle mobility sizes investigated. Only CCN flow scan cycles with constant dT were used in the data analysis. The supersaturation of the CCNc was calibrated during and after the campaign by use of ammonium sulfate particles in a similar way as described by Wittbom et al. (2014). The reproducibility of repeated calibration measurements was significantly higher in the current study relative to the variations presented by Wittbom et al. (2014), which we contribute to our efforts of improving the flow control. Hence, the errors in the supersaturation in the current study are relatively lower by a factor of ∽2 relative to the calibration results presented by Wittbom et al. (2014).
Particle number size distributions were measured online in the flue gas with a fast particle analyser (FPA, DMS 500; Cambustion). It was operated with a sample flow rate of 8.0 slpm, and the inversion matrix for bimodal spherical aerosol particles from the manufacturer was applied. This matrix is suitable for spherical biomass particles and heavily coated soot, but it may underestimate the sizes of fractal-like soot particles due to the particle shape influencing the charging efficiency. That effect may play a role for fractal soot aggregates with mobility diameters larger than ∽150 nm and can, when these are present, result in a slight overestimation of particle numbers at smaller sizes (Symonds et al., 2007). The main advantages of the FPA when studying combustion aerosol emissions online are (i) a very fast instrumental response time (<1 s) and (ii) minimised losses of the smallest particles (Reavell et al., 2002). The emitted aerosol was diluted by a factor of ∽20 or more in the hood depending on the aerosol emissions and burn rate. The residence time of the flue gas in the hood and the flue gas channel was on the order of 2 s followed by an ejector dilution step using dry clean air with a ratio of 1:100 for most of the experiments. Thus, two dilution steps were introduced before the fast particle analyser measurements. A scanning mobility particle sizer (SMPS, TSI model 3938) spectrometer was used to measure particle number size distributions in the aerosol storage chamber. The SMPS was operated with an advanced aerosol neutraliser (model 3088) and an inlet impactor (0.071 cm) both from TSI.
A high-resolution time-of-flight soot particle aerosol mass spectrometer (AMS) (DeCarlo et al., 2006; Onasch et al., 2012) was used for chemical characterisation of the submicron aerosol PM. Application of a laser with a wavelength of 1064 nm inside the AMS allows for vaporisation of soot particles. The AMS typically sampled in parallel with an aethalometer (AE33, Magee Scientific) from the flue gas line during combustion after a dilution step (ratio 1:100). For the experiments where PM was injected into the aerosol storage chamber, the AMS and the aethalometer would also be used to sample from the chamber after the transient measurements.
A potential aerosol mass reactor (PAM) (Kang et al., 2007) was used to simulate intense photochemical ageing. Two mercury UV lamps with peak wavelengths of 185 and 254 nm were used to produce hydroxyl radicals (OH) and ozone (O3) inside the PAM for oxidation of the aerosol sampled from the aerosol storage chamber. The O3 concentration in the PAM was measured with an ozone monitor (Thermo Scientific, model 49i). The OH concentrations inside the PAM were estimated from calibrations with SO2 in the absence of and in the presence of high concentrations of biomass burning aerosol particles (Li et al., 2015). The higher PM loading relevant in the current study only resulted in minor reductions in the estimated OH concentrations. Efforts were made to reduce the background of secondary aerosol particle precursors in the system as described above, and the background was generally found to be negligible compared to the combustion aerosol signal. Three different levels of photochemical ageing would typically be applied in each experiment ranging from ∽1 to ∽10 d of atmospheric ageing assuming an average ambient OH concentration of 1.5×106 cm−3. The CCNc, APM, SMPS, AMS and the aethalometer were used for sampling directly from the aerosol storage chamber, or alternatively in parallel through PAM with a total flow rate of about 5 , in the experiments when photochemical ageing was studied.
The concentration of CO2 was measured online in the flue gas with a non-dispersive infrared sensor (LI 840A, LI-COR). The concentration of carbon in the fuels was obtained from application of the EN ISO 16948 protocol (https://www.iso.org/, last access: 9 April 2021). This information was used to normalise particle emissions to dry fuel consumption as described in more detail below. The ash content and inorganic elemental concentrations were investigated by use of the EN 14775 and the EN 15289, 15290 and 15297 protocols (https://standards.iteh.ai, last access: 9 April 2021), respectively.
3.4 Data analysis
Throughout this study we will refer to the aerosol particles present in the flue gas and initially injected into the aerosol storage chamber as freshly formed or primary, while particulate matter formed due to simulated photochemical ageing in the flow reactor will be considered secondary aerosol.
Determinations of the critical supersaturation and indications of particle mixing state (internal or external) for particle mobility diameters of ∽65, ∽100, ∽200 and occasionally ∽350 nm were obtained through the following procedure. Relaxed step functions were fitted to the CCN concentration vs. total flow rate (supersaturation) in a similar way as done by Wittbom et al. (2014). Multiply charged particles were accounted for, and the critical supersaturation was obtained for 50 % of the singly charged particles having activated into cloud droplets. All CCN spectra were visually inspected to ensure that the full range of the spectra were available for analysis and to investigate for indications of externally mixed particle populations as reported by Petters et al. (2009). CCN spectra were excluded from the data analysis for four different reasons: (i) if the dT was not constant, (ii) if a full CCN spectrum was not covered within the scan range, (iii) if the counting statistics and signal-to-noise ratio were too low for analysis, or (iv) in rare cases, if the actual CCNc flow profile over a scan differed significantly from the pre-programmed profile.
Droplet growth kinetics were investigated by comparing the average droplet mode size measured by the optical particle counter (OPC) near the exit of the growth column with ammonium sulfate calibrations used as reference. Experiments with aerosol particles having the same critical supersaturation and applying the same temperature gradient along the CCNc column were used for the intercomparison.
Emission factors of CCN were obtained by normalisation of particle concentrations in the flue gas to dry fuel consumption by assuming 90 % of the carbon in the fuel being converted to CO2 in the flue gas. We applied a very simple model to estimate the CCN emissions due to the discretised information about the CCN activity at different particle diameters. The κ value for a given particle mobility diameter was estimated by a linear inter- and extrapolation relative to the particle diameters for which κ was measured. The κ value below mobility diameters of ∽65 nm was assumed constant and identical to that obtained for ∽65 nm. Likewise, the κ values for the particles with mobility diameters larger than ∽200 nm (or alternatively ∽350 nm) were assumed constant and equal to the value for 200 nm (or 350 nm if available). Thus, the critical supersaturation for any particle mobility size was estimated, and in all cases but one, the modelled SSc increased monotonically with decreasing Dp. This allowed for estimating the CCN emissions as a function of supersaturation by integration of the average particle number size distributions measured in the flue gas taking the modelled SSc(Dp) into account. The ability of an aerosol particle to activate into a cloud droplet depends on the dry particle size and the chemistry (largely “hygroscopicity”) for a given supersaturation (Eq. 1). As mentioned above, we generally found that the particle size dominated over the κ value with this simple interpolation approach with one exception. The exception (RS-cas#2) had a pronounced soot mode with low κ dominating near ∽100 nm, while the ultrafine mode dominating near ∽65 nm had a significantly higher κ value resulting in cloud droplet activation of ultrafine particles at lower SSc than for the soot particles with larger Dp. In that particular case, the CCN emission factors were estimated in a similar fashion, but with a separate integration of the two modes obtained by lognormal fits to the modes. It is unclear whether a similar issue (a non-monotonic SSc(Dp) distribution) could have been observed for other experiments, if a higher size resolution in CCN measurements had been provided. In this context, it is worth noting that ambient measurements of the CCN activity based on similar integration of particle number size distributions (assuming particle size dominating over κ) (e.g. Herenz et al., 2018) may be biased in a range near two overlapping size modes in case (fresh) biomass combustion emissions or similar dominate the aerosol particle population.
The CCN emission factors for the simulated photochemical ageing with PAM were estimated in a somewhat similar fashion. In those cases, the emission factors were estimated with focus on the soot mode by considering the measured change in CCN activity. The average size of the soot mode and its CCN activity were typically unaffected during storage in the aerosol storage chamber for up to ∽60 min. In contrast, coagulation significantly influenced the primary ultrafine particles, which complicated assessing the emission factors related to the isolated effect of photochemical ageing of those. However, simple κ considerations (Eq. 2) show that the main ageing effects on the CCN population can be expected for the soot particles with initial relatively low κ values. Ideally, the increase in Dp with ageing should also be taken into account, but we were typically not able to determine that with reasonable accuracy from the particle number size distributions, despite clear indications of a particle growth based on CCNc, APM and AMS measurements. This is most likely due to the initial soot particle CCN activity and effective density being very low compared to those properties of SOA. Hence, soot particle CCN activity and effective density are very sensitive to minor additions of SOA. Therefore, the inferred shift towards lower SSc for the aged soot particles can in this context be considered a lower estimate based on changes in chemistry. In addition, nucleation mode particles generally formed during the simulated photochemical ageing, and in a couple of cases, these secondary particles grew large enough to play a (minor) role as CCN. The emission factor of these secondary particles was in one case estimated by relative comparison to the soot mode particle number concentration.
The effective particle density was inferred from Gaussian fits to the particle number concentration versus voltage with results for PSL spheres used as reference. Our approach does not account for multiply charged particles, which may lead to the inferred effective density being biased slightly high (by up to ∽10 %) (Rissler et al., 2013). However, for most of the experiments, we would expect the bias for the ∽65, ∽200 and ∽350 nm particles to be less pronounced due to often relatively small potential fractions of multiply charged particles. The APM data obtained shortly after chamber injections were used in conjunction with the particle number size distributions for estimation of the freshly emitted PM. The effective particle density was linearly interpolated from ∽65 to ∽100 nm and from ∽100 to ∽200 nm. The effective particle density was assumed constant and equal to that at ∽65 nm for the smaller particles. For the particles larger than 200 nm, the effective density was estimated/modelled by use of Eq. (3) in a similar fashion as done for soot particles by Rissler et al. (2013), with fits including 200 and 350 nm particles when available. For experiments where APM data were incomplete or missing, values for ρeff from similar experiments were assumed. Emission factors of the particulate matter with a diameter up to 0.5 µm (PM0.5) were estimated from the normalised particle number size distributions measured in the flue gas in conjunction with the obtained size-dependent ρeff.
4.1 Particle number size distributions
Some examples of normalised particle number size distributions measured in the flue gas with the fast particle analyser are shown in Fig. 2. The presented particle number size distributions were averaged over the time window during which injection into the aerosol storage chamber was carried out. The distributions have been adjusted for the dilution rates and normalised to the corresponding consumption of dry fuel mass. The size distributions associated with the 3S and the RS were typically averaged over periods with significant variations depending on the combustion phase, while the size distributions associated with the NDS and the FDS stayed close to constant during the injections. We provide a more detailed description of the variability in particle number size distributions below.
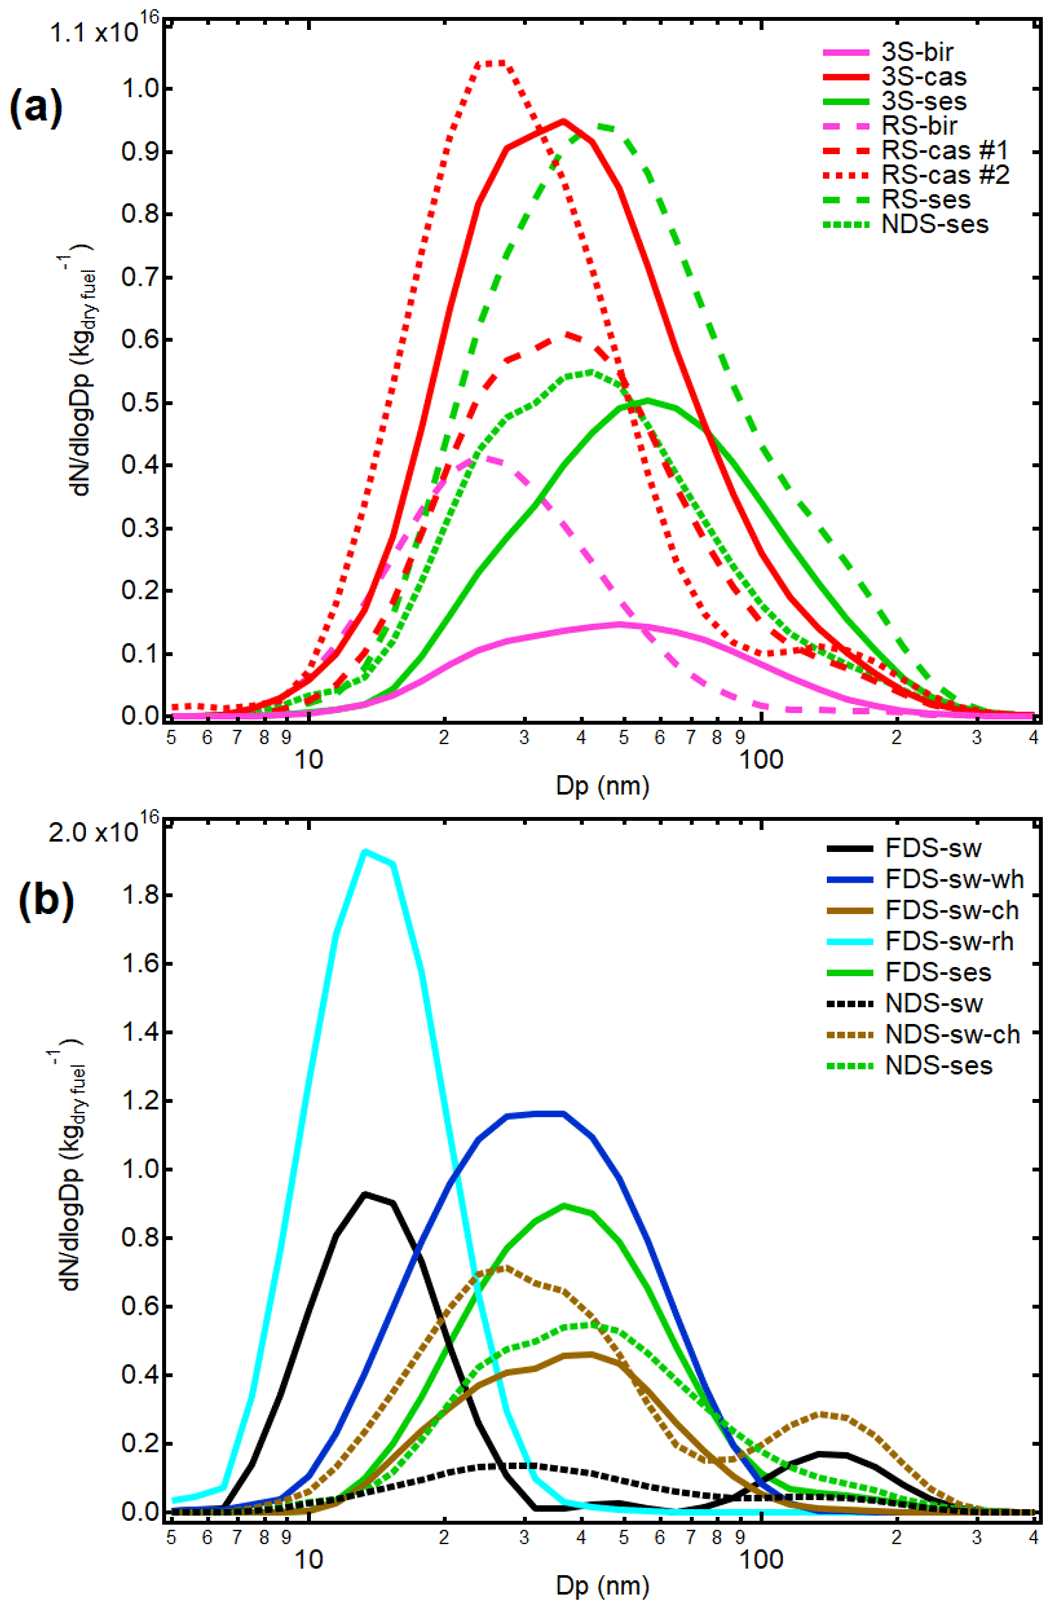
Figure 2Examples of averaged particle number size distributions in the flue gas measured with the fast particle analyser normalised with respect to the dry fuel consumption. The distributions represent averages during the time periods when the respective chamber fillings were carried out. The abbreviations of stoves and fuels in the legends are three-stone fire (3S), rocket stove (RS), natural draft stove (NDS) and forced-draft stove (FDS) with combustion of birch (bir), Casuarina (cas) or Sesbania (ses) wood logs or pellets of softwood (sw), coffee husk (ch), rice husk (rh), water hyacinth (wh) or ses. The size distributions in (a) from the 3S and RS showed pronounced variability during chamber injections. The size distributions in (b) from the FDS and the NDS representing the intermediate combustion phase were typically rather constant during chamber injections. Note that the scales on the ordinate axes are different, and NDS-ses is included in both (a) and (b) for comparison.
In general, the features of the presented particle number size distributions measured with the fast particle analyser corresponded relatively well to the initial emissions into the aerosol storage chamber, which were measured with the SMPS. However, the average size of both the ultrafine and the accumulation (soot) mode were typically slightly larger for the chamber versus the flue gas measurements, and it is unclear to which extent it was due to (i) diffusion particle losses of the smallest particles in sampling lines, (ii) additional coagulation in sampling lines prior to the chamber injections, or (iii) a minor systematic offset between the instruments. We did not carry out particle loss calculations in the flue gas and sampling lines. The measurements of particle number size distributions in the flue gas with the FPA were optimised for minimal particle losses, and for the size range of relevance for CCN (Dp>∽30 nm), we would not expect any pronounced losses.
Remarkable differences can be observed between the particle number size distributions for the freshly emitted aerosol for the different experiments. Some distributions are clearly bimodal, with a mode centred around a mobility diameter of 10–40 nm and another mode centred around ∽150 nm (e.g. RS-cas, FDS-sw). Below, we present results indicating that the ultrafine modes often appear dominated by inorganic compounds potentially with a significant organic fraction, while the modes centred near a mobility diameter of ∽150 nm are typically comprised of soot particles dominated by refractory black carbon mixed with varying fractions of organic and inorganic components. Other particle number size distributions appear bimodal with overlapping ultrafine and soot modes (3S-cas, RS-cas, RS-ses, NDS-ses). The particle number size distributions related to the forced-draft stove and mixed fuels appear unimodal (FDS-sw-rh, FDS-sw-ch, FDS-sw-wh), but a modest soot mode was present in all those cases. We speculate that the easily combustible sw pellets with higher burn rate in the FDS resulted in quenching of the flame on the bottom of the pot, leading to enhanced soot emissions, while the pellet mixtures with relatively lower burn rate were likely to result in relatively lower flame height and no quenching of the flame inside the FDS, resulting in low soot emissions. In general, the particle number size distributions compare well with previously published results for comparable experiments (Just et al., 2013; Shen et al., 2017; Mitchell et al., 2019).
The particle number size distribution presented for RS-ses appears to have the most dominant soot mode in terms of the number concentration, and we investigated the conditions for that experiment in more detail. It turned out that two relatively short chamber injections were carried out with a minor break in between – and during both injections a pronounced soot mode was captured. An alternative chamber injection time window had typically resulted in a less pronounced but still significant soot mode. Hence, the presented particle number size distribution is not representative of the typical average over an entire combustion cycle for the RS-ses. Since this experiment was only carried out once, we have included the size distribution (and associated results) in the figure(s), but we note that it is not directly comparable to the other presented average particle number size distributions (or CCN emission factors), which are more representative of the aerosol population averaged over an entire combustion cycle.
We have studied the particle number size distributions over the chamber injection time windows to provide some semi-quantitative information about the variability. The particle number concentration for the diameter size bin where maxima on average were observed for the ultrafine modes varied relatively by ±28 %, ±17 %, ±9 % and ±6 % for the 3S, the RS, the NDS and the FDS, respectively. The reported variability ranges correspond to the range from the 25th to the 75th percentiles. It was not possible in general to report similarly derived variabilities for the soot mode maxima due to less well-defined modes in many experiments. Instead we have looked into the variability in number concentrations for the size bin centred close to 150 nm. Those variabilities were about ±35 %, ±50 % and ±10 % for the 3S, the RS and the NDS, respectively, again with the ranges corresponding to the 25th to 75th percentile range. The relative soot-mode particle number variability for the FDS-sw experiment was about 14 %, while it was significantly more pronounced (20 %–100 %) for the other FDS experiments with very modest absolute soot mode particle number concentrations. Comparison between stoves should be carried out with precaution in this context, since the relevant time intervals, fuels and number of experiments with each stove varied. Nevertheless, we observed indications of more constant ultra-fine particle number emissions with increasing combustion temperature and improved combustion temperature stability from the 3S to the FDS. Furthermore, it is worth noting that the soot mode variability appears to be more pronounced for the RS relative to the 3S, but additional studies are needed for a robust investigation of such potential differences. The pronounced variability in aerosol emissions in particular from the 3S and the RS illustrates the need for studying average emissions over a full combustion cycle for those stoves in order to assess the general aerosol emission features. Due to the described variability in emissions, we prioritised repeats of the 3S and the RS experiments as indicated in Table 1.
4.2 Mixing state
An indication of whether the particles are internally or externally mixed can be obtained from the shape of the CCN activation spectra (Petters et al., 2009). It is particularly of interest to investigate the mixing state in size ranges where two different modes overlap, which in our case is relevant for some of the CCN spectra obtained near a mobility diameter of 100 nm. All the obtained CCN spectra were visually inspected, and we did not observe any clear indications of externally mixed particles as reported by Petters et al. (2009) in several cases for aerosols from simulated wildfires. In many cases, the slopes of the CCN activation spectra were very similar to similarly obtained spectra for ammonium sulfate particles. Our observations may be due to (i) internally mixed particles in the size range near 100 nm, (ii) one mode being dominant by number near 100 nm or (iii) comparable CCN activity of the overlapping modes near 100 nm. Regardless of which of the listed options can explain our observations, we were generally able to infer a single CCN activity from the analysed CCN spectra. However, it should be noted that the CCNc experimental approach was optimised for fast scans in parallel with the APM measurements. Hence, neither the DMA transfer function nor the CCNc operation were optimised for extracting information about the mixing state from the CCN spectra.
4.3 CCN activity of freshly emitted aerosol particles
The CCN activities (average κ values) for freshly emitted particles are shown in Fig. 3 and also presented in Table 2. The results represent as far as possible the first measurements carried out shortly after injection into the aerosol storage chamber. The error bars represent ±2 standard deviations reflecting the variation between these early measurements. Some experiments were carried out up to five times (Table 1). In the cases with repeated experiments, the results presented in Fig. 3 include all data of reasonable quality, and the same holds for what is presented in Table 2, with the exception of RS-cas. Thus, large error bars do not necessarily reflect large uncertainties in single measurements – rather they may reflect variations within a single experiment or for different chamber injections for similar experiments. The latter is particularly pronounced for RS-cas for Dp=100 nm, where two more extreme cases are included in Table 2, and the two corresponding averaged particle number size distributions are included in Fig. 2. In the RS-cas#1 case, the ultrafine mode dominates near Dp=100 nm, which is associated with a relatively high κ value (0.31), while in the RS-cas#2 case, the mode centred near Dp=150 nm dominates the concentration close to Dp=100 nm and is associated with a significantly lower κ value (0.06). In general, κ decreased with increasing mobility diameter for the size range investigated for all the experiments, which has also been observed in other comparable studies (Petters et al., 2009; Martin et al., 2013). In addition, it is worth noting that the reproducibility of κ values for the 3S-cas and the RS-cas experiments is typically quite high (as indicated by the modest error bars in Fig. 3), at least for the ∽65 and ∽200 nm particles. Hence, the experiments with potentially more pronounced differences in manual cookstove operation conditions result in reproducible average CCN activities for the different aerosol modes.
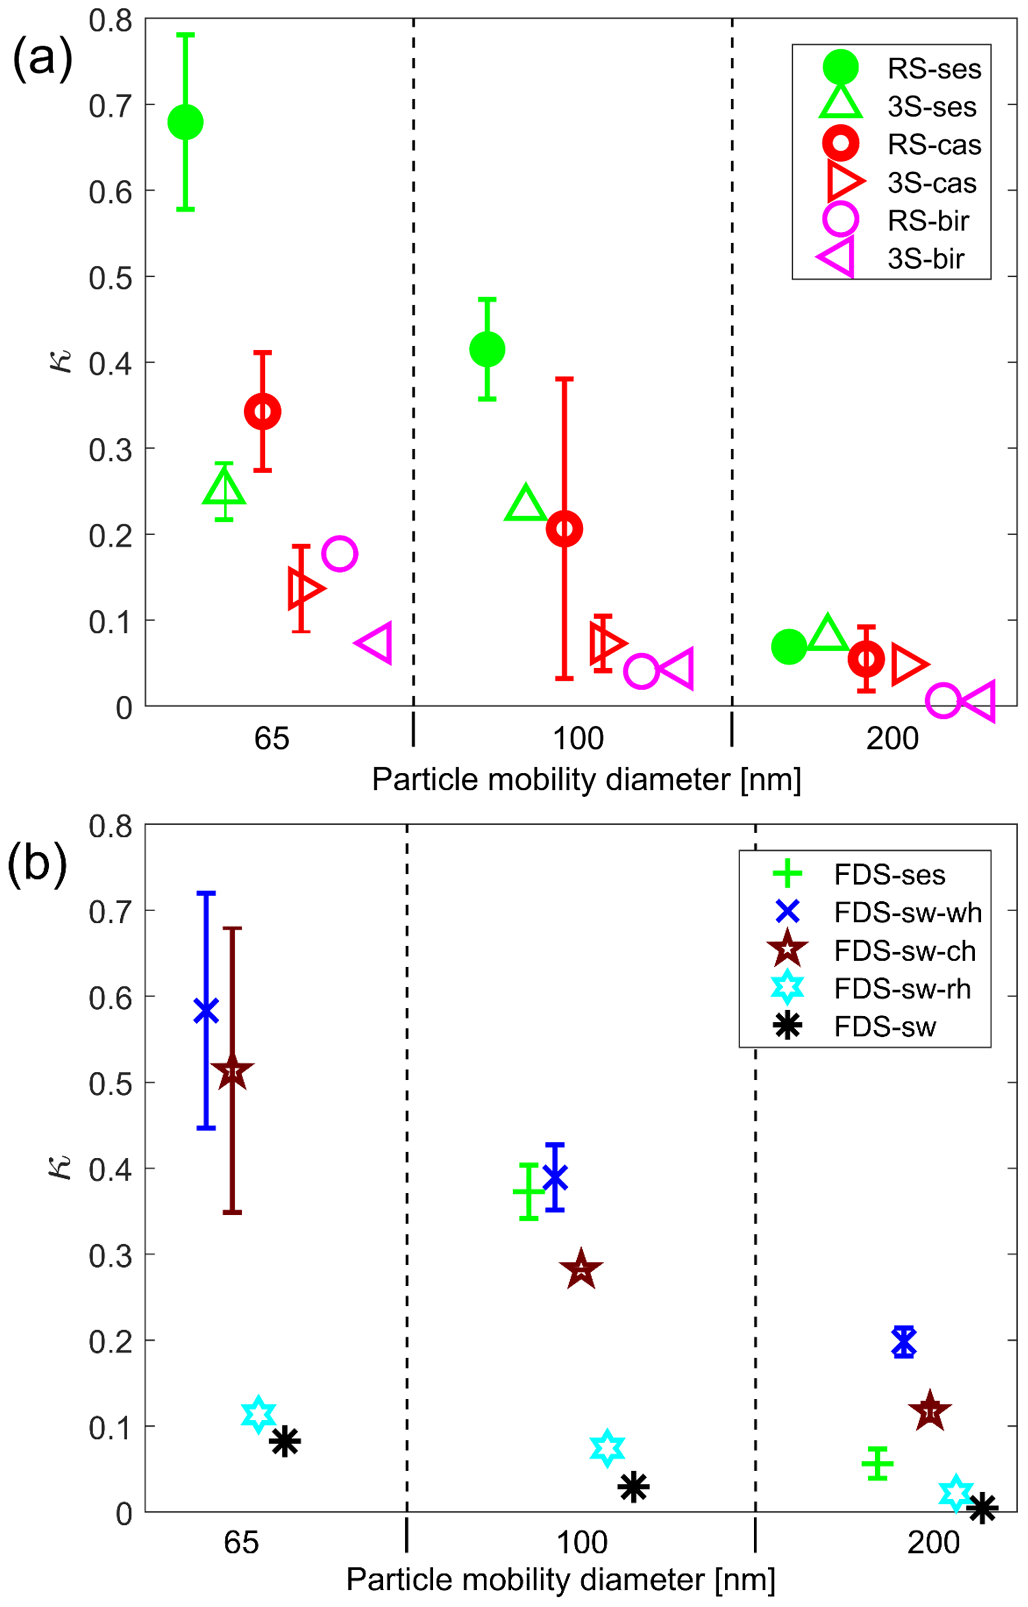
Figure 3The CCN activity expressed as the hygroscopicity parameter κ for different fuels and three different particle mobility diameters of ∼65, ∼100 and ∼200 nm. In (a), for the rocket stove (RS) and the three-stone (3S) stove with combustion of wood logs of birch (bir), Casuarina (cas) or Sesbania (ses). In (b), for the forced-draft stove (FDS) and combustion of pellets of ses or softwood (sw) or mixtures of sw with pelletised coffee husk (ch), rice husk (rh) or water hyacinth (wh). The data points represent mean values of κ, while the error bars represent ±2 standard deviations of the variability between different measurements of the aerosol shortly after chamber fillings. In cases where no error bars are depicted – they are subsumed by the data points.
Table 2The measured CCN activity (κ) of freshly emitted aerosol particles. The reported ranges represent ±2 standard deviations for the variation between independent measurements. The κ values for ∼20–30 nm particles were estimated in some experiments from measurements near 65 nm once the initial ∼20–30 nm particles had grown by coagulation to dominate at 65 nm.

NA stands for not available.
The CCN activities of aerosol particle emissions from combustion of birch, Casuarina and Sesbania wood logs in the 3S vs. the RS are shown in Fig. 3a. These results to some extent allow for investigating the influence of the stove and the fuel separately – keeping in mind that the different combustion cycles were not necessarily represented identically between these different experiments. The CCN activity of ∽65 nm particles is significantly higher for the RS relative to the 3S for any of the three studied fuels. The same trend is to some extent observed for the ∽100 nm particles (with the exception of birch), while the CCN activities are similar for the ∽200 nm particles from the two stoves and usage of the same fuel. From Fig. 3a it can also be observed that, for the two stoves, there is a decreasing trend in the CCN activity of particles from combustion of Sesbania over Casuarina to birch. That trend is evident for both of the stoves and for all of the particle sizes investigated. The results presented in Fig. 3a clearly indicate that both the stove and the fuel composition are likely to influence the CCN activity at a given particle size, which will be discussed in more detail below.
The CCN activities for different particle mobility diameters and different pelletised fuels combusted in the forced-draft stove are presented in Fig. 3b. The κ values were relatively high for the softwood mixed with coffee husk or water hyacinth for all sizes investigated, with average values on the order of 0.6 for the ∽65 nm particles. The κ values for FDS-ses for particle diameters near 100 and 200 nm are similar to those observed for RS-ses. The κ values appear low (<0.05) with respect to sw, while they are slightly higher (<0.12) for the mixture of softwood and rice husk. In this context it shall be noted that the particle concentrations near Dp=65 nm are very low for the freshly emitted aerosol related to FDS-sw and FDS-sw-rh due to the ultrafine mode being present at smaller sizes. Hence, the associated κ values presented in Fig. 3 are only representative of a tiny number fraction of the aerosol. Coagulation in the chamber resulted in growth of the particle modes initially centred around ∽15 nm (Fig. 2b). When those modes had grown to dominate near Dp=65 nm, κ values up to 0.20 and 0.12 for FDS-sw and FDS-sw-rh, respectively, were detected. In the cases where such trends were observed, the associated κ values are included in Table 2. It shall also be noted that in some cases the number concentrations of larger particles are low as can be observed from Fig. 2, so the κ values of 200 nm particles from FDS-sw-ch, FDS-sw-rh or FDS-sw-wh relate to a tiny number fraction of the emitted aerosol particles.
Fewer experiments were carried out with the natural draft stove, and the inferred κ values are included in Table 2. There seems to be a tendency of relatively lower κ values for the NDS-ses and NDS-sw-ch aerosols compared to the FDS-ses and FDS-sw-ch aerosols, respectively, but the data set is too limited to draw any general conclusions in this respect. In Sect. 4.3.2 below, we discuss how the presented κ values (together with supportive results) can be used to provide qualitative information about the chemical composition of the respective aerosol particles.
4.3.1 Effective particle density
The available APM data provide complementary supportive information regarding the aerosol particles, as will be discussed in more detail in the following section. Unfortunately, we do not have APM data from all the chamber experiments due to technical issues with the instrument during parts of the campaign. In Fig. 4, selected typical results are presented.
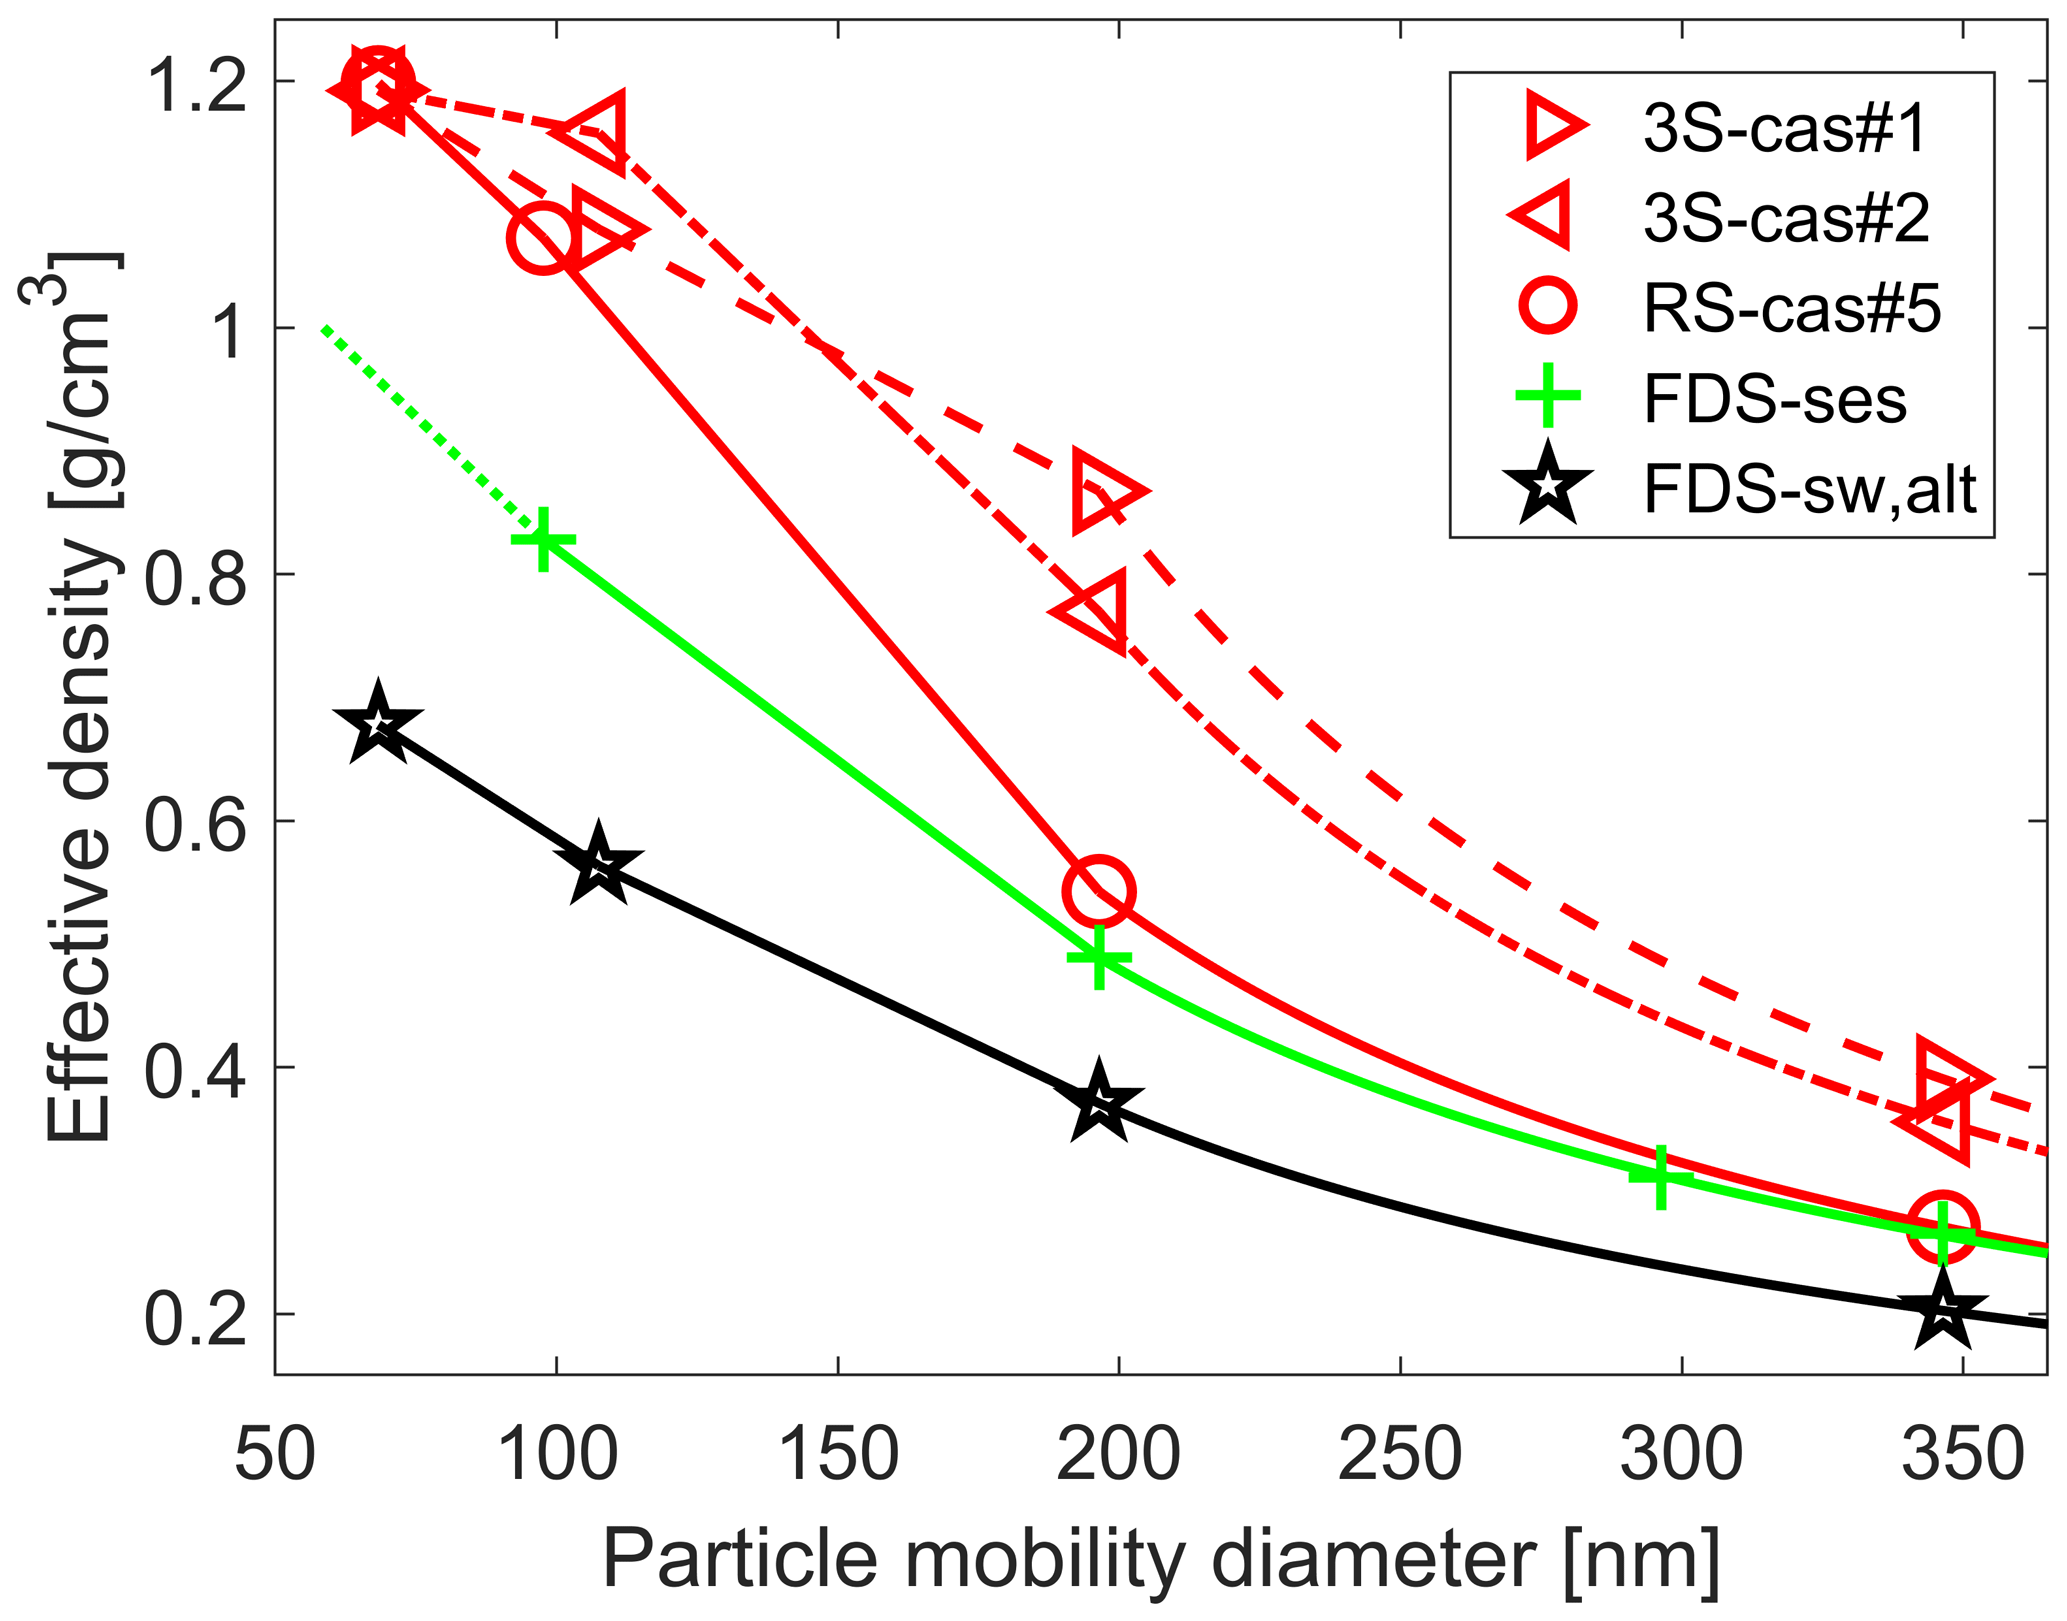
Figure 4Examples of the measured effective densities (ρeff) for primary particles when measurements for Dp=350 nm were included. The lines are linearly interpolated for Dp<200 nm, while fits to Eq. (3) are applied for Dp>200 nm. A data point typically represents the average of two to four independent measurements from the same chamber filling. The shown FDS-sw,alt results are from an experiment with altered pot height (Korhonen et al., 2020), and they do originate from the regular FDS-sw experiment, which is presented elsewhere in this study. Examples of additional primary and aged ρeff for 200 nm particles are included in Table 5.
In general, the effective density decreased with increasing particle mobility diameter for all experiments carried out (including experiments not included in Fig. 4). Typically, the effective density of freshly emitted particles with a mobility diameter of ∽65 nm would be found in the range 0.9–1.3 g cm−3 including all experiments with reasonable data quality. For the freshly emitted 200 nm particles, typical effective densities were found in the range from 0.35 to 0.5 g cm−3 for the RS, the FDS and the NDS applying various fuels, while it was ∽0.8 g cm−3 for the different 3S experiments. The effective density for the particles with a mobility diameter of 350 nm was lower than for 200 nm whenever measured, with values of 0.2–0.3 g cm−3 for the FDS, ∽0.3 g cm−3 for the RS and ∽0.4 g cm−3 for the 3S. Similar low effective densities have been reported for fractal-like black-carbon-dominated agglomerates from a variety of sources (Rissler et al., 2013). The relatively higher effective density for the freshly emitted 200 and 350 nm soot particles for the 3S is potentially due to (i) a larger fraction of organic compounds/coatings and/or (ii) more compact black carbon aggregates. The first suggestion did most likely play a role, judging from the following observations. Sampling through a thermodenuder was carried out a few times during the campaign. Sampling of the 3S-cas aerosol through the thermodenuder with a temperature of 280 ∘C resulted in a significant reduction of the effective density of the 200 nm particles and also towards more black-carbon-type aerosol absorption as measured with the aethalometer. Refractory organic primary matter that passes through the thermodenuder may also be present, and it is in line with significantly higher amounts of primary organic matter reported for the 3S relative to the other types of stoves included in our experiments (e.g. Reece et al., 2017).
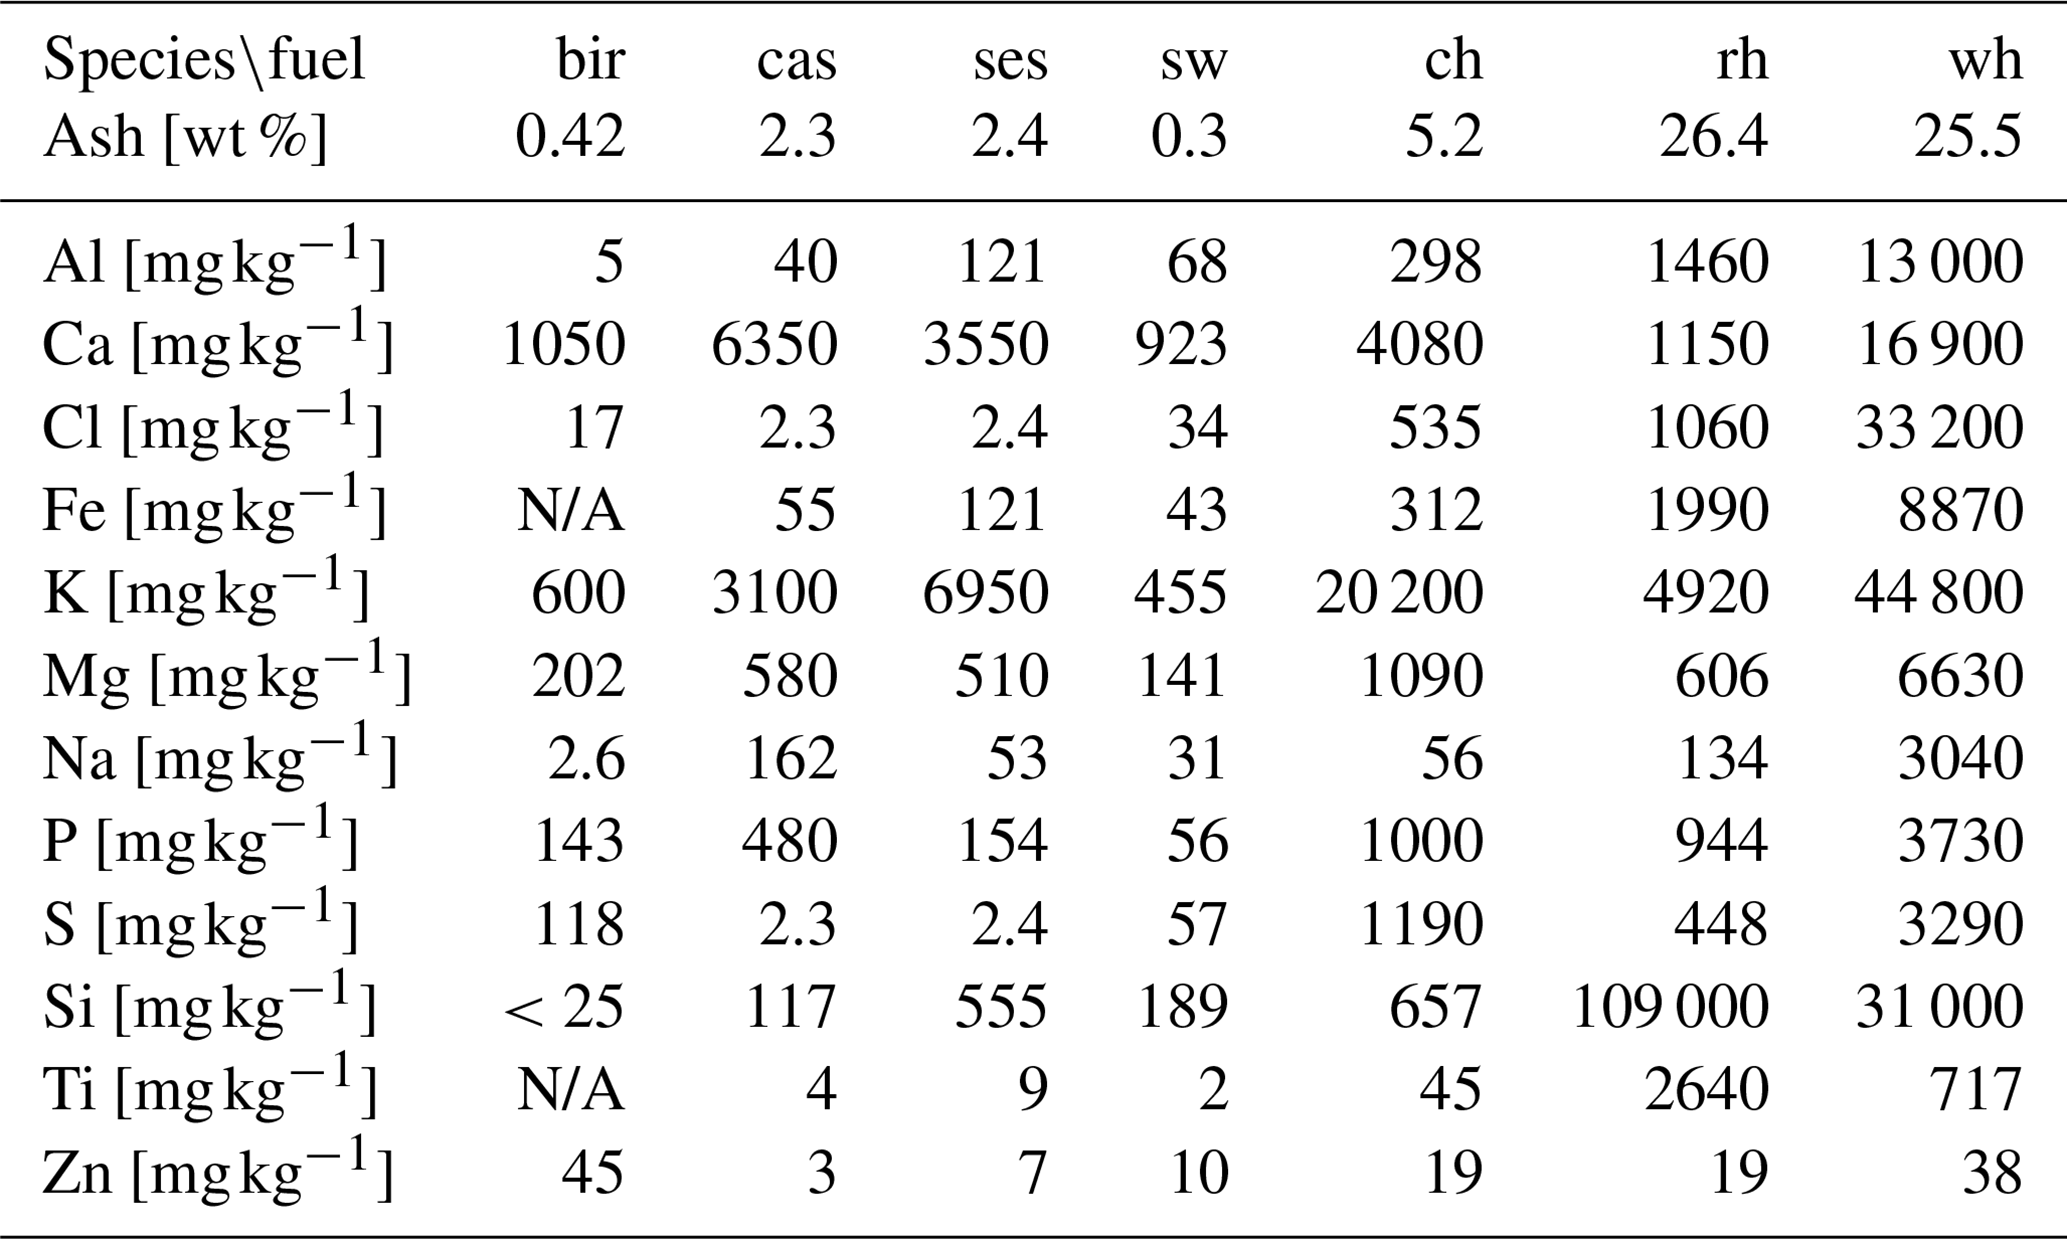
Table 3Ash content and major ash-forming elements on a dry fuel basis. The results were obtained from application of the standard protocols EN 14775, EN 15289, EN 15290 and EN 15297.
Atmospheric photochemical ageing was simulated by sampling through an oxidation flow reactor as described above. There was a general tendency of increasing effective density with increasing levels of OH and ozone in the flow tube. In four cases, secondary aerosol particles dominated by number around a size of 65 nm (Table 5). An effective density close to 1.4 g cm−3 was observed in those cases. Similar densities close to 1.4 g cm−3 have previously been reported for various secondary organic aerosol particles (Kostenidou et al., 2007; Kuwata et al., 2011; Nakao et al., 2013).
The consistent increase in effective density with increased ageing for all particle sizes investigated can thus be explained by condensation of SOA onto the pre-existing particles with lower initial effective density. That is supported by the AMS measurements, where the relative increase in PM due to the simulated photochemical ageing was due to organic species with fragmentation patterns characteristic of SOA particles.
4.3.2 Chemical composition and CCN activity
The observed differences in the CCN activity and the effective density reflect significant differences in the chemical composition of the aerosol particles between the different experiments. The ash content in general and concentrations of major ash-forming elements in the fuels, together with the combustion conditions, determine the chemical behaviour including volatilisation of fine aerosol forming inorganic species (Boström et al., 2011). The concentration of the dominant inorganic species in the applied fuels is presented in Table 3. The total ash content in the fuels varied within almost 2 orders of magnitude from ∽0.3 % for sw-pellets and birch over ∽2.4 % for cas and ses to ∽25 % for rh and wh, and the elemental ash composition varied significantly between the different fuels. For all woody fuels (bir, cas, ses and sw) Ca and K were the main ash elements with less but varying content of, e.g., Si and P. For two of the pelletised agro-fuels (ch and wh) very high amounts of K were present in the fuel ash, although with varying content of other elements. For wh, high concentrations of Si, Al, Ca and Cl were also seen, while for ch, K dominated the ash elements together with some Ca in the fuel. For rh, the fuel ash was dominated by Si (>85 %) by mass with a minor fraction of K (∽4 %).
It is rather difficult to exactly infer which inorganic compounds will actually be present in the fine aerosol particles based on the information in Table 3 alone, due to the complex nature of the ash transformation reactions that govern the behaviour of different elements (e.g. volatilisation and condensation) during the combustion process. However, considerable experimental experiences exist together with conceptual fundamental thermochemical models (Boström et al., 2011), which give a rather solid framework to support the interpretation of the results seen in the present work related to fine inorganic aerosol formation and CCN activity. Based on the knowledge in this field, it is expected that elements such as K, Na, S, Cl and Zn, as well as some other trace metals like Pb and Cd, to a different degree will be volatilised during combustion (Obernberger et al., 2006; Boström et al., 2011; Obaidullah et al., 2012). Depending on the different chemical composition of the flue gases, those volatilised species may react further with gaseous components (e.g. O2, CO2, HCl, SO2) and/or condense onto submicron particles during cooling of the flue gases. In small-scale biomass combustion applications, refractory species like Ca, Mg and Si are expected to stay in the bottom ashes, as solids or melts, with only a minor fraction forming coarse fly ash particles entrained in the flue gases. Still, elements like Si and P play a vital role in determining the degree of volatilisation of alkali (K and Na) since they readily react with both Ca and K (or Na), forming different silicates and phosphates, most often found in the residual ash in stoves and boilers (Boström et al., 2011).
Kristensen et al. (2012)Sullivan et al. (2009)Sullivan et al. (2009)Sullivan et al. (2009)Sullivan et al. (2009)Carrico et al. (2010)Carrico et al. (2010)Rissler et al. (2005)Carrico et al. (2010)Slade et al. (2015)Shantz et al. (2008)Kumar et al. (2009)Engelhart et al. (2012)Engelhart et al. (2012)Wittbom et al. (2014)Table 4Some hygroscopicity parameter (κ) values for selected species potentially relevant for the biomass combustion aerosol emissions studied. The κGF values were inferred from hygroscopic growth for subsaturated conditions, and according to Petters and Kreidenweis (2007) similar values can be expected for the supersaturated conditions (κCCN).
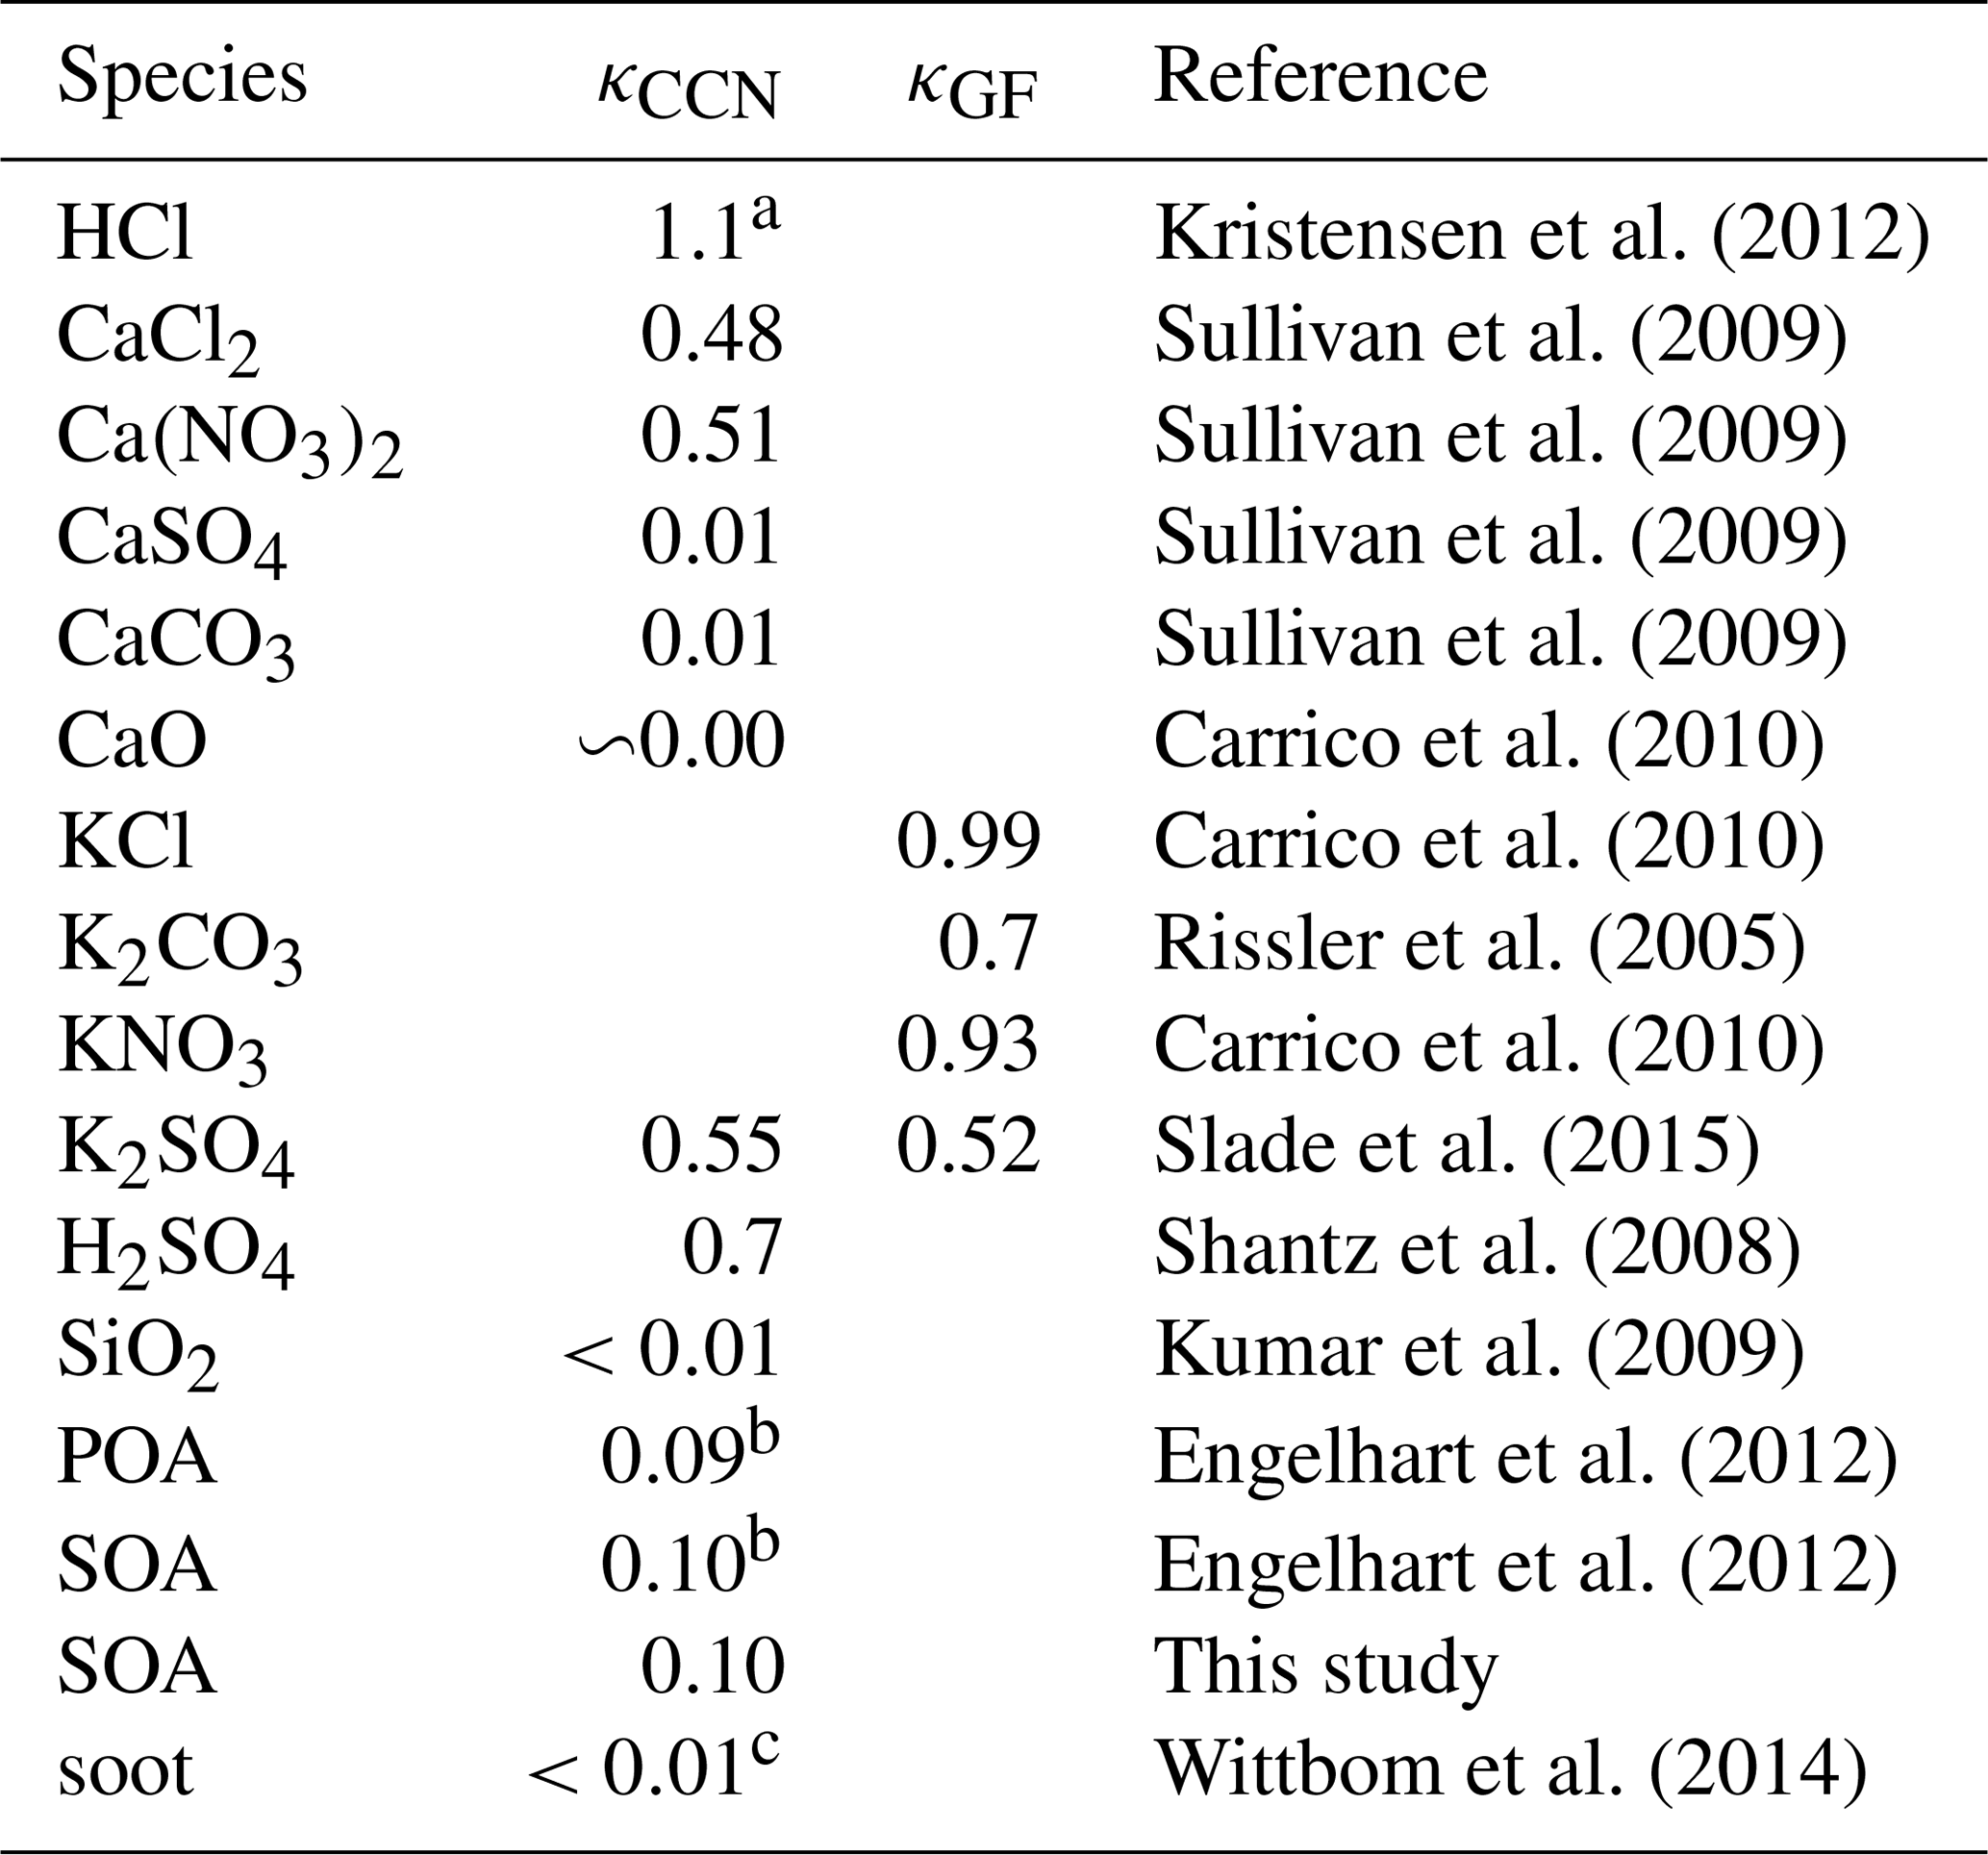
a Modelled. b Average κ for primary organic aerosol (POA) (estimate) and secondary organic aerosol (SOA) as defined in the experimental approach applied by Engelhart et al. (2012). c Freshly emitted, uncoated and insoluble soot particles.
The measured CCN activity may in some cases provide indirect information about the chemical composition of the aerosol particles. Some available κ values of various compounds potentially present in the aerosol particles are listed in Table 4. Different potassium salts have been identified in biomass burning aerosol particles in ambient as well as laboratory studies. Species such as KCl, K2SO4 and KNO3 have been identified as major inorganic components in atmospheric aerosol particles sampled over or adjacent to areas with wildfires in California (Silva et al., 1999) and Africa (Gaudichet et al., 1995; Li et al., 2003). Rissler et al. (2005) reported KCl, K2SO4 and in some cases K2CO3 to be the dominant species in fine particulate matter emitted from combustion of moist forest residue and stem-wood pellets in district heating boilers. Furthermore, the detailed composition and morphology of submicron (single) particles emitted from small-scale biomass combustion were nicely explored by Torvela et al. (2014), where both soot and inorganic particles where characterised by TEM-EDX. For the inorganic particles, a smaller nucleus of ZnO was in many cases seen in the core of single alkali salt particles (mainly KCl and K2SO4). Those potassium salts of potential relevance to the particle phase are included in Table 4 with relatively high κ values (0.5–1).
Secondary organic aerosol particles typically have a κ value of 0.1 as found in the current study (presented in Sect. 4.6 below) and in a previous study on emissions from biomass combustion (Engelhart et al., 2012). Engelhart et al. (2012) estimated primary organic aerosol (POA) from biomass combustion to have a κ of 0.09, but it could in general potentially be lower due to the potential presence of relatively large molecules and not necessarily very oxidised species. Freshly emitted and uncoated soot particles generally have very low κ values close to 0 (e.g. Wittbom et al., 2014).
It is not possible to include all relevant species in Table 4 due to complex chemical matrices and/or unavailable κ values. A few Ca or Si species are included in Table 4, typically with low κ values. The significant differences in κ values between different relevant species allow for extraction of information about the aerosol chemical composition on a qualitative level, which will be discussed in more detail below. The link between the inferred κ values and the associated chemical composition for internally mixed particles is based on κ addition (Eq. 2). In short, particles with κ values close to 0 can be explained by the dominance of elemental carbon and/or organics/inorganics with low solubility/hygroscopicity. On the other hand, particles with κ values of >0.5 are likely to be dominated by inorganic soluble salts, potentially the potassium species listed in Table 4. Particles with intermediate κ values may be comprised of internally mixed particles of species with different κ values and/or dominance of organic species in case κ is in the neighbourhood of 0.1. The interpretation can be supported by the measured effective density to estimate whether low κ particles can be explained by soot agglomerates or low-solubility organic or inorganic species.
It is interesting to compare the RS-bir, RS-cas and RS-ses experiments. The birch fuel contains significantly less ash, while the total ash fraction is similar for cas and ses. The only significant difference between the ash composition of cas and ses is the mass ratio between the dominating ash elements K and Ca being ∽1:2 and ∽2:1, respectively. Hence, ses contains the most easily volatilisable ash mass followed by cas with significantly less in birch. That corresponds very well to the significant differences in the normalised magnitude and size range (related to the particle mass) of the ultrafine modes of the particle number size distributions of RS-bir, RS-cas and RS-ses presented in Fig. 2a. The relatively high κ value of ∽0.7 for the ∽65 nm particles for RS-ses corresponds well with a dominance of potassium salts. The lower κ values of ∽0.35 and ∽0.2 for RS-cas and RS-bir, respectively, indicate that other species than potassium salts are present. The most likely explanation would be a significant and a dominant organic volume fraction internally mixed with potassium salts in the ultrafine aerosol particles for RS-cas and RS-bir, respectively. Alternatively, the presence of soot particles and/or various Ca salts in the ultrafine particles would contribute to low κ values. However, the soot modes we identified from the particle number size distributions (Fig. 2) did typically not contribute significantly by number near a mobility diameter of ∽65 nm. In addition, we find it unlikely with significant concentrations of Ca salts in the ultrafine particles, which we base on previous laboratory studies introduced above.
The CCN activity for the ∽65 nm particles was significantly lower for the 3S relative to the RS for any of the fuels. That may be due to (i) a relatively lower combustion temperature for the 3S resulting in a lower fraction of inorganic compounds being volatilised (assuming organics to be present in any case) and/or (ii) a relatively larger fraction of inefficiently combusted organic species being present in the ultrafine particles. Judging from Fig. 2a, the particulate mass relevant for the ultrafine modes appears to be higher for the 3S versus the RS for bir and cas (not including the RS-ses, which may be biased in this context as described above). Those observations of apparently more ultrafine mass in combination with lower κ values for the 3S versus the RS indicate that the 3S emits relatively more organic particulate matter in the ultrafine size range of the primary aerosol. Whether the other effect suggested above also plays a role (lower absolute emissions of inorganics for the 3S versus the RS) is not something we can conclude on based solely on these observations, but we would expect such an effect due to the difference in combustion temperature.
The κ values for Dp=200 nm were almost identical for the 3S and the RS experiments, when the same fuel was applied. We would expect a relatively larger organic fraction in the larger size range for the 3S relative to the RS experiments as supported by the APM results, so the apparently similar κ values may not necessarily reflect similar particles around a Dp=200 nm – but could potentially be due to different ratios between elemental carbon, organic and inorganic species. In other words, the 3S soot particles are likely to have a relatively higher organic-to-EC ratio, while the RS soot particles are likely to have a slightly higher inorganic-to-EC ratio for a given fuel.
The combustion with the FDS is more efficient and well-controlled, which provides a more reproducible basis for intercomparison of the relation between fuel composition and aerosol properties. For the ch and wh ash, potassium is the dominant element (Table 3), and the corresponding κ values for ∽65 nm particles are relatively high (0.5–0.6), which can be explained by a significant fraction of potassium salts in the ultrafine particles. The rh ash is dominated by Si with a minor fraction of K, and the corresponding κ values for the ultrafine mode are estimated to ∽0.12 (measured when the mode had grown by coagulation to dominate at Dp=65 nm). Hence, that ultrafine mode is unlikely to be dominated by potassium salts – and dominance of organic species can explain the observation. It is unlikely that soot particles could affect the κ value, since there is no indication of significant soot concentrations. Alternatively, the presence of Si salts could potentially contribute to the relatively low κ value; however, we would not expect any significant presence of Si in the ultrafine particles, as discussed above.
In general, for the stoves and fuels investigated, our results indicate that a higher potassium concentration in the fuel results in a higher CCN activity of the emitted ultrafine particles – which is more pronounced for combustion at higher temperatures (e.g. RS vs. 3S). Overall, the κ values for 200 nm particles range from ∽0.001 to ∽0.2. Whenever κ values for the 200 nm particles were relatively low (or high), they were associated with relatively low (or high) κ values for the ultrafine mode (∽65 nm). That relation is represented by a correlation coefficient of 0.76 and a p value of 0.01 for the results presented in Fig. 3. Hence, it is likely that the ultrafine particles coagulated with the soot mode particles and thus increased the soot mode κ values. These observations further support the fact that not only do the potassium compounds appear to play a key role for the CCN activity of the ultrafine particles, they also influence the CCN activity of the soot mode.
4.4 Droplet growth kinetics
The size of droplets formed inside the CCNc was detected by an optical particle counter. Insoluble organic compounds and mineral dust have previously been shown to delay droplet growth (Asa-Awuku et al., 2009; Kumar et al., 2009), which is the motivation for investigating whether the same may be the case for biomass burning aerosol particles. In the present study, the size of the formed droplets was systematically investigated. No significant differences were observed between the sizes of the droplets formed on the studied biomass burning aerosol versus ammonium sulfate particles – when the CCNc operation conditions were identical and the critical supersaturation of the seed aerosol particles similar. Atmospheric ageing of the biomass burning aerosol particles with the lowest CCN activity (κ<0.1) is likely to result in an increase in the CCN activity, which is discussed in more detail below. Hence, our results indicate that reduced cloud droplet growth rates are unlikely to play a role with respect to the studied biomass burning emissions from the investigated fuels and combustion conditions at any stage of their atmospheric lifetime.
4.5 Primary CCN emission factors
Estimated cumulative primary CCN emission factors (EFCCN) are shown in Fig. 5. These averaged emission factors are normalised with respect to dry fuel consumption during the studied chamber injections. For the 3S and the RS, the chamber injections are typically averaged over different burning phases – and thus a higher variability is expected for those experiments compared to the pellet stove experiments. In general, the fresh emissions of CCN for a supersaturation of 0.1 % are relatively modest, while for higher supersaturations huge variations are observed for different stoves and different fuels.
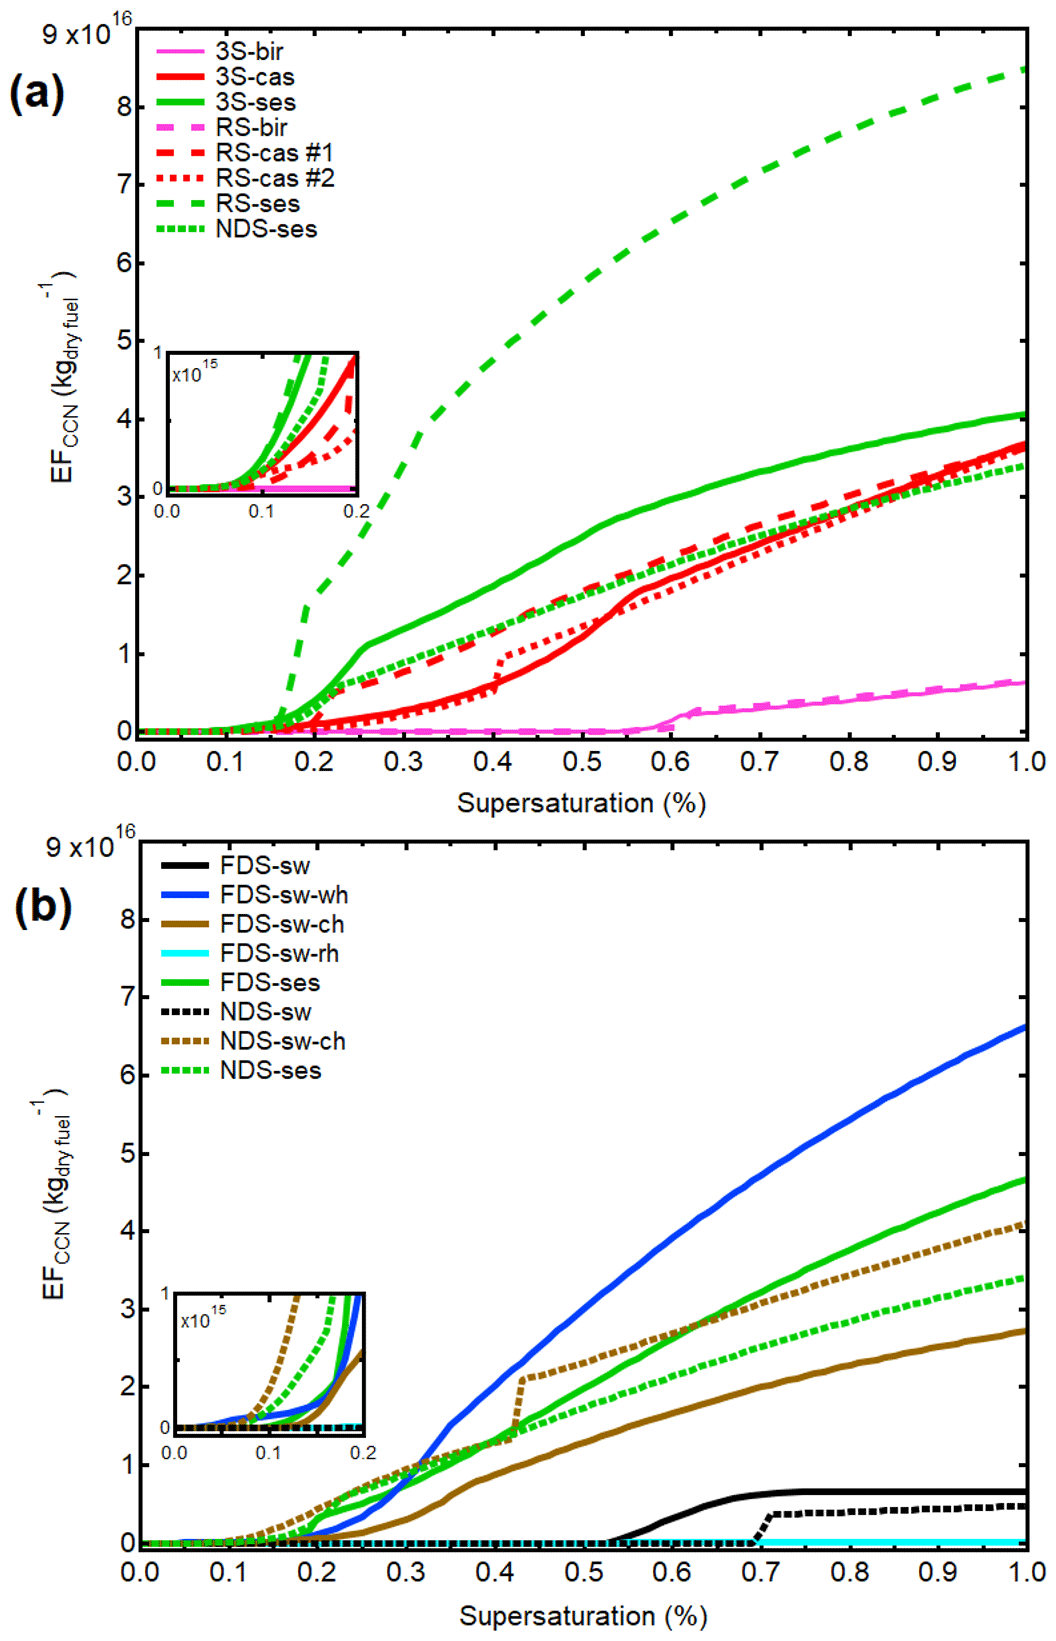
Figure 5Normalised average “primary” CCN emission factors vs. supersaturation for various combinations of stoves and fuels. The curves are inferred from the average particle number size distributions during which the chamber was filled (Fig. 2) combined with the inter- and extrapolated CCN activity, which typically was measured for three (2–4) particle mobility sizes (Fig. 3). The NDS-ses emission factors are included in both (a) and (b) for comparison.
In Fig. 5a, the emission factors for Sesbania pellets (NDS) and Sesbania wood logs (3S, RS) are included. The CCN emission factors for the RS were significantly higher relative to the other stoves, which to some extent is likely to be due to the chamber injections for the RS-ses experiment not being representative of a full combustion cycle as described above. Hence, we do not consider the aerosol emission factors for the RS-ses to be directly comparable to the other experiments. Fresh CCN emission factors for the RS-bir and two different RS-cas experiments are also included in Fig. 5a. There is a significant difference in the CCN activity for 100 nm particles between the two RS-cas experiments, which largely explains the difference in EFCCN observed in the neighbourhood around a supersaturation of 0.3 %. This difference is due to different relative representations of different burning phases during the time period of injection into the chamber. However, the variability in fresh CCN emission factors between the different RS-cas experiments was very modest relative to the differences to the EFCCN for the RS-bir experiment.
For the RS, the CCN emission factors for Sesbania and Casuarina are significantly higher than those for birch. The difference in emitted CCN for the RS-bir relative to the RS-cas and RS-ses experiments exceeds 1 order of magnitude for a significant range of intermediate supersaturations. The differences between CCN emission factors for the same fuel and different stoves appear to be modest compared to the more pronounced differences observed between the different fuels studied. We ascribe the somewhat similar CCN emission factors for the 3S and RS applying the same fuel to the relatively higher CCN activity (κ) for the RS to be compensated for (to some extent) by more organic particulate matter and on average larger particles emitted from the 3S.
In Fig. 5b, primary CCN emission factors vs. supersaturation for the FDS and the NDS and different fuels are shown. These fresh CCN emission factors vary by several orders of magnitude depending on the chemical composition of the fuel. The fuels containing a significant fraction of potassium (ch, wh, ses) led to a larger ultrafine particle mode (Fig. 2b) and also higher κ values, and both of those effects impact the estimated CCN emission factors. The steps observed in some cases (e.g. NDS-sw, NDS-sw-ch) are results of significant particle size ranges activating into cloud droplets over a narrow range of supersaturations due to the strong increase in κ with decreasing Dp in some cases.
The CCN emission factors presented in Fig. 5 appear in general to be highly dependent on the inorganic content and composition of the fuels. The characteristics of the experimental setup related to losses in sampling lines and coagulation (dilution rates) may to some extent influence the inferred CCN emission factors on a quantitative level. A higher degree of coagulation will result in fewer but larger CCN activating at lower supersaturations. However, we consider it highly likely that the qualitative differences between the inferred CCN emission factors will remain consistent for other sampling systems with different losses in sampling lines and coagulation effects. Limitations with respect to simulating atmospherically relevant emission factors are discussed in more detail in the following section. In general, we conclude that the inorganic ash content and composition are very likely to significantly influence the CCN emission factors, with a high fraction of potassium in the fuel resulting in high emissions of CCN. In this context, the stove seems to be of less importance within the investigated conditions.
Table 5CCN activity (κ) and effective density (ρeff) of ∽65 nm secondary particles and ∽200 nm primary and photochemically aged particles. Inferred κ values for secondary-organic-aerosol-dominated particles are included for the three cases observed. The indicated ranges are ±2 standard deviations for the 200 nm primary particles when more than two data points are available, while they represent the full range observed for the photochemically aged particle parameters.
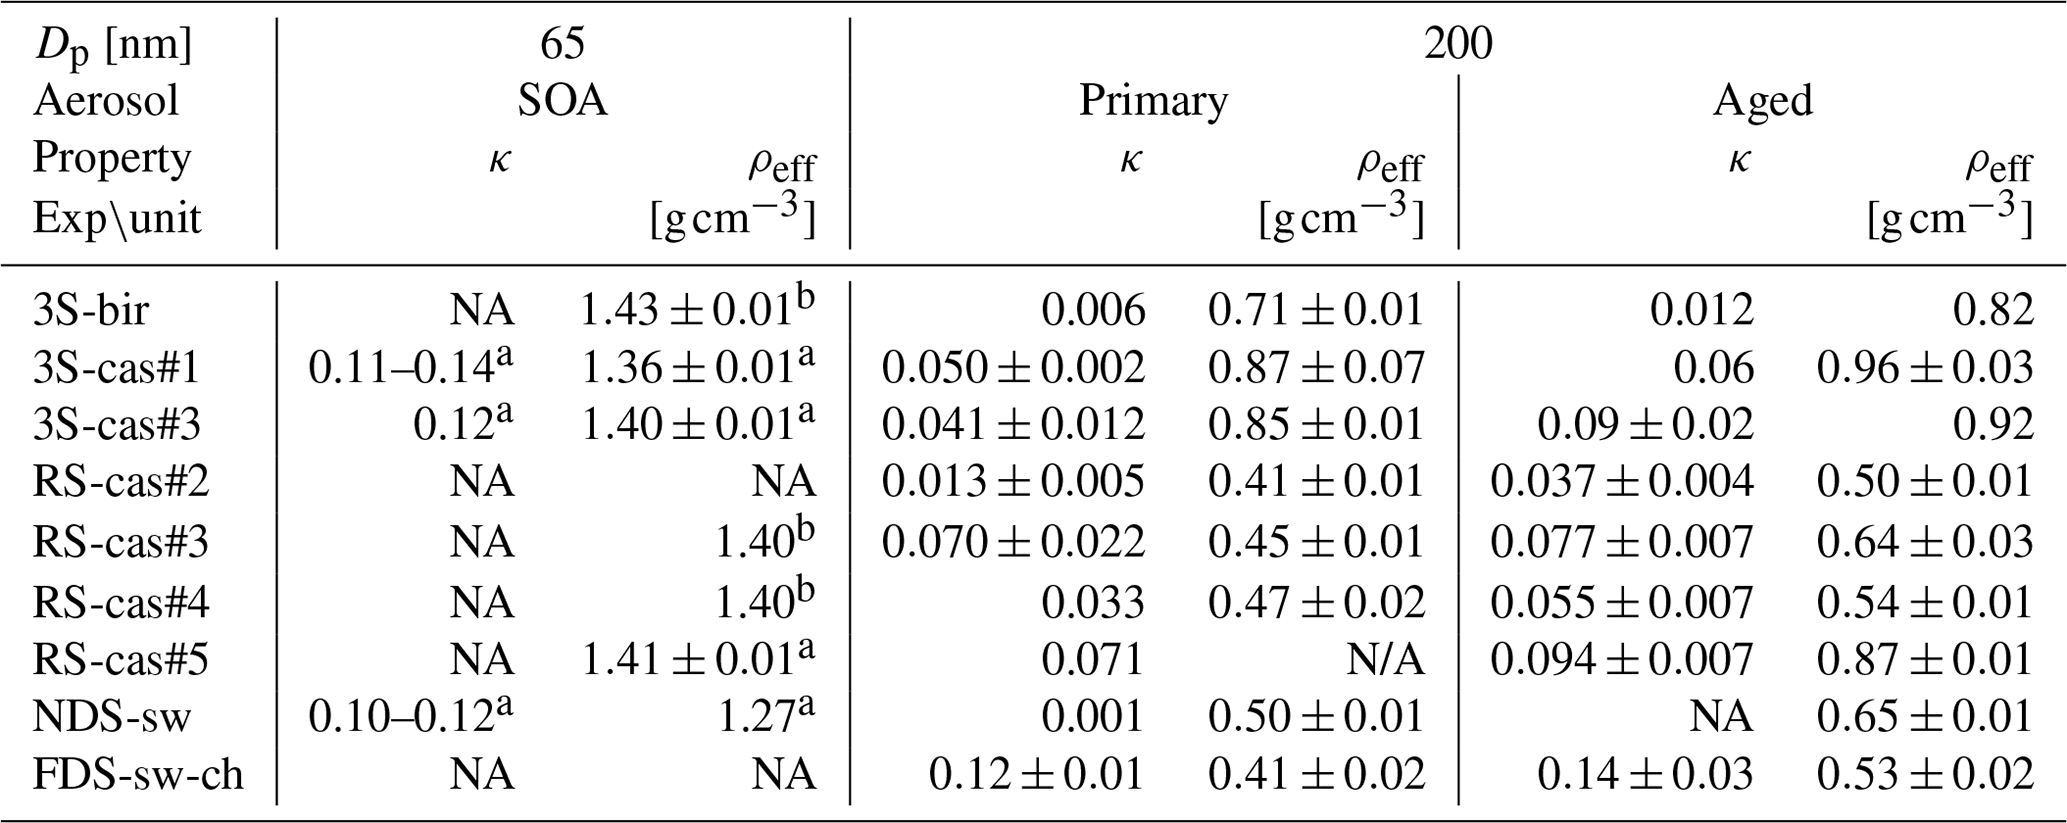
a Dominated by secondary aerosol. b Particles comprised of a mixture of primary and secondary aerosol. NA stands for not available.
4.6 Influence of photochemical ageing on the CCN properties and emission factors
The simulated photochemical ageing resulted in formation of secondary aerosol matter over the entire aerosol population as indicated by the CCN and ρeff results presented in Table 5. Typically, a mode of secondary particles (nucleation mode) appeared in the particle number size distribution. In a few cases, the secondary particles grew large enough to dominate the particle number concentration in a neighbourhood around a mobility diameter of 65 nm. Those cases allowed us to determine the κ values of the secondary particles to 0.11–0.14 and 0.10–0.12 for the 3S-cas and NDS-sw experiments, respectively. Engelhart et al. (2012) similarly reported an average κSOA=0.10 with a standard deviation of 0.02 for a range of simulated wildfire biomass burning emissions and simulated photochemical atmospheric ageing. Our observations are also similar to κ values reported for a wide range of SOA particles (Lambe et al., 2011). Hence, the observed κ values support that the formed secondary aerosol was highly dominated by organic species as also strongly indicated by the measurements of effective density (Table 5) and chemical composition discussed above.
The CCN emission factors may increase due to atmospheric ageing. Four effects may cause such an increase. Condensation of secondary aerosol on pre-existing particles will cause (i) an increase in dry particle size and (ii) potentially an increase in κ. In addition, (iii) oxidation of soot and/or organic species may enhance their CCN activity. Those three effects will shift the CCN population to become active at relatively lower supersaturation, while (iv) new particle formation may increase the number of CCN, most likely in the high supersaturation range. Changes in κ values for the soot mode due to the simulated photochemical ageing are presented in Table 5. An increase in κ from 0.006 to 0.012 (3S-bir) results in a decrease in the SSc for 200 nm particles from 0.54 % to 0.38 % (assuming a temperature similar to that of the upper CCNc column). Similarly, an increase in κ from 0.013 to 0.037 (RS-cas#4) for 200 nm particles leads to a decrease in the SSc from 0.36 % to 0.22 %, while an increase in κ from 0.071 to 0.094 (RS-cas#5) leads to a decrease in the SSc from 0.16 % to 0.14 % for 200 nm particles. These examples illustrate that the effect of atmospheric ageing on the CCN properties is more pronounced when the initial κ is significantly lower than that of the SOA of about 0.1.
We mainly ascribe these changes in κ to the process (ii) listed above due to the combined increase in κ and effective density (Table 5) often associated with little detectable growth in the average soot mode size with the SMPS. In addition, we cannot exclude a minor potential contribution from process (iii). These examples illustrate that atmospheric ageing may increase the emitted concentrations of CCN, depending on the supersaturation the aerosol particles may get exposed to. Basic κ modelling involving SOA condensation onto emitted particles using Eqs. (1) and (2) supports that ageing has a stronger impact on the CCN activity, when the initial κ value is significantly lower than that of SOA, which we often observed for the soot mode.

Figure 6Examples of emission factors of CCN as estimated for the aerosol photochemically aged inside PAM with the unaged emission factors included for comparison. For the 3S-cas PAM experiment, the nucleation particle mode grew large enough to dominate near a mobility diameter of 65 nm, which resulted in an increase in CCN for high supersaturations.
Examples of estimated CCN emission factors for the aged versus the primary aerosol are shown in Fig. 6. The presented aged aerosol emission factors are based on the measured change in κ of the soot mode, while growth of the primary ultrafine mode is expected to have significantly less impact due to its relatively higher initial κ values. In one case, the effect of new particle formation of CCN is also shown (3S-cas), and this mainly affects the CCN concentrations at the very highest supersaturations included. For most other PAM experiments not included in Fig. 6, it was not possible to estimate the isolated effect of ageing on the ultrafine particles with a reasonable certainty due to (i) the nucleation mode not growing large enough for CCN sizes and (ii) coagulation during storage in the aerosol storage chamber.
Our results indicate that the partitioning of the emitted gas-phase secondary particle precursors between (i) the gas-phase, (ii) formation and growth of new particles, and (iii) condensation on different pre-existing particle modes may be of great importance for the total CCN emission factors relevant for real atmospheric conditions. The partitioning of the condensable organic matter is likely to depend upon coagulation (dilution/dispersion), the surrounding ambient aerosol particle population and gas-phase constituents (polluted versus pristine environment) including available oxidants (e.g. solar radiation intensity and daytime vs. nighttime chemistry). It was not possible to estimate the relative importance of such complex parameters in the current study, but the effects are discussed in more detail below.
It is challenging to simulate photochemical ageing of the studied aerosol on a quantitative level. Prior to our flow reactor experiments, the aerosol is transported through a hood and some tubing, which may be representative of the geometry of a chimney, where wall losses and coagulation may influence the aerosol particle population. However, in our experimental setup, significant dilution is introduced at an early stage, making our conditions more representative of open ambient combustion emissions with pronounced aerosol dispersion. Hence, the studied freshly emitted aerosol may be representative of such fresh combustion aerosol emissions in African regions where biomass cookstoves dominate – often operated in the open. Nevertheless, before entering the flow reactor, the aerosol is typically stored for 30–60 min inside the aerosol storage chamber, where particle coagulation in some cases occurs, and where wall losses of ultrafine particles and potentially gases may influence the outcome of the experiment. Inside the flow reactor, the aerosol is exposed to unrealistically high concentrations of OH and O3 for atmospheric conditions – in order to simulate up to several days of photochemical ageing. The high concentrations of oxidants are likely to influence the partitioning of the potential secondary aerosol particle precursors. In addition, wall losses of oxidised gas-phase constituents in the flow reactor may bias the secondary aerosol particulate matter yield low. Furthermore, residential cooking often involves more than just boiling water. Hence, actual cooking will typically result in additional emissions of primary particles and gas-phase constituents potentially relevant for additional formation of secondary aerosol (Zhao et al., 2007). Hence, our estimated total CCN emission factors for the aged aerosol are likely to be biased low relative to expected field observations, at least for the relatively low supersaturations. However, on a qualitative level, they do provide insight into how atmospheric ageing influences the CCN properties.
4.7 CCN versus PM emission factors
The primary PM emission factors from cookstoves have been reported in many previous studies, and ambient PM measurements are available in many regions dominated by residential biomass combustion emissions. In contrast, the CCN emissions from biomass combustion in laboratory and field settings are generally scarce, and it is of high relevance to investigate how CCN emissions relate to PM emissions. The estimated primary CCN versus estimated primary PM0.5 emission factors for the different stoves and fuels are shown for supersaturations of 1.0 % and 0.5 % in Fig. 7a and b, respectively. Those two supersaturations were chosen to represent (i) a high supersaturation of relevance to highly convective clouds and (ii) a supersaturation level where the soot mode in many cases has activated. Before interpreting the relation between emitted CCN and PM presented in Fig. 7, we find it appropriate to discuss how the PM EFs compare to previous findings, as well as potential errors and biases related to the PM.
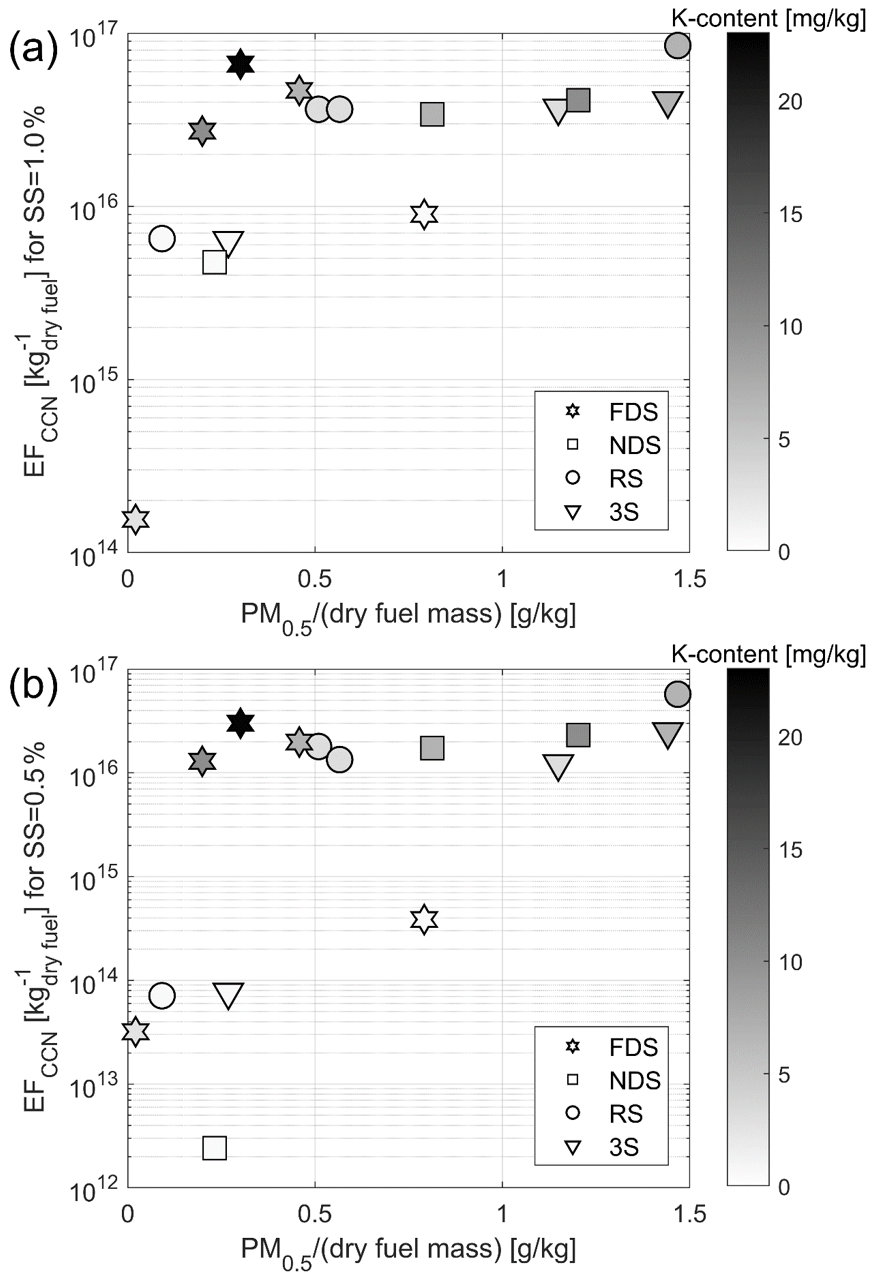
Figure 7Primary emission factors (EFs) of cloud condensation nuclei (CCN) normalised to dry fuel consumption for a supersaturation (SS) of 1.0 % in (a) and 0.5 % in (b), respectively, versus estimated EFs of PM0.5. The colour bar indicates the potassium concentration in the dry fuel. The CCN EFs are presented for a larger range of SS in Fig. 5, and more details about the inorganic composition of the fuels can be found in Table 3. The EFs of PM0.5 are estimated from the particle number size distributions shown in Fig. 2 in conjunction with effective density measurements as presented in Fig. 4. It should be noted that the range of the ordinate differs between the two subfigures.
The estimated primary PM0.5 EFs for the forced-draft stove range from 0.2 to 0.8 with the exception of the FDS-sw-rh with a very low PM0.5 EF of about 0.02 . PM2.5 EFs have for comparable stoves and full water boiling tests been reported to be about 0.4 (Jetter et al., 2012; Champion and Grieshop, 2019) with a significant fraction of the PM emissions being associated with the ignition, refuelling and burnout phases (Champion and Grieshop, 2019), which have been excluded from our experiments. Hence, most of our estimated PM0.5 EFs for the FDS compare well to previous PM2.5 EF observations. We note that our PM0.5 EF for the FDS-sw is biased high due to non-ideal stove operation.
The estimated primary PM0.5 EFs for the RS (0.10–1.47 ) and the 3S (0.27–1.44 ) are somewhat lower than values reported for PM2.5 in previous water boiling test experiments. The lower reported PM2.5 EFs for full water boiling tests were about 1.4 and 1.8 for rocket stoves and the 3S, respectively (Jetter et al., 2012). We ascribe the differences to be due to (i) exclusion of the ignition and end-of-experiment burnout phases in our approach and (ii) to some extent PM emissions potentially being present in the 0.5 to 2.5 µm size range (Just et al., 2013).
It is worth noting that the results shown in Fig. 7 are specific to the experimental setup and procedure, and they are associated with random errors and biases. However, the qualitative and relative comparison between estimated PM and CCN emission factors is in many respects robust in the sense that both parameters are inferred from the same particle number size distribution. Hence, biases and random errors associated with those measurements would in many respects cancel out when comparing the CCN and PM emission factors, with the latter being relatively more sensitive to the very largest particles.
There are three noteworthy outliers in Fig. 7, the FDS-sw-rh, FDS-sw and RS-ses, which are of relevance to discuss before interpretation of the more general features. As discussed above, the FDS-sw experiment produced a pronounced soot mode, which we ascribe to quenching of the flame on the bottom of the pot. Similar experiments carried out at a later stage confirmed that it was possible to operate the FDS-sw without production of a significant soot mode. Optimal operation would lead to a significant reduction in both CCN and PM EFs. The RS-ses experiment represents a chamber filling where the soot mode was over-represented, as discussed above. We carried out a few simple sensitivity tests applying the same κ and ρeff distributions, but with different chamber injection windows representing a full combustion cycle. Those simple tests indicate that the PM0.5 may be biased high by up to 0.5 relative to the other RS and 3S experiments, while the alternatively estimated CCN EFs remained within ±25 % of the data points included in Fig. 7. Finally, the CCN and PM emissions are very low for the FDS-sw-rh experiment despite a significant potassium content in the rh pellets. The inorganic ash of the rh is highly dominated by silicon (Table 3), which may inhibit the aerosolisation of the potassium species, as discussed above (Boström et al., 2011). These three outliers exemplify that the studied emissions can be highly sensitive to the stove operation, the experimental approach and the composition of the fuel, which is discussed in more detail below.
Several interesting qualitative features can be observed in Fig. 7. First we focus on the 3S and RS results. If we take into account that the RS-ses PM EFs are likely biased high, then the PM EFs of the 3S are higher than for the RS applying the same fuel, which is in line with several previous studies (e.g. MacCarty et al., 2010; Jetter et al., 2012). However, the reduction in PM EFs by replacing the 3S with RS does not appear to influence the primary CCN EFs significantly, which seems to be the case for the full range of relevant supersaturations (Fig. 5). The reduction in PM EFs going from the 3S to the RS is likely due to a significant reduction in organic carbon (OC) emissions with a higher combustion temperature, which is also likely to enhance emissions of the more hygroscopic inorganic species. Those two effects largely appear to cancel out with respect to the emitted CCN, for which a significantly lower organic fraction in the soot mode may be compensated for by a relatively small addition of inorganic hygroscopic species.
Another interesting feature related to the 3S and RS results is a clear trend of increased CCN and PM EFs with increasing concentration of potassium in the dry fuel. As discussed above for the FDS-sw-rh, the emissions may not depend on the absolute potassium concentration in the fuel alone, so it would be highly interesting to further investigate how robust the observed trend is. Our findings indicate that it may be possible to reduce PM and particle number emissions very significantly by applying a low-potassium-content fuel, which is worth considering from a health perspective. Nevertheless, our observations are not suited for a full assessment of such potential health benefits, since we have not included ignition and end-of-experiment burn-out phases. In addition, we have no quantitative measurements of the potential contribution of secondary aerosol emissions. If atmospheric ageing is considered, we would expect the PM EFs of the 3S to increase relatively more than they would for the RS applying the same fuel (Reece et al., 2017), but it is less clear to which extent the secondary aerosol formation from atmospheric ageing may be influenced by the choice of fuel.
The PM EFs can be reduced significantly when replacing the NDS with the FDS applying the same fuel assuming optimal stove operation, which is in line with previously reported results (e.g. Jetter et al., 2012). The PM EF reduction is likely due to (i) reduced OC and/or (ii) EC emissions. However, again it is worth noting that this reduction in PM emissions may not be associated with a reduction in CCN emissions. The FDS experiments applying sw-ch, sw-wh and ses are all associated with modest PM EFs and some of the highest CCN EFs, which again illustrates that improved stove technology may not necessarily reduce the primary CCN emissions. However, with the very low FDS-sw-rh CCN and PM EFs in mind, it seems like the inorganic composition of the fuel can be of great importance. There is room for further studies in that context considering fuel efficiency, availability and sustainability.
In general, it would be useful if the CCN EFs could be directly linked to the PM EFs. It may be possible to provide an empirical relation between CCN and PM EFs for the 3S or the RS depending on the inorganic content of the fuel, but more experiments are needed to fully shed light on that. However, it seems impossible to link a given single measurement of PM originating from cookstove emissions to a given CCN concentration with high certainty unless further physico-chemical aerosol properties are provided. For example, similar PM emissions can be observed for the FDS-sw-wh and NDS-sw in Fig. 7b with a difference in CCN emission factors of 4 orders of magnitude for an SS=0.5 %. However, in those two cases, we would expect the chemical composition of the PM to differ significantly (pronounced potassium levels versus dominance of EC and possibly OC), so information about the chemical composition of the PM (or the fuel) is likely to significantly improve the ability to estimate the CCN population from the emitted PM. Our results indicate that potassium is likely to play a key role in that context.
There are a few additional implications and perspectives related to our observations. It seems highly likely that CCN emission factors from wildfires also will depend highly on the potassium content in the fuel – and potentially the content of other inorganic-aerosol-forming elements. So we speculate that significant spatial differences can be expected for wildfire CCN EFs depending on the chemical composition of the biomass burning.
When assessing the health impact of aerosol particles, it is of relevance to know whether the particles grow hygroscopically inside the respiratory tract with a high RH level, as it will influence particle deposition and dilution (Löndahl et al., 2007, 2008). Our observations indicate that the ultrafine particles with moderate to high κ values are likely to grow hygroscopically in the respiratory tract as previously shown for biomass combustion aerosol (Löndahl et al., 2008), whilst there may be soot particles with the very lowest κ values, which may not show significant hygroscopic growth in the respiratory tract. Our observations indicate that the content of potassium in the fuel as well as combustion temperature will influence the hygroscopicity of the soot particles. However, further hygroscopicity studies at relevant RHs are needed for any firm conclusions in that respect.
The CCN properties of aerosol emissions from various combinations of four different cookstoves and seven different solid biomass fuels have been investigated. The average particle number size distributions were by number dominated by an ultrafine mode in all cases, and a varying soot mode was present and centred near a mobility diameter of ∽150 nm. The CCN activity (κ) and the particle effective density both decreased with increasing particle size for any of the primary aerosol emissions studied. For the ultrafine mode, the κ values ranged from ∽0.1 to ∽0.8, and for the soot mode, κ ranged from ∽0.001 to ∽0.15.
The aerosol properties and CCN activity varied significantly depending on the fuel and the stove. There was a tendency of higher κ with improved stove technology and increasing combustion temperature for the ultrafine particles from combustion of birch, Casuarina and Sesbania wood logs. This is most likely due to a higher inorganic-to-organic fraction in the ultrafine aerosol particles for higher combustion temperature. An increase in combustion temperature most likely reduced the absolute emissions of primary organic aerosol, while higher temperatures were also likely to enhance the absolute emissions of alkali salts. In general, higher potassium ash concentration was associated with higher κ values for the studied fuels.
The estimated primary CCN emission factors were found to vary substantially depending on the fuel composition, while the stove appeared to have a less pronounced influence. Simulated photochemical ageing led to formation of secondary aerosol most likely dominated by organic compounds. The secondary aerosol condensing onto the soot particles increased the concentration of CCN for low supersaturations mainly due to an increase in κ. In addition, new particle formation and growth potentially increased the CCN concentration for relatively high supersaturations. The secondary aerosol mode had an effective density of about 1.4 g cm−3 and a κ of about 0.1, which are typical values for secondary organic aerosol.
Primary PM0.5 emission factors were estimated and found to increase with increasing potassium content for the rocket stove and the three-stone stove. The estimated PM0.5 emission factors typically decreased with improved stove technology (increasing combustion temperature) for a given fuel, while the primary CCN emission factors appeared relatively unaffected by improved stove technology. The reduction in PM emissions with improved stove technology was mainly associated with reduced emissions of organic and elemental carbon. From a CCN emission perspective, the reduced PM emissions were compensated for by elevated emissions of more hygroscopic alkali salts for a given fuel. A given PM emission level can be associated with orders of magnitude difference in CCN emission factors for a given supersaturation depending on the fuel and the stove. Hence, it appears challenging to parameterise CCN emissions from the PM emissions from cookstoves without more detailed physico-chemical information about the aerosol particles. Our results indicate that it is critical to know about the inorganic fuel composition in order to estimate properties related to the emitted aerosol population and associated CCN properties.
Overall, we observed high potential to significantly reduce primary PM0.5 emissions from biomass cookstoves by (i) applying fuels with low levels of inorganic compounds potentially entering the aerosol phase, (ii) improved stove technology and (iii) optimal stove operation. Reduced PM and soot emissions are motivated from health and climate perspectives. However, our study indicates that biomass-fired cookstoves may comprise a very significant and underestimated source of CCN, and substantial reductions of such CCN emissions may potentially lead to warming effects on climate depending on the prevailing meteorological conditions and importance relative to other significant CCN sources. Our study indicates that with the right combination of stove and fuel, it is possible to significantly reduce the soot and PM emissions while maintaining pronounced emissions of highly hygroscopic ultrafine particles – depending on the fuel. However, stove costs, infrastructures and fuel quality, availability, and sustainability have to be considered in the overall guidelines towards improved cookstoves.
The observed strong impact of potassium on CCN emissions for a wide range of combustion conditions is likely to be of relevance not only to cookstoves but also to a wider range of biomass combustion including wildfires.
All presented data can be requested from the corresponding author Thomas Bjerring Kristensen or Joakim Pagels (joakim.pagels@design.lth.se).
RL, CB, JP and BS designed the majority of the experiments. RL, RLC and CB collected and prepared the fuels and were responsible for the combustion aspects. TBK, JF, RL, CA, VBM, ACE, KK, JP and BS carried out the aerosol measurements. The majority of the presented aerosol data analysis was carried out by TBK and JF. All authors were involved in the interpretation of results and contributed with revisions of the manuscript. The manuscript was drafted by TBK.
The authors declare that they have no conflict of interest.
We thank Andrew Grieshop, Erik S. Thomson, Pontus Roldin and Roland Schrödner for scientific discussions and input. We thank the anonymous reviewers for their comments and suggestions.
This research has been supported by the Swedish research councils, VR (grant nos. 2017-05016 and 2018-04200) and Formas (grant nos. 2015-992, 2015-1385, and 2013-1023), the Kempestiftelserna (grant no. JCK-1516), and Centre for Environmental and Marine Studies, University of Aveiro (grant nos. UIDP/50017/2020 and UIDB/50017/2020). In addition, we acknowledge support from the national strategic research areas MERGE at Lund University and Bio4Energy at Umeå University.
This paper was edited by Paul Zieger and reviewed by two anonymous referees.
Albrecht, B. A.: Aerosols, Cloud Microphysics, and Fractional Cloudiness, Science, 245, 1227–1230, https://doi.org/10.1126/science.245.4923.1227, 1989. a
Andreae, M. O.: Emission of trace gases and aerosols from biomass burning – an updated assessment, Atmos. Chem. Phys., 19, 8523–8546, https://doi.org/10.5194/acp-19-8523-2019, 2019. a
Asa-Awuku, A., Engelhart, G. J., Lee, B. H., Pandis, S. N., and Nenes, A.: Relating CCN activity, volatility, and droplet growth kinetics of β-caryophyllene secondary organic aerosol, Atmos. Chem. Phys., 9, 795–812, https://doi.org/10.5194/acp-9-795-2009, 2009. a
Bølling, A. K., Pagels, J., Yttri, K. E., Barregard, L., Sallsten, G., Schwarze, P. E., and Boman, C.: Health effects of residential wood smoke particles: the importance of combustion conditions and physicochemical particle properties, Part. Fibre Toxicol., 6, 29, 2009. a, b
Boman, C., Nordin, A., Boström, D., and Öhman, M.: Characterization of inorganic particulate matter from residential combustion of pelletized biomass fuels, Energ. Fuel., 18, 338–348, 2004. a
Bond, T., Venkataraman, C., and Masera, O.: Global atmospheric impacts of residential fuels, Energy Sustain. Dev., 8, 20–32, 2004. a
Boström, D., Skoglund, N., Grimm, A., Boman, C., Ohman, M., Brostrom, M., and Backman, R.: Ash transformation chemistry during combustion of biomass, Energ. Fuel., 26, 85–93, 2011. a, b, c, d, e
Carrico, C. M., Petters, M. D., Kreidenweis, S. M., Sullivan, A. P., McMeeking, G. R., Levin, E. J. T., Engling, G., Malm, W. C., and Collett Jr., J. L.: Water uptake and chemical composition of fresh aerosols generated in open burning of biomass, Atmos. Chem. Phys., 10, 5165–5178, https://doi.org/10.5194/acp-10-5165-2010, 2010. a, b, c
Champion, W. M. and Grieshop, A. P.: Pellet-fed gasifier stoves approach gas-stove like performance during in-home use in Rwanda, Environ. Sci. Technol., 53, 6570–6579, 2019. a, b
Crutzen, P. J. and Andreae, M. O.: Biomass burning in the tropics: Impact on atmospheric chemistry and biogeochemical cycles, Science, 250, 1669–1679, 1990. a
DeCarlo, P. F., Kimmel, J. R., Trimborn, A., Northway, M. J., Jayne, J. T., Aiken, A. C., Gonin, M., Fuhrer, K., Horvath, T., Docherty, K. S., Worsnop, D. R., and Jimenez, J. L.: Field-deployable, high-resolution, time-of-flight aerosol mass spectrometer, Anal. Chem., 78, 8281–8289, 2006. a
Engelhart, G. J., Hennigan, C. J., Miracolo, M. A., Robinson, A. L., and Pandis, S. N.: Cloud condensation nuclei activity of fresh primary and aged biomass burning aerosol, Atmos. Chem. Phys., 12, 7285–7293, https://doi.org/10.5194/acp-12-7285-2012, 2012. a, b, c, d, e, f, g, h
Fernandes, S. D., Trautmann, N. M., Streets, D. G., Roden, C. A., and Bond, T. C.: Global biofuel use, 1850–2000, Global Biogeochem. Cy., 21, GB2019, https://doi.org/10.1029/2006GB002836, 2007. a
Frosch, M., Prisle, N. L., Bilde, M., Varga, Z., and Kiss, G.: Joint effect of organic acids and inorganic salts on cloud droplet activation, Atmos. Chem. Phys., 11, 3895–3911, https://doi.org/10.5194/acp-11-3895-2011, 2011. a
Fullerton, D. G., Bruce, N., and Gordon, S. B.: Indoor air pollution from biomass fuel smoke is a major health concern in the developing world, T. Roy. Soc. Trop. Med. H., 102, 843–851, 2008. a
Gaudichet, A., Echalar, F., Chatenet, B., Quisefit, J., Malingre, G., Cachier, H., Buat-Menard, P., Artaxo, P., and Maenhaut, W.: Trace elements in tropical African savanna biomass burning aerosols, J. Atmos. Chem., 22, 19–39, 1995. a, b, c
Hennigan, C. J., Westervelt, D. M., Riipinen, I., Engelhart, G. J., Lee, T., Collett, J. L., Pandis, S. N., Adams, P. J., and Robinson, A. L.: New particle formation and growth in biomass burning plumes: An important source of cloud condensation nuclei, Geophys. Res. Lett., 39, L09805, https://doi.org/10.1029/2012GL050930, 2012. a
Herenz, P., Wex, H., Henning, S., Kristensen, T. B., Rubach, F., Roth, A., Borrmann, S., Bozem, H., Schulz, H., and Stratmann, F.: Measurements of aerosol and CCN properties in the Mackenzie River delta (Canadian Arctic) during spring–summer transition in May 2014, Atmos. Chem. Phys., 18, 4477–4496, https://doi.org/10.5194/acp-18-4477-2018, 2018. a
Huang, Y., Unger, N., Storelvmo, T., Harper, K., Zheng, Y., and Heyes, C.: Global radiative effects of solid fuel cookstove aerosol emissions, Atmos. Chem. Phys., 18, 5219–5233, https://doi.org/10.5194/acp-18-5219-2018, 2018. a
Jetter, J., Zhao, Y., Smith, K. R., Khan, B., Yelverton, T., DeCarlo, P., and Hays, M. D.: Pollutant emissions and energy efficiency under controlled conditions for household biomass cookstoves and implications for metrics useful in setting international test standards, Environ. Sci. Technol., 46, 10827–10834, 2012. a, b, c, d
Jetter, J. J. and Kariher, P.: Solid-fuel household cook stoves: Characterization of performance and emissions, Biomass Bioenerg., 33, 294–305, 2009. a, b
Joeller, M., Brunner, T., and Obernberger, I.: Modeling of aerosol formation during biomass combustion in grate furnaces and comparison with measurements, Energ. Fuel., 19, 311–323, 2005. a
Just, B., Rogak, S., and Kandlikar, M.: Characterization of ultrafine particulate matter from traditional and improved biomass cookstoves, Environ. Sci. Technol., 47, 3506–3512, 2013. a, b, c
Kang, E., Root, M. J., Toohey, D. W., and Brune, W. H.: Introducing the concept of Potential Aerosol Mass (PAM), Atmos. Chem. Phys., 7, 5727–5744, https://doi.org/10.5194/acp-7-5727-2007, 2007. a
Kaufman, Y. J. and Fraser, R. S.: The effect of smoke particles on clouds and climate forcing, Science, 277, 1636–1639, 1997. a
Korhonen, K., Kristensen, T. B., Falk, J., Lindgren, R., Andersen, C., Carvalho, R. L., Malmborg, V., Eriksson, A., Boman, C., Pagels, J., Svenningsson, B., Komppula, M., Lehtinen, K. E. J., and Virtanen, A.: Ice-nucleating ability of particulate emissions from solid-biomass-fired cookstoves: an experimental study, Atmos. Chem. Phys., 20, 4951–4968, https://doi.org/10.5194/acp-20-4951-2020, 2020. a, b, c
Kostenidou, E., Pathak, R. K., and Pandis, S. N.: An algorithm for the calculation of secondary organic aerosol density combining AMS and SMPS data, Aerosol Sci. Technol., 41, 1002–1010, 2007. a
Kristensen, T. B., Wex, H., Nekat, B., Nøjgaard, J. K., van Pinxteren, D., Lowenthal, D. H., Mazzoleni, L. R., Dieckmann, K., Koch, C. B., Mentel, T. F., Herrmann, H., Hallar, A. G., Stratmann, F., and Bilde, M.: Hygroscopic growth and CCN activity of HULIS from different environments, J. Geophys. Res., 117, D22203, https://doi.org/10.1029/2012JD018249, 2012. a
Kristensen, T. B., Prisle, N. L., and Bilde, M.: Cloud droplet activation of mixed model HULIS and NaCl particles: Experimental results and κ–Köhler theory, Atmos. Res., 137, 167–175, 2014. a
Kumar, P., Nenes, A., and Sokolik, I. N.: Importance of adsorption for CCN activity and hygroscopic properties of mineral dust aerosol, Geophys. Res. Lett., 36, L24804, https://doi.org/10.1029/2009GL040827, 2009. a, b
Kuwata, M., Zorn, S. R., and Martin, S. T.: Using elemental ratios to predict the density of organic material composed of carbon, hydrogen, and oxygen, Environ. Sci. Technol., 46, 787–794, 2011. a
Lambe, A. T., Onasch, T. B., Massoli, P., Croasdale, D. R., Wright, J. P., Ahern, A. T., Williams, L. R., Worsnop, D. R., Brune, W. H., and Davidovits, P.: Laboratory studies of the chemical composition and cloud condensation nuclei (CCN) activity of secondary organic aerosol (SOA) and oxidized primary organic aerosol (OPOA), Atmos. Chem. Phys., 11, 8913–8928, https://doi.org/10.5194/acp-11-8913-2011, 2011. a
Lamberg, H., Nuutinen, K., Tissari, J., Ruusunen, J., Yli-Pirilä, P., Sippula, O., Tapanainen, M., Jalava, P., Makkonen, U., Teinilä, K., Saarnio, K., Hillamo, R., Hirvonen, M.-R., and Jokiniemi, J.: Physicochemical characterization of fine particles from small-scale wood combustion, Atmos. Environ., 45, 7635–7643, 2011. a
Li, J., Pósfai, M., Hobbs, P. V., and Buseck, P. R.: Individual aerosol particles from biomass burning in southern Africa: 2, Compositions and aging of inorganic particles, J. Geophys. Res., 108, 8484, https://doi.org/10.1029/2002JD002310, 2003. a, b
Li, R., Palm, B. B., Ortega, A. M., Hlywiak, J., Hu, W., Peng, Z., Day, D. A., Knote, C., Brune, W. H., de Gouw, J. A., and Jimenez, J. L.: Modeling the radical chemistry in an oxidation flow reactor: Radical formation and recycling, sensitivities, and the OH exposure estimation equation, J. Phys. Chem. A, 119, 4418–4432, 2015. a
Löndahl, J., Massling, A., Pagels, J., Swietlicki, E., Vaclavik, E., and Loft, S.: Size-resolved respiratory-tract deposition of fine and ultrafine hydrophobic and hygroscopic aerosol particles during rest and exercise, Inhal. Toxicol., 19, 109–116, 2007. a
Löndahl, J., Pagels, J., Boman, C., Swietlicki, E., Massling, A., Rissler, J., Blomberg, A., Bohgard, M., and Sandström, T.: Deposition of biomass combustion aerosol particles in the human respiratory tract, Inhal. Toxicol., 20, 923–933, 2008. a, b
Ludwig, J., Marufu, L., Huber, B., Andreae, M., and Helas, G.: Domestic combustion of biomass fuels in developing countries: A major source of atmospheric pollutants, J. Atmos. Chem., 44, 23–37, 2003. a, b
MacCarty, N., Still, D., and Ogle, D.: Fuel use and emissions performance of fifty cooking stoves in the laboratory and related benchmarks of performance, Energy Sustain. Dev., 14, 161–171, 2010. a, b, c
Martin, M., Tritscher, T., Juranyi, Z., Heringa, M. F., Sierau, B., Weingartner, E., Chirico, R., Gysel, M., Prévôt, A. S., Baltensperger, U., and Lohmann, U.: Hygroscopic properties of fresh and aged wood burning particles, J. Aerosol Sci., 56, 15–29, 2013. a, b
Martinsson, J., Eriksson, A., Nielsen, I. E., Malmborg, V. B., Ahlberg, E., Andersen, C., Lindgren, R., Nystrom, R., Nordin, E., Brune, W., Svenningsson, B., Swietlicki, E., Boman, C., and Pagels, J. H.: Impacts of combustion conditions and photochemical processing on the light absorption of biomass combustion aerosol, Environ. Sci. Technol., 49, 14663–14671, 2015. a
Mena, F., Bond, T. C., and Riemer, N.: Plume-exit modeling to determine cloud condensation nuclei activity of aerosols from residential biofuel combustion, Atmos. Chem. Phys., 17, 9399–9415, https://doi.org/10.5194/acp-17-9399-2017, 2017. a
Mitchell, E., Ting, Y., Allan, J., Lea-Langton, A., Spracklen, D., McFiggans, G., Coe, H., Routledge, M., Williams, A., and Jones, J. M.: Pollutant emissions from improved cookstoves of the type used in sub-Saharan Africa, Combust. Sci. Technol., 1–21, https://doi.org/10.1080/00102202.2019.1614922, 2019. a
Moore, R. and Nenes, A.: Scanning flow CCN analysis – a method for fast measurements of CCN spectra, Aerosol Sci. Technol., 43, 1192–1207, 2009. a
Nakao, S., Tang, P., Tang, X., Clark, C. H., Qi, L., Seo, E., Asa-Awuku, A., and Cocker III, D.: Density and elemental ratios of secondary organic aerosol: Application of a density prediction method, Atmos. Environ., 68, 273–277, 2013. a
Obaidullah, M., Bram, S., Verma, V., and De Ruyck, J.: A review on particle emissions from small scale biomass combustion, Int. J. Renew. Energy Res., 2, 147–159, 2012. a
Obernberger, I., Brunner, T., and Bärnthaler, G.: Chemical properties of solid biofuels-significance and impact, Biomass Bioenerg., 30, 973–982, 2006. a, b
Onasch, T., Trimborn, A., Fortner, E., Jayne, J., Kok, G., Williams, L., Davidovits, P., and Worsnop, D.: Soot particle aerosol mass spectrometer: development, validation, and initial application, Aerosol Sci. Technol., 46, 804–817, 2012. a
Penner, J. E., Dickinson, R. E., and O'Neill, C. A.: Effects of aerosol from biomass burning on the global radiation budget, Science, 256, 1432–1435, 1992. a, b
Petters, M. D. and Kreidenweis, S. M.: A single parameter representation of hygroscopic growth and cloud condensation nucleus activity, Atmos. Chem. Phys., 7, 1961–1971, https://doi.org/10.5194/acp-7-1961-2007, 2007. a, b, c, d
Petters, M. D., Carrico, C. M., Kreidenweis, S. M., Prenni, A. J., DeMott, P. J., Collett, J. L., and Moosmueller, H.: Cloud condensation nucleation activity of biomass burning aerosol, J. Geophys. Res., 114, D22205, https://doi.org/10.1029/2009JD012353, 2009. a, b, c, d, e
Reavell, K., Hands, T., and Collings, N.: A fast response particulate spectrometer for combustion aerosols, SAE Transactions, 111, 1338–1344, 2002. a
Reece, S. M., Sinha, A., and Grieshop, A. P.: Primary and photochemically aged aerosol emissions from biomass cookstoves: chemical and physical characterization, Environ. Sci. Technol., 51, 9379–9390, 2017. a, b, c, d, e
Rissler, J., Pagels, J., Swietlicki, E., Wierzbicka, A., Strand, M., Lillieblad, L., Sanati, M., and Bohgard, M.: Hygroscopic behavior of aerosol particles emitted from biomass fired grate boilers, Aerosol Sci. Technol., 39, 919–930, 2005. a, b
Rissler, J., Messing, M. E., Malik, A. I., Nilsson, P. T., Nordin, E. Z., Bohgard, M., Sanati, M., and Pagels, J. H.: Effective density characterization of soot agglomerates from various sources and comparison to aggregation theory, Aerosol Sci. Technol., 47, 792–805, 2013. a, b, c, d
Shantz, N. C., Leaitch, W. R., Phinney, L., Mozurkewich, M., and Toom-Sauntry, D.: The effect of organic compounds on the growth rate of cloud droplets in marine and forest settings, Atmos. Chem. Phys., 8, 5869–5887, https://doi.org/10.5194/acp-8-5869-2008, 2008. a
Shen, G., Gaddam, C. K., Ebersviller, S. M., Vander Wal, R. L., Williams, C., Faircloth, J. W., Jetter, J. J., and Hays, M. D.: A laboratory comparison of emission factors, number size distributions, and morphology of ultrafine particles from 11 different household cookstove-fuel systems, Environ. Sci. Technol., 51, 6522–6532, 2017. a
Silva, P. J., Liu, D.-Y., Noble, C. A., and Prather, K. A.: Size and chemical characterization of individual particles resulting from biomass burning of local Southern California species, Environ. Sci. Technol., 33, 3068–3076, 1999. a
Slade, J. H., Thalman, R., Wang, J., and Knopf, D. A.: Chemical aging of single and multicomponent biomass burning aerosol surrogate particles by OH: implications for cloud condensation nucleus activity, Atmos. Chem. Phys., 15, 10183–10201, https://doi.org/10.5194/acp-15-10183-2015, 2015. a
Sullivan, R. C., Moore, M. J. K., Petters, M. D., Kreidenweis, S. M., Roberts, G. C., and Prather, K. A.: Effect of chemical mixing state on the hygroscopicity and cloud nucleation properties of calcium mineral dust particles, Atmos. Chem. Phys., 9, 3303–3316, https://doi.org/10.5194/acp-9-3303-2009, 2009. a, b, c, d
Symonds, J. P., Reavell, K. S. J., Olfert, J. S., Campbell, B. W., and Swift, S. J.: Diesel soot mass calculation in real-time with a differential mobility spectrometer, J. Aerosol Sci., 38, 52–68, 2007. a
Torvela, T., Tissari, J., Sippula, O., Kaivosoja, T., Leskinen, J., Virén, A., Lähde, A., and Jokiniemi, J.: Effect of wood combustion conditions on the morphology of freshly emitted fine particles, Atmos. Environ., 87, 65–76, 2014. a
Wittbom, C., Eriksson, A. C., Rissler, J., Carlsson, J. E., Roldin, P., Nordin, E. Z., Nilsson, P. T., Swietlicki, E., Pagels, J. H., and Svenningsson, B.: Cloud droplet activity changes of soot aerosol upon smog chamber ageing, Atmos. Chem. Phys., 14, 9831–9854, https://doi.org/10.5194/acp-14-9831-2014, 2014. a, b, c, d, e, f, g
Zhao, Y., Hu, M., Slanina, S., and Zhang, Y.: Chemical compositions of fine particulate organic matter emitted from Chinese cooking, Environ. Sci. Technol., 41, 99–105, 2007. a