the Creative Commons Attribution 4.0 License.
the Creative Commons Attribution 4.0 License.
 | 20 Jan 2021
Size-resolved aerosol pH over Europe during summer
Stylianos Kakavas
David Patoulias
Maria Zakoura
Athanasios Nenes
Spyros N. Pandis
The dependence of aerosol acidity on particle size, location, and altitude over Europe during a summertime period is investigated using the hybrid version of aerosol dynamics in the chemical transport model PMCAMx. The pH changes more with particle size in northern and southern Europe owing to the enhanced presence of non-volatile cations (Na, Ca, K, Mg) in the larger particles. Differences of up to 1–4 pH units are predicted between sub- and supermicron particles, while the average pH of PM1−2.5 can be as much as 1 unit higher than that of PM1. Most aerosol water over continental Europe is associated with PM1, while coarse particles dominate the water content in the marine and coastal areas due to the relatively higher levels of hygroscopic sea salt. Particles of all sizes become increasingly acidic with altitude (0.5–2.5 units pH decrease over 2.5 km) primarily because of the decrease in aerosol liquid water content (driven by humidity changes) with height. Inorganic nitrate is strongly affected by aerosol pH with the highest average nitrate levels predicted for the PM1−5 range and over locations where the pH exceeds 3. Dust tends to increase aerosol pH for all particle sizes and nitrate concentrations for supermicron range particles. This effect of dust is quite sensitive to its calcium content. The size-dependent pH differences carry important implications for pH-sensitive processes in the aerosol.
- Article
(5080 KB) - Full-text XML
-
Supplement
(1516 KB) - BibTeX
- EndNote


Acidity is an aerosol property of central importance driving gas–particle partitioning and heterogeneous chemistry (Pye et al., 2020). pH affects the formation of semi-volatile particulate matter and the nitrogen cycle by modulating HNO3– and NH3– gas–particle partitioning (Meskhidze et al., 2003; Guo et al., 2017; Nenes et al., 2020). Aerosol acidity can influence pH-dependent heterogeneous atmospheric processes, like oxidation of SO2 to sulfate, formation of secondary organic aerosol, and uptake of N2O5 on particles (Huang et al., 2011), and also influences aerosol hygroscopicity (Hu et al., 2014). Deposition of acidic particles causes damage to building materials, forests, and aquatic ecosystems (Xue et al., 2011). Aerosol pH can change the solubility of metals, such as iron and copper, which have been linked to aerosol toxicity, and at the same time affects nutrient distributions with impacts on photosynthesis productivity and ocean oxygen levels (Meskhidze et al., 2003; Nenes et al., 2011). Adverse health outcomes have been linked to aerosol acidity, including respiratory diseases (Raizenne et al., 1996), oxidative stress (Fang et al., 2017), and lung and laryngeal cancers (Hsu et al., 2008).
The nitrate partitioning to the aerosol phase is favored when pH exceeds a threshold value (between 1.5 and 3) that depends logarithmically on liquid water content and temperature (Meskhidze et al., 2003; Guo et al., 2016; Nenes et al., 2020). If aerosol pH is high enough (typically above 2.5 to 3), aerosol nitrate formation is favored, as most of the total nitrate formed from NOx chemistry resides in the aerosol phase. For lower pH values (below 1.5 to 2), formation of aerosol nitrate is not favored and remains in the gas phase as HNO3. Between these pH value limits, a sensitivity window (of 1 to 1.5 pH units) exists in which nitrate can be found either as gas or as aerosol (Vasilakos et al., 2018; Nenes et al., 2020). Atmospheric aerosol often has pH values inside this sensitivity window, for which pH errors could translate to important biases in aerosol composition (Bougiatioti et al., 2016; Guo et al., 2015, 2017; Vasilakos et al., 2018).
Aerosol acidity and partitioning of semi-volatile species, like nitrate, can be modulated by the presence of soluble inorganic cations of sea salt and mineral dust, such as Na+, K+, Ca2+, and Mg2+ (Vasilakos et al., 2018). These non-volatile cations (NVCs) tend to reside in the coarse mode of ambient aerosol (sea salt, dust), with much lower concentration in smaller particles (Seinfeld and Pandis, 2006). Chemical transport models tend to overpredict aerosol inorganic nitrate levels in both the US and Europe (Yu et al., 2005; Pye et al., 2009; Fountoukis et al., 2011; Tuccella et al., 2012; Heald et al., 2012; Walker et al., 2012; Im et al., 2015; Ciarelli et al., 2016; Bian et al., 2017; Zakoura and Pandis, 2018). One of the reasons for these errors is that these models do not properly simulate the aerosol acidity, introducing errors in gas–particle partitioning of semi-volatile species, often affecting predictions of inorganic nitrate (Vasilakos et al., 2018).
The effect of amines and organic acids on pH is usually neglected in efforts to simulate aerosol pH (Pye et al., 2020). In areas with high organic aerosol concentrations and relatively low inorganic ion levels, organics could play a non-negligible role in determining particle pH (Bougiatioti et al., 2016). The aerosol pH has been estimated by combining field measurements and aerosol thermodynamic models. Katoshevski et al. (1999) predicted that the pH of the submicrometer marine aerosol is several units lower than that of the supermicrometer particles. pH was estimated to be 0 to 2 for the accumulation mode and 2–5 for the coarse mode particles using aerosol and gas phase data collected over the Southern Ocean in combination with the EQUISOLV II model (Fridlind and Jacobson, 2000). Keene et al. (2004) calculated mean pH, ranging from 2.6 to 3.9, for 0.75–25 µm particles based on measurements by an impactor for aerosols and Teflon filters for gases in New England during summer. PM2.5 pH was calculated with ISORROPIA II in Beijing during all seasons in 2016/17 with values ranging from 3.8 to 4.5 (Ding et al., 2019). Guo et al. (2015) estimated that PM1 particle pH varied from 0.5 to 2 in the summer and 1 to 3 in the winter in the southeastern US. PM1 pH was estimated for the northeastern US and its mean value was 0.77 (Guo et al., 2016). PM2.5 pH values of 0–2 were estimated combining ISORROPIA II and data collected at a rural southeastern US site during summer 2013 (Weber et al., 2016). Based on impactor measurements in Atlanta, GA, during the spring of 2015, Fang et al. (2017) calculated a mean pH value of 3.5 for the coarse mode particles using the ISORROPIA II model. Guo et al. (2017) calculated PM1 and PM2.5 pH (equal to 1.9 and 2.7) from measurements during the CalNex study in combination with ISORROPIA II. An average PM1 pH equal to 2.2 was estimated at a rural southeastern US site using ISORROPIA II (Nah et al., 2018). Vasilakos et al. (2018) used the three-dimensional chemical transport model CMAQ along with ISORROPIA II to predict the annual average PM2.5 pH over the eastern US for 2001 and 2011 (pH equal to 1.6 and 2.5, respectively). Bougiatioti et al. (2016) calculated PM1 pH between −0.97 and 3.75 using ISORROPIA II in the eastern Mediterranean. Squizzato et al. (2013) estimated a mean PM2.5 pH value equal to 3.1 over the Po Valley, Italy, during 2009 based on filter measurements using the E-AIM thermodynamic model. A comprehensive survey of pH studies to date including observation-based aerosol pH estimates at sites around the world can be found in Pye et al. (2020).
Most of the previous studies focused on the average pH of a particular size range neglecting potential pH variation with particle diameter. There is evidence that pH may vary by as much as 6 units between particle diameters of 0.1 and 10 µm (Fang et al., 2017; Ding et al., 2019). The majority of previous work has focused on select locations in the US, Canada, and Asia and there is still little information about Europe. Also, there is only one study that links aerosol acidity with altitude (Guo et al., 2016), indicating the need for further investigation.
The aim of our work is to investigate the size-dependent aerosol pH over Europe. For this purpose, the Particulate Matter Comprehensive Air quality Model with extensions, PMCAMx, including the thermodynamic model ISORROPIA II, was used. Europe is particularly interesting, owing to the large concentration of NH3, nitrate, sulfate, and dust across all sizes. The roles of dust, Ca2+, and variation in aerosol pH with altitude are analyzed in detail.
PMCAMx (Tsimpidi et al., 2010; Karydis et al., 2010) is based on the CAMx air quality model (Environ, 2003) to simulate the processes of horizontal and vertical advection, horizontal and vertical diffusion, wet and dry deposition, and gas and aqueous phase chemistry. A sectional approach is used to dynamically track the evolution of the aerosol mass and composition distribution across 10 size sections covering a diameter range from 40 nm to 40 µm. The first five size bins represent the PM1 fraction, while three size bins are used to describe the coarse PM1−10 fraction (PM1−2.5, PM2.5−5, PM5−10). The model assumes that each size section is internally mixed; therefore all particles in that size range have the same composition. The aerosol components modeled include sulfate, nitrate, ammonium, sodium, chloride, calcium, potassium, magnesium, other inert crustal material, elemental carbon, water, and primary and secondary organic species. The thermodynamics of inorganic aerosol species is simulated using the ISORROPIA-II model (Fountoukis and Nenes, 2007), assuming that the aerosol exists only in liquid form and is therefore in a metastable equilibrium state at low relative humidity. The gas phase chemical mechanism used in this application is based on the SAPRC mechanism (Carter, 2000; Environ, 2003). The version of the SAPRC mechanism used here includes 237 reactions of 91 gases, 18 radicals, and 37 aerosol species. Additional details regarding PMCAMx are provided in Fountoukis et al. (2011).
We use a hybrid approach to model inorganic aerosol mass transfer, where for particles with dry diameters less than 1 µm bulk equilibrium is assumed. For larger particles, the mass transfer to each size section is simulated using the Multicomponent Aerosol Dynamics Model (Pilinis et al., 2000) as extended by Gaydos et al. (2003) for metastable aerosol. Two additional modifications in the Gaydos et al. (2003) algorithm have been made in this work. The first is that Ca2+, K+, and Mg2+ have been added to the various ionic balances in the algorithm and the corresponding mass transfer constraints. The second is that the mass transfer model now includes an explicit constraint that nitric and hydrochloric acid do not condense when ammonia is condensing until the system equilibrates using the acidity as a driving force as described by Gaydos et al. (2003).
pH is calculated in this work for particles smaller than 1, 1–2.5, 2.5–5, and 5–10 µm, using a molal definition consistent with the pHF definition of Pye et al. (2020):
where [H+] and [W] are the concentrations of particle hydronium ion and inorganic particle water in micrograms per cubic meter. The water associated with organics is neglected in our study, as it has been shown that it has minor influence on the estimated pH (Guo et al., 2015; Battaglia et al., 2019).
PMCAMx was applied over Europe, during the EUCAARI summer intensive campaign in May 2008 for which the model has been evaluated in previous work (Fountoukis et al., 2011). The domain covers a 5400 km × 5832 km region with 36 km × 36 km grid resolution and 14 vertical layers extending up to 6 km. Inputs to the model include horizontal wind components, vertical diffusivity, temperature, pressure, water vapor, clouds, and rainfall, all generated using the Weather Research and Forecast (WRF) meteorological model (Skamarock et al., 2005). Anthropogenic gas phase emissions include land emissions from the GEMS dataset (Visschedijk et al., 2007) as well as international shipping emissions. Anthropogenic particulate emissions of organic and elemental carbon were obtained from the EUCAARI Pan-European Carbonaceous Aerosol Inventory (Kulmala et al., 2009). Industrial, domestic, agricultural, and traffic emission sources are included in the two inventories. Biogenic emissions were based on MEGAN (Guenther et al., 2006), and sea salt emission inventories were developed using the approach of O'Dowd et al. (2008). Urban dust emissions were based on the work of Kakavas and Pandis (2020), assuming that calcium, potassium, magnesium, and sodium represented 2.4 %, 1.5 %, 0.9 %, and 1.2 % of the emitted mineral dust, respectively (Sposito, 1989). A reliable Saharan dust emissions inventory was not available; therefore the African region is excluded from the simulation analysis. Additionally, we focused on a period during which the impact of Saharan dust in Europe was minimal. The concentrations of dust and its components at the boundaries of the domain are considered constant and invariant with height and along each boundary (Table S1 in the Supplement). More information about the inputs of PMCAMx during the simulated period can be found in Fountoukis et al. (2011) and Kakavas and Pandis (2020).
Three simulations were performed. The first was the “base case” simulation and included all emissions described above. Two other simulations were carried out and compared with the base case to understand how non-volatile cations (NVCs) in dust affect water uptake and aerosol pH: one where dust lacks any non-volatile soluble cations (“inert dust” simulation) and one where we neglect calcium (“no calcium” simulation) from the base case simulation. Calcium is the major NVC in dust and compared to the other NVCs it can react with sulfate ions and form insoluble CaSO4, which precipitates out of the aerosol aqueous phase and remains insoluble under subsaturated conditions – even for metastable aerosol (Fountoukis and Nenes, 2007). Particles in each size section can contain both insoluble and soluble material. Therefore, the insoluble CaSO4 is treated as such by ISORROPIA-II. This unique interaction implies that calcium, if present in sufficient amounts, can reduce aerosol sulfate and reduce acidity, but at the same time reduce hygroscopicity that promotes acidity – in a way that is not obvious by just comparing the base case simulation with the inert dust simulation. In all simulations, the total dust mass emissions were the same and only its assumed composition varied.

Figure 1Average ground level aerosol pH predictions for (a) PM1, (b) PM1−2.5, (c) PM2.5−5, and (d) PM5−10 for the base case simulation over Europe during May 2008.
4.1 Size dependence of aerosol pH
The average ground level pH predictions for different size ranges are presented in Fig. 1. The domain-average ground level pH is 2.05 for PM1, 2.65 for PM1−2.5, 3.2 for PM2.5−5, and 3.35 for PM5−10. Higher pH values for all particle sizes are predicted over the Atlantic due to the presence of sea salt and the systematically higher RH and liquid water content – all of which act to reduce aerosol acidity. The acidity is higher over the Mediterranean, especially its eastern part, due to the higher sulfate and nitrate levels in that region. However, the fine particles over the Atlantic are also predicted to be quite acidic, especially in the south. High pH is also predicted for parts of central and northern Europe due to the corresponding ammonia but also the effect of the alkaline dust particles. The pH of marine aerosol increases with particle size, with the highest value equal to 4.5 for the 2.5–5 and 5–10 µm ranges, as sea salt is emitted mainly at the supermicron range and is the main aerosol component in these areas. Over the continental region, average PM1 pH ranges between 1 and 3.5, with the highest values in the northern coastal parts of Europe and northern Italy; in these regions, acidity is reduced by the high levels of NH3 present from agriculture and livestock emissions combined with high NOx and RH levels (Guo et al., 2018; Masiol et al., 2020). PM1−2.5 is less acidic with pH values from 1.5 to 4 over the continental region with the higher values in the northern coastal areas of Europe extending from France to Denmark. The average pH increases further in the 2.5–5 µm range, being equal to 2–3.5 over the continental regions and reaching values up to 4–5 in the coastal areas of the Netherlands, Belgium, France, and Denmark. Average PM5−10 pH increases over the continental region compared to PM2.5−5, especially in northern Europe, and the highest pH values (4.5–5) are predicted for the same regions. The largest pH changes across size occur for regions where fine-mode aerosol acidity is dominated by the NH3–sulfate system (i.e., relatively lower NH3 levels – so that aerosol nitrate is low; Guo et al., 2018), and the largest sizes contain large amounts of NVCs from sea salt and dust.
Squizzato et al. (2013) calculated PM2.5 pH equal to 2.3 and Masiol et al. (2020) equal to 2.2 in the Po Valley, Italy, during the summer of 2009 and 2012, respectively. The predicted pH by PMCAMx is a little higher and equal to approximately 3.3. Guo et al. (2018) estimated that the PM2.5 pH was equal to 3.3 in Cabauw, Netherlands, during the summer of 2013, based on measurements and thermodynamic modeling. PMCAMx predicts a PM2.5 pH equal to 3.4 in this area during the summer. These discrepancies could be partially due to the different periods compared as the aerosol pH can be sensitive to small changes in composition but also to meteorology (e.g., relative humidity). Nonetheless, these comparisons, even if they involve different years, suggest that the model predictions are reasonable. Bougiatioti et al. (2016) determined through thermodynamic analysis of observations with ISORROPIA-II that the PM1 pH in Finokalia, Crete, is equal to 1.3, which agrees with our predictions.
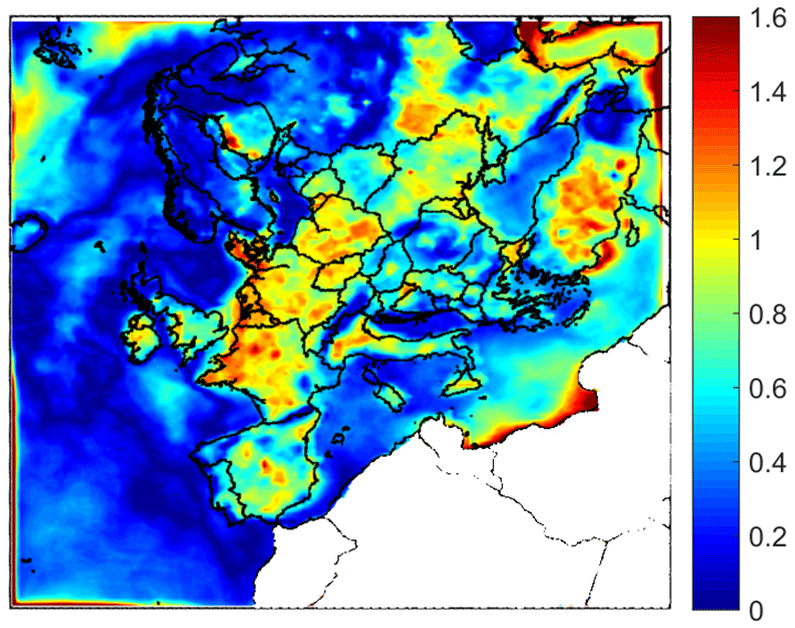
Figure 2Absolute difference of average ground level pH between PM1−2.5 and PM1 for the base case simulation during May 2008.
The pH of PM2.5 has often been the focus of previous measurement studies, due to the availability of the corresponding filter samples. However, the pH in the 1–2.5 range can be quite different from that in the submicrometer range (Fang et al., 2017; Ding et al., 2019). This difference may have important implications for aerosol toxicity, metal solubility, nitrate partitioning, and other processes. The difference of average ground level aerosol pH predictions between PM1−2.5 and PM1 is shown in Fig. 2. The pH of these size ranges can differ up to 1.2 units over the continental region due to the effect of NVCs from dust in the PM1−2.5. This difference is predicted to be smaller over most marine areas (up to 1 unit).

Figure 3Average ground level aerosol water predictions (µg m−3) for (a) PM1, (b) PM1−2.5, (c) PM2.5−5, and (d) PM5−10 for the base case simulation over Europe during May 2008.
Particle water concentrations for the different particle sizes are shown in Fig. 3. PM1 has the most water, compared to the other size fractions over the continental region. The coarse particles in PM1−2.5 and PM2.5−5 have the most water in the marine areas because of the sea salt, which is found in higher levels in these particles, and exhibits the highest hygroscopicity – compared to all other inorganic salts found in aerosol. Water levels for all particle sizes are higher at areas closer to the sea, owing to the relatively high dry aerosol mass concentration combined with the high RH typically associated with the marine environments; in just the 2.5–5 µm size range alone, water content exceeds 20 µg m−3.
Northern Scotland is predicted to have lower pH values compared to the rest of Great Britain for all size ranges during the simulated period. This happens because particles across all sizes have lower water content (Fig. 3) in this area. Also, the predicted dust concentrations are lower than the rest of Great Britain (Fig. S8). The lower aerosol water content and lower dust concentrations lead to more acidic particles in northern Scotland for all size ranges according to PMCAMx.
4.2 Temporal evolution of pH
To study the temporal evolution of pH, eight sites (Fig. S1 in the Supplement) with different characteristics were selected based on their different type, location, and dust–sea salt levels (Table S2). Finokalia has the lowest PM1 pH of all examined locations with a value equal to 1.3 (Fig. S2). During most of the time the PM1 pH in that area in the eastern Mediterranean is predicted to be within 0.1–0.2 units of its average even if there are limited periods with both very low (pH = 0.3) and high (pH = 7.7) hourly average pH (not shown). The predicted pH for larger particles is higher but remains the lowest of the examined group of sites due to the high sulfate levels in the area. This site is affected by both relatively dry air masses with continental aerosol characteristics and by air masses with relatively high sea salt and dust levels as well as biomass burning influences (Bougiatioti et al., 2016). Cabauw, on the other hand, has the highest average PM1 pH (3.0) with hourly average values ranging between 1.5 and 4.5. The distribution of pH values of the 1–2.5 µm diameter particles moves to higher values (less acidic particles) for all sites compared to the submicrometer particles. The pH values of all sites for the 2.5–5 µm range are similar to those in the 5–10 µm range and higher than the fine aerosol pH values.
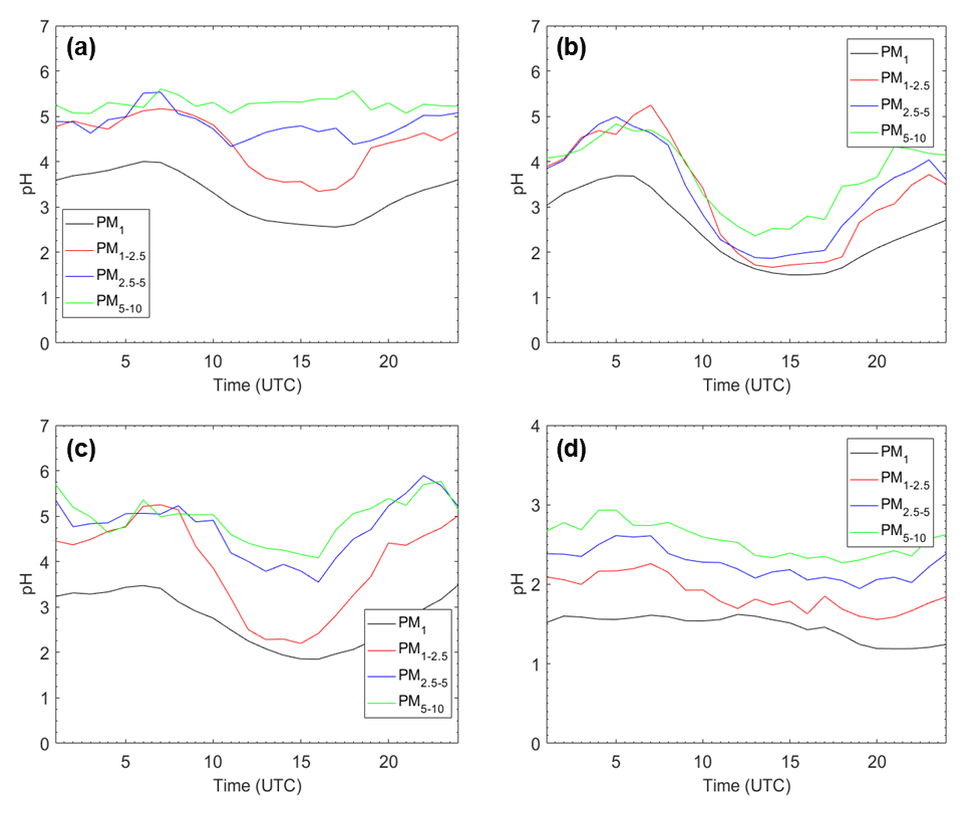
Figure 4Average pH diurnal profiles for (a) Cabauw, Netherlands; (b) Melpitz, Germany; (c) Paris, France; and (d) Finokalia, Greece, for the four particle size ranges for the base case simulation during May 2008.
The pH diurnal profiles for Cabauw, Melpitz, Paris, and Finokalia are shown in Fig. 4. These sites were selected based on their different type, location, and dust–sea salt levels (Table S2) – and because ambient pH data are available for most of them (Pye et al., 2020). pH follows similar trends for all particle sizes at each of the four sites. Cabauw is characterized by lower PM1 and PM1−2.5 pH during the afternoon and relatively constant average diurnal PM2.5−5 and PM5−10 pH with slightly higher values early in the morning. The average pH in Melpitz is characterized for all particle sizes by early morning and evening peaks and a strong afternoon minimum. The behavior in Paris is similar to that in Melpitz, but the variation in PM1−2.5 is predicted to be stronger than in other size ranges due to the combined effects of photochemistry, relative humidity, and urban dust emissions. The average pH at the remote site of Finokalia has the lowest variability of all four sites. It has a little higher values during the night and lower during the day. These variations are caused by a variety of factors including the relative humidity (that is higher during the early morning, leading to higher liquid water content and higher pH), the temperature (which tends to evaporate nitrate), and mixing height variation (which in turn tends to affect precursor concentrations). The aerosol pH diurnal profiles at the four examined sites of our study follow the same pattern as the corresponding RH diurnal profiles, underlining the importance of RH as a driver of these average variations (Fig. S3).

Figure 5Average predicted aerosol pH as a function of size and altitude: (a–f) for PM1, (g–l) for PM1−2.5, (m–r) for PM2.5−5, and (s–x) for PM5−10 at 0–50, 50–140, 250–380, 550–780, 1000–1500, and 2000–2500 m for the base case simulation during May 2008.
4.3 pH variation with height
All the results presented so far are for the ground level (lowest 50 m). The predicted aerosol water content for all size ranges decreases with altitude (Fig. S4). This is mainly due to the decrease in the relative humidity and aerosol concentrations with altitude (Mishra et al., 2015; Wang et al., 2018). As height increases, pH values for all particle sizes decrease, due to the reduction of aerosol water per unit mass of dry aerosol, with height (Fig. 5) – which is exclusively an effect of relative humidity decrease. A secondary effect is that the lower concentration of aerosol tends to drive partitioning of semi-volatile species (nitrate, ammonium) to the gas phase (Nenes et al., 2020). As a result, particles of all sizes that are acidic at ground level become more acidic when they move higher in the atmosphere.
For PM1, in the less acidic areas over Europe the pH decreases from 3–3.5 near the ground to around 2–2.5 at 2.5 km altitude. For PM1−2.5, the reduction is even larger, since the pH values decrease from 3.5–4.0 at the ground to 1.5–2.0 at 2.5 km (the larger drop in pH is a result of the evaporation of nitrate aerosol and the decrease in liquid water content). Similar decreases of 2–2.5 pH units are predicted for the coarse particles in the first 2.5 km of the atmosphere in areas over land. The predicted decrease in aerosol water content and pH for the supermicrometer particles is even more pronounced in the marine atmosphere and coastal areas due to the high levels of sea salt near the ground. This reduction of pH with altitude is smaller for the PM1 size range in the marine atmosphere. A comparison of the average vertical profiles for the inorganic aerosol components is shown in Fountoukis et al. (2011). The measured reduction of PM1 nitrate levels over central and northern Europe from their maximum near the ground to close to zero at 3–4 km was reproduced well on average by PMCAMx.
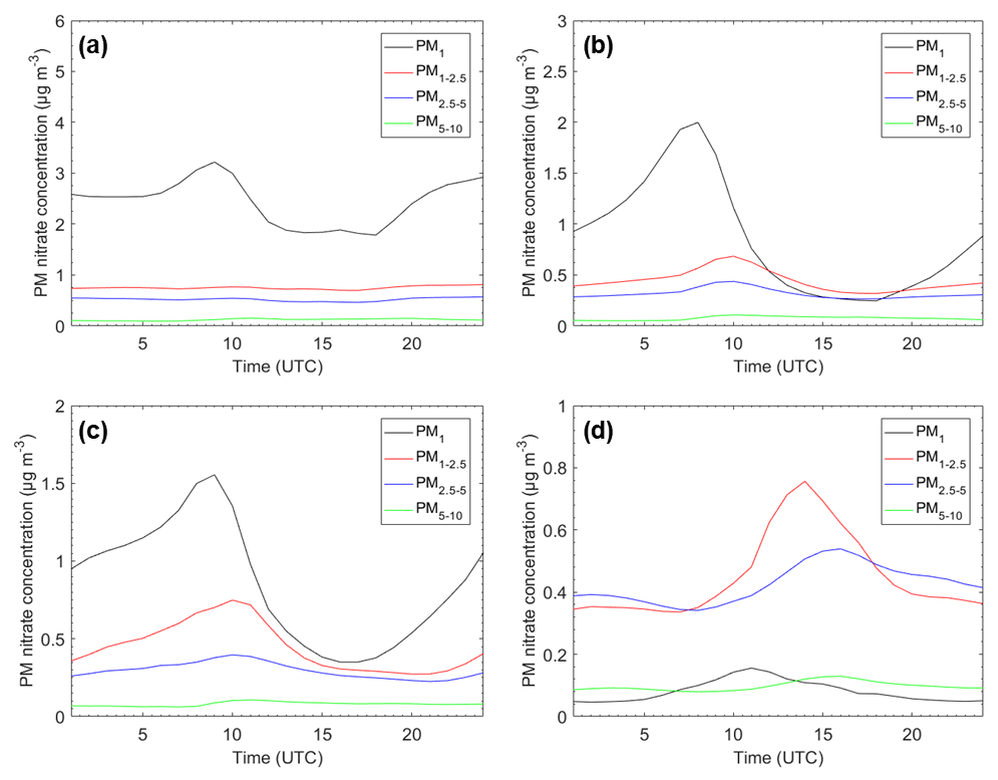
Figure 6PM1, PM1−2.5, PM2.5−5, and PM5−10 nitrate diurnal profiles for (a) Cabauw, Netherlands; (b) Melpitz, Germany; (c) Paris, France; and (d) Finokalia, Greece, for the base case simulation during May 2008.
4.4 Effect of aerosol pH on inorganic nitrate
The model predicts significant concentrations of inorganic nitrate both in central Europe and in parts of northern and southern Europe (Fig. S5). PMCAMx does not simulate the concentrations of organonitrates. The high ammonia levels together with the high-NOx emissions and photochemistry over Belgium, the Netherlands, and the UK according to PMCAMx result in high levels of nitrate in both the fine and coarse particles in these areas. In parts of southern Europe, the relatively high sea salt concentrations result in modest levels of coarse nitrate in areas with very low or zero levels of fine nitrate. High average nitrate levels are predicted in several areas in which the pH exceeds 2.5 and are predicted for the 1–2.5 µm size range (Fig. S5). Nitrate partitioning to the aerosol phase is favored at these higher pH values (Guo et al., 2016; Vasilakos et al., 2018). At the same time, the mass transfer of the produced nitric acid to the aerosol phase is faster for the particles in the 1–2.5 µm range compared to those in the PM2.5−5 and PM5−10 ranges also contributing to a higher concentration. Finally, the removal of the larger particles from the atmosphere is faster adding one more reason for the maximum of the nitrate size distribution. Modest nitrate levels are predicted in central Europe during this period because both nitric acid and ammonia levels were modest and the temperature was relatively high.
The size-dependent average nitrate diurnal profiles for Cabauw, Melpitz, Paris, and Finokalia are shown in Fig. 6. In Cabauw, predicted total nitrate levels start to increase early in the morning and peak around 09:00 UTC. Lower values are predicted during midday and early afternoon, with fine nitrate starting to increase in the early evening. Most of this variation is due to the formation of ammonium nitrate in the PM1 size range. The increase in PM1 nitrate is accompanied by an increase in the ammonium levels (Fig. S6) in this area that is characterized by high ammonia concentrations. Predicted supermicrometer nitrate levels are less variable (in absolute terms) during the day. In Cabauw, coarse particles have on average pH above 2.5 throughout the day (Fig. 4a), favoring the partitioning of nitrate to the aerosol phase also forming coarse ammonium nitrate. The predicted average PM1 nitrate diurnal variation is in very good agreement with the measurements at that site during the EUCAARI campaign (Fig. S7).
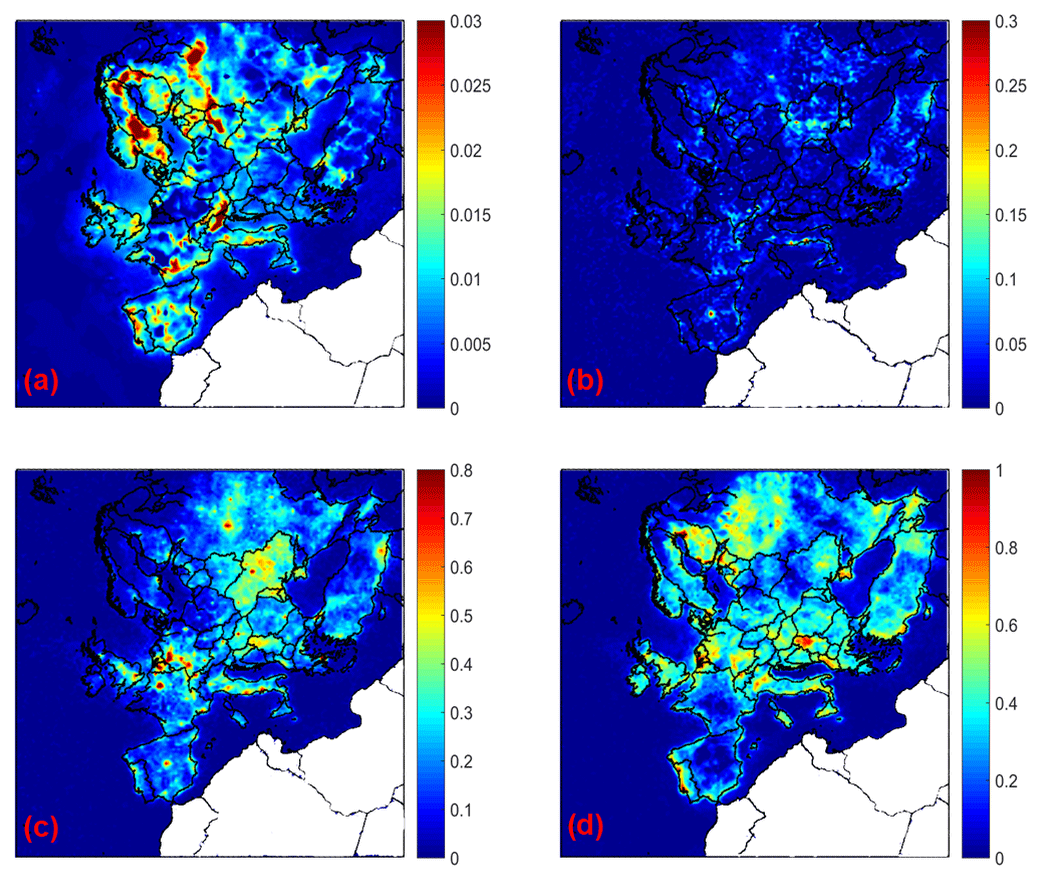
Figure 7Increase in average ground level aerosol pH for (a) PM1, (b) PM1−2.5, (c) PM2.5−5, and (d) PM5−10 for the base case simulation compared to the inert dust case during May 2008.
In Melpitz, the predicted behavior of nitrate is almost the same as in Cabauw, but with lower fine nitrate levels (Fig. 6). PM1 nitrate peaks early in the morning with peaks in coarse nitrate a few hours later. The peak in fine nitrate is at the same time as the pH in this range, while for the coarse particles it is a few hours later due to the delays in mass transfer to the larger particles. Nitrate levels in all size ranges are predicted to decrease during the afternoon, with nitrate reaching a minimum in the late afternoon. The predicted diurnal pattern is the same as the observed values, but the model tends to overpredict nitrate in this area by approximately 0.5 µg m−3. The behavior of nitrate in the fine and coarse particles in Paris is quite similar to that in Melpitz, reflecting the similarity in the behavior of pH. Nitrate in all size sections peaks in the early morning and has a minimum in the afternoon. The main difference in this case is that there is more nitrate in the coarse particles due to the higher predicted levels of dust in this megacity. In Finokalia, the predicted fine nitrate is quite low, reaching a peak of approximately 0.2 µg m−3 at 11:00 UTC. These very low levels are consistent with the corresponding measurements of very low fine nitrate (approximately 0.1 µg m−3) in this area during this summertime period. The nitrate in the coarse particles is significantly higher and peaks a few hours later, increases gradually in all sizes during the morning, reaches its maximum values in the afternoon, and then gradually decreases. These higher levels of coarse nitrate exceeding 1 µg m−3 are consistent with the 1–2 µg m−3 of coarse nitrate measured in Finokalia during this EUCAARI campaign. So PMCAMx reproduces the size distribution of nitrate in this area, with practically all of the mass in the supermicrometer range well.
4.5 Effect of dust composition on particle pH
The impact of the NVCs from dust on pH can be quantified comparing the results of the simulation in which the dust was assumed to be inert with the base case simulation. The NVCs in dust directly and indirectly affect the aerosol water content for both the fine and coarse particles (Fig. S8). The predicted dust concentrations are shown in Fig. S9, and their effects on aerosol water in the different size sections are predicted to be both positive and negative. This complex picture is due to a series of effects of the dust NVCs on the particle composition. In general, the presence of dust causes an increase in coarse nitrate and a reduction in fine nitrate. At the same time, there is increased water absorption by the coarse particles. These effects dominate near the sources of dust, but at the same time there is an increase in removal rates of the nitrates, leading to reductions further downwind of their sources. The result of these processes is reductions in fine nitrate in most areas of continental Europe (Fig. S10) accompanied by a reduction in fine aerosol water. However, there are some reductions of PM1 water due to the presence of the NVCs in marine areas. On the other hand, for the larger coarse particles the presence of the dust NVCs leads to an increase in aerosol water practically everywhere. For the particles in the intermediate size ranges (PM1−2.5 and PM2.5−5), the effects of dust NVCs on aerosol water are mixed, with both increases and decreases predicted due to changes in the total concentrations and size distributions of the water-soluble aerosol components. These results highlight the complex effect of the coarse dust particles on aerosol water and its size distribution.
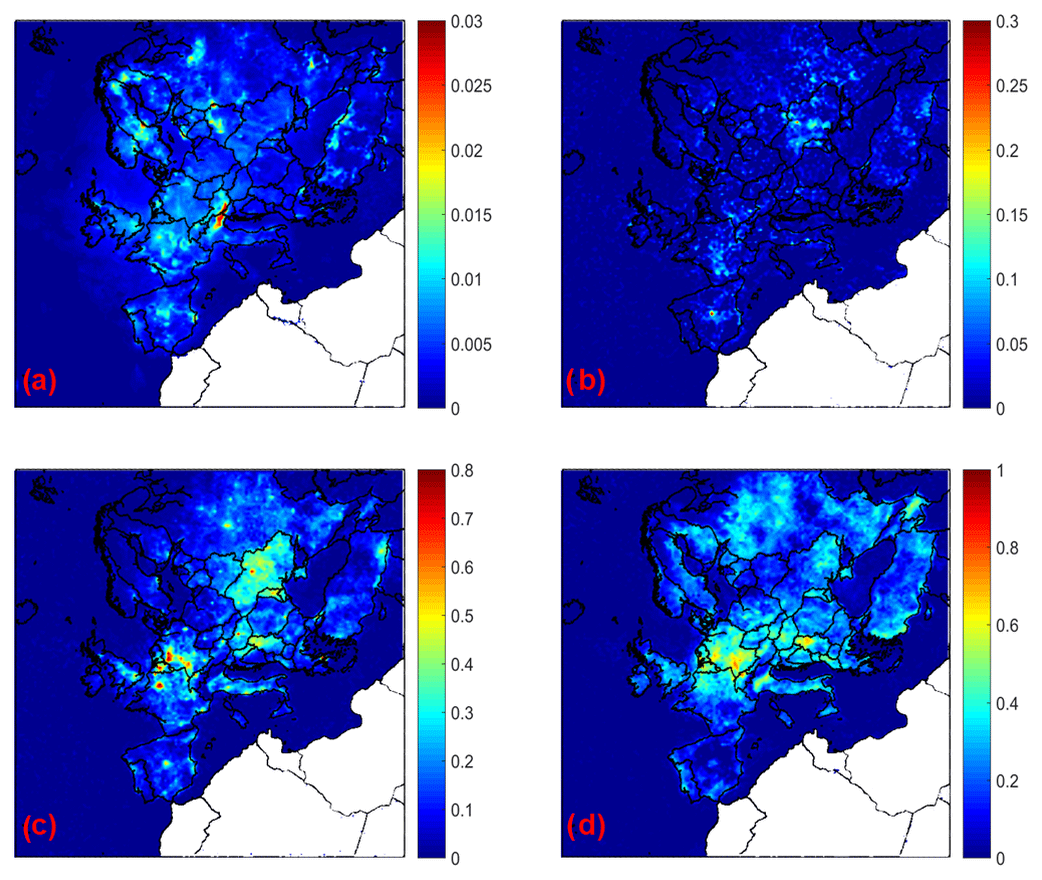
Figure 8Increase in average ground level aerosol pH for (a) PM1, (b) PM1−2.5, (c) PM2.5−5, and (d) PM5−10 for the base case simulation compared to the case when calcium is neglected during May 2008.
The predicted aerosol pH is lower in all particle sizes for the inert dust case compared to the base case simulation (Fig. 7). The soluble NVCs in dust tend to increase pH, because due to their lack of volatility they irreversibly neutralize sulfate ions. NVCs also tend to elevate aerosol water in a way that leads to pH increase, directly through their hygroscopicity and indirectly through promoting the condensation of aerosol nitrate and its associated water content (Guo et al., 2018). PM1 is slightly affected, because it contains small amounts of dust. The average PM1 pH changes due to dust by less than 0.05 units. The corresponding pH increase is around 0.1 units for PM1−2.5, 0.2–1 units for PM2.5−5, and 0.3–1 units for PM5−10.
The effects of dust on pH and aerosol water are reflected on the predicted aerosol nitrate. Nitrate in the submicron range increases and for bigger particle sizes decreases when dust is assumed to be inert (Fig. S10). The average effect of dust on submicrometer nitrate is negligible in several areas, but there are significant effects in the Netherlands and the surrounding areas. The dust is predicted to cause average increases of PM1−2.5, PM2.5−5, and PM5−10 nitrate up to 0.01, 0.1, and 0.08 µg m−3, respectively, in parts of northern Europe with higher dust levels and also Italy. This nonlinear impact of relatively minor amounts of NVCs from dust occurs because relatively small changes in aerosol pH, when occurring in the “pH sensitivity window” of nitrate partitioning, can lead to large responses in nitrate uptake (Vasilakos et al., 2018).
If only calcium is neglected in the simulation, aerosol pH decreases for all particle sizes compared to the base case simulation (Fig. 8). This decrease varies from 0.01 to 0.03 units for PM1, 0.05–0.1 units for PM1−2.5, 0.1–0.7 for PM2.5−5, and 0.4–0.7 for PM5−10 over continental Europe. The highest pH differences are predicted for the coarse particles, consistent with the fact that the coarse particles are richest in calcium. Considering the possible effects calcium can have on soluble sulfate and water uptake, the simulations suggest that the primary effect of calcium is through its action as a soluble ion.
The size-dependent aerosol pH was simulated over Europe during an early summer period. We find that fine mode aerosol is persistently more acidic than coarse mode particles. The size dependence of pH is strongest in northern and southern Europe, where the difference can be as large as 2 units between submicron and 10 µm particles. This difference is reduced over other continental regions, but can still be as large as 1 pH unit between PM1 and PM1−2.5. PM1 has the most water over continental areas, while coarse PM has the most water in marine and coastal areas.
Particles of all sizes become increasingly acidic with altitude owing to the reduction of aerosol water levels with height and volatilization of particulate ammonium and nitrate due to dilution. The highest pH decrease between the ground and 2.5 km altitude is 1–1.5 units for PM1, and 2–2.5 units for PM1−2.5, PM2.5−5, and PM5−10. The largest drop in pH is observed for the PM1−2.5 fraction, because it coincides with where aerosol nitrate resides most – hence its evaporation with altitude tends to have a larger impact on pH than reductions of liquid water from the RH effect alone.
The nitrate concentration tends to peak a few hours later than the pH in most sites due to the time required for the production of nitric acid and its partitioning to the aerosol phase. If aerosol pH becomes low enough to impede fine mode nitrate formation, its preferential condensation to larger sizes tends to increase the pH difference between fine and coarse particles.
The water soluble components of dust have a rather complex effect on aerosol water, causing both increases and decreases in the aerosol water levels. The average increase in water levels ranges from 0.1 to 1.5 µg m−3 with the highest change for PM5−10 in parts of northern Europe. Dust causes an increase in aerosol pH for all particle sizes with higher effects in the coarse particles. This effect can be more than 1 pH unit. This increase in pH is accompanied by increases in aerosol nitrate. This effect of dust is mainly due to its calcium content, suggesting the importance of accurately simulating not only the dust concentration but also the calcium levels. This study focused on periods during which the impact of Saharan dust on Europe was minimal and the predicted dust was dominated by local sources. The effect of Saharan dust on the aerosol pH of Europe is expected to be even more important than our results indicate and will be the topic of future work.
This study shows that aerosol acidity and liquid water content change considerably across size, location, time, and height over Europe. These changes will impact aerosol formation and its response to emissions controls, solubility of aerosol trace metals, and deposition. With this realization, aerosol pH and liquid water content emerge as powerful aerosol state variables (Nenes et al., 2020) that could help elucidate the complex impacts of aerosol on public health, ecosystems, and climate.
Simulation results are available upon request.
The supplement related to this article is available online at: https://doi.org/10.5194/acp-21-799-2021-supplement.
SK extended the hybrid module in the revision stage of the paper, repeated all simulations, analyzed the revised results, and wrote the final version of the paper. He also contributed the dust emissions and NVC scheme. DP assisted in the extension of the hybrid module and the development and implementation of the final pH calculation scheme and the analysis of the final results. MZ developed and implemented the original pH calculation scheme in PMCAMx, carried out the initial simulations, and was responsible for the first draft of the paper. SN and AN conceived and led the study and helped in the writing of the paper. All authors were involved in the scientific interpretation of the simulations, provided feedback on the analysis approach, and extensively commented on the manuscript.
The authors declare that they have no conflict of interest.
This work was supported by the project PyroTRACH (ERC-2016-COG) funded from H2020-EU.1.1. – Excellent Science – European Research Council (ERC), project ID 726165.
This paper was edited by Chul Han Song and reviewed by two anonymous referees.
Battaglia Jr., M. A., Weber, R. J., Nenes, A., and Hennigan, C. J.: Effects of water-soluble organic carbon on aerosol pH, Atmos. Chem. Phys., 19, 14607–14620, https://doi.org/10.5194/acp-19-14607-2019, 2019.
Bian, H., Chin, M., Hauglustaine, D. A., Schulz, M., Myhre, G., Bauer, S. E., Lund, M. T., Karydis, V. A., Kucsera, T. L., Pan, X., Pozzer, A., Skeie, R. B., Steenrod, S. D., Sudo, K., Tsigaridis, K., Tsimpidi, A. P., and Tsyro, S. G.: Investigation of global particulate nitrate from the AeroCom phase III experiment, Atmos. Chem. Phys., 17, 12911–12940, https://doi.org/10.5194/acp-17-12911-2017, 2017.
Bougiatioti, A., Nikolaou, P., Stavroulas, I., Kouvarakis, G., Weber, R., Nenes, A., Kanakidou, M., and Mihalopoulos, N.: Particle water and pH in the eastern Mediterranean: source variability and implications for nutrient availability, Atmos. Chem. Phys., 16, 4579–4591, https://doi.org/10.5194/acp-16-4579-2016, 2016.
Carter, W. P. L.: Documentation of the SAPRC-99 Chemical Mechanism for VOC Reactivity Assessment, Report to California Air Resources Board, available at: http://intra.engr.urc.edu/~carter (last access: 8 January 2021), 2000.
Ciarelli, G., Aksoyoglu, S., Crippa, M., Jimenez, J.-L., Nemitz, E., Sellegri, K., Äijälä, M., Carbone, S., Mohr, C., O'Dowd, C., Poulain, L., Baltensperger, U., and Prévôt, A. S. H.: Evaluation of European air quality modelled by CAMx including the volatility basis set scheme, Atmos. Chem. Phys., 16, 10313–10332, https://doi.org/10.5194/acp-16-10313-2016, 2016.
Ding, J., Zhao, P., Su, J., Dong, Q., Du, X., and Zhang, Y.: Aerosol pH and its driving factors in Beijing, Atmos. Chem. Phys., 19, 7939–7954, https://doi.org/10.5194/acp-19-7939-2019, 2019.
Environ: User's guide to the comprehensive air quality model with extensions (CAMx), version 4.02, report, ENVIRON Int. Corp., Novato, CA, available at: http://www.camx.com (last access: 8 January 2021), 2003.
Fang, T., Guo, H., Zeng, L., Verma, V., Nenes, A., and Weber, R. J.: Highly acidic ambient particles, soluble metals, and oxidative potential: a link between sulfate and aerosol toxicity, Environ. Sci. Technol., 51, 2611–2620, 2017.
Fountoukis, C. and Nenes, A.: ISORROPIA II: a computationally efficient thermodynamic equilibrium modcheel for K+–Ca2+–Mg2+––Na+–––Cl−–H2O aerosols, Atmos. Chem. Phys., 7, 4639–4659, https://doi.org/10.5194/acp-7-4639-2007, 2007.
Fountoukis, C., Racherla, P. N., Denier van der Gon, H. A. C., Polymeneas, P., Charalampidis, P. E., Pilinis, C., Wiedensohler, A., Dall'Osto, M., O'Dowd, C., and Pandis, S. N.: Evaluation of a three-dimensional chemical transport model (PMCAMx) in the European domain during the EUCAARI May 2008 campaign, Atmos. Chem. Phys., 11, 10331–10347, https://doi.org/10.5194/acp-11-10331-2011, 2011.
Fridlind, A. M. and Jacobson, M. Z.: A study of gas-aerosol equilibrium and aerosol pH in the remote marine boundary layer during the First Aerosol Characterization Experiment (ACE 1), J. Geophys. Res., 105, 17325–17340, 2000.
Gaydos, T. M., Koo, B., Pandis, S. N., and Chock, D. P.: Development and application of an efficient moving sectional approach for the solution of the atmospheric aerosol condensation/evaporation equations, Atmos. Environ., 37, 3303–3316, 2003.
Guenther, A., Karl, T., Harley, P., Wiedinmyer, C., Palmer, P. I., and Geron, C.: Estimates of global terrestrial isoprene emissions using MEGAN (Model of Emissions of Gases and Aerosols from Nature), Atmos. Chem. Phys., 6, 3181–3210, https://doi.org/10.5194/acp-6-3181-2006, 2006.
Guo, H., Xu, L., Bougiatioti, A., Cerully, K. M., Capps, S. L., Hite Jr., J. R., Carlton, A. G., Lee, S.-H., Bergin, M. H., Ng, N. L., Nenes, A., and Weber, R. J.: Fine-particle water and pH in the southeastern United States, Atmos. Chem. Phys., 15, 5211–5228, https://doi.org/10.5194/acp-15-5211-2015, 2015.
Guo, H., Sullivan, A. P., Campuzano-Jost, P., Schroder, J. C., Lopez-Hilfiker, F. D., Dibb, J. E., Jimenez, J. L., Thornton, J. A., Brown, S. S., Nenes, A., and Weber, R. J.: Fine particle pH and the partitioning of nitric acid during winter in the northeastern United States, J. Geophys. Res., 121, 10355–10376, 2016.
Guo, H., Liu, J., Froyd, K. D., Roberts, J. M., Veres, P. R., Hayes, P. L., Jimenez, J. L., Nenes, A., and Weber, R. J.: Fine particle pH and gas–particle phase partitioning of inorganic species in Pasadena, California, during the 2010 CalNex campaign, Atmos. Chem. Phys., 17, 5703–5719, https://doi.org/10.5194/acp-17-5703-2017, 2017.
Guo, H., Otjes, R., Schlag, P., Kiendler-Scharr, A., Nenes, A., and Weber, R. J.: Effectiveness of ammonia reduction on control of fine particle nitrate, Atmos. Chem. Phys., 18, 12241–12256, https://doi.org/10.5194/acp-18-12241-2018, 2018.
Heald, C. L., Collett Jr., J. L., Lee, T., Benedict, K. B., Schwandner, F. M., Li, Y., Clarisse, L., Hurtmans, D. R., Van Damme, M., Clerbaux, C., Coheur, P.-F., Philip, S., Martin, R. V., and Pye, H. O. T.: Atmospheric ammonia and particulate inorganic nitrogen over the United States, Atmos. Chem. Phys., 12, 10295–10312, https://doi.org/10.5194/acp-12-10295-2012, 2012.
Hsu, Y., Wu, C., Lundgren, D. A., and Birky, B. K.: Size distribution, chemical composition and acidity of mist aerosols in fertilizer manufacturing facilities in Florida, J. Aerosol Sci., 39, 127–140, 2008.
Hu, G., Zhang, Y., Sun, J., Zhang, L., Shen, X., Lin, W., and Yang, Y.: Variability, formation and acidity of water-soluble ions in PM2.5 in Beijing based on the semi-continuous observations, Atmos. Res., 145–146, 1–11, 2014.
Huang, X., Qiu, R., Chan, C. K., and Pathak, R. K: Evidence of high PM2.5 strong acidity in ammonia-rich atmosphere of Guangzhou, China: Transition in pathways of ambient ammonia to form aerosol ammonium at []/[] = 1.5, Atmos. Res., 99, 488–495, 2011.
Im, U., Bianconi, R., Solazzo, E., Kioutsioukis, I., Badia, A., Balzarini, A., Baró, R., Bellasio, R., Brunner, D., Chemel, C., Curci, G.,van der Gon, H. D., Flemming, J., Forkel, R., Giordano, L., Jiménez-Guerrero, P., Hirtl, M., Hodzic, A., Honzak, L., Jorba, O., Knote, C., Makar, P. A., Manders-Groot, A., Neal, L., Pérez, J. L., Pirovano, G., Pouliot, G., Jose, R. S., Savage, N., Schroder, W., Sokhi, R. S., Syrakov, D., Torian, A., Tuccella, P., Wang, K., Werhahn, J., Wolke, R., Zabkar, R., Zhang, Y., Zhang, J., Hogrefe, C., and Galmarini, S.: Evaluation of operational online-coupled regional air quality models over Europe and North America in the context of AQMEII phase 2. Part II: Particulate matter, Atmos. Environ., 115, 421–441, 2015.
Kakavas, S. and Pandis, S. N.: Effects of urban dust emissions on fine and coarse PM levels and composition, Atmos. Environ., https://doi.org/10.1016/j.atmosenv.2020.118006, in press, 2020.
Karydis, V. A., Tsimpidi, A. P., Fountoukis, C., Nenes, A., Zavala, M., Lei, W., Molina, L. T., and Pandis, S. N.: Simulating the fine and coarse inorganic particulate matter concentrations in a polluted megacity, Atmos. Environ., 44, 608–620, 2010.
Katoshevski, D., Nenes, A., and Seinfeld, J. H.: A study of processes that govern the maintenance of aerosols in the marine boundary layer, J. Aerosol Sci., 30, 503–532, 1999.
Keene, W. C., Pszenny, A. A. P., Maben, J. R., Stevenson, E., and Wall, A.: Closure evaluation of size-resolved aerosol pH in the New England coastal atmosphere during summer, J. Geophys. Res., 109, 1–16, 2004.
Kulmala, M., Asmi, A., Lappalainen, H. K., Carslaw, K. S., Pöschl, U., Baltensperger, U., Hov, Ø., Brenquier, J.-L., Pandis, S. N., Facchini, M. C., Hansson, H.-C., Wiedensohler, A., and O'Dowd, C. D.: Introduction: European Integrated Project on Aerosol Cloud Climate and Air Quality interactions (EUCAARI) – integrating aerosol research from nano to global scales, Atmos. Chem. Phys., 9, 2825–2841, https://doi.org/10.5194/acp-9-2825-2009, 2009.
Masiol, M., Squizzato, S., Formenton, G., Khan, M. B., Hopke, P. K., Nenes, A., Pandis, S. N., Tositti, L., Benetello, F., Visin, F., and Pavoni, B.: Hybrid multiple-site mass closure and source apportionment of PM2.5 and aerosol acidity at major cities in the Po Valley, Sci. Total Environ., 704, 135287, https://doi.org/10.1016/j.scitotenv.2019.135287, 2020.
Meskhidze, N., Chameides, W. L., Nenes, A., and Chen, G.: Iron mobilization in mineral dust: Can anthropogenic SO2 emissions affect ocean productivity?, Geophys. Res. Lett., 30, 1–5, 2003.
Mishra, A. K., Koren, I., and Rudich, Y.: Effect of aerosol vertical distribution on aerosol-radiation interaction: a theoretical prospect, Heliyon, 1, e00036, https://doi.org/10.1016, 2015.
Nah, T., Guo, H., Sullivan, A. P., Chen, Y., Tanner, D. J., Nenes, A., Russell, A., Ng, N. L., Huey, L. G., and Weber, R. J.: Characterization of aerosol composition, aerosol acidity, and organic acid partitioning at an agriculturally intensive rural southeastern US site, Atmos. Chem. Phys., 18, 11471–11491, https://doi.org/10.5194/acp-18-11471-2018, 2018.
Nenes, A., Krom, M. D., Mihalopoulos, N., Van Cappellen, P., Shi, Z., Bougiatioti, A., Zarmpas, P., and Herut, B.: Atmospheric acidification of mineral aerosols: a source of bioavailable phosphorus for the oceans, Atmos. Chem. Phys., 11, 6265–6272, https://doi.org/10.5194/acp-11-6265-2011, 2011.
Nenes, A., Pandis, S. N., Weber, R. J., and Russell, A.: Aerosol pH and liquid water content determine when particulate matter is sensitive to ammonia and nitrate availability, Atmos. Chem. Phys., 20, 3249–3258, https://doi.org/10.5194/acp-20-3249-2020, 2020.
O'Dowd, C. D., Langmann, B., Varghese, S., Scannell, C., Ceburnis, D., and Facchini, M. C.: A combined organic-inorganic sea-spray source function, Geophys. Res. Lett., 35, L01801, 2008.
Pilinis, C., Capaldo, K. P., Nenes, A., and Pandis, S. N.: MADM-A new multicomponent aerosol dynamics model, Aerosol Sci. Tech., 32, 482–502, 2000.
Pye, H. O. T., Liao, H., Wu, S., Mickley, L. J., Jacob, D. J., Henze, D. K., and Seinfeld, J. H.: Effect of changes in climate and emissions on future sulfate-nitrate-ammonium aerosol levels in the United States, J. Geophys. Res., 114, D01205, https://doi.org/10.1029/2008JD010701, 2009.
Pye, H. O. T., Nenes, A., Alexander, B., Ault, A. P., Barth, M. C., Clegg, S. L., Collett Jr., J. L., Fahey, K. M., Hennigan, C. J., Herrmann, H., Kanakidou, M., Kelly, J. T., Ku, I.-T., McNeill, V. F., Riemer, N., Schaefer, T., Shi, G., Tilgner, A., Walker, J. T., Wang, T., Weber, R., Xing, J., Zaveri, R. A., and Zuend, A.: The acidity of atmospheric particles and clouds, Atmos. Chem. Phys., 20, 4809–4888, https://doi.org/10.5194/acp-20-4809-2020, 2020.
Raizenne, M., Neas, L. M., Damokosh, A. I., Dockery, D. W., Spengler, J. D., Koutrakis, P., Ware, J. H., and Speizer, F. E.: Health effects of acid aerosols on North American children: pulmonary function, Environ. Health Persp., 104, 506–514, 1996.
Seinfeld, J. H. and Pandis, S. N.: Atmospheric Chemistry and Physics. From Air Pollution to Climate Change, second edn., Wiley, New Jersey, 2006.
Skamarock, W. C., Klemp, J. B., Dudhia, J., Gill, D. O., Barker, D. M., Wang, W., and Powers, J. G.: A description of the advanced research WRF Version 2, NCAR Technical Note, available at: http://opensky.ucar.edu/islandora/object/technotes:479/datastream/PDF/view (last access: 8 January 2021), 2005.
Sposito, G.: The Chemistry of Soils, Oxford University Press, Oxford, 1989.
Squizzato, S., Masiol, M., Brunelli, A., Pistollato, S., Tarabotti, E., Rampazzo, G., and Pavoni, B.: Factors determining the formation of secondary inorganic aerosol: a case study in the Po Valley (Italy), Atmos. Chem. Phys., 13, 1927–1939, https://doi.org/10.5194/acp-13-1927-2013, 2013.
Tsimpidi, A. P., Karydis, V. A., Zavala, M., Lei, W., Molina, L., Ulbrich, I. M., Jimenez, J. L., and Pandis, S. N.: Evaluation of the volatility basis-set approach for the simulation of organic aerosol formation in the Mexico City metropolitan area, Atmos. Chem. Phys., 10, 525–546, https://doi.org/10.5194/acp-10-525-2010, 2010.
Tuccella, P., Curci, G., Visconti, G., Bessagnet, B., Menut, L., and Park, R. J.: Modeling of gas and aerosol with WRF/Chem over Europe: evaluation and sensitivity study, J. Geophys. Res., 117, D03303, https://doi.org/10.1029/2011JD016302, 2012.
Vasilakos, P., Russell, A., Weber, R., and Nenes, A.: Understanding nitrate formation in a world with less sulfate, Atmos. Chem. Phys., 18, 12765–12775, https://doi.org/10.5194/acp-18-12765-2018, 2018.
Visschedijk, A. J. H., Zandveld, P., and Denier van der Gon, H. A. C.: TNO Report 2007 A-R0233/B: A high resolution gridded European emission database for the EU integrated project GEMS, Organization for Applied Scientific Research, the Netherlands, 2007.
Walker, J. M., Philip, S., Martin, R. V., and Seinfeld, J. H.: Simulation of nitrate, sulfate, and ammonium aerosols over the United States, Atmos. Chem. Phys., 12, 11213–11227, https://doi.org/10.5194/acp-12-11213-2012, 2012.
Wang, H., Sun, Z., Li, H., Gao, Y., Wu, J., and Cheng, T.: Vertical distribution characteristics of atmospheric aerosols under different thermodynamic conditions in Beijing, Aerosol Air Qual. Res., 18, 2775–2787, 2018.
Weber, R. J., Guo, H., Russell, A. G., and Nenes, A.: High aerosol acidity despite declining atmospheric sulfate concentrations over the past 15 years, Nat. Geosci., 9, 1–5, 2016.
Xue, J., Lau, A. K. H., and Yu, J. Z.: A study of acidity on PM2.5 in Hong Kong using online ionic chemical composition measurements, Atmos. Environ., 45, 7081–7088, 2011.
Yu, S., Dennis, R., Roselle, S., Nenes, A., Walker, J., Eder, B., Schere, K., Swall, J., and Robarge, W.: An assessment of the ability of three-dimensional air quality models with current thermodynamic equilibrium models to predict aerosol , J. Geophys. Res., 110, D07S13, https://doi.org/10.1029/2004JD004718, 2005.
Zakoura, M. and Pandis, S. N.: Overprediction of aerosol nitrate by chemical transport models: The role of grid resolution, Atmos. Environ., 187, 390–400, 2018.