the Creative Commons Attribution 4.0 License.
the Creative Commons Attribution 4.0 License.
 | 26 May 2021
Aircraft measurements of aerosol and trace gas chemistry in the eastern North Atlantic
Maria A. Zawadowicz
Kaitlyn Suski
Jiumeng Liu
Mikhail Pekour
Jerome Fast
Arthur J. Sedlacek
Stephen Springston
Yang Wang
Rahul A. Zaveri
Robert Wood
Jian Wang
The Aerosol and Cloud Experiment in the Eastern North Atlantic (ACE-ENA) investigated properties of aerosols and subtropical marine boundary layer (MBL) clouds. Low subtropical marine clouds can have a large effect on Earth's radiative budget, but they are poorly represented in global climate models. In order to understand their radiative effects, it is imperative to understand the composition and sources of the MBL cloud condensation nuclei (CCN). The campaign consisted of two intensive operation periods (IOPs) (June–July 2017 and January–February 2018) during which an instrumented G-1 aircraft was deployed from Lajes Field on Terceira Island in the Azores, Portugal. The G-1 conducted research flights in the vicinity of the Atmospheric Radiation Measurement (ARM) Eastern North Atlantic (ENA) atmospheric observatory on Graciosa Island. An Aerodyne high-resolution time-of-flight aerosol mass spectrometer (HR-ToF-AMS) and Ionicon proton-transfer-reaction mass spectrometer (PTR-MS) were deployed aboard the aircraft, characterizing chemistry of non-refractory aerosol and trace gases, respectively. The eastern North Atlantic region was found to be very clean, with an average non-refractory submicrometer aerosol mass loading of 0.6 µg m−3 in the summer and 0.1 µg m−3 in the winter, measured by the AMS. Average concentrations of the trace reactive gases methanol and acetone were 1–2 ppb; benzene, toluene and isoprene were even lower, <1 ppb. Mass fractions of sulfate, organics, ammonium and nitrate in the boundary layer were 69 %, 23 %, 7 % and 1 % and remained largely similar between seasons. The aerosol chemical composition was dominated by sulfate and highly processed organics. Particulate methanesulfonic acid (MSA), a well-known secondary biogenic marine species, was detected, with an average boundary layer concentration of 0.021 µg m−3, along with its gas-phase precursor, dimethyl sulfide (DMS). MSA accounted for no more than 3 % of the submicron, non-refractory aerosol in the boundary layer. Examination of vertical profiles of aerosol and gas chemistry during ACE-ENA reveals an interplay of local marine emissions and long-range-transported aged aerosol. A case of transport of biomass burning emissions from North American fires has been identified using back-trajectory analysis. In the summer, the non-refractory portion of the background CCN budget was heavily influenced by aerosol associated with ocean productivity, in particular sulfate formed from DMS oxidation. Episodic transport from the continents, particularly of biomass burning aerosol, periodically increased CCN concentrations in the free troposphere. In the winter, with ocean productivity lower, CCN concentrations were overall much lower and dominated by remote transport. These results show that anthropogenic emissions perturb CCN concentrations in remote regions that are sensitive to changes in CCN number and illustrate that accurate predictions of both transport and regional aerosol formation from the oceans are critical to accurately modeling clouds in these regions.
- Article
(13778 KB) - Full-text XML
-
Supplement
(9258 KB) - BibTeX
- EndNote


Interactions of atmospheric aerosols with clouds and precipitation are a vital, yet uncertain, part of the climate system. Indirect aerosol radiative forcing effects are associated with large uncertainties in global climate models (Boucher et al., 2013), and they are poorly constrained, with a factor of 5 variation across different models (Quaas et al., 2009). An effect that is especially relevant to these clouds is the first indirect or Twomey effect (Twomey, 1974), which accounts for changes to cloud albedo resulting from perturbations in aerosol concentration and therefore the cloud condensation nuclei (CCN) availability. Remote marine clouds are particularly susceptible to perturbations in aerosol concentrations because they are relatively optically thin, and the background aerosol concentrations in the remote MBL are low (Bony and Dufresne, 2005; Carslaw et al., 2013; Quaas et al., 2009; Wood, 2005). However, by itself, the Twomey effect is insufficient in explaining all indirect effects (Wood, 2007). Factors such as aerosol suppression of precipitation can also be important (Wood, 2005; Wood et al., 2015), highlighting the need for measurement of aerosol and cloud properties in the remote MBL.
Sources of CCN in the MBL have been at the center of much research for several decades. Early studies have hypothesized that dimethyl sulfide (DMS), a volatile organic compound (VOC) produced by phytoplankton, is a major source of secondary sulfate aerosols, which then dominate the marine CCN budget (Charlson et al., 1987). This came to be known as the CLAW hypothesis, which posits a feedback loop between ocean biochemistry, marine cloud properties and climate (Charlson et al., 1987). More recently, it has been shown that there are factors, such as additional sea salt sources of CCN in the MBL or complex interactions between CCN and aerosol–cloud interactions, that prevent DMS-derived sulfate from being directly involved in a climate feedback mechanism (Quinn and Bates, 2011). Sea salt sources of CCN that compete with DMS-derived sulfate include primary organic species emitted together with sea salt upon bubble bursting, which is a mixture of fragments of marine biota, their exudates, and other simple proteins, lipids, and carbohydrates (Quinn and Bates, 2011). However, it has also been shown that sea salt contributes only 30 % to the CCN budget in midlatitudes, and secondary, possibly DMS derived, non-sea-salt sulfate can dominate most MBL CCN budgets (Quinn et al., 2017). This secondary source of CCN has been shown to be important in the ENA region (Zheng et al., 2018). Because the emissions of marine VOCs and chemistry of both primary and secondary marine organic aerosol are controlled by ocean ecosystems, they are likely impacted by climate change. Sea surface temperatures drive marine phytoplankton diversity, and the distributions of phytoplankton species in the warming ocean are likely to shift in the near future (Flombaum et al., 2013; Righetti et al., 2019). A recent modeling study by Wang et al. (2018) found significant radiative effects from such broad community shifts. Understanding complex relationships between ocean diversity, aerosol chemistry and MBL clouds is of critical importance in the changing climate.
Apart from local oceanic sources of aerosols, such as DMS oxidation and ejection of sea salt, the remote MBL can also be impacted by long-range continental transport. Biomass burning plumes can be effectively transported between the continents (Brocchi et al., 2018), as the aerosols are injected into the free troposphere or the stratosphere. Secondary aerosols of continental origins, such as secondary organic aerosol (SOA) produced by oxidation of VOCs, can also potentially reach the remote atmosphere. Recent studies have shown that SOA may be more resistant to evaporation than previously thought, increasing the SOA lifetime and the distances it can be transported (Shrivastava et al., 2013, 2015; Vaden et al., 2010, 2011; Zelenyuk et al., 2012). Furthermore, recent research has shown that while the lifetime of most biogenic SOA is shorter than their mechanical removal timescales, there exists a fraction of non-photolabile SOA that could potentially have long lifetimes and be effectively transported into the remote regions (O'Brien and Kroll, 2019; Zawadowicz et al., 2020). In summary, the MBL CCN budget is composed of primary ocean emissions (sea salt and primary organics), secondary aerosols derived from ocean biogenic VOCs and aerosols transported remotely from the continents. The specific local variations of those sources, their seasonality, and the exact mixing states of MBL aerosols are difficult to predict due to a lack of detailed chemical measurements of aerosol in remote marine regions yet crucial for understanding cloud properties and radiative forcing in these areas.
This study focuses on chemical measurements of non-refractory aerosol and trace gas composition vertical profiles, from the Aerosol and Cloud Experiment in the Eastern North Atlantic (ACE-ENA), a US Department of Energy (DOE) airborne measurement campaign. The site of these measurements is the Azores archipelago in the eastern North Atlantic (Fig. 1), which is uniquely suited for characterization of both marine and long-range-transported aerosol properties and various meteorological conditions favorable to both of these CCN composition regimes. Graciosa Island in the Azores is also the location of a permanent DOE Atmospheric Radiation Measurement (ARM) user facility measurement site. Because the Azores straddle the boundary between subtropics and midlatitudes, they experience a wide range of meteorological conditions throughout the year (Wood et al., 2015). There is a marked seasonality in the wind patterns near the Graciosa site: in the winter, there is a strong gradient of surface pressure between the Icelandic low and the Azores high-pressure systems, and the winds tend to have high average speeds and come from the southwest (Wood et al., 2015). In the summer, the Icelandic low disappears and the Azores high-pressure system strengthens, which is associated with winds predominantly from the northwest with lower average wind speeds (Wood et al., 2015). The high wind speeds are responsible for higher sea salt contributions to the ENA CCN budget in the winter (Zheng et al., 2018). This pattern is also responsible for the seasonal peak in total cloud fraction, which occurs the winter (Wood et al., 2015). This dynamic complexity makes it difficult to attribute sources of aerosols in the ENA region because the MBL air masses are continually diluted with free-tropospheric air on a timescale of several days (Wood et al., 2015). As observed during the Clouds, Aerosol, and Precipitation in the Marine Boundary Layer (CAP-MBL) campaign, marine air masses can have continental features due to the entrainment from the free troposphere (Wood et al., 2015). Previous measurements on Pico Island also indicate a seasonal summer peak in carbon monoxide due to long-range transport from North America (Val Martin et al., 2008). Additionally, single-scattering albedo measurements during CAP-MBL indicate that the aerosols are more absorbing during springtime, also consistent with transport of North American biomass burning aerosols (Logan et al., 2014).
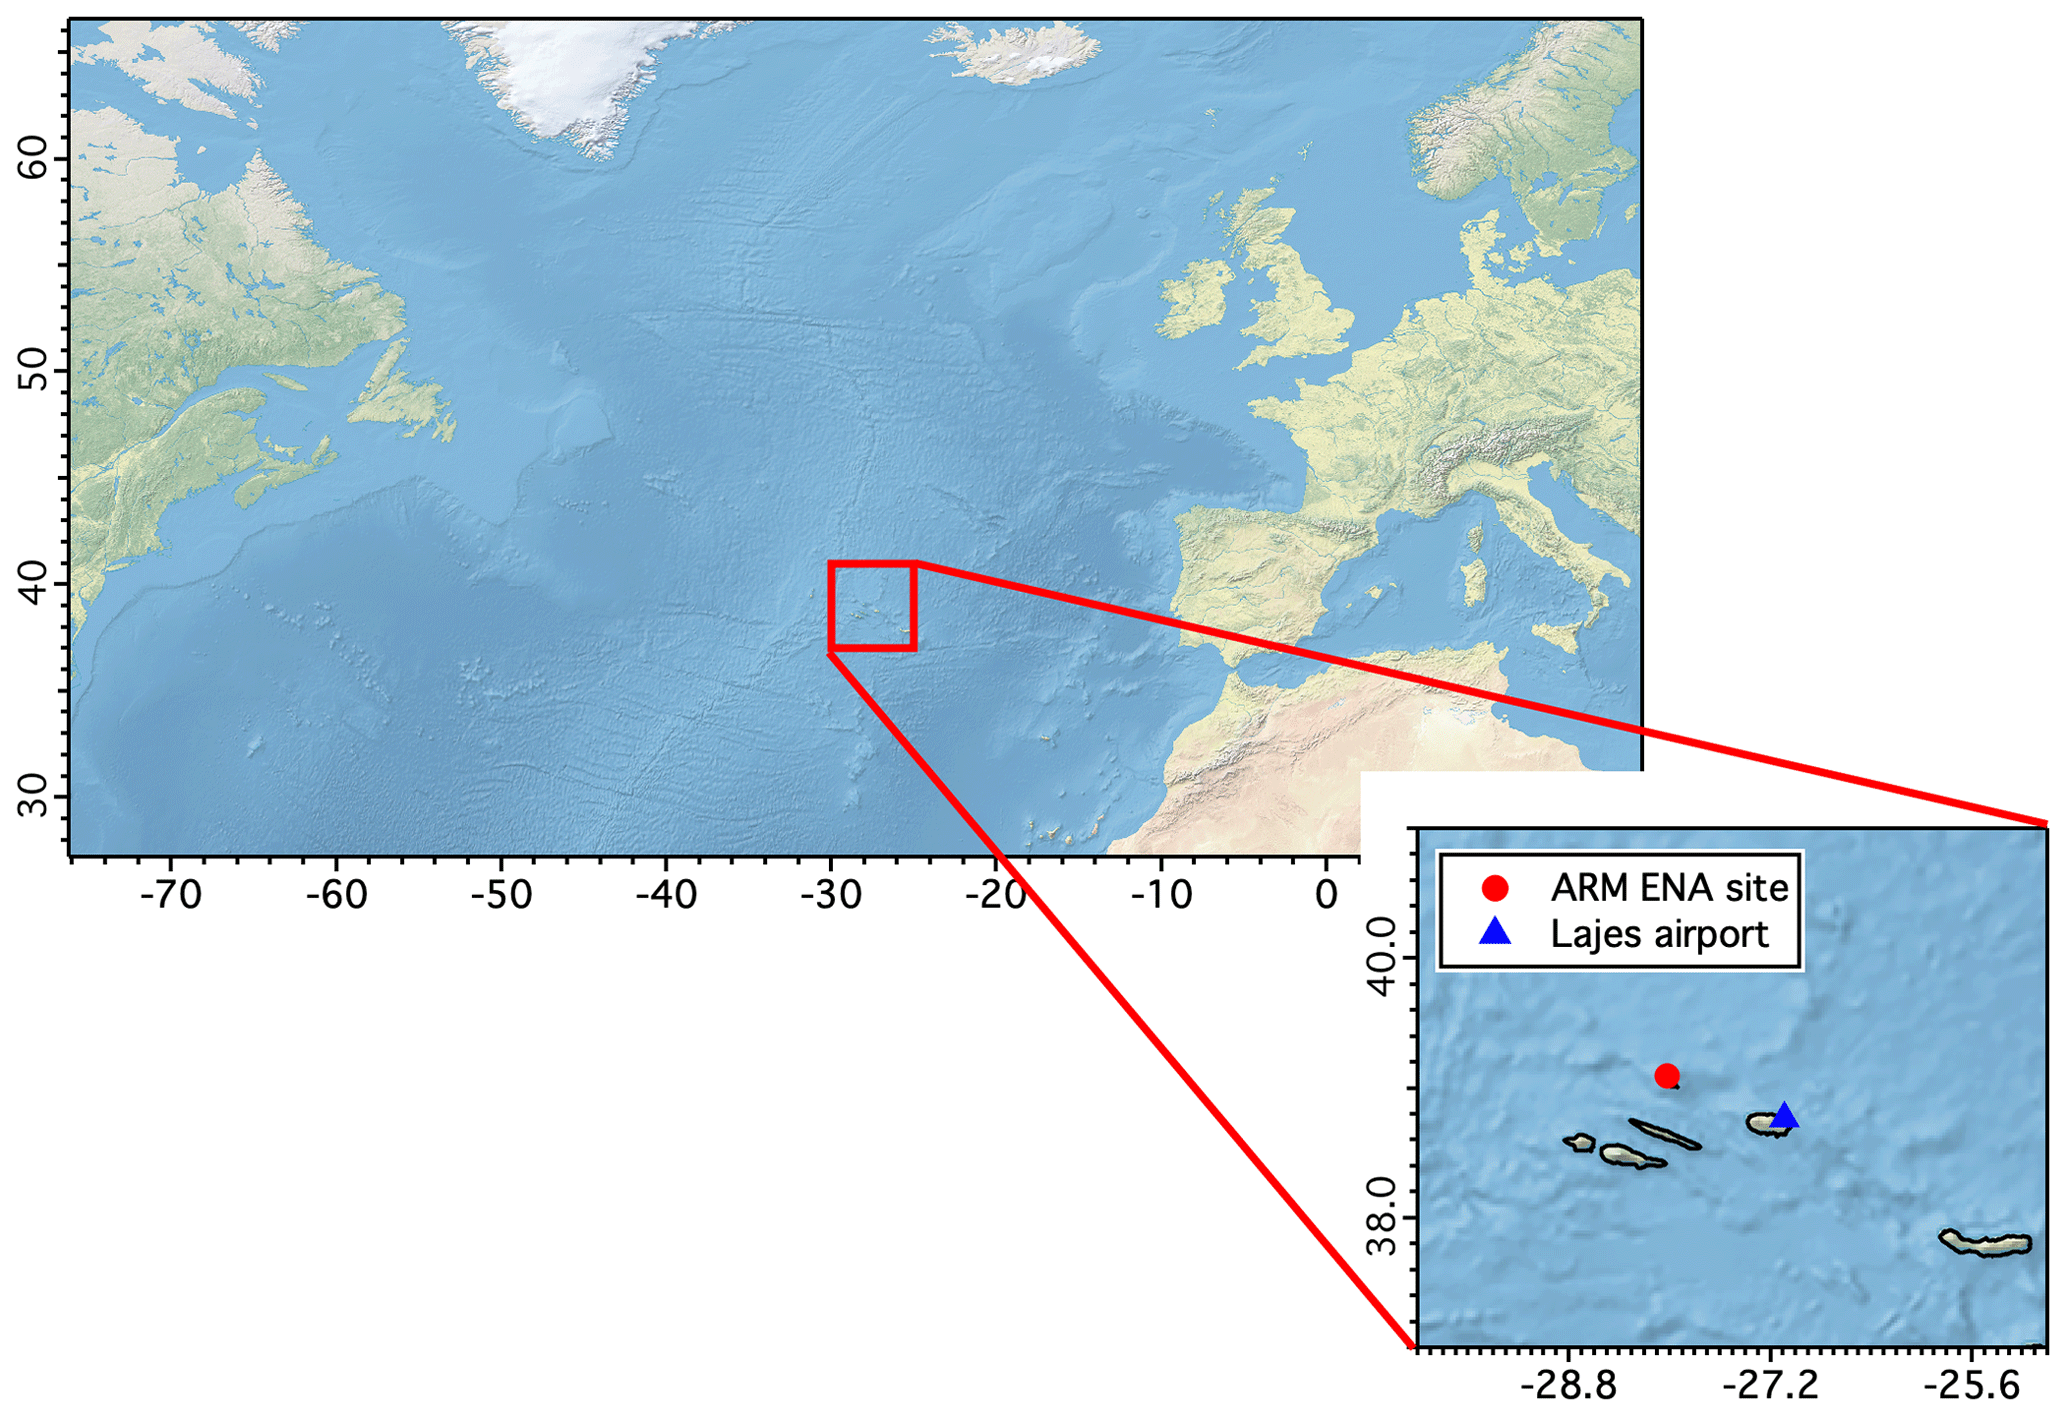
Figure 1Geographical location of the Azores archipelago, the site of the ACE-ENA campaign. The map was created using public domain map data on Natural Earth (https://www.naturalearthdata.com/, last access: 12 March 2020) and the GSHHG database (https://ngdc.noaa.gov/mgg/shorelines/, last access: 12 March 2020).
The atmospheric chemistry of the North Atlantic region, including the Azores, has been studied in previous oceanographic cruises (Andreae et al., 2003) and aircraft campaigns. Early work on sulfur cycle in the eastern North Atlantic has been summarized by Galloway et al. (1992). Notable campaigns in the region include the Atlantic Stratocumulus Transition Experiment/Marine Aerosol and Gas Exchange (ASTEX/MAGE) (Blomquist et al., 1996) and the second Aerosol Characterization Experiment (ACE-2) (Raes et al., 2000). Of note are also studies on the west coast of Ireland at the Mace Head observatory, which frequently encounter North Atlantic air masses, as described in Dall'Osto et al. (2010) and Ovadnevaite et al. (2014).
More recent field measurements focusing on the aerosol chemistry of the North Atlantic region include the NASA North Atlantic Aerosols and Marine Ecosystems Study (NAAMES), which included both aircraft and shipborne observations focused on marine biological productivity of the western North Atlantic (Behrenfeld et al., 2019), and the African biomass-burning-focused NASA Observations of Aerosols above Clouds and their Interactions (ORACLES), which included aircraft deployments of a suite of instruments, including the aerosol mass spectrometer (AMS), in the southeastern Atlantic. The AMS has a long field deployment history on a variety of platforms (Zhang et al., 2007), but particle composition measurements in remote marine environments are of recent interest. Between 2011 and 2012, an AMS was deployed aboard the German research vessel Polarstern during four cruises in the Atlantic Ocean (Huang et al., 2017, 2018). The average aerosol composition was found to be ∼50 % sulfate and ∼20 % organic (Huang et al., 2018). The organic component was further analyzed with positive matrix factorization, and it was determined to be a mixture of primary and secondary (DMS- and amine-derived) marine aerosol and aerosol transported from North America (Huang et al., 2018). Between 2016 and 2017, AMS was also deployed aboard the NASA DC-8 aircraft during the Atmospheric Tomography (ATom) missions in the remote atmosphere, including the North Atlantic region (Hodshire et al., 2019). In 2015, AMS was also deployed on aircraft as a part of the Network on Climate and Aerosols: Addressing Key Uncertainties in Remote Canadian Environments (NETCARE) project in the Canadian high Arctic (Abbatt et al., 2019; Willis et al., 2019). A unique feature of the ACE-ENA aircraft deployments is the seasonally resolved measurements during summer and winter in the eastern North Atlantic region.
In this study, we focus on chemical characterization of aerosol and trace gases during ACE-ENA. We present average concentrations of sulfate, total organics, ammonium, and nitrate aerosol components and mixing ratios of trace gases such as methanol, acetone, DMS, isoprene, toluene and benzene. In addition, concentrations of particle-phase methanesulfonic acid (MSA), an oxidation product of DMS, were derived using aircraft measurements and laboratory calibrations. We also discuss vertical profiles of these quantities in context of other G-1 measurements, meteorology and Hybrid Single-Particle Lagrangian Integrated Trajectory model (HYSPLIT) (Stein et al., 2015) back trajectories to elucidate the sources of ENA aerosols.
The ACE-ENA campaign was conducted around the Azores archipelago in the eastern North Atlantic from 1 June 2017 to 28 February 2018. During this period, the DOE G-1 research aircraft, based out of Lajes Field on Terceira Island (Fig. 1), was deployed for two intensive operation periods (IOPs), consisting of flights around the Graciosa Island ENA ARM research site. The first aircraft deployment period occurred in the summer, from 1 June to 31 July 2017, and the second occurred in the winter, from 1 January 2018 to 28 February 2019. During the summertime deployment period, the aircraft completed 20 research flights, and during the winter, it completed 19 research flights (Table S1 in the Supplement). Figure S1 in the Supplement shows flight tracks for all research flights. In general, the flight plans were focused on multiple L-shaped transits at different altitudes with the ENA site as the focal point, with occasional excursions to other cloud layers. Each research flight also typically included at least one spiral profile through the atmosphere to characterize the boundary layer structure. The locations of spiral profiles are shown in Fig. S1c and d and included in Table S1. This study uses the vertical profiles to explore the marine and continental influences on aerosol composition.
2.1 Aerosol mass spectrometry
An Aerodyne high-resolution time-of-flight aerosol mass spectrometer (DeCarlo et al., 2006) (abbreviated as AMS hereafter) was deployed aboard the G-1 to measure non-refractory aerosol chemical composition. The AMS operated only in the standard “V” mass spectrometer mode with 13 s data averaging intervals and equal chopper open and closed periods of 3 s. The particle sizing mode was not used. The standard aerodynamic lens was used, and the AMS vaporizer was set to 600 ∘C. Before and after the flights, air was diverted through a HEPA filter to remove the particulates, and these periods were used to account for gas-phase interferences with isobaric particulate signals. The AMS was regularly calibrated in the field using monodisperse ammonium nitrate particles quantified with a TSI condensation particle counter (CPC), as described in the literature (Canagaratna et al., 2007; Jayne et al., 2000). A collection efficiency of unity is applied to data collected here, due to high acidity of the marine environment (Middlebrook et al., 2012). AMS data were processed using the ToF-AMS analysis toolkit Squirrel version 1.60N and ToF-AMS HR analysis toolkit Pika version 1.20N.
The AMS sampled from two G-1 inlets, an isokinetic aerosol inlet and a counterflow virtual impactor (CVI) inlet. Sample streams between two inlets were switched by the instrument operator aboard the aircraft based on the presence of clouds. This paper limits the discussion to data obtained during the isokinetic inlet sampling. The isokinetic inlet transmission efficiency is greater than 95 % for 0.01–5 µm diameter particles. It should be noted that this study is not sensitive to sea salt because AMS, which uses thermal desorption as a component of its ionization system, is not sensitive to refractory particle compositions.
Apart from regular calibrations with monodisperse ammonium nitrate, AMS was also calibrated for MSA in the laboratory after the campaign. The details of this calibration are discussed in the Supplement.
2.2 Trace gas mass spectrometry
An Ionicon quadrupole high-sensitivity proton-transfer-reaction mass spectrometer (abbreviated as PTR-MS hereafter) was used to measure selected gas-phase VOC concentrations. The PTR-MS was run in ion monitoring mode in which signals of a limited number of pre-selected values are sequentially measured, with one measurement cycle taking 3.5 s. Drift tube temperature, pressure and voltage were held at 60 ∘C, 2.22 hPa and 600 V, respectively. The PTR-MS sampled air through a dedicated inlet that consisted of approximately 6 in. (15.24 cm) of in. (6.35 mm) o.d. stainless steel with 0.035 in. (0.89 mm) wall thickness, followed by approximately 46 in. (116.84 cm) of in. (6.35 mm) o.d. ( in. (4.76 mm) i.d.) Teflon tubing, including a Teflon filter, and 36 in. (91.44 cm) of in. (1.59 mm) o.d. (0.055 in. (1.40 mm) i.d.) PEEK tubing. To assess the PTR-MS background, air was periodically diverted through a stainless-steel tube filled with a Shimadzu platinum catalyst heated to 600 ∘C, which removed VOCs from the airstream without perturbing the water vapor content. The PTR-MS was calibrated by introducing known concentrations of calibration gases into the instrument with variable dilution by VOC-free air. Two different calibration tanks were used: one in the field and one in the lab before and after the IOPs. Much of the summer IOP PTR-MS data were affected by a loss of sensitivity resulting from a faulty electrical connection in the quadrupole. Additionally, DMS backgrounds throughout the summer campaign were found to be elevated, even with the flow diverted through the catalyst. This could be due to an isobaric interference or incomplete removal of DMS by the catalyst. Absolute concentrations of DMS, especially during the summer intensive period, are biased high due to these factors and should be regarded as largely qualitative.
2.3 Supporting measurements
Ozone was measured with a Thermo Scientific Model 49i ozone analyzer based on measurement of UV absorption at 254 nm. The instrument was regularly calibrated in flight by displacement of known quantities of ozone and zeroed in flight using ozone-scrubbed ambient air. CO was measured using a Los Gatos Research CO–N2O–H2O analyzer based on cavity-enhanced near-IR absorption and was also calibrated regularly in flight. Refractory black carbon concentration was measured using a Droplet Measurement Technologies (DMT) single-particle soot photometer (SP2). The SP2 was calibrated at the beginning, during and at the end of the deployment using fullerene soot in order to closely mimic the morphology of ambient black carbon. CCN concentrations were measured with the Droplet Measurement Technologies CCN-200 cloud condensation nuclei counter. A CCN counter draws ambient aerosol through a column with supersaturated water vapor, where it can activate into cloud droplets. The instrument then sizes and counts activated ambient aerosol as a function of supersaturation (Roberts and Nenes, 2005). A two-column CCN counter was used on the G-1, with one column at 0.1 % supersaturation and the other at 0.3 % supersaturation. The instrument was calibrated with size-selected ammonium sulfate. G-1 position and altitude and wind direction and velocity were measured using an Aventech AIMMS-20 probe.
3.1 Background aerosol and trace gas composition in the eastern North Atlantic
3.1.1 Aerosol chemistry
Figure 2 and Table 1 summarize AMS measurements obtained during the 39 ACE-ENA research flights. In the summer MBL, mean loadings for organics, non-sea-salt sulfate, ammonium and nitrate were 0.18, 0.55, 0.05 and 0.01 µg m−3, respectively (Table 1). These are low concentrations, illustrating clean conditions in the remote ENA region. The low abundance of nitrate is expected given the minor influence of anthropogenic pollution over the remote North Atlantic. Low ammonium is also expected, given the distance from ammonia emissions. In the summer free troposphere, mean loadings of the same species were 0.12, 0.18, 0.03 and 0.01 µg m−3, respectively (Table 1). In the MBL, mean winter loadings for organics, non-sea-salt sulfate, ammonium and nitrate were 0.04, 0.11, 0.01 and 0.003 µg m−3, respectively (Table 1). In the free troposphere, mean winter loadings for the same species were 0.03, 0.06, 0.01 and 0.002 µg m−3, respectively (Table 1). Apart from low average abundance, these measurements also show strong seasonality with significantly lower concentrations of all aerosol species observed in the winter campaign. For both organics and non-sea-salt sulfate, abundances during the summer were 4 times larger than in the winter. For comparison, mean organic, sulfate, ammonium and nitrate concentrations measured in GoAmazon 2014/15 in the central Amazon basin, a remote continental location, during the wet season were 0.91, 0.16, 0.05 and 0.02 µg m−3 respectively (Shilling et al., 2018). AMS measurements of organics, sulfate, ammonium and nitrate from the NEAQS 2002 campaign measured from a ship in the vicinity of the NE USA, a likely source region of transported aerosol, were 5.0, 2.1, 0.65 and 0.30 µg m−3 respectively (de Gouw et al., 2005; Zhang et al., 2007). AMS measurements of the same species aboard research ship Polarstern during the North Atlantic transect along the coast of Europe and Africa were 0.53, 1.38, 0.29 and 0.09 µg m−3, respectively, in the spring and 0.47, 0.76, 0.20 and 0.07 µg m−3, respectively, in the winter (Huang et al., 2018). The NAAMES cruises in the western North Atlantic provide another point of comparison: in the winter, the loadings of organics, non-sea-salt sulfate, ammonium and nitrate were , , and , respectively, and in the late spring they were , , and , respectively, for marine/continental air mass origin (Saliba et al., 2020). Thus, the AMS measurements during ACE-ENA represent some of the cleanest conditions measured with AMS, and they are broadly consistent with other measurements in marine environments.

Figure 2Summary of aerosol chemistry measurements acquired with the HR-ToF-AMS aboard the G-1 aircraft during ACE-ENA. Boxes are centered on daily medians, box boundaries extend between the 25th and 75th percentile, and whiskers extend between the 10th and 90th percentile. (a, c) IOP 1 measurements. (b, d) IOP 2 measurements. Panels (a)–(d) are for and altitude window of 1000–3000 m.
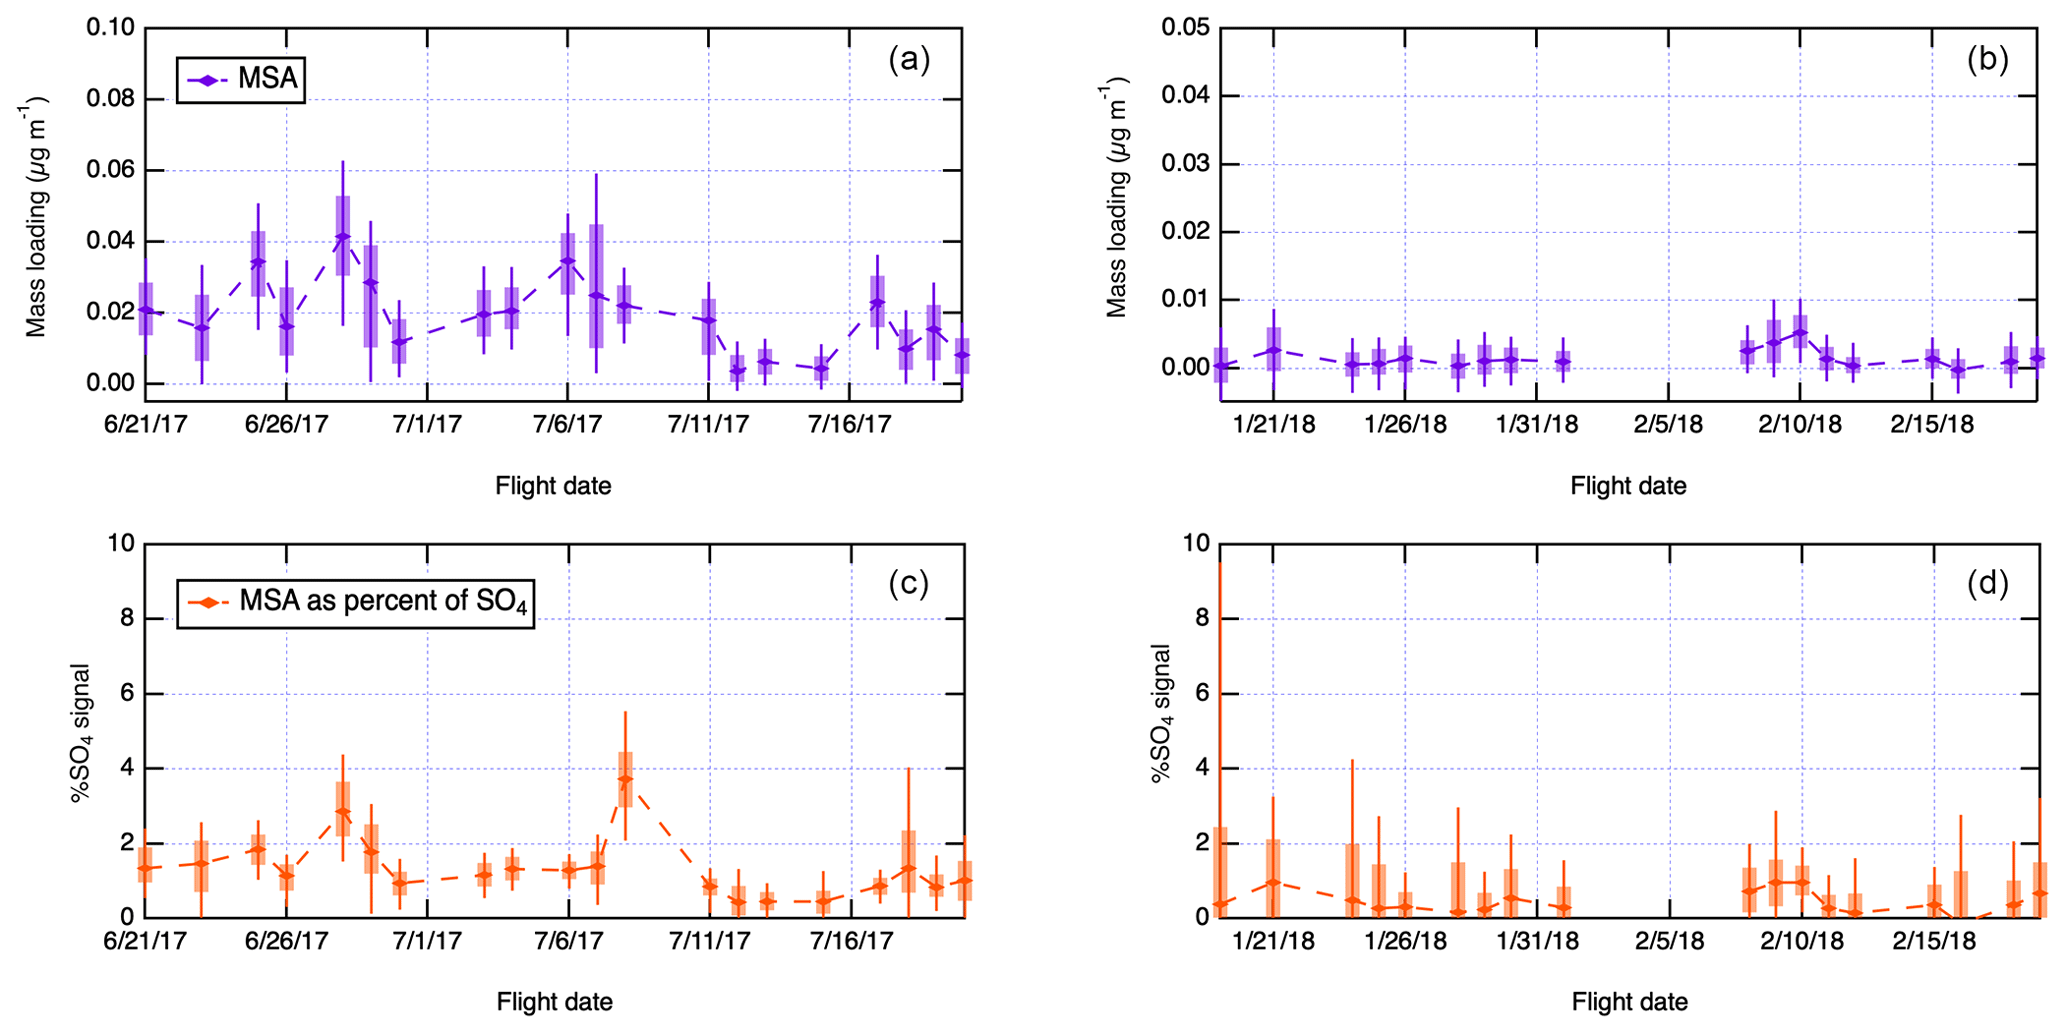
Figure 3Summary of methanesulfonic acid (MSA) measurements derived from the AMS mass spectra collected during ACE-ENA and laboratory calibrations as described in the Experimental section, expressed as total particle-phase MSA (a, b) and percentage of total AMS sulfate signal (c, d). Boxes are centered on daily medians, box boundaries extend between the 25th and 75th percentile, and whiskers extend between the 10th and 90th percentile. (a, c) IOP 1 measurements. (b, d) IOP 2 measurements. Panels (a)–(d) are for an altitude window <1000 m.
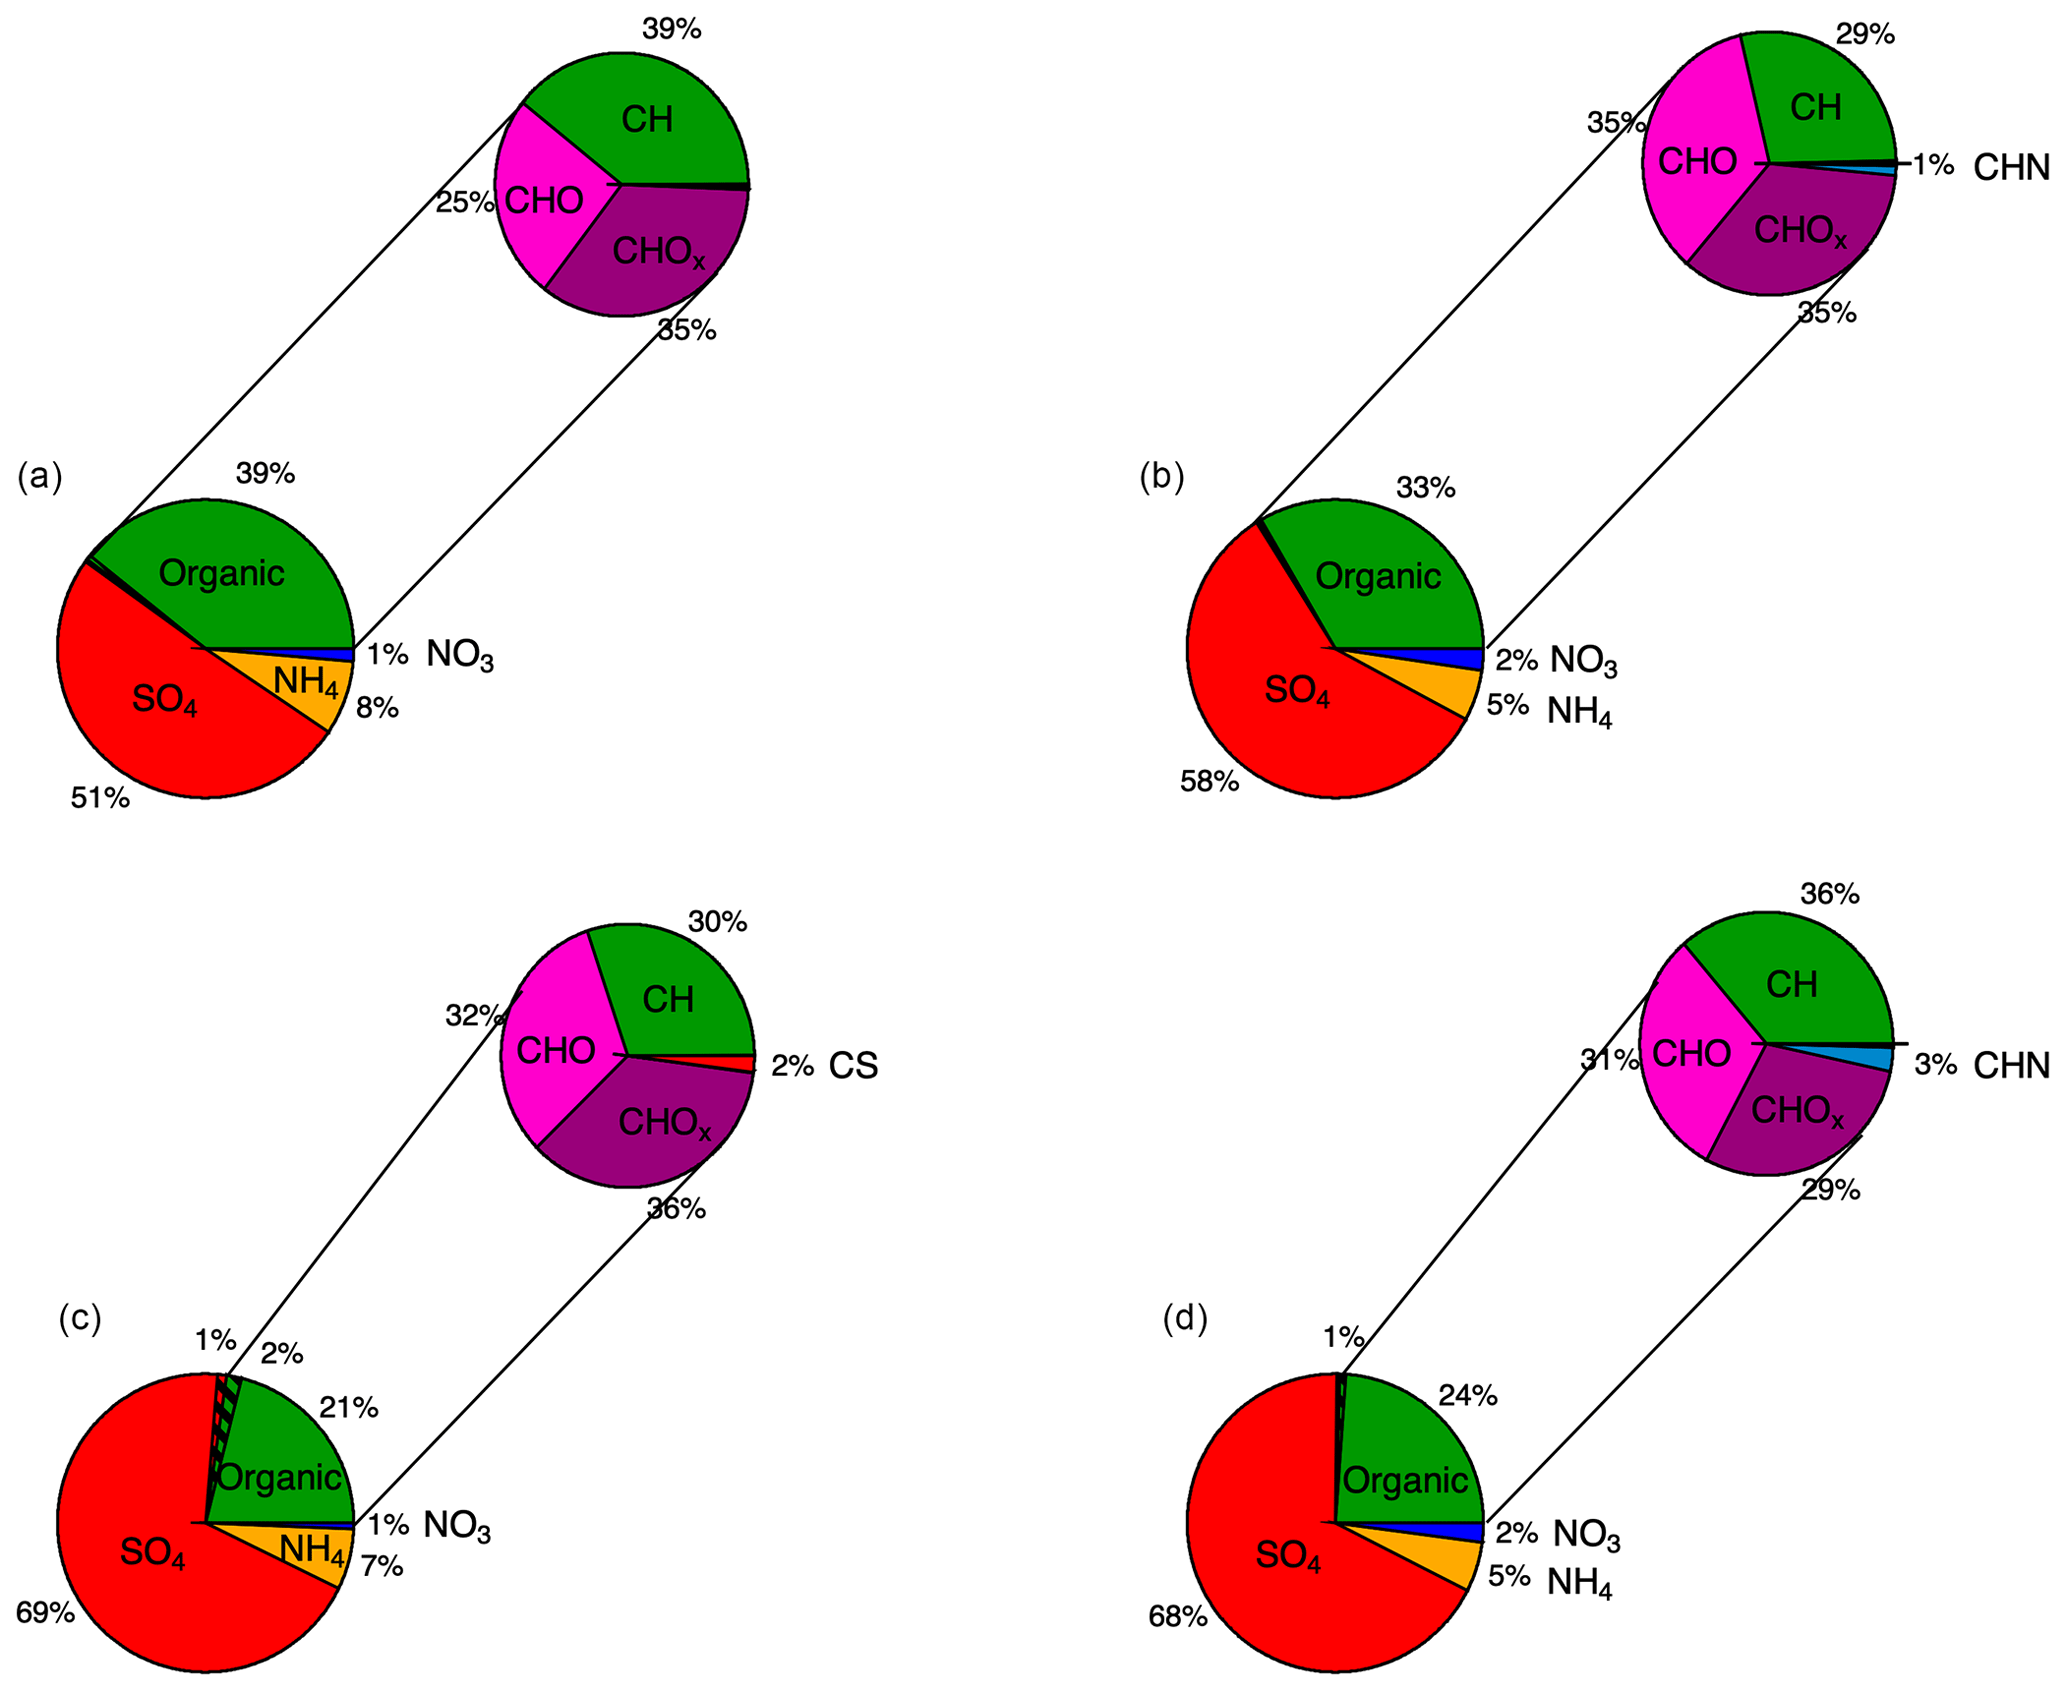
Figure 4Relative contributions of four non-refractory components of aerosol chemistry: organic, sulfate, ammonium and nitrate to boundary layer AMS observations shown in Fig. 2 and Table 2 at two different altitude ranges. The hatched portions of organic and sulfate observations represent contributions of MSA. Also shown are relative contributions of different functional groups to the total organic budget. (a) 1000–3000 m, IOP 1. (b) 1000–3000 m, IOP 2. (c) <1000 m, IOP 1. (d) <1000 m, IOP 2.
Table 1Summary of AMS measurements aboard the G-1 during ACE-ENA.
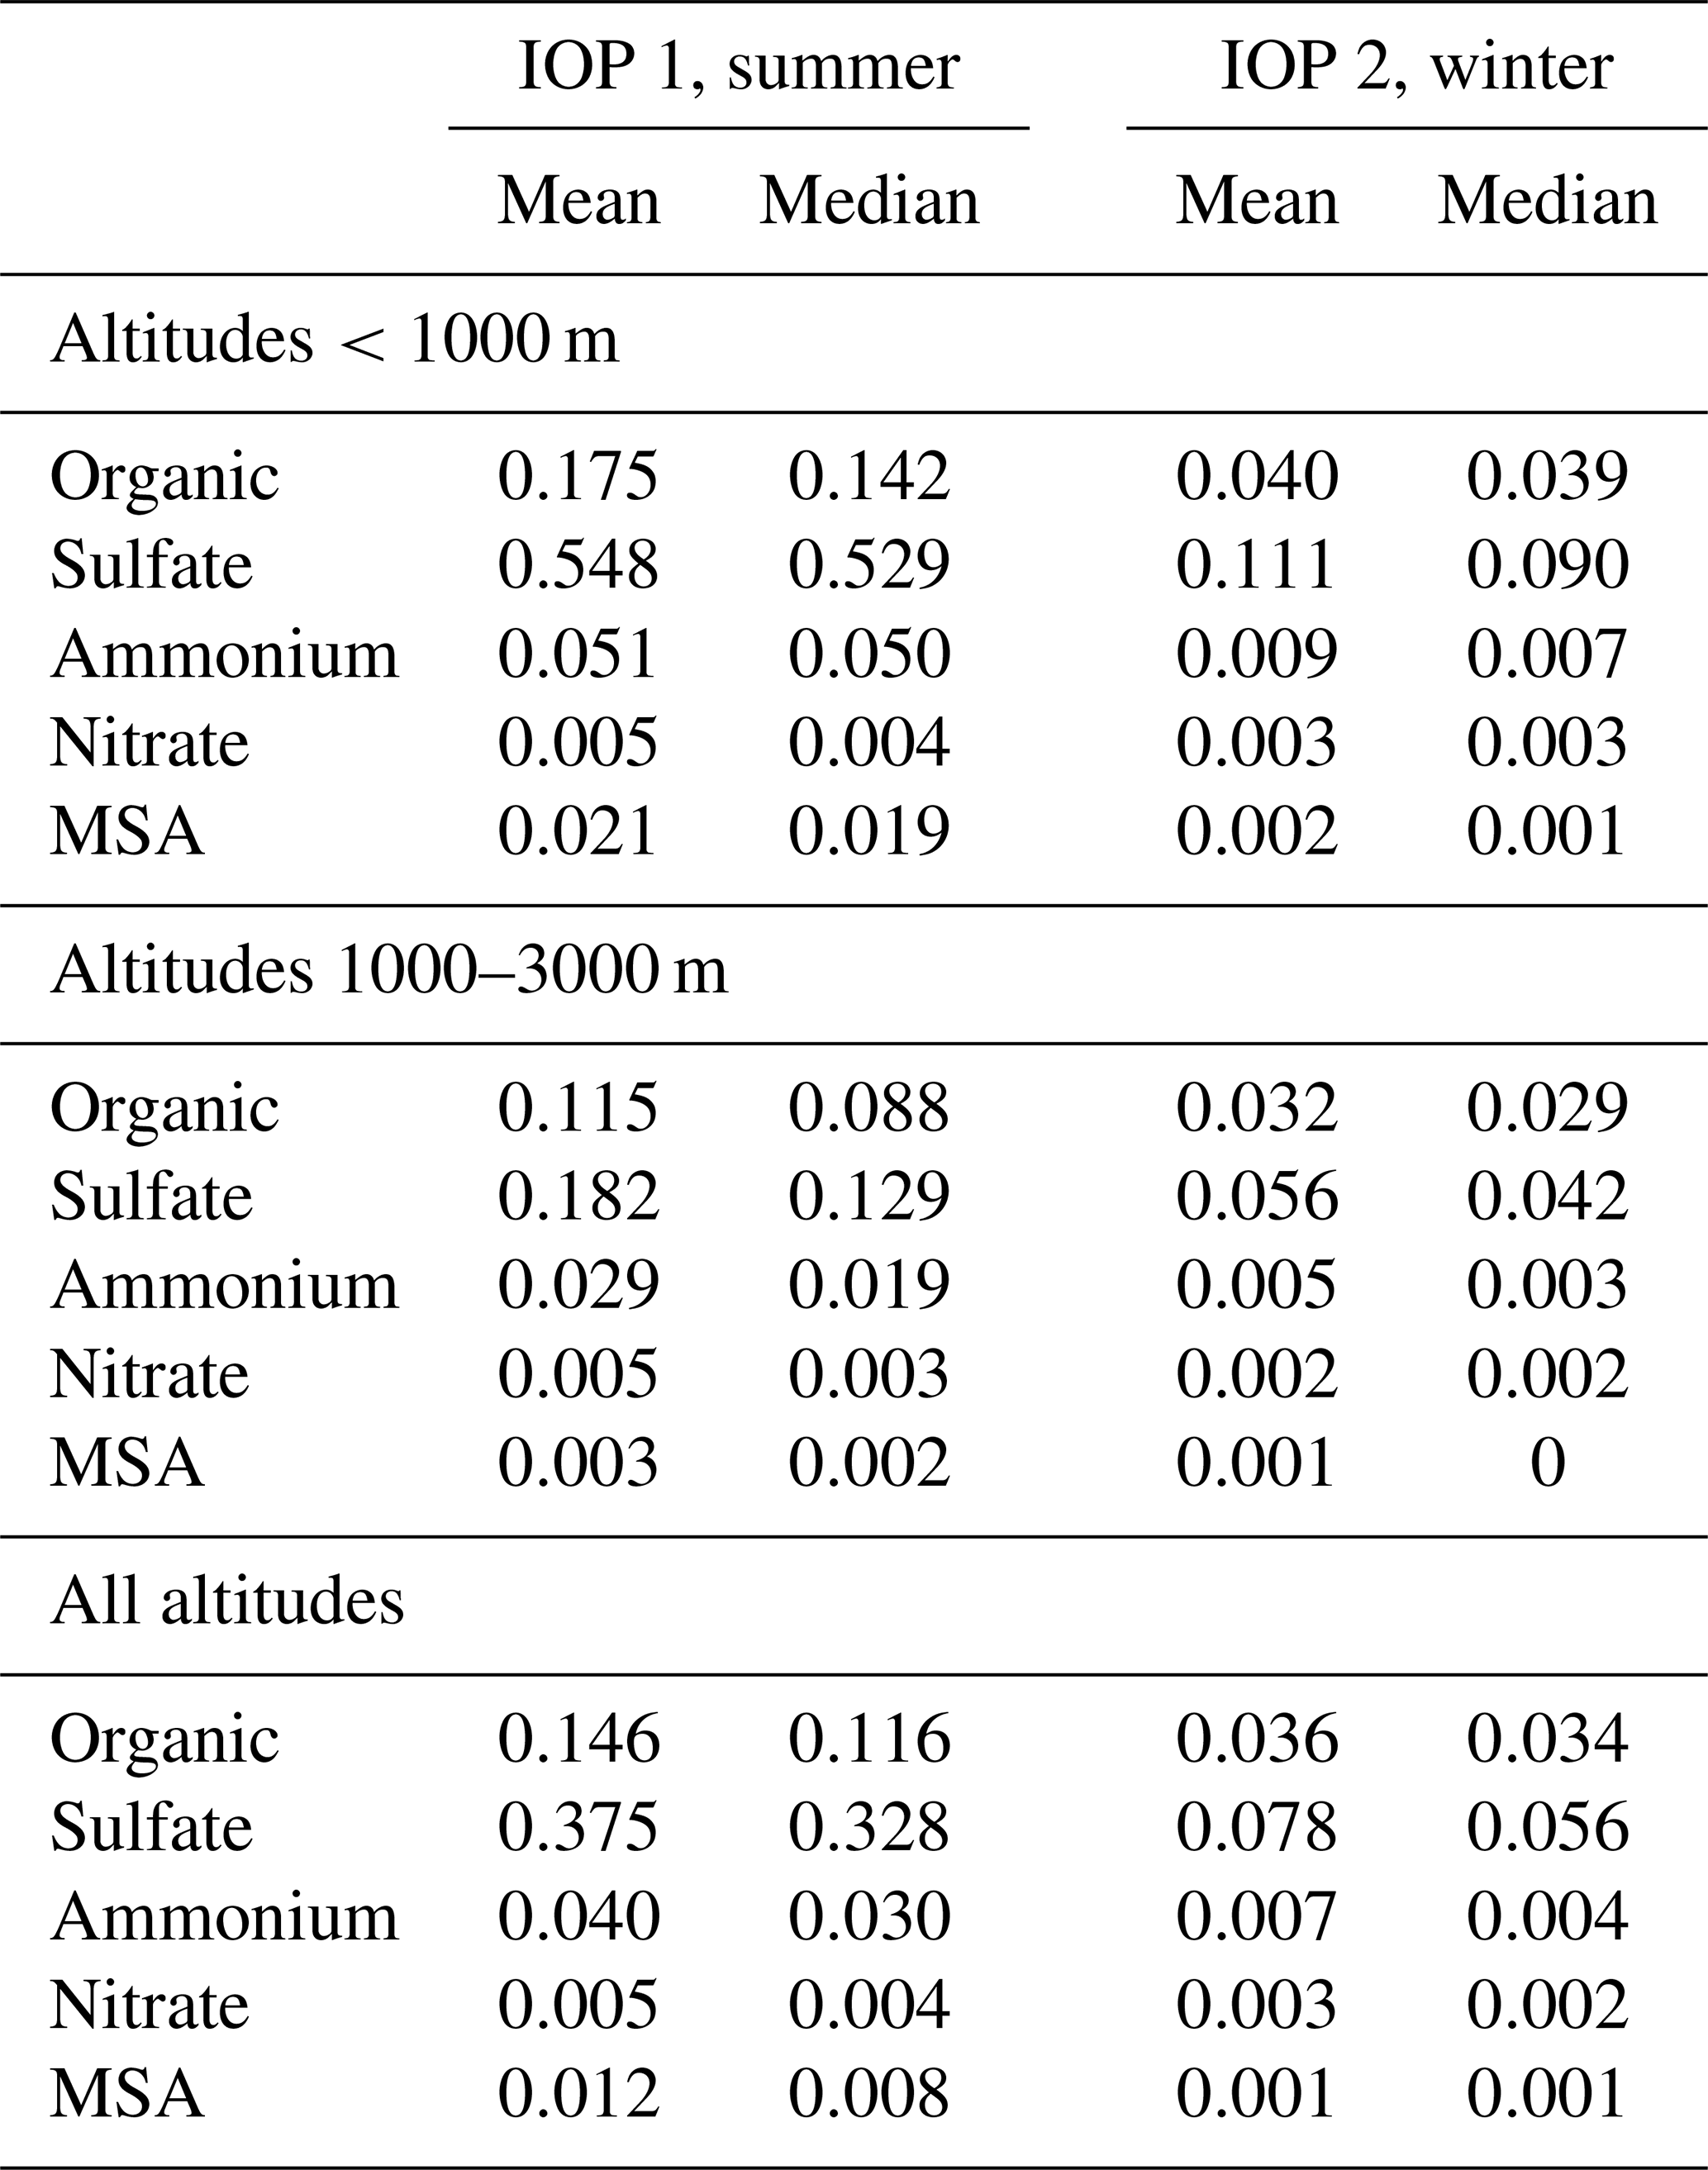
Figure 3 shows a flight-by-flight summary of AMS-derived MSA measurements obtained using a laboratory calibration, as outlined in the Experimental section. MSA measurements shown in Fig. 3 are for altitudes below 1000 m, which are expected to show the strongest marine influence. Campaign averages for MSA are also summarized in Table 1. Average MSA concentrations for altitudes <1000 m during the summer period were 0.021 µg m−3, compared to 0.002 µg m−3 during the winter. The range of concentrations measured during ACE-ENA is comparable to other MSA measurements over the eastern North Atlantic; for example, Huang et al. (2017) reports 0.04 µg m−3 in the spring and 0.01 µg m−3 in the fall, measured with an AMS aboard a research ship in the North Atlantic. Similarly, during the NAAMES cruises, MSA concentrations measured with ion chromatography were reported as 0.07 µg m−3 in the late spring and 0.01 µg m−3 in both March and September (Quinn et al., 2019; Saliba et al., 2020). MSA concentrations strongly vary by season as well; MSA is about 10 times less abundant during the winter compared to the summer. In Fig. 3c and d, total particulate MSA loadings are expressed as fractions of AMS sulfate signal as described in the Supplement. Even during the summer, MSA accounts for a small (<10 %) fraction of the total particulate sulfate. The small fraction of particulate MSA does not, however, indicate that DMS is not a significant source of sulfate mass in the region, as DMS oxidation also produces inorganic sulfate.
The MSA-to-non-sea-salt-sulfate ratio (MSA:SO4) measured during ACE-ENA in the summer was 0.02 on average in the MBL (<1000 m), which is lower than historical estimates of the ratio. For example, Pszenny et al. (1990) reports the ratio as 0.05 in the North Atlantic in August–September, Berresheim et al. (1991) reports 0.033 in the western North Atlantic in September, and Savoie et al. (2002) reports 0.06 in Bermuda in September and 0.05 in Mace Head in August. Huebert et al. (1996) found 0.07 in marine air masses and 0.02 in continental air masses in June in the Azores. The measurements reported in these earlier studies are based on analysis of filter samples, and they may not be directly comparable to AMS measurements reported here. In particular, because the filter samples can measure larger particles than the AMS, this might suggest that some of the MSA was present on coarse aerosols, such as sea salt.
Despite strong seasonality in abundance, relative contributions of non-refractory aerosol compositions are similar between summer and winter. Figure 4 shows relative contributions of sulfate, organics, ammonium and nitrate to the total non-refractory aerosol budget measured by the AMS during both measurement periods. In both IOPs, the fractional contribution of organics, sulfate, ammonium and nitrate were 23 %, 69 %, 6 % and 1 %, respectively. Sulfate is the dominant contribution to the non-refractory aerosol mass in the ACE-ENA region. This in contrast to the dominance of organics at most continental sites in the Northern Hemisphere midlatitudes (Zhang et al., 2007). We observe a trend of decreasing contribution of sulfate with increasing altitude. Sulfate contributes 51 %–58 % to the total non-refractory aerosol at altitudes between 1000 and 3000 m and 68 %–70 % at altitudes below 1000 m. Figure 4 also shows an estimate of average relative MSA contributions to sulfate and organic components, which do not exceed 1 % and 2 %, respectively.
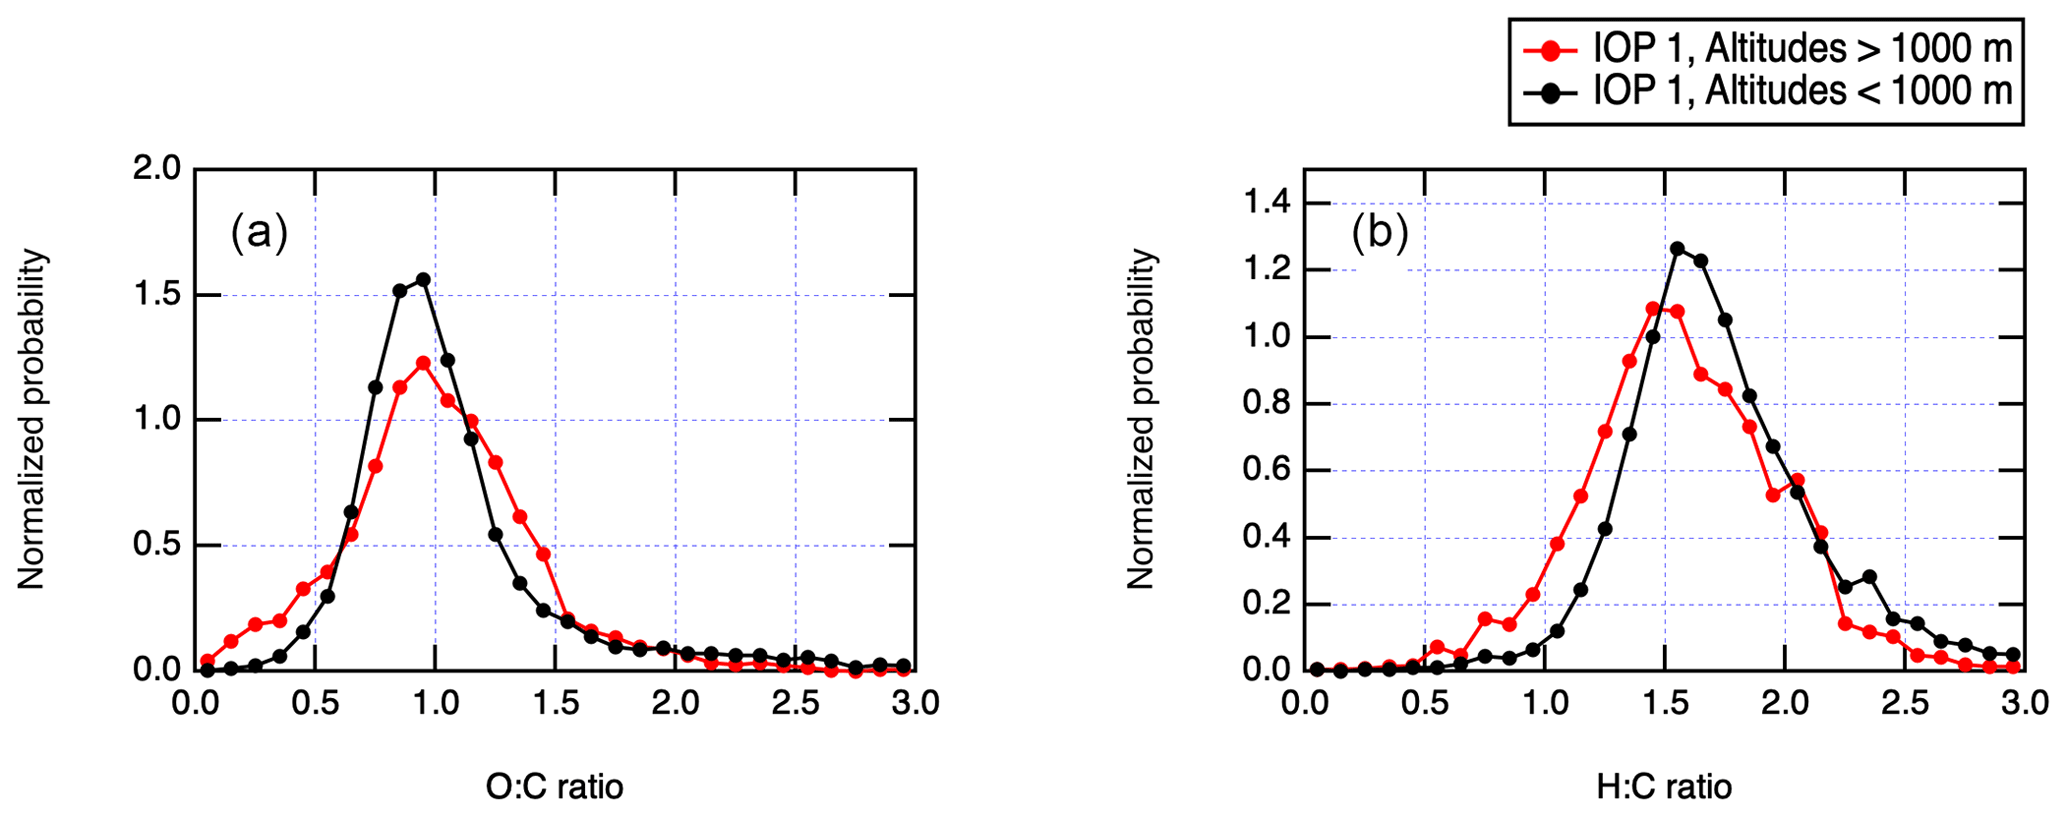
Figure 5Overview of organic chemistry for IOP 1 using AMS measurement periods where [Org] > 0.15 µg m−3. All elemental ratios were calculated using the Canagratna et al. (2015) method. (a) AMS O:C ratios for boundary layer and free-troposphere altitudes. (b) AMS H:C ratios for boundary layer and free-troposphere altitudes.
Unlike sulfate, there is no strong trend of decreasing ammonium with altitude, and as a result, boundary layer sulfate aerosol is more acidic than sulfate in the free troposphere. AMS measurements can be used to calculate the degree of aerosol neutralization as
Neutralization below 1 indicates acidic aerosol. Note that this analysis is based solely on quantities measured by the AMS and therefore neglects certain common marine cations such as Na+ or K+. Chloride salts of Na or K will also be undetected by the AMS. Due to the acidity of marine boundary layer sulfate, the bulk biogenic sulfate is likely sulfuric acid, which is produced from oxidation of SO2, another oxidation product of DMS (Hoffmann et al., 2016). A thermodenuder heated to 300 ∘C in front of an aerosol sizing instrument aboard the G-1 aircraft during the ACE-ENA campaign was used to infer that the AMS observations are of non-sea-salt submicron marine aerosol. The analysis also neglects organic acids, such as oxalic acid or MSA, but the concentrations of these in clean MBL are low. MSA, for example, was shown to account for only 1 %–2 % of the non-refractory aerosol mass.
Relative contributions of different functional groups differentiated by AMS to the total bulk organic loading are also indicated in Fig. 4. In all cases, CxHyOz components contribute over 50 % of total organic aerosol, as would be expected for photochemically aged aerosol transported into the remote region. Figure 5 shows a further overview of organic aerosol chemistry during the summer, when organics were most abundant. O:C and H:C ratios were computed from AMS measurements using the “improved ambient” method of Canagaratna et al. (2015) and averaged using a 11-point moving average. The O:C ratio of 1.1 for MBL and 1.0 for free troposphere suggests that the organic aerosol is highly processed by the time it is sampled at the ACE-ENA region. For comparison, the mean O:C and H:C ratios during GoAmazon 2014/15 were 0.6 and 1.65 during the wet season (Shilling et al., 2018). No strong trends in elemental ratios are observed for the two altitude bins considered in Fig. 5a and b, <1000 and 1000–3000 m. This suggests a similar degree of oxidation of the organic aerosol throughout the marine boundary layer, further pointing to a lack of strong local sources of organic aerosol.
To further test this, two representative research flights, RF no. 9 and no. 19, were selected to represent conditions with lower (RF no. 9) and higher (RF no. 19) influence from long-range transport on the basis of concentrations of black carbon, ammonium, methanol and acetone in the free troposphere, which are all markers for long-range transport. The vertical profiles of total AMS organic loading from those two research flights are shown in Fig. 6. During RF no. 9, MSA accounts for 3 % of the total particulate organic signal, but during RF no. 19, its contribution is <1 % (Fig. 6c). However, the distributions of O:C and H:C ratios on those 2 d are very similar (Fig. 6d and e). This suggests two likely possibilities for the source of organic aerosol in the ENA region: (1) the majority of the boundary layer particulate organic aerosol is made up of oxidized continental emissions that were transported and are now mixed into the boundary layer, and (2) fresh ocean primary organic aerosol that is highly oxidized and indistinguishable from long-range-transported organic aerosol by O:C and H:C ratios. During the International Chemistry Experiment in the Arctic Lower Troposphere (ICEALOT) O:C of submicron particles was quantified using both Fourier-transform infrared spectroscopy (FTIR) and AMS aboard a research ship (Frossard et al., 2011; Russell et al., 2010). The average O:C during the cruise was 0.94, and it was 1.07 for the North Atlantic leg (Russell et al., 2010). This high O:C ratio was linked to an abundance of highly oxidized hydroxyl functional groups similar to those found in biogenic carbohydrates found in seawater (Russell et al., 2010). Bubble bursting on the ocean surface was identified as a likely source of such primary aerosols (Russell et al., 2010).
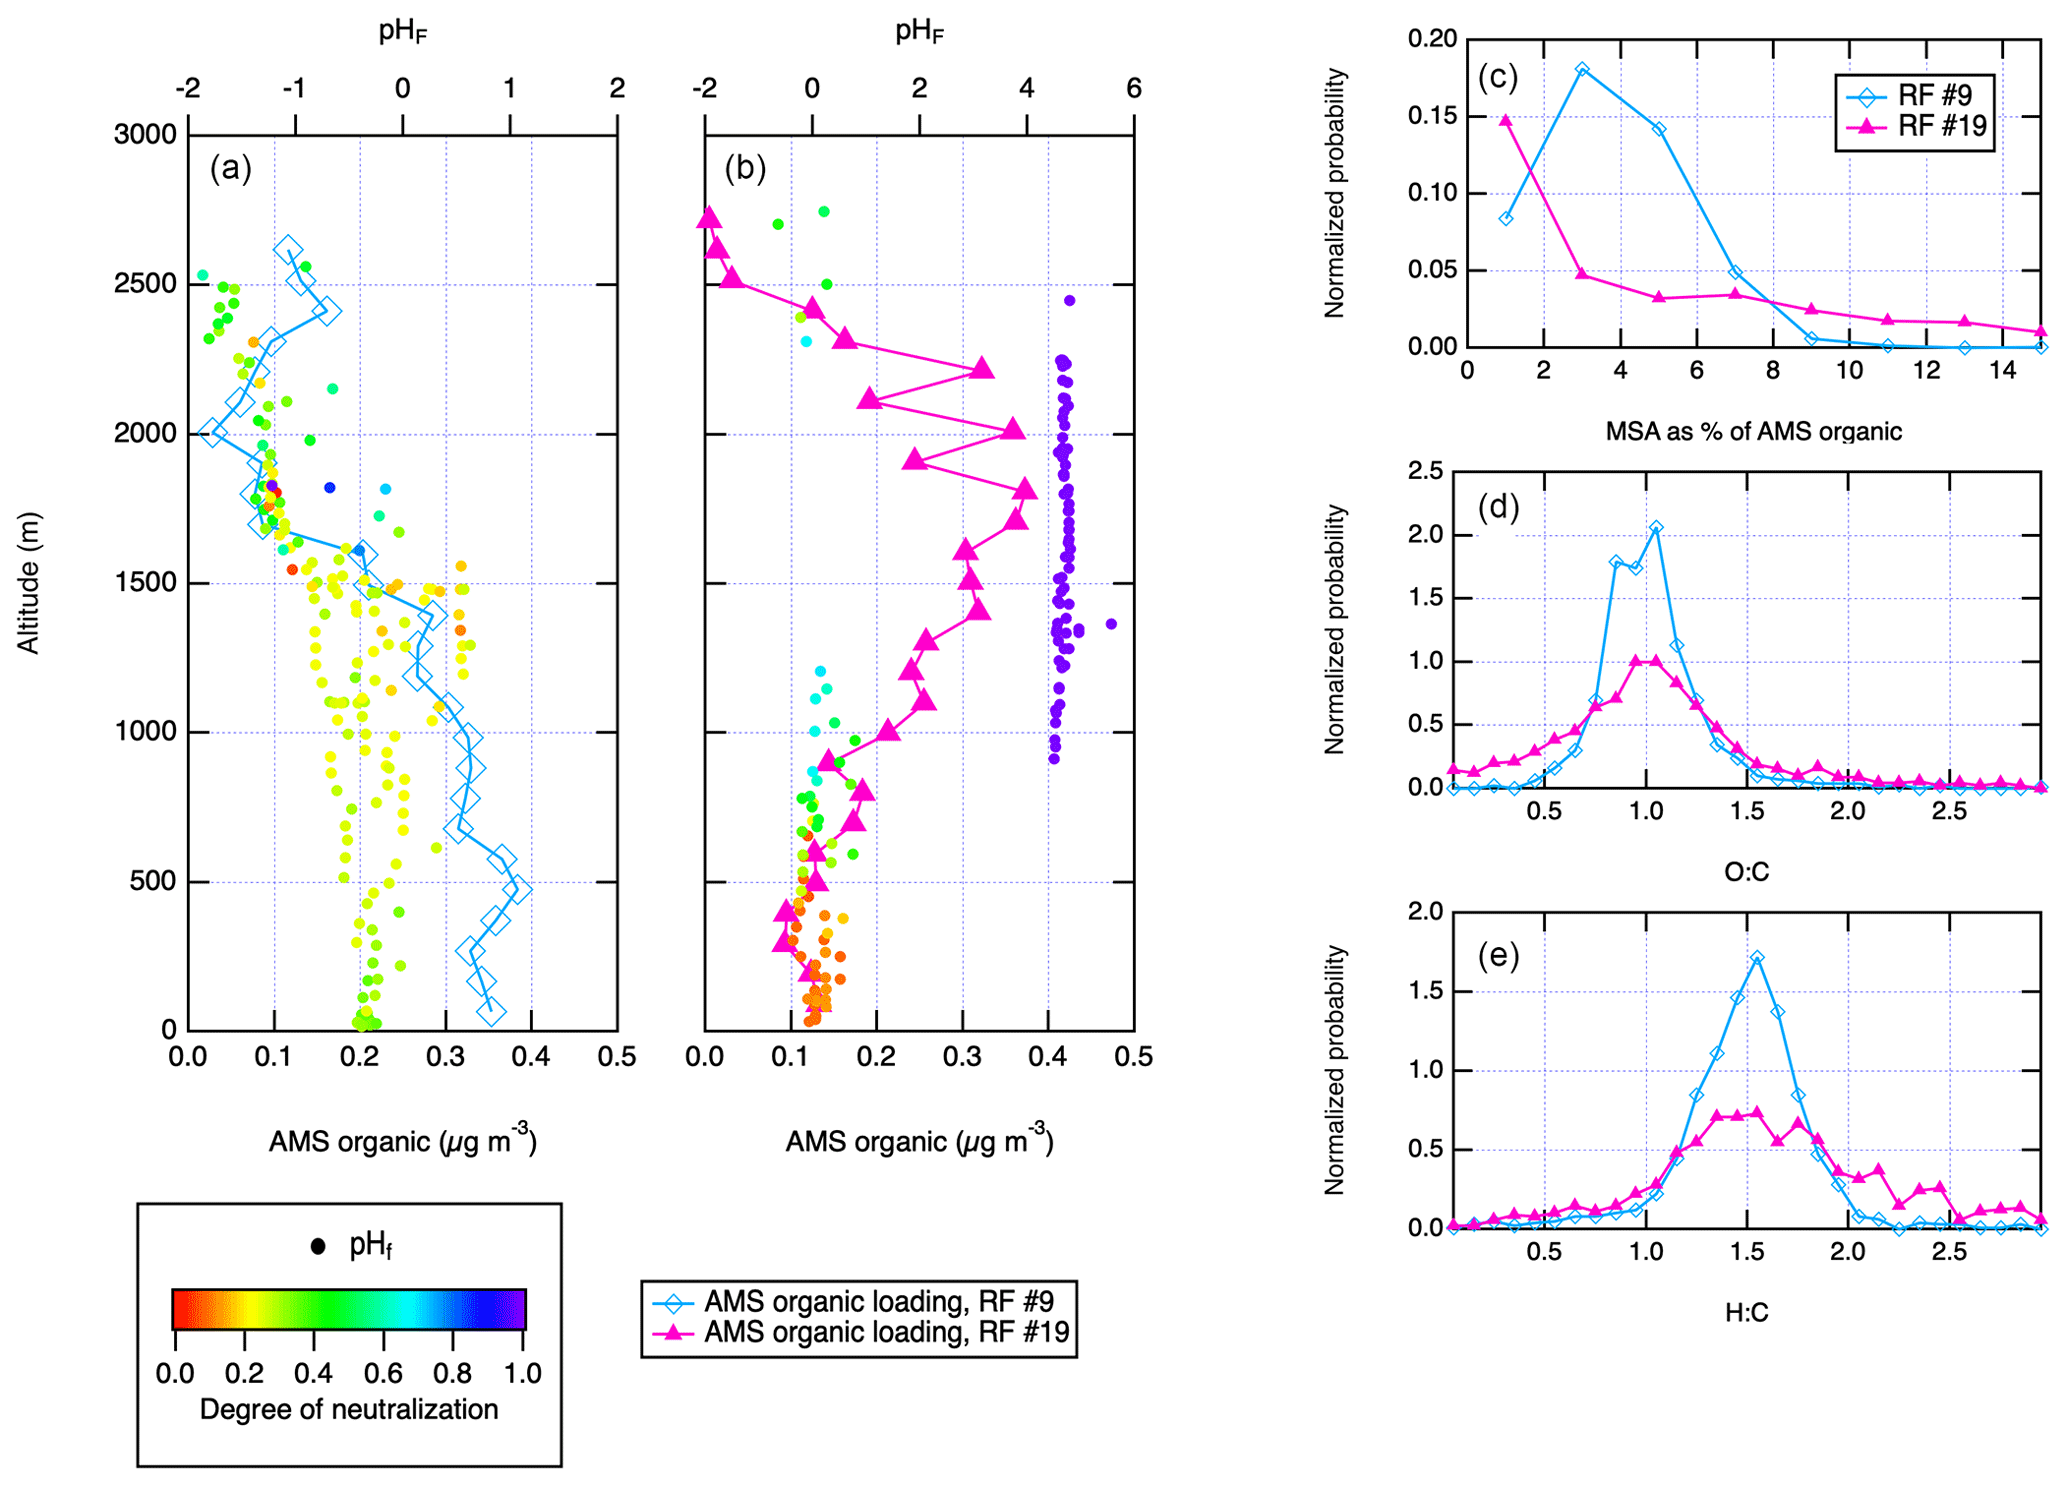
Figure 6Vertical profiles of AMS organic loading for two research flights representative of different (local vs. remote) transport conditions, overlaid with the calculated pHF during the vertical profile, (a) RF no. 9 and (b) no. 19. (c) Percentage of total AMS organic signal accounted for by MSA during RF no. 9 and no. 19, (d) AMS O:C ratios during RF no. 9 and no. 19, and (e) AMS H:C ratios during RF no. 9 and no. 19. Panels (a) and (b)show only the vertical profiles, while panels (c)–(e) are for the entire flight.
Figure 6 also shows aerosol pHF (i.e., pH based on only the free-H+ molality; Pye et al., 2020) calculated using the MOSAIC aerosol model (Zaveri et al., 2008) and the web-based E-AIM model IV (Friese and Ebel, 2010; Wexler and Clegg, 2002) for the two limiting cases of local vs. remote emissions, respectively. This provides a more accurate constraint on the aerosol pH than the neutralization obtained from AMS, but it agrees with the earlier conclusion that the submicron aerosol in the MBL at ENA is very acidic. In the case of clean MBL, during RF no. 9, pH is between 0 and −2, depending on the presence of liquid water in the particles. Even during RF no. 19, which contained a clear remote transport plume, pH is 0 everywhere outside of the plume. This raises the possibility of a third source of organic aerosol at ENA – fresh SOA produced through acid-catalyzed reactive uptake of oxidized isoprene and monoterpene emitted from the ocean. While the isoprene concentrations measured during ACE-ENA were low and close to the detection limit of 0.1 ppb (Table 2), SOA formation from acid-catalyzed IEPOX chemistry has been shown to be significantly more efficient than from a non-IEPOX photochemical mechanism (Surratt et al., 2010).
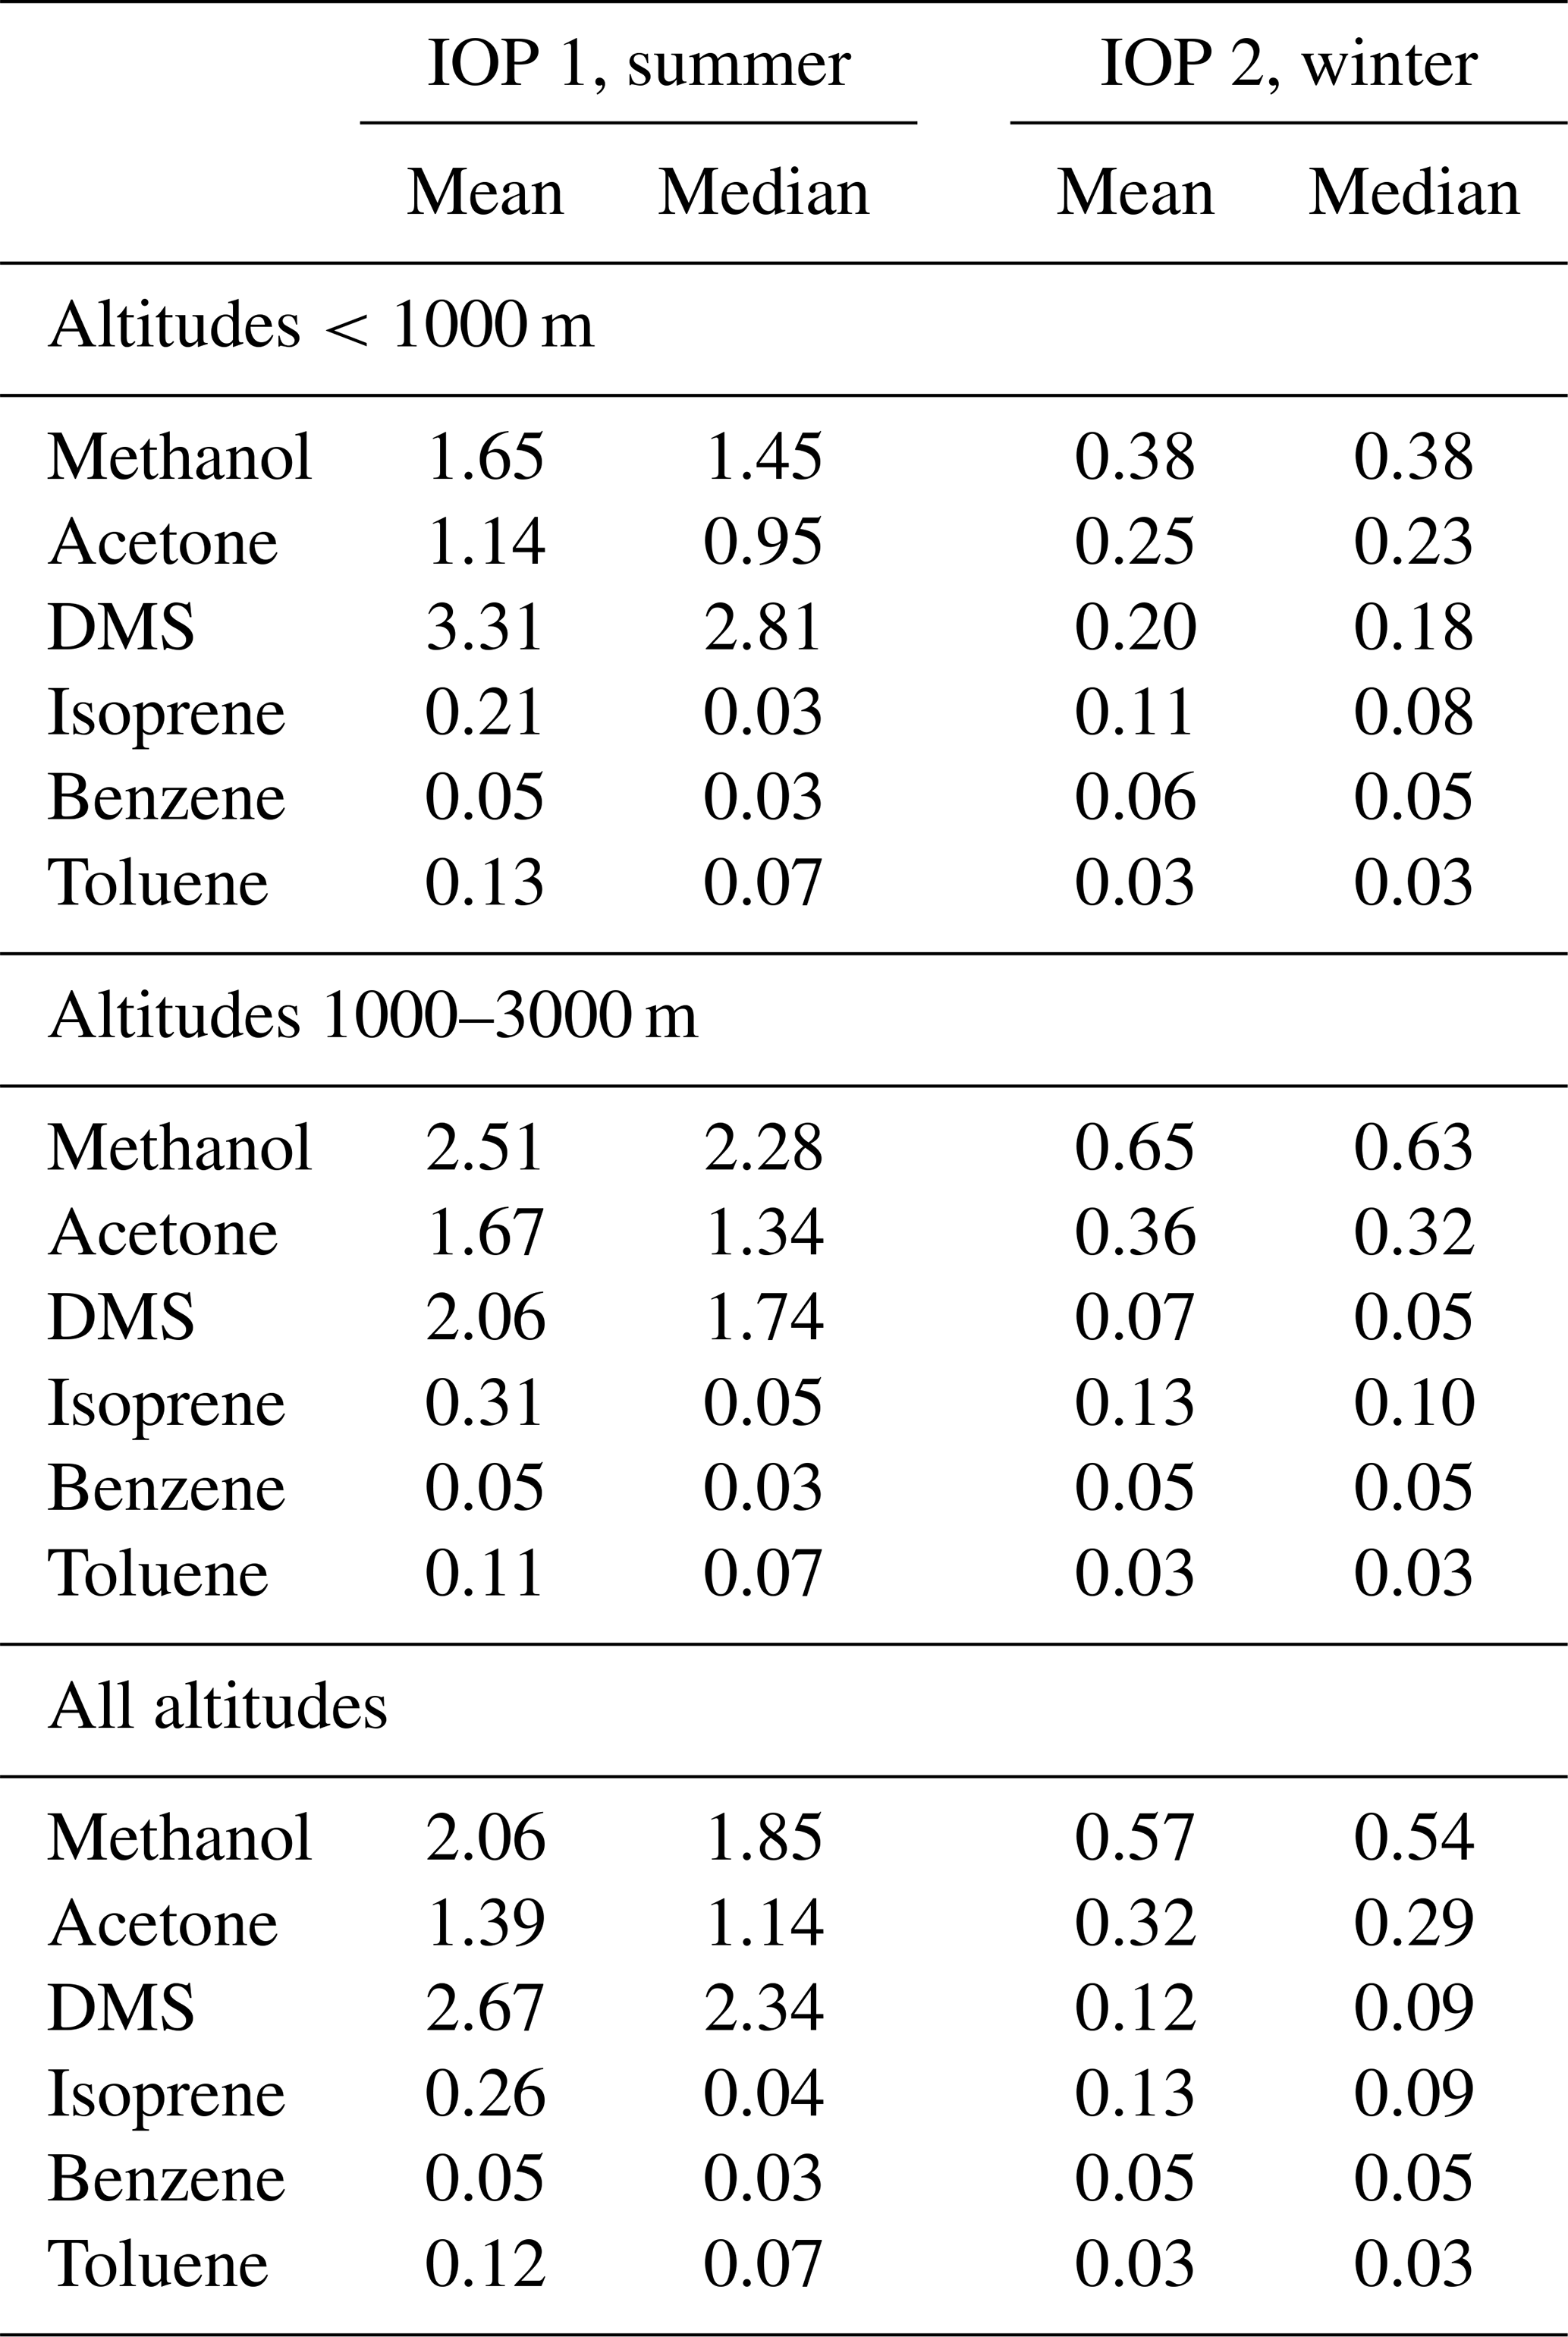
Table 2Summary of PTR-MS measurements aboard the G-1 during ACE-ENA.
3.1.2 Trace gas chemistry
Figure 7 and Table 2 summarize the PTR-MS measurements for trace gases during ACE-ENA. The most abundant trace gas is methanol, with average concentrations around 2 ppb at all altitudes during the summer (Table 2). Methanol concentrations were higher above the boundary layer (>1000 m) but lower near the ocean surface, while DMS showed the opposite trend of high concentrations at the surface and low concentrations at high altitudes. In the winter, the average methanol concentration was 0.6 ppb, and the average DMS concentration was 0.1 ppb (Table 2). Isoprene, benzene and toluene concentrations are very low throughout the campaign, with average concentrations below 0.5 ppb for isoprene and below 0.1 ppb for benzene and toluene, which is near the detection limit. The measurements of these anthropogenic and biogenic VOCs again indicate that emissions of SOA-forming precursors in the region are low. The three major trace gas components (DMS, methanol and acetone) all show seasonality, but the reduction in concentration from summer to winter is 3–4 times for methanol and acetone and 20-fold for DMS. Note that there is a potential interference for summer DMS, which produced higher absolute concentrations than expected, though we expect trends in relative concentration to be accurate.
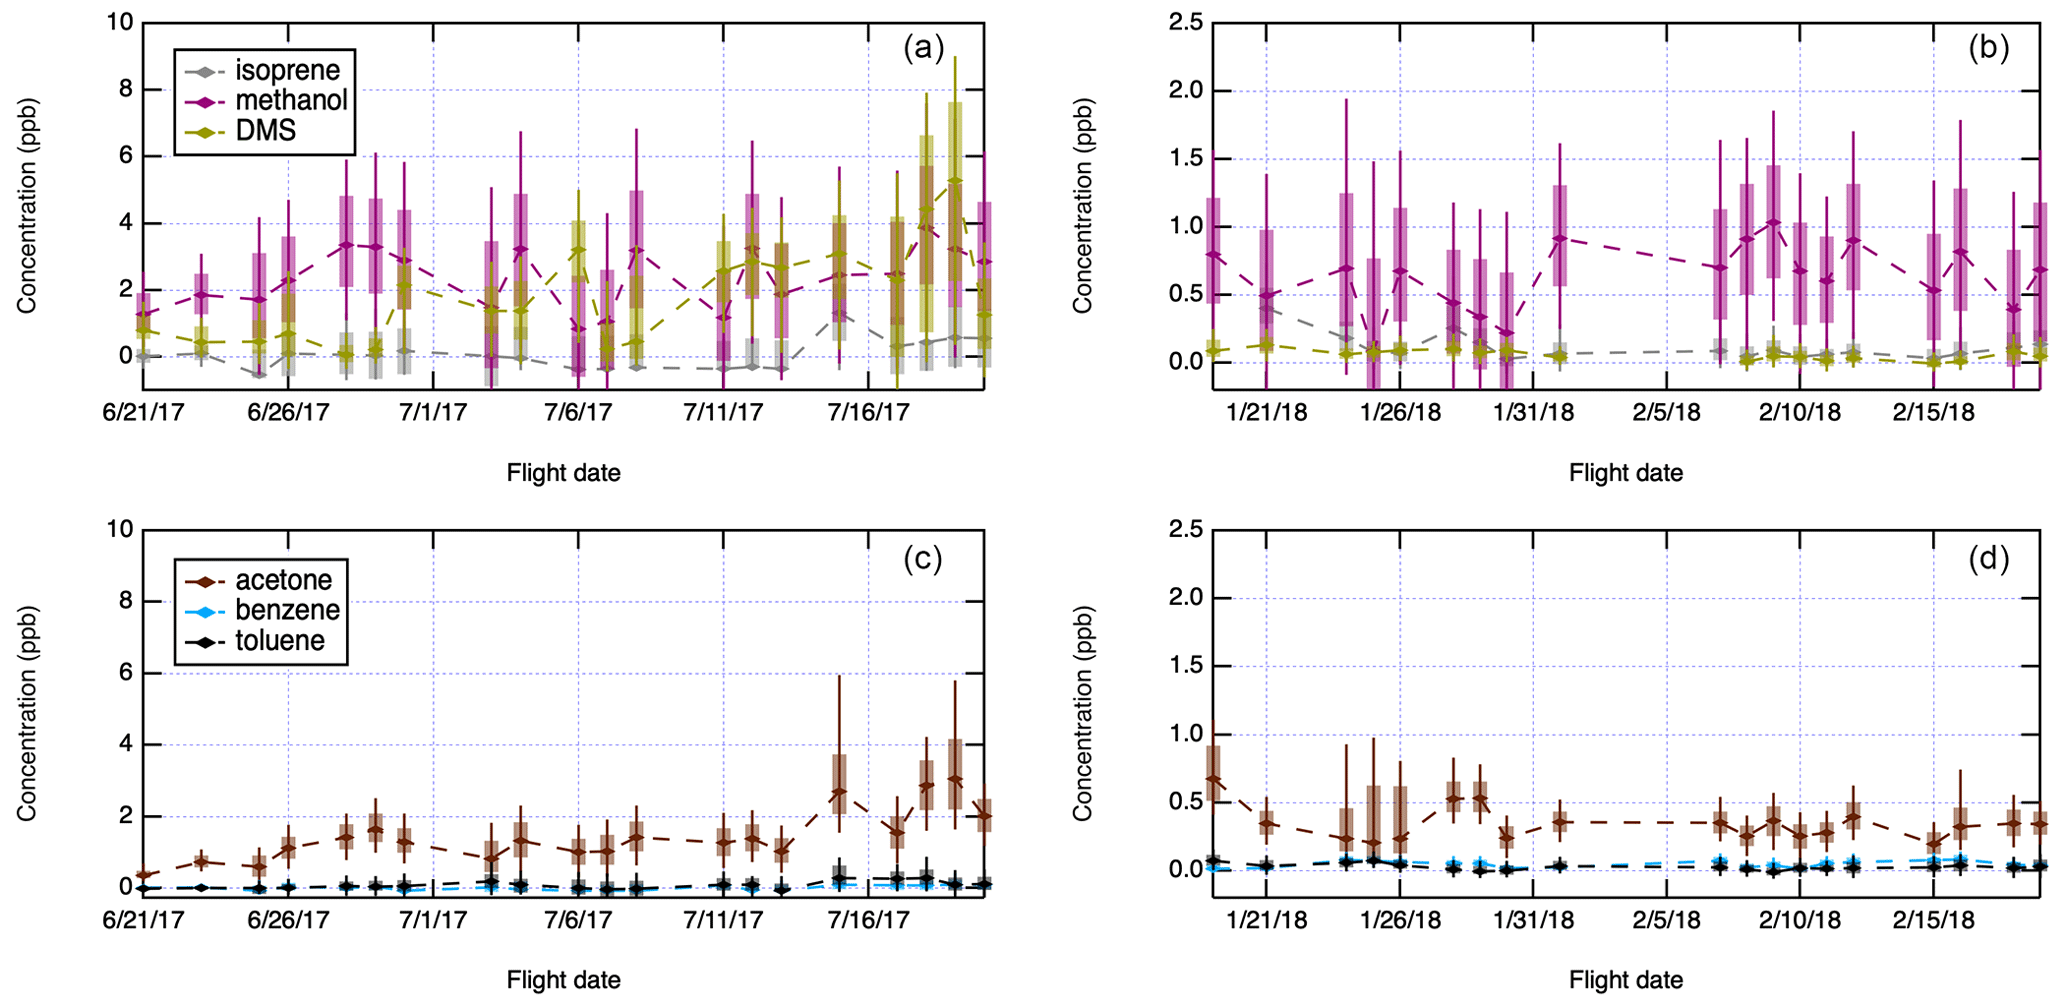
Figure 7Summary of trace gas chemistry measurements acquired with the PTR-MS aboard the G-1 aircraft during ACE-ENA. Measurements at altitudes from 1000 to 3000 m. Boxes are centered on daily medians, box boundaries extend between the 25th and 75th percentile, and whiskers extend between the 10th and 90th percentile. (a, c) IOP 1 measurements. (b, d) IOP 2 measurements.
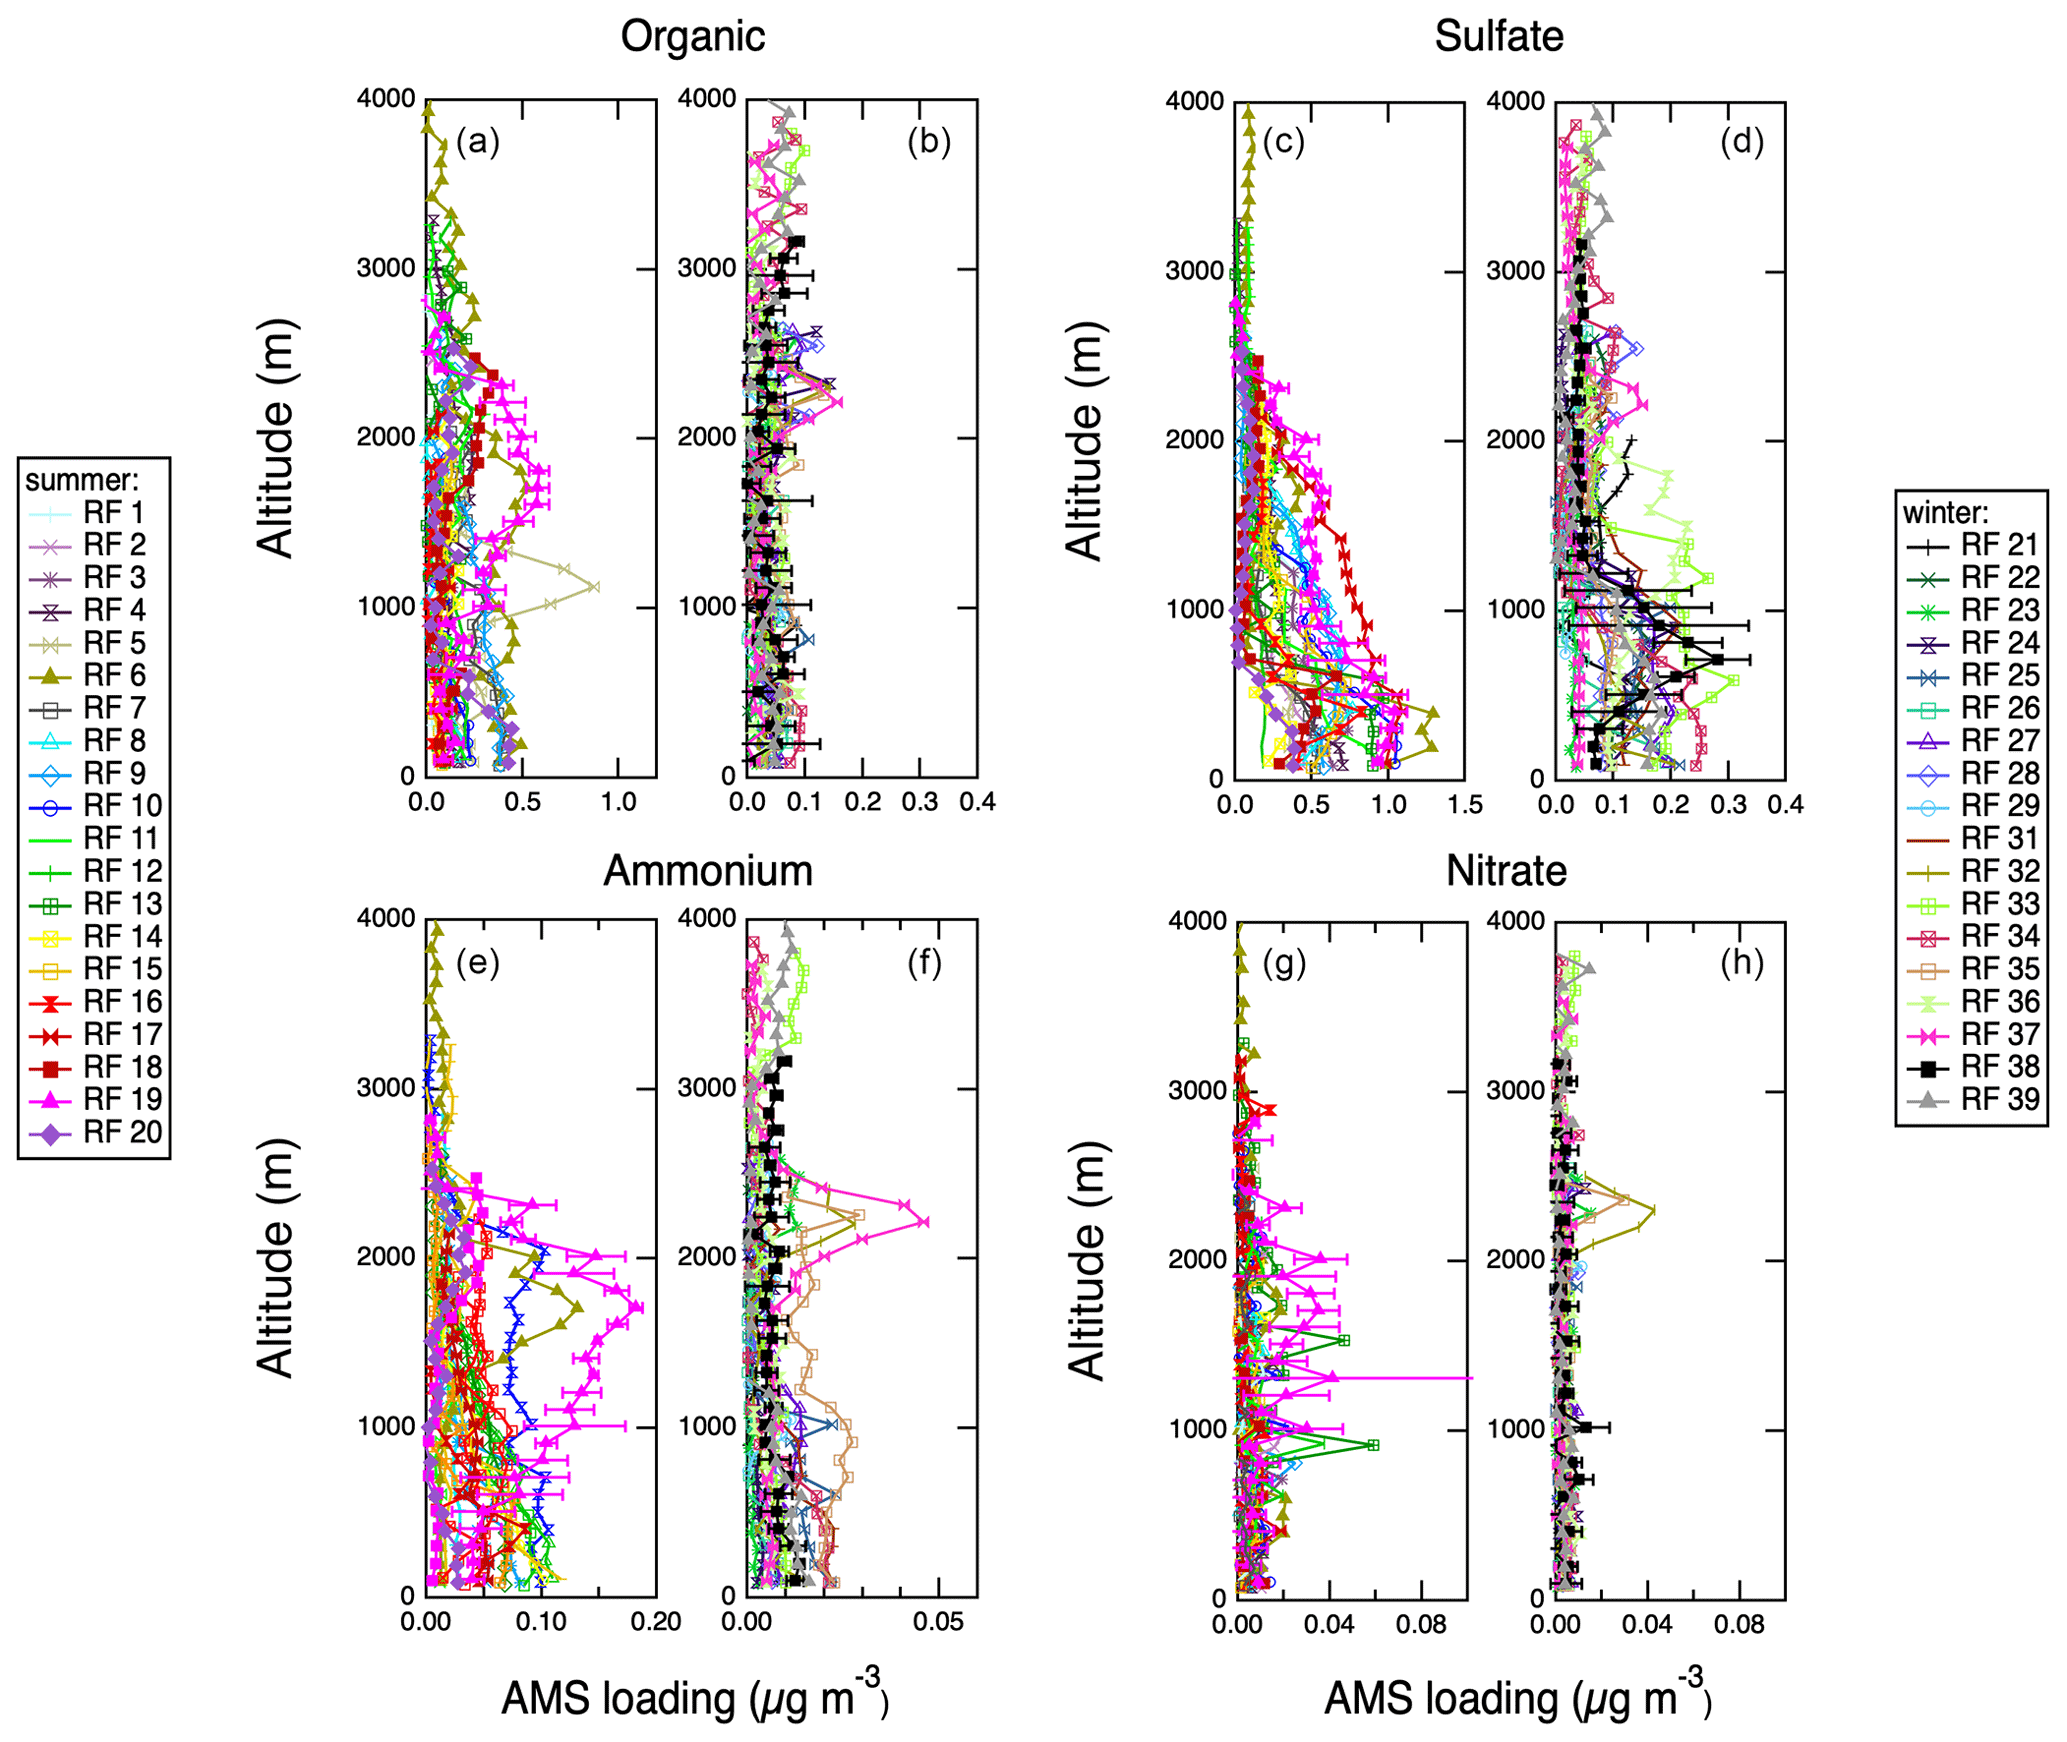
Figure 8Vertical profiles of AMS aerosol chemistry measurements acquired during spiral profiles shown in Fig. S1. Representative error bars (1σ standard deviations) are shown on 1 d only for clarity. (a) Organic, IOP 1. (b) Organic, IOP 2. (c) Sulfate, IOP 1. (d) Sulfate, IOP 2. (e) Ammonium, IOP 1. (f) Ammonium, IOP 2. (g) Nitrate, IOP 1. (h) Nitrate, IOP 2.
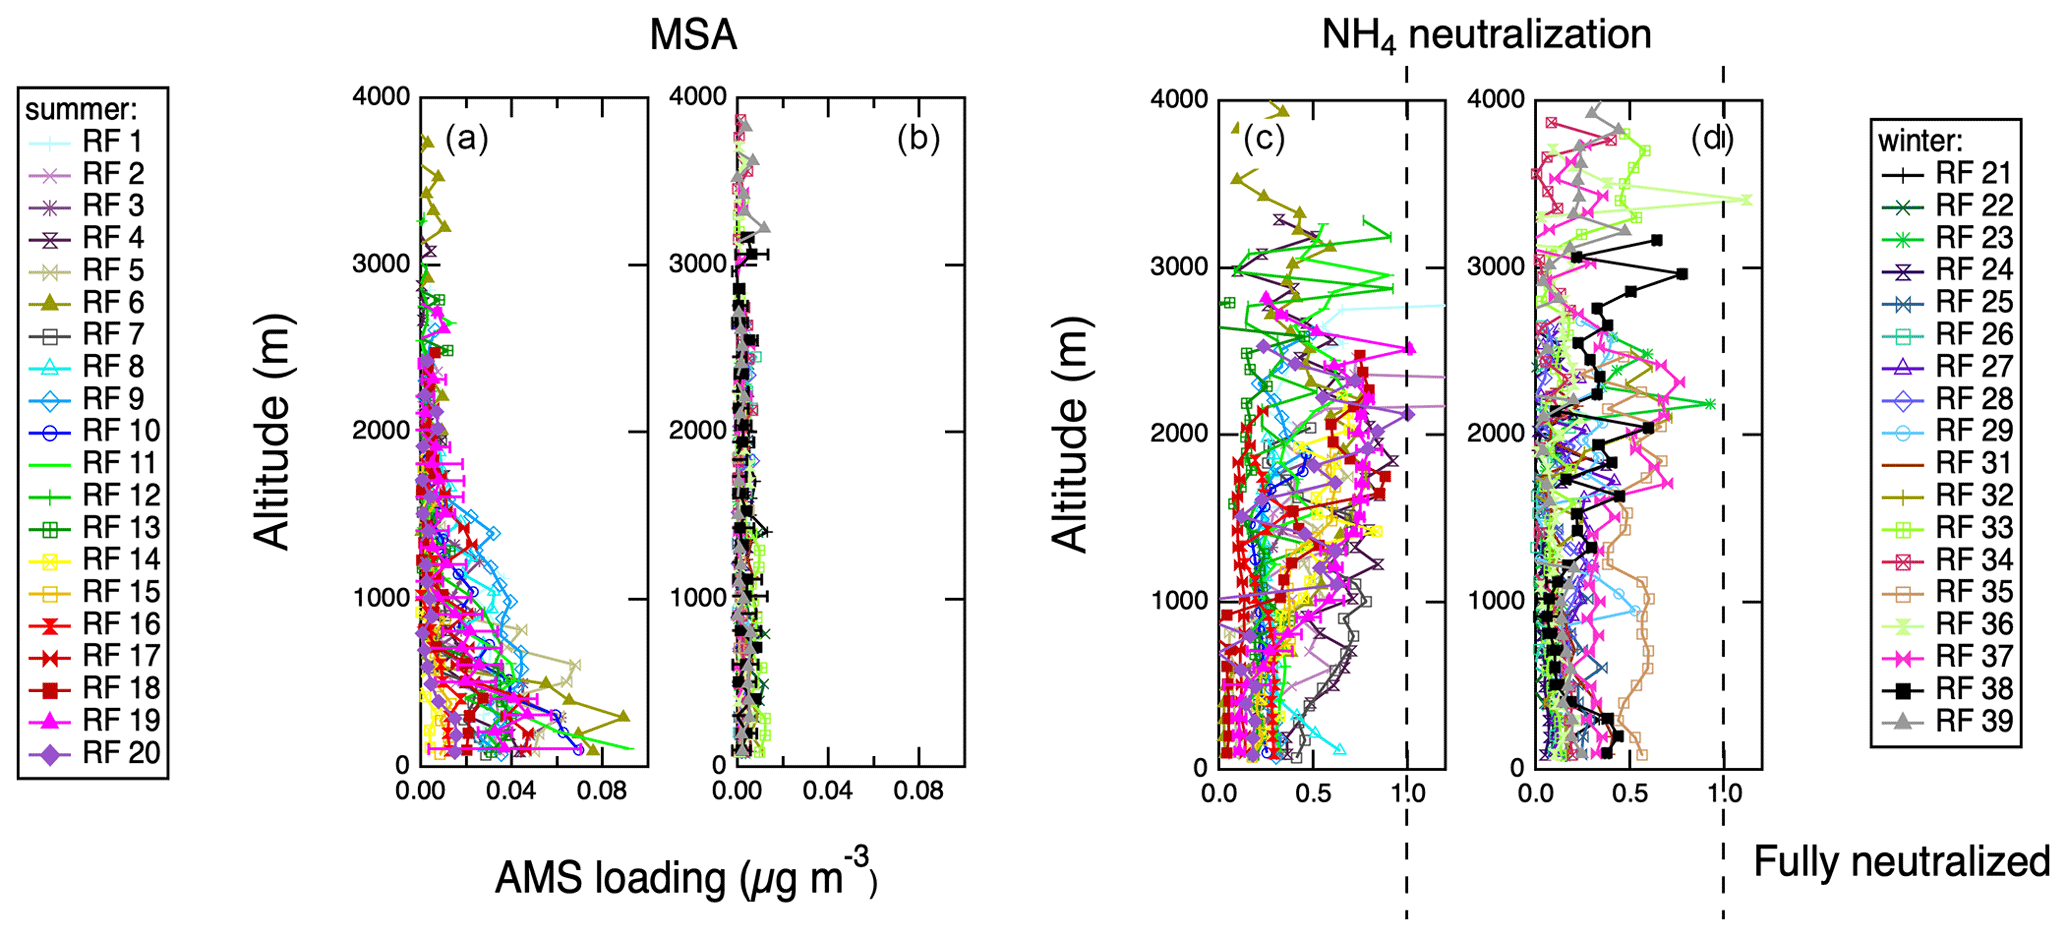
Figure 9Vertical profiles of AMS-derived MSA and AMS-derived degree of NH4 neutralization (a proxy for aerosol acidity) acquired during spiral profiles shown in the Supplement Fig. S1. Representative error bars (1σ standard deviations) are shown on 1 d only for clarity. (a) MSA, IOP 1. (b) MSA, IOP 2. (c) NH4 neutralization, IOP 1. (d) NH4 naturalization, IOP 2.
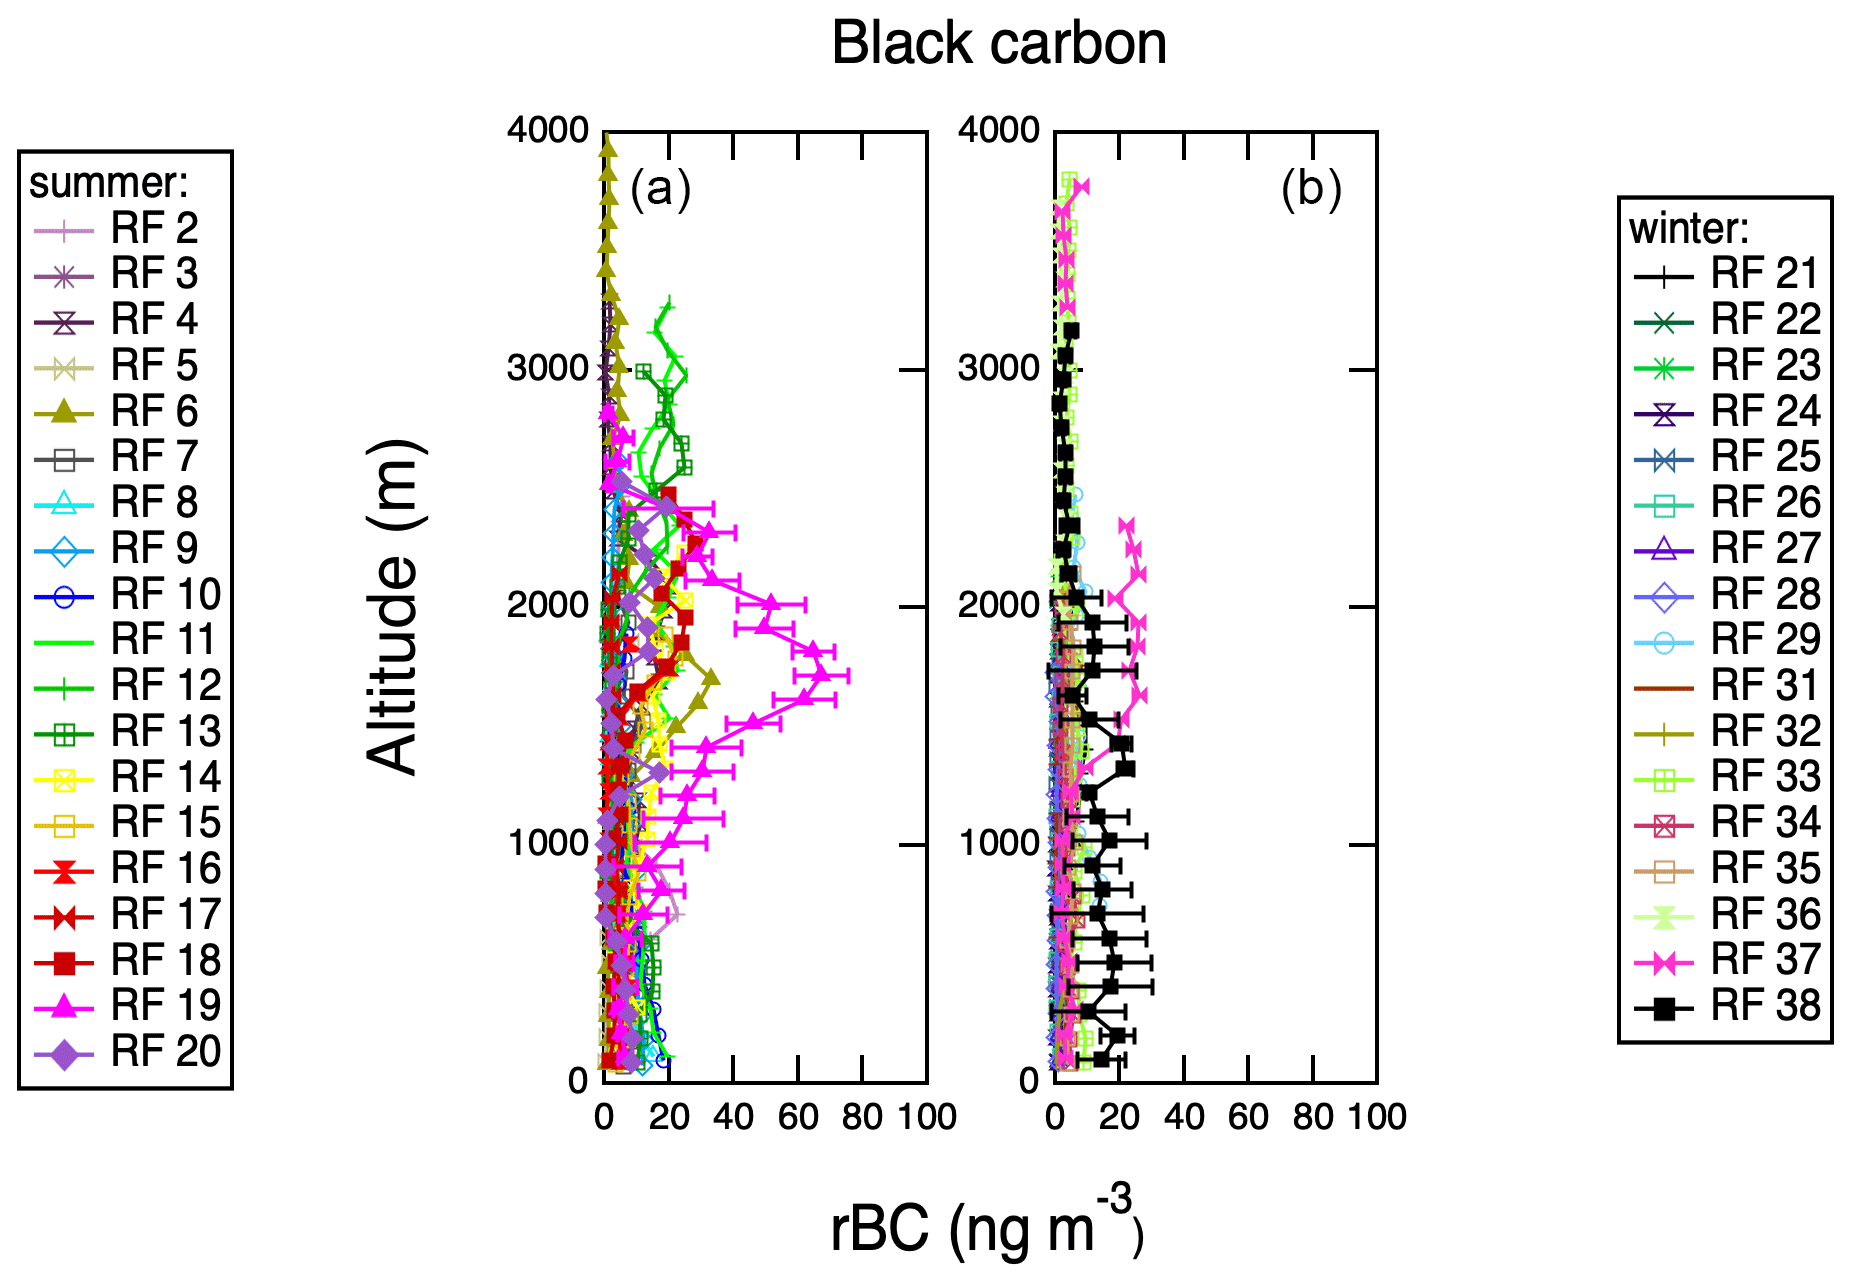
Figure 10Vertical profiles of refractory black carbon (rBC) acquired with SP2 during spiral profiles shown in Fig. S1. Representative error bars (1σ standard deviations) are shown on 1 d only for clarity. (a) IOP 1. (b) IOP 2.
3.2 Vertical profiles of aerosol and trace gases
Vertical profiles for each of the research flights are summarized in Table S1. Most flights included at least two vertical profiles, and if there were multiple vertical profiles per flight, they were averaged together. Vertical profile locations are shown in Fig. S1; the majority were located close to the coast of Graciosa Island. Figure 8 shows vertical profiles of aerosol chemistry measured with the AMS. Examination of vertical profiles can reveal the boundary layer structure and aerosol sources. Because all the vertical profiles were carried out over the ocean, the surface sources are marine in origin. The vertical profiles of organics and nitrate are relatively constant on most flights, indicating that these species are well mixed through the troposphere. Organics display a slight increase in concentration at high altitudes in the winter, though this layer is relatively weak. Ammonium aerosol components have both weak marine sources and stronger influences at >1000 m in the summer. Similar to organics, ammonium shows weak high-altitude layers above 2000 m in the winter, likely representing transport from North America. Sulfate aerosol has two distinct sources: a marine source seen below 1000 m in the summer and a high-altitude source above 1000 m present in both seasons. Figure 9 shows additional vertical profiles of quantities derived using AMS aerosol chemistry measurements, MSA concentration and acidity. MSA shows a strong surface source during the summer measurement period but falls below the detection limit during the winter measurement period. It is also especially clear during the summer that the surface-derived marine aerosol tends to be strongly acidic, but the higher-altitude aerosol tends to be more neutralized, further supporting two distinct sources of sulfate at different altitudes. Figure 10 shows vertical profiles of refractory black carbon (rBC) measured by the SP-2. Consistently with clean, remote conditions, concentrations of rBC are low in both measurement periods, but during the summer several profiles show very clear layers at altitudes higher than 1000 m. Profiles of rBC are consistent with occasional transport of polluted air from the continent at high altitude to the region.
Figure 11 shows vertical profiles of four of the trace gases measured with the PTR-MS. Two of these gases, DMS and isoprene, are expected to have local sources: marine biogenic emissions in the case of DMS and both marine and island biogenic emissions for isoprene. The source for DMS emissions is decidedly marine, but the isoprene profiles do not show a strong surface source, suggesting a lack of local isoprene emissions. Phytoplankton have been shown to emit isoprene in the laboratory (Colomb et al., 2008; Exton et al., 2013; Meskhidze et al., 2015; Shaw et al., 2010), and trace isoprene and its oxidation products have been detected in ocean research cruises (Hackenberg et al., 2017; Hu et al., 2013; Kim et al., 2017; Mungall et al., 2017). Generally, the phytoplankton species that emit isoprene are different from those that are primary DMS producers, and their respective geographical distributions are anti-correlated (Dani and Loreto, 2017). Methanol and acetone are both expected to be tracers for continental transport, and they tend to show layers at altitudes higher than 1000 m during both measurement periods. Figure 12 shows vertical profiles of two additional atmospheric gases whose concentrations were also measured aboard the G-1, carbon monoxide and ozone. Both of those gases are tracers for long-range transport of anthropogenic pollution and/or biomass burning. They show similar high-altitude layers to methanol and acetone, but CO in particular is less susceptible to wet removal by clouds and precipitation because of its low water solubility. Summertime marine boundary layer concentrations for carbon monoxide and ozone are 60–100 and 10–40 ppb, respectively. During the winter, however, their concentrations are consistently higher, 80–140 and 20–50 ppb, respectively. This can indicate both continental influence and more efficient removal of CO during the summer due to photochemistry. Recently, concentrations of hydroxyl radical have been quantified during the summer and winter in the remote troposphere, indicating a column average for the Northern Hemisphere of 4.4×10⁶ molec cm−3 in the summer and 0.9×10⁶ molec cm−3 in the winter, which could explain the seasonal differences in photochemical removal (Travis et al., 2020). In the Amazon, the CO background was found to be about 80 ppb absent any urban influence (Shilling et al., 2018). A similar background CO concentration was also found in the remote southeast Atlantic (Zuidema et al., 2018).
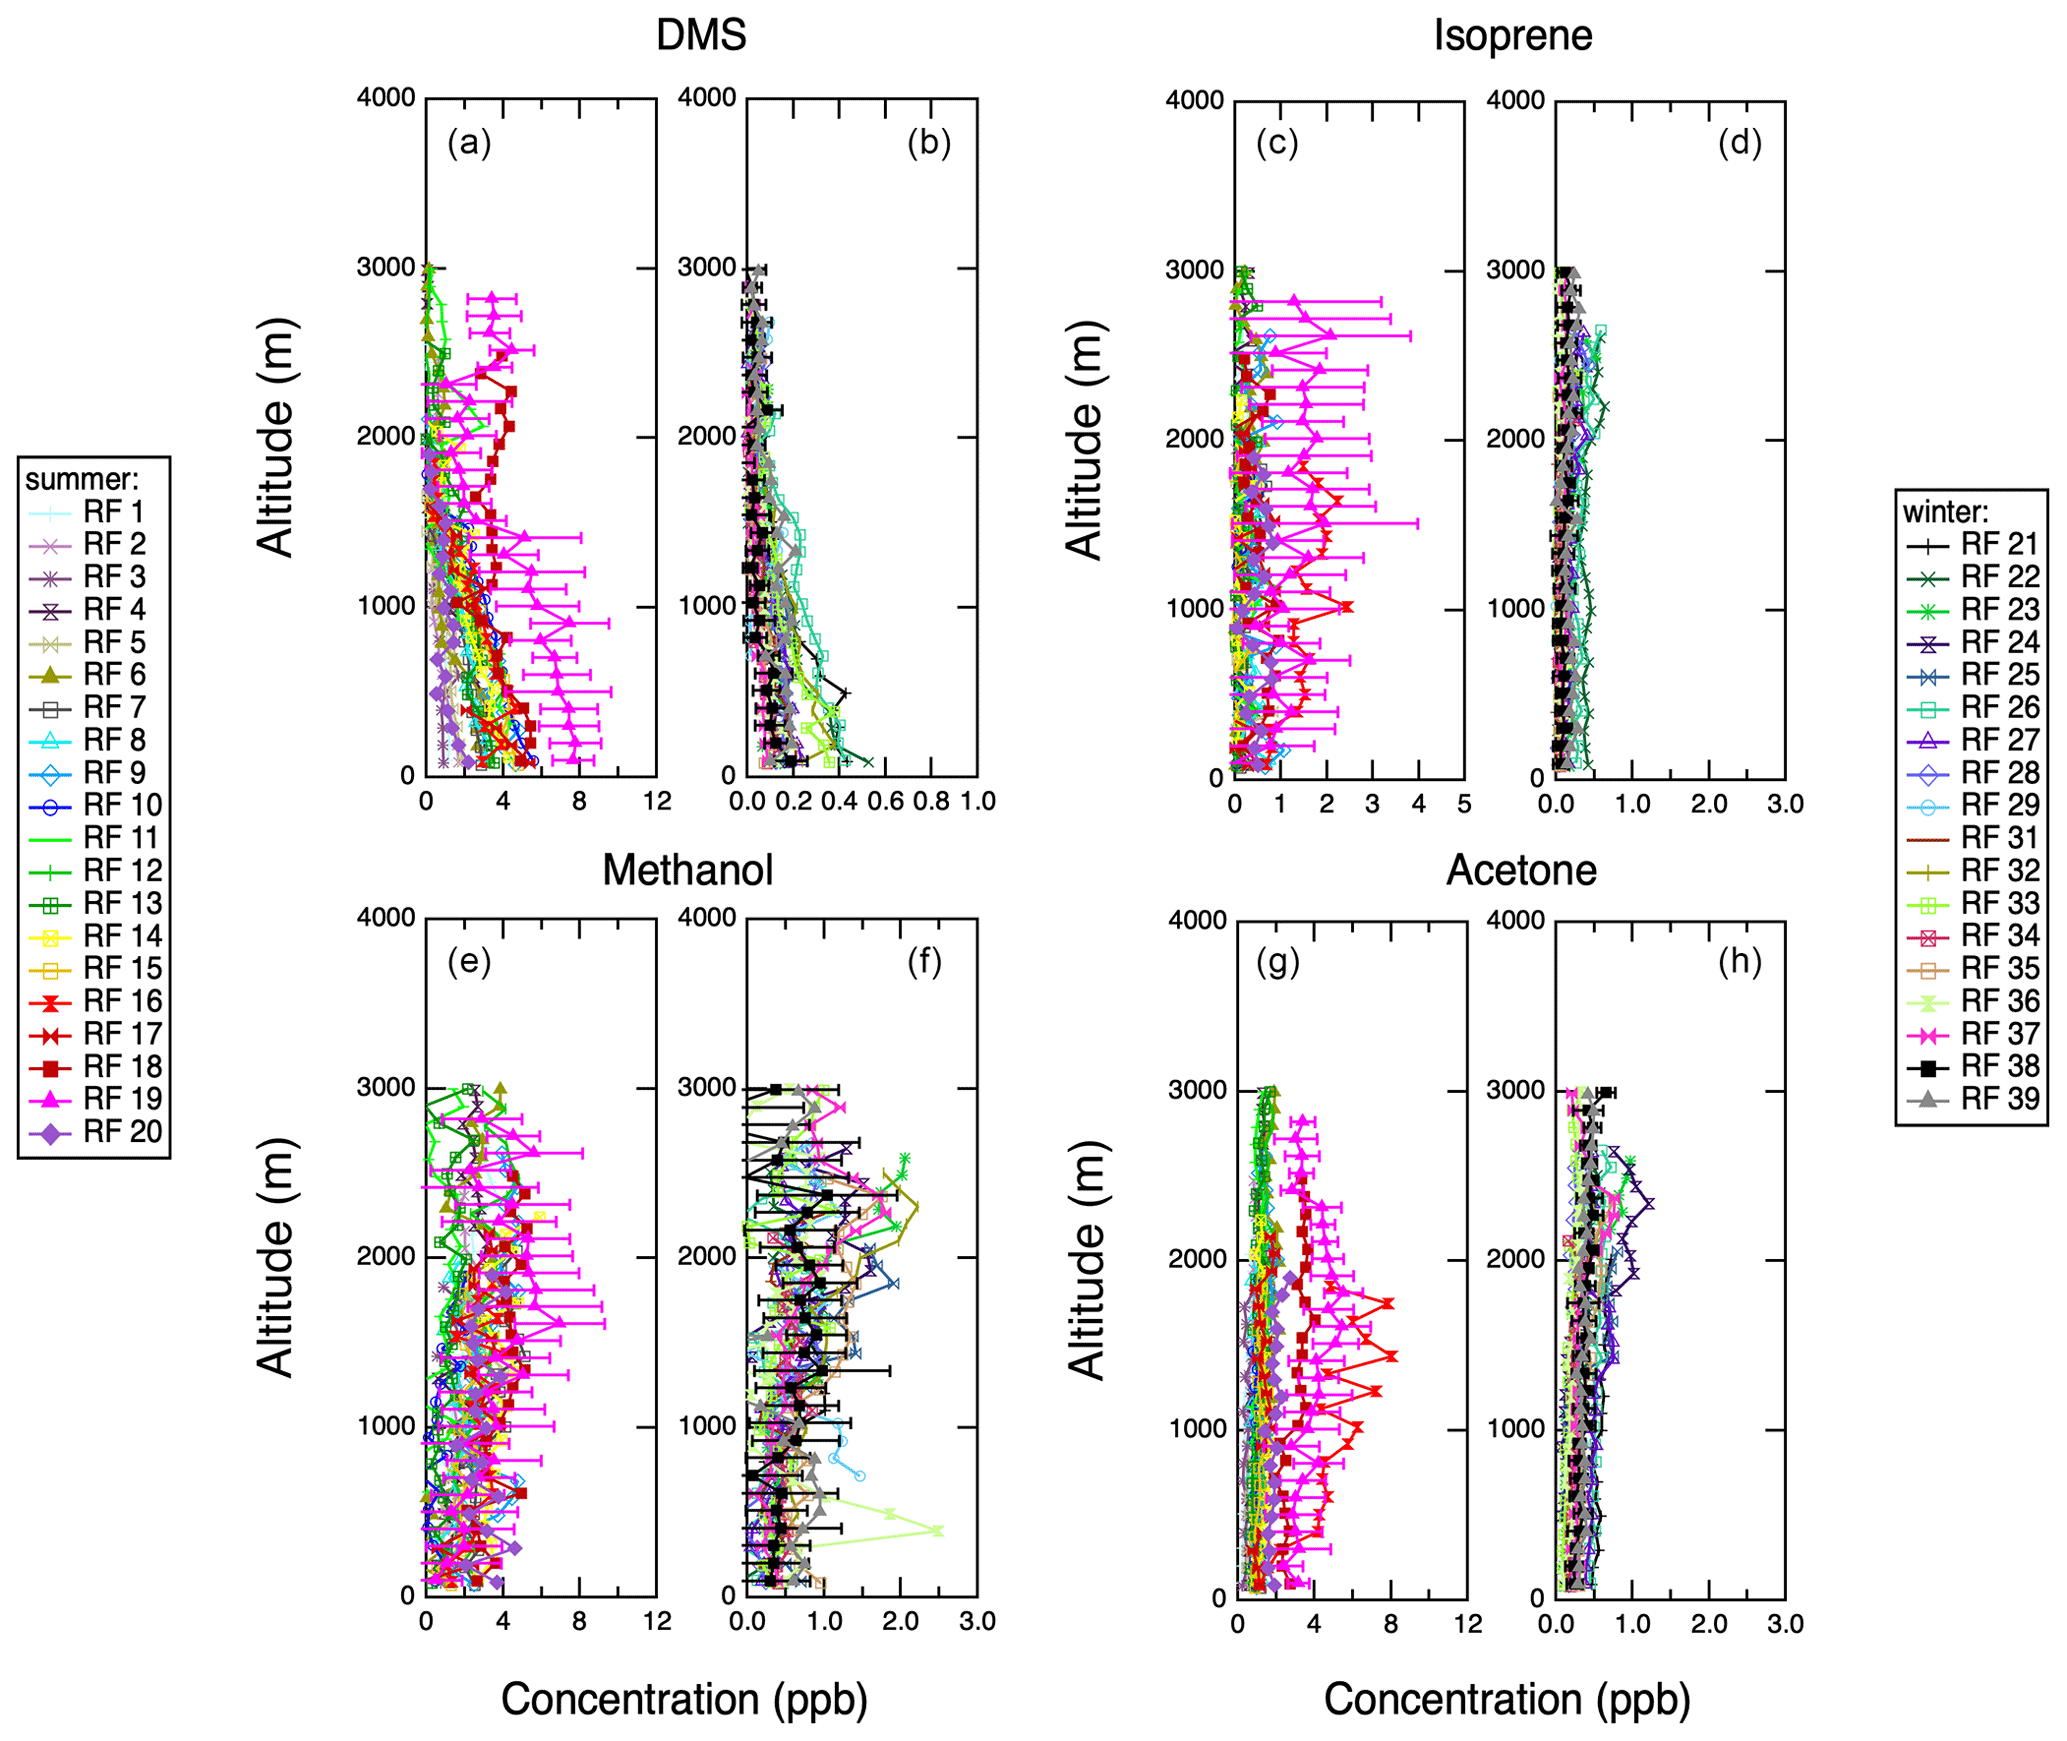
Figure 11Vertical profiles of PTR-MS trace gas chemistry measurements acquired during spiral profiles shown in Fig. S1. Representative error bars (1σ standard deviations) are shown on 1 d only for clarity. (a) Dimethyl sulfide, IOP 1. (b) Dimethyl sulfide, IOP 2. (c) Isoprene, IOP 1. (d) Isoprene, IOP 2. (e) Methanol, IOP 1. (f) Methanol, IOP 2. (g) Acetone, IOP 1. (h) Acetone, IOP 2.

Figure 12Vertical profiles of carbon monoxide and ozone measurements acquired during spiral profiles shown in Fig. S1. Representative error bars (1σ standard deviations) are shown on 1 d only for clarity. (a) CO, IOP 1. (b) CO, IOP 2. (c) Ozone, IOP 1. (d) Ozone, IOP 2.
Figure 13 shows vertical profiles of CCN concentrations measured with the CCN counter aboard the G-1. During both seasons, but especially in the summer, CCN profiles correlate with high-altitude layers of organics, ammonium and rBC, which are markers for long-range transport of aerosols, as described above. This trend is apparent for both 0.13 % and 0.3 % supersaturations. Campaign-wide correlations between aerosol chemical composition and CCN concentrations are also shown in Figs. S3 and S4. At both supersaturations, CCN concentration correlate best with ammonium at high altitudes (>1000 m), R2=0.8 for 0.1 % supersaturation and R2=0.7 for 0.3 % supersaturation, which tends to be transported from the continents.
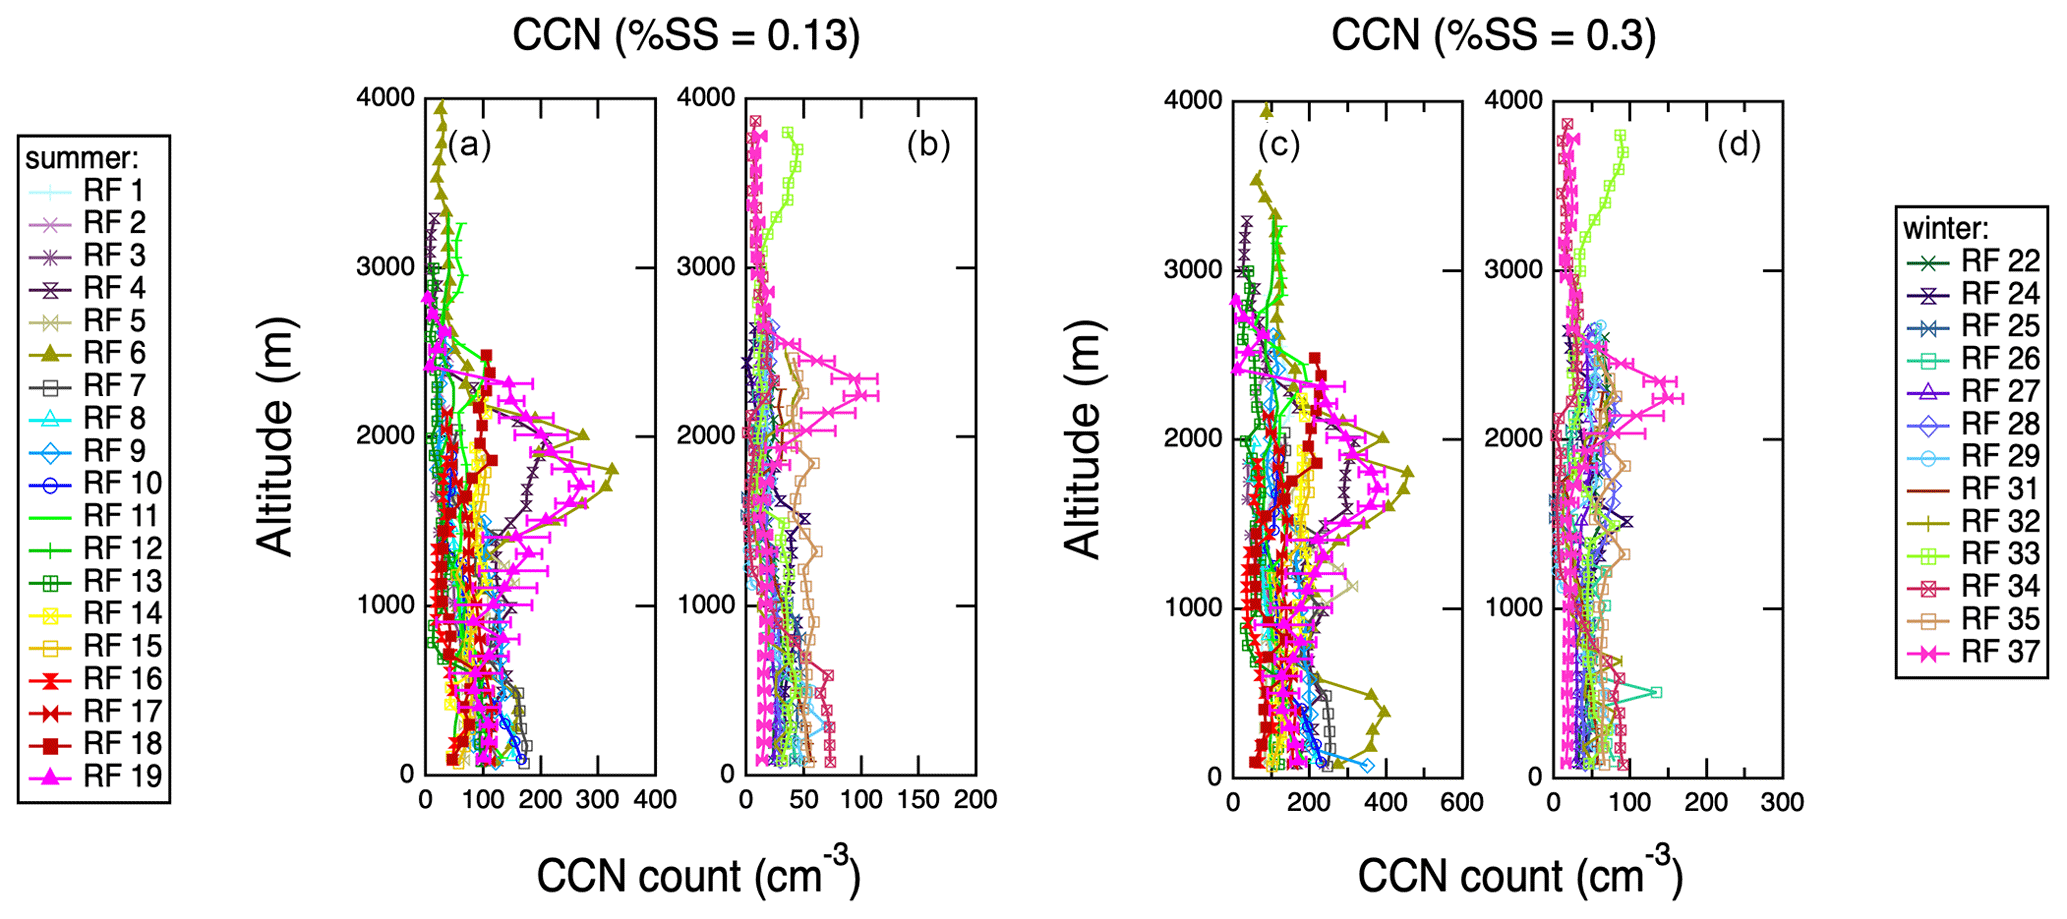
Figure 13Vertical profiles of CCN concentration measurements at two supersaturations (0.13 % and 0.3 %) acquired during spiral profiles shown in Fig. S2. Representative error bars (1σ standard deviations) are shown on 1 d only for clarity. (a) CCN concentration at 0.13 % supersaturation, IOP 1. (b) CCN concentration at 0.13 % supersaturation, IOP 2. (c) CCN concentration at 0.3 % supersaturation, IOP 1. (d) CCN concentration at 0.3 % supersaturation, IOP 2.
Examination of average concentrations of trace gases and aerosols, their vertical profiles, and external factors such as meteorology, back trajectories and biological productivity reveals an interplay of local and transported emissions giving rise to CCN in the ENA region. Two tracers of biological ocean productivity were measured during ACE-ENA: DMS and particulate MSA. Both of these tracers are prominent in the marine boundary layer but generally only in the summer. The synchronization in concentrations of DMS and MSA is expected, as MSA is produced through atmospheric oxidation of DMS. In the marine boundary layer, DMS is a by-product of metabolism of some phytoplankton species, such as coccolithophores and dinoflagellates (Keller et al., 1989). Because its production is biogenic in nature, it undergoes seasonal cycles, which tend to be strongly latitude dependent (Galí and Simó, 2015; Polimene et al., 2012). At polar and subpolar latitudes, which are light-limited in the winter, concentrations of ocean DMS peak synchronously with phytoplankton biomass, but at subtropical latitudes, peak DMS emissions lag behind peak biomass by as much as a few months (Galí and Simó, 2015; Lana et al., 2012; Polimene et al., 2012). The cause of this lag is the way seasonality in solar irradiation drives diversity of phytoplankton taxa, with the DMS-producing species preferring more irradiated conditions (Galí and Simó, 2015; Polimene et al., 2012). Figure S5 shows distributions of ocean chlorophyll a measured by MODIS aboard the Aqua satellite (NASA Goddard Space Flight Center, 2018) during the two intensive periods during ACE-ENA. While the summer coincides with greater biological productivity at the subpolar latitudes north of the Azores, the chlorophyll a concentrations at the ENA site are higher in the winter (0.27 mg m−3) than in the summer (0.12 mg m−3), which is an opposite trend to the aircraft DMS and MSA measurements. This could be due to the lag in seasonal production of DMS in the Azores, which straddle midlatitude and subtropical regimes. The anti-correlation between phytoplankton biomass and ocean DMS concentrations has been shown to persist in the −20 to 40∘ latitude band in both hemispheres, which includes the Azores (Lana et al., 2012). The seasonal surface DMS concentration has been shown to peak in the summer in the eastern North Atlantic using a global model (Kloster et al., 2006). Previous measurements of surface seawater DMS concentrations compiled in the Global Surface Seawater DMS Database (https://saga.pmel.noaa.gov/dms/, last access: 2 May 2020) (Kettle et al., 1999) also indicate higher concentration around the Azores in the summer (mean 2±2 nM L−1) than in the winter (0.5±0.4 nM L−1) (Fig. S6). An alternative explanation is transport of DMS-rich air masses north of the site, but the HYSPLIT (Stein et al., 2015) back trajectories shown in Fig. S7 do not suggest strong transport from the north at low altitudes where DMS signal is most prominent.
Local production of MSA and sulfate from oceanic emissions is a major source of aerosol mass in the summer. Sulfate is highly hygroscopic, and therefore this aerosol will be efficient as CCN, which explains higher on average CCN concentrations close to the ocean surface in the summer (Fig. 13). There is evidence from analysis of ENA site data that accumulation-mode particles entrained from the free troposphere, as well as growth of Aitken-mode particles into accumulation mode in the MBL, are the largest contributors to the CCN budget in the ENA region (Zheng et al., 2018). In particular, the latter source can represent as much as 60 % of the CCN budget in the summer (Zheng et al., 2018). Aitken-mode particles, in this case, are entrained from the free troposphere, and they continue to grow by condensation of DMS oxidation products, such as MSA and sulfuric acid, into CCN-relevant sulfate particles (Zheng et al., 2018). Annual mean contributions of sea salt to accumulation and Aitken modes have been found to be 21 % and less than 10 %, respectively (Zheng et al., 2018), which suggests that AMS is sensitive to the majority of the ENA CCN budget composition.
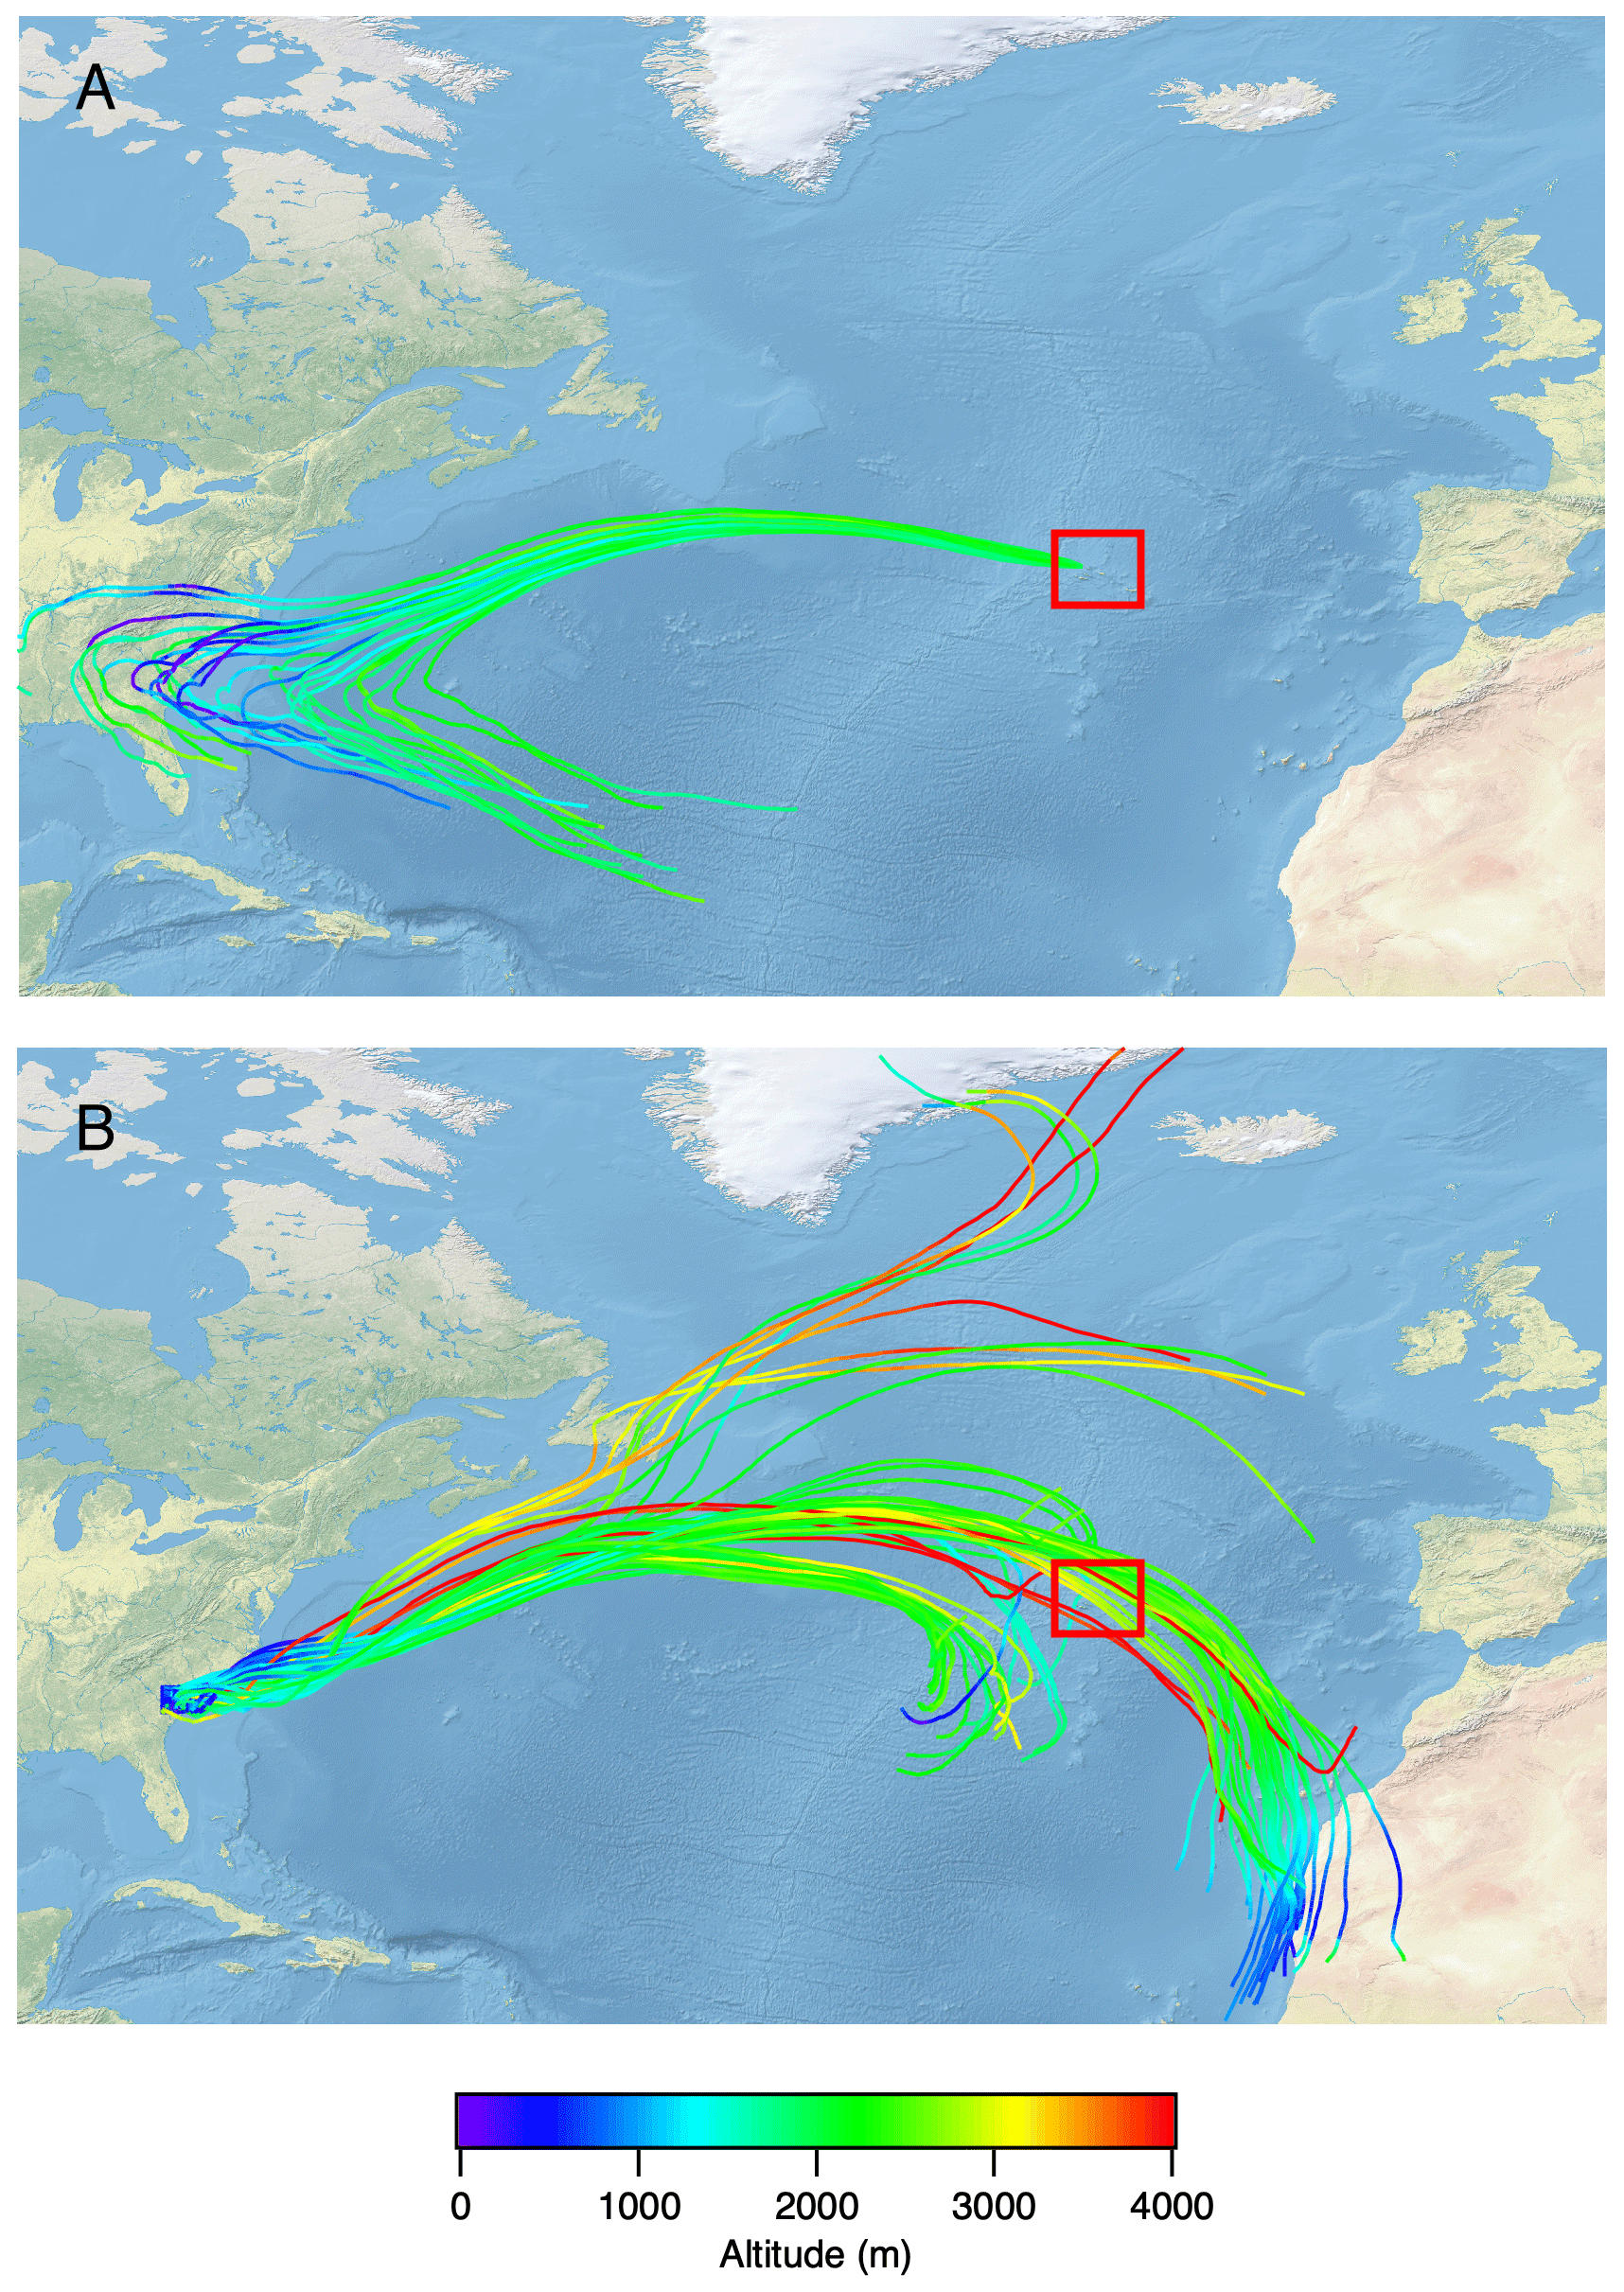
Figure 14HYSPLIT trajectory analysis for the case study of RF no. 19 (19 July 2017). (a) A 27-member ensemble of 14 d back trajectories was started from the first vertical profile location (39.172∘ N, 28.379∘ W) at 2000 m altitude. Each member of the trajectory ensemble is calculated by offsetting the meteorological data by a fixed grid factor (one grid meteorological grid point in the horizontal and 0.01σ units in the vertical). (b) A matrix of 80 10 d forward trajectories was started from an evenly spaced grid bounded by (34∘ N, 81.75∘ W), (34∘ N, 79.5∘ W), (32.6∘ N, 81.75∘ W) and (32.6∘ N, 79.5∘ W) at 500 m altitude. In both cases, GDAS 0.5∘ meteorology and isentropic vertical motion were used. The red box indicates the location of the Azores. The map was created using public domain map data on Natural Earth (https://www.naturalearthdata.com/, last access: 12 March 2020) and the GSHHG database (https://ngdc.noaa.gov/mgg/shorelines/, last access: 12 March 2020).
Vertical profiles presented in Figs. 8–10 show strong stratification in aerosol chemistry. Below ∼1000 m, the particles are MSA-influenced and strongly sulfate dominated and acidic; at 1000–3000 m, the particles contain no MSA, are more neutralized (though still acidic), and can contain organics, ammonium and black carbon. HYSPLIT back trajectories in Fig. S7 corroborate the low-altitude air masses as strongly influenced by marine conditions. The high-altitude features are also consistent with long-rage transport of North American continental emissions. Research flight no. 19 on 19 July 2017 shows the strongest continental transport influence at altitudes between 1000 and 2500 m. The peak in aerosol abundance, organic and black carbon concentrations, and higher pH (Fig. 6) is accompanied by a peak in CO, methane and acetone concentrations (Figs. 11 and 12). Those characteristics suggest a biomass burning plume, but the lack of an AMS 60 levoglucosan marker points to highly processed biomass burning aerosol or anthropogenic emissions. In order to constrain the source of the emissions, HYSPLIT back-trajectory analysis of this flight was carried out as shown in Fig. 14. An ensemble of 14 d back trajectories was generated from the site of the first vertical profile (Table S1) at 2000 m altitude. The back trajectories reach >500 m altitude over the east of the United States on 12–15 July. The Fire Inventory from NCAR (FINNv1) (Wiedinmyer et al., 2011) was then used to provide locations of major fires on these 4 d, as shown in Fig. S8. Two fire clusters on those days occur in southwestern Canada and the southeastern United States. The southeastern US location in South Carolina, where FINN predicts the highest biomass burning emissions, was used to start 10 d forward trajectories in HYSPLIT in Fig. 14. Those reach the Azores at the correct time and altitude, which suggest that southeastern US could be the location for biomass burning emissions seen in the ENA region on 19 July 2017. A similar back-trajectory analysis was carried out for the southwestern Canadian fire location (Fig. S9), and those trajectories do not appear to reach the correct location. However, uncertainties in trajectory analysis and factors such as rapid mixing of free-tropospheric and MBL air (Wood et al., 2015) do not allow ruling it out as a source completely. Anthropogenic emissions such as traffic also cannot be ruled out completely as a source of 19 July elevated aerosol concentrations, other polluted layers at ENA, or the highly oxidized background organic aerosol. Such polluted layers were observed relatively frequently during the campaign, and they were often accompanied by large increases in CCN concentrations (Fig. 13). This shows that periodic long-range transport of pollution into the ENA region can significantly perturb the local CCN budget.
Long-range-transported aerosols (organic, ammonium, rBC) and reactive gases (methanol, acetone) at ENA show strong seasonality with high concentrations in the summer and low in the winter. This can be partially attributed to the seasonality of North American wildfires, which occur in the summer and winter. However, Fig. 12 suggests an opposite trend for CO, a non-reactive, water-insoluble gas, which on average shows higher concentrations in the winter. Analysis of 3 years of data at the ENA ARM site suggests a peak of CO and ozone concentrations occurring in the spring (March) and a minimum during the summer (July) (Zheng et al., 2018). This trend coincides with the CO and ozone seasonality seen during ACE-ENA. One explanation is that CO undergoes more photolytic destruction in the summer due to higher OH concentrations. Another is that continental transport into the Azores might actually be more prominent during the winter, but the particles and reactive gases are maybe locally scavenged by clouds. Figure S5 shows MODIS Aqua observations of cloud fraction over the North Atlantic during the two intensive observation periods during the ACE-ENA campaign. The mean cloud fraction over the Azores is 0.56 and 0.77 during summer and fall, respectively. Additionally, Fig. S10 shows that on average the winds were stronger in the winter, and the HYSPLIT back trajectories in Fig. S7 show more long-range transport during the winter at all altitudes. The seasonal trend in CO can also be attributed to local emissions to some extent, as higher emissions in the winter coincide with residential heating and power use. The EDGAR-HTAP V2 (https://edgar.jrc.ec.europa.eu/htap_v2/, last access: 4 May 2020) gridded emissions inventory (Janssens-Maenhout et al., 2015) was used to estimate local CO emissions in the Azores (Fig. S11), showing increased emissions in the power and residential sectors. However, local Azores anthropogenic emissions are still rather low, and the trends in local emissions and transported pollution are likely superimposed.
During the ACE-ENA campaign, 39 research flights in the vicinity of the Graciosa Island in the Azores were carried out during two seasons, summer 2017 and winter 2018. Aerosol and trace gas chemistry were characterized using the AMS and PTR-MS, as well as a suite of other sensors. AMS measurements reveal clean conditions with <1 µg m−3 non-refractory aerosol abundance and strong seasonality, where the summer aerosol concentrations were ∼4 times higher than in the winter. Trace reactive gas concentrations were often <1 ppb throughout the campaign, with similar seasonality. Particles sampled in the MBL showed contributions from MSA, which is a tracer for ocean biogenic activity. The summertime clean MBL at ENA is characterized by secondary sulfuric acid aerosol produced through DMS oxidation and some highly oxidized organic aerosol, which could be entrained from the free troposphere or ejected from the ocean. Secondary sulfate aerosol is also hygroscopic, which leads to a high baseline concentration of CCN above the ocean (100 cm−3 for 0.1 % supersaturation and 200 cm−3 for 0.3 % supersaturation). In the winter, less DMS is emitted due to seasonal shifts in ocean productivity, and consequently aerosol and CCN concentrations in the boundary layer also decrease (∼50 cm−3 for both supersaturations sampled).
Examination of vertical profiles and HYSPLIT back trajectories revealed numerous remote transport events that influenced the aerosol sampled in the free troposphere, above 1000 m. Both anthropogenic pollution and North American wildfires are a likely sources, with especially high emissions observed on 19 July 2017. Such long-range-transport events were accompanied by large plumes of CCN in the free troposphere (Fig. 13). The 19 July 2017 event was in particular traced to possible fires in the North American southeastern US region, and it was associated with a large plume of CCN (200–300 cm−3 for 0.1 % supersaturation and 300–400 cm−3 for 0.3 % supersaturation). This work shows that the CCN budget in the MBL in the eastern North Atlantic region is a result of complex interactions between long-rage transport of North American wildfire and anthropogenic emissions and the local marine biogenic sources.
All ARM datasets used in this paper are publicly available on the ARM website (https://www.arm.gov/research/campaigns/aaf2017ace-ena (last access: 30 October 2019) (ACE-ENA, 2019).
The supplement related to this article is available online at: https://doi.org/10.5194/acp-21-7983-2021-supplement.
MAZ, KS, JL, MP and JES collected the AMS and PTR-MS data aboard the G-1. FM, AJS, SS, YW and JW collected and analyzed other airborne data used in this paper. MAZ and JES analyzed the AMS and PTR-MS data. RAZ provided the MOSAIC model results. MAZ wrote the paper with contributions and advice from all co-authors.
The authors declare that they have no conflict of interest.
This article is part of the special issue “Marine aerosols, trace gases, and clouds over the North Atlantic (ACP/AMT inter-journal SI)”. It is not associated with a conference.
The authors thank the G-1 flight and ground crews for supporting the ACE-ENA campaign. This work was supported by the US Department of Energy's (DOE) Atmospheric System Research, an Office of Science Biological and Environmental Research program; Pacific Northwest National Laboratory is operated for the DOE by the Battelle Memorial Institute under contract DE-AC05-76RL01830. Collection of the data was supported by the Atmospheric Radiation Measurement (ARM) user facility, a US DOE user facility managed by the Biological and Environmental Research program.
This research has been supported by the US Department of Energy (grant no. KP1701000/57131).
This paper was edited by Timothy Bertram and reviewed by Steven Howell and one anonymous referee.
Abbatt, J. P. D., Leaitch, W. R., Aliabadi, A. A., Bertram, A. K., Blanchet, J.-P., Boivin-Rioux, A., Bozem, H., Burkart, J., Chang, R. Y. W., Charette, J., Chaubey, J. P., Christensen, R. J., Cirisan, A., Collins, D. B., Croft, B., Dionne, J., Evans, G. J., Fletcher, C. G., Galí, M., Ghahremaninezhad, R., Girard, E., Gong, W., Gosselin, M., Gourdal, M., Hanna, S. J., Hayashida, H., Herber, A. B., Hesaraki, S., Hoor, P., Huang, L., Hussherr, R., Irish, V. E., Keita, S. A., Kodros, J. K., Köllner, F., Kolonjari, F., Kunkel, D., Ladino, L. A., Law, K., Levasseur, M., Libois, Q., Liggio, J., Lizotte, M., Macdonald, K. M., Mahmood, R., Martin, R. V., Mason, R. H., Miller, L. A., Moravek, A., Mortenson, E., Mungall, E. L., Murphy, J. G., Namazi, M., Norman, A.-L., O'Neill, N. T., Pierce, J. R., Russell, L. M., Schneider, J., Schulz, H., Sharma, S., Si, M., Staebler, R. M., Steiner, N. S., Thomas, J. L., von Salzen, K., Wentzell, J. J. B., Willis, M. D., Wentworth, G. R., Xu, J.-W., and Yakobi-Hancock, J. D.: Overview paper: New insights into aerosol and climate in the Arctic, Atmos. Chem. Phys., 19, 2527–2560, https://doi.org/10.5194/acp-19-2527-2019, 2019.
ACE-ENA – Aerosol and Cloud Experiments in the Eastern North Atlantic: Campaign Datasets, Atmospheric Radiation Measurement (ARM) User Facility, available at: https://www.arm.gov/research/campaigns/aaf2017ace-ena, last access: 30 October 2019.
Andreae, M. O., Andreae, T. W., Meyerdierks, D., and Thiel, C.: Marine sulfur cycling and the atmospheric aerosol over the springtime North Atlantic, Chemosphere, 52, 1321–1343, https://doi.org/10.1016/S0045-6535(03)00366-7, 2003.
Behrenfeld, M. J., Moore, R. H., Hostetler, C. A., Graff, J., Gaube, P., Russell, L. M., Chen, G., Doney, S. C., Giovannoni, S., Liu, H., Proctor, C., Bolaños, L. M., Baetge, N., Davie-Martin, C., Westberry, T. K., Bates, T. S., Bell, T. G., Bidle, K. D., Boss, E. S., Brooks, S. D., Cairns, B., Carlson, C., Halsey, K., Harvey, E. L., Hu, C., Karp-Boss, L., Kleb, M., Menden-Deuer, S., Morison, F., Quinn, P. K., Scarino, A. J., Anderson, B., Chowdhary, J., Crosbie, E., Ferrare, R., Hair, J. W., Hu, Y., Janz, S., Redemann, J., Saltzman, E., Shook, M., Siegel, D. A., Wisthaler, A., Martin, M. Y., and Ziemba, L.: The North Atlantic Aerosol and Marine Ecosystem Study (NAAMES): Science Motive and Mission Overview, Front. Mar. Sci., 6, 122, https://doi.org/10.3389/fmars.2019.00122, 2019.
Berresheim, H., Andreae, M. O., Iverson, R. L., and Li, S. M.: Seasonal variations of dimethylsulfide emissions and atmospheric sulfur and nitrogen species over the western north Atlantic Ocean, Tellus B, 43, 353–372, https://doi.org/10.3402/tellusb.v43i5.15410, 1991.
Blomquist, B. W., Bandy, A. R., and Thornton, D. C.: Sulfur gas measurements in the eastern North Atlantic Ocean during the Atlantic Stratocumulus Transition Experiment/Marine Aerosol and Gas Exchange, J. Geophys. Res., 101, 4377–4392, https://doi.org/10.1029/95JD00618, 1996.
Bony, S. and Dufresne, J.-L.: Marine boundary layer clouds at the heart of tropical cloud feedback uncertainties in climate models, Geophys. Res. Lett., 32, L20806, https://doi.org/10.1029/2005GL023851, 2005.
Boucher, O., Randall, D., Artaxo, P., Bretherton, C., Feingold, G., Forster, P., Kerminen, V.-M., Kondo, Y., Liao, H., Lohmann, U., Rasch, P., Satheesh, S. K., Sherwood, S., Stevens, B., and Zhang, X. Y.: Climate Change 2013: The Physical Science Basis, in: Contribution of Working Group I to the Fifth Assessment Report of the Intergovernmental Panel on Climate Change Clouds and Aerosols, edited by: Stocker, T. F., Qin, D., Plattner, G.-K., Tignor, M., Allen, S. K., Boschung, J., Nauels, A., Xia, Y., Bex, V., and Midgley, P. M., Cambridge University Press, Cambridge, UK and New York, NY, USA, 2013.
Brocchi, V., Krysztofiak, G., Catoire, V., Guth, J., Marécal, V., Zbinden, R., El Amraoui, L., Dulac, F., and Ricaud, P.: Intercontinental transport of biomass burning pollutants over the Mediterranean Basin during the summer 2014 ChArMEx-GLAM airborne campaign, Atmos. Chem. Phys., 18, 6887–6906, https://doi.org/10.5194/acp-18-6887-2018, 2018.
Canagaratna, M. R., Jayne, J. T., Jimenez, J. L., Allan, J. D., Alfarra, M. R., Zhang, Q., Onasch, T. B., Drewnick, F., Coe, H., Middlebrook, A., Delia, A., Williams, L. R., Trimborn, A. M., Northway, M. J., DeCarlo, P. F., Kolb, C. E., Davidovits, P., and Worsnop, D. R.: Chemical and microphysical characterization of ambient aerosols with the aerodyne aerosol mass spectrometer, Mass Spectrom. Rev., 26, 185–222, https://doi.org/10.1002/mas.20115, 2007.
Canagaratna, M. R., Jimenez, J. L., Kroll, J. H., Chen, Q., Kessler, S. H., Massoli, P., Hildebrandt Ruiz, L., Fortner, E., Williams, L. R., Wilson, K. R., Surratt, J. D., Donahue, N. M., Jayne, J. T., and Worsnop, D. R.: Elemental ratio measurements of organic compounds using aerosol mass spectrometry: characterization, improved calibration, and implications, Atmos. Chem. Phys., 15, 253–272, https://doi.org/10.5194/acp-15-253-2015, 2015.
Carslaw, K. S., Lee, L. A., Reddington, C. L., Pringle, K. J., Rap, A., Forster, P. M., Mann, G. W., Spracklen, D. V., Woodhouse, M. T., Regayre, L. A., and Pierce, J. R.: Large contribution of natural aerosols to uncertainty in indirect forcing, Nature, 503, 67–71, https://doi.org/10.1038/nature12674, 2013.
Charlson, R. J., Lovelock, J. E., Andreae, M. O., and Warren, S. G.: Oceanic phytoplankton, atmospheric sulphur, cloud albedo and climate, Nature, 326, 655–661, https://doi.org/10.1038/326655a0, 1987.
Colomb, A., Yassaa, N., Williams, J., Peeken, I., and Lochte, K.: Screening volatile organic compounds (VOCs) emissions from five marine phytoplankton species by head space gas chromatography/mass spectrometry (HS-GC/MS), J. Environ. Monit., 10, 325–330, https://doi.org/10.1039/b715312k, 2008.
Dall'Osto, M., Ceburnis, D., Martucci, G., Bialek, J., Dupuy, R., Jennings, S. G., Berresheim, H., Wenger, J., Healy, R., Facchini, M. C., Rinaldi, M., Giulianelli, L., Finessi, E., Worsnop, D., Ehn, M., Mikkilä, J., Kulmala, M., and O'Dowd, C. D.: Aerosol properties associated with air masses arriving into the North East Atlantic during the 2008 Mace Head EUCAARI intensive observing period: an overview, Atmos. Chem. Phys., 10, 8413–8435, https://doi.org/10.5194/acp-10-8413-2010, 2010.
Dani, K. G. S. and Loreto, F.: Trade-Off Between Dimethyl Sulfide and Isoprene Emissions from Marine Phytoplankton, Trends Plant Sci., 22, 361–372, https://doi.org/10.1016/j.tplants.2017.01.006, 2017.
DeCarlo, P. F., Kimmel, J. R., Trimborn, A., Northway, M. J., Jayne, J. T., Aiken, A. C., Gonin, M., Fuhrer, K., Horvath, T., Docherty, K. S., Worsnop, D. R., and Jimenez, J. L.: Field-Deployable, High-Resolution, Time-of-Flight Aerosol Mass Spectrometer, Anal. Chem., 78, 8281–8289, https://doi.org/10.1021/ac061249n, 2006.
de Gouw, J. A., Middlebrook, A. M., Warneke, C., Goldan, P. D., Kuster, W. C., Roberts, J. M., Fehsenfeld, F. C., Worsnop, D. R., Canagaratna, M. R., Pszenny, A. A. P., Keene, W. C., Marchewka, M., Bertman, S. B., and Bates, T. S.: Budget of organic carbon in a polluted atmosphere: Results from the New England Air Quality Study in 2002, J. Geophys. Res., 110, D16305, https://doi.org/10.1029/2004JD005623, 2005.
Exton, D. A., Suggett, D. J., McGenity, T. J., and Steinke, M.: Chlorophyll-normalized isoprene production in laboratory cultures of marine microalgae and implications for global models, Limnol. Oceanogr., 58, 1301–1311, https://doi.org/10.4319/lo.2013.58.4.1301, 2013.
Flombaum, P., Gallegos, J. L., Gordillo, R. A., Rincon, J., Zabala, L. L., Jiao, N., Karl, D. M., Li, W. K. W., Lomas, M. W., Veneziano, D., Vera, C. S., Vrugt, J. A., and Martiny, A. C.: Present and future global distributions of the marine Cyanobacteria Prochlorococcus and Synechococcus, P. Natl. Acad. Sci. USA, 110, 9824–9829, https://doi.org/10.1073/pnas.1307701110, 2013.
Friese, E. and Ebel, A.: Temperature Dependent Thermodynamic Model of the System H+-NH4+-Na+---Cl−-H2O, J. Phys. Chem. A, 114, 11595–11631, https://doi.org/10.1021/jp101041j, 2010.
Frossard, A. A., Shaw, P. M., Russell, L. M., Kroll, J. H., Canagaratna, M. R., Worsnop, D. R., Quinn, P. K., and Bates, T. S.: Springtime Arctic haze contributions of submicron organic particles from European and Asian combustion sources, J. Geophys. Res., 116, D05205, https://doi.org/10.1029/2010JD015178, 2011.
Galí, M. and Simó, R.: A meta-analysis of oceanic DMS and DMSP cycling processes: Disentangling the summer paradox, Global Biogeochem. Cy., 29, 496–515, https://doi.org/10.1002/2014GB004940, 2015.
Galloway, J. N., Penner, J. E., Atherton, C. S., Prospero, J. M., Rodhe, H., Artz, R. S., Balkanski, Y. J., Bingemer, H. G., Brost, R. A., Burgermeister, S., Carmichael, G. R., Chang, J. S., Charlson, R. J., Cober, S., Ellis, W. G., Fischer, C. J., Hales, J. M., Hastie, D. R., Iversen, T., Jacob, D. J., John, K., Johnson, J. E., Kasibhatla, P. S., Langner, J., Lelieveld, J., Levy, H., Lipschultz, F., Merrill, J. T., Michaels, A. F., Miller, J. M., Moody, J. L., Pinto, J., Pszenny, A. A. P., Spiro, P. A., Tarrason, L., Turner, S. M., and Whelpdale, D. M.: Sulfur and nitrogen levels in the North Atlantic Ocean's atmosphere: A synthesis of field and modeling results, Global Biogeochem. Cy., 6, 77–100, https://doi.org/10.1029/91GB02977, 1992.
Hackenberg, S. C., Andrews, S. J., Airs, R., Arnold, S. R., Bouman, H. A., Brewin, R. J. W., Chance, R. J., Cummings, D., Dall'Olmo, G., Lewis, A. C., Minaeian, J. K., Reifel, K. M., Small, A., Tarran, G. A., Tilstone, G. H., and Carpenter, L. J.: Potential controls of isoprene in the surface ocean: Isoprene Controls in the Surface Ocean, Global Biogeochem. Cy., 31, 644–662, https://doi.org/10.1002/2016GB005531, 2017.
Hodshire, A. L., Campuzano-Jost, P., Kodros, J. K., Croft, B., Nault, B. A., Schroder, J. C., Jimenez, J. L., and Pierce, J. R.: The potential role of methanesulfonic acid (MSA) in aerosol formation and growth and then associated radiative forcings, Atmos. Chem. Phys., 19, 3137–3160, https://doi.org/10.5194/acp-19-3137-2019, 2019.
Hoffmann, E. H., Tilgner, A., Schrödner, R., Bräuer, P., Wolke, R., and Herrmann, H.: An advanced modeling study on the impacts and atmospheric implications of multiphase dimethyl sulfide chemistry, P. Natl. Acad. Sci. USA, 113, 11776–11781, https://doi.org/10.1073/pnas.1606320113, 2016.
Hu, Q.-H., Xie, Z.-Q., Wang, X.-M., Kang, H., He, Q.-F., and Zhang, P.: Secondary organic aerosols over oceans via oxidation of isoprene and monoterpenes from Arctic to Antarctic, Sci. Rep., 3, 2280, https://doi.org/10.1038/srep02280, 2013.
Huang, S., Poulain, L., van Pinxteren, D., van Pinxteren, M., Wu, Z., Herrmann, H., and Wiedensohler, A.: Latitudinal and Seasonal Distribution of Particulate MSA over the Atlantic using a Validated Quantification Method with HR-ToF-AMS, Environ. Sci. Technol., 51, 418–426, https://doi.org/10.1021/acs.est.6b03186, 2017.
Huang, S., Wu, Z., Poulain, L., van Pinxteren, M., Merkel, M., Assmann, D., Herrmann, H., and Wiedensohler, A.: Source apportionment of the organic aerosol over the Atlantic Ocean from 53∘ N to 53∘ S: significant contributions from marine emissions and long-range transport, Atmos. Chem. Phys., 18, 18043–18062, https://doi.org/10.5194/acp-18-18043-2018, 2018.
Huebert, B. J., Zhuang, L., Howell, S., Noone, K., and Noone, B.: Sulfate, nitrate, methanesulfonate, chloride, ammonium, and sodium measurements from ship, island, and aircraft during the Atlantic Stratocumulus Transition Experiment/Marine Aerosol Gas Exchange, J. Geophys. Res., 101, 4413–4423, https://doi.org/10.1029/95JD02044, 1996.
Janssens-Maenhout, G., Crippa, M., Guizzardi, D., Dentener, F., Muntean, M., Pouliot, G., Keating, T., Zhang, Q., Kurokawa, J., Wankmüller, R., Denier van der Gon, H., Kuenen, J. J. P., Klimont, Z., Frost, G., Darras, S., Koffi, B., and Li, M.: HTAP_v2.2: a mosaic of regional and global emission grid maps for 2008 and 2010 to study hemispheric transport of air pollution, Atmos. Chem. Phys., 15, 11411–11432, https://doi.org/10.5194/acp-15-11411-2015, 2015.
Jayne, J. T., Leard, D. C., Zhang, X., Davidovits, P., Smith, K. A., Kolb, C. E., and Worsnop, D. R.: Development of an Aerosol Mass Spectrometer for Size and Composition Analysis of Submicron Particles, Aerosol Sci. Tech., 33, 49–70, https://doi.org/10.1080/027868200410840, 2000.
Keller, M. D., Bellows, W. K., and Guillard, R. R. L.: Dimethyl Sulfide Production in Marine Phytoplankton, in: Biogenic Sulfur in the Environment, vol. 393, edited by: Saltzman, E. S. and Cooper, W. J., AmericanChemical Society, Washington, DC, 167–182, https://doi.org/10.1021/bk-1989-0393.ch011, 1989.
Kettle, A. J., Andreae, M. O., Amouroux, D., Andreae, T. W., Bates, T. S., Berresheim, H., Bingemer, H., Boniforti, R., Curran, M. A. J., DiTullio, G. R., Helas, G., Jones, G. B., Keller, M. D., Kiene, R. P., Leck, C., Levasseur, M., Malin, G., Maspero, M., Matrai, P., McTaggart, A. R., Mihalopoulos, N., Nguyen, B. C., Novo, A., Putaud, J. P., Rapsomanikis, S., Roberts, G., Schebeske, G., Sharma, S., Simó, R., Staubes, R., Turner, S., and Uher, G.: A global database of sea surface dimethylsulfide (DMS) measurements and a procedure to predict sea surface DMS as a function of latitude, longitude, and month, Global Biogeochem. Cy., 13, 399–444, https://doi.org/10.1029/1999GB900004, 1999.
Kim, M. J., Novak, G. A., Zoerb, M. C., Yang, M., Blomquist, B. W., Huebert, B. J., Cappa, C. D., and Bertram, T. H.: Air-Sea exchange of biogenic volatile organic compounds and the impact on aerosol particle size distributions: Air-Sea Exchange of Biogenic VOCs, Geophys. Res. Lett., 44, 3887–3896, https://doi.org/10.1002/2017GL072975, 2017.
Kloster, S., Feichter, J., Maier-Reimer, E., Six, K. D., Stier, P., and Wetzel, P.: DMS cycle in the marine ocean-atmosphere system – a global model study, Biogeosciences, 3, 29–51, https://doi.org/10.5194/bg-3-29-2006, 2006.
Lana, A., Simó, R., Vallina, S. M., and Dachs, J.: Re-examination of global emerging patterns of ocean DMS concentration, Biogeochemistry, 110, 173–182, https://doi.org/10.1007/s10533-011-9677-9, 2012.
Logan, T., Xi, B., and Dong, X.: Aerosol properties and their influences on marine boundary layer cloud condensation nuclei at the ARM mobile facility over the Azores: Aerosol and influences on MBL CCN, J. Geophys. Res.-Atmos., 119, 4859–4872, https://doi.org/10.1002/2013JD021288, 2014.
Meskhidze, N., Sabolis, A., Reed, R., and Kamykowski, D.: Quantifying environmental stress-induced emissions of algal isoprene and monoterpenes using laboratory measurements, Biogeosciences, 12, 637–651, https://doi.org/10.5194/bg-12-637-2015, 2015.
Middlebrook, A. M., Bahreini, R., Jimenez, J. L., and Canagaratna, M. R.: Evaluation of Composition-Dependent Collection Efficiencies for the Aerodyne Aerosol Mass Spectrometer using Field Data, Aerosol Sci. Tech., 46, 258–271, https://doi.org/10.1080/02786826.2011.620041, 2012.
Mungall, E. L., Abbatt, J. P. D., Wentzell, J. J. B., Lee, A. K. Y., Thomas, J. L., Blais, M., Gosselin, M., Miller, L. A., Papakyriakou, T., Willis, M. D., and Liggio, J.: Microlayer source of oxygenated volatile organic compounds in the summertime marine Arctic boundary layer, P. Natl. Acad. Sci. USA, 114, 6203–6208, https://doi.org/10.1073/pnas.1620571114, 2017.
NASA Goddard Space Flight Center: Ocean Ecology Laboratory, Ocean Biology Processing Group, Moderate-resolution Imaging Spectroradiometer (MODIS) Aqua Chlorophyll Data; 2018 Reprocessing, NASA Goddard Space Flight Center, Greenbelt, MD, 2018.
O'Brien, R. E. and Kroll, J. H.: Photolytic Aging of Secondary Organic Aerosol: Evidence for a Substantial Photo-Recalcitrant Fraction, J. Phys. Chem. Lett., 10, 4003–4009, https://doi.org/10.1021/acs.jpclett.9b01417, 2019.
Ovadnevaite, J., Manders, A., de Leeuw, G., Ceburnis, D., Monahan, C., Partanen, A.-I., Korhonen, H., and O'Dowd, C. D.: A sea spray aerosol flux parameterization encapsulating wave state, Atmos. Chem. Phys., 14, 1837–1852, https://doi.org/10.5194/acp-14-1837-2014, 2014.
Polimene, L., Archer, S. D., Butenschön, M., and Allen, J. I.: A mechanistic explanation of the Sargasso Sea DMS “summer paradox”, Biogeochemistry, 110, 243–255, https://doi.org/10.1007/s10533-011-9674-z, 2012.
Pszenny, A. A. P., Harvey, G. R., Brown, C. J., Lang, R. F., Keene, W. C., Galloway, J. N., and Merrill, J. T.: Measurements of dimethyl sulfide oxidation products in the summertime North Atlantic marine boundary layer, Global Biogeochem. Cy., 4, 367–379, https://doi.org/10.1029/GB004i004p00367, 1990.
Pye, H. O. T., Nenes, A., Alexander, B., Ault, A. P., Barth, M. C., Clegg, S. L., Collett Jr., J. L., Fahey, K. M., Hennigan, C. J., Herrmann, H., Kanakidou, M., Kelly, J. T., Ku, I.-T., McNeill, V. F., Riemer, N., Schaefer, T., Shi, G., Tilgner, A., Walker, J. T., Wang, T., Weber, R., Xing, J., Zaveri, R. A., and Zuend, A.: The acidity of atmospheric particles and clouds, Atmos. Chem. Phys., 20, 4809–4888, https://doi.org/10.5194/acp-20-4809-2020, 2020.
Quaas, J., Ming, Y., Menon, S., Takemura, T., Wang, M., Penner, J. E., Gettelman, A., Lohmann, U., Bellouin, N., Boucher, O., Sayer, A. M., Thomas, G. E., McComiskey, A., Feingold, G., Hoose, C., Kristjánsson, J. E., Liu, X., Balkanski, Y., Donner, L. J., Ginoux, P. A., Stier, P., Grandey, B., Feichter, J., Sednev, I., Bauer, S. E., Koch, D., Grainger, R. G., Kirkevåg, A., Iversen, T., Seland, Ø., Easter, R., Ghan, S. J., Rasch, P. J., Morrison, H., Lamarque, J.-F., Iacono, M. J., Kinne, S., and Schulz, M.: Aerosol indirect effects – general circulation model intercomparison and evaluation with satellite data, Atmos. Chem. Phys., 9, 8697–8717, https://doi.org/10.5194/acp-9-8697-2009, 2009.
Quinn, P. K. and Bates, T. S.: The case against climate regulation via oceanic phytoplankton sulphur emissions, Nature, 480, 51–56, https://doi.org/10.1038/nature10580, 2011.
Quinn, P. K., Coffman, D. J., Johnson, J. E., Upchurch, L. M., and Bates, T. S.: Small fraction of marine cloud condensation nuclei made up of sea spray aerosol, Nat. Geosci., 10, 674–679, https://doi.org/10.1038/ngeo3003, 2017.
Quinn, P. K., Bates, T. S., Coffman, D. J., Upchurch, L., Johnson, J. E., Moore, R., Ziemba, L., Bell, T. G., Saltzman, E. S., Graff, J., and Behrenfeld, M. J.: Seasonal Variations in Western North Atlantic Remote Marine Aerosol Properties, J. Geophys. Res.-Atmos., 124, 14240–14261, https://doi.org/10.1029/2019JD031740, 2019.
Raes, F., Bates, T., McGovern, F., and Van Liedekerke, M.: The 2nd Aerosol Characterization Experiment (ACE-2): general overview and main results, Tellus B, 52, 111–125, https://doi.org/10.1034/j.1600-0889.2000.00124.x, 2000.
Righetti, D., Vogt, M., Gruber, N., Psomas, A., and Zimmermann, N. E.: Global pattern of phytoplankton diversity driven by temperature and environmental variability, Sci. Adv., 5, eaau6253, https://doi.org/10.1126/sciadv.aau6253, 2019.
Roberts, G. C. and Nenes, A.: A Continuous-Flow Streamwise Thermal-Gradient CCN Chamber for Atmospheric Measurements, Aerosol Sci. Tech., 39, 206–221, https://doi.org/10.1080/027868290913988, 2005.
Russell, L. M., Hawkins, L. N., Frossard, A. A., Quinn, P. K., and Bates, T. S.: Carbohydrate-like composition of submicron atmospheric particles and their production from ocean bubble bursting, P. Natl. Acad. Sci. USA, 107, 6652–6657, https://doi.org/10.1073/pnas.0908905107, 2010.
Saliba, G., Chen, C., Lewis, S., Russell, L. M., Quinn, P. K., Bates, T. S., Bell, T. G., Lawler, M. J., Saltzman, E. S., Sanchez, K. J., Moore, R., Shook, M., Rivellini, L., Lee, A., Baetge, N., Carlson, C. A., and Behrenfeld, M. J.: Seasonal Differences and Variability of Concentrations, Chemical Composition, and Cloud Condensation Nuclei of Marine Aerosol Over the North Atlantic, J. Geophys. Res.-Atmos., 125, e2020JD033145, https://doi.org/10.1029/2020JD033145, 2020.
Savoie, D. L., Arimoto, R., Keene, W. C., Prospero, J. M., Duce, R. A., and Galloway, J. N.: Marine biogenic and anthropogenic contributions to non‐sea‐salt sulfate in the marine boundary layer over the North Atlantic Ocean, J. Geophys. Res., 107, 4356, https://doi.org/10.1029/2001JD000970, 2002.
Shaw, S. L., Gantt, B., and Meskhidze, N.: Production and Emissions of Marine Isoprene and Monoterpenes: A Review, Adv. Meteorol., 2010, 1–24, https://doi.org/10.1155/2010/408696, 2010.
Shilling, J. E., Pekour, M. S., Fortner, E. C., Artaxo, P., de Sá, S., Hubbe, J. M., Longo, K. M., Machado, L. A. T., Martin, S. T., Springston, S. R., Tomlinson, J., and Wang, J.: Aircraft observations of the chemical composition and aging of aerosol in the Manaus urban plume during GoAmazon 2014/5, Atmos. Chem. Phys., 18, 10773–10797, https://doi.org/10.5194/acp-18-10773-2018, 2018.
Shrivastava, M., Zelenyuk, A., Imre, D., Easter, R., Beranek, J., Zaveri, R. A., and Fast, J.: Implications of low volatility SOA and gas-phase fragmentation reactions on SOA loadings and their spatial and temporal evolution in the atmosphere, J. Geophys. Res.-Atmos., 118, 3328–3342, https://doi.org/10.1002/jgrd.50160, 2013.
Shrivastava, M., Easter, R. C., Liu, X., Zelenyuk, A., Singh, B., Zhang, K., Ma, P.-L., Chand, D., Ghan, S., Jimenez, J. L., Zhang, Q., Fast, J., Rasch, P. J., and Tiitta, P.: Global transformation and fate of SOA: Implications of low-volatility SOA and gas-phase fragmentation reactions: Global Modeling of SOA, J. Geophys. Res.-Atmos., 120, 4169–4195, https://doi.org/10.1002/2014JD022563, 2015.
Stein, A. F., Draxler, R. R., Rolph, G. D., Stunder, B. J. B., Cohen, M. D., and Ngan, F.: NOAA's HYSPLIT Atmospheric Transport and Dispersion Modeling System, B. Am. Meteorol. Soc., 96, 2059–2077, https://doi.org/10.1175/BAMS-D-14-00110.1, 2015.
Surratt, J. D., Chan, A. W. H., Eddingsaas, N. C., Chan, M., Loza, C. L., Kwan, A. J., Hersey, S. P., Flagan, R. C., Wennberg, P. O., and Seinfeld, J. H.: Reactive intermediates revealed in secondary organic aerosol formation from isoprene, P. Natl. Acad. Sci. USA, 107, 6640–6645, https://doi.org/10.1073/pnas.0911114107, 2010.
Travis, K. R., Heald, C. L., Allen, H. M., Apel, E. C., Arnold, S. R., Blake, D. R., Brune, W. H., Chen, X., Commane, R., Crounse, J. D., Daube, B. C., Diskin, G. S., Elkins, J. W., Evans, M. J., Hall, S. R., Hintsa, E. J., Hornbrook, R. S., Kasibhatla, P. S., Kim, M. J., Luo, G., McKain, K., Millet, D. B., Moore, F. L., Peischl, J., Ryerson, T. B., Sherwen, T., Thames, A. B., Ullmann, K., Wang, X., Wennberg, P. O., Wolfe, G. M., and Yu, F.: Constraining remote oxidation capacity with ATom observations, Atmos. Chem. Phys., 20, 7753–7781, https://doi.org/10.5194/acp-20-7753-2020, 2020.
Twomey, S.: Pollution and the planetary albedo, Atmos. Environ., 8, 1251–1256, https://doi.org/10.1016/0004-6981(74)90004-3, 1974.
Vaden, T. D., Song, C., Zaveri, R. A., Imre, D., and Zelenyuk, A.: Morphology of mixed primary and secondary organic particles and the adsorption of spectator organic gases during aerosol formation, P. Natl. Acad. Sci. USA, 107, 6658–6663, https://doi.org/10.1073/pnas.0911206107, 2010.
Vaden, T. D., Imre, D., Beranek, J., Shrivastava, M., and Zelenyuk, A.: Evaporation kinetics and phase of laboratory and ambient secondary organic aerosol, P. Natl. Acac. Sci. USA, 108, 2190–2195, https://doi.org/10.1073/pnas.1013391108, 2011.
Val Martin, M., Honrath, R. E., Owen, R. C., and Li, Q. B.: Seasonal variation of nitrogen oxides in the central North Atlantic lower free troposphere, J. Geophys. Res., 113, D17307, https://doi.org/10.1029/2007JD009688, 2008.
Wang, S., Maltrud, M. E., Burrows, S. M., Elliott, S. M., and Cameron-Smith, P.: Impacts of Shifts in Phytoplankton Community on Clouds and Climate via the Sulfur Cycle, Global Biogeochem. Cy., 32, 1005–1026, https://doi.org/10.1029/2017GB005862, 2018.
Wexler, A. S. and Clegg, S. L.: Atmospheric aerosol models for systems including the ions H+, , Na+, , , Cl−, Br−, and H2O, J. Geophys. Res., 107, 4207, https://doi.org/10.1029/2001JD000451, 2002.
Wiedinmyer, C., Akagi, S. K., Yokelson, R. J., Emmons, L. K., Al-Saadi, J. A., Orlando, J. J., and Soja, A. J.: The Fire INventory from NCAR (FINN): a high resolution global model to estimate the emissions from open burning, Geosci. Model Dev., 4, 625–641, https://doi.org/10.5194/gmd-4-625-2011, 2011.
Willis, M. D., Bozem, H., Kunkel, D., Lee, A. K. Y., Schulz, H., Burkart, J., Aliabadi, A. A., Herber, A. B., Leaitch, W. R., and Abbatt, J. P. D.: Aircraft-based measurements of High Arctic springtime aerosol show evidence for vertically varying sources, transport and composition, Atmos. Chem. Phys., 19, 57–76, https://doi.org/10.5194/acp-19-57-2019, 2019.
Wood, R.: Drizzle in Stratiform Boundary Layer Clouds. Part I: Vertical and Horizontal Structure, J. Atmos. Sci., 62, 3011–3033, https://doi.org/10.1175/JAS3529.1, 2005.
Wood, R.: Cancellation of Aerosol Indirect Effects in Marine Stratocumulus through Cloud Thinning, J. Atmos. Sci., 64, 2657–2669, https://doi.org/10.1175/JAS3942.1, 2007.
Wood, R., Wyant, M., Bretherton, C. S., Rémillard, J., Kollias, P., Fletcher, J., Stemmler, J., de Szoeke, S., Yuter, S., Miller, M., Mechem, D., Tselioudis, G., Chiu, J. C., Mann, J. A. L., O'Connor, E. J., Hogan, R. J., Dong, X., Miller, M., Ghate, V., Jefferson, A., Min, Q., Minnis, P., Palikonda, R., Albrecht, B., Luke, E., Hannay, C., and Lin, Y.: Clouds, Aerosols, and Precipitation in the Marine Boundary Layer: An Arm Mobile Facility Deployment, B. Am. Meteorol. Soc., 96, 419–440, https://doi.org/10.1175/BAMS-D-13-00180.1, 2015.
Zaveri, R. A., Easter, R. C., Fast, J. D., and Peters, L. K.: Model for Simulating Aerosol Interactions and Chemistry (MOSAIC), J. Geophys. Res., 113, D13204, https://doi.org/10.1029/2007JD008782, 2008.
Zawadowicz, M. A., Lee, B. H., Shrivastava, M., Zelenyuk, A., Zaveri, R. A., Flynn, C., Thornton, J. A., and Shilling, J. E.: Photolysis Controls Atmospheric Budgets of Biogenic Secondary Organic Aerosol, Environ. Sci. Technol., 54, 3861–3870, https://doi.org/10.1021/acs.est.9b07051, 2020.
Zelenyuk, A., Imre, D., Beránek, J., Abramson, E., Wilson, J., and Shrivastava, M.: Synergy between Secondary Organic Aerosols and Long-Range Transport of Polycyclic Aromatic Hydrocarbons, Environ. Sci. Technol., 46, 12459–12466, https://doi.org/10.1021/es302743z, 2012.
Zhang, Q., Jimenez, J. L., Canagaratna, M. R., Allan, J. D., Coe, H., Ulbrich, I., Alfarra, M. R., Takami, A., Middlebrook, A. M., Sun, Y. L., Dzepina, K., Dunlea, E., Docherty, K., DeCarlo, P. F., Salcedo, D., Onasch, T., Jayne, J. T., Miyoshi, T., Shimono, A., Hatakeyama, S., Takegawa, N., Kondo, Y., Schneider, J., Drewnick, F., Borrmann, S., Weimer, S., Demerjian, K., Williams, P., Bower, K., Bahreini, R., Cottrell, L., Griffin, R. J., Rautiainen, J., Sun, J. Y., Zhang, Y. M., and Worsnop, D. R.: Ubiquity and dominance of oxygenated species in organic aerosols in anthropogenically-influenced Northern Hemisphere midlatitudes, Geophys. Res. Lett., 34, L13801, https://doi.org/10.1029/2007GL029979, 2007.
Zheng, G., Wang, Y., Aiken, A. C., Gallo, F., Jensen, M. P., Kollias, P., Kuang, C., Luke, E., Springston, S., Uin, J., Wood, R., and Wang, J.: Marine boundary layer aerosol in the eastern North Atlantic: seasonal variations and key controlling processes, Atmos. Chem. Phys., 18, 17615–17635, https://doi.org/10.5194/acp-18-17615-2018, 2018.
Zuidema, P., Sedlacek, A. J., Flynn, C., Springston, S., Delgadillo, R., Zhang, J., Aiken, A. C., Koontz, A., and Muradyan, P.: The Ascension Island Boundary Layer in the Remote Southeast Atlantic is Often Smoky, Geophys. Res. Lett., 45, 4456–4465, https://doi.org/10.1002/2017GL076926, 2018.