the Creative Commons Attribution 4.0 License.
the Creative Commons Attribution 4.0 License.
 | 18 May 2021
Reactive nitrogen around the Arabian Peninsula and in the Mediterranean Sea during the 2017 AQABA ship campaign
Nils Friedrich
Philipp Eger
Justin Shenolikar
Nicolas Sobanski
Jan Schuladen
Dirk Dienhart
Bettina Hottmann
Ivan Tadic
Horst Fischer
Monica Martinez
Roland Rohloff
Sebastian Tauer
Hartwig Harder
Eva Y. Pfannerstill
Nijing Wang
Jonathan Williams
James Brooks
Frank Drewnick
Guo Li
Yafang Cheng
Jos Lelieveld
We present shipborne measurements of NOx (≡ NO + NO2) and NOy (≡ NOx+ gas- and particle-phase organic and inorganic oxides of nitrogen) in summer 2017 as part of the expedition “Air Quality and climate change in the Arabian BAsin” (AQABA). The NOx and NOz (≡ NOy-NOx) measurements, made with a thermal dissociation cavity ring-down spectrometer (TD-CRDS), were used to examine the chemical mechanisms involved in the processing of primary NOx emissions and their influence on the NOy budget in chemically distinct marine environments, including the Mediterranean Sea, the Red Sea, and the Arabian Gulf, which were influenced to varying extents by emissions from shipping and oil and gas production. Complementing the TD-CRDS measurements, NO and NO2 data sets from a chemiluminescence detector (CLD) were used in the analysis. In all regions, we find that NOx is strongly connected to ship emissions, both via direct emission of NO and via the formation of HONO and its subsequent photolytic conversion to NO. The role of HONO was assessed by calculating the NOx production rate from its photolysis. Mean NO2 lifetimes were 3.9 h in the Mediterranean Sea, 4.0 h in the Arabian Gulf, and 5.0 h in the Red Sea area. The cumulative loss of NO2 during the night (reaction with O3) was more important than daytime losses (reaction with OH) over the Arabian Gulf (by a factor 2.8) and over the Red Sea (factor 2.9), whereas over the Mediterranean Sea, where OH levels were high, daytime losses dominated (factor 2.5). Regional ozone production efficiencies (OPEs; calculated from the correlation between Ox and NOz, where Ox= O3+ NO2) ranged from 10.5 ± 0.9 to 19.1 ± 1.1. This metric quantifies the relative strength of photochemical O3 production from NOx compared to the competing sequestering into NOz species. The largest values were found over the Arabian Gulf, consistent with high levels of O3 found in that region (10–90 percentiles range: 23–108 ppbv). The fractional contribution of individual NOz species to NOy exhibited a large regional variability, with HNO3 generally the dominant component (on average 33 % of NOy) with significant contributions from organic nitrates (11 %) and particulate nitrates in the PM1 size range (8 %).
- Article
(10891 KB) - Full-text XML
-
Supplement
(2026 KB) - BibTeX
- EndNote


The nitrogen oxides NO and NO2 are emitted into the atmosphere in several natural and anthropogenic processes including lightning (Chameides et al., 1977; Lange et al., 2001), combustion (Lenner, 1987), and bacterial action in soil (Oertel et al., 2016). Due to their rapid interconversion, NO and NO2 are often treated as a single chemical family (NOx).
The chemical processing of NOx in the atmosphere, initiated by ozone and the radicals OH, HO2, and NO3, leads to the formation of NOz (NOz= HNO3+ NO3+ 2N2O5+ RO2NO2+ RONO2+ XONO2+ XNO2+ particulate nitrates), where R is an organic fragment and X represents a halogen atom or a H atom. The sum of NOx and NOz is referred to as total reactive nitrogen NOy (Logan, 1983), which does not include N2, N2O, NH3, or HCN.
OH, formed, for example, via the photolysis of O3 in the presence of water (Reactions R1a and R1b), can directly convert both NO and NO2 to more oxidised, acidic forms (R2, R3; where M is a collision partner). NOx can be re-formed from HONO at daytime through photolysis, with a noon-time lifetime of ca. 20–30 min (Stutz et al., 2000).
OH can also react with volatile organic compounds (VOCs) to generate peroxy radicals (RO2, Reaction R4). Reaction with organic peroxy radicals converts NO to NO2 (major channel; reaction R5a) or to organic nitrates RONO2 (minor channel; Reaction R5b), and it sequesters NO2 as peroxy nitrates RO2NO2 (Reaction R7).
The formation of long-lived organic nitrates (R5b) and especially nitric acid (R3) represent daytime sinks for both NOx and ROx (OH + HO2+RO + RO2).
At night-time, when the photolysis of NO2 ceases, NO is sequentially converted to the NO3 radical (Reaction R8). This radical can also be a source of RONO2 species through the addition to unsaturated VOCs. NO3 exists in thermal equilibrium with NO2 and N2O5 (Reaction R9) and the heterogeneous loss of N2O5 to aqueous surfaces results in transfer of NOy to the particle phase as HNO3 (Reaction R10) or its loss via deposition. In some (especially marine) environments (Osthoff et al., 2008; Kercher et al., 2009), loss of N2O5 to particles can result in formation of ClNO2 (R11) which, via photolysis, re-forms NO2 the next day.
The above reactions illustrate that NOx and VOCs provide the catalyst and fuel for photochemical ozone formation, the efficiency of which is determined by the competition between photolysis of NO2 to ozone and its conversion to NOz (Day et al., 2003; Wild et al., 2014, 2016; Womack et al., 2017). Modelling studies have identified the Arabian Gulf as a hotspot for O3 pollution and photochemical smog, with O3 mixing ratios exceeding 100 ppbv (Lelieveld et al., 2009).
The lack of measurements in the Arabian Gulf and the eastern Mediterranean, both of which are expected to be significantly impacted by climate change (Lelieveld et al., 2012), preclude accurate prognosis of air quality in these regions and provide the rationale for conducting the AQABA campaign (AQABA: Air Quality and climate change in the Arabian BAsin), in which a large suite of instruments were operated in regions that were influenced by anthropogenic emissions from megacities, petrochemical and shipping activity, and desert dust emissions and through regions that could be classified as maritime background conditions. Emissions from oil exploration provide a complex atmospheric mixture of NOx and anthropogenic VOCs. The presence of desert dust can have a significant impact on the budget of inorganic acids such as HNO3. Finally, the overall elevated temperatures and actinic fluxes during AQABA promoted rapid photochemical processing of NOx. We therefore expect a more varied and complex chemistry than found in remote marine locations.
Previous analyses from this campaign focussed on sources and sinks of non-methane hydrocarbons (Bourtsoukidis et al., 2019); the role of OH reactivity in ozone chemistry (Pfannerstill et al., 2019); formation of ClNO2 (Eger et al., 2019a), ethane, and propane emissions from the Red Sea (Bourtsoukidis et al., 2020); emission factors in ship plumes (Celik et al., 2020); marine emissions of methane sulfonamide (Edtbauer et al., 2020); rates of net O3 production (Tadic et al., 2020); and the abundance of carbonyl compounds.
In this paper we present NOx, NOy, and NOz mixing ratios obtained by a thermal dissociation cavity ring-down spectrometer (TD-CRDS), together with NO and NO2 mixing ratios from a chemiluminescence detector, a comprehensive set of ancillary measurements, and an analysis of the results in terms of photochemical processing and ageing of air masses, chemical sources of NOx (e.g. from the photolysis of HONO), and the efficiency of ozone formation.
The ozone production efficiency (OPE), a metric used in the analysis of the O3 formation, quantifies the fractional transformation of primarily emitted NOx to O3 (Liu et al., 1987; Trainer et al., 1993) and thus reflects the relative importance of competing photochemical processes leading to O3 and NOz formation from NOx. High values of OPE are favoured by low OH and VOC concentrations, and values exceeding 80 have been reported for remote marine environments. Low single-digit values have been observed in polluted urban environments (Rickard et al., 2002; Wang et al., 2018). The location dependence of the OPE can be further classified with previous observations from the literature. Minimal OPEs in urban environments between 1 and 2 have been reported from the Beijing area (Lin et al., 2011; Ge et al., 2013) and from the USA (Daum et al., 2000; Sillman, 2000; Nunnermacker et al., 2004). In rural and suburban environments, the OPE can increase to values between 10 and 15, as demonstrated in North America (Olszyna et al., 1994; Roussel et al., 1996; Fried et al., 1997; Ninneman et al., 2017) and in China (Sun et al., 2010). From oceanic samples, OPEs of 65 and 87 were observed on the south-eastern coast of the UK (Rickard et al., 2002) and on Sable Island, Canada (Wang et al., 1996). Flights over the western Pacific Ocean found values of 102–246 in the tropical area (latitude 0–18∘ N) and of 73–209 further north (18–42∘ N) (Davis et al., 1996). For the AQABA campaign, we expect lower OPEs than those observed in remote oceanic locations, due to the variable influx from harbours, coastal pollution, and surrounding ship traffic.
The AQABA ship campaign followed a route from Toulon in southern France to Kuwait (and back) via the Mediterranean Sea, the Suez Canal, the Red Sea, the Arabian Sea, and the Arabian Gulf (see Fig. 1). Stops were made in Malta, Jeddah, Djibouti, and Fujairah on the first leg (24 June to 30 July 2017) and in Fujairah and Malta on the second leg (2 August to 30 August 2017). Most measurements started in the south-eastern Mediterranean Sea on the first leg and finished ca. halfway between Sicily and Corsica on the second leg. The instruments were located either in air-conditioned research containers aboard, or directly on the deck of, the 73 m long research vessel “Kommandor Iona”. Periods during which instrument inlets were contaminated by ship-stack emissions from the ship (identified based on relative wind direction and speed and the variability in measured SO2 and NO mixing ratios) were excluded from the analysis. This resulted in rejection of 38.4 % of the data points on the first leg, when the wind and ship direction were often similar, and rejection of 1.4 % on the second leg of the campaign, when sailing mainly into the wind.

Figure 1Mixing ratio of NOz from the second leg of the campaign, colour-coded along the ship track. Each data point represents an average over 30 min. Grey lines represent HYSPLIT 48 h back-trajectories starting from the ship location at 100 m height. SH = Strait of Hormuz; BM = Strait of Bab al-Mandab; SC = Suez Canal.
2.1 TD-CRDS instrument for NOx, NOy, and NOz detection
The TD-CRDS instrument, its operating principles, laboratory characterisation, and a validation of the NOx measurements versus an independent chemiluminescence detector (CLD) instrument have recently been presented (Friedrich et al., 2020). The TD-CRDS (located in an air-conditioned research container on the front deck of the vessel) has two separate cavities operating at a wavelength of 405 nm and at sub-ambient pressure (720 to 770 hPa) to prevent condensation of water on inlet lines under humid conditions. One of the cavities is connected to an inlet (perfluoroalkoxy alkane (PFA) tubing) at ambient temperature, and the other cavity is connected to a tubular quartz inlet, which was heated to 850 ∘C to thermally dissociate NOy trace gases to NO or NO2. The TD oven was accommodated in an aluminium box on top of the container with the inlet ca. 1.2 m above the container roof. Air samples reached the TD area less than 30 cm behind the tip of the inlet, and we expect negligible inlet losses for NOy species. Inlet lines of the heated and the ambient temperature channel were each overall ca. 4 m long (2 m located inside and 2 m outside the container). In the Red Sea and Arabian Gulf, the inlet heating of the NOy channel was switched off occasionally during the hottest hours of the day to prevent damage to the oven electronics. The campaign data coverage for NOy is 65 %, considering only time periods when the ship was moving.
The total uncertainty (at 50 % relative humidity and 1 min integration time) amounts to 11 % + 10 pptv for NOx and to 16 % + 14 pptv for NOz if we disregard the non-quantitative detection of coarse-mode non-refractory nitrate (see below). Detection limits (5 s integration time) during the AQABA campaign were 98 pptv for NOx, 51 pptv for NOy, and 110 pptv for NOz and are higher than those reported for laboratory operation owing to problems with optical alignment due to the motion of the ship. Detection limits are defined as the 2σ standard deviation between consecutive zeroing periods. Under laboratory conditions, NOx detection limits of 40 pptv (1 min average) were obtained (Friedrich et al., 2020); 6 pptv (40 s) has been achieved with undegraded mirrors (Thieser et al., 2016).
The NOz mixing ratios obtained using the TD-CRDS were calculated from the difference between NOy and NOx measurements and thus contain a contribution from particulate nitrate. Friedrich et al. (2020) have shown that this instrument measures ammonium nitrate quantitatively but detects only a fraction (≈ 25 %) of sodium nitrate (NaNO3) of 200–300 nm diameter as NOx. The inefficient detection of some non-refractory nitrate species (e.g. NaNO3) means that the NOy mixing ratios presented below are thus (potentially) lower limits. As NaNO3 is usually associated with coarse-mode aerosol (particle diameter > 1 µm), this also implies that the particle-phase nitrate measured by the TD-CRDS is comparable to that measured by an aerosol mass spectrometer (HR-ToF-AMS; see Sect. 2.3). In marine environments, sea salt aerosol can be the dominant aerosol component (Lewis and Schwartz, 2004). We therefore note that the definition of NOy, in this work, is restricted to non-refractory nitrate particles which can be vaporised by the AMS or in the TD inlet of the CRDS. Nitrate detection by the AMS is further discussed in Sect. 3.2.2 and 3.4.
High loadings of coarse-mode particles are associated with high wind speeds, which were encountered on the first leg passing the Strait of Bab al-Mandab, through the Arabian Sea, and until the Gulf of Oman and on the second leg in the Arabian Sea and in the northern Red Sea. The fractional contribution of coarse-mode particles to the overall mass concentration were derived using data from an optical particle counter (OPC) and via the (PM10–PM1) PM10 ratio (both PM1 and PM10 were measured with the OPC). We see from Fig. S1 that the impact of coarse-mode nitrate may have been largest on both legs in the transitional area between the southern Red Sea and Arabian Sea, where OPC PM10 mass concentrations exceeded 150 µg m−3 and the coarse-mode fraction was consistently > ca. 90 %.
2.2 CLD measurements of NOx
NO and NO2 were measured with a chemiluminescence detector (CLD 790 SR, ECO PHYSICS, 5 s time resolution) as described in Tadic et al. (2020), with total measurement uncertainties of 6 % (NO) and 23 % (NO2) and detection limits of 22 pptv for NO and 52 pptv for NO2, both calculated at a time resolution of 5 s and a confidence interval of 2σ. The CLD detection method is based on the chemiluminescence of electronically excited NO formed in the reaction of NO with O3. Ambient NO2 is photolytically converted to NO by exposure to UV light from LEDs emitting at wavelengths close to 398 nm. The CLD was calibrated every 6 h using a 2 ppmv NO gas standard.
2.3 Other measurements
An overview of the instruments deployed is given in Table 1. Total organic nitrates (ONs) were measured as the sum of peroxy nitrates (PNs, RO2NO2) and alkyl nitrates (ANs, RONO2) in a five-channel thermal dissociation cavity-ring-down spectrometer (5C-TD-CRDS; Sobanski et al., 2016). SO2 and ClNO2 were measured with a chemical ionisation quadrupole mass spectrometer (CI-QMS) with 15 s time resolution (Eger et al., 2019a, b). The detection limits for SO2 and ClNO2 were 38 and 12 pptv, respectively; the total uncertainties were 20 % ± 23 pptv (SO2) and 30 % ± 6 pptv (ClNO2). Particulate-phase nitrate (pNit) and sulfate concentrations in the PM1 size range were obtained by an aerosol mass spectrometer (Aerodyne HR-ToF-AMS; DeCarlo et al., 2006) with measurement uncertainties of 30 % and 35 %, respectively, for the mass concentrations of NO and SO. Total aerosol mass concentrations in the PM1 and PM10 size ranges were calculated from particle size distributions, detected with an optical particle counter (OPC, Grimm model 1.109; size range: 250 nm to 32 µm) in a 6 s time resolution and with a 35 % uncertainty. Ozone was measured by optical absorption at 253.65 nm in a commercial ozone monitor (2B Technologies model 202) with total measurement uncertainty of 2 % ± 1 ppbv and a detection limit of 3 ppbv (at 10 s integration time). HONO mixing ratios were measured by a long-path absorption photometer (LOPAP; Heland et al., 2001) with a 3–5 pptv detection limit and a measurement uncertainty of 20 %. The path length of the instrument was 1.9 m, and the inlet was also located on the foredeck of the ship at a ca. 5 m distance to the TD-CRDS inlets. A spectral radiometer (Metcon GmbH) measured wavelength-resolved actinic flux, which was converted to photolysis rate constants (J) for NO2, NO3 and HONO using evaluated quantum yields and cross sections (Burkholder et al., 2015). The overall uncertainty in J is ca. 15 %, which includes calibration accuracy (Bohn et al., 2008) and the neglect of upwelling radiation from the sea surface. OH concentrations were obtained from a custom-built laser-induced fluorescence (LIF) instrument (Martinez et al., 2010; Regelin et al., 2013) with an upper limit total uncertainty of 40 %. Total OH reactivity measurements were performed according to the comparative reactivity method (Sinha et al., 2008), with a 5 min detection limit of 5.4 s−1 and a ca. 50 % total uncertainty, as described in Pfannerstill et al. (2019). HCHO was detected by a commercial instrument (AL4021, Aero-Laser GmbH) according to the Hantzsch method and had a relative uncertainty of 13 % (Stickler et al., 2006). Multi-pass absorption spectroscopy using a quantum cascade laser was used to measure CO mixing ratios with 20 % uncertainty and a limit of detection of 0.6 ppbv (Li et al., 2013).
Table 1Data sets used in the analysis and corresponding measurement characteristics.

* represents total aerosol mass concentration. represents photolysis rate constants for NO2, NO3, and HONO. NA stands for not available.
2.4 Meteorological data
Temperature, wind direction, wind speed, and relative humidity were measured by a weather station (Neptune, Sterela), together with the GPS position and velocity of the ship. Back-trajectories were obtained using the HYSPLIT transport and dispersion model (Stein et al., 2015; Rolph et al., 2017). The trajectories were calculated backwards for 48 h from the GPS location of the ship with a starting height of 100 m a.m.s.l., using the Global Data Assimilation System (GDAS1) meteorological model. The back-trajectories were limited to 48 h as this exceeds the lifetimes of both NOx and NOz (see later) and is thus sufficient to indicate potential source regions. Back-trajectories displayed in graphs are considered to be representative for the prevailing atmospheric flow conditions when passing the respective areas along the AQABA ship track.
In Fig. S2 we show the complete NOx, NOy, and NOz time series from the campaign, averaged from the 5 s raw data time resolution onto a 5 min grid. Periods of contamination by the ship's own exhaust are indicated by grey background colouring. The regional variation in NOx and NOz during the second leg is illustrated in Figs. S3c and 1 which also delineates the campaign into the “Red Sea” (2–16 July and 17–24 August 2017), the “Arabian Sea” (16–24 July and 7–17 August 2017), the “Arabian Gulf” (24–31 July and 3–7 August 2017), and the “Mediterranean Sea” (24–31 August 2017).
Altogether, 4.8 % of the NOx measurements during AQABA were below the ca. 100 ppt detection limit of the TD-CRDS instrument, indicating only sporadic occurrence of maritime background conditions. Similar observations were made by Tadic et al. (2020), with only 3.3 % of the NOx data set below 50 pptv in the Arabian Sea, the southern Red Sea, and the eastern Mediterranean. In comparison, NOx mixing ratios below 20 pptv were previously found, for example, over the South Atlantic (Fischer et al., 2015). The black lines in Fig. 1 represent 2 d back-trajectories (HYSPLIT; see Sect. 2.4). A similar figure for the first leg is given in Fig. S3. For the Mediterranean Sea, the Red Sea, and the Arabian Gulf, we present an analysis of the lifetimes and sources of NOx and NOz. Chemical sources of NOx, e.g. from the photolysis of HONO or pNit, are discussed in Sect. 3.4. The chemically distinct regions are compared and contrasted in Sects. 3.5 and 4. Dividing the analysis into the three regions helps to highlight the chemically different environments encountered. An analysis of the Arabian Sea region was unfortunately not possible due to a gap in the NOz measurements between 9 and 17 August 2017, caused by instrument failure during heavy seas and winds. The division of the regions was based on the prevalent NOx mixing ratios displayed in Fig. S3c. In contrast to other AQABA publications (Eger et al., 2019a; Pfannerstill et al., 2019; Tadic et al., 2020), the Gulf of Oman, and the Suez Channel were included in the Arabian Gulf and the Red Sea regions, respectively, as a clear shift in NOx to mixing ratios below ca. 1 ppbv occurred both upon leaving the Gulf of Oman into the Arabian Sea and upon exiting the Suez Channel to the north towards the Mediterranean Sea. The transitions between the Arabian Gulf and the Gulf of Oman, and between the northern Red Sea and the Suez region are less obviously represented in the NOx levels.
3.1 Mediterranean Sea
Owing to unfavourable winds resulting in contamination of the measurements by the ships own exhaust as well as instrument malfunction, very little useable data were obtained by the TD-CRDS during the first leg through the Mediterranean Sea, and we analyse only the data obtained on the return leg (24–31 August 2017). In this period, temperatures varied between 24 and 29 ∘C with relative humidity between 52 % and 89 % (see Fig. S2). During most of the transit through the Mediterranean Sea, winds were from the north. At the end of the cruise when approaching Sicily, we encountered a shift in wind direction with air arriving from the north-west. Back-trajectories (see Fig. 1) indicate that when sailing through the eastern Mediterranean Sea we encountered air masses that had passed over Turkey; the air we sampled in the central Mediterranean Sea had passed over the Balkan states, and in the western Mediterranean it had passed over Greece and Italy. The trajectories ending at the ships location were persistently located in the boundary layer (height < 1000 m) for the previous 48 h. An exception was the back-trajectory originating from the Black Sea, which was located at a height (above ground level) of up to 1740 m. The back-trajectory passing over the island of Crete was located at a maximum height of 3224 m, which may be the result of orographic uplift caused by the central Cretan mountain range.
3.1.1 NOx
NOx mixing ratios were generally low in the Mediterranean Sea (Fig. 2a). One-minute mean and median mixing ratios of NOx as detected by the TD-CRDS were 1.3 and 0.3 ppbv, respectively. For the CLD measurements of NOx, the equivalent values are 1.1 and 0.2 ppbv, respectively. For both instruments, the difference between mean and median values stems from the frequent occurrence of NOx plumes resulting from emissions of nearby ships. The NOx mixing ratios measured by TD-CRDS and CLD were in good agreement (see Friedrich et al., 2020) and the bias of the TD-CRDS to higher values reflects the exclusion of data below the detection limit. A histogram of the NOx measurements made by the CLD is displayed in Fig. 2b), which indicates that 33 % of the NOx data were between 100 and 250 pptv and 24 % were above 1 ppbv. The maximum mixing ratio of NOx in the Mediterranean Sea of 84.7 ppbv was measured in the narrowest part of the Strait of Messina, which is a busy corridor for international shipping with ferry traffic between Italy and Sicily crossing the Kommandor Iona's ship track. This observation highlights the importance of NOx shipping emissions in some parts of the Mediterranean Sea, which we return to later.

Figure 2NOy measurements in the Mediterranean Sea. Dashed lines signify the instrument detection limits. (a) NOx mixing ratios by CLD and TD-CRDS. (b) Frequency distribution of NOx mixing ratios between 25 August and 1 September 2017. (c) NOz mixing ratios by TD-CRDS. (d) Frequency distribution of NOz mixing ratios between 25 August and 1 September 2017. The yellow shaded regions show . The vertical dotted lines are the limits of detection of the respective measurements.
Potential non-shipping sources of NOx in this region can be identified via the back-trajectories plotted in Fig. 1. In the eastern part of the Mediterranean Sea, the air masses were influenced by emissions from the heavily populated and industrialised western Turkish coastal area, the island of Crete, and mainland Greece. However, as we show below, the lifetime of NOx is generally less than 6 h, and the greater fraction of any land-based NOx emissions would have undergone oxidation to NOz during the 48 h transport time of the back-trajectory. In the western Mediterranean Sea, the 2 d back-trajectories end above the open ocean.
Our data can be compared to results from previous measurements of NOx in the Mediterranean area. Excluding pollution events, Mallik et al. (2018) report NO and NO2 levels below 0.05 and 0.25 ppbv, respectively, during the 2014 Cyprus-based CYPHEX (CYprus PHotochemical EXperiment 2014) campaign in the eastern Mediterranean Sea. Plume-like increases in NOx were associated with enhanced SO2 and related to emissions from shipping (Eger et al., 2019b). During the MINOS (Mediterranean INtensive Oxidant Study) campaign on the island of Crete, median NO2 mixing ratios between 0.3 ppbv and 0.7 ppbv were reported (Berresheim et al., 2003). The lower mixing ratios were associated with air masses arriving from the western European free troposphere, whereas the higher values were air masses impacted by biomass burning in eastern Europe. In contrast, higher NO2 mixing ratios (typically between 4 and 6 ppbv excluding plumes) were reported from shipboard measurements in the Aegean Sea (Večeřa et al., 2008). Satellite-based observations of NO2 vertical column densities over Crete and in the region between Crete and Sicily, were used to derive near-surface NO2 mixing ratios of up to ∼ 0.4 ppbv (Ladstätter-Weißenmayer et al., 2003, 2007).
Our NOx measurements are thus broadly consistent with previous measurements in the Mediterranean Sea which indicate mixing ratios of less than 1 ppbv in the absence of recent emissions from ships. The higher mixing ratios reported by Večeřa et al. (2008) are likely to be related to the close proximity of their ship to NOx sources on the European continent and denser ship traffic compared to the more southerly AQABA route through the eastern Mediterranean Sea.
3.1.2 NOz
Figure 2c and d show a time series and histogram, respectively, of NOz for the Mediterranean Sea. The shape of the distribution indicates that NOz mixing ratios close to the detection limit were rarely measured. The mean (0.8 ppbv), median (0.7 ppbv), maximum (2.8 ppbv), and minimum NOz mixing ratios (< 0.1 ppbv) along with the narrower distribution indicate that, as expected, NOz is significantly less variable than NOx. The ratio of the median mixing ratios NOz NOy in the Mediterranean Sea is ∼ 0.8, and, concomitantly, that of NOx NOy is ∼ 0.2. A more detailed analysis of the relative contributions of NOx and NOz to NOy, in which we divide the Mediterranean Sea into seven subregions, is presented in the following paragraphs. The choice of these subregions was based on the existence of homogeneous NOz NOy ratios over periods of hours to days. This approach enabled us to compare subregions with substantially different chemical regimes along the ship track but does not lend itself to the derivation of a representative NOy budget for the entire region.
The pie charts in Fig. 3 indicate the regional average contributions (in subregions M1 to M7) of reactive nitrogen species to NOy. The fractional contributions are based on measurements of NOx, NOy, gas-phase organic nitrates (ON), particulate nitrate (pNit), ClNO2, and HONO. HNO3 was not measured directly but calculated from HNO3= NOy – (NOx+ ON + pNit + ClNO2+ HONO), where pNit refers to submicron particulate nitrate as measured by the HR-ToF-AMS. Detection of coarse-mode pNit by the TD-CRDS (see Friedrich et al., 2020) would lead to an overestimation of HNO3. However, given that the thermal dissociation to NO2 of NaNO3 particles with 300 nm diameter is inefficient (∼ 20 %) with this instrument, a significant bias by coarse-mode nitrate (e.g. associated with sea salt or mineral dust) appears unlikely. The data available in each subregion did not always cover an entire diurnal cycle, which will have an impact on the fractional contributions of individual NOy species (see differences between day- and night-time chemistry in Sect. 1). We argue, however, that diurnal patterns in NOy are likely overshadowed by the variability of air mass sources. The NOy compositions presented are thus to be considered coarse estimates.
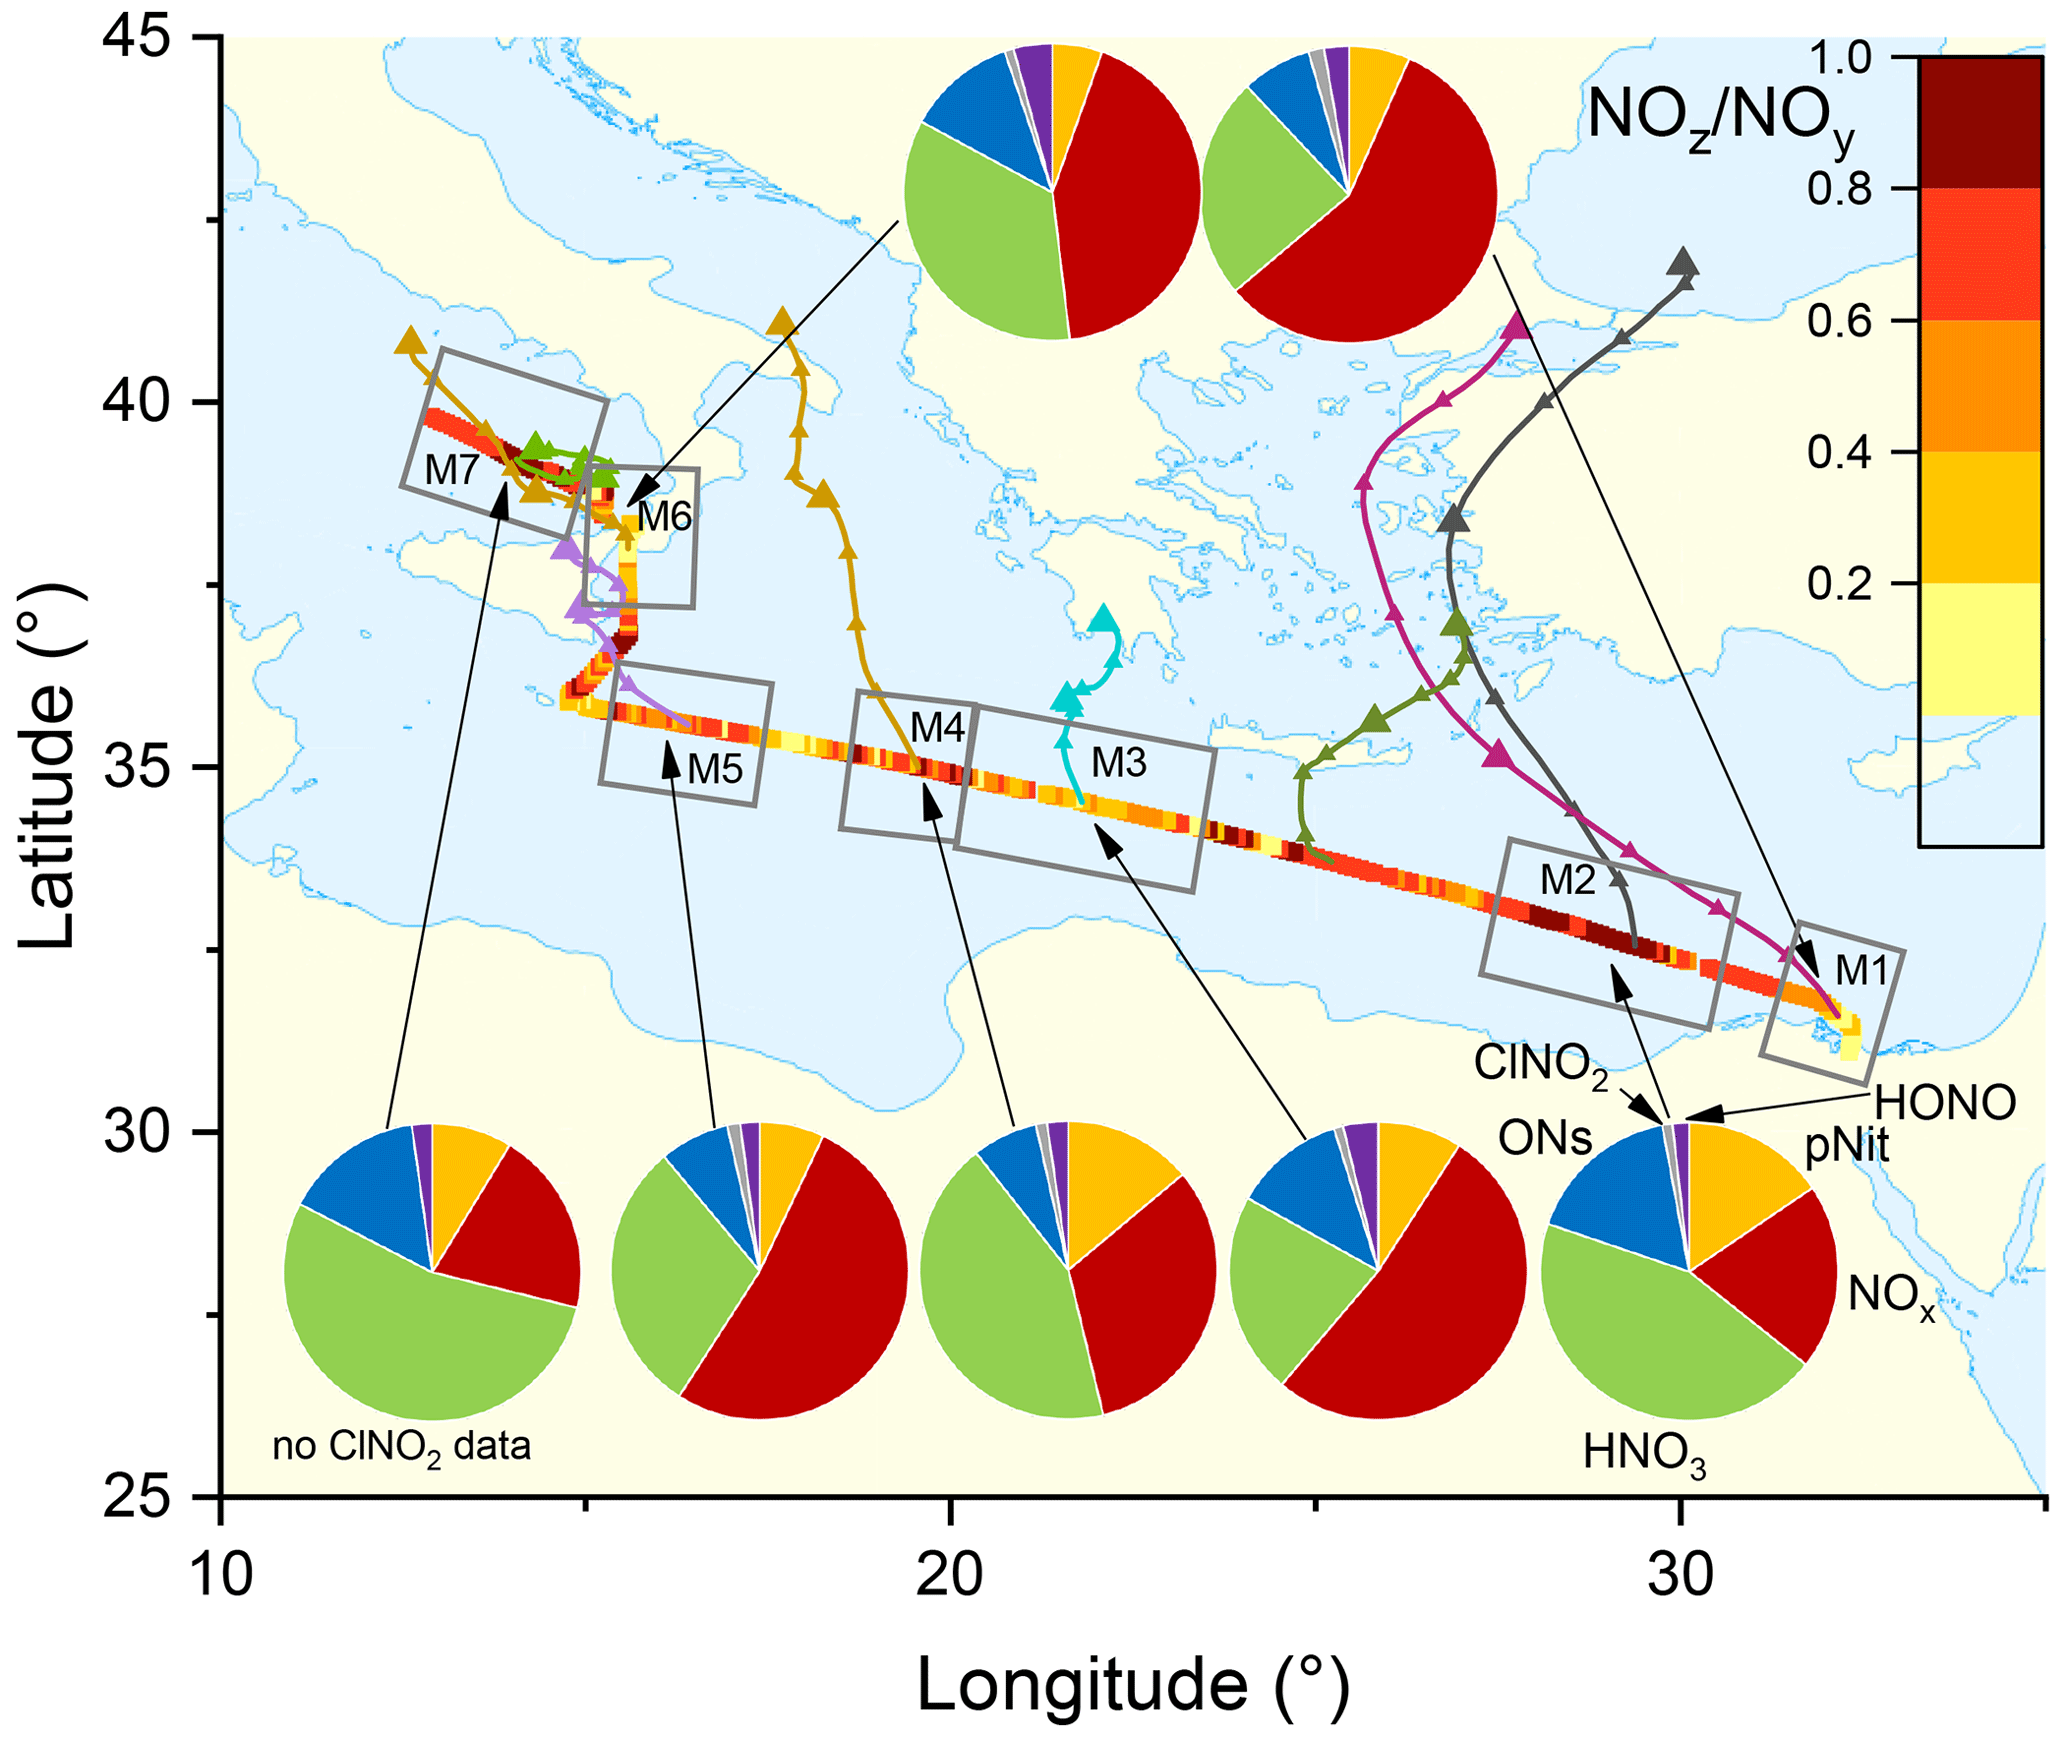
Figure 3The NOz NOy ratio over the Mediterranean Sea. Coloured lines are 2 d back-trajectories (HYSPLIT). The pie charts indicate the components of NOy at various segments along the ship's track (ONs = organic nitrates, pNit = particulate nitrate). HNO3 was calculated via HNO3= NOz – (ONs + pNit + ClNO2+ HONO). The colours of the pie chart segments are assigned as follows (clockwise): pNit in yellow, NOx in red, HNO3 in green, ONs in blue, ClNO2 in grey, and HONO in magenta.
In all subregions, HNO3 is the dominant component of NOy besides NOx and therefore the most important NOz species. Contrastingly, submicron pNit only contributes between 5.4 % (M6) and 15.5 % (M2) to NOy and ONs between 7.1 % (M4) and 16.9 % (M2). ClNO2 only constitutes a minor part of NOy with ca. 1 % contribution in all regions where ClNO2 was measured (M1–M6). The low mixing ratios of ClNO2 have been attributed to high night-time temperatures and high reactivity of NO3 which reduce the interaction of N2O5 with chloride-containing particles (Eger et al., 2019a). Elevated HONO mixing ratios (up to 0.3 ppbv) were observed in regions M3 and M6 where its contributions to NOz was 3.8 % and 4.2 %, respectively. As the daytime lifetime of HONO is short (a few minutes) due to its rapid photolysis (Platt et al., 1980), HONO levels up to 0.3 ppbv imply strong sources. Elevated HONO mixing ratios in ship plumes have been observed in previous field measurements (Večeřa et al., 2008; Sun et al., 2020) and could explain the presence of HONO in subregions M3 and M6. Other sources of HONO, summarised in Elshorbany et al. (2012), include heterogeneous or photochemical reactions of NOx and NOz on various surfaces and also the photolysis of particulate nitrate (Meusel et al., 2018).
Figure 3 also plots the NOz NOy ratio along the ship's track. The highest values with median NOz NOy > 0.68 were found in regions M2, M4, and M7, reflecting a lack of local NOx sources as confirmed by the back-trajectories. For visual clarity, only the back-trajectories starting at the geographical centres of the respective subregions are displayed in Fig. 3. Back-trajectories starting at the ship's location 4 h before or after confirmed that the air mass origin was very similar. In contrast, the regions designated M3, M5, and M6 are influenced by fresh emissions from land-based sources and are characterised by low NOz NOy ratios (medians < 0.55), reflecting the higher levels of NOx which contributed 52 % (M3 and M5) and 43 % (M6) to total NOy.
3.1.3 Lifetime and sources of NOx
In the following section, the observations of NOx in the Mediterranean Sea are analysed in terms of its production and loss. Following the considerations in Sect. 1, we compare the daytime loss of NOx via the reaction between NO2 and OH (Reaction R3; expected to dominate over other daytime NOx loss processes in the marine environment) with night-time losses via the reaction between NO2 and O3 (Reaction R8):
where represents the total loss rate constant (in s−1) for NO2 and is the inverse of the NO2 lifetime (). The first term on the right-hand side of this expression is most important during the day when OH levels were high (up to 1.4 × 10⁷ molec. cm−3 at local noon) but relatively unimportant at night. In contrast, the second term on the right is only important at night as the NO3 product of R8 is rapidly photolysed back to NOx during daytime so that NOx is conserved.
By using Eq. (1) to approximate the NO2 loss rate constant, we neglect two further processes which can, under some conditions, influence the lifetime of NO2. Our approach assumes that the night-time formation of NO3 leads to the removal of one NO2 molecule. This approach would be invalid if a significant fraction of NO3 would be lost via formation (and subsequent heterogeneous loss) of N2O5. Firstly, we note that formation of N2O5 was hindered during AQABA by the high gas-phase reactivity of NO3 towards VOCs (Eger et al., 2019a) and that the transfer of N2O5 to the particle phase was hindered by high temperatures. For example, taking an N2O5 uptake coefficient of 0.03 (as found for polluted marine environments by Aldener et al., 2006) and the median night-time aerosol surface area (ASA) in the Mediterranean Sea of cm2 cm−3 (Eger et al., 2019a), we estimated a loss rate constant for uptake of N2O5 of s−1, which is 2 orders of magnitude lower than the rate constant ( s−1) for thermal decomposition at 25.7 ∘C (the mean, minimum night-time temperature in the Mediterranean Sea).
We also neglect the loss of NOx via uptake of NO2 onto black carbon (BC) particles. Using a literature uptake coefficient of ca. (Longfellow et al., 1999) and the aforementioned ASA, the first-order loss rate constant for the heterogeneous uptake would be 1.8 × 10⁻⁶ s−1. Using an O3 mixing ratio of 63.4 ppbv (equal to night-time median mixing ratio in the Mediterranean Sea), we calculate a first-order loss rate constant for the reaction of NO2 and O3 of 5.5 × 10⁻⁵ s−1, which implies that > 95 % of total NO2 loss at night-time NO2 is due to O3. Uptake of NO2 might, therefore, be relevant for HONO formation (see Sect. 3.4) but does not constitute a relevant loss process for NOx.
In order to fill gaps in the OH data set (daytime data coverage of 71 %), complete diel cycles of OH were generated by scaling measurements of to the OH noon-time maxima. Figure S4 compares the measured OH concentrations with the interpolated trace and shows that the thereby derived OH levels can be considered upper limits. Inserting these values and the measured O3 concentration into Eq. (1) and using preferred rate coefficients for k3 and k8 (IUPAC, 2020) we derive lifetimes (Fig. 4a) of ∼ 2 h at local noon (largest OH levels) and 5–6 h at night. Loss of NOx by deposition may be important in forested regions (Delaria et al., 2018; Delaria and Cohen, 2020) but is expected to be insignificant in a marine environment. The relative importance of day- and night-time losses of NO2 in the Mediterranean Sea during AQABA was estimated by integrating the two loss terms using the available NO2, O3, and OH data. Averaged over the 6 d of measurements, 3.71 ppbv of NOx was lost per 12 h day and 1.51 ppbv was lost per 12 h night (Fig. 4c).

Figure 4(a) Lifetime (τ) of NO2 due to reactions with OH and O3 in the Mediterranean Sea, together with concentrations of O3 and OH. The OH trace is an interpolation based on OH measurements and (see Sect. 3.1.3). Daytime hours are indicated via . (b) Cumulative loss of NO2 during the displayed time frame, based on the calculated lifetimes and measured NO2.
Although our conclusion is based on a limited data set, we calculate that the OH-induced daytime loss of NOx is most important in the Mediterranean Sea, reflecting the high levels of OH encountered during AQABA, but we note that night-time losses make a significant contribution. It is very likely that in other seasons with reduced photochemical activity and lower temperatures (which favour the formation of N2O5 which can remove two NO2 molecules via heterogeneous processes), the night-time losses gain in relative importance. Averaged over the entire data set obtained in the Mediterranean Sea, we calculate a lifetime of NO2 of 3.9 h. Chemical sources of NOx in the Mediterranean Sea, i.e. from the photolysis of HONO and pNit, as well the reaction of OH and HNO3, are discussed in detail in Sect. 3.4.
In the following, we examine the contribution of ship emissions to the NOx budget in the Mediterranean region and especially along the track taken by the Kommandor Iona during the AQABA campaign. In Fig. S5 we plot a time series of NOx and SO2 data for the transit through the Mediterranean Sea. It is immediately apparent that large plume-like features in NOx coincide with similar features in SO2. We now separate the data set into two regimes in which the NOz and NOy measurements indicate either relatively “fresh” emissions (NOz NOy ratio < 0.4) or relatively “aged” emissions (NOz NOy ratio > 0.8). In Fig. 5a we show that, for fresh emissions, SO2 and NOx are highly correlated (Pearson's R = 0.84) with a slope of 4 ± 0.1 ppbv NOx per ppbv SO2 and an intercept (at zero SO2) of −1.9 ± 0.3 ppbv. This strongly suggests that fresh NOx emissions are generally accompanied by SO2 and thus indicates that either ships or power plants, e.g. in coastal locations, are the likely sources of a large fraction of the NOx. The slope is similar to that derived by Celik et al. (2020) (2.7 ± 0.8), who examined single ship plumes in a more detailed analysis and with literature values that range from 6.8 ± 6.3 near the coast of Texas (Williams et al., 2009) to 11.2 ± 10.9 (Diesch et al., 2013) at the Elbe river near Hamburg/Germany. In comparison to Celik et al. (2020), however, the two other literature studies only sampled very fresh and unprocessed ship plumes, from a distance of less than ca. 5 km to the emission source. Fig. 5a shows that NOz and SO2 are not correlated (Pearson's R= 0.38) in air masses impacted by fresh emissions.
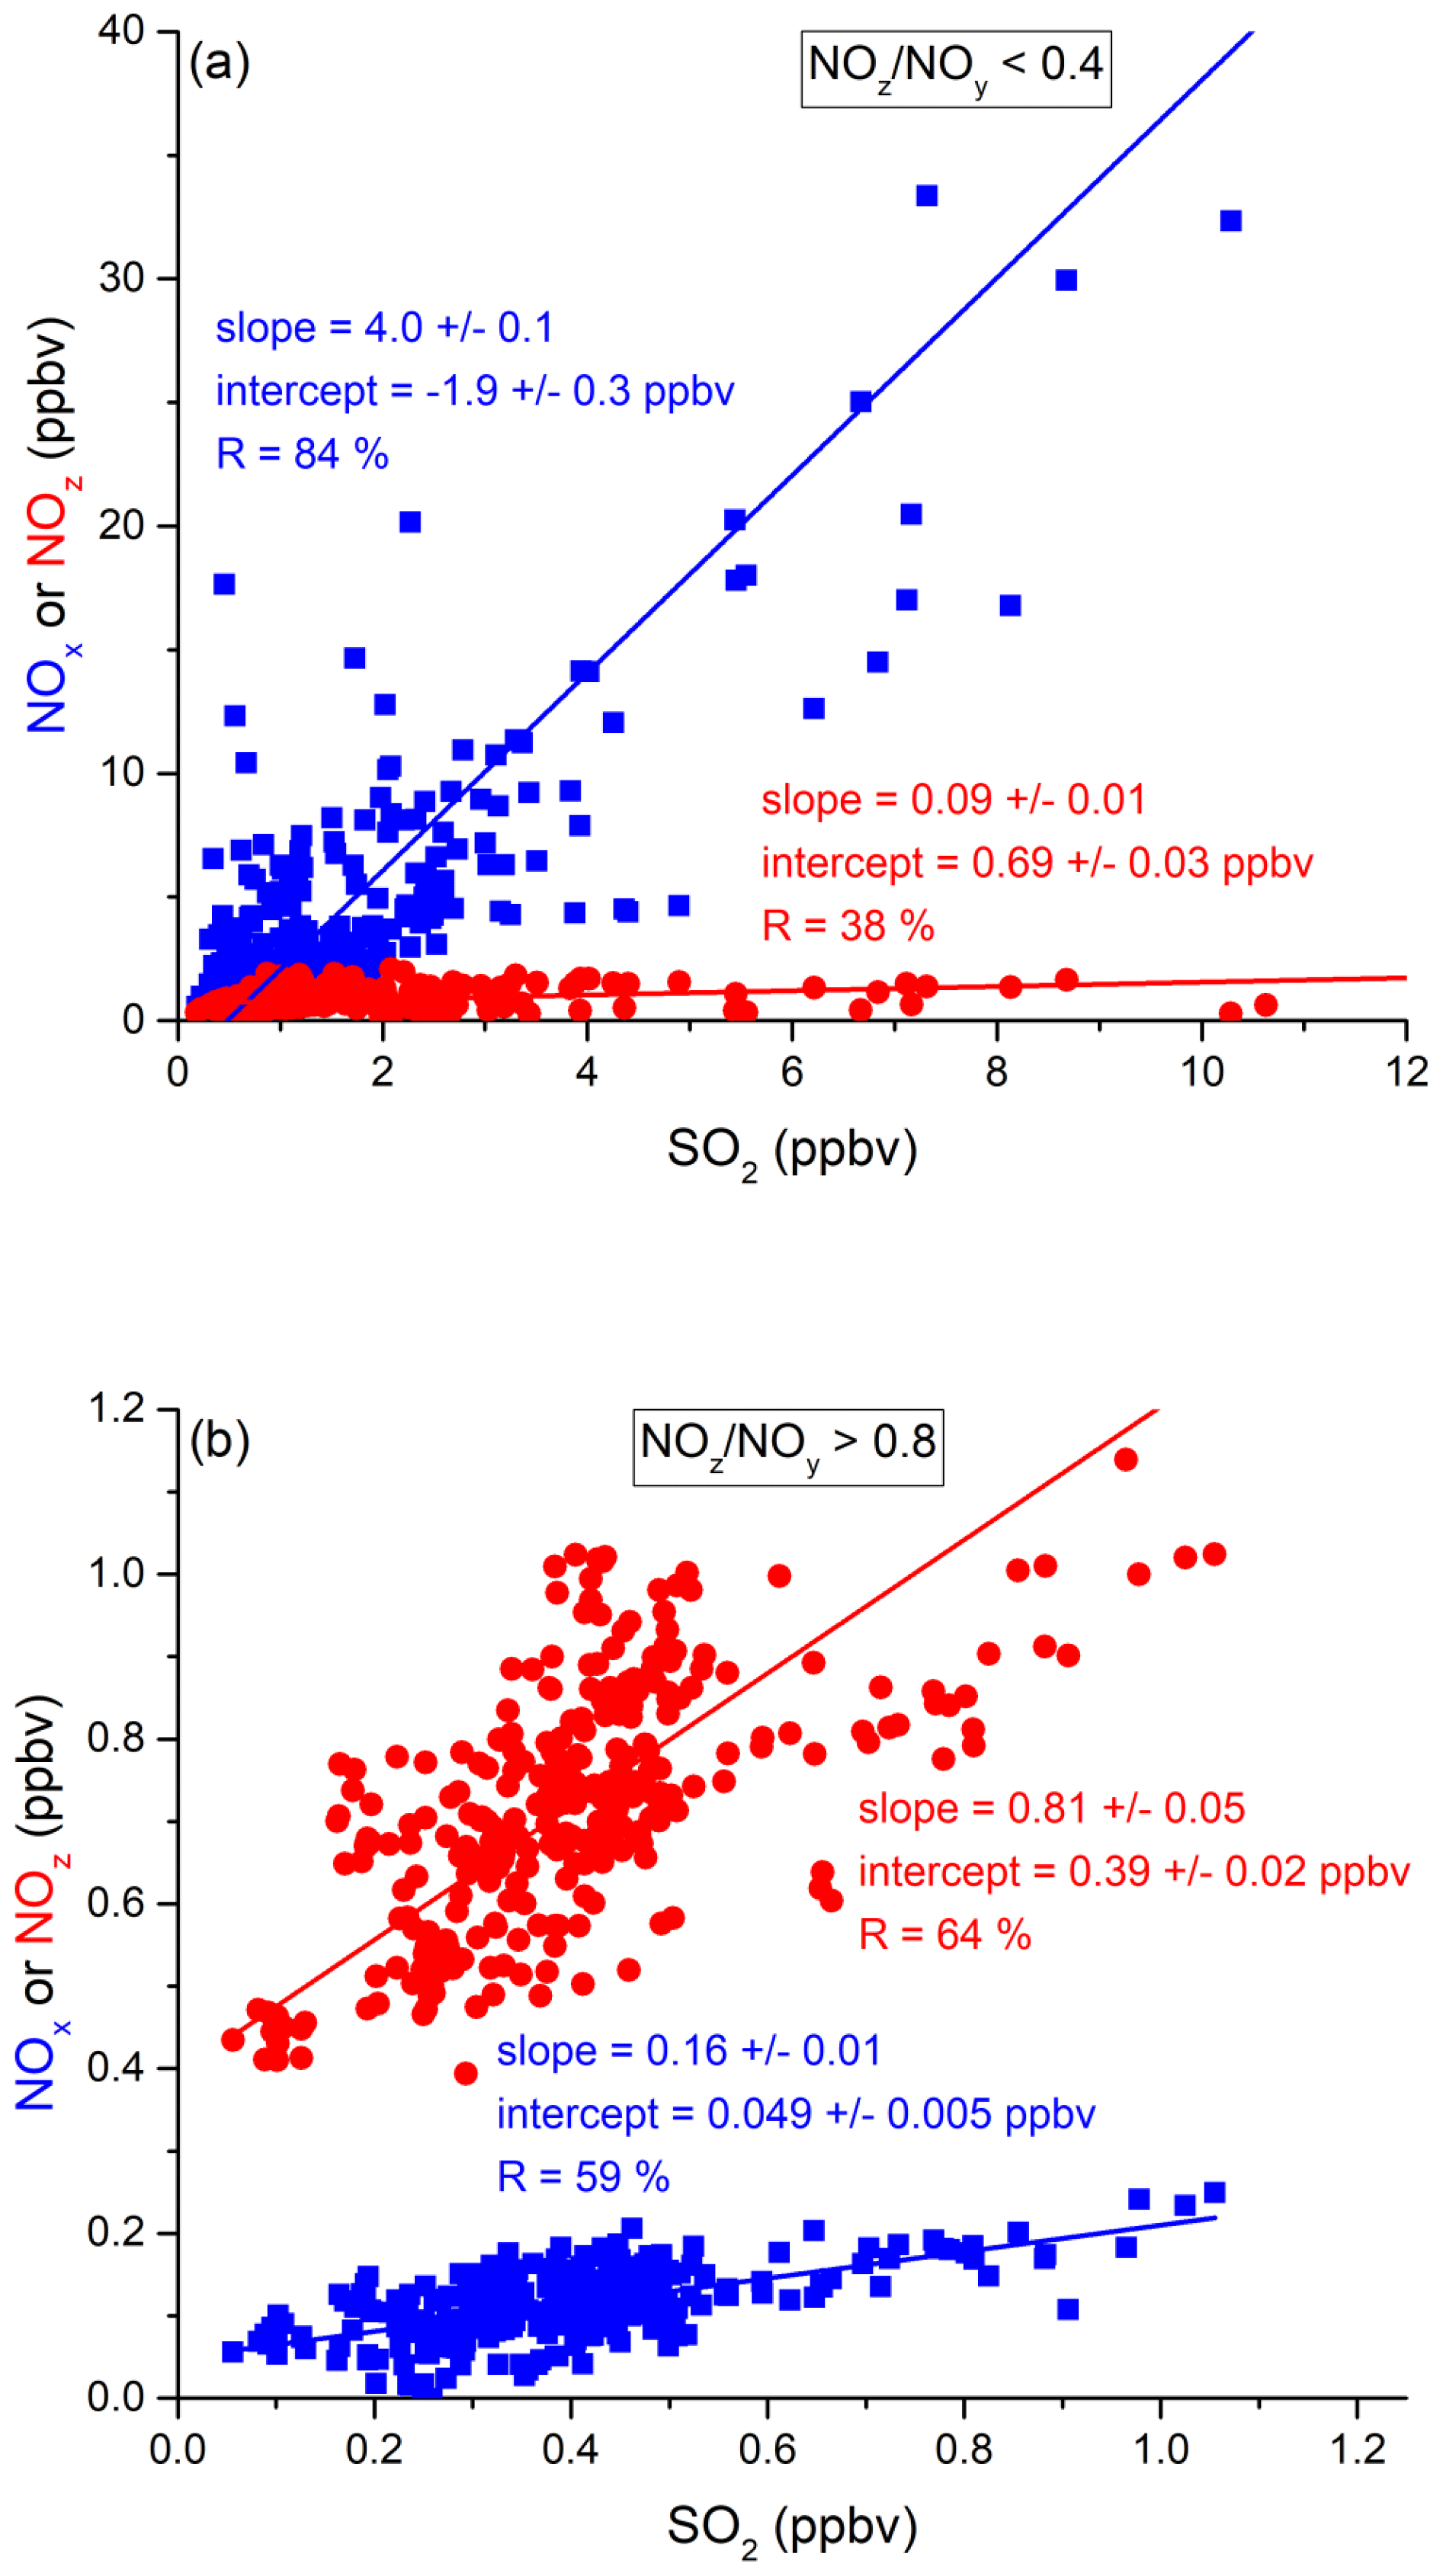
Figure 5Correlation between SO2 and NOx or NOz for (a) fresh and (b) aged NOx emissions in the Mediterranean Sea.
In more aged air masses (Fig. 5b) the slope of NOx per SO2 is, as expected, much smaller (0.16 ± 0.01 ppbv NO2 per ppbv SO2) which reflects the significantly longer lifetime of SO2 (∼ 10 d) compared to NOx. After a few days of transport an air mass containing co-emitted NOx and SO2 will still contain SO2 but the initially emitted NOx will, to a large extent, have been converted to NOz. The intercept (NOx= 0.049 ± 0.005 ppbv at zero SO2) is consistent with the re-generation of NOx from NOz (see above) but is also in the area of the detection limit of the NOx measurement.
The plot of NOz versus SO2 for aged emissions indicates a significant intercept (at zero SO2) of 0.4 ppbv NOz. As the lifetime of SO2 (∼ 10 d) is longer than of NOz (∼ half a day) (Dickerson et al., 1999; Romer et al., 2016), the residual NOz at zero SO2 cannot stem directly from ship emissions (or combustion sources that generate both NOx and SO2) but represents the background level of NOz in the Mediterranean Sea in aged air masses and is consistent with an average HNO3 mixing ratio of 0.48 ppbv observed during the MINOS campaign at Finokalia on Crete (Metzger et al., 2006).
The analysis above, when combined with back-trajectory information, provides clear evidence that shipping emissions are responsible for a large fraction of NOx in the Mediterranean Sea. The impact of shipping emissions on the atmospheric sulfur budget has been assessed in numerous studies which identify coastal areas and international shipping lanes as important hotspots for SO2 emissions (Capaldo et al., 1999; Dalsøren et al., 2009; Eyring et al., 2010), with emissions of SO2 severely impacting air quality in port regions (Isakson et al., 2001; Cooper, 2003; Saxe and Larsen, 2004; Marmer and Langmann, 2005; Ledoux et al., 2018). A detailed analysis of SO2 data with regard to ship emissions during AQABA is provided by Celik et al. (2020), who analysed emission factors from individual ship plumes during the AQABA campaign.
3.2 Red Sea
Measurements over the Red Sea (from the Suez Canal and the Strait of Bab al-Mandab) were made from 2–16 July 2017 on the first leg and 17–25 August 2017 on the second leg. On the first leg, the Kommandor Iona reversed direction in the northern Red Sea three times (twice for 9 h and once for 6 h), in order to sail into the wind and avoid contamination by the ship's own stack. Additionally, there was a 3 d layover in Jeddah (10 to 13 July 2017). Temperatures on the first leg were usually above 27 ∘C, with maxima of 37–38 ∘C in the Suez Canal, in Jeddah, and on the approach to Bab al-Mandab. The relative humidity was usually between ca. 60 % and 80 % but dropped below 30 % in the Suez Canal and in Jeddah. Winds came predominantly from northerly directions with speeds generally between 2 and 10 m s−1. On the second leg, temperatures were constantly above 30 ∘C in the southern Red Sea; relative humidities were similar to the first leg. The wind was consistently from the north, with wind speeds between 5 and 12 m s−1 until the ship reached the Suez region. During the first leg, the air masses intercepted above the northern Red Sea were impacted by emissions from Cairo and the Nile valley. Two-day back-trajectories for the southern Red Sea start in the centre of the Red Sea and do not indicate transport from the Suez region. Extended back-trajectories for the southern Red Sea showed that 3 to 4 d prior to sampling, the air parcel passed over southern Egypt, and 5 to 6 d before it was located over the Cairo area. Similar back-trajectories were obtained for the second leg. Air masses in the northern Red Sea were influenced by the Suez region, north-eastern Egypt, and Israel.
3.2.1 NOx
NOx mixing ratios in the Red Sea (excluding the 3 d layover in the port of Jeddah) as measured by the TD-CRDS and the CLD instruments are displayed in Fig. 6a. NOx mixing ratios were highly variable and there were only short periods free of NOx plumes > 10 ppbv (e.g. during the second leg on 19 and 20 August 2017). The mean NOx mixing ratios (2.8 ppbv measured by the TD-CRDS and 3.2 ppbv measured by the CLD) were therefore significantly higher than the median values of 1.0 ppbv. Figure 6b indicates that the NOx mixing ratios are broadly distributed around the median of 1.0 ppbv with 21 % of all data points > 3 ppbv. The highest NOx levels during AQABA were found in narrow shipping corridors of the Suez region and the Strait of Bab al-Mandab. When excluding the Suez and Bab al-Mandab regions, a median NOx mixing ratio of 0.7 ppbv can be derived for the maritime central part of the Red Sea.
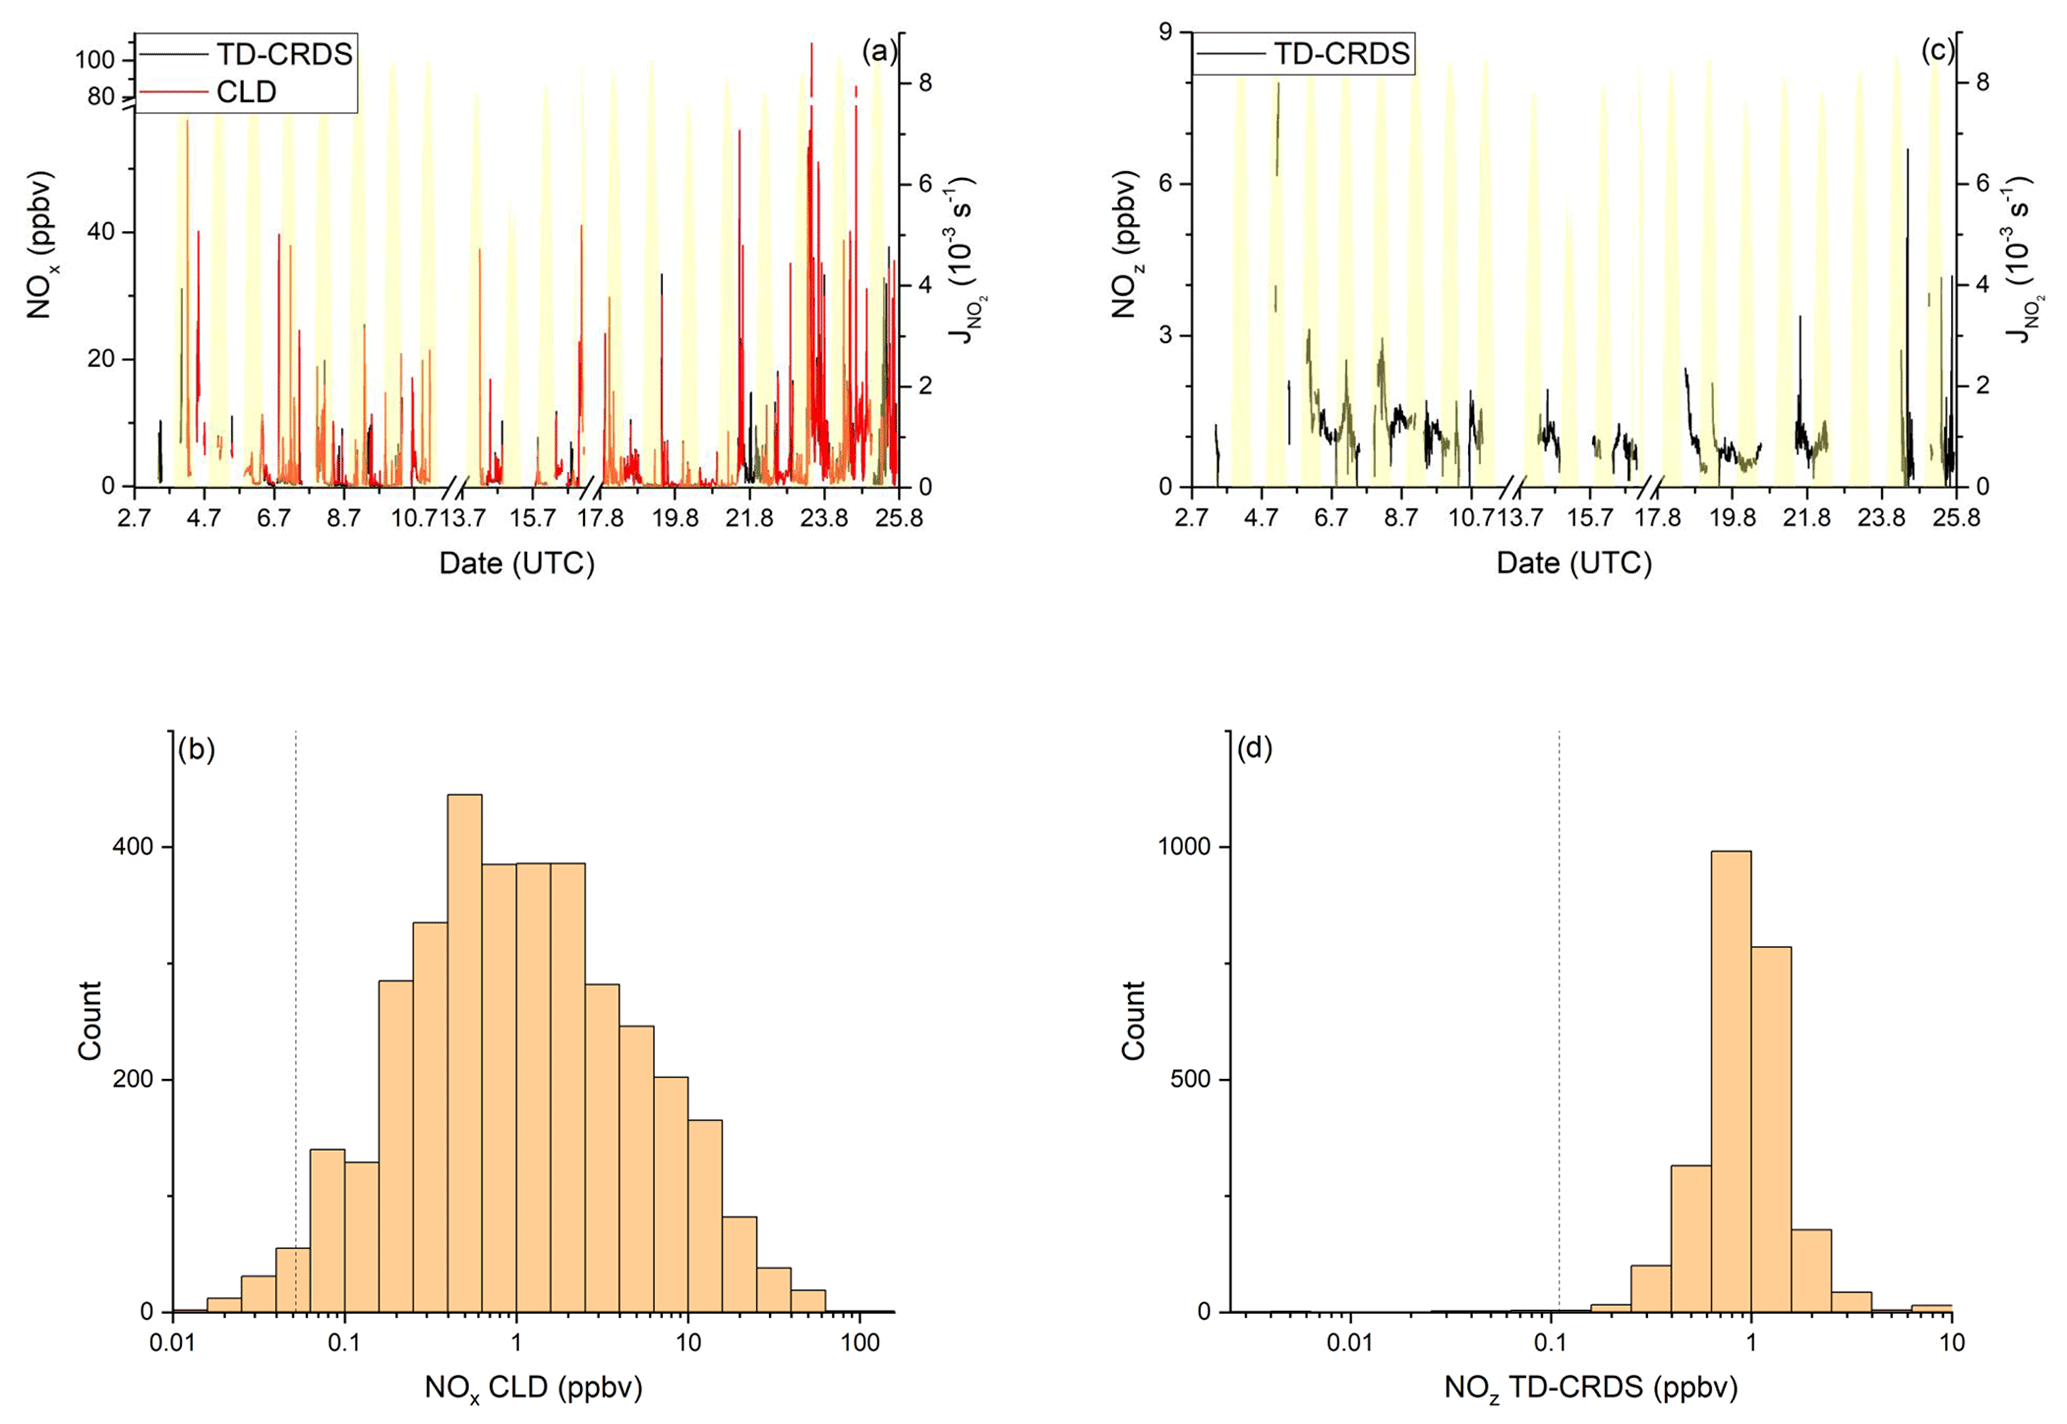
Figure 6NOy measurements in the Red Sea. Dashed lines signify the instrument detection limits. (a) NOx mixing ratios by CLD and TD-CRDS. (b) Frequency distribution of NOx mixing ratios during 2–16 July 2017 and 17–24 August 2017, excluding the layover in Jeddah. (c) NOz mixing ratios by TD-CRDS. (d) Frequency of NOz mixing ratios during 2–16 July 2017 and 17–24 August 2017. The yellow shaded regions show . The vertical dotted lines are the limits of detection of the respective measurements.
To the best of our knowledge, in situ measurements in the Red Sea area are not available for comparison with our NOx data. Satellite-based modelling studies show that high NO2 column densities above the Red Sea are associated with shipping emissions (Richter et al., 2004; Alahmadi et al., 2019), which is consistent with our observation of a strong correlation between NOx and SO2 (see below). Johansson et al. (2017) have estimated a NOx emission rate of 0.70 t km−2 yr−1for the Red Sea (including the Suez region).
3.2.2 NOz
The mean mixing ratio of NOz over the Red Sea was 1.0 ppbv, with a maximum value of 8.0 ppbv measured in the Gulf of Suez on the first leg. NOz mixing ratios are narrowly distributed (see Fig. 6d) around a median value of 0.7 ppbv, with 53 % of the measurements between 0.4 and 1.0 ppbv and 41 % between 1.0 and 4.0 ppbv.
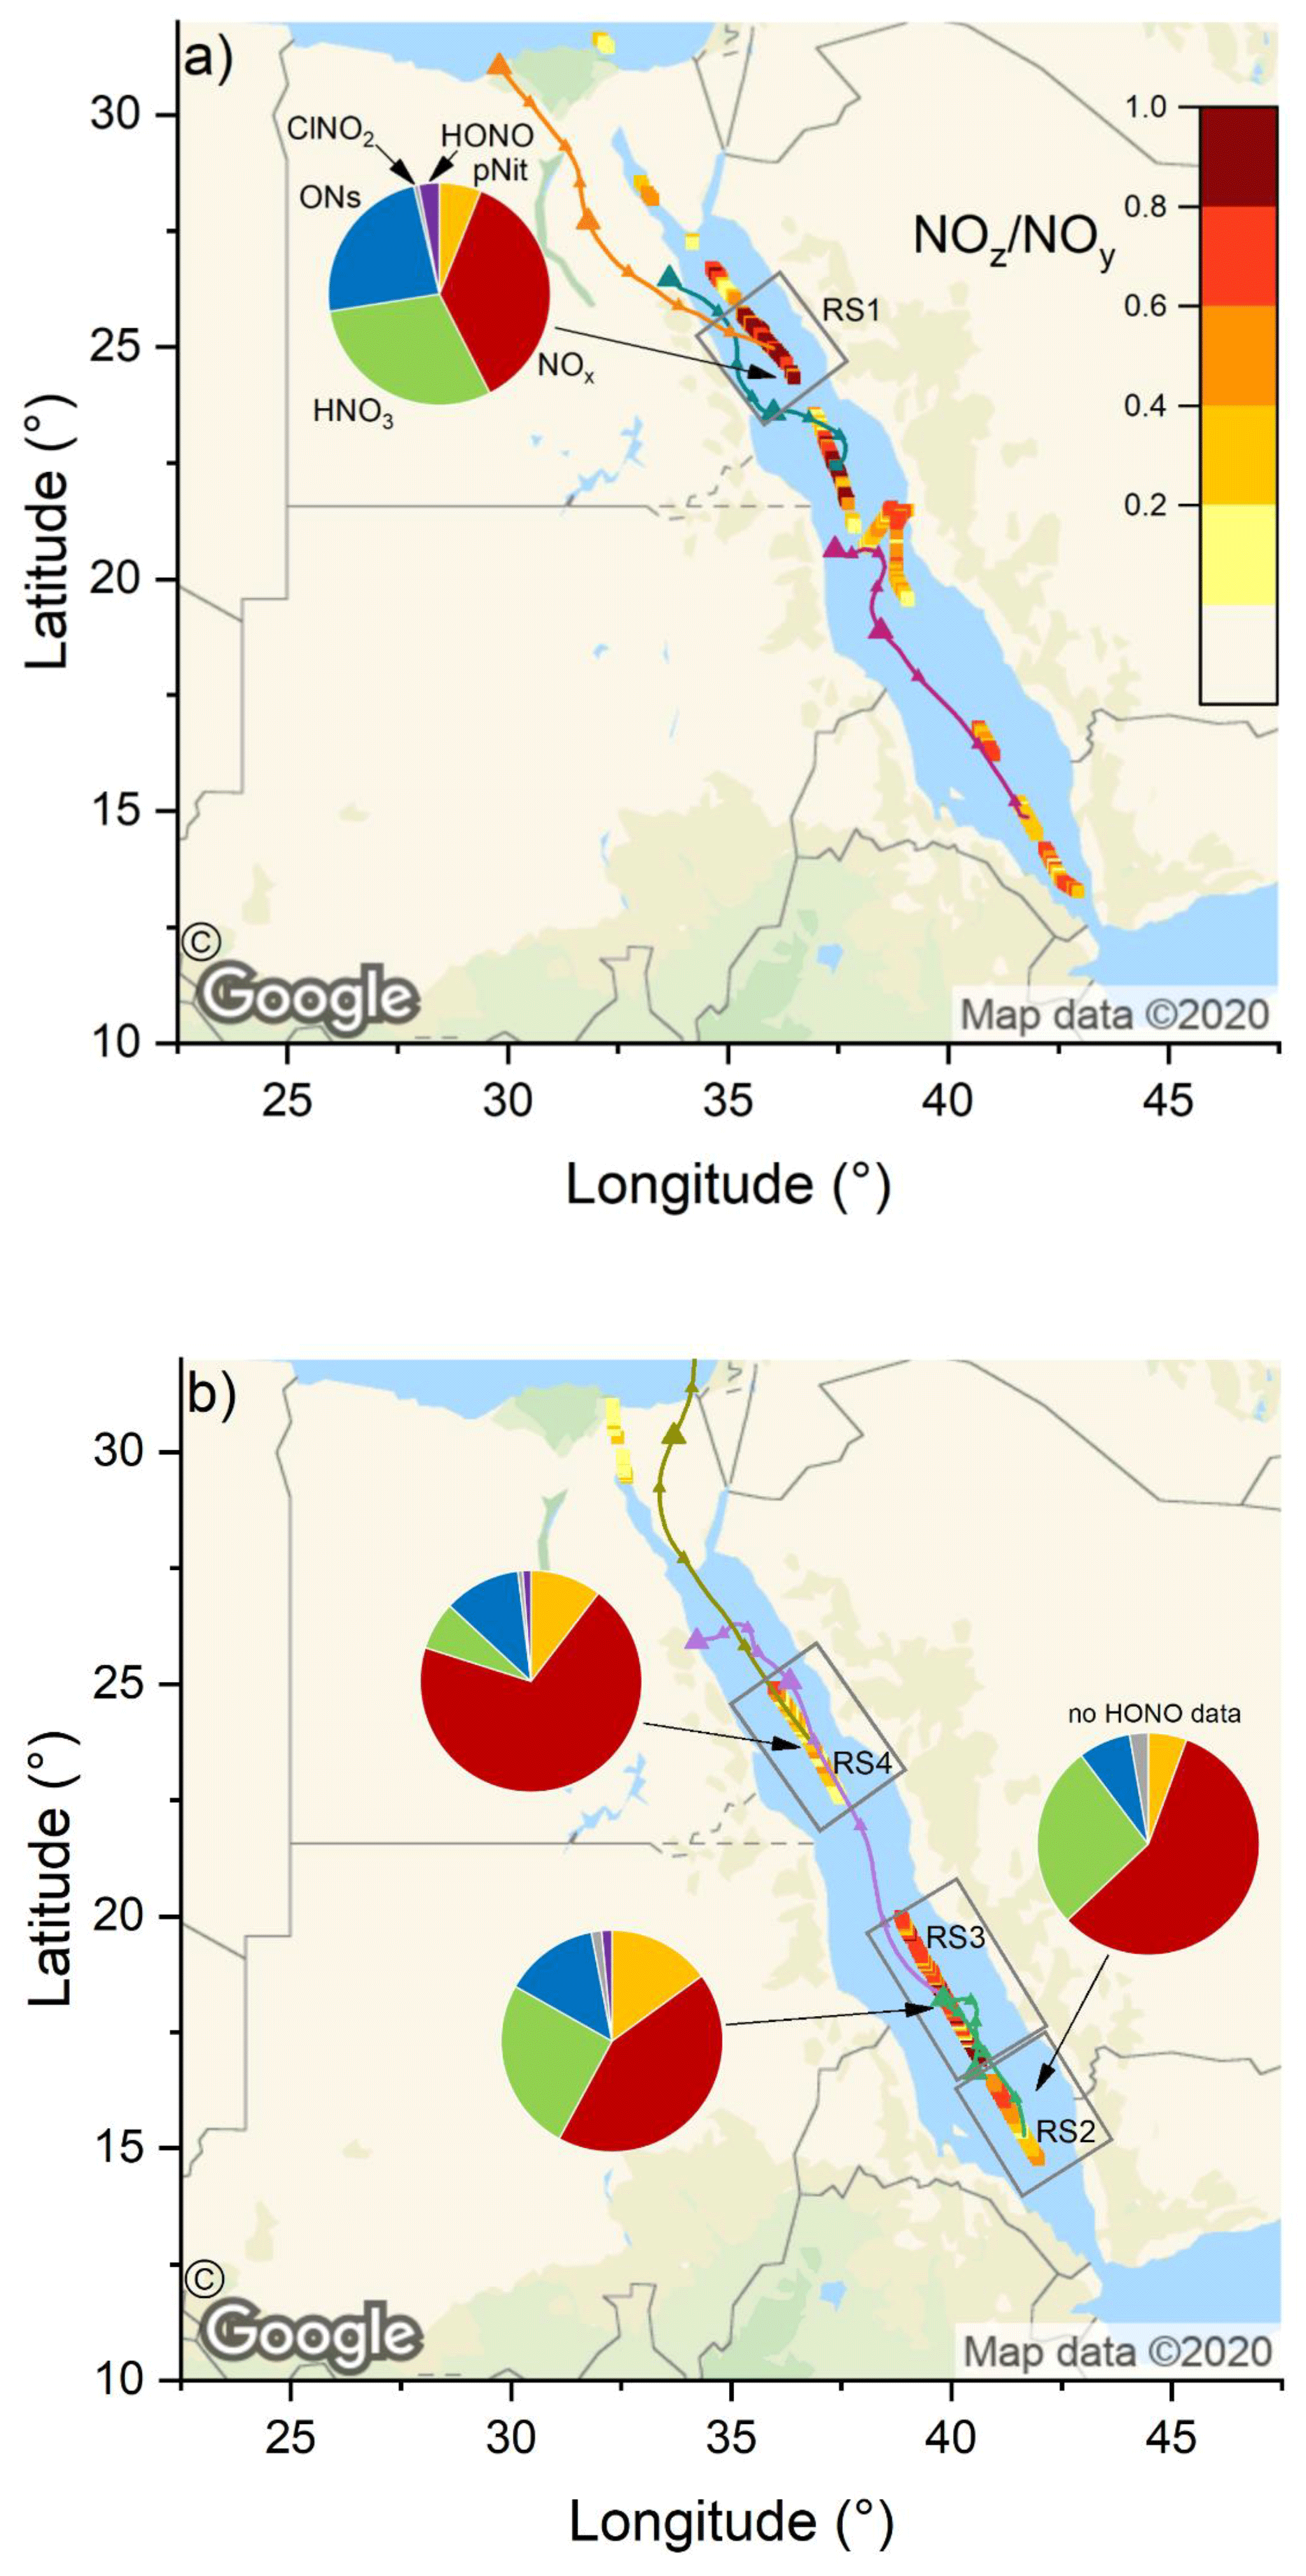
Figure 7The NOz NOy ratio over the Red Sea during the (a) first and (b) second leg. Coloured lines are 2 d back-trajectories (HYSPLIT). The pie charts indicate the components of NOy at various segments along the ship's track (ONs = organic nitrates, pNit = particulate nitrate). HNO3 was calculated via HNO3= NOz – (ONs + pNit + ClNO2+ HONO). The colours of the pie chart segments are assigned as follows (clockwise): pNit in yellow, NOx in red, HNO3 in green, ONs in blue, ClNO2 in grey, and HONO in magenta (© Google Maps).
The NOz NOy ratios along the ship's track are plotted in Fig. 7: values > 0.6 were mostly observed over the northern Red Sea on the first leg, after leaving the Gulf of Suez. On the second leg, the NOz NOy ratio was higher in the southern Red Sea. NOz data coverage was limited in the Red Sea on both legs and the NOz NOy ratio was more variable than values found in the Mediterranean Sea and the Arabian Gulf. The high variability in the NOz NOy ratios is caused by the route of the Kommandor Iona along the main shipping lane connecting the Suez Canal and the Gulf of Aden and the frequent sampling of plumes from nearby ships. The observed NOz NOy ratios of < 0.6 in the Red Sea highlight the impact of NOx emissions from shipping on the reactive nitrogen budget and the air quality in the Red Sea region (as discussed in Sect. 3.2.1).
For the Red Sea, we have defined four subregions in which we calculate the contributions of NOx and various NOz species to NOy: these are RS1 on the first leg and RS2, RS3, and RS4 on the second leg. Note that RS1 and RS4 are both located in the northern Red Sea, but the measurements (∼ 5 weeks apart) revealed different chemical characteristics; hence the separate treatment.
Due to poor data coverage, mainly of organic nitrates, we were not able to perform this calculation in further subregions on the first leg. In all four regions, NOx was the largest component of NOy which results from continuous NOx input from onshore and shipping emissions.
In RS1 we observed the lowest contribution (36.4 %) of NOx to NOy and the largest contribution of ONs (23.8 %) to NOy, over the Red Sea. The latter value is the highest found during the entire AQABA campaign and is comparable to the contribution of HNO3 (30.0 %). In roughly co-located RS4, but 5 weeks later, the NOx contribution was much larger (69.5 %). The divergent median NOx NOy and NOz NOy for subregions RS1 and RS4 can be understood when one examines the air mass back-trajectories for the two legs. On the second leg, strong northerly winds transported NOx from the highly polluted southern end of the Gulf of Suez to RS4, whereas during the first leg the back-trajectory for RS1 passed (with lower wind speeds) mainly over eastern Egyptian deserts, with emissions from Cairo requiring 36 h to reach RS1 during which a significant fraction of NOx was converted to NOz. We expect that the large contribution of ONs in RS1 is a result of the unique chemical environment at the southern end of the Gulf of Suez and in the northern Red Sea. A large coherent oil field is located south of the Gulf of Suez and the coast of eastern Egypt (Alsharhan, 2003), and the numerous facilities for oil extraction result in abundant emissions of VOCs, while the proximity to the Gulf of Suez and the narrowing shipping corridor on the approach to Suez provides the NOx required for formation of organic nitrates (ONs). Meteorological conditions additionally favoured a build-up of ONs during our passage through RS1: elevated wind speeds of up to 11 m s−1 coincided with temperatures below 30 ∘C, which slowed down the thermal decomposition of PAN (peroxyacetyl nitrate) compared to the ca. 35 ∘C regime in the Arabian Gulf. Average PAN mixing ratios, as measured by chemical ionisation mass spectroscopy (CIMS), were 190 pptv in this area, which constitutes ca. 20 % of the total ONs signal. On the second leg in RS4, the fractional contribution of ONs was overshadowed by the stronger impact of NOx pollution from the Suez region (see above).
In RS1 and RS4 the contributions of HONO and ClNO2 to NOy were minor (≤ 3 %). RS2 and RS3 are both located in the southern half of the Red Sea. For RS3 we observed the highest contribution (15 %) of AMS-measured particulate nitrate to NOy, and RS3 was characterised in large parts by coarse-mode OPC fractions > 85 % (i.e. (PM10-PM1) PM10; see 18 and 19 August 2017 in Fig. S1). It is reasonable to assume that the coarse-mode particle mass concentrations in this area was due to sea salt, which reacts heterogeneously with HNO3 to form particle-phase nitrates (Mamane and Gottlieb, 1990). Refractory sea salt aerosol particles in the PM1 size range are, however, not expected to be detectable via AMS (Jimenez et al., 2003) or with only very low efficiency (ca. 1 %) (Zorn et al., 2008).
Region RS2 shows a intermediate behaviour, as NOz NOy increases after leaving Bab al-Mandab and transported air only came from the surrounding southern Red Sea without being influenced by shore-side anthropogenic activities. Here, NOx and HNO3 contribute 57 % and 27 %, respectively. The relatively high NOx contribution, considering the remote area, can be explained by sampling ship plumes on the departure from Bab el-Mandab, which led to several NOx peaks above 10 ppbv (see Fig. 6a). Consequently, background NOx levels also did not fall below ca. 1.5 ppbv on the night from 17 to 18 August 2017. Overall, the fractional contributions of NOx were positively biased by short-term spikes in NOx mixing ratios caused by ship plumes in all Red Sea subregions. The use of mean values to assess the fractional contributions of NOy species in certain subregions is thus a caveat of this analysis, as NOz signals exhibit less variability during pollution events (see Fig. 6c). Employing the median values, however, would not allow the relative contributions to NOy to be assessed.
3.2.3 Lifetime and sources of NOx
Analogous to Sect. 3.1.3, we now investigate the day- and night-time chemical losses of NO2 in the Red Sea (see Fig. 8). As described previously, we used an interpolated OH data set based on a scaling factor between the available OH data and .
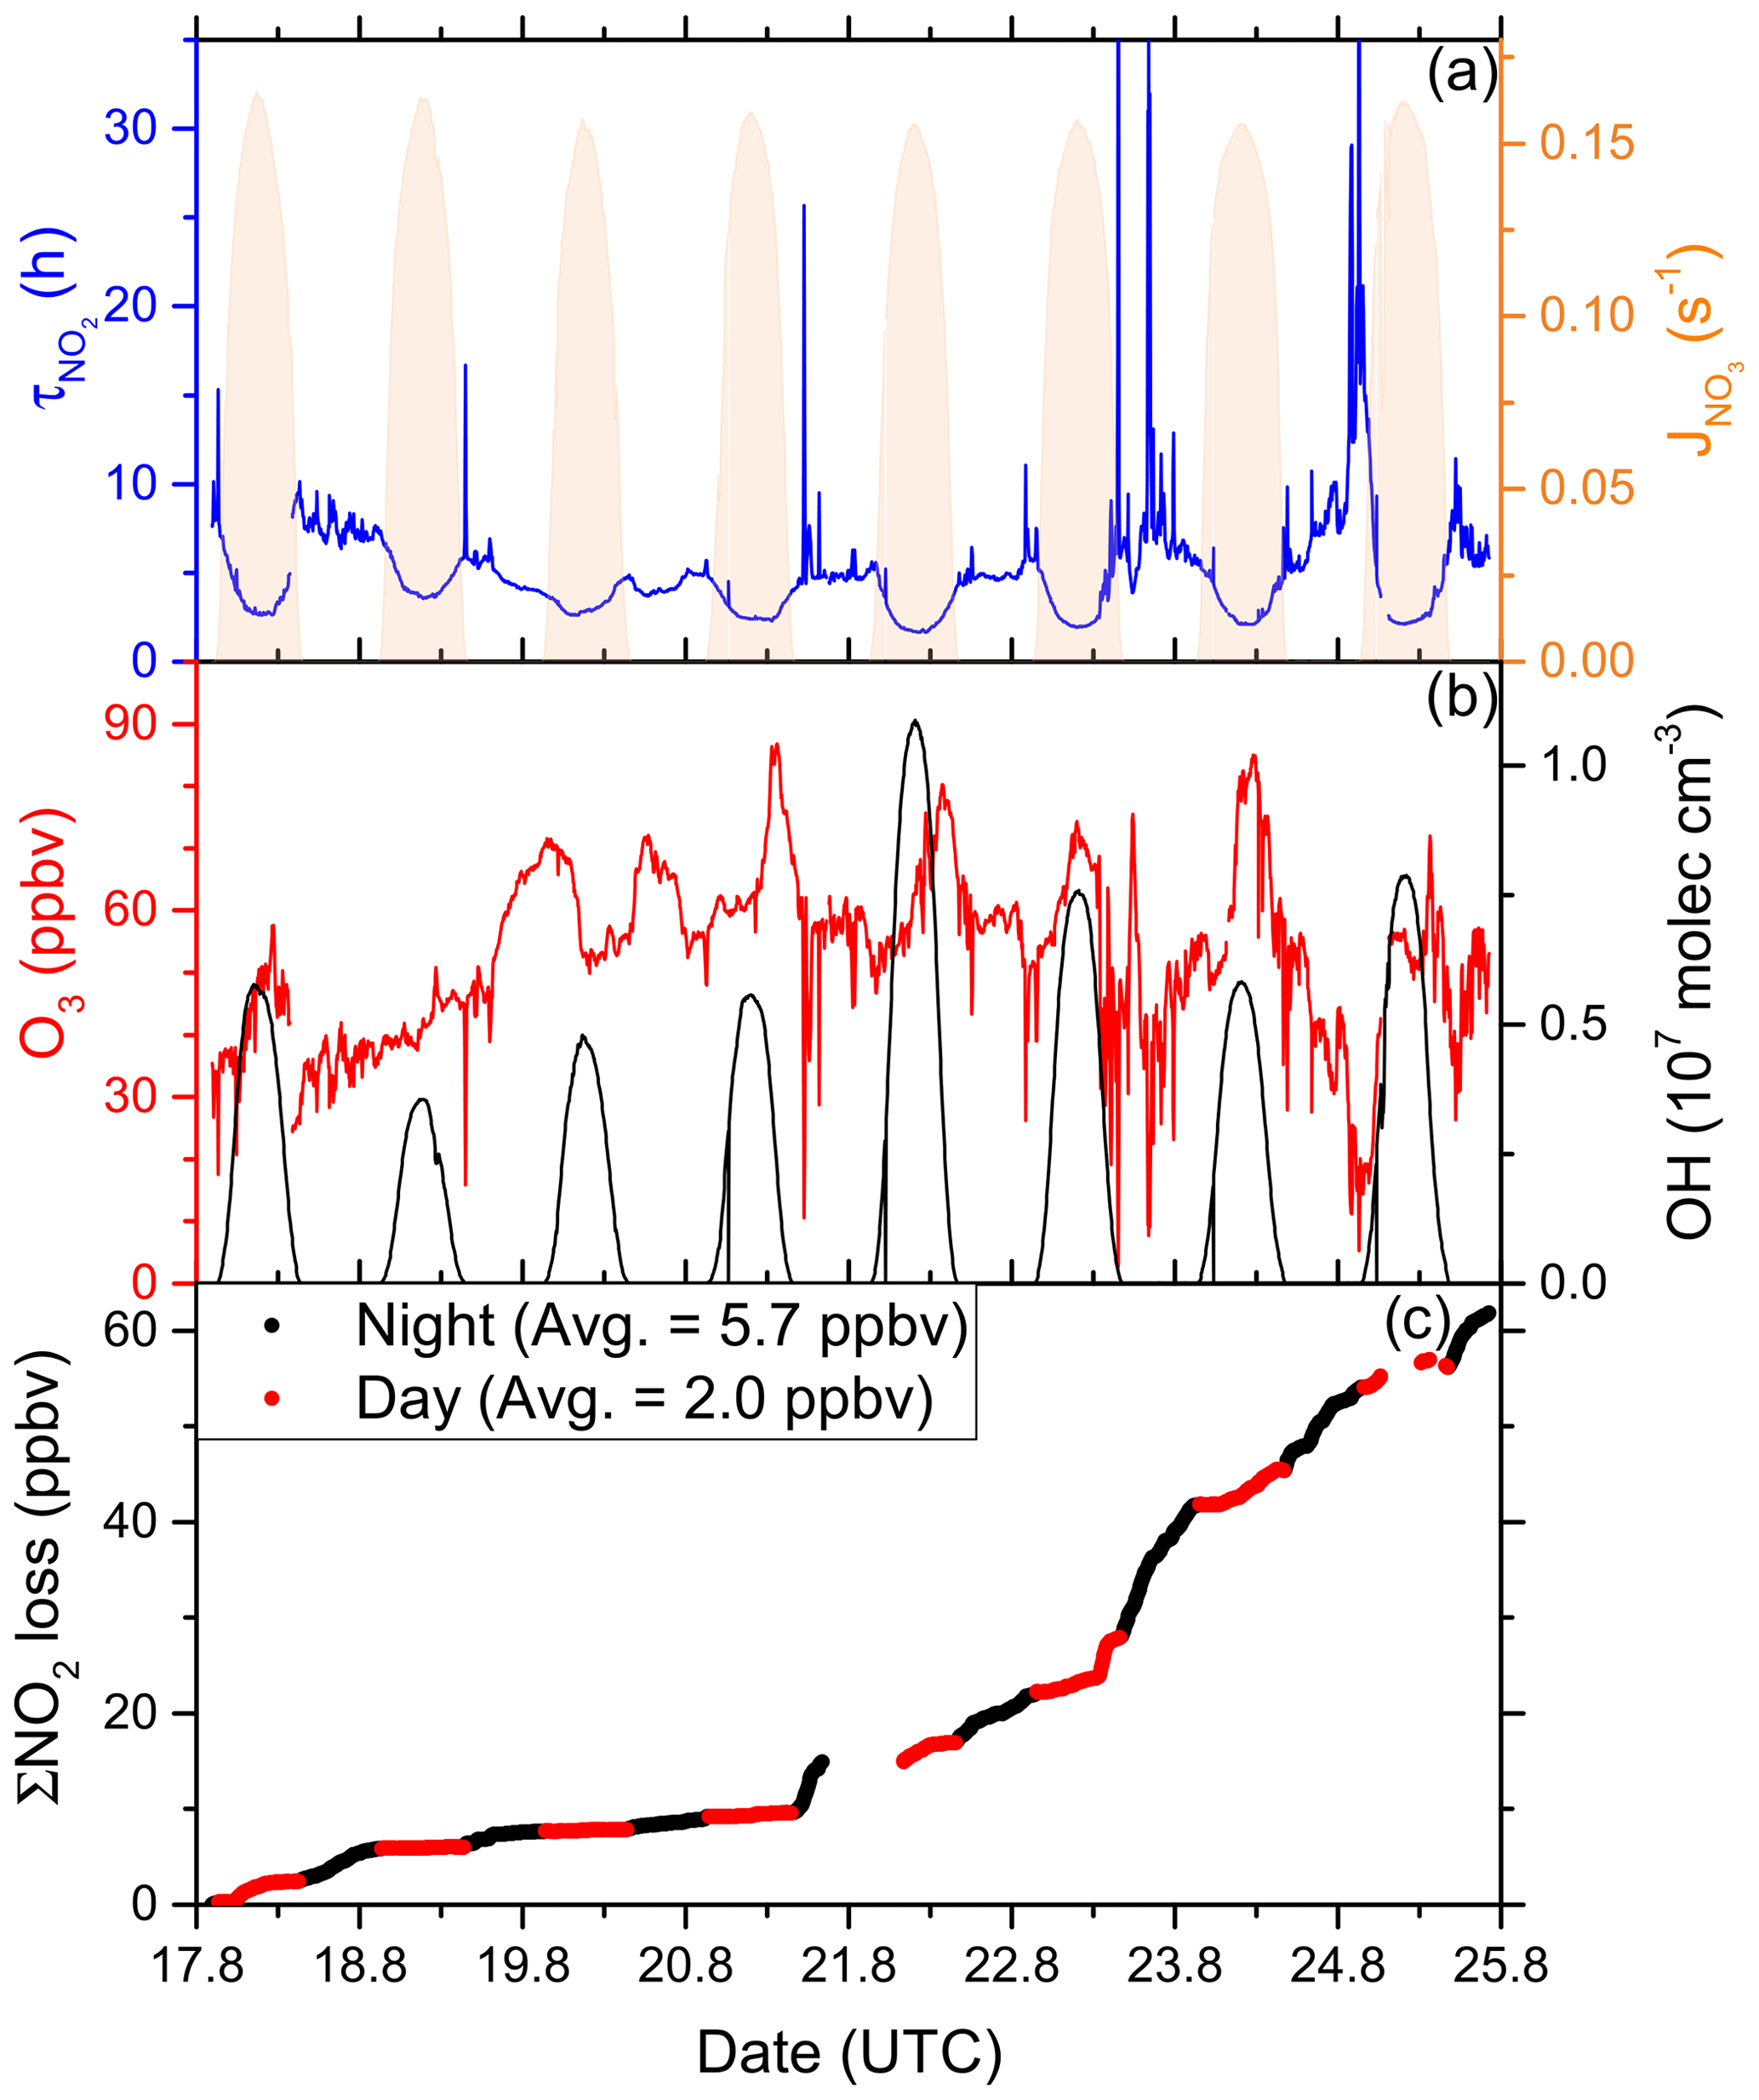
Figure 8(a) Lifetime (τ) of NO2 due to reactions with OH and O3 along the second Red Sea leg, together with concentrations of O3 and OH. The OH trace is an interpolation based on OH measurements and (see Sect. 3.2.3). Daytime hours are indicated via . (b) Cumulative loss of NO2 during the displayed time frame, based on the calculated lifetimes and measured NO2.
As OH was not measured over the Red Sea on the first leg, our analysis is restricted to the second leg only. Daytime NO2 lifetimes with respect to loss by reaction with OH were usually in a range between 2 and 4 h, with a minimum of 1.7 h on 21 August 2017, where the noon-time OH concentration peaked at 1.1 × 10⁷ molec. cm−3. Night-time NO2 lifetimes (determined by O3 levels) exhibited a larger variability but were mostly between 5 and 10 h. The average (day and night) NO2 lifetime in the Red Sea was 5.0 h.
Over the entire period of measurements in the Red Sea (8 d and 8 nights) we calculate that a cumulative total of 62 ppbv of NO2 were lost (Fig. 8c). Despite the shorter lifetime of NO2 at noon, the greater integrated loss of NO2 occurred during night-time (5.7 ppbv per night on average) when continually high O3 levels (median 54 ppbv) were available. At midday, NO2 mixing ratios are reduced due to the shift in the NO2 NO ratio caused by the rapid photolysis of NO2 and also because the OH levels are highest then. On average, daytime loss rates were 2.0 ppbv per day.
In order to assess the contribution of shipping on NOx emissions, we correlated NOx and SO2 mixing ratios for freshly emitted (NOz NOy < 0.4) and chemically more aged (NOz NOy > 0.8) air masses. The results are illustrated in Fig. 9 and summarised in Table 2, which reveal a positive correlation (slope of 3.7 ± 0.1 and a regression coefficient R of 0.61) between NOx and SO2 in air masses containing freshly emitted pollutants. Six data points far above 20 ppbv (range 43–128 ppbv SO2) were excluded, as they would bias the linear regression result. Including these data points lowers the slope to 1.26 ± 0.04 and the correlation coefficient R to 0.40. The NOx SO2 ratio is thus highly variable throughout the Red Sea, potentially reflecting variable NOx SO2 emission ratios of different vessels, using various fuels, as well as the impact (on NOx) of offshore oil-drilling rigs and shore-side oil refineries. The latter are most important in the northern Red Sea, whereas shipping emissions dominate in the narrow shipping lanes of the Suez Canal.
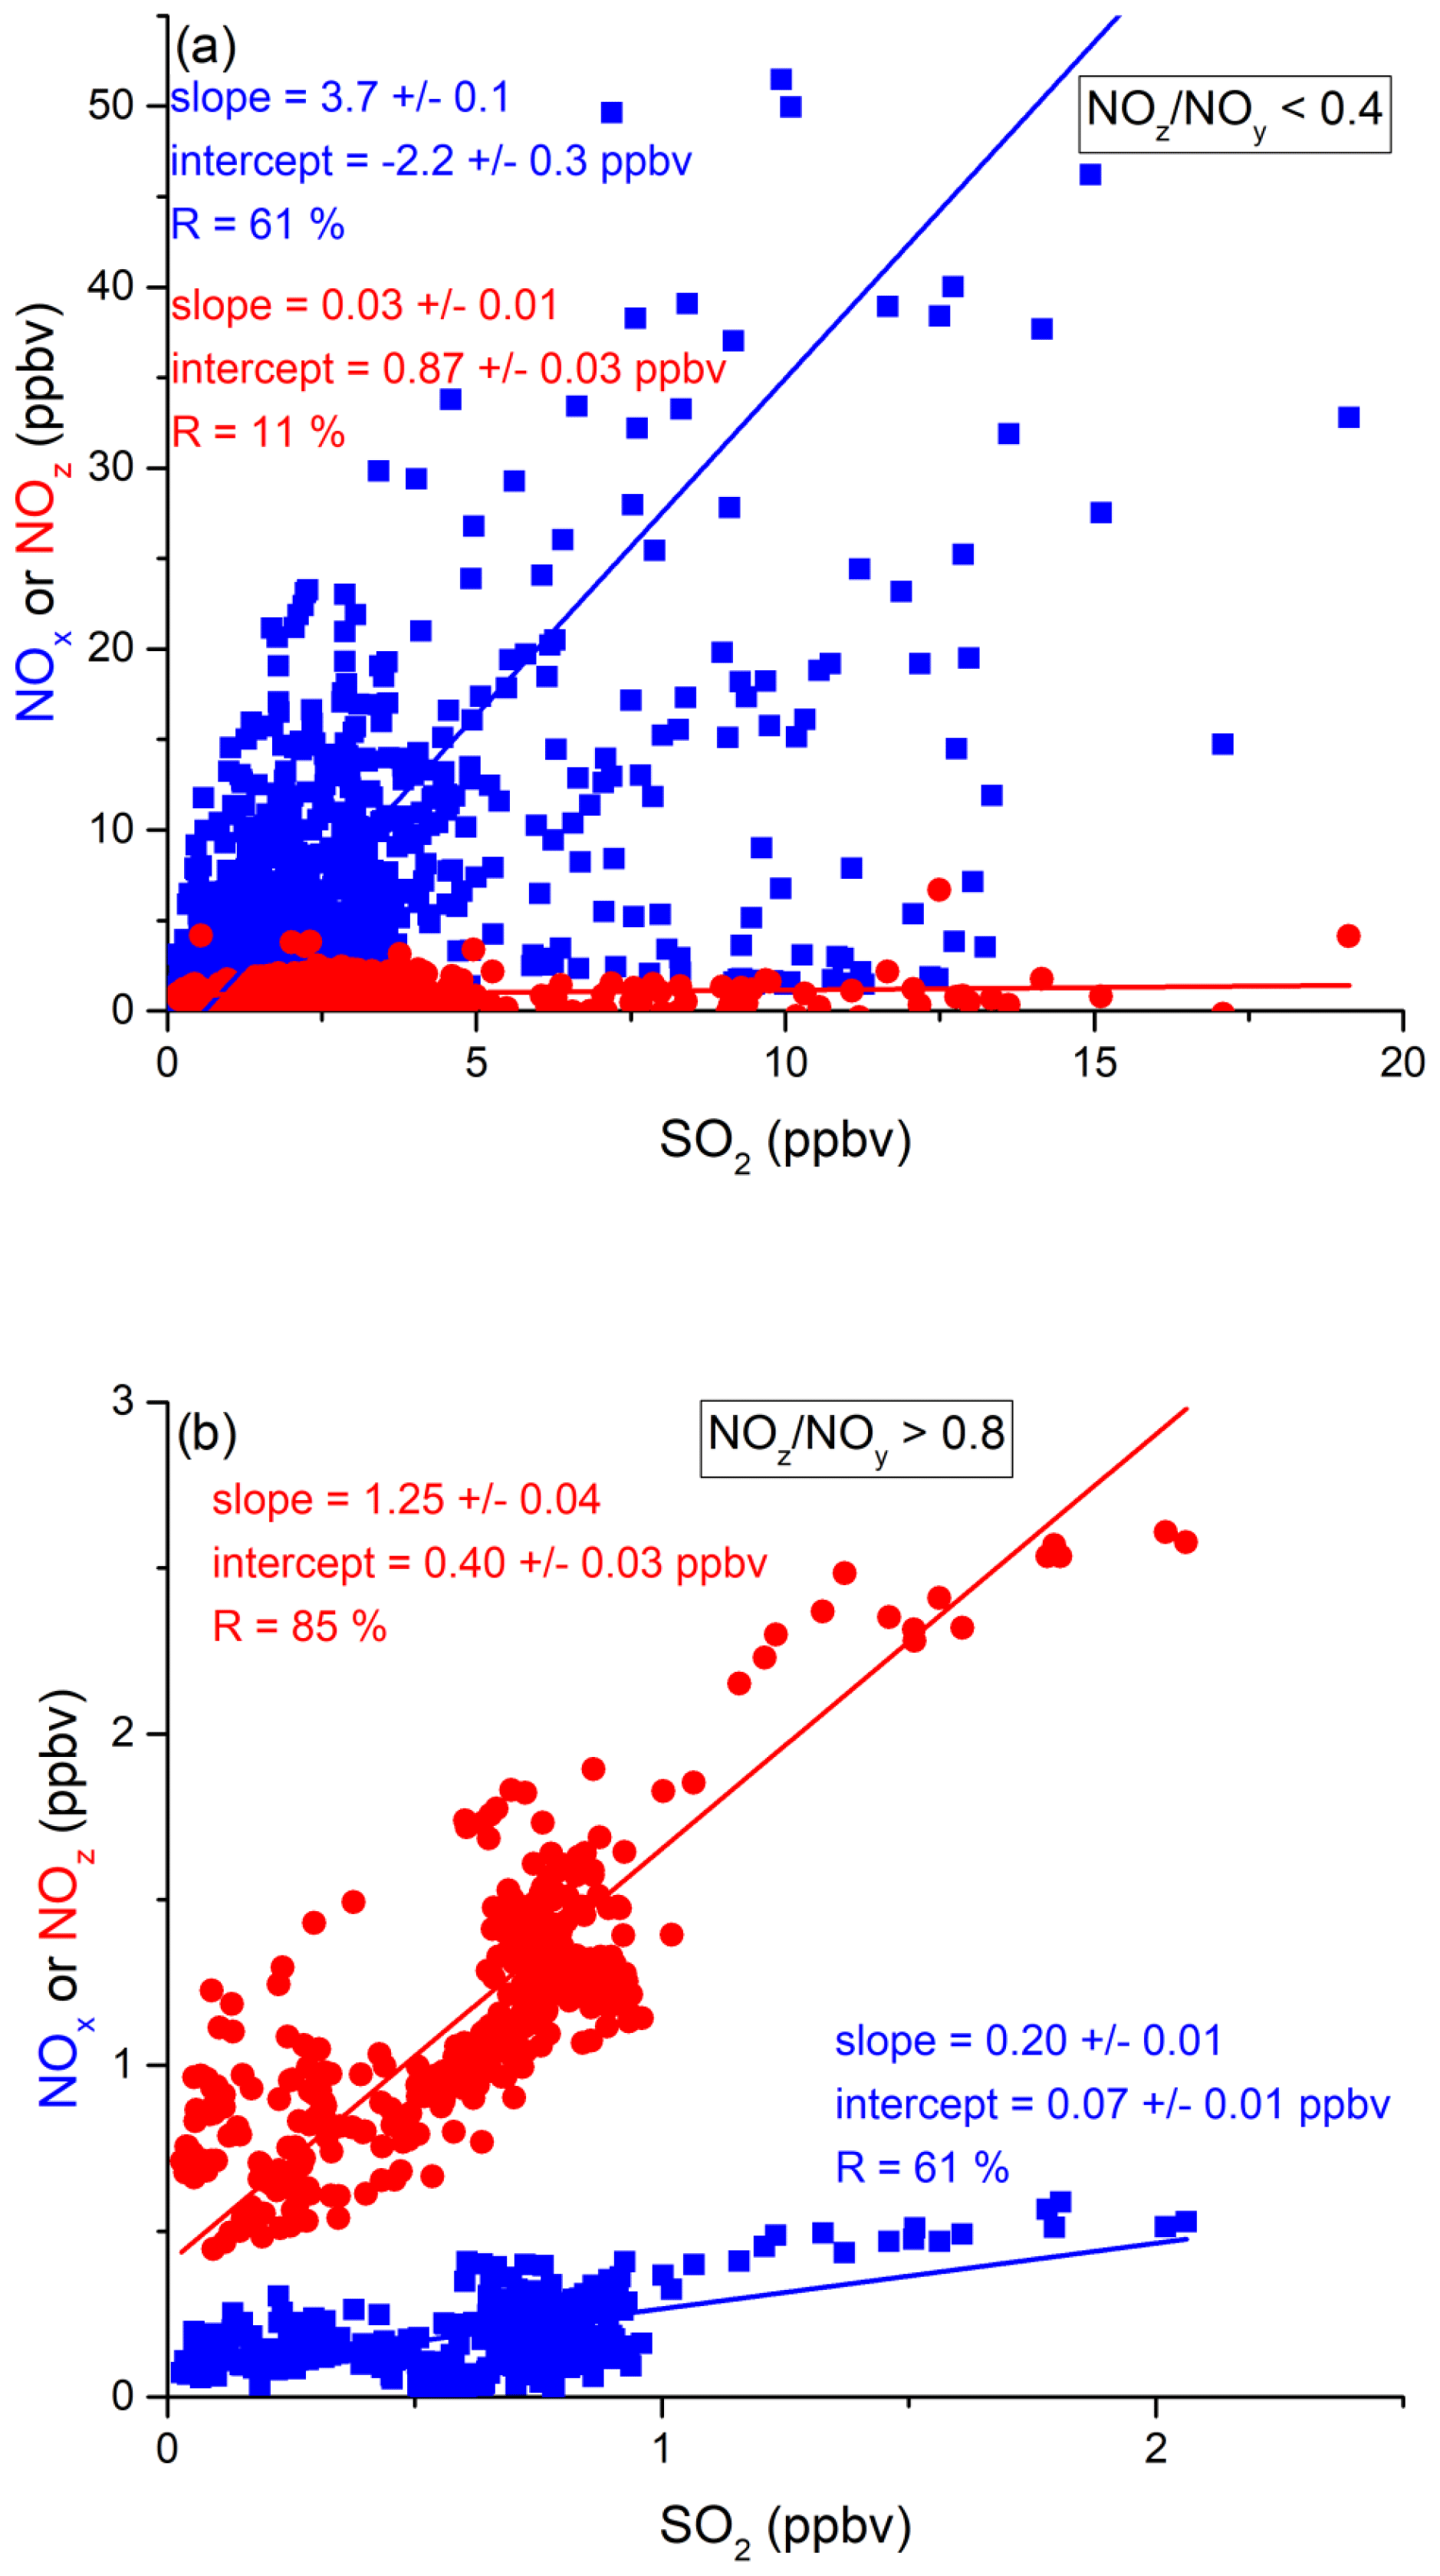
Figure 9Correlation between SO2 and NOx or NOz for (a) fresh and (b) aged NOx emissions in the Red Sea.
Table 2Summary of correlation results between NOx NOz and SO2 in all regions.
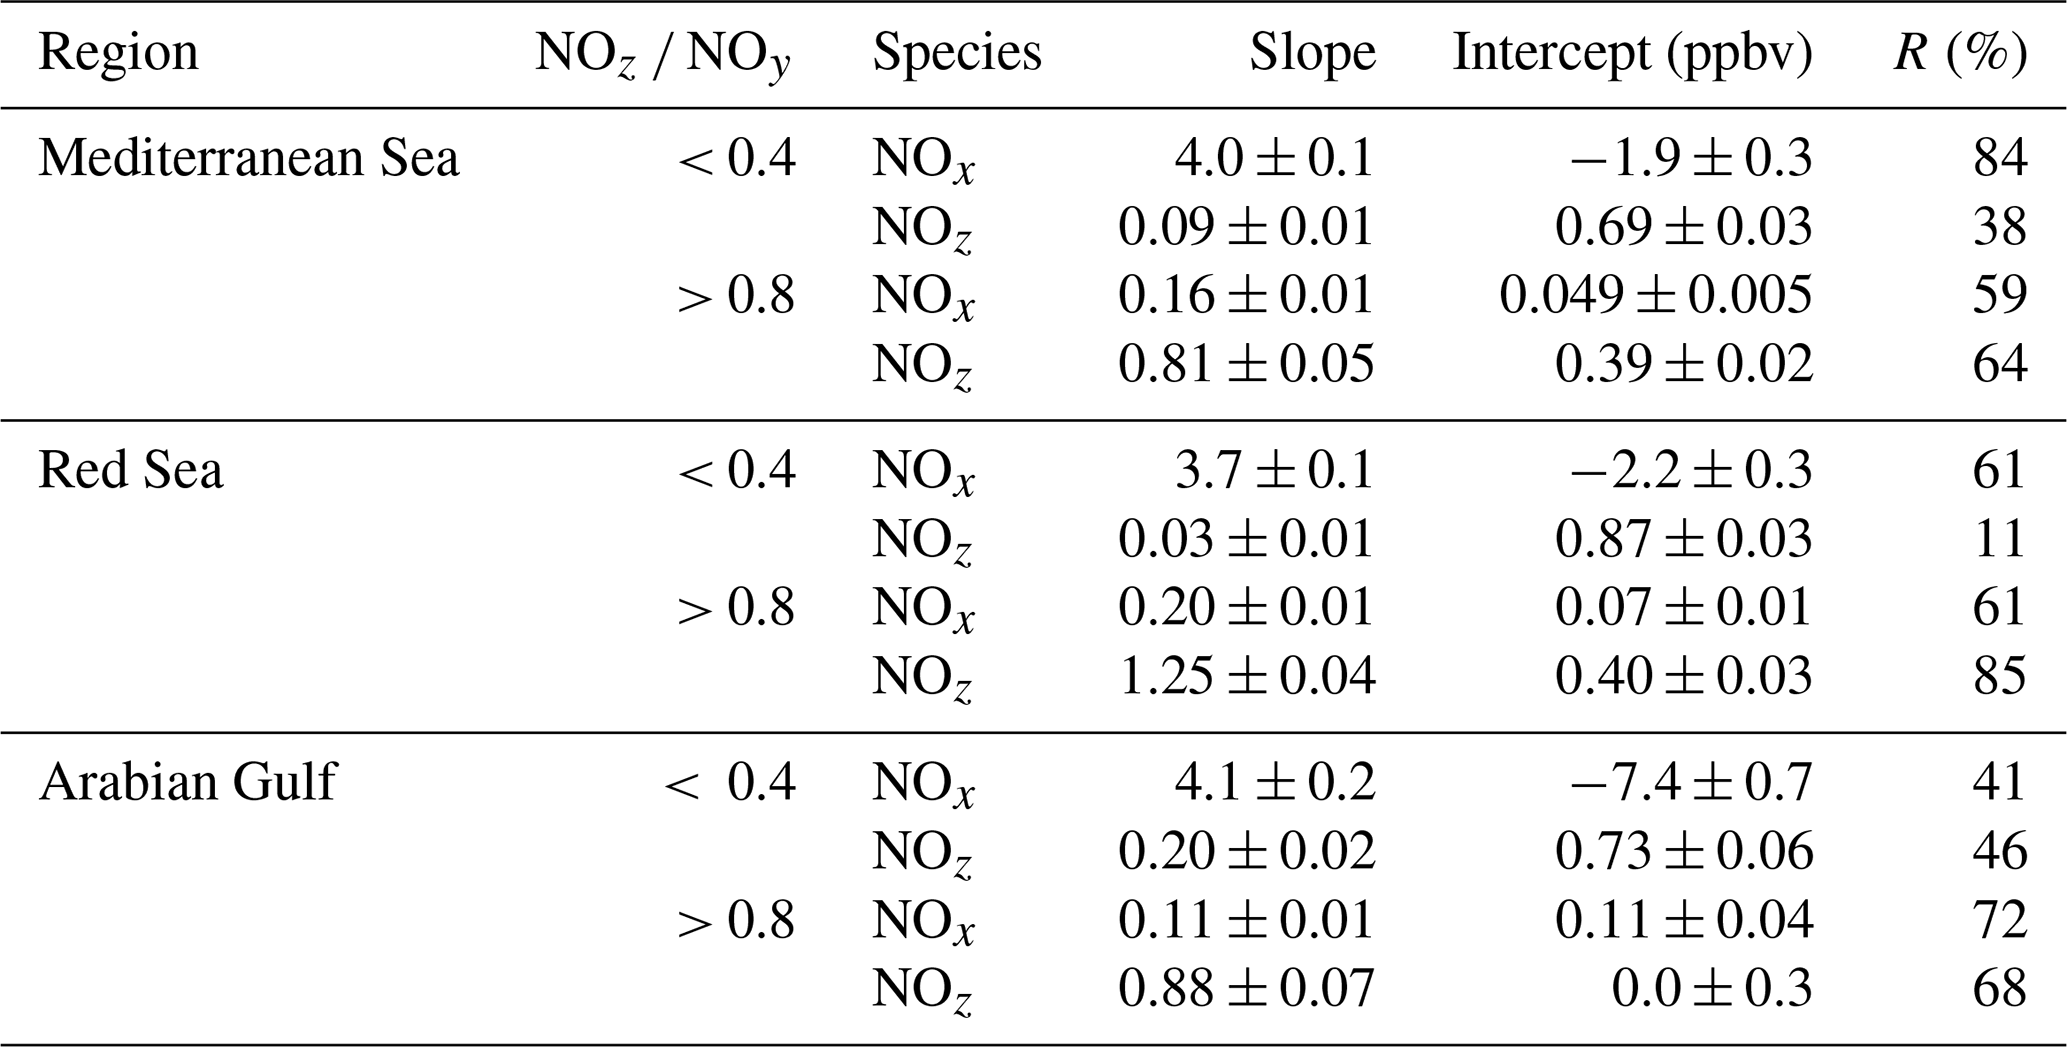
For chemically aged air masses, the NOx SO2 ratio is 0.20 ± 0.01 with R= 0.61 and the reduction in slope reflecting the shorter lifetime of NOx compared to SO2. We find, however, that in chemically aged air masses, NOz and SO2 are highly correlated (Fig. 9b) with a slope NOz SO2 of 1.25 ± 0.04 and R=0.85. The intercept (see Fig. 9b) at an SO2 mixing ratio of zero is 0.40 ± 0.03 ppbv, which can be taken to be the regional NOz background mixing ratio (i.e. NOz formed from NOx which was not emitted from SO2-containing fuels).
3.3 Arabian Gulf
Data over the Arabian Gulf (see Fig. 10) were obtained from 24 to 31 July 2017 (first leg) and 31 July to 3 August 2017 (second leg). During the 4 d layover in the harbour of Kuwait, the TD-CRDS was not operational. The highest temperatures during the AQABA campaign were found in the Arabian Gulf with daytime temperatures up to 46 ∘C at Kuwait harbour and 38–39 ∘C offshore. Night-time temperatures were constantly above 30 ∘C on both legs. Offshore relative humidities were between 60 % and 90 % during both legs; wind speeds were generally below 6 m s−1 and frequently 1–2 m s−1. The Arabian Gulf crossing was divided into four subregions: A1 and A2 on the first leg and A3 and A4 on the second leg (see Fig. 11).
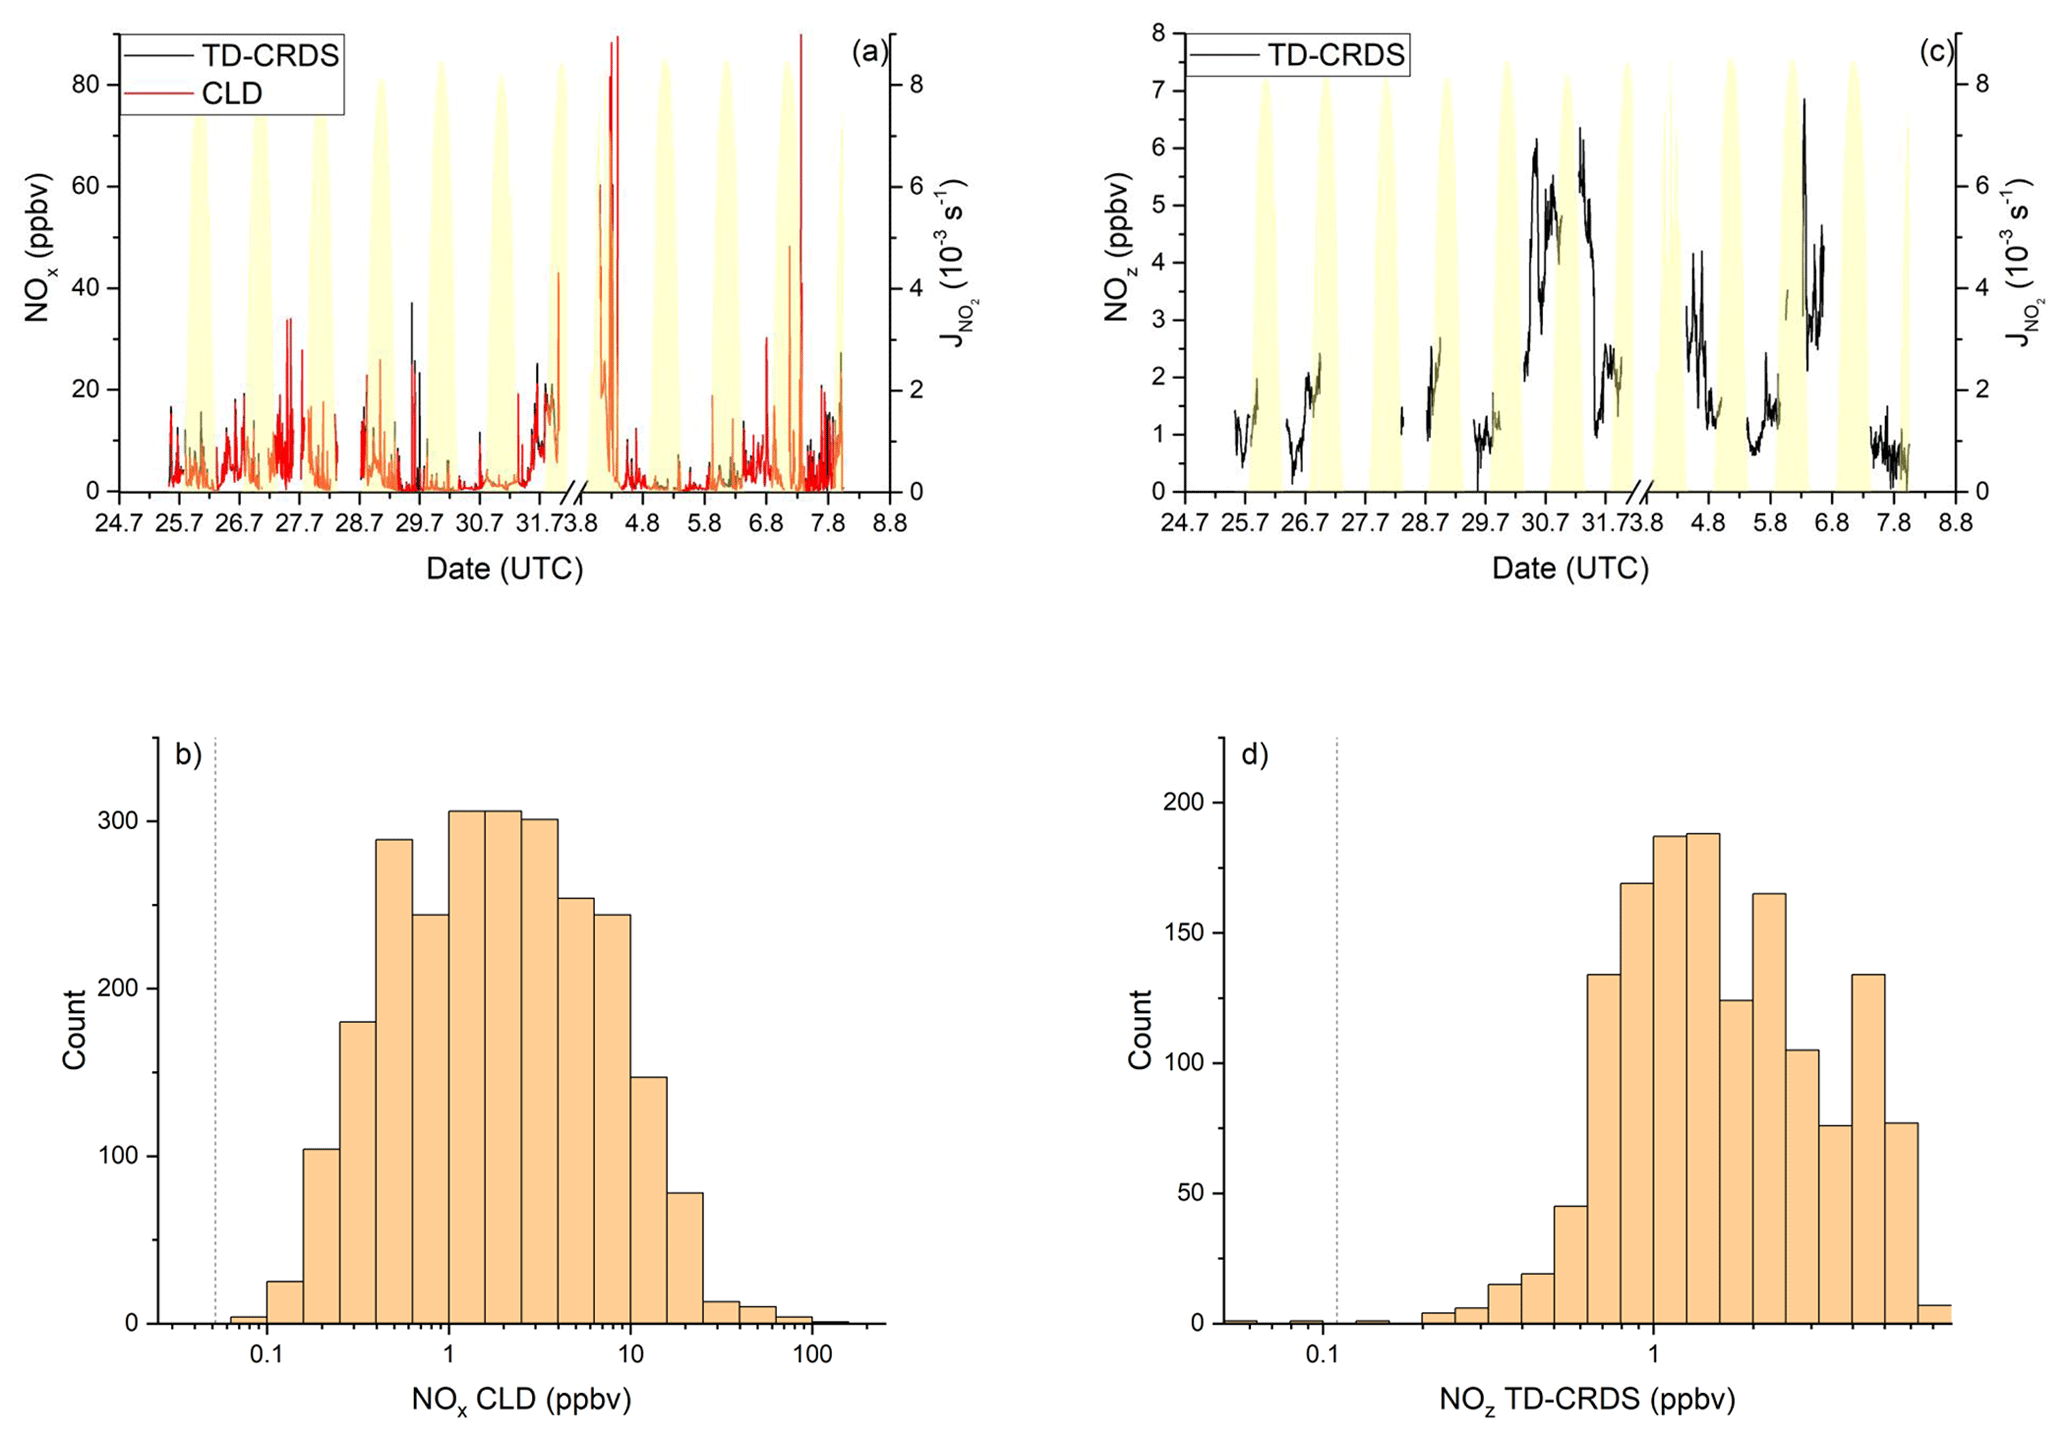
Figure 10NOy measurements in the Arabian Gulf. Dashed lines signify the instrument detection limits. (a) NOx mixing ratios by CLD and TD-CRDS. The NOx peak in the afternoon of 6 August 2017 reached 153 ppbv. (b) Frequency of NOx mixing ratios between 24 July and 7 August 2017, excluding the layover in Kuwait. (c) NOz mixing ratios by TD-CRDS. (d) Frequency of NOz mixing ratios between 24 July and 7 August 2020. The yellow shaded regions show .
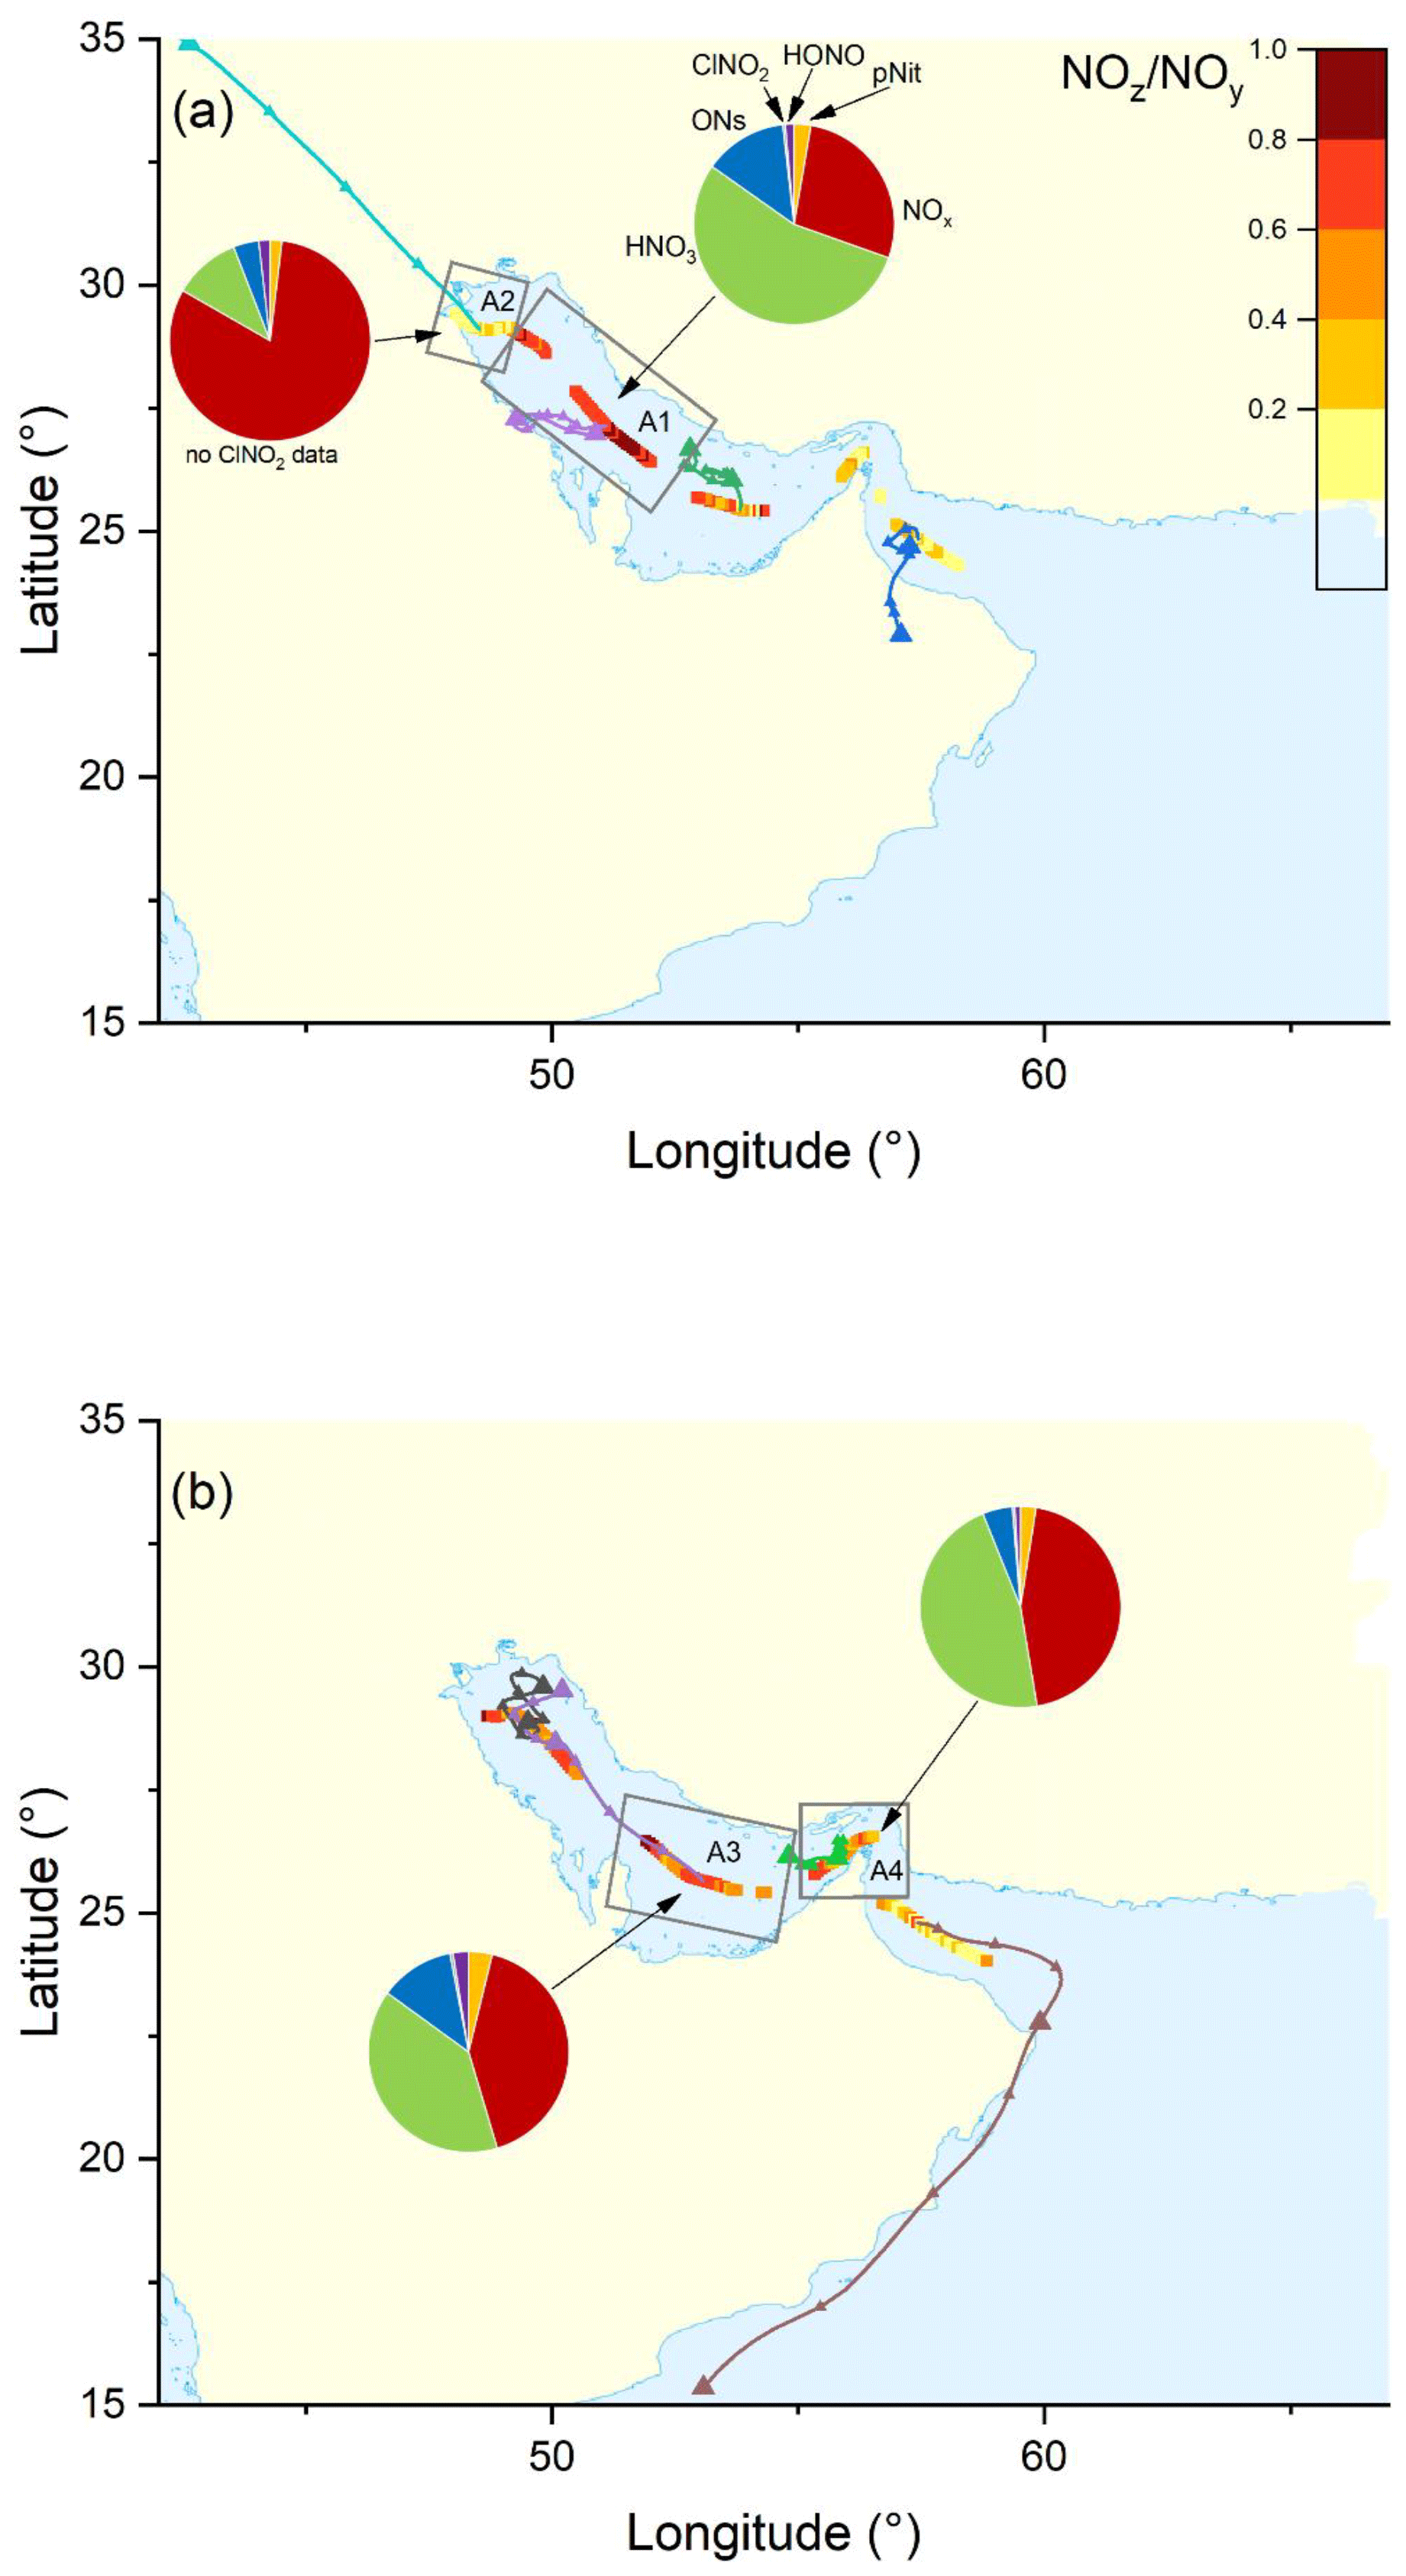
Figure 11The NOz NOy ratio over the Arabian Gulf during the (a) first and (b) second legs. Coloured lines are 2 d back-trajectories (HYSPLIT). The pie charts indicate the components of NOy at various segments along the ship's track (ONs = organic nitrates, pNit = particulate nitrate). HNO3 was calculated via HNO3= NOz – (ONs + pNit + ClNO2+ HONO). The colours of the pie chart segments are assigned as follows (clockwise): pNit in yellow, NOx in red, HNO3 in green, ONs in blue, ClNO2 in grey, and HONO in magenta.
Air mass back-trajectories indicated that air sampled in the Gulf of Oman originated in Oman; the south-eastern Arabian Gulf was influenced by transport from the central Arabian Gulf and Saudi Arabia. Inside A1, samples were affected by the eastern coast of Saudi Arabia. When approaching Kuwait (area A2), back-trajectories originated from Iraq. During the second leg, the northern Arabian Gulf region was dominated by stagnating air masses, mainly containing emissions from local sources and from the direction of Iran. Air from this area was also transported to the central Arabian Gulf, which is covered by subregion A3. Local sources from inside the shipping lane were dominant when passing the Strait of Hormuz (A4). The Gulf of Oman experienced influx from the remote Arabian Sea in contrast to the first leg.
3.3.1 NOx
Elevated NOx mixing ratios were detected by both TD-CRDS and CLD throughout the Arabian Gulf (see Fig. 10a). The TD-CRDS measured mean and median NOx mixing ratios of 3.3 and 1.6 ppbv, respectively. By comparison, the CLD measured an average of 4.1 ppbv and a median of 1.8 ppbv. The large difference between median and mean reflects the numerous plumes of high NOx detected by both instruments (Fig. 10a). The deviation of the TD-CRDS and the CLD data is caused by different data coverage as the CLD continued measuring in the most polluted areas close to Fujairah and Kuwait, while the TD-CRDS was switched to zeroing mode, in order to avoid contamination of the inlet lines. When limiting the comparison to periods where both instruments were operating, very similar median values are obtained, with 1.6 ppbv from the TD-CRDS and 1.5 ppbv from the CLD. A histogram of the NOx measurements (CLD data only) made in the Arabian Gulf (Fig. 10b) shows a broad distribution, reflecting high variability in the region, with 77 % of the data points falling into a range between 0.4 and 10 ppbv and a broad maximum at 1–3 ppbv. The highest NOx daily maxima were observed near Fujairah (up to 34 ppbv on the first and 153 ppbv on the second leg), in the Strait of Hormuz (26 and 30 ppbv), and when approaching and departing Kuwait (43 and 90 ppbv). The locations of these maxima close to the shore or in narrow shipping corridors and the plume-dominated time series suggest the influence of mostly local pollution sources of NOx, i.e. from ship traffic or from industrial activities in the shore-side areas of the neighbouring cities. NOx mixing ratios < 0.5 ppbv were found exclusively in the central part of the Arabian Gulf, which is the widest part (least influence from onshore activity) with the largest spread of the shipping lanes.
The generally very high levels of NOx in the Arabian Gulf are consistent with results from satellite measurements which have identified high NO2 tropospheric vertical column densities over the Gulf of Oman, the Strait of Hormuz, and the south-eastern Arabian Gulf (Beirle et al., 2004). Model studies estimate a NOx emission rate of 1.13 t km−2 yr−1 for the Arabian Gulf (Johansson et al., 2017). With a NOx lifetime of 4.0 h (see Sect. 3.3.3) and a boundary layer height of 1 km (Wu et al., 2008), this emission rate translates to a NOx mixing ratio of 0.3 ppbv. The lower mixing ratio, compared to the median NOx observed on AQABA (see above), is likely caused by the averaging of the model over the entire Arabian Gulf water surface area, whereas the Kommandor Iona followed common shipping routes with larger NOx emissions. To the best of our knowledge, there are no in situ measurements of NOx over the Arabian Gulf with which to compare our data.
3.3.2 NOz
The Arabian Gulf featured the highest NOz levels during the AQABA campaign (see Fig. 10c), with mixing ratios from < 0.1 ppbv up to 6.9 ppbv (mean 2.0 ± 1.5 ppbv (standard deviation) and median of 1.5 ± 0.7 ppbv (median absolute deviation)). The histogram of NOz mixing ratios (Fig. 10d) shows a maximum in the frequency distribution at 1–3 ppbv, with 73 % of all data above 1 ppbv and 15 % above 4 ppbv. Our results thus indicate that the Arabian Gulf is a hotspot for NOz formation, which is a result of high levels of the NOx and VOCs precursors and also O3. The spatial distribution of the NOz NOy ratio for both legs is presented in Fig. 11. On both legs, NOz NOy ratios above 0.8 were found in the central part of the Arabian Gulf, which results from the processing of NOx emissions during transport from the shore to the centre of the Arabian Gulf.
We now examine the partitioning of NOy into its various components in the four subregions (A1–A4) defined above for the Arabian Gulf (Fig. 11). On the approach to Kuwait (A2), winds from the north transported fresh NOx emissions from cities in Kuwait and Iraq to the ship and NOx accounted for 81 % of NOy. More aged air masses were found in other regions (A1, A3, and A4) with a roughly equal split between NOx and HNO3 (both 45 %–50 %) observed in A3 and A4. The major component of NOz was HNO3 in all regions, with significant but very variable contribution from organic nitrates, especially in A1 (13 ± 16 %) where the air masses originated from the eastern coast of Saudi Arabia, which accommodates numerous facilities for oil and gas extraction and processing, resulting in high levels of organic trace gases including alkanes, alkenes, and aromatics (Bourtsoukidis et al., 2019). Particulate nitrate contributed only minor amounts to NOz in the Arabian Gulf, which reflects the high temperatures and resultant partitioning of nitrate into the gas phase. Other NOz species contributed only weakly to the NOz as indicated in Fig. 11.
3.3.3 Lifetime and sources of NOx
Analogously to Sect. 3.1.3, we also determined NO2 lifetimes and the cumulative loss of NO2 in the Arabian Gulf. The results are presented in Fig. 12. Limited by the availability of OH data, these calculations include only the time period after 29 August 2017 on the first leg. In the same way as in Sect. 3.1.3, we used an interpolated OH data set in the following calculations.
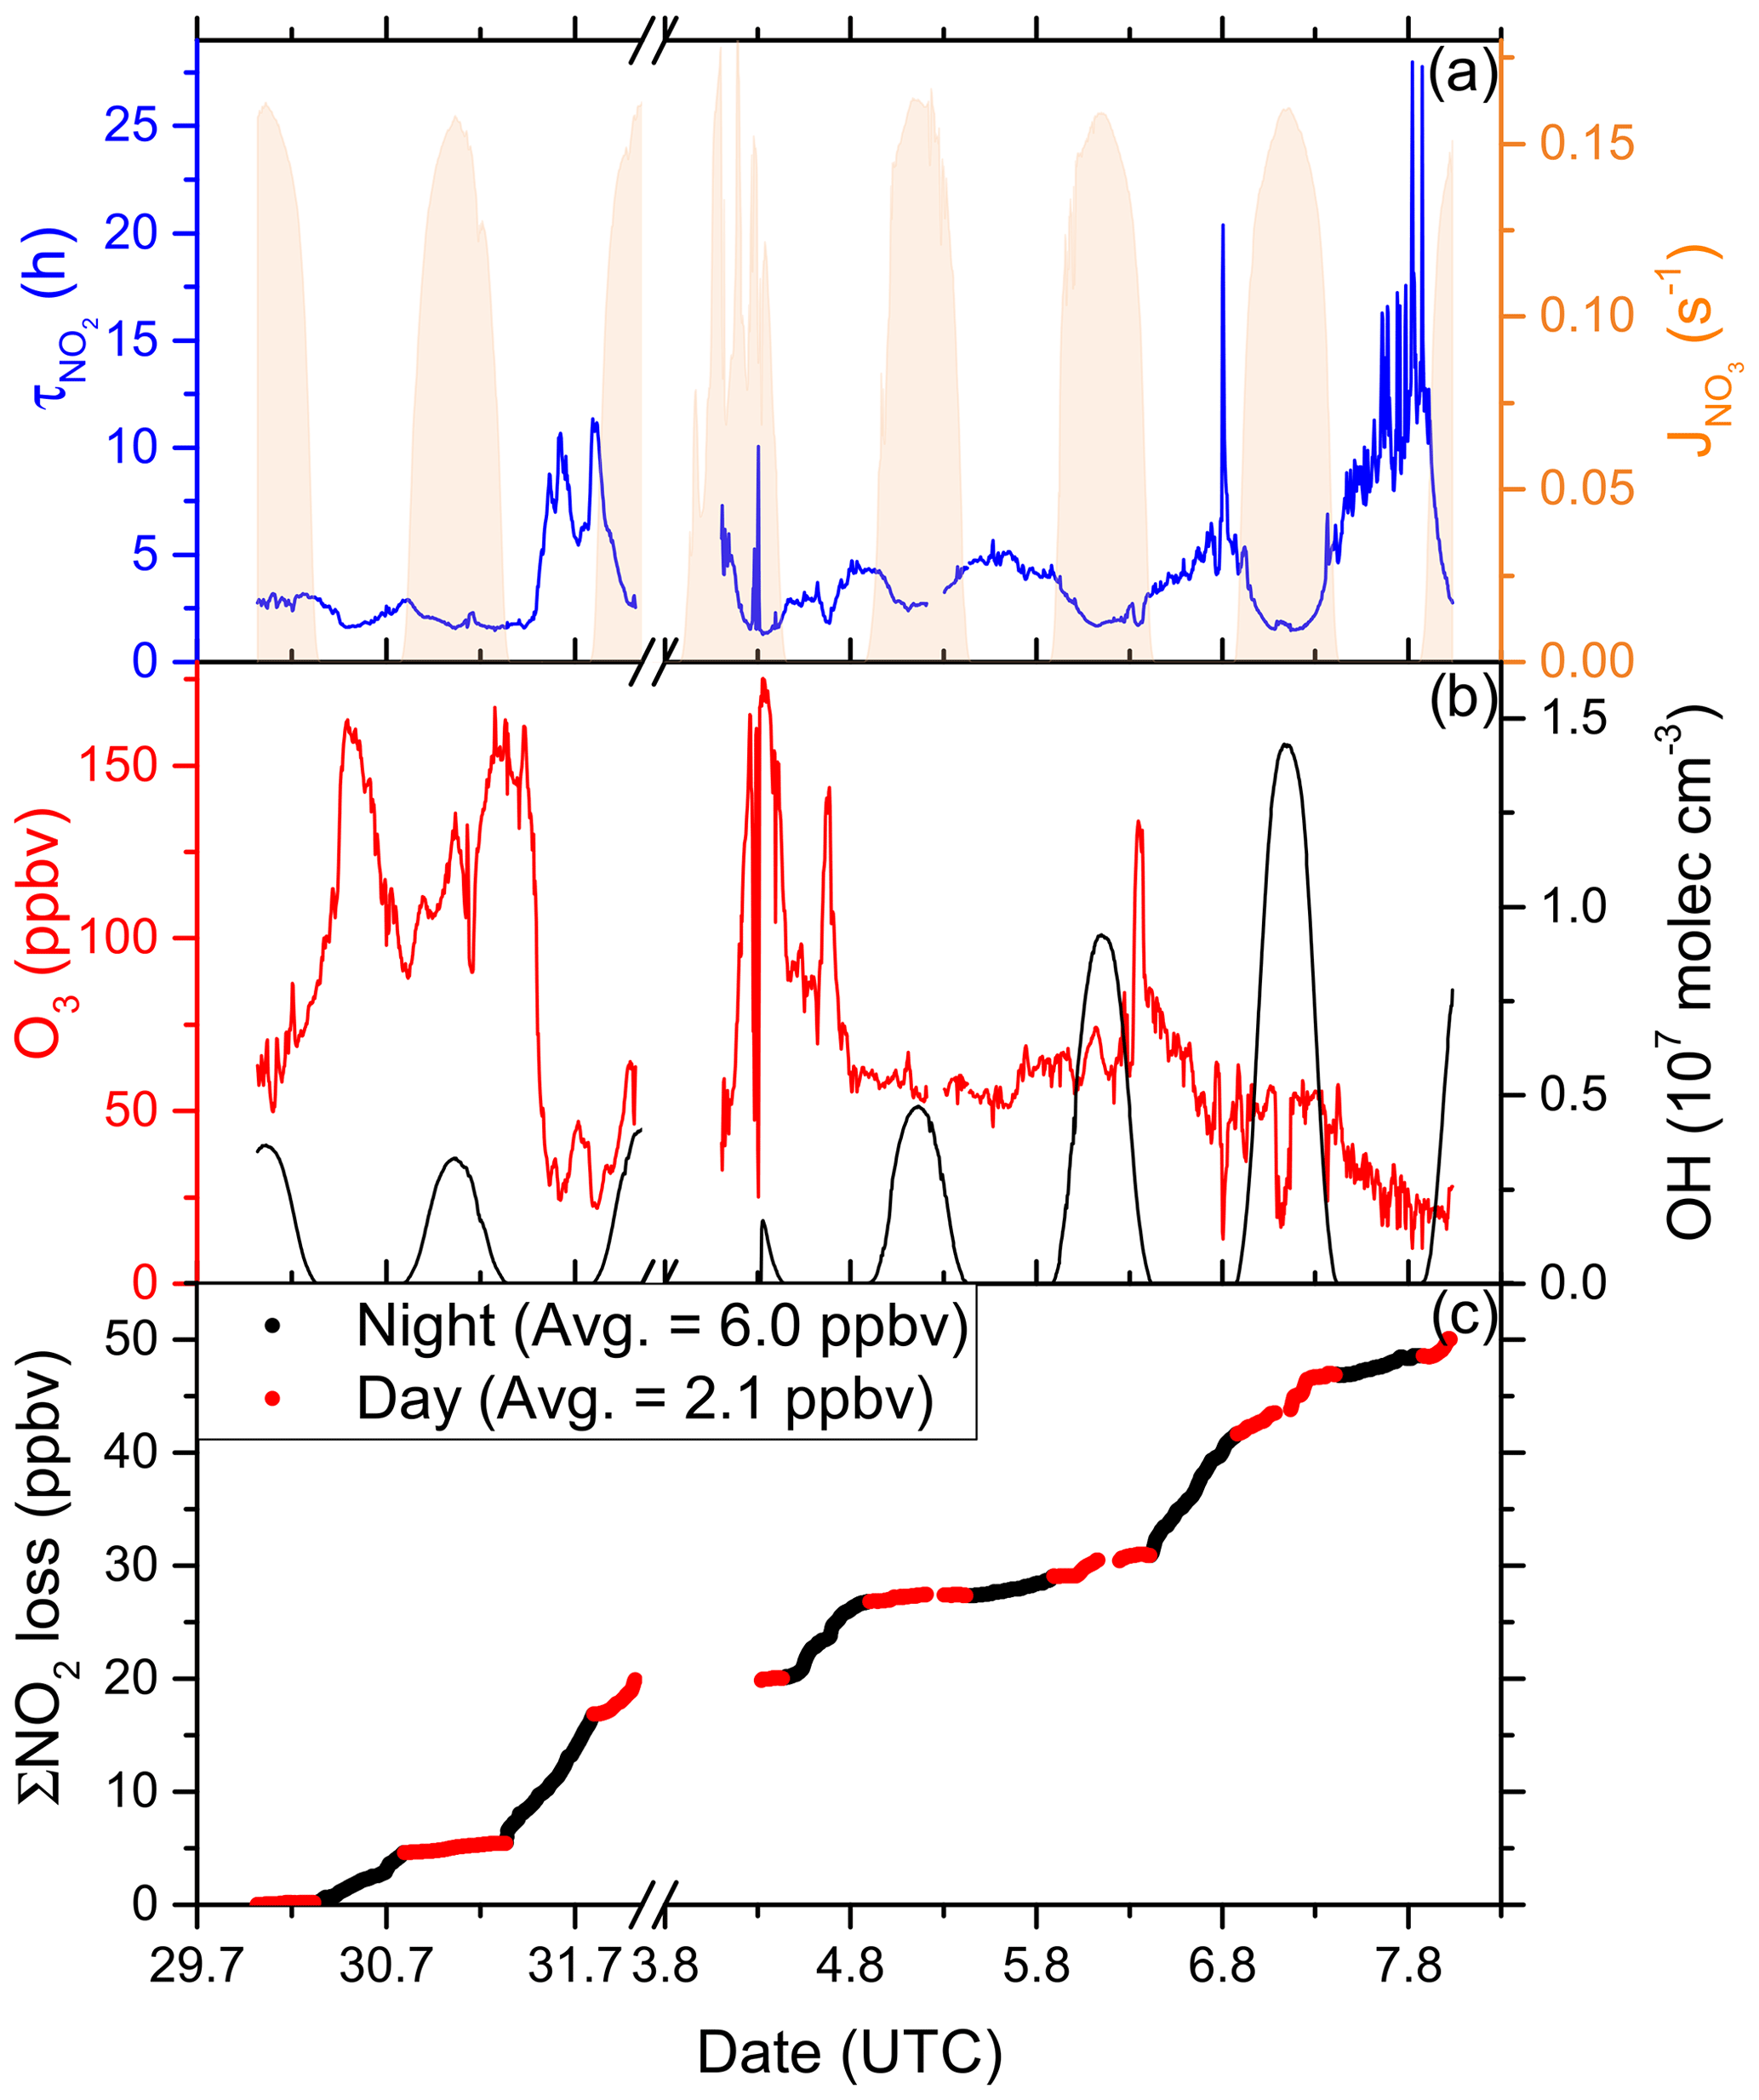
Figure 12(a) Lifetime (τ) of NO2 due to reactions with OH and O3 in the Arabian Gulf, together with concentrations of O3 and OH. The OH trace is an interpolation based on OH measurements and (see Sect. 3.3.3). Daytime hours are indicated via . (b) Cumulative loss of NO2 during the displayed time frame, based on the calculated lifetimes and measured NO2.
In the Arabian Gulf, daytime NO2 lifetimes (considering loss by OH) were generally between 2 and 4 h. Night-time lifetimes were in a similar range but also occasionally exceeded 10 h, e.g. when leaving the Arabian Gulf towards the Gulf of Oman and the Arabian Sea on the second leg, where O3 mixing ratios fell below 20 ppbv. The average NO2 lifetime was calculated to be 4.0 h.
Figure 12c shows that 50 ppbv of NO2 was lost cumulatively throughout the period of measurements over the Arabian Gulf, with night-time losses (black data points) being more important than daytime losses (red data points). On average 6.0 ppbv NO2 were lost per night and only 2.1 ppbv was lost per day. Large night-time compared to day-time losses are related to moderate OH levels in large parts of the Arabian Gulf (see Fig. 12b). The daytime average OH concentration was 2.4 × 10⁶ molec. cm−3, while on average 73 ppbv O3 was present. The measured OH concentrations were generally low, given the NOx and O3 levels in the Arabian Gulf, which may have resulted from its reactions with VOCs. With a loss rate constant of 11.6 s−1, the Arabian Gulf was the AQABA region with the largest median OH reactivity (Pfannerstill et al., 2019), with 61 % of the total OH reactivity attributed to various measured VOCs. The daytime losses of NO2 are therefore indirectly limited by the availability of VOCs from the oil and gas production (see above).
Via analysis of correlation between SO2 and NO2 (Fig. 13 and Table 2), we can assess the influence of shipping emissions on NOx mixing ratios in the Arabian Gulf. In air masses recently influenced by NOx emissions (NOz NOy < 0.4), NOx and SO2 are only weakly correlated (slope = 4.1 ± 0.2, R= 0.41), indicating that many different NOx sources (i.e. not only shipping emissions) contribute. These might include vehicular traffic and industrial activity (e.g. production of nitrogen-based fertilisers Khan et al., 2016) in Kuwait City, the Iraqi city of Basra, and in Iranian harbours and offshore oil and gas terminals. Considering the limited NOx lifetime, the land-based emission sources of NOx from urban/industrialised areas gain in importance over plumes from nearby ships, when approaching the coast. In aged air masses, the slope of the NOx versus SO2 correlation is 0.11 ± 0.01 with a large correlation coefficient (R= 0.72). This indicates that in aged air masses, the NOx levels are linked to SO2 emissions, which is consistent with the photolysis of HONO being a major source of NOx in the region. From the intercept (SO2 mixing ratio = zero = 0.0 ± 0.3 ppbv), we would expect negligible background levels of NOz. Overall, shipping was an important source of NOx in the Arabian Gulf, both through direct emissions and via photolysis of ship-related HONO.
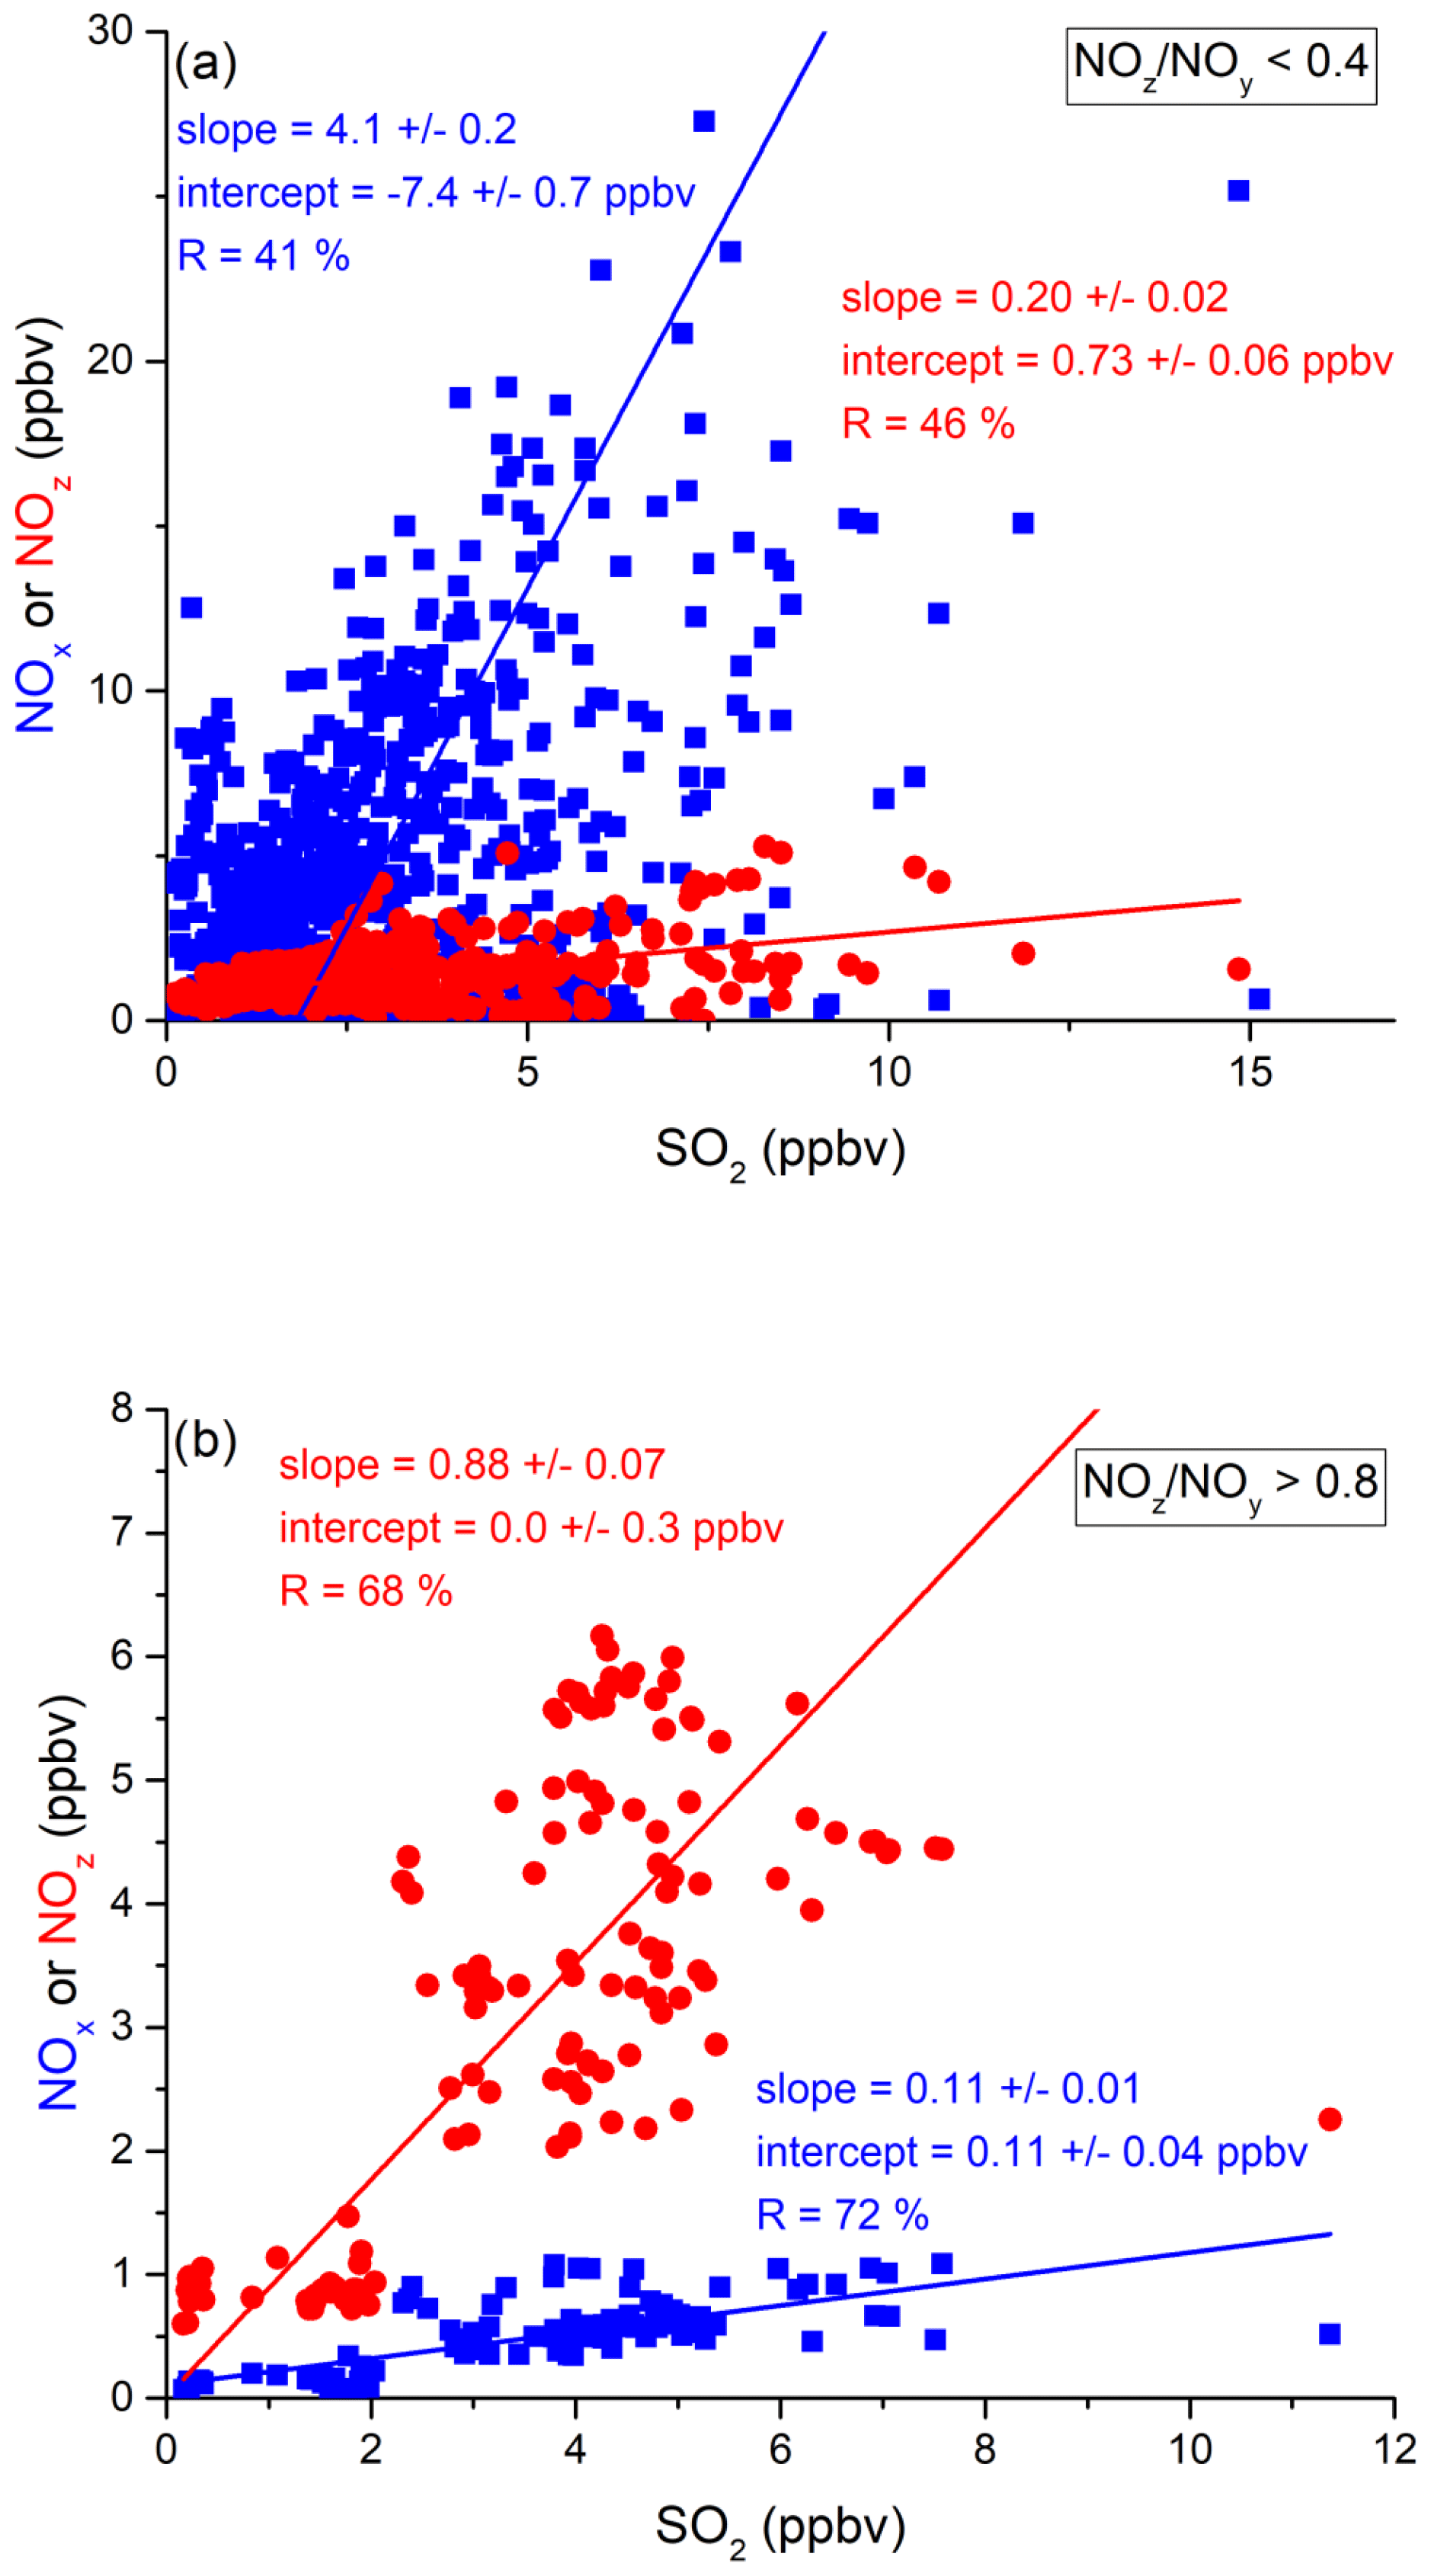
Figure 13Correlation between SO2 and NOx or NOz for (a) fresh and (b) aged NOx emissions in the Arabian Gulf.
3.4 NOx and NOy and the role of ship-emission-related HONO formation during AQABA
In this section, we perform a steady-state analysis, assessing to what extent chemical source strengths can explain the background mixing ratios of NOx observed during AQABA. Background conditions refer to NOx mixing ratios found during periods when ship plumes were rarely encountered. “Background” NO2 varied from region to region and was, for example, 50–150 pptv in the Mediterranean Sea. The required NOx source strength (P, in molec. cm−3 s−1) to maintain the observed NOx levels is derived from the measured mixing ratios [NOx] and the NO2 reactivity (; see Sect. 3.1.3), whereby is a combination of chemical production (Pchem) and direct emission (E). Notably, we neglect direct emissions under background conditions (i.e. E= 0) and assume that NOx is only lost via the reaction of NO2 with OH (i.e. ).
Chemical processes that result in the formation of NOx include the degradation of two gas-phase NOz components, HONO and HNO3, and the photolysis of particulate nitrate.
In a first step, we examine whether the HONO levels observed on AQABA can be explained by the photolysis of pNit in the PM1 size range. This calculation is based on the assumption of a steady state for HONO established at noon through its photolytic loss and its production through the photolysis of pNit. Using average noon-time Mediterranean Sea concentrations for HONO (2.44 × 10⁹ molec. cm−3) and pNit (2.93 × 10⁹ molec. cm−3) and a photolysis rate JHONO (1.45 × 10⁻³ s−1), we calculate that a value for JpNit of ∼ 1.21 × 10⁻³ s−1 would be required in order to maintain the observed HONO concentrations. This is a factor of ∼ 5–6 higher than a reported value of JpNit ≈ 2 × 10⁻⁴ s−1, based on observations over the western North Atlantic Ocean (Ye et al., 2016). It is, however, unclear whether the type and age of particles examined by Ye et al. (2016) are comparable to those in AQABA. In addition, photolysable nitrate associated with particles that are > 1 µm diameter remain undetected by the AMS and could also contribute to the discrepancy between required and literature JpNit.
Laboratory studies have demonstrated the conversion of NO2 to HONO on BC particles, with a clear enhancement under UV irradiation (Acker et al., 2006; Elshorbany et al., 2009; Monge et al., 2010; Ma et al., 2013). Monge et al. (2010) postulated the transport of HONO and NO to remote low-NOx areas, enabled via this heterogeneous mechanism. Besides the effect of irradiation, heterogeneous BC-assisted HONO and NO generation also shows a remarkable humidity dependence (Lammel and Perner, 1988; Kalberer et al., 1999; Kleffmann et al., 1999). Further information on the particulate-phase chemistry of HONO can be found in comprehensive reviews by Ma et al. (2013) and George et al. (2015). Sources of HONO during the AQABA campaign will be discussed in more detail in a separate publication.
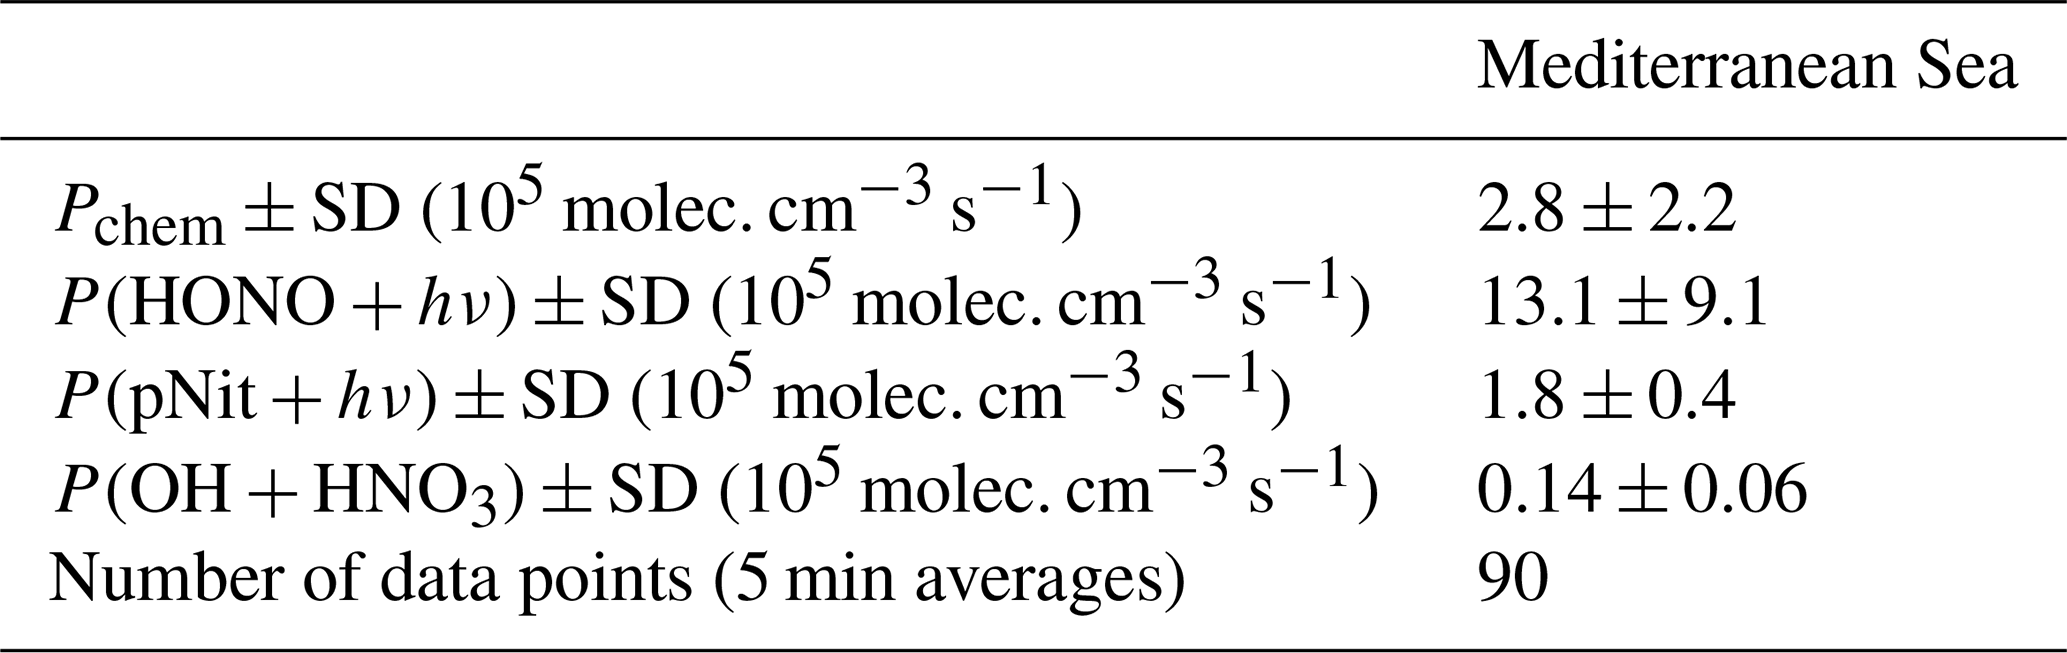
Using Eq. (2), we now calculate what values of Pchem are required to maintain the background levels of NOx observed and assess the individual contributions from Reactions (R12)–(R14) (results presented in Table 3). The analysis was restricted to data points where NOz NOy was greater than 0.6 and to the 4 h time frame around local noon, in order to focus on aged air mass conditions during maximum photochemical activity. NO2 reacting with O3 was not considered a NOx loss mechanism, due to the rapid re-formation of NOx by the photolysis of NO3. For the pNit photolysis rate constant to form NOx, we used 0.33 ⋅ JpNit (from Ye et al., 2016), which accounts for the HONO NOx production ratio of 2:1. Additionally, we scaled JpNit with JHONO (normed to the average daytime maximum of JHONO) to introduce diurnal variability. Due to limited data availability and rare occurrence of NOz NOy > 0.6 (i.e. sampling of aged air) in the other regions, we performed this calculation for the Mediterranean Sea only. The results indicate that the measured HONO concentrations should result in a factor ca. 4.7 times larger NOx production term than calculated via Eq. (2). Possible explanations for this include a positively biased HONO measurement or the underestimation of NOx losses, e.g. due to undetected OH (despite the upper limit chosen in the interpolation). Our measurements and calculations, nonetheless, allow for the qualitative identification of HONO photolysis as a major source of daytime background NOx levels during AQABA. The production rate from pNit photolysis can also account for ca. 64 % of the chemical NOx generation, whereas the reaction of OH and HNO3 forms an order of magnitude less NOx.
Table 3Average required production rates to maintain the observed NOx mixing ratios in aged air masses during the Mediterranean Sea transit and contributions from processes (R12)–(R14).
Throughout AQABA, shipping emissions were responsible for fresh input of pollutant NOx into the atmosphere. Our observations that levels of NOx (with a lifetime of a few hours) were correlated with SO2 (with lifetimes of more than a week) levels even in aged air masses and that HONO photolysis was an important source of NO may be reconciled by considering that HONO (and thus NOx) production is driven by heterogeneous photochemistry on nitrate-containing particulate matter, the formation of which is associated with emissions of NOx and SO2 as well as black carbon. The latter has a lifetime in the boundary layer (defined by its deposition) of about a week or longer in the absence of precipitation and is thus comparable to that of SO2. The slow, photochemically induced conversion of nitrate to HONO thus provides a long-lived source of NOx and a link with SO2, together with an explanation for the detection of short-lived HONO even in processed air masses in the eastern Mediterranean Sea. We emphasise that the analysis presented here focussed on the daytime chemistry of HONO. At night-time, a pseudo stationary state, independent of fresh NOx input, has been observed by Wojtal et al. (2011) and explained with a reversible deposition of HONO on marine surfaces. This will, however, be insignificant during the day. Ship-derived HONO also has a substantial effect on the rates of photochemical O3 formation in the remote marine boundary layer, largely as a result of higher ROx production rates (Dai and Wang, 2021).
3.5 Inter-regional ozone production efficiency (OPE)
The OPE can be calculated from the relationship between Ox and NOz where Ox= O3+ NO2, and the O3 mixing ratios are augmented by those of NO2, 95 % of which potentially photolyses to O3 (Wood et al., 2009). Note that in any air mass where HNO3 is a major component of NOz, the derived OPE may represent an upper limit if HNO3 is lost during transport from the NOx source region to the measurement location. The NOy CO ratio has been used to estimate the impact of NOz losses on the values of OPE obtained in this type of analysis (Nunnermacker et al., 2000) the rationale being that CO (like O3) is a product of photochemical activity and relatively long lived, at least compared to NOz. The high variability in the NOy CO ratio during AQABA is, however, indicative of local (non-photochemical) sources of CO (e.g. via combustion) and precludes use of this corrective procedure so that the values of OPE we present should be regarded as upper limits. An introduction into the OPE metric and on typical literature values is given in Sect. 1.

Figure 14Correlation between Ox (= O3+ NO2) and NOz during AQABA, with the regions indicated via the colour code. Only daytime measurements were used in this analysis. The OPEs for AQABA and for the individual regions shown in Table 4 were derived from linear fits of these data points. A clear regional variability can be observed for Ox and NOz mixing ratios. Elevated Ox and NOz levels were measured in the Arabian Gulf and the Red Sea.
In Fig. 14 we plot Ox versus NOz for which the NO2 photolysis rate constant was > 1 × 10⁻³ s−1, which restricts the analysis to hours of the day with active photochemistry. Regional OPE values are 10.5 ± 0.9 for the Red Sea, 19.1 ± 1.1 for the Arabian Gulf, and 15.4 ± 2.4 for the eastern Mediterranean Sea. The heterogeneity of NOz and O3 mixing ratios, i.e. the chemical conditions frequently varying between aged and plume situations (see Sect. 3.1), resulted in a low correlation coefficient in the western Mediterranean Sea (R2= 0.19), which precluded derivation of an OPE for this region and led us to restrict the Mediterranean Sea OPE analysis to the more homogenous eastern part (encompassing subregions M1–M5).
The range of OPE values measured during AQABA (10.5–19.1) is comparable to the value of 10, derived in the marine boundary layer (MBL) at Oki Islands, Japan, a site which is influenced by pollution arriving from the Korean peninsula and the Japanese mainland (Jaffe et al., 1996), but much lower than the value of 87 which was derived from observations off the coast of Newfoundland (Wang et al., 1996), where the median NOx mixing ratio was < 100 pptv. As alluded to above, high values in remote locations may in part be a result of reactive nitrogen loss via deposition. By comparison, during AQABA the median NOx mixing ratio was > 600 pptv, which together with the relatively low OPE indicates that the vast majority of the AQABA ship track cannot be considered representative of remote MBL conditions.
Table 4Ozone production efficiencies (OPEs) for AQABA and the individual regions.

a Median. b 10–90 percentiles. c No CO data after 16 August 2017. d Average of daily OH peak concentrations; no data before 18 July 2017.
Figure 14 and Table 4 indicate that the Arabian Gulf, for which the highest O3 levels in the entire campaign were found (up to 150 ppbv), also has the largest OPE, despite high median NOx mixing ratios. The high OPE value, however, is consistent with the analysis of Pfannerstill et al. (2019), who used VOC and OH reactivity measurements to derive the fraction of OH that reacts with VOCs (fuelling the formation of RO2, conversion of NO to NO2, and thus O3 formation) versus the fraction that reacted with NOx (resulting in NOz formation) to identify regions where O3 formation was NOx-limited, VOC-limited, or (as was generally the case) in a transition regime. Pfannerstill et al. (2019) indicated that formation of O3 was favoured around the Arabian Peninsula where VOCs from petroleum extraction and processing industries were important sinks of OH. The highest net ozone production rates (NOPRs) during AQABA were also found in the Arabian Gulf where calculations of the rate of RO2 induced oxidation of NO to NO2 resulted in a median (over the diel cycle) value of NOPR = 32 ppbv per day which was driven by high noon-time mixing ratios of RO2 (73 pptv in the Arabian Gulf) (Tadic et al., 2020). In contrast to the OPE, NOPR accounts for the total amount of O3 produced in 1 d, considering production (governed by the formation of NO2 via reactions of NO with HO2 and RO2) and loss (via photolysis and reaction with OH or HO2). The OPE, on the other hand, focusses on the product side and assesses the competition between O3 formation and sequestering into NOz from a given initial level of NOx. By approximating the O3 production rate via the NO2 formation from NO reactions with HO2 and RO2, the NOPR thus neglects the alternative branch leading to NOz. In the other two regions, the correlation coefficients are notably smaller, due to the lower span in O3 and NOz, resulting in increased relative errors for the derived OPE values.
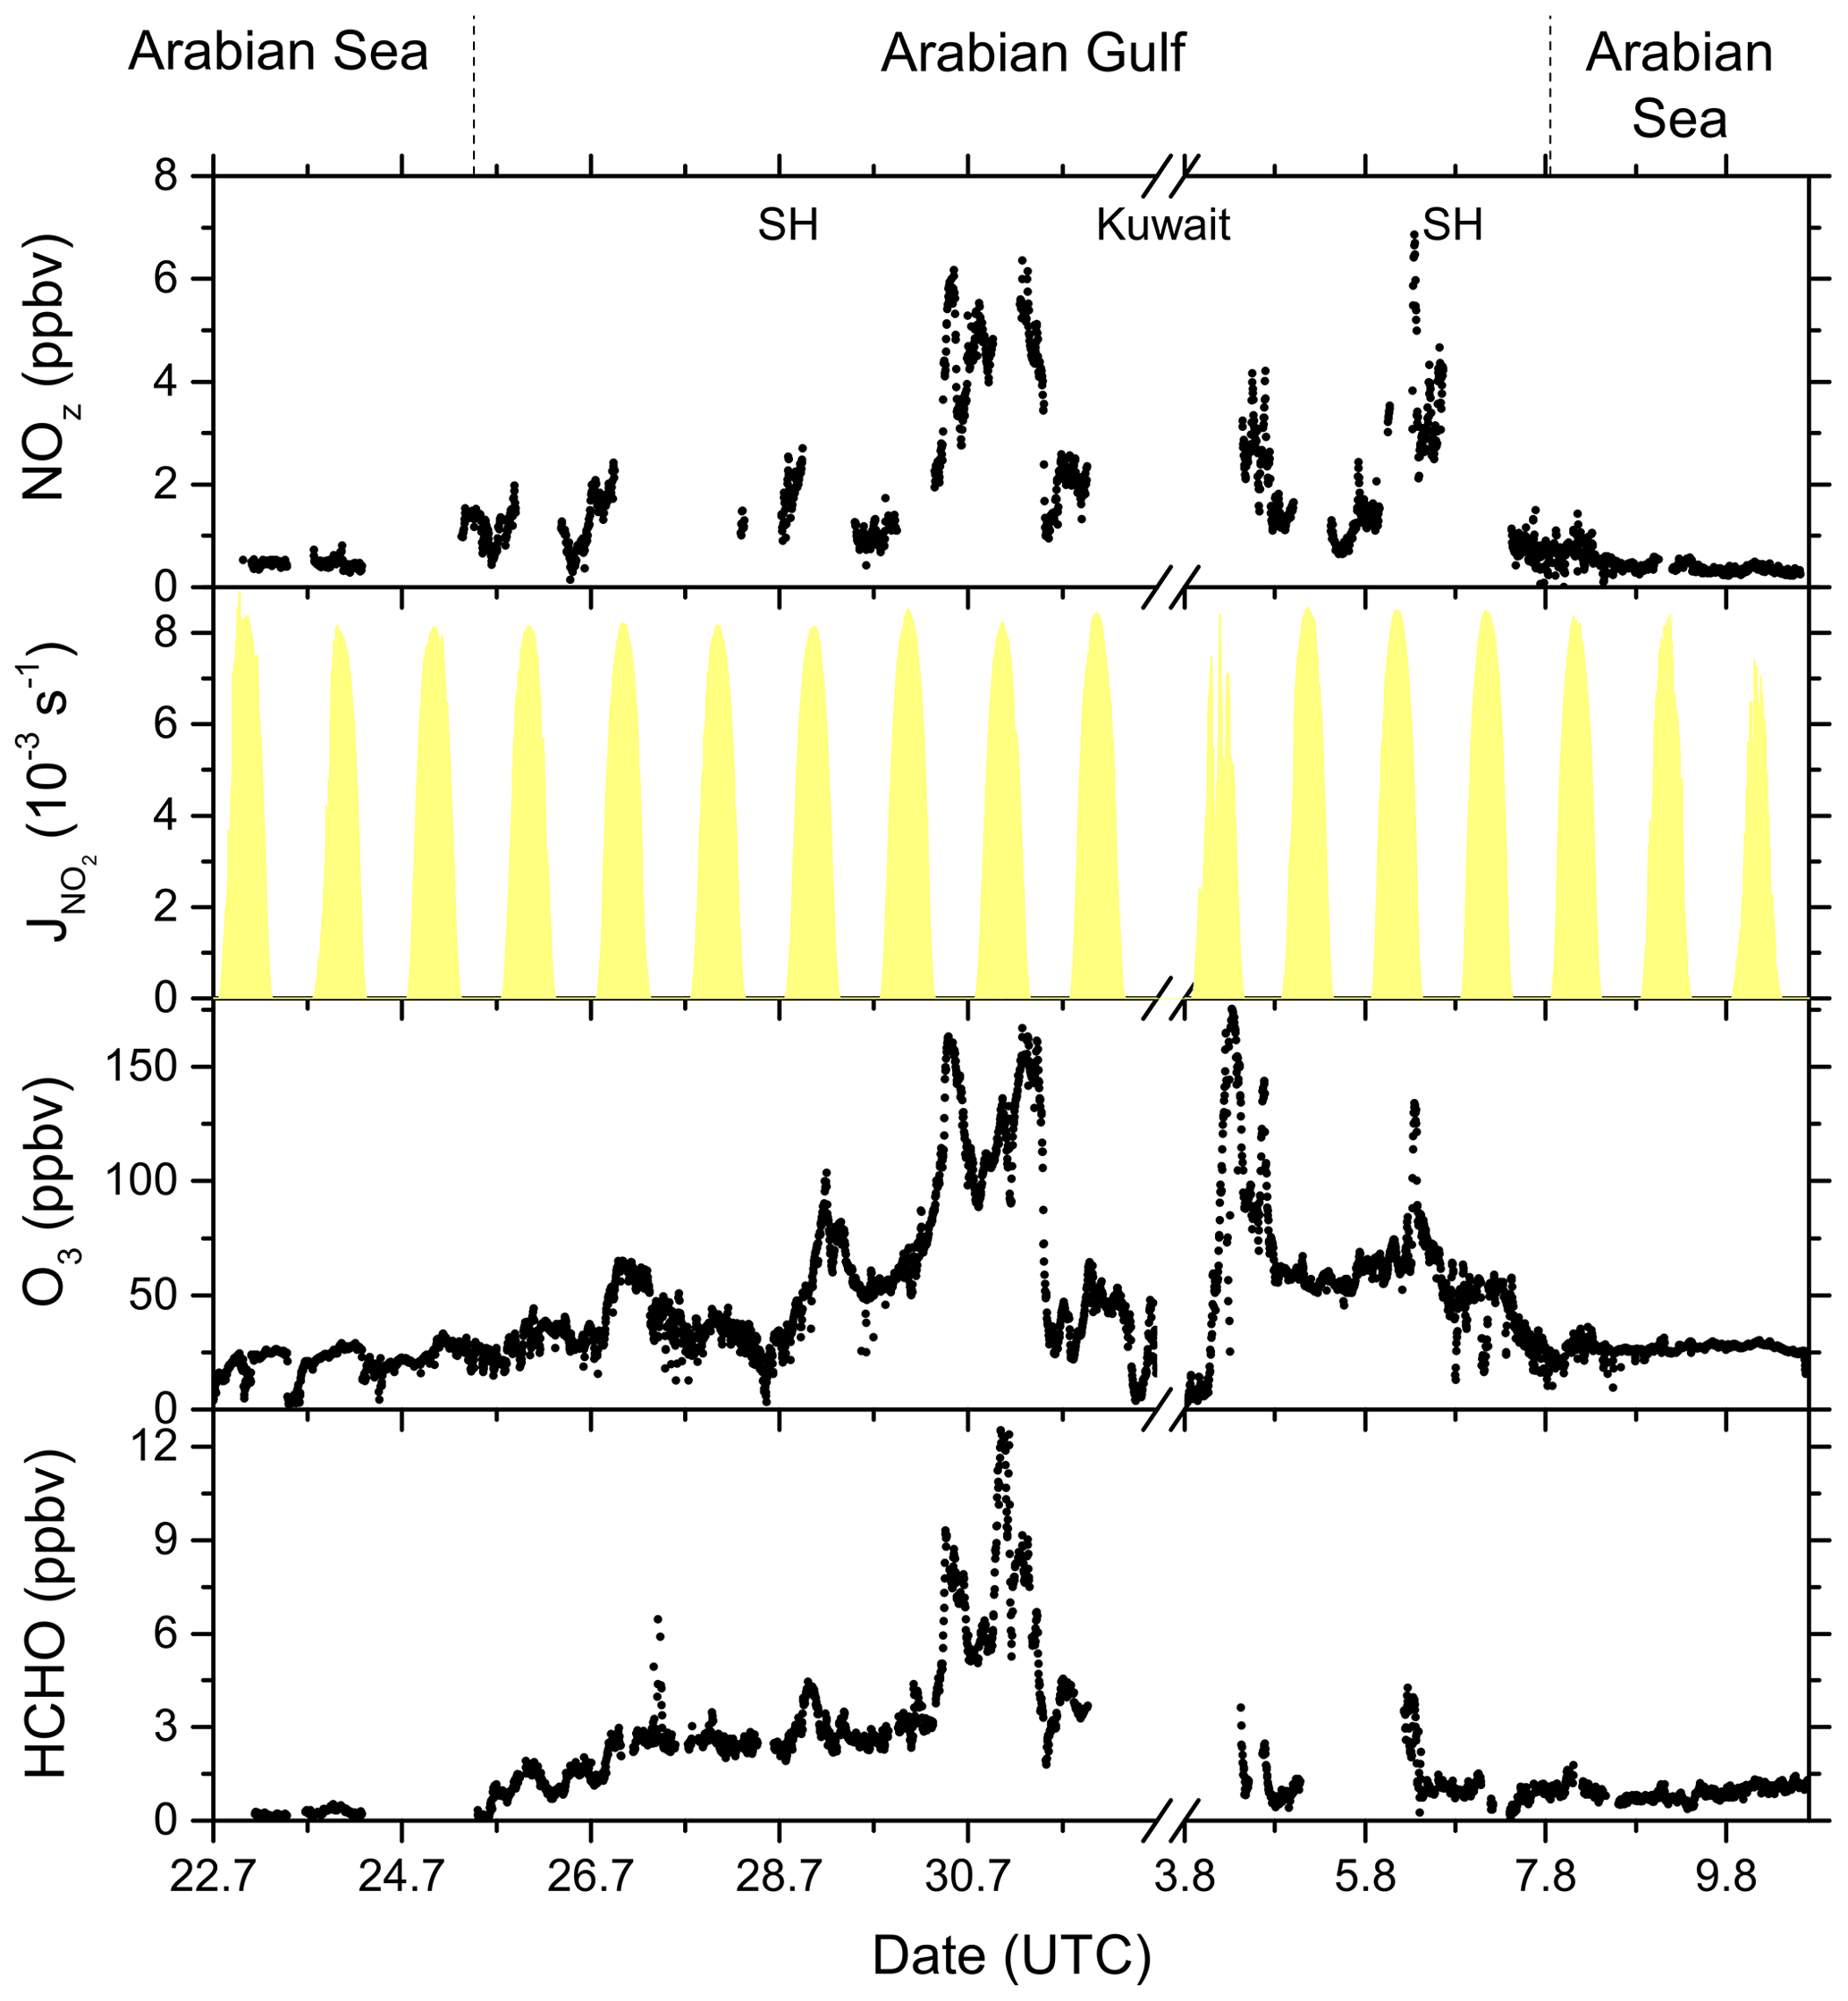
Figure 15NOz, O3, and HCHO mixing ratios, together with NO2 photolysis rates, during the transitions between the Arabian Sea and Arabian Gulf, as well as in the Arabian Gulf.
In Fig. 15 we plot a time series of NOz mixing ratios during the transition from the Arabian Sea to the Arabian Gulf along with NO2 photolysis rates, O3, and formaldehyde (HCHO) which is formed during the photochemical processing of many VOCs (Fischer et al., 2003; Klippel et al., 2011; Wolfe et al., 2016; Wolfe et al., 2019) and which can therefore be used as a tracer for photochemical activity (Dodge, 1990; Altshuller, 1993; Garcia et al., 2006; Duncan et al., 2010; Parrish et al., 2012). The transition from low NOz levels in the Arabian Sea to values up to ∼ 7 ppbv in the Strait of Hormuz (SH) is accompanied by increases in both O3 (up to 160 ppbv) and HCHO (up to 12.5 ppbv). Based on the analysis by Duncan et al. (2010), Tadic et al. (2020) calculated a median HCHO NO2 ratio of 9.3 for the Arabian Gulf, indicating that O3 production in this region is NOx limited. The high levels of NOz, O3, and HCHO in the Arabian Gulf result from the combination of intense solar radiation with high levels of reactive VOCs (Bourtsoukidis et al., 2019; Pfannerstill et al., 2019) and NOx and are accompanied by the highest levels of gas-phase organic nitrates observed during AQABA, with absolute mixing ratios up to 2.5 ppbv on the approach to Kuwait. In conclusion, our NOx NOy measurements and the OPE values derived from them confirm the exceptional photochemical activity in the Arabian Gulf.
During the AQABA campaign in the summer of 2017, we collected a unique NOx and NOy data set that covers the Mediterranean Sea, the Red Sea, and the Arabian Gulf, which are regions with only few previously published observational data sets. The highest median NOx and NOz mixing ratios were observed in the Arabian Gulf (NOx: 1.6 ppbv; NOz: 1.5 ppbv), followed by the Red Sea (NOx: 1.0 ppbv; NOz: 0.7 ppbv) and the Mediterranean Sea (NOx: 0.3 ppbv; NOz: 0.7 ppbv). Night-time losses of NO2 exceeded daytime losses by factors of 2.8 and 2.9 in the Arabian Gulf and the Red Sea, respectively, whereas daytime losses were 2.5 times higher in the Mediterranean Sea, which is a result of consistently high daytime OH concentrations.
The derivation of NOx lifetimes enabled us to calculate the NOx source strength required to reproduce the observed mixing ratios and indicated that HONO photolysis was a significant source of NOx in the Mediterranean Sea. The strong correlation between NOx and SO2 in air masses that were impacted by fresh emissions of NOx indicated that ships are the dominant source of NOx throughout the AQABA campaign. HONO may have been generated on particulate nitrate, possibly associated with black carbon that has been processed (to contain sulfate, organics, and nitrate) as the ship plumes evolve chemically.
The fractional contributions to NOx of NOy and the various components of NOz were highly variable in the three regions. The lowest regional mean contribution of NOx to NOy (i.e. most aged air masses) was found in the Mediterranean Sea with 41 % compared to 47 % in the Red Sea and 46 % in the Arabian Gulf. Of the NOz trace gases, HNO3 represented the most important contribution to NOy with 39 % in the Arabian Gulf, 25 % in the Red Sea, and 35 % in the Mediterranean Sea. A clear regional variability was observed for the contribution of organic nitrates, with the highest value (16 % in the Red Sea) related to the concurrent availability of precursor NOx and VOCs from the oil and gas industry. Comparable figures were derived for the Arabian Gulf and the Mediterranean Sea, with 10 % and 11 %, respectively. pNit (particle diameter < 1 µm) contributed only a few percent, with the largest value (10 %) found in the Mediterranean Sea. HONO and ClNO2 were generally only minor components (< 3 %) of NOz. Future studies on the reactive nitrogen budget in the AQABA region might benefit from longer stationary measurements (e.g. to identify diurnal patterns), together with the detection of more speciated NOz compounds (especially HNO3 and ONs).
The NOx and NOz data sets are available at https://doi.org/10.5281/zenodo.4746367 (Friedrich and Crowley, 2021). Other data sets (e.g. HONO, OH, SO2) can be obtained via the person responsible on request.
The supplement related to this article is available online at: https://doi.org/10.5194/acp-21-7473-2021-supplement.
NF analysed the NOx and NOy data sets and wrote the article. NF and JNC operated the TD-CRDS. PE and JNC provided CIMS measurements of SO2 and ClNO2. JSh, NS, and JNC performed and evaluated ONs measurements. JSc set up and processed data from the spectral radiometer. DD, BH, IT, and HF contributed NO, NO2, HCHO, and CO measurements. MM, RR, ST, and HH provided OH concentrations. EYP, NW, and JW were responsible for the OH reactivity measurements. JB and FD performed measurements with the AMS and OPC instruments. HS, GL, and YC contributed the HONO data set. JL designed the AQABA campaign. All authors contributed to the writing of the article.
The authors declare that they have no conflict of interest.
The authors gratefully acknowledge the NOAA Air Resources Laboratory (ARL) for the provision of the HYSPLIT transport and dispersion model and READY website (https://www.ready.noaa.gov, last access: 10 May 2021) used in this publication. We thank the whole crew of the Kommandor Iona and Hays Ships for their support, as well as Marcel Dorf for organising the campaign.
The article processing charges for this open-access publication were covered by the Max Planck Society.
This paper was edited by Eleanor Browne and reviewed by two anonymous referees.
Acker, K., Febo, A., Trick, S., Perrino, C., Bruno, P., Wiesen, P., Moller, D., Wieprecht, W., Auel, R., Giusto, M., Geyer, A., Platt, U., and Allegrini, I.: Nitrous acid in the urban area of Rome, Atmos. Environ., 40, 3123–3133, https://doi.org/10.1016/j.atmosenv.2006.01.028, 2006.
Alahmadi, S., Al-Ahmadi, K., and Almeshari, M.: Spatial variation in the association between NO2 concentrations and shipping emissions in the Red Sea, Sci. Total Environ., 676, 131–143, https://doi.org/10.1016/j.scitotenv.2019.04.161, 2019.
Aldener, M., Brown, S. S., Stark, H., Williams, E. J., Lerner, B. M., Kuster, W. C., Goldan, P. D., Quinn, P. K., Bates, T. S., Fehsenfeld, F. C., and Ravishankara, A. R.: Reactivity and loss mechanisms of NO3 and N2O5 in a polluted marine environment: Results from in situ measurements during New England Air Quality Study 2002, J. Geophys. Res.-Atmos., 111, D23S73, https://doi.org/10.1029/2006JD007252, 2006.
Alsharhan, A. S.: Petroleum geology and potential hydrocarbon plays in the Gulf of Suez rift basin, Egypt, AAPG Bull., 87, 143–180, 2003.
Altshuller, A. P.: Production of Aldehydes as Primary Emissions and from Secondary Atmospheric Reactions of Alkenes and Alkanes during the Night and Early Morning Hours, Atmos. Environ. A-Gen., 27, 21–32, https://doi.org/10.1016/0960-1686(93)90067-9, 1993.
Beirle, S., Platt, U., von Glasow, R., Wenig, M., and Wagner, T.: Estimate of nitrogen oxide emissions from shipping by satellite remote sensing, Geophys. Res. Lett., 31, L18102, https://doi.org/10.1029/2004gl020312, 2004.
Berresheim, H., Plass-Dülmer, C., Elste, T., Mihalopoulos, N., and Rohrer, F.: OH in the coastal boundary layer of Crete during MINOS: Measurements and relationship with ozone photolysis, Atmos. Chem. Phys., 3, 639–649, https://doi.org/10.5194/acp-3-639-2003, 2003.
Bohn, B., Corlett, G. K., Gillmann, M., Sanghavi, S., Stange, G., Tensing, E., Vrekoussis, M., Bloss, W. J., Clapp, L. J., Kortner, M., Dorn, H.-P., Monks, P. S., Platt, U., Plass-Dülmer, C., Mihalopoulos, N., Heard, D. E., Clemitshaw, K. C., Meixner, F. X., Prevot, A. S. H., and Schmitt, R.: Photolysis frequency measurement techniques: results of a comparison within the ACCENT project, Atmos. Chem. Phys., 8, 5373–5391, https://doi.org/10.5194/acp-8-5373-2008, 2008.
Bourtsoukidis, E., Ernle, L., Crowley, J. N., Lelieveld, J., Paris, J.-D., Pozzer, A., Walter, D., and Williams, J.: Non-methane hydrocarbon (C2–C8) sources and sinks around the Arabian Peninsula, Atmos. Chem. Phys., 19, 7209–7232, https://doi.org/10.5194/acp-19-7209-2019, 2019.
Bourtsoukidis, E., Pozzer, A., Sattler, T., Matthaios, V. N., Ernle, L., Edtbauer, A., Fischer, H., Könemann, T., Osipov, S., Paris, J. D., Pfannerstill, E. Y., Stönner, C., Tadic, I., Walter, D., Wang, N., Lelieveld, J., and Williams, J.: The Red Sea Deep Water is a potent source of atmospheric ethane and propane, Nat. Commun., 11, 447, https://doi.org/10.1038/s41467-020-14375-0, 2020.
Burkholder, J. B., Sander, S. P., Abbatt, J., Barker, J. R., Huie, R. E., Kolb, C. E., Kurylo, M. J., Orkin, V. L., Wilmouth, D. M., and Wine, P. H.: Chemical Kinetics and Photochemical Data for Use in Atmospheric Studies, Evaluation No. 18, JPL Publication 15-10, Jet Propulsion Laboratory, Pasadena, available at: http://jpldataeval.jpl.nasa.gov (last access: 10 May 2021), 2015.
Capaldo, K., Corbett, J. J., Kasibhatla, P., Fischbeck, P., and Pandis, S. N.: Effects of ship emissions on sulphur cycling and radiative climate forcing over the ocean, Nature, 400, 743–746, https://doi.org/10.1038/23438, 1999.
Celik, S., Drewnick, F., Fachinger, F., Brooks, J., Darbyshire, E., Coe, H., Paris, J.-D., Eger, P. G., Schuladen, J., Tadic, I., Friedrich, N., Dienhart, D., Hottmann, B., Fischer, H., Crowley, J. N., Harder, H., and Borrmann, S.: Influence of vessel characteristics and atmospheric processes on the gas and particle phase of ship emission plumes: in situ measurements in the Mediterranean Sea and around the Arabian Peninsula, Atmos. Chem. Phys., 20, 4713–4734, https://doi.org/10.5194/acp-20-4713-2020, 2020.
Chameides, W. L., Stedman, D. H., Dickerson, R. R., Rusch, D. W., and Cicerone, R. J.: Nox Production in Lightning, J. Atmos. Sci., 34, 143–149, https://doi.org/10.1175/1520-0469(1977)034<0143:Npil>2.0.Co;2, 1977.
Cooper, D. A.: Exhaust emissions from ships at berth, Atmos. Environ., 37, 3817–3830, https://doi.org/10.1016/S1352-2310(03)00446-1, 2003.
Dai, J. and Wang, T.: Impact of International Shipping Emissions on Ozone and PM2.5: The Important Role of HONO and ClNO2, Atmos. Chem. Phys. Discuss. [preprint], https://doi.org/10.5194/acp-2020-1185, in review, 2021.
Dalsøren, S. B., Eide, M. S., Endresen, Ø., Mjelde, A., Gravir, G., and Isaksen, I. S. A.: Update on emissions and environmental impacts from the international fleet of ships: the contribution from major ship types and ports, Atmos. Chem. Phys., 9, 2171–2194, https://doi.org/10.5194/acp-9-2171-2009, 2009.
Daum, P. H., Kleinman, L., Imre, D. G., Nunnermacker, L. J., Lee, Y. N., Springston, S. R., Newman, L., and Weinstein-Lloyd, J.: Analysis of the processing of Nashville urban emissions on July 3 and July 18, 1995, J. Geophys. Res.-Atmos., 105, 9155–9164, https://doi.org/10.1029/1999jd900997, 2000.
Davis, D. D., Crawford, J., Chen, G., Chameides, W., Liu, S., Bradshaw, J., Sandholm, S., Sachse, G., Gregory, G., Anderson, B., Barrick, J., Bachmeier, A., Collins, J., Browell, E., Blake, D., Rowland, S., Kondo, Y., Singh, H., Talbot, R., Heikes, B., Merrill, J., Rodriguez, J., and Newell, R. E.: Assessment of ozone photochemistry in the western North Pacific as inferred from PEM-West A observations during the fall 1991, J. Geophys. Res.-Atmos., 101, 2111–2134, https://doi.org/10.1029/95jd02755, 1996.
Day, D. A., Dillon, M. B., Wooldridge, P. J., Thornton, J. A., Rosen, R. S., Wood, E. C., and Cohen, R. C.: On alkyl nitrates, O3, and the “missing NOy”, J. Geophys. Res.-Atmos., 108, 4501, https://doi.org/10.1029/2003jd003685, 2003.
DeCarlo, P. F., Kimmel, J. R., Trimborn, A., Northway, M. J., Jayne, J. T., Aiken, A. C., Gonin, M., Fuhrer, K., Horvath, T., Docherty, K. S., Worsnop, D. R., and Jimenez, J. L.: Field-deployable, high-resolution, time-of-flight aerosol mass spectrometer, Anal. Chem., 78, 8281–8289, https://doi.org/10.1021/ac061249n, 2006.
Delaria, E. R., Vieira, M., Cremieux, J., and Cohen, R. C.: Measurements of NO and NO2 exchange between the atmosphere and Quercus agrifolia, Atmos. Chem. Phys., 18, 14161–14173, https://doi.org/10.5194/acp-18-14161-2018, 2018.
Delaria, E. R. and Cohen, R. C.: A model-based analysis of foliar NOx deposition, Atmos. Chem. Phys., 20, 2123–2141, https://doi.org/10.5194/acp-20-2123-2020, 2020.
Dickerson, R. R., Rhoads, K. P., Carsey, T. P., Oltmans, S. J., Burrows, J. P., and Crutzen, P. J.: Ozone in the remote marine boundary layer: A possible role for halogens, J. Geophys. Res.-Atmos., 104, 21385–21395, 1999.
Diesch, J.-M., Drewnick, F., Klimach, T., and Borrmann, S.: Investigation of gaseous and particulate emissions from various marine vessel types measured on the banks of the Elbe in Northern Germany, Atmos. Chem. Phys., 13, 3603–3618, https://doi.org/10.5194/acp-13-3603-2013, 2013.
Dodge, M. C.: Formaldehyde Production in Photochemical Smog as Predicted by 3 State-of-the-Science Chemical Oxidant Mechanisms, J. Geophys. Res.-Atmos., 95, 3635–3648, https://doi.org/10.1029/JD095iD04p03635, 1990.
Duncan, B. N., Yoshida, Y., Olson, J. R., Sillman, S., Martin, R. V., Lamsal, L., Hu, Y. T., Pickering, K. E., Retscher, C., Allen, D. J., and Crawford, J. H.: Application of OMI observations to a space-based indicator of NOx and VOC controls on surface ozone formation, Atmos. Environ., 44, 2213–2223, https://doi.org/10.1016/j.atmosenv.2010.03.010, 2010.
Edtbauer, A., Stönner, C., Pfannerstill, E. Y., Berasategui, M., Walter, D., Crowley, J. N., Lelieveld, J., and Williams, J.: A new marine biogenic emission: methane sulfonamide (MSAM), dimethyl sulfide (DMS), and dimethyl sulfone (DMSO2) measured in air over the Arabian Sea, Atmos. Chem. Phys., 20, 6081–6094, https://doi.org/10.5194/acp-20-6081-2020, 2020.
Eger, P. G., Friedrich, N., Schuladen, J., Shenolikar, J., Fischer, H., Tadic, I., Harder, H., Martinez, M., Rohloff, R., Tauer, S., Drewnick, F., Fachinger, F., Brooks, J., Darbyshire, E., Sciare, J., Pikridas, M., Lelieveld, J., and Crowley, J. N.: Shipborne measurements of ClNO2 in the Mediterranean Sea and around the Arabian Peninsula during summer, Atmos. Chem. Phys., 19, 12121–12140, https://doi.org/10.5194/acp-19-12121-2019, 2019a.
Eger, P. G., Helleis, F., Schuster, G., Phillips, G. J., Lelieveld, J., and Crowley, J. N.: Chemical ionization quadrupole mass spectrometer with an electrical discharge ion source for atmospheric trace gas measurement, Atmos. Meas. Tech., 12, 1935–1954, https://doi.org/10.5194/amt-12-1935-2019, 2019b.
Elshorbany, Y. F., Kurtenbach, R., Wiesen, P., Lissi, E., Rubio, M., Villena, G., Gramsch, E., Rickard, A. R., Pilling, M. J., and Kleffmann, J.: Oxidation capacity of the city air of Santiago, Chile, Atmos. Chem. Phys., 9, 2257–2273, https://doi.org/10.5194/acp-9-2257-2009, 2009.
Elshorbany, Y. F., Steil, B., Brühl, C., and Lelieveld, J.: Impact of HONO on global atmospheric chemistry calculated with an empirical parameterization in the EMAC model, Atmos. Chem. Phys., 12, 9977–10000, https://doi.org/10.5194/acp-12-9977-2012, 2012.
Eyring, V., Isaksen, I. S. A., Berntsen, T., Collins, W. J., Corbett, J. J., Endresen, O., Grainger, R. G., Moldanova, J., Schlager, H., and Stevenson, D. S.: Transport impacts on atmosphere and climate: Shipping, Atmos. Environ., 44, 4735–4771, https://doi.org/10.1016/j.atmosenv.2009.04.059, 2010.
Fischer, H., Kormann, R., Klüpfel, T., Gurk, Ch., Königstedt, R., Parchatka, U., Mühle, J., Rhee, T. S., Brenninkmeijer, C. A. M., Bonasoni, P., and Stohl, A.: Ozone production and trace gas correlations during the June 2000 MINATROC intensive measurement campaign at Mt. Cimone, Atmos. Chem. Phys., 3, 725–738, https://doi.org/10.5194/acp-3-725-2003, 2003.
Fischer, H., Pozzer, A., Schmitt, T., Jöckel, P., Klippel, T., Taraborrelli, D., and Lelieveld, J.: Hydrogen peroxide in the marine boundary layer over the South Atlantic during the OOMPH cruise in March 2007, Atmos. Chem. Phys., 15, 6971–6980, https://doi.org/10.5194/acp-15-6971-2015, 2015.
Fried, A., McKeen, S., Sewell, S., Harder, J., Henry, B., Goldan, P., Kuster, W., Williams, E., Baumann, K., Shetter, R., and Cantrell, C.: Photochemistry of formaldehyde during the 1993 Tropospheric OH Photochemistry Experiment, J. Geophys. Res.-Atmos., 102, 6283–6296, https://doi.org/10.1029/96jd03249, 1997.
Friedrich, N. and Crowley, J. N.: Reactive nitrogen around the Arabian Peninsula and in the Mediterranean Sea during the 2017 AQABA ship campaign, Zenodo [dataset], https://doi.org/10.5281/zenodo.4746367, 2021.
Friedrich, N., Tadic, I., Schuladen, J., Brooks, J., Darbyshire, E., Drewnick, F., Fischer, H., Lelieveld, J., and Crowley, J. N.: Measurement of NOx and NOy with a thermal dissociation cavity ring-down spectrometer (TD-CRDS): instrument characterisation and first deployment, Atmos. Meas. Tech., 13, 5739–5761, https://doi.org/10.5194/amt-13-5739-2020, 2020.
Garcia, A. R., Volkamer, R., Molina, L. T., Molina, M. J., Samuelson, J., Mellqvist, J., Galle, B., Herndon, S. C., and Kolb, C. E.: Separation of emitted and photochemical formaldehyde in Mexico City using a statistical analysis and a new pair of gas-phase tracers, Atmos. Chem. Phys., 6, 4545–4557, https://doi.org/10.5194/acp-6-4545-2006, 2006.
Ge, B. Z., Sun, Y. L., Liu, Y., Dong, H. B., Ji, D. S., Jiang, Q., Li, J., and Wang, Z. F.: Nitrogen dioxide measurement by cavity attenuated phase shift spectroscopy (CAPS) and implications in ozone production efficiency and nitrate formation in Beijing, China, J. Geophys. Res.-Atmos., 118, 9499–9509, https://doi.org/10.1002/jgrd.50757, 2013.
George, C., Ammann, M., D'Anna, B., Donaldson, D. J., and Nizkorodov, S. A.: Heterogeneous Photochemistry in the Atmosphere, Chem. Rev., 115, 4218–4258, https://doi.org/10.1021/cr500648z, 2015.
Heland, J., Kleffmann, J., Kurtenbach, R., and Wiesen, P.: A new instrument to measure gaseous nitrous acid (HONO) in the atmosphere, Environ. Sci. Technol., 35, 3207–3212, https://doi.org/10.1021/es000303t, 2001.
Isakson, J., Persson, T. A., and Lindgren, E. S.: Identification and assessment of ship emissions and their effects in the harbour of G(o)over-circleteborg, Sweden, Atmos. Environ., 35, 3659–3666, https://doi.org/10.1016/S1352-2310(00)00528-8, 2001.
IUPAC: Task Group on Atmospheric Chemical Kinetic Data Evaluation, edited by: Ammann, M., Cox, R. A., Crowley, J. N., Herrmann, H., Jenkin, M. E., McNeill, V. F., Mellouki, A., Rossi, M. J., Troe, J., and Wallington, T. J., available at: http://iupac.pole-ether.fr/index.html (last access: 10 May 2021), 2020.
Jaffe, D. A., Honrath, R. E., Zhang, L., Akimoto, H., Shimizu, A., Mukai, H., Murano, K., Hatakeyama, S., and Merrill, J.: Measurements of NO, NOy, CO and O3 and estimation of the ozone production rate at Oki Island, Japan, during PEM-West, J. Geophys. Res.-Atmos., 101, 2037–2048, https://doi.org/10.1029/95jd01699, 1996.
Jimenez, J. L., Jayne, J. T., Shi, Q., Kolb, C. E., Worsnop, D. R., Yourshaw, I., Seinfeld, J. H., Flagan, R. C., Zhang, X. F., Smith, K. A., Morris, J. W., and Davidovits, P.: Ambient aerosol sampling using the Aerodyne Aerosol Mass Spectrometer, J. Geophys. Res.-Atmos., 108, 8425, https://doi.org/10.1029/2001jd001213, 2003.
Johansson, L., Jalkanen, J. P., and Kukkonen, J.: Global assessment of shipping emissions in 2015 on a high spatial and temporal resolution, Atmos. Environ., 167, 403–415, https://doi.org/10.1016/j.atmosenv.2017.08.042, 2017.
Kalberer, M., Ammann, M., Arens, F., Gaggeler, H. W., and Baltensperger, U.: Heterogeneous formation of nitrous acid (HONO) on soot aerosol particles, J. Geophys. Res.-Atmos., 104, 13825–13832, 1999.
Kercher, J. P., Riedel, T. P., and Thornton, J. A.: Chlorine activation by N2O5: simultaneous, in situ detection of ClNO2 and N2O5 by chemical ionization mass spectrometry, Atmos. Meas. Tech., 2, 193–204, https://doi.org/10.5194/amt-2-193-2009, 2009.
Khan, A. R., Al-Awadi, L., and Al-Rashidi, M. S.: Control of ammonia and urea emissions from urea manufacturing facilities of Petrochemical Industries Company (PIC), Kuwait, J. Air Waste Ma., 66, 609–618, https://doi.org/10.1080/10962247.2016.1145154, 2016.
Kleffmann, J., Becker, K. H., Lackhoff, M., and Wiesen, P.: Heterogeneous conversion of NO2 on carbonaceous surfaces, Phys. Chem. Chem. Phys., 1, 5443–5450, https://doi.org/10.1039/a905545b, 1999.
Klippel, T., Fischer, H., Bozem, H., Lawrence, M. G., Butler, T., Jöckel, P., Tost, H., Martinez, M., Harder, H., Regelin, E., Sander, R., Schiller, C. L., Stickler, A., and Lelieveld, J.: Distribution of hydrogen peroxide and formaldehyde over Central Europe during the HOOVER project, Atmos. Chem. Phys., 11, 4391–4410, https://doi.org/10.5194/acp-11-4391-2011, 2011.
Ladstätter-Weißenmayer, A., Heland, J., Kormann, R., von Kuhlmann, R., Lawrence, M. G., Meyer-Arnek, J., Richter, A., Wittrock, F., Ziereis, H., and Burrows, J. P.: Transport and build-up of tropospheric trace gases during the MINOS campaign: comparision of GOME, in situ aircraft measurements and MATCH-MPIC-data, Atmos. Chem. Phys., 3, 1887–1902, https://doi.org/10.5194/acp-3-1887-2003, 2003.
Ladstatter-Weissenmayer, A., Kanakidou, M., Meyer-Arnek, J., Dermitzaki, E. V., Richter, A., Vrekoussis, M., Wittrock, F., and Burrows, J. P.: Pollution events over the East Mediterranean: Synergistic use of GOME, ground-based and sonde observations and models, Atmos. Environ., 41, 7262–7273, https://doi.org/10.1016/j.atmosenv.2007.05.031, 2007.
Lammel, G. and Perner, D.: The Atmospheric Aerosol as a Source of Nitrous-Acid in the Polluted Atmosphere, J. Aerosol Sci., 19, 1199–1202, https://doi.org/10.1016/0021-8502(88)90135-8, 1988.
Lange, L., Hoor, P., Helas, G., Fischer, H., Brunner, D., Scheeren, B., Williams, J., Wong, S., Wohlfrorn, K. H., Arnold, F., Strom, J., Krejci, R., Lelieveld, J., and Andreae, M. O.: Detection of lightning-produced NO in the midlatitude upper troposphere during STREAM 1998, J. Geophys. Res.-Atmos., 106, 27777–27785, https://doi.org/10.1029/2001jd900210, 2001.
Ledoux, F., Roche, C., Cazier, F., Beaugard, C., and Courcot, D.: Influence of ship emissions on NOx, SO2, O3 and PM concentrations in a North-Sea harbor in France, J. Environ. Sci.-China, 71, 56–66, https://doi.org/10.1016/j.jes.2018.03.030, 2018.
Lelieveld, J., Hoor, P., Jöckel, P., Pozzer, A., Hadjinicolaou, P., Cammas, J.-P., and Beirle, S.: Severe ozone air pollution in the Persian Gulf region, Atmos. Chem. Phys., 9, 1393–1406, https://doi.org/10.5194/acp-9-1393-2009, 2009.
Lelieveld, J., Hadjinicolaou, P., Kostopoulou, E., Chenoweth, J., El Maayar, M., Giannakopoulos, C., Hannides, C., Lange, M. A., Tanarhte, M., Tyrlis, E., and Xoplaki, E.: Climate change and impacts in the Eastern Mediterranean and the Middle East, Climatic Change, 114, 667–687, https://doi.org/10.1007/s10584-012-0418-4, 2012.
Lenner, M.: Nitrogen-Dioxide in Exhaust Emissions from Motor-Vehicles, Atmos. Environ., 21, 37–43, https://doi.org/10.1016/0004-6981(87)90268-X, 1987.
Lewis, E. R. and Schwartz, S. E.: Sea salt aerosol production: mechanisms, methods, measurements and models: a critical review, Geophysical monograph, 152, American Geophysical Union, Washington, DC, xii, 413 pp., 2004.
Li, J. S., Parchatka, U., and Fischer, H.: Development of field-deployable QCL sensor for simultaneous detection of ambient N2O and CO, Sensor Actuat. B-Chem, 182, 659–667, https://doi.org/10.1016/j.snb.2013.03.073, 2013.
Lin, W., Xu, X., Ge, B., and Liu, X.: Gaseous pollutants in Beijing urban area during the heating period 2007–2008: variability, sources, meteorological, and chemical impacts, Atmos. Chem. Phys., 11, 8157–8170, https://doi.org/10.5194/acp-11-8157-2011, 2011.
Liu, S. C., Trainer, M., Fehsenfeld, F. C., Parrish, D. D., Williams, E. J., Fahey, D. W., Hubler, G., and Murphy, P. C.: Ozone Production in the Rural Troposphere and the Implications for Regional and Global Ozone Distributions, J. Geophys. Res.-Atmos., 92, 4191–4207, https://doi.org/10.1029/JD092iD04p04191, 1987.
Logan, J. A.: Nitrogen-Oxides in the Troposphere – Global and Regional Budgets, J. Geophys. Res.-Oceans, 88, 785–807, https://doi.org/10.1029/JC088iC15p10785, 1983.
Longfellow, C. A., Ravishankara, A. R., and Hanson, D. R.: Reactive uptake on hydrocarbon soot: Focus on NO2, J. Geophys. Res.-Atmos., 104, 13833–13840, 1999.
Ma, J. Z., Liu, Y. C., Han, C., Ma, Q. X., Liu, C., and He, H.: Review of heterogeneous photochemical reactions of NOy on aerosol – A possible daytime source of nitrous acid (HONO) in the atmosphere, J. Environ. Sci., 25, 326–334, https://doi.org/10.1016/S1001-0742(12)60093-X, 2013.
Mallik, C., Tomsche, L., Bourtsoukidis, E., Crowley, J. N., Derstroff, B., Fischer, H., Hafermann, S., Hüser, I., Javed, U., Keßel, S., Lelieveld, J., Martinez, M., Meusel, H., Novelli, A., Phillips, G. J., Pozzer, A., Reiffs, A., Sander, R., Taraborrelli, D., Sauvage, C., Schuladen, J., Su, H., Williams, J., and Harder, H.: Oxidation processes in the eastern Mediterranean atmosphere: evidence from the modelling of HOx measurements over Cyprus, Atmos. Chem. Phys., 18, 10825–10847, https://doi.org/10.5194/acp-18-10825-2018, 2018.
Mamane, Y., and Gottlieb, J.: Heterogeneous reaction of nitrogen oxides on sea salt and mineral particles – A single particle approach, J. Aerosol Sci., 21, 225–228, 1990.
Marmer, E. and Langmann, B.: Impact of ship emissions on the Mediterranean summertime pollution and climate: A regional model study, Atmos. Environ., 39, 4659–4669, https://doi.org/10.1016/j.atmosenv.2005.04.014, 2005.
Martinez, M., Harder, H., Kubistin, D., Rudolf, M., Bozem, H., Eerdekens, G., Fischer, H., Klüpfel, T., Gurk, C., Königstedt, R., Parchatka, U., Schiller, C. L., Stickler, A., Williams, J., and Lelieveld, J.: Hydroxyl radicals in the tropical troposphere over the Suriname rainforest: airborne measurements, Atmos. Chem. Phys., 10, 3759–3773, https://doi.org/10.5194/acp-10-3759-2010, 2010.
Metzger, S., Mihalopoulos, N., and Lelieveld, J.: Importance of mineral cations and organics in gas-aerosol partitioning of reactive nitrogen compounds: case study based on MINOS results, Atmos. Chem. Phys., 6, 2549–2567, https://doi.org/10.5194/acp-6-2549-2006, 2006.
Meusel, H., Tamm, A., Kuhn, U., Wu, D., Leifke, A. L., Fiedler, S., Ruckteschler, N., Yordanova, P., Lang-Yona, N., Pöhlker, M., Lelieveld, J., Hoffmann, T., Pöschl, U., Su, H., Weber, B., and Cheng, Y.: Emission of nitrous acid from soil and biological soil crusts represents an important source of HONO in the remote atmosphere in Cyprus, Atmos. Chem. Phys., 18, 799–813, https://doi.org/10.5194/acp-18-799-2018, 2018.
Monge, M. E., D'Anna, B., Mazri, L., Giroir-Fendler, A., Ammann, M., Donaldson, D. J., and George, C.: Light changes the atmospheric reactivity of soot, P. Natl. Acad. Sci. USA, 107, 6605–6609, https://doi.org/10.1073/pnas.0908341107, 2010.
Ninneman, M., Lu, S., Lee, P., McQueen, J., Huang, J. P., Demerjian, K., and Schwab, J.: Observed and Model-Derived Ozone Production Efficiency over Urban and Rural New York State, Atmosphere-Basel, 8, 126, https://doi.org/10.3390/atmos8070126, 2017.
Nunnermacker, L. J., Kleinman, L. I., Imre, D., Daum, P. H., Lee, Y. N., Lee, J. H., Springston, S. R., Newman, L., and Gillani, N.: NOy lifetimes and O3 production efficiencies in urban and power plant plumes: Analysis of field data, J. Geophys. Res.-Atmos., 105, 9165–9176, https://doi.org/10.1029/1999jd900753, 2000.
Nunnermacker, L. J., Weinstein-Lloyd, J., Kleinman, L., Daum, P. H., Lee, Y. N., Springston, S. R., Klotz, P., Newman, L., Neuroth, G., and Hyde, P.: Ground-based and aircraft measurements of trace gases in Phoenix, Arizona (1998), Atmos. Environ., 38, 4941–4956, https://doi.org/10.1016/j.atmosenv.2004.04.033, 2004.
Oertel, C., Matschullat, J., Zurba, K., Zimmermann, F., and Erasmi, S.: Greenhouse gas emissions from soils A review, Chem. Erde-Geochem., 76, 327–352, https://doi.org/10.1016/j.chemer.2016.04.002, 2016.
Olszyna, K. J., Bailey, E. M., Simonaitis, R., and Meagher, J. F.: O3 and NOy relationships at a rural Site, J. Geophys. Res.-Atmos., 99, 14557–14563, https://doi.org/10.1029/94jd00739, 1994.
Osthoff, H. D., Roberts, J. M., Ravishankara, A. R., Williams, E. J., Lerner, B. M., Sommariva, R., Bates, T. S., Coffman, D., Quinn, P. K., Dibb, J. E., Stark, H., Burkholder, J. B., Talukdar, R. K., Meagher, J., Fehsenfeld, F. C., and Brown, S. S.: High levels of nitryl chloride in the polluted subtropical marine boundary layer, Nat. Geosci., 1, 324–328, 2008.
Parrish, D. D., Ryerson, T. B., Mellqvist, J., Johansson, J., Fried, A., Richter, D., Walega, J. G., Washenfelder, R. A., de Gouw, J. A., Peischl, J., Aikin, K. C., McKeen, S. A., Frost, G. J., Fehsenfeld, F. C., and Herndon, S. C.: Primary and secondary sources of formaldehyde in urban atmospheres: Houston Texas region, Atmos. Chem. Phys., 12, 3273–3288, https://doi.org/10.5194/acp-12-3273-2012, 2012.
Pfannerstill, E. Y., Wang, N., Edtbauer, A., Bourtsoukidis, E., Crowley, J. N., Dienhart, D., Eger, P. G., Ernle, L., Fischer, H., Hottmann, B., Paris, J.-D., Stönner, C., Tadic, I., Walter, D., Lelieveld, J., and Williams, J.: Shipborne measurements of total OH reactivity around the Arabian Peninsula and its role in ozone chemistry, Atmos. Chem. Phys., 19, 11501–11523, https://doi.org/10.5194/acp-19-11501-2019, 2019.
Platt, U., Perner, D., Harris, G. W., Winer, A. M., and Pitts, J. N.: Observations of Nitrous-Acid in an Urban Atmosphere by Differential Optical-Absorption, Nature, 285, 312–314, https://doi.org/10.1038/285312a0, 1980.
Regelin, E., Harder, H., Martinez, M., Kubistin, D., Tatum Ernest, C., Bozem, H., Klippel, T., Hosaynali-Beygi, Z., Fischer, H., Sander, R., Jöckel, P., Königstedt, R., and Lelieveld, J.: HOx measurements in the summertime upper troposphere over Europe: a comparison of observations to a box model and a 3-D model, Atmos. Chem. Phys., 13, 10703–10720, https://doi.org/10.5194/acp-13-10703-2013, 2013.
Richter, A., Eyring, V., Burrows, J. P., Bovensmann, H., Lauer, A., Sierk, B., and Crutzen, P. J.: Satellite measurements of NO2 from international shipping emissions, Geophys. Res. Lett., 31, L23110, https://doi.org/10.1029/2004gl020822, 2004.
Rickard, A. R., Salisbury, G., Monks, P. S., Lewis, A. C., Baugitte, S., Bandy, B. J., Clemitshaw, K. C., and Penkett, S. A.: Comparison of measured ozone production efficiencies in the marine boundary layer at two European coastal sites under different pollution regimes, J. Atmos. Chem., 43, 107–134, https://doi.org/10.1023/A:1019970123228, 2002.
Rolph, G., Stein, A., and Stunder, B.: Real-time environmental applications and display system: READY, Environ. Modell. Softw., 95, 210–228, https://doi.org/10.1016/j.envsoft.2017.06.025, 2017.
Romer, P. S., Duffey, K. C., Wooldridge, P. J., Allen, H. M., Ayres, B. R., Brown, S. S., Brune, W. H., Crounse, J. D., de Gouw, J., Draper, D. C., Feiner, P. A., Fry, J. L., Goldstein, A. H., Koss, A., Misztal, P. K., Nguyen, T. B., Olson, K., Teng, A. P., Wennberg, P. O., Wild, R. J., Zhang, L., and Cohen, R. C.: The lifetime of nitrogen oxides in an isoprene-dominated forest, Atmos. Chem. Phys., 16, 7623–7637, https://doi.org/10.5194/acp-16-7623-2016, 2016.
Roussel, P. B., Lin, X., Camacho, F., Laszlo, S., Taylor, R., Melo, O. T., Shepson, P. B., Hastie, D. R., and Niki, H.: Observations of ozone and precursor levels at two sites around Toronto, Ontario, during SONTOS 92, Atmos. Environ., 30, 2145–2155, https://doi.org/10.1016/1352-2310(95)00102-6, 1996.
Saxe, H. and Larsen, T.: Air pollution from ships in three Danish ports, Atmos. Environ., 38, 4057–4067, https://doi.org/10.1016/j.atmosenv.2004.03.055, 2004.
Sillman, S.: Ozone production efficiency and loss of NOx in power plant plumes: Photochemical model and interpretation of measurements in Tennessee, J. Geophys. Res.-Atmos., 105, 9189–9202, https://doi.org/10.1029/1999jd901014, 2000.
Sinha, V., Williams, J., Crowley, J. N., and Lelieveld, J.: The Comparative Reactivity Method – a new tool to measure total OH Reactivity in ambient air, Atmos. Chem. Phys., 8, 2213–2227, https://doi.org/10.5194/acp-8-2213-2008, 2008.
Sobanski, N., Schuladen, J., Schuster, G., Lelieveld, J., and Crowley, J. N.: A five-channel cavity ring-down spectrometer for the detection of NO2, NO3, N2O5, total peroxy nitrates and total alkyl nitrates, Atmos. Meas. Tech., 9, 5103–5118, https://doi.org/10.5194/amt-9-5103-2016, 2016.
Stein, A. F., Draxler, R. R., Rolph, G. D., Stunder, B. J. B., Cohen, M. D., and Ngan, F.: NOAA'S HYSPLIT atmospheric transport and dispersion modeling system, B. Am. Meteorol. Soc., 96, 2059–2077, https://doi.org/10.1175/bams-d-14-00110.1, 2015.
Stickler, A., Fischer, H., Williams, J., de Reus, M., Sander, R., Lawrence, M. G., Crowley, J. N., and Lelieveld, J.: Influence of summertime deep convection on formaldehyde in the middle and upper troposphere over Europe, J. Geophys. Res.-Atmos., 111, D14308, https://doi.org/10.1029/2005JD007001, 2006.
Stutz, J., Kim, E. S., Platt, U., Bruno, P., Perrino, C., and Febo, A.: UV-visible absorption cross sections of nitrous acid, J. Geophys. Res.-Atmos., 105, 14585–14592, 2000.
Sun, L., Chen, T. S., Jiang, Y., Zhou, Y., Sheng, L. F., Lin, J. T., Li, J., Dong, C., Wang, C., Wang, X. F., Zhang, Q. Z., Wang, W. X., and Xue, L. K.: Ship emission of nitrous acid (HONO) and its impacts on the marine atmospheric oxidation chemistry, Sci. Total Environ., 735, 139355, https://doi.org/10.1016/j.scitotenv.2020.139355, 2020.
Sun, Y., Wang, L. L., Wang, Y. S., Zhang, D. Q., Quan, L., and Xin, J. Y.: In situ measurements of NO, NO2, NOy, and O3 in Dinghushan (112∘ E, 23∘ N), China during autumn 2008, Atmos. Environ., 44, 2079–2088, https://doi.org/10.1016/j.atmosenv.2010.03.007, 2010.
Tadic, I., Crowley, J. N., Dienhart, D., Eger, P., Harder, H., Hottmann, B., Martinez, M., Parchatka, U., Paris, J.-D., Pozzer, A., Rohloff, R., Schuladen, J., Shenolikar, J., Tauer, S., Lelieveld, J., and Fischer, H.: Net ozone production and its relationship to nitrogen oxides and volatile organic compounds in the marine boundary layer around the Arabian Peninsula, Atmos. Chem. Phys., 20, 6769–6787, https://doi.org/10.5194/acp-20-6769-2020, 2020.
Thieser, J., Schuster, G., Schuladen, J., Phillips, G. J., Reiffs, A., Parchatka, U., Pöhler, D., Lelieveld, J., and Crowley, J. N.: A two-channel thermal dissociation cavity ring-down spectrometer for the detection of ambient NO2, RO2NO2 and RONO2, Atmos. Meas. Tech., 9, 553–576, https://doi.org/10.5194/amt-9-553-2016, 2016.
Trainer, M., Parrish, D. D., Buhr, M. P., Norton, R. B., Fehsenfeld, F. C., Anlauf, K. G., Bottenheim, J. W., Tang, Y. Z., Wiebe, H. A., Roberts, J. M., Tanner, R. L., Newman, L., Bowersox, V. C., Meagher, J. F., Olszyna, K. J., Rodgers, M. O., Wang, T., Berresheim, H., Demerjian, K. L., and Roychowdhury, U. K.: Correlation of Ozone with Noy in Photochemically Aged Air, J. Geophys. Res.-Atmos., 98, 2917–2925, https://doi.org/10.1029/92jd01910, 1993.
Večeřa, Z., Mikuška, P., Smolík, J., Eleftheriadis, K., Bryant, C., Colbeck, I., and Lazaridis, M.: Shipboard Measurements of Nitrogen Dioxide, Nitrous Acid, Nitric Acid and Ozone in the Eastern Mediterranean Sea, Water Air Soil Poll., 8, 117–125, https://doi.org/10.1007/s11267-007-9133-y, 2008.
Wang, J. H., Ge, B. Z., and Wang, Z. F.: Ozone Production Efficiency in Highly Polluted Environments, Current Pollution Reports, 4, 198–207, https://doi.org/10.1007/s40726-018-0093-9, 2018.
Wang, T., Carroll, M. A., Albercook, G. M., Owens, K. R., Duderstadt, K. A., Markevitch, A. N., Parrish, D. D., Holloway, J. S., Fehsenfeld, F. C., Forbes, G., and Ogren, J.: Ground-based measurements of NOx and total reactive oxidized nitrogen (NOy) at Sable Island, Nova Scotia, during the NARE 1993 summer intensive, J. Geophys. Res.-Atmos., 101, 28991–29004, https://doi.org/10.1029/96jd01090, 1996.
Wild, R. J., Edwards, P. M., Dube, W. P., Baumann, K., Edgerton, E. S., Quinn, P. K., Roberts, J. M., Rollins, A. W., Veres, P. R., Warneke, C., Williams, E. J., Yuan, B., and Brown, S. S.: A measurement of total reactive nitrogen, NOy, together with NO2, NO, and O3 via cavity ring-down spectroscopy, Environ. Sci. Technol., 48, 9609–9615, https://doi.org/10.1021/es501896w, 2014.
Wild, R. J., Edwards, P. M., Bates, T. S., Cohen, R. C., de Gouw, J. A., Dubé, W. P., Gilman, J. B., Holloway, J., Kercher, J., Koss, A. R., Lee, L., Lerner, B. M., McLaren, R., Quinn, P. K., Roberts, J. M., Stutz, J., Thornton, J. A., Veres, P. R., Warneke, C., Williams, E., Young, C. J., Yuan, B., Zarzana, K. J., and Brown, S. S.: Reactive nitrogen partitioning and its relationship to winter ozone events in Utah, Atmos. Chem. Phys., 16, 573–583, https://doi.org/10.5194/acp-16-573-2016, 2016.
Williams, E. J., Lerner, B. M., Murphy, P. C., Herndon, S. C., and Zahniser, M. S.: Emissions of NOx, SO2, CO, and HCHO from commercial marine shipping during Texas Air Quality Study (TexAQS) 2006, J. Geophys. Res.-Atmos., 114, D21306, https://doi.org/10.1029/2009jd012094, 2009.
Wojtal, P., Halla, J. D., and McLaren, R.: Pseudo steady states of HONO measured in the nocturnal marine boundary layer: a conceptual model for HONO formation on aqueous surfaces, Atmos. Chem. Phys., 11, 3243–3261, https://doi.org/10.5194/acp-11-3243-2011, 2011.
Wolfe, G. M., Kaiser, J., Hanisco, T. F., Keutsch, F. N., de Gouw, J. A., Gilman, J. B., Graus, M., Hatch, C. D., Holloway, J., Horowitz, L. W., Lee, B. H., Lerner, B. M., Lopez-Hilifiker, F., Mao, J., Marvin, M. R., Peischl, J., Pollack, I. B., Roberts, J. M., Ryerson, T. B., Thornton, J. A., Veres, P. R., and Warneke, C.: Formaldehyde production from isoprene oxidation across NOx regimes, Atmos. Chem. Phys., 16, 2597–2610, https://doi.org/10.5194/acp-16-2597-2016, 2016.
Wolfe, G. M., Nicely, J. M., St. Clair, J. M., Hanisco, T. F., Liao, J., Oman, L. D., Brune, W. B., Miller, D., Thames, A., González Abad, G., Ryerson, T. B., Thompson, C. R., Peischl, J., McKain, K., Sweeney, C., Wennberg, P. O., Kim, M., Crounse, J. D., Hall, S. R., Ullmann, K., Diskin, G., Bui, P., Chang, C., and Dean-Day, J.: Mapping hydroxyl variability throughout the global remote troposphere via synthesis of airborne and satellite formaldehyde observations, P. Natl. Acad. Sci. USA, 116, 11171–11180, https://doi.org/10.1073/pnas.1821661116, 2019.
Womack, C. C., Neuman, J. A., Veres, P. R., Eilerman, S. J., Brock, C. A., Decker, Z. C. J., Zarzana, K. J., Dube, W. P., Wild, R. J., Wooldridge, P. J., Cohen, R. C., and Brown, S. S.: Evaluation of the accuracy of thermal dissociation CRDS and LIF techniques for atmospheric measurement of reactive nitrogen species, Atmos. Meas. Tech., 10, 1911–1926, https://doi.org/10.5194/amt-10-1911-2017, 2017.
Wood, E. C., Herndon, S. C., Onasch, T. B., Kroll, J. H., Canagaratna, M. R., Kolb, C. E., Worsnop, D. R., Neuman, J. A., Seila, R., Zavala, M., and Knighton, W. B.: A case study of ozone production, nitrogen oxides, and the radical budget in Mexico City, Atmos. Chem. Phys., 9, 2499–2516, https://doi.org/10.5194/acp-9-2499-2009, 2009.
Wu, D., Hu, Y. X., McCormick, M. P., Xu, K. M., Liu, Z. Y., Smith, B., Omar, A. H., and Chang, F. L.: Deriving Marine-Boundary-Layer Lapse Rate from Collocated CALIPSO, MODIS, and AMSR-E Data to Study Global Low-Cloud Height Statistics, IEEE Geosci. Remote Sens. Lett., 5, 649–652, https://doi.org/10.1109/Lgrs.2008.2002024, 2008.
Ye, C. X., Zhou, X. L., Pu, D., Stutz, J., Festa, J., Spolaor, M., Tsai, C., Cantrell, C., Mauldin, R. L., Campos, T., Weinheimer, A., Hornbrook, R. S., Apel, E. C., Guenther, A., Kaser, L., Yuan, B., Karl, T., Haggerty, J., Hall, S., Ullmann, K., Smith, J. N., Ortega, J., and Knote, C.: Rapid cycling of reactive nitrogen in the marine boundary layer, Nature, 532, 489–491, https://doi.org/10.1038/nature17195, 2016.
Zorn, S. R., Drewnick, F., Schott, M., Hoffmann, T., and Borrmann, S.: Characterization of the South Atlantic marine boundary layer aerosol using an aerodyne aerosol mass spectrometer, Atmos. Chem. Phys., 8, 4711–4728, https://doi.org/10.5194/acp-8-4711-2008, 2008.