the Creative Commons Attribution 4.0 License.
the Creative Commons Attribution 4.0 License.
 | 17 May 2021
The impact of increasing stratospheric radiative damping on the quasi-biennial oscillation period
Kevin DallaSanta
Larissa Nazarenko
Gavin A. Schmidt
Zhonghai Jin
Stratospheric radiative damping increases as atmospheric carbon dioxide concentration rises. We use the one-dimensional mechanistic models of the quasi-biennial oscillation (QBO) to conduct sensitivity experiments and find that the simulated QBO period shortens due to the enhancing of radiative damping in the stratosphere. This result suggests that increasing stratospheric radiative damping due to rising CO2 may play a role in determining the QBO period in a warming climate along with wave momentum flux entering the stratosphere and tropical vertical residual velocity, both of which also respond to increasing CO2.
- Article
(3700 KB) - Full-text XML
- BibTeX
- EndNote


The quasi-biennial oscillation (QBO) dominates the variability in the equatorial middle and lower stratosphere and is characterized by a downward-propagating zonal wind regime that regularly changes from westerlies to easterlies. The QBO period ranges from 22 to 34 months, with its average being slightly longer than 28 months. The QBO not only manifests itself in the equatorial zonal winds but also leaves an imprint on the temperature in both the tropics and extratropics (Baldwin et al., 2001, and references therein).
The QBO has far-reaching implications for global weather and climate systems. First of all, the QBO exerts a marked influence on the distribution and transport of various chemical constituents such as ozone (O3) (e.g., Hasebe, 1994), water vapor (H2O) (e.g., Kawatani et al., 2014), methane (CH4), nitrous oxide (N2O), hydrogen fluoride (HF), hydrochloric acid (HC1), odd nitrogen species (NOy) (e.g., Zawodny and McCormick, 1991), and volcanic aerosol (Trepte and Hitchman, 1992). Secondly, it is well appreciated that the QBO influences the extratropical circulation in the winter stratosphere, which is commonly known as the Holton–Tan effect (Holton and Tan, 1980; Labitzke, 1982). It has been noted that the effect of the QBO on the extratropical winter stratosphere impacts the severity of stratospheric ozone depletion (e.g., Lait et al., 1989). Furthermore, taking account of the QBO improves the simulation and predictability of the extratropical troposphere (e.g., Marshall and Scaife, 2009). Finally, through its modulation of temperature and vertical wind shear in the vicinity of the tropical tropopause, the QBO influences tropical moist convection (Collimore et al., 2003; Liess and Geller, 2012), the El Niño–Southern Oscillation (ENSO) (Gray et al., 1992; Huang et al., 2012; Hansen et al., 2016), the Hadley circulation (Hitchman and Huesmann, 2009), the tropospheric subtropical jet (Garfinkel and Hartmann, 2011a, b), the boreal summer monsoon (Giorgetta et al., 1999), and the Madden–Julian Oscillation (Yoo and Son, 2016). Intriguingly, the QBO is also reported to influence the activities of tropical cyclones (Gray, 1984; Ho et al., 2009), although this issue is still unsettled (Camargo and Sobel, 2010) and needs further study.
Efforts to understand and simulate the QBO have been ongoing ever since its discovery by Ebdon (1960) and Reed et al. (1961). Lindzen and Holton (1968) and Holton and Lindzen (1972) developed the classical theory of the QBO. Namely, as waves propagate upward, they are attenuated by thermal damping; encounter critical levels; and accelerate and decelerate the mean flow, providing momentum sources for both the westerly and easterly phases of the QBO.
The model of Holton and Lindzen (1972) (hereafter referred to as the HL model) was further simplified by Plumb (1977), the elegance of which made it a standard paradigm for the QBO. In the Boussinesq formulation of Plumb (1977), the QBO period is inversely dependent upon both the momentum flux and thermal dissipation rate. Hamilton (1981) further highlighted the role of the radiative damping rate on both the realistic vertical structure and the realistic period of the QBO.
By adopting higher vertical resolutions and incorporating various gravity wave parameterization schemes, many state-of-the-art climate models have shown the capability to self-consistently simulate the QBO (Scaife et al., 2000; Giorgetta et al., 2002, 2006; Rind et al., 2014, 2020; Geller et al., 2016a; Richter et al., 2020a, b). Given the important implications of the QBO for the global climate system, it is natural to ask how the QBO will change in a warming climate.
Giorgetta and Doege (2005) showed a shortening of the QBO period in their doubled CO2 experiments. They reasoned that both the weakening of the tropical upwelling and the prescribed increase in gravity wave sources lead to the reduction in the QBO period in a warming climate. However, most climate models project a strengthening rather than weakening of tropical upwelling in a warmer climate (Butchart et al., 2006; Butchart, 2014; Li et al., 2008). Employing a model without any parametrized non-orographic gravity waves, Kawatani et al. (2011) demonstrated that the intensifying tropical upwelling in a warming climate dominates the counteracting effect of enhanced wave fluxes and consequently projected a lengthening of the QBO period. Using fixed sources of parametrized gravity waves, Watanabe and Kawatani (2012) also projected an elongation of the QBO period in a warming climate and ascribed it to the stronger tropical upwelling. Analyzing four Coupled Model Intercomparison Project Phase 5 (CMIP5) models that could simulate a reasonable QBO, Kawatani and Hamilton (2013) found that the projected trends of the QBO period were inconsistent in sign. They further investigated the 60-year operational balloon-borne radiosonde observations provided by the Free Berlin University and detected no significant trend in the QBO period. Richter et al. (2020b) investigated the response of the QBO to doubled and quadrupled CO2 climates among 11 models that participated in Phase 1 of the Stratospheric–tropospheric Processes And their Role in Climate QBO initiative (QBOi; Butchart et al., 2018) and found no consensus on how the QBO period would respond to a changing climate. Recently, Butchart et al. (2020) evaluated 10 Coupled Model Intercomparison Project Phase 6 (CMIP6) models with realistic QBO in two shared-socioeconomic-pathway (SSP; Gidden et al., 2019) scenario simulations and surprisingly found that the QBO period shortens in 7 of those 10 models in both SSP3-7.0 and SSP5-8.5 scenarios, although only 2 and 3 models show a significant shortening trend in the respective scenarios.
It is challenging to ascertain the trend of the QBO period in a warming climate. On one hand, a speeding-up of the Brewer–Dobson circulation in a warming climate leads to a lengthening of the QBO period in most climate models. On the other hand, there is a robust increase in the vertical component of the Eliassen–Palm (EP) flux for both eastward- and westward-propagating waves (Richter et al., 2020b; Butchart et al., 2020), indicating that the QBO period shortens due to the enhanced wave driving in a warming climate. The competing effects between enhanced wave driving and a faster Brewer–Dobson circulation suggest that trends in the QBO period are likely to be small and difficult to detect due to the large cycle-to-cycle variability that is reproduced by climate models (Butchart et al., 2020). In addition, uncertainty in the representation of the parameterized gravity waves make it more elusive to detect the trend of the QBO period in a warming climate (Schirber et al., 2015; Richter et al., 2020b).
Given the fact that the QBO period is influenced by the radiative damping (Plumb, 1977; Hamilton, 1981), a natural question to ask is whether it could play a role in the trend of the QBO in a warming climate. Fels (1985) estimated that the radiative damping time under a doubling of CO2 would decrease by about 23 %. His estimate implies a shortening of the QBO period as the radiative damping rate increases.
It is well known that enhanced wave fluxes entering the stratosphere and stronger tropical upwelling individually play a dominant role in determining the trends in the QBO period in a warming climate. Does the competing effect between them leave some room for increasing stratospheric radiative damping to exert an influence on the QBO period? In this paper, we use the HL model to isolate the effect of radiative damping on the QBO period by assuming that the momentum flux entering the stratosphere does not change in our experiments. Observational and modeling studies (Andrews et al., 1987; Kawatani et al., 2009, 2010, 2011; Richter et al., 2020b; Holt et al., 2020) showed that the wave-forcing spectrum is similar to a discrete two-wave spectrum rather than red noise or white noise, all of which are illustrated in Saravanan (1990). Accordingly, the QBO is indeed sensitive to stratospheric radiative damping, and the HL model is suitable for us to conduct the sensitivity analysis.
The remainder of this paper is organized as follows. Section 2 investigates the sensitivity of the QBO period to the radiative damping using HL's original model. Section 3 explores the sensitivity of the QBO period to the radiative damping using a modified HL model where the semiannual forcing is removed. Discussion and conclusions are presented in Sects. 4 and 5, respectively.
In the HL model the governing equation of mean flow emerges after the primitive momentum equation is meridionally averaged over some suitable latitudinal belt over the Equator.
where is mean zonal wind, ρ0 is mean density, is the meridionally averaged vertical Eliassen–Palm flux associated with wave i, the index i refers to the individual waves, Kz is a vertical eddy diffusion coefficient, t is time, z is altitude, and G is semiannual forcing identical to that specified by HL.
The is evaluated with the Wentzel–Kramers–Brillouin (WKB) formalism of Lindzen (1971) for equatorial waves in shear. When only infrared cooling acts to damp the waves, the formulae for are
for the Kelvin wave and
for the mixed Rossby–gravity wave. As in HL, the wavenumber k, the phase speed c, and A0 are chosen to be km), 30 m s−1, and 0.04 m2 s−2 ρ0(17 km), respectively, for the Kelvin wave, while they are equal to km), −30 m s−1, and −0.04 m2 s−2 ρ0(17 km), respectively, for the mixed Rossby–gravity wave. In Eq. (1), Kz=0.3 m2 s−1, which is also the same as in HL. In addition, , where Ω is earth's rotation rate, and a is earth's radius. HL's boundary conditions stipulated that at the lowest model level (17 km) and constrained to vary semiannually at the top level (35 km).
In our control run that is used to depict the present-day QBO, all the model parameters are identical to those used by HL in their original simulation. The Brunt–Väisälä frequency
In Eq. (4), g is gravity, T0 is mean temperature, and cp is specific heat of dry air at constant pressure. HL set N in Eq. (4) to s−1 with a scale height H=6 km. In addition, the Newtonian cooling profile in our control run, i.e., α(z) in Eqs. (2) and (3), is also identical to that in the original HL model and depicted in Fig. 1a as the black line. Namely, α(z) in the control run increases from (21 d)−1 at 17 km to (7 d)−1 at 30 km and is kept at (7 d)−1 between 30 and 35 km. Fels (1985) explained why the magnitude of this radiative damping rate is suitable for simulating the QBO on the basis of the scale-dependent effect of radiative damping (Fels, 1982). Hamilton (1981) demonstrated that the proper choice of α(z) is crucial in simulating a realistic vertical structure of the QBO.
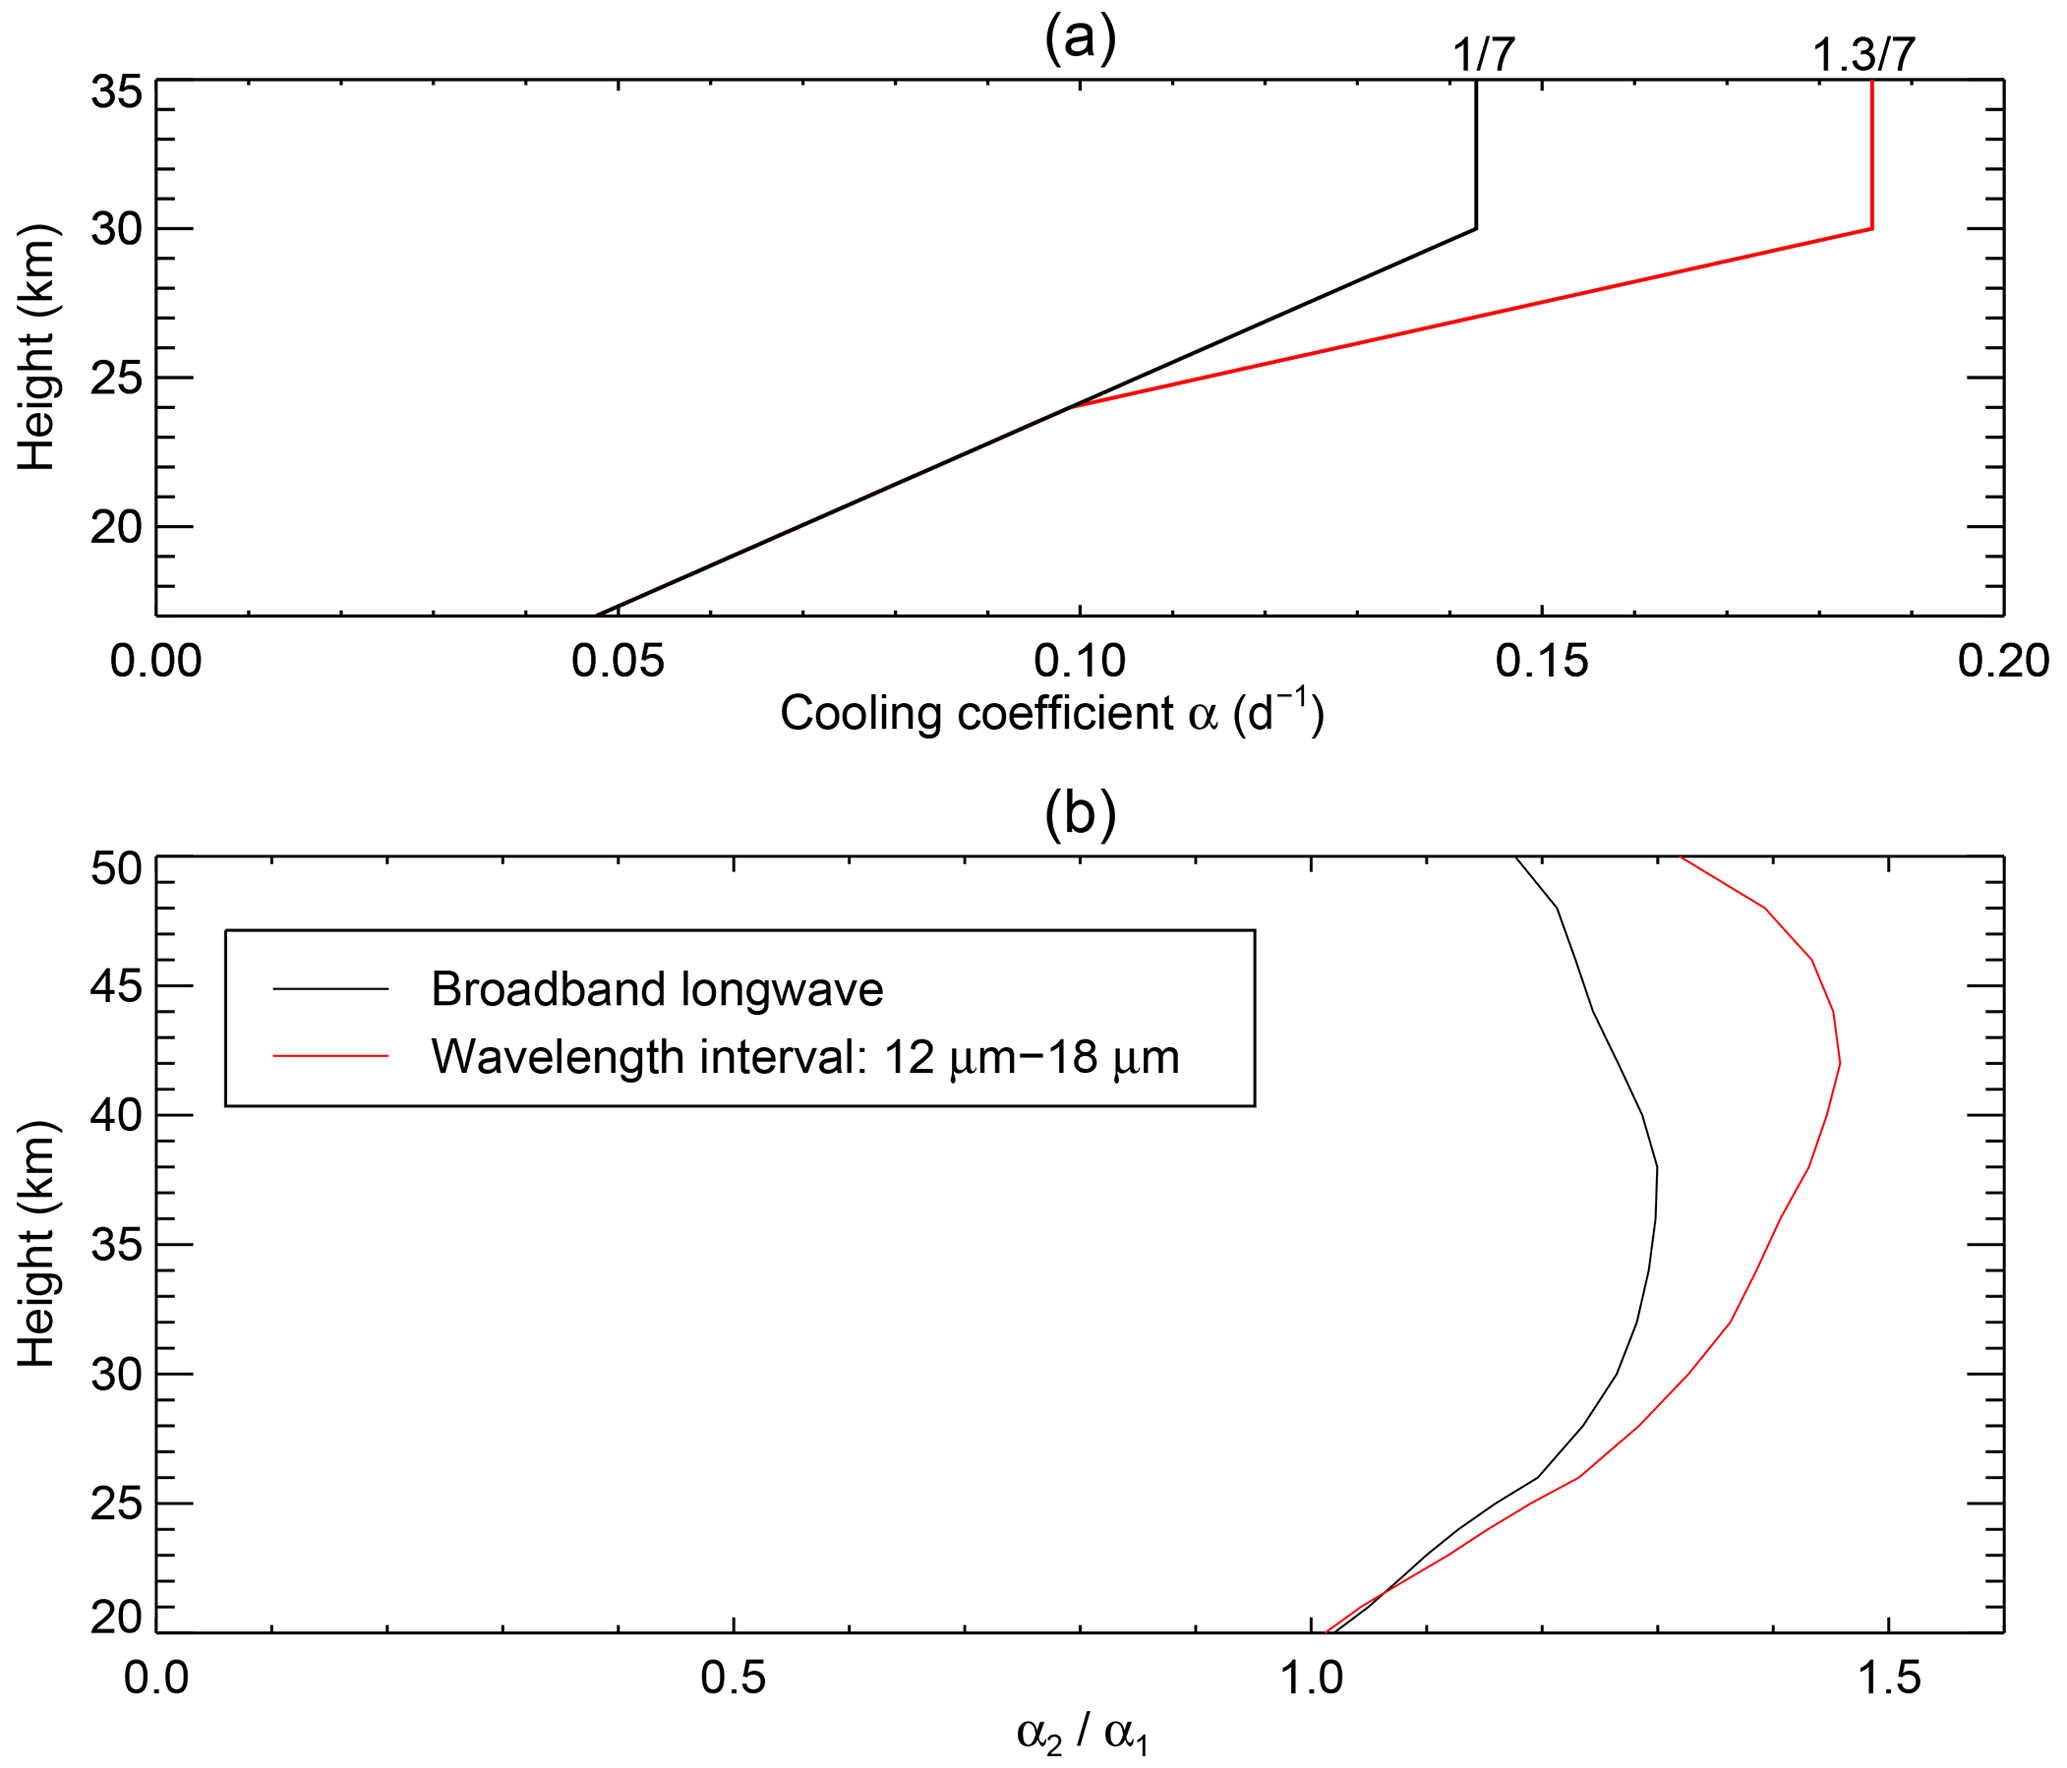
Figure 1(a) Profiles of Newtonian cooling coefficients: the smaller values (black line) are used for the control runs, while the larger values (red line) are used for the experimental runs. (b) Profiles of the ratio of α2 to α1, where α1 and α2 denote the Newtonian cooling coefficient for the reference CO2 and the doubled CO2, respectively. The black line depicts the ratio for the broadband longwave (5–100 µm), and the red line delineates that for the CO2 absorption band (12–18 µm).
Equation (1) was integrated for 100 years using the forward–backward scheme (Matsuno, 1966). The vertical resolution was 250 m and identical to that in HL. The time step was 12 h, i.e., one-half of that used in HL, because the 24 h time step resulted in numerical instability in our integration.
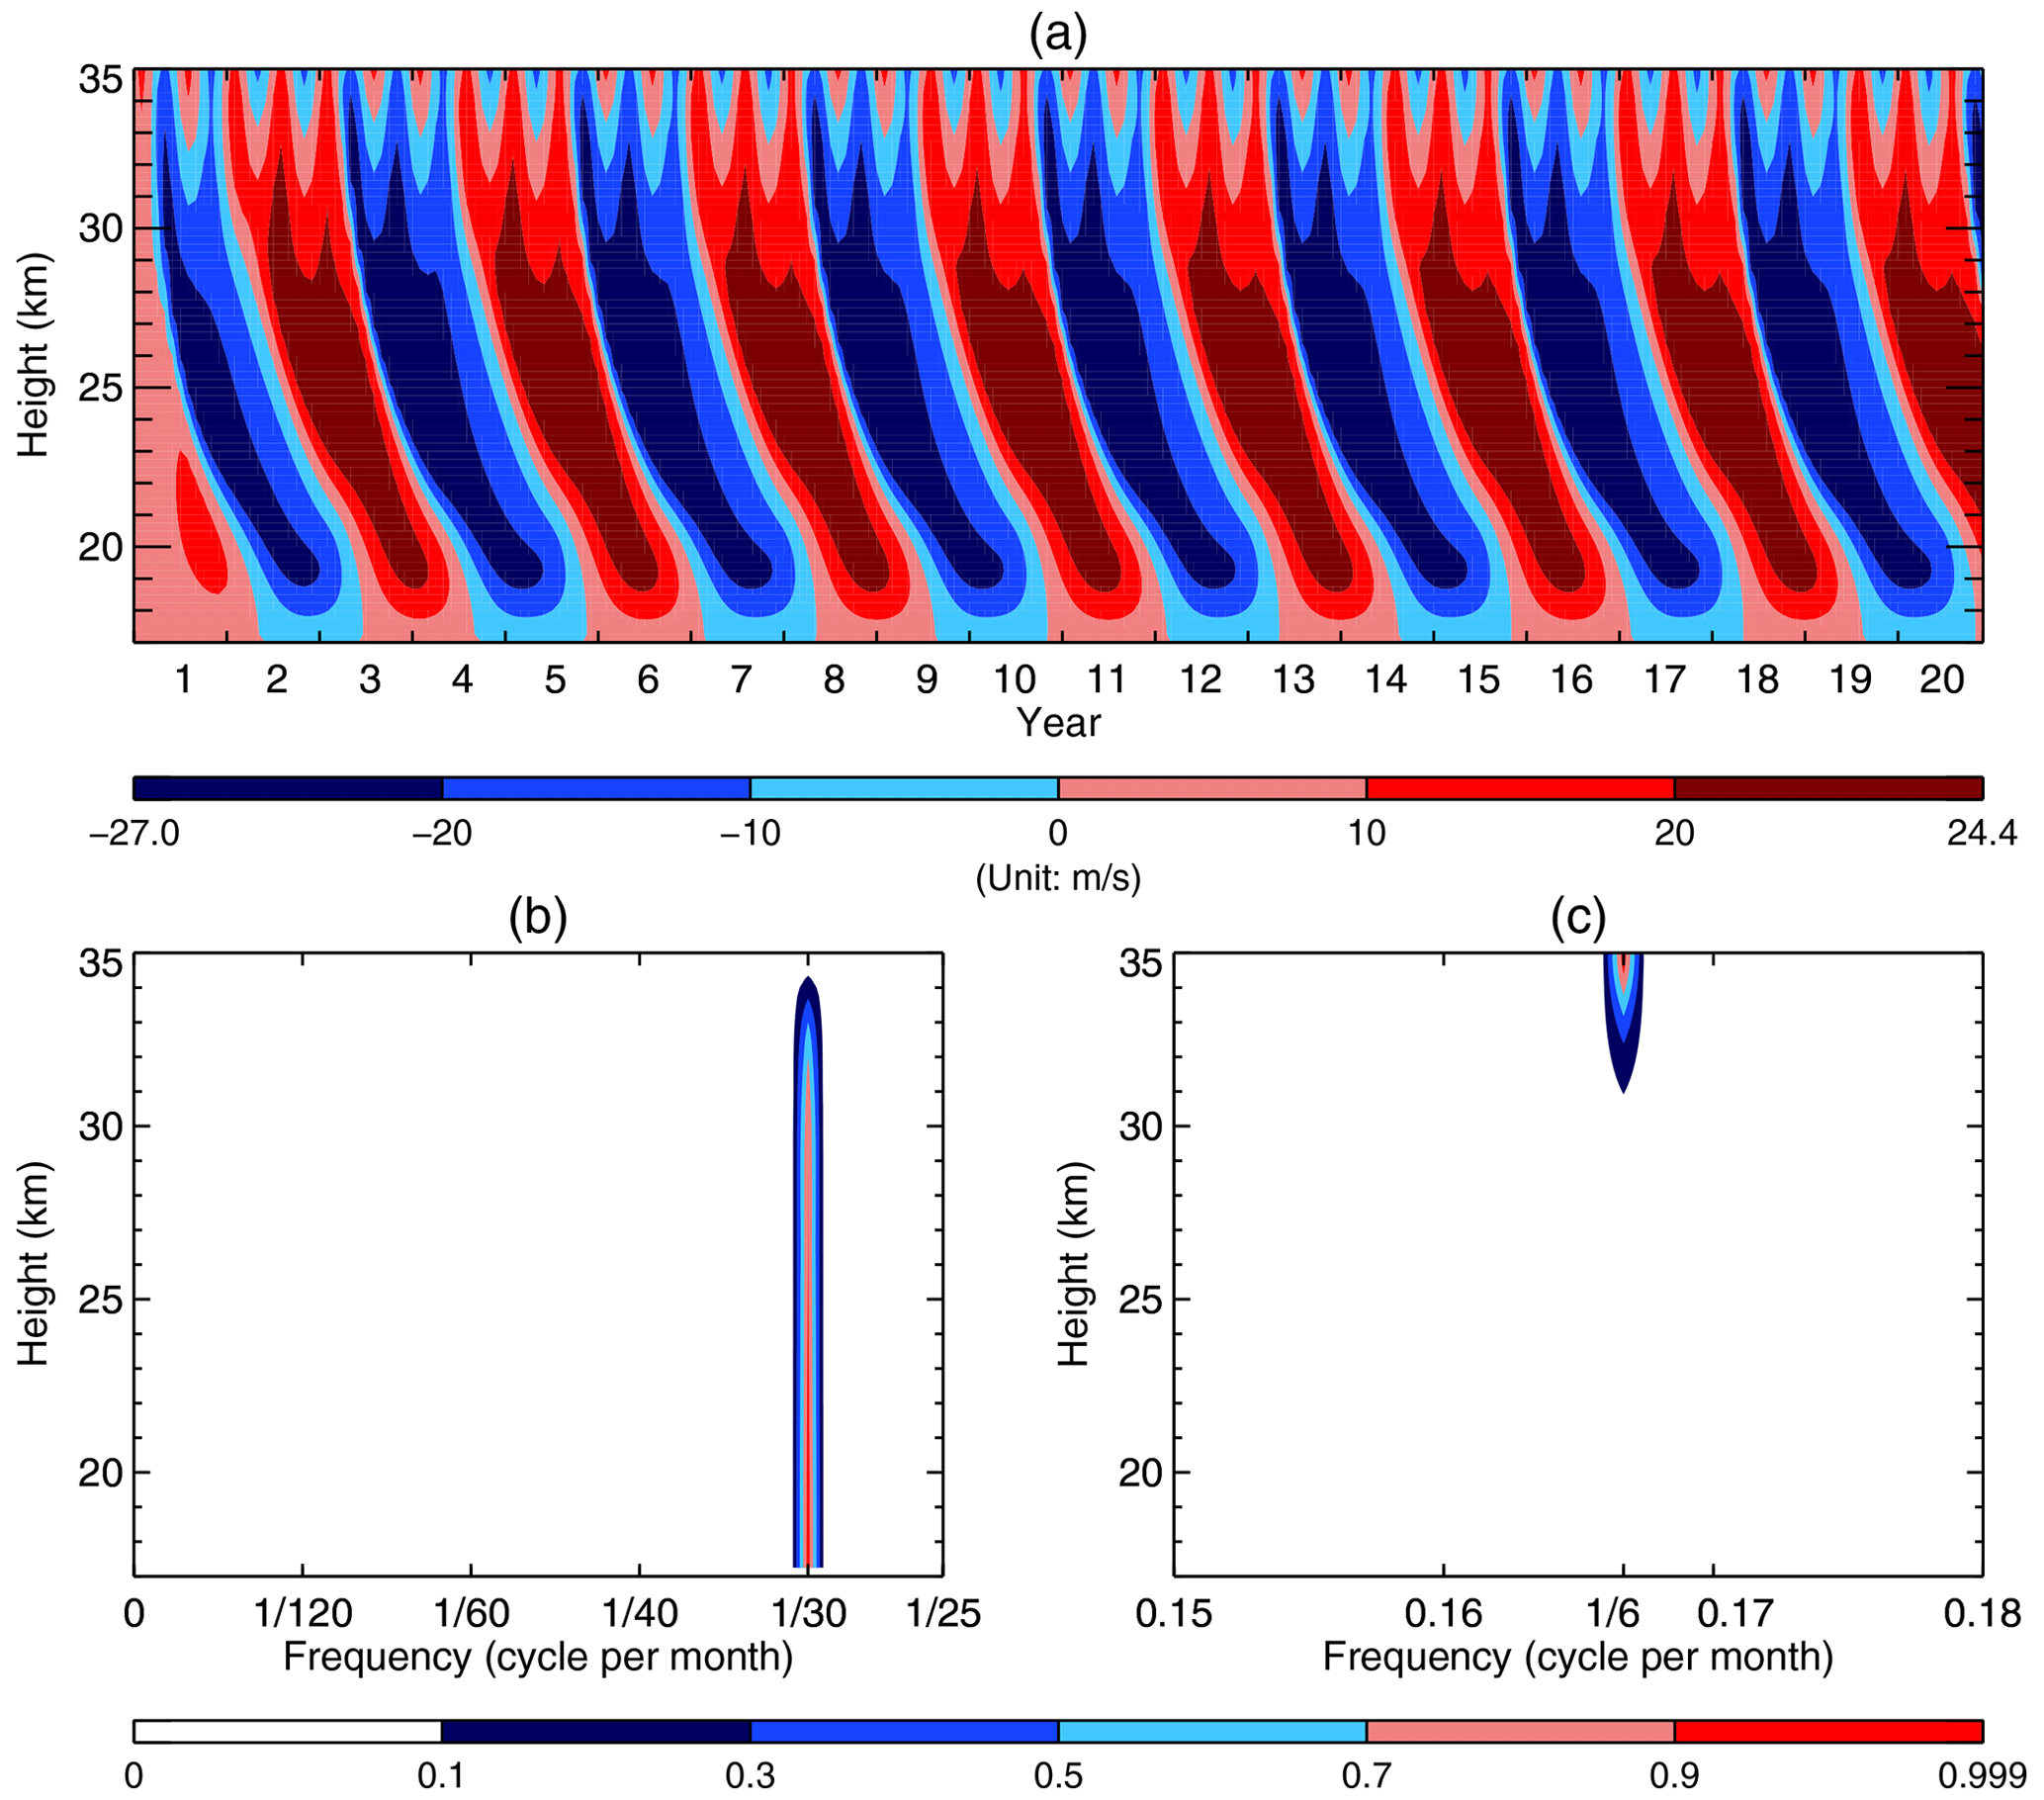
Figure 2(a) Time–height section of the monthly averaged mean zonal wind over the first 20 years from the HL's original model. (b, c) Frequency–height section of the power spectral densities (PSDs) of the standardized monthly averaged mean zonal wind of the 100 years. Note that in order to better visualize the PSDs in (b) and (c), we trimmed off the blank segments for the frequencies ranging from to 0.15 cycles per month and those ranging from 0.18 to 0.5 cycles per month.
Figure 2a shows the time–height section of the monthly averaged mean zonal wind simulated over the first 20 years using the HL model. Both the QBO and the semiannual oscillation (SAO) are conspicuous. The fast Fourier transform (FFT) method is used to calculate the frequency power spectra. In order to more accurately derive the QBO period, the model was run for 100 years to increase the spectral resolution. Frequency–height sections of the power spectral densities (PSDs) over zero to the Nyquist frequency, i.e., 0.5 cycles per month, depict two sharp lines (peaks) at and cycles per month, respectively (not shown). In order to better visualize the magnitudes of the PSDs, we show two truncated frequency–height sections, with Fig. 2b and c highlighting the QBO and the SAO, respectively. Figure 2b shows that the QBO dominates over the model domain. The peak frequency corresponds to the period of 30 months. Figure 2c shows the SAO dominates near the model top due to the fact that a semiannual forcing was imposed in the altitudes from 28 to 35 km.
It is worth mentioning that the QBO period shown here is longer than 26.5 months as reported in the HL paper (see their Fig. 1). Using the HL model parameters, the QBO period simulated by Plumb (1977) was close to 3 years (refer to his Fig. 8a), which is longer than our simulated QBO period, i.e., 30.0 months. Although we could not explain why our simulated QBO period is longer than that simulated by HL, we found that when the upper boundary condition is changed from and d−1 used in HL's original model (refer to their Eq. 2) to used in Plumb (1977), the simulated QBO period becomes 34.3 month (figure not shown). In other words, when we adopted the stress-free upper boundary condition as in Plumb (1977), our simulated QBO period is comparable to that simulated by him, which lends credence to our reconstruction of the HL model.
In order to rigorously quantify the relationship of the Newtonian cooling coefficient at any altitude z between the reference and doubled CO2, we follow Dickinson (1973) in using a radiative-transfer model to calculate Q1(T) for a reference temperature profile T(z) and Q1(T+δ) for T(z)+δ, where a small perturbation δT=0.1 K, with T(z) being the 1976 US standard atmosphere. Our radiative-transfer computations use the MODTRAN gas absorption database with 0.1 cm−1 spectral resolution (Jin et al., 2019; Berk et al., 2008). We then repeat the computations with the doubled CO2 to yield Q2(T) and Q2(T+δ). It follows that , where α1(z) and α2(z) stand for the Newtonian cooling coefficient at any altitude z for the reference and doubled CO2, respectively. In Fig. 1b the black line depicts the ratio for the broadband longwave radiation (5–100 µm), and the red line delineates the ratio for the CO2 absorption band (12–18 µm). The ratio calculated over the broadband is conspicuously smaller than that for the CO2 absorption band because the changes in cooling rate from the temperature perturbation are larger over a wider spectral band. It is worth mentioning that the ratios calculated over the broadband in the middle stratosphere are close to 1.3 and comparable to what Fels (1985) estimated, i.e., about 23 % decrease in the radiative damping time under a doubling of CO2.
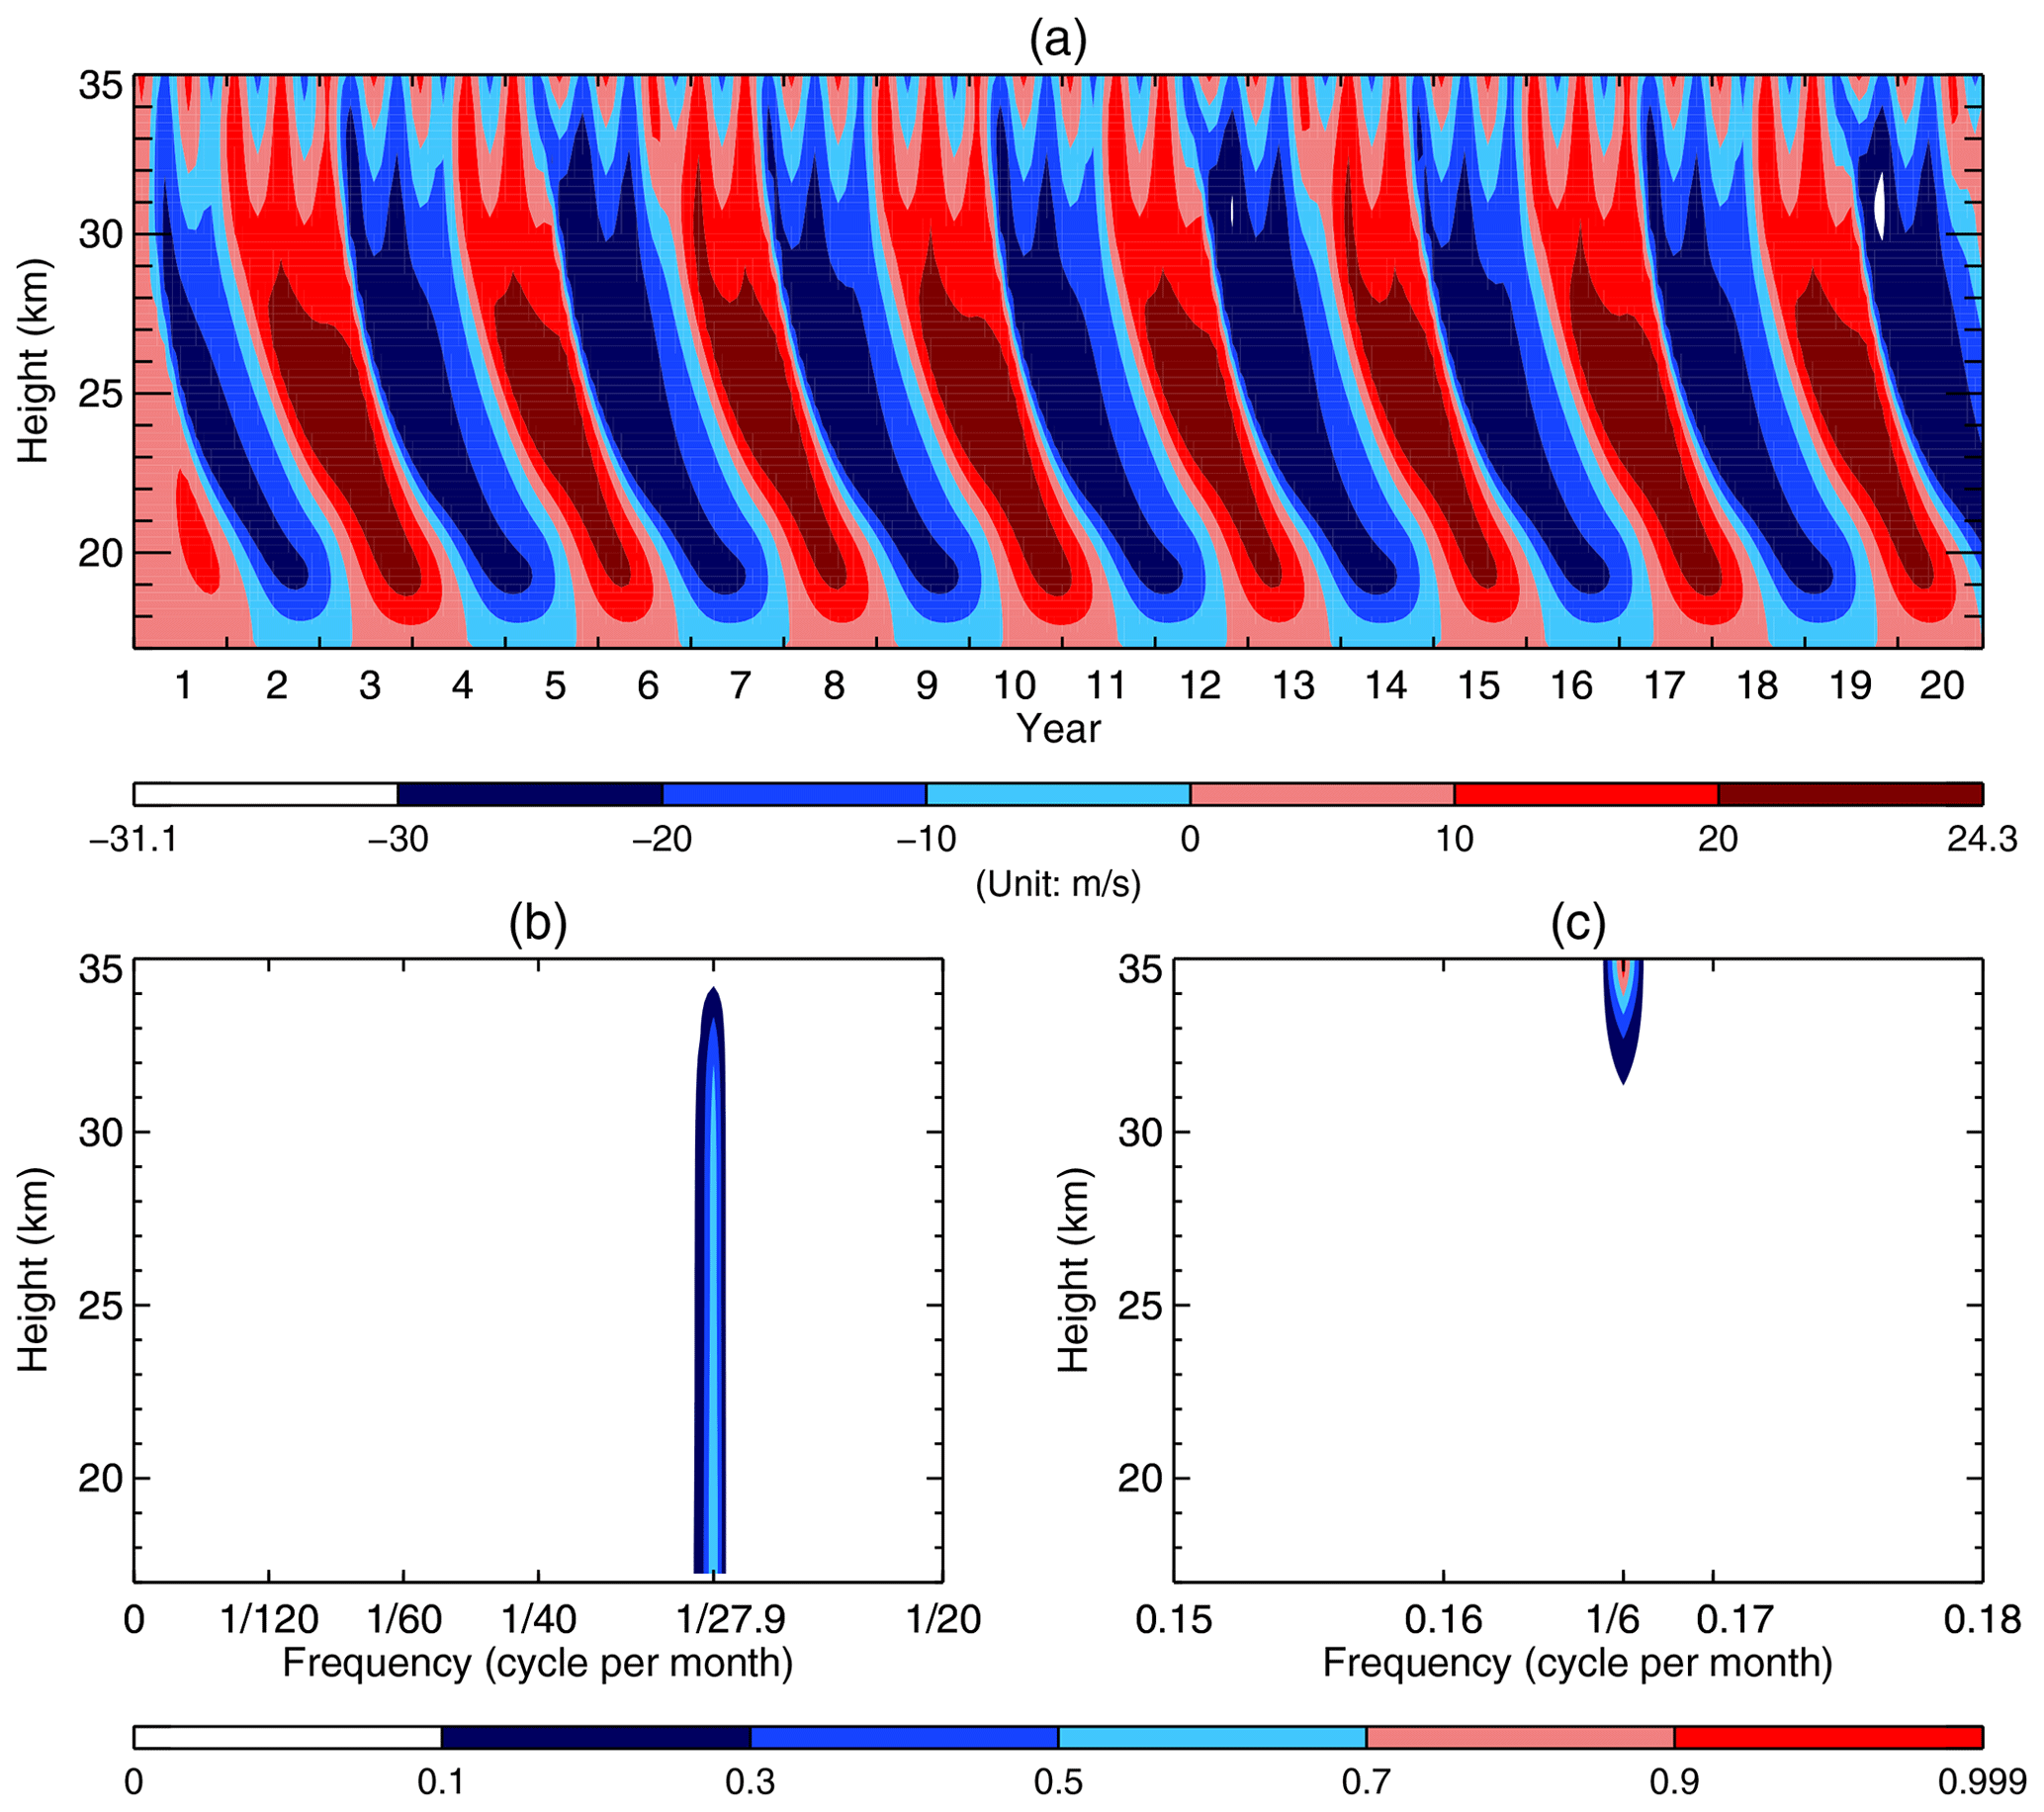
Figure 3(a) Same as Fig 2a but with the enhanced α(z) depicted as the red line in Fig. 1a. (b, c) Frequency–height section of the power spectral densities (PSDs) of the standardized monthly averaged mean zonal wind of the 100 years. Note that in order to better visualize the PSDs in (b) and (c), we trimmed off the blank segments for the frequencies ranging from to 0.15 cycles per month and those ranging from 0.18 to 0.5 cycles per month.
Returning to the 1D HL model, we synthesize those findings by prescribing α2(z) in our experimental runs for the doubled CO2 as follows: an increase of 30 % between 30 and 35 km, no change below 24 km, and linear interpolation between 24 and 30 km. The resulting increase in radiative damping rate from the control runs is depicted as the red line in Fig. 1a. This increase is reasonable based on our results shown in Fig. 1b.
Figure 3a shows the time–height section of the monthly averaged mean zonal wind simulated over the first 20 years for the doubled CO2 run, where the increased α(z) depicted as the red line in Fig. 1a was employed, while all other parameters are identical to those in the control run. Obviously, the QBO dominates below 28 km, while the semiannual oscillation (SAO) dominates above 31 km. Like Fig. 2b and c, we only show two truncated frequency–height sections, with Fig. 3b highlighting the QBO and Fig. 3c highlighting the SAO. Figure 3b also shows that the QBO prevails over the model domain. The peak frequency corresponds to the period of 27.9 months. Figure 3c shows the SAO dominates near the model top due to the same imposed semiannual forcing as that in the control run.
In summary, using the original HL model we found that the increased radiative damping due to the doubling of CO2 shortens the QBO period by 7 % (i.e., decreases from 30 to 27.9 months).

Figure 4(a) Time–height section of the monthly averaged mean zonal wind over the first 20 years from the HL's model without the semiannual forcing. (b) Frequency–height section of the power spectral densities (PSDs) of the standardized monthly averaged mean zonal wind of the 100 years. Note that in order to visualize the PSDs, we trimmed off the blank segment for the frequencies ranging from to 0.5 cycles per month.
HL pointed out that the imposed semiannual oscillation was not essential for their QBO theory. Applying as the upper boundary condition, Plumb (1977) showed a simulated QBO without resorting to the semiannual momentum source (refer to his Fig. 8b). In the following control run, all parameters are identical to those used in the previous control run in Sect. 2 except that G in Eq. (1) is set to zero, with also being set to zero at z=35 km. Hereafter we refer to it as the Plumb model.1 Figure 4a shows the time–height section of the monthly averaged mean zonal wind simulated over the first 20 years using the Plumb model. As expected, the QBO emerges without any trace of SAO since G=0 in Eq. (1). Figure 4b shows that the QBO dominates over the whole model domain. The peak frequency corresponds to the period of 37.5 months, which is comparable to that simulated by Plumb (1977) shown in his Fig. 8b. Apparently, the QBO period from the Plumb model, i.e., 37.5 months shown in Fig. 4b, is longer than that from the HL model, i.e., 30.0 months shown in Fig. 2b. This is partly because the additional forcing G in Eq. (1) was removed in the Plumb model.
In the following experimental run, all parameters are identical to those used in the previous experimental run in Sect. 2 except that G in Eq. (1) is set to zero, with also being set to zero at z=35 km. In other words, the following experimental run using the Plumb model employed the same parameters as the aforementioned control run using the Plumb model except that the increased α(z) shown as the red line in Fig. 1a was used in the following experimental run, while α(z) shown as the black line in Fig. 1a was used in the above control run. Figure 5a shows the time–height section of the monthly averaged mean zonal wind simulated over the first 20 years for the doubled CO2 run. It is natural that only the QBO emerges. A comparison of Figs. 4a and 5a shows that the QBO period shortens when the infrared damping increases in response to the doubled CO2. Figure 5b shows that the QBO dominates over the whole model domain. The peak frequency corresponds to the period of 31.6 months.

Figure 5(a) Same as Fig. 4a but with the enhanced α(z) depicted as the red line in Fig. 1a. (b) Same as Fig. 4b but for the doubled CO2 run.
Using the Plumb model, we found that the increased radiative damping due to the doubling of CO2 shortens the QBO period by 15.7 % (i.e., decreases from 37.5 to 31.6 months).
Dunkerton (1997) showed that in the presence of tropical upwelling it was gravity waves rather than large-scale Kelvin and mixed Rossby–gravity waves that contributed the bulk of QBO forcing. Consequently, Geller et al. (2016a, b) pointed out that enough gravity wave momentum flux is required to model the QBO in a self-consistent manner in climate models and that the magnitude of the subgrid-scale gravity wave momentum flux plays a crucial role in determining the QBO period. Since there is no tropical upwelling in either the HL model or the Plumb model, it is natural that planetary-scale Kelvin and mixed Rossby–gravity waves largely determine the QBO periods shown in Sects. 2 and 3 due to the fact that the specified G is significantly weaker than that in the terrestrial stratosphere. We conducted another sensitivity test where all parameters are identical to those in the HL model except that G in both the control and experimental runs is twice as large as that used by HL. As the radiative damping profile changes from the black line to the red line above 24 km shown in Fig. 1a, our simulated QBO period decreases from 28.6 to 27.3 months (figures not shown). This smaller percentage decrease of 4.5 % is not unexpected because G is not sensitive to the radiative damping at all, and the greater specified G reduces the fraction of the total wave forcing arising from the planetary waves.
We further conducted two sensitivity tests where all parameters are identical to those in the HL model except that G in the first test is half as large as that used by HL and is equal to zero in the second test. Surprisingly, as the radiative damping profile changes from the black line to the red line above 24 km shown in Fig. 1a, our simulated QBO periods decrease from 30.0 to 28.6 months for both G being decreased by 50 % and for G=0 (figures not shown). This 4.7 % decrease in the QBO period is smaller than the 7 % reduction obtained from the sensitivity test presented in Sect. 2 when G is the same as that used by HL. It is surprising because the model atmosphere is expected to be more sensitive to the changes in the radiative damping as G becomes smaller and smaller. Note that when our control runs adopt the black radiative damping profile shown in Fig. 1a, the simulated QBO periods are not sensitive to the imposed semiannual forcing provided that G does not exceed the values employed by HL. Similarly, when our experimental runs adopt the red radiative damping profile above 24 km shown in Fig. 1a, the simulated QBO periods are also not sensitive to the imposed semiannual forcing provided that G does not exceed 50 % of the values adopted in HL. The question naturally arises: what is responsible for this unexpected behavior?
In Sect. 2, the simulated QBO periods are equal to 30 and 34.3 months when we adopted the no-slip and stress-free upper boundary condition, respectively, with all other parameters being identical to those used by HL. The results implicate the upper boundary conditions in the inconsistency. Plumb (1977) pointed out that the upper boundary in HL was undesirably low and implied that raising the lid to an additional 50 % would be adequate for the robustness in his model. Here, we carry out a series of sensitivity tests by raising the model lid gradually from 35 to 55 km with an increment of 1 km. We demonstrate how the behavior of the HL model with G=0 converges with that of the Plumb model. The modified HL model, i.e., the HL model with G=0 is identical to the Plumb model except that the former has the no-slip upper boundary condition, while the latter has the stress-free upper boundary condition. Both models share the same governing equation (Eq. 5). Note that we set the radiative damping rate above the 35 km level to its value at the 35 km level shown in Fig. 1a.
For the radiative damping profile corresponding to the reference CO2, Fig. 6 shows that when the model lid is placed at the 35 km level the simulated QBO period of 30.0 months with the no-slip upper boundary condition (solid black line) is apparently shorter than that of 37.5 months with the stress-free upper boundary condition (dashed black line). Figure 6 also shows that as the model lid is raised incrementally from the 35 km level to the 46 km level, the discrepancies between the simulated QBO periods due to the different upper boundary conditions decrease monotonically. No matter whether we adopt the no-slip or stress-free upper boundary condition, the simulated QBO period is 32.4 months for the reference radiative damping profile provided that the model top is at or above the 46 km level.
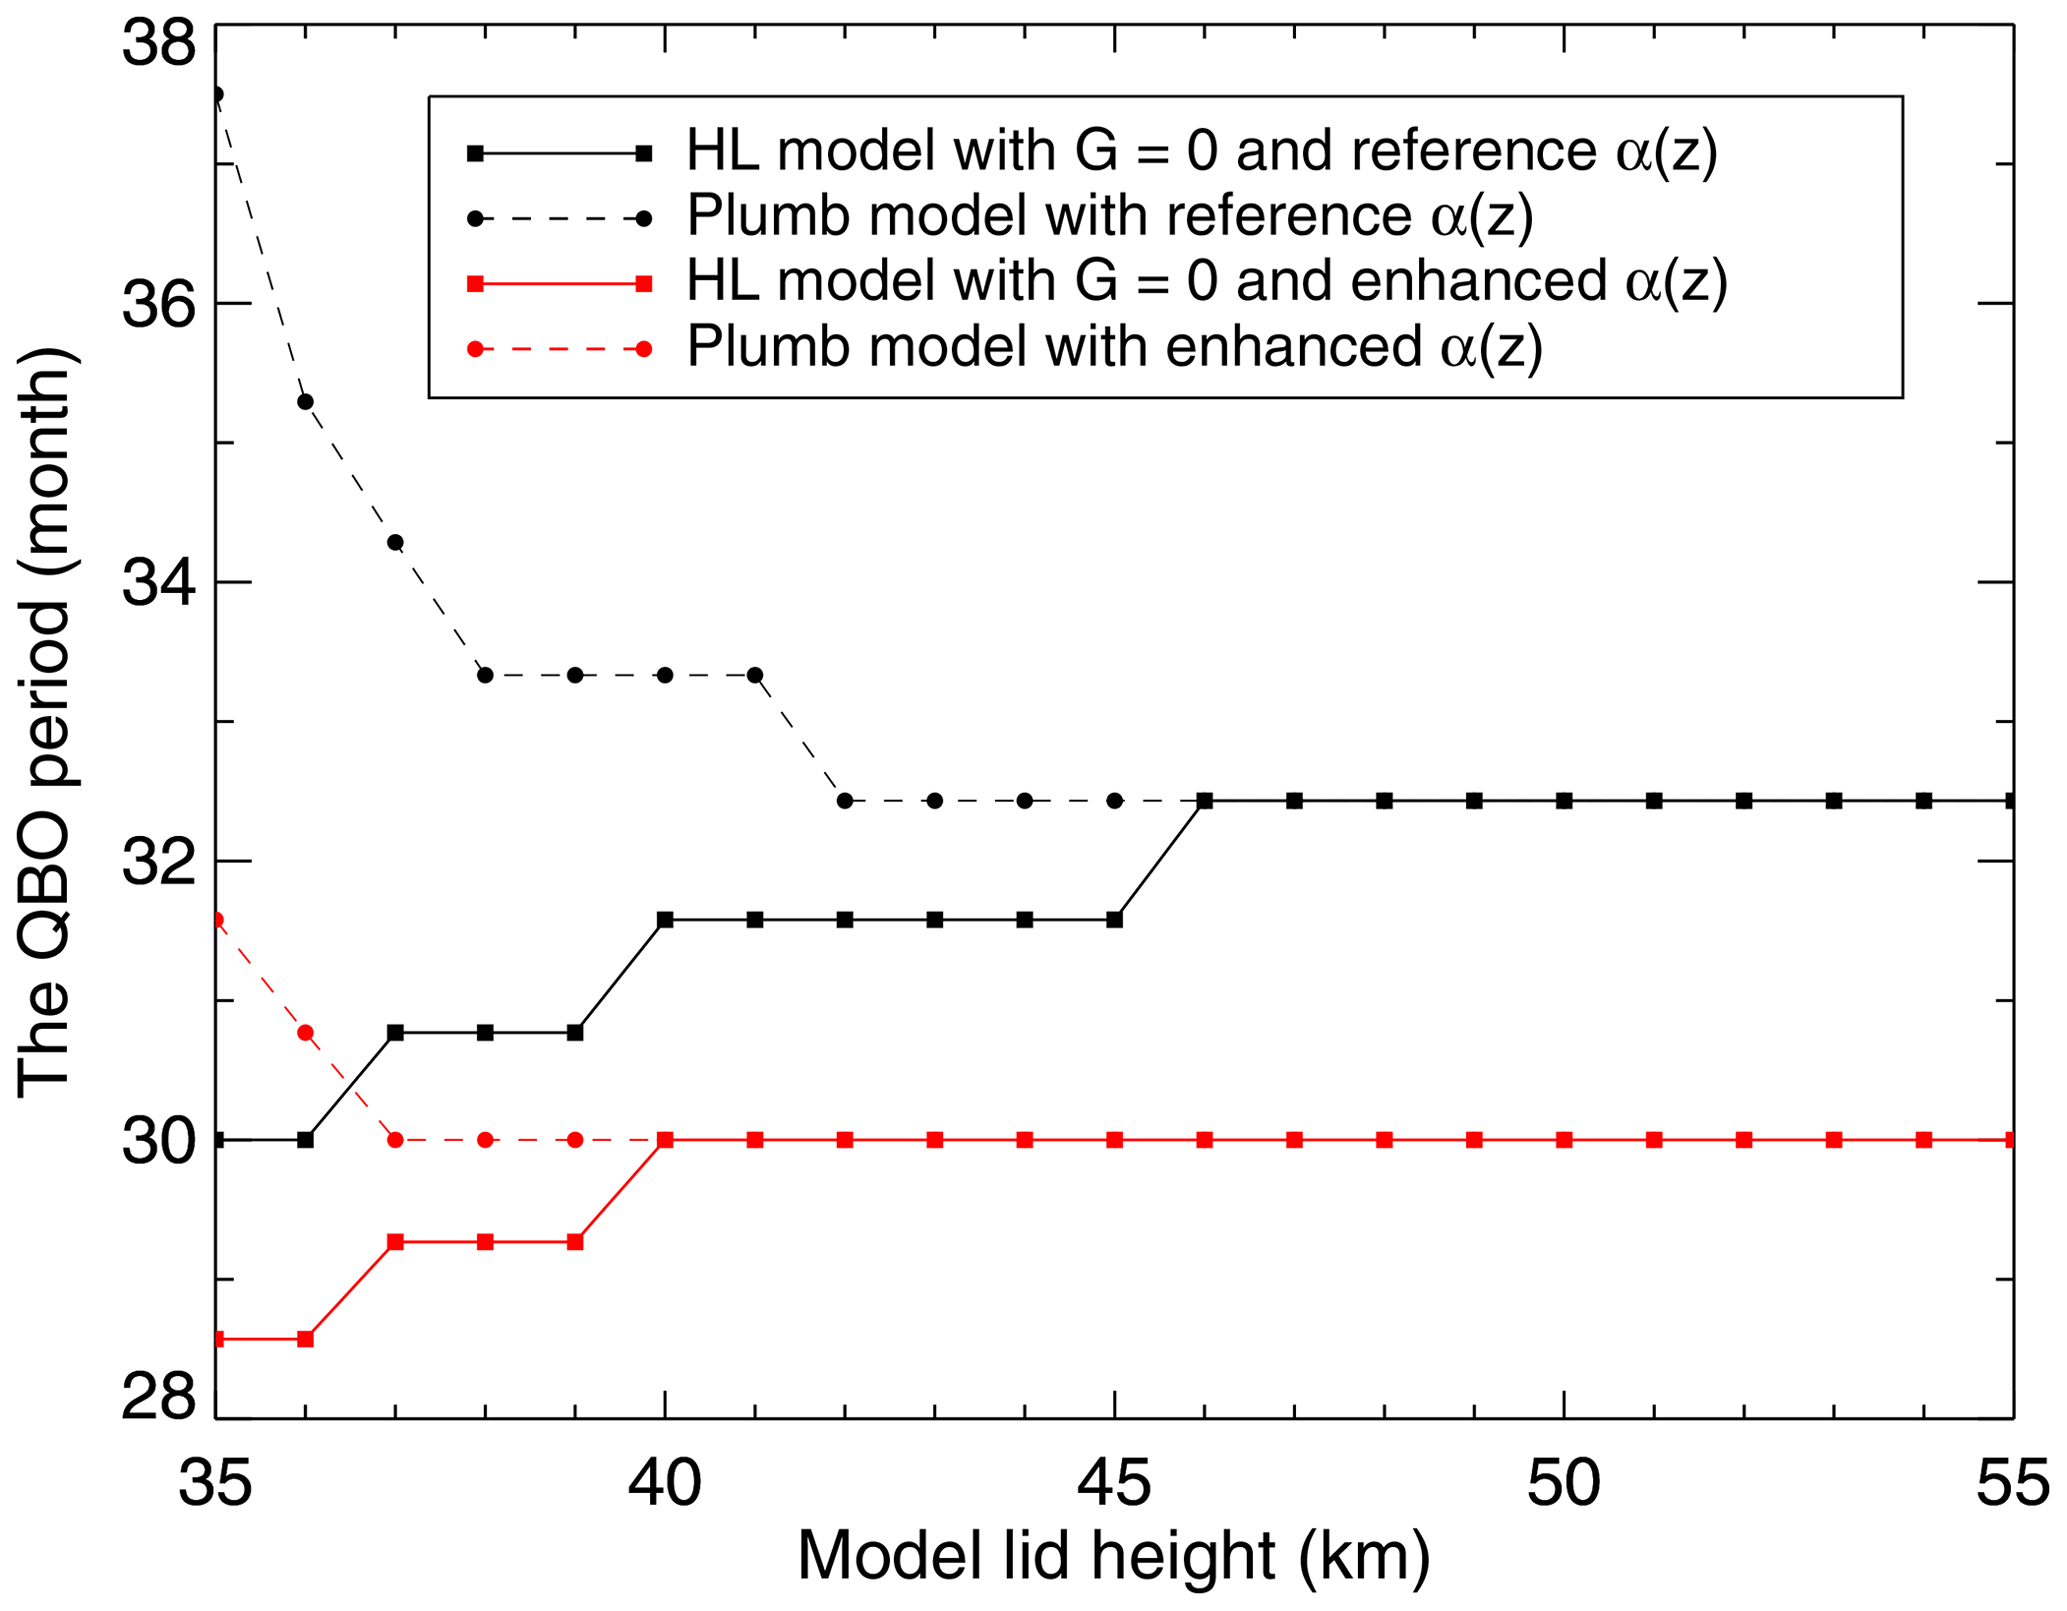
Figure 6The relationship between the simulated QBO period with the height of the model lid. Black and red lines depict the results from using the reference radiative damping and the enhanced radiative damping, respectively, while solid and dashed lines delineate the results from the HL model with G=0 and the Plumb model, respectively.
Similarly, for the radiative damping profile corresponding to the doubled CO2, Fig. 6 demonstrates that when the model lid is placed at the 35 km level the simulated QBO period of 28.6 months with the no-slip upper boundary condition (solid red line) is obviously shorter than that of 31.6 months with the stress-free upper boundary condition (dashed red line). Figure 6 also exhibits that as the model lid is raised gradually from the 35 km level to the 40 km level, the discrepancies between the simulated QBO periods due to the different upper boundary conditions decrease monotonically. No matter whether we adopt the no-slip or stress-free upper boundary condition, the simulated QBO period for the enhanced infrared cooling due to the doubled CO2 is 30.0 months provided that the model top is at or above the 40 km level. It is apparent that the required model top is lower when the radiative damping is augmented due to the doubling of CO2 because the planetary waves dissipate more steeply with height in the presence of the enhanced infrared cooling rates.
Figure 6 suggests that when the model lid is sufficiently high the QBO period in response to the enhanced radiative damping due to the increasing CO2 will decrease from 32.4 to 30.0 months. This 7.4 % decrease in the QBO period is independent of the upper boundary condition. Note that the relative uncertainty in the ratio calculated over the broadband (refer to the black line shown in Fig. 1b) ranges from 5 % to 10 % in the lower stratosphere and from 10 % to 15 % in the middle and upper stratosphere. Thus, the relative uncertainty in the calculated ratio is 15 % at a liberal estimate in the stratosphere. Using the HL model with its top at the 48 km level, we further conducted two experiments by adopting G=0 in Eq. (1) and increasing the radiative damping corresponding to the doubled CO2 between 30 and 48 km by 30 % − 30 % ⋅ 15 % = 25.5 % and 30 % + 30 % ⋅ 15 % = 34.5 %, respectively, relative to that in the control run. The simulated QBO periods are 30.3 and 29.7 months, respectively. Therefore, when the model lid is sufficiently high the QBO period in response to the enhanced radiative damping due to the doubled CO2 will decrease by approximately 7.4 % ± 0.9 %.
Jonsson et al. (2004) showed that the doubled CO2 induces a substantial cooling throughout most of the middle atmosphere, which in turn increases the ozone mixing ratio by 15 %–20 % in the upper stratosphere and by 10 %–15 % in the lower mesosphere (refer to their Fig. 6). Incorporating this increase into the ozone profile for the doubled CO2, we recalculated the ratio of α2, the Newtonian cooling coefficient for the doubled CO2, to α1, the Newtonian cooling coefficient for the reference CO2. Our calculated is only slightly increased as compared with that shown Fig. 1b no matter whether the CO2 absorption band is 5–100 or 12–18 µm (figure not shown). It is not unexpected because the infrared radiative cooling by ozone is significantly smaller than that by CO2 (refer to Fig. 1 in Dickinson, 1973), and, as a result, the 15 %–20 % increases in the ozone mixing ratio will not make a noticeable difference. Since the monthly and zonal mean 2D ozone concentrations are specified in about 80 % of the CMIP5 models (Cionni et al., 2011), and the monthly mean 3D ozone data are employed in many CMIP6 models (Keeble et al., 2020), it is expected that the change in the radiative damping due to the increase in ozone in response to the doubled CO2 only marginally impacts the QBO periods in those models that do not include an interactive chemistry. However, the 15 %–20 % increases in the ozone mixing ratio in response to the doubled CO2 do contribute to the shortening of the QBO period due to its role in strengthening the tropical upwelling in the stratosphere (Bushell et al., 2010).
The real atmosphere involves the complex interactions among dynamics, chemistry, and radiation (Andrews et al., 1987). First of all, the dynamical QBO goes hand in hand with the ozone QBO (Hasebe, 1994). Shibata and Deushi (2005) pointed out that the radiative heating related to the ozone QBO could modify the secondary meridional circulation associated with the QBO and consequently could modify how the QBO westerlies move down faster than the QBO easterlies, leading to the elongation of the QBO period in the chemically interactive models as compared with the chemically non-interactive models. However, it is difficult to fathom how the intensity of the secondary meridional circulation associated with the QBO could change the QBO period due to the fact that any speedup or slowdown of the descending westerly shear zones is roughly compensated by the concurrent slowdown or speedup of the descending easterly shear zones. Furthermore, due to the increase in the zonal mean temperatures and ozone concentrations with the altitude in the lower stratosphere, the motion, ozone, and thermal waves are closely coupled. Pawson et al. (1992) found that the net linearized cooling coefficient from CO2 (Newtonian cooling) was more than compensated for in the lower equatorial atmosphere arising from absorption by the 9.6 µm bands of ozone (see their Fig. 8). This reduced or negative radiative damping in the lower stratosphere acts to lengthen the QBO period in the presence of the increased ozone due to the doubling of the CO2 concentrations. Finally, taking into account the shortwave heating of eddy ozone, Cordero et al. (1998) used a mechanistic model with a one-dimensional representation for mean flow and a three-dimensional depiction for Kelvin and Rossby–gravity waves to demonstrate that the ozone distribution, which maximizes in the middle stratosphere, leads to the local radiative damping decreases by up to 15 % below 35 km and its increases by up to 20 % above 35 km. They concluded that ozone feedbacks lengthen the QBO period by about 2 months. Cordero and Nathan (2000) further developed a more sophisticated mechanistic model with a two-dimensional representation for mean flow and a three-dimensional depiction for Kelvin and Rossby–gravity waves and surprisingly found that ozone feedbacks had little influence on the QBO period. We believe that more studies should be conducted to fully understand how to put together those various effects of interactive ozone on the QBO period.
Using the NASA Goddard Institute for Space Studies (GISS) Model E2.2-AP (Rind et al., 2020; Orbe et al., 2020), DallaSanta et al. (2021), to a great extent, isolated the overall effect on the QBO period of the increase in ozone due to the doubled CO2. They first used a chemically non-interactive (NINT) model to conduct two CMIP6 experiments: the preindustrial (pi) control run and the doubled CO2 (2X) run. The two experiments only differ in the CO2 concentration, with the latter being 2 times the former. Any other specification of these two experiments is the same; e.g., the ozone concentrations in the two runs are identical. Their Fig. 5 shows that the doubling of CO2 in the NINT model shortens the QBO period from 29.1 to 25 months. In other words, the doubling of CO2 shortens the QBO period by 14 %. DallaSanta et al. (2021) then employed a chemically interactive CMIP6 model with a mass-based scheme (Bauer et al., 2020), called one-moment aerosol (OMA), to conduct the pi control run and the 2X run. The ozone concentrations simulated by the OMA model increase by 10 %–15 % in response to the doubling of CO2 (figure not shown), which is consistent with the results of Jonsson et al. (2004). Figure 5 in DallaSanta et al. (2021) indicates that the doubling of CO2 in the OMA model shortens the QBO period from 31.7 to 26.6 months. Namely, the doubling of CO2 shortens the QBO period by 16 %. In short, the results of DallaSanta et al. (2021) appear to suggest that three-way interactions among dynamics, chemistry, and radiation tend to slightly amplify the shortening of the QBO period in response to the doubling of CO2.
Note that N, the Brunt–Väisälä frequency, in Eqs. (2) and (3) also changes with increasing CO2. Richter et al. (2020b) showed that N2 would be decreased by ∼5 % in the stratosphere when CO2 is doubled (refer to their Fig. 2c). We used the HL model to conduct a sensitivity test by adopting G=0 in Eq. (1), with the radiative damping profile corresponding to the doubled CO2 and the top of the models at the 48 km level. The rest of the parameters in this sensitivity test are identical to those in all the previous runs except that the Brunt–Väisälä frequency in this experimental run was 2.5 % smaller than that in the control run. The models were run for 1000 years to further increase the spectral resolution. We found that when the Brunt–Väisälä frequency was decreased by 2.5 %, the simulated QBO period was slightly lengthened from 30 to 30.2 months (figure not shown). In other words, the impact of decreasing stratospheric buoyancy frequency on the QBO period is almost negligible.
Analyzing 11 CCMI-1 REF-C2 climate–chemistry simulations, Eichinger and Šácha (2020) showed that the scale height in the stratosphere decreases by 2.3 % per century. Accordingly, we used the HL model to conduct another sensitivity test by adopting G=0 in Eq. (1) with the radiative damping profile corresponding to the doubled CO2 and the top of the models at the 48 km level. The rest of parameters in this sensitivity test are identical to those in all the previous control runs except that the scale height in this experimental run was 2.3 % smaller than that in the control run. The model was also run for 1000 years for the sake of higher spectral resolution. We found that when the scale height was decreased by 2.3 %, the simulated QBO period was also shortened by about 2.3 %, i.e., from 30 months to 29.3 months (figure not shown). Apparently, the shortening of the QBO period due to the warming climate is ascribed less to the shrinkage of the scale height in the stratosphere than to the enhancing of the stratospheric radiative damping. Together, the shrinking scale height and the increasing radiative damping shorten the QBO period by about 9.6 %.
Plumb (1977) envisioned that stratospheric climate change would give rise to long-term changes in the QBO period due to changes in radiative damping and the Brunt–Väisälä frequency. Using one-dimensional (1D) models and taking into account the uncertainty due to the radiative damping rate, we found that the enhanced radiative damping arising from the doubling of CO2 leads to the shortening of the QBO period by about 7.4 % ± 0.9 % provided that the model top is higher than the 46 km level. Furthermore, when we incorporated both the 2.3 % shrinkage of the scale height and the enhanced radiative damping, the QBO period is shortened by about 9.6 %. In addition, the impact of decreasing stratospheric buoyancy frequency is marginal. While the increased ozone in response to the doubling of CO2 appears to slightly further shorten the QBO period, more research needs to be done for the appreciation of the underlying mechanisms. Note that our 1D models include neither gravity waves nor tropical upwelling and assume that there are no changes in wave fluxes entering the equatorial stratosphere.
From a comprehensive model perspective, Richter et al. (2020b) showed that the changes in period of the QBO in warming-climate simulations varied quite significantly among these models. Some models projected longer mean periods and some shorter mean periods for the QBO in a future warmer climate. They argue that uncertainty in the representation of the parameterized gravity waves is the most likely cause of the spread among the QBOi models in the QBO's response to climate change.
In addition, CO2 increases in the NASA GISS Model E2.2-AP lead to a decrease in both QBO period and QBO amplitude (DallaSanta et al., 2021). The period decrease is mostly associated with increases in lower-stratospheric momentum fluxes (related to parameterized convection), a finding consistent with Geller et al. (2016a, b) and Richter et al. (2020b). The amplitude decrease is mainly associated with a strengthened residual mean circulation, also consistent with the literature, although the vertical structure of the circulation response is nontrivial. It is worth mentioning that horizontal momentum flux divergences could also play an important role in weakening the QBO (Match and Fueglistaler, 2019, 2020).
Our 1D models only explored how the QBO period responds to the enhancing radiative damping of planetary waves, the shrinking scale height in the stratosphere, and the decreasing stratospheric buoyancy frequency due to the increasing CO2 concentration. In order to investigate how those factors affect gravity waves, which play an even more important role in determining the QBO period than planetary waves, high-resolution models such as those used by Kawatani et al. (2011, 2019) are desirable to further our understanding. Ultimately, how the QBO period changes in response to the increasing CO2 will be determined by the combined effects of the strengthening of tropical upwelling, the increasing of wave fluxes entering the equatorial stratosphere, the enhancing of radiative damping, and the shrinking of the scale height in the stratosphere, which warrant further research.
Any data used in this paper can be made available from the corresponding author upon request.
All authors made equal contributions to this work.
The authors declare that they have no conflict of interest.
Climate modeling at GISS is supported by the NASA Modeling, Analysis, and Prediction program, and resources supporting this work were provided by the NASA High-End Computing (HEC) program through the NASA Center for Climate Simulation (NCCS) at Goddard Space Flight Center. Kevin DallaSanta acknowledges support from the NASA Postdoctoral Program. The authors thank the editor Peter Haynes and two anonymous reviewers for their helpful comments, which led to an improved paper. The authors also acknowledge very useful discussions with Marvin A. Geller and Clara Orbe.
This research has been supported by NASA.
This paper was edited by Peter Haynes and reviewed by two anonymous referees.
Andrews, D. G., Holton, J. R., and Leovy, C. B.: Middle Atmosphere Dynamics, Academic Press, 489 pp., 1987.
Baldwin, M. P., Gray, L. J., Dunkerton, T. J., Hamilton, K., Haynes, P. H., Randel, W. J., Holton, J. R., Alexander, M. J., Hirota, I., Horinouchi, T., Jones, D. B. A., Kinnersley, J. S., Marquardt, C., Sato, K., and Takahashi, M.: The Quasi-biennial oscillation, Rev. Geophys., 39, 179–229, https://doi.org/10.1029/1999RG000073, 2001.
Bauer, S. E., Tsigaridis, K., Faluvegi, G., Kelley, M., Lo, K. K., Miller, R. L., Nazarenko, L., Schmidt, G. A., and Wu, J.: Historical (1850–2014) Aerosol Evolution and Role on Climate Forcing Using the GISS ModelE2.1 Contribution to CMIP6, J. Adv. Model. Earth Sy., 12, e2019MS001978, https://doi.org/10.1029/2019ms001978, 2020.
Berk, A., Anderson, G. P., Acharya, P. K., and Shettle, E. P.: MODTRAN5 version 2 user's manual, Spectral Sciences Inc., Burlington, Massachusetts, USA and Air Force Geophysics Laboratory, Hanscom Air Force Base, Massachusetts, USA, 2008.
Bushell, A. C., Jackson, D. R., Butchart, N., Hardiman, S. C., Hinton, T. J., Osprey, S. M., and Gray, L. J.: Sensitivity of GCM tropical middle atmosphere variability and climate to ozone and parameterized gravity wave changes, J. Geophys. Res.-Atmos., 115, D15101, https://doi.org/10.1029/2009JD013340, 2010.
Butchart, N.: The Brewer-Dobson circulation, Rev. Geophys., 52, 157–184, https://doi.org/10.1002/2013RG000448, 2014.
Butchart, N., Scaife, A. A., Bourqui, M., Grandpré, J., Hare, S. H., Kettleborough, J., Langematz, U., Manzini, E., Sassi, F., Shibata, K., Shindell, D., and Sigmond, M.: Simulations of anthropogenic change in the strength of the Brewer–Dobson circulation, Clim. Dynam., 27, 727–741, https://doi.org/10.1007/s00382-006-0162-4, 2006.
Butchart, N., Anstey, J. A., Hamilton, K., Osprey, S., McLandress, C., Bushell, A. C., Kawatani, Y., Kim, Y.-H., Lott, F., Scinocca, J., Stockdale, T. N., Andrews, M., Bellprat, O., Braesicke, P., Cagnazzo, C., Chen, C.-C., Chun, H.-Y., Dobrynin, M., Garcia, R. R., Garcia-Serrano, J., Gray, L. J., Holt, L., Kerzenmacher, T., Naoe, H., Pohlmann, H., Richter, J. H., Scaife, A. A., Schenzinger, V., Serva, F., Versick, S., Watanabe, S., Yoshida, K., and Yukimoto, S.: Overview of experiment design and comparison of models participating in phase 1 of the SPARC Quasi-Biennial Oscillation initiative (QBOi), Geosci. Model Dev., 11, 1009–1032, https://doi.org/10.5194/gmd-11-1009-2018, 2018.
Butchart, N., Anstey, J. A., Kawatani, Y., Osprey, S. M., Richter, J. H., and Wu, T.: QBO changes in CMIP6 climate projections, Geophys. Res. Lett., 47, e2019GL086903, https://doi.org/10.1029/2019GL086903, 2020.
Camargo, S. J. and Sobel, A. H.: Revisiting the influence of the quasi-biennial oscillation on tropical cyclone activity, J. Climate, 23, 5810–5825, https://doi.org/10.1175/2010JCLI3575.1, 2010.
Cionni, I., Eyring, V., Lamarque, J. F., Randel, W. J., Stevenson, D. S., Wu, F., Bodeker, G. E., Shepherd, T. G., Shindell, D. T., and Waugh, D. W.: Ozone database in support of CMIP5 simulations: results and corresponding radiative forcing, Atmos. Chem. Phys., 11, 11267–11292, https://doi.org/10.5194/acp-11-11267-2011, 2011.
Collimore, C. C., Martin, D. W., Hitchman, M. H., Huesmann, A., and Waliser, D. E.: On the relationship between the QBO and tropical deep convection, J. Climate, 16, 2552–2568, https://doi.org/10.1175/1520-0442(2003)016<2552:OTRBTQ>2.0.CO;2, 2003.
Cordero, E. C. and Nathan, T. R.: The influence of wave- and zonal-mean ozone feedbacks on the quasi-biennial oscillation, J. Atmos. Sci., 57, 3426–3442, https://doi.org/10.1175/1520-0469(2000)057<3426:TIOWAZ>2.0.CO;2, 2000.
Cordero, E. C., Nathan, T. R., and Echols, R. S.: An analytical study of ozone feedbacks on Kelvin and Rossby–gravity waves: Effects on the QBO, J. Atmos. Sci., 55, 1051–1062, https://doi.org/10.1175/1520-0469(1998)055<1051:AASOOF>2.0.CO;2, 1998.
DallaSanta, K., Orbe, C., Rind, D., Nazarenko, L., and Jonas, J.: Dynamical and trace gas responses of the Quasi-Biennial Oscillation to increased CO2, J. Geophys. Res.-Atmos., 126, e2020JD034151, https://doi.org/10.1029/2020JD034151, 2021.
Dickinson, R. E.: Method of parameterization for infrared cooling between altitudes of 30 and 70 km, J. Geophys. Res., 78, 4451–4457, https://doi.org/10.1029/JC078i021p04451, 1973.
Dunkerton, T. J.: The role of gravity waves in the quasi-biennial oscillation, J. Geophys. Res.-Atmos., 102, 26053–26076, https://doi.org/10.1029/96JD02999, 1997.
Ebdon, R. A.: Notes on the wind flow at 50 mb in tropical and subtropical regions in January 1957 and in 1958, Q. J. Roy. Meteorol. Soc., 86, 540–542, https://doi.org/10.1002/qj.49708637011, 1960.
Eichinger, R. and Šácha, P.: Overestimated acceleration of the advective Brewer-Dobson circulation due to stratospheric cooling, Q. J. Roy. Meteorol. Soc., 146, 3850–3864, https://doi.org/10.1002/qj.3876, 2020.
Fels, S. B.: A parameterization of scale-dependent radiative damping rates in the middle atmosphere, J. Atmos. Sci., 39, 1141–1152, https://doi.org/10.1175/1520-0469(1982)039<1141:APOSDR>2.0.CO;2, 1982.
Fels, S. B.: Radiative-dynamical interactions in the middle atmosphere, Adv. Geophys., 28, 277–300, https://doi.org/10.1016/S0065-2687(08)60227-7, 1985.
Garfinkel, C. I. and Hartmann, D. L.: The influence of the quasi-biennial oscillation on the troposphere in winter in a hierarchy of models, Part I: Simplified dry GCMs, J. Atmos. Sci., 68, 1273–1289, https://doi.org/10.1175/2011JAS3665.1, 2011a.
Garfinkel, C. I. and Hartmann, D. L.: The influence of the quasi-biennial oscillation on the troposphere in winter in a hierarchy of models, Part II: Perpetual winter WACCM runs, J. Atmos. Sci., 68, 2026–2041, https://doi.org/10.1175/2011JAS3702.1, 2011b.
Geller, M. A., Zhou, T., Shindell, D., Ruedy, R., Aleinov, I., Nazarenko, L., Tausnev, N. L., Kelley, M., Sun, S., Cheng, Y., Field, R. D., and Faluvegi, G.: Modeling the QBO-improvements resulting from higher-model vertical resolution, J. Adv. Model. Earth Sy., 8, 1092–1105, https://doi.org/10.1002/2016MS000699, 2016a.
Geller, M. A., Zhou, T., and Yuan, W.: The QBO, gravity waves forced by tropical convection, and ENSO, J. Geophys. Res.-Atmos., 121, 8886–8895, https://doi.org/10.1002/2015JD024125, 2016b.
Gidden, M. J., Riahi, K., Smith, S. J., Fujimori, S., Luderer, G., Kriegler, E., van Vuuren, D. P., van den Berg, M., Feng, L., Klein, D., Calvin, K., Doelman, J. C., Frank, S., Fricko, O., Harmsen, M., Hasegawa, T., Havlik, P., Hilaire, J., Hoesly, R., Horing, J., Popp, A., Stehfest, E., and Takahashi, K.: Global emissions pathways under different socioeconomic scenarios for use in CMIP6: a dataset of harmonized emissions trajectories through the end of the century, Geosci. Model Dev., 12, 1443–1475, https://doi.org/10.5194/gmd-12-1443-2019, 2019.
Giorgetta, M. A. and Doege, M. C.: Sensitivity of the Quasi-Biennial Oscillation to CO2 doubling, Geophys. Res. Lett., 32, L08701, https://doi.org/10.1029/2004GL021971, 2005.
Giorgetta, M. A., Bengtson, L., and Arpe, K.: An investigation of QBO signals in the east Asian and Indian monsoon in GCM experiments, Clim. Dynam., 15, 435–450, https://doi.org/10.1007/s003820050292, 1999.
Giorgetta, M. A., Manzini, E., and Roeckner, E.: Forcing of the quasi-biennial oscillation from a broad spectrum of atmospheric waves, Geophys. Res. Lett., 29, 1245, https://doi.org/10.1029/2002GL014756, 2002.
Giorgetta, M. A., Manzini, E., Roeckner, E., Esch, M., and Bengtsson, L.: Climatology and forcing of the quasi-biennial oscillation in the MAECHEM5 model, J. Climate, 19, 3882–3901, https://doi.org/10.1175/JCLI3830.1, 2006.
Gray, W. M.: Atlantic seasonal hurricane frequency, Part I: El Niño and 30 mb quasi-biennial oscillation influences, Mon. Weather Rev., 112, 1649–1688, https://doi.org/10.1175/1520-0493(1984)112<1649:ASHFPI>2.0.CO;2, 1984.
Gray, W. M., Sheaffer, J. D., and Knaff, J.: Influence of the Stratospheric QBO on ENSO Variability, J. Meteorol. Soc. Jpn., 70, 975–995, https://doi.org/10.2151/jmsj1965.70.5_975, 1992.
Hamilton, K.: The vertical structure of the quasi-biennial oscillation: Observations and theory, Atmos. Ocean, 19, 236–250, https://doi.org/10.1080/07055900.1981.9649111, 1981.
Hansen, F., Matthes, K., and Wahl, S.: Tropospheric QBO-ENSO interactions and differences between the Atlantic and Pacific, J. Climate, 29, 1353–1368, https://doi.org/10.1175/JCLI-D-15-0164.1, 2016.
Hasebe, F.: Quasi-biennial oscillations of ozone and diabatic circulation in the equatorial stratosphere, J. Atmos. Sci., 51, 729–745, https://doi.org/10.1175/1520-0469(1994)051<0729:QBOOOA>2.0.CO;2, 1994.
Hitchman, M. H. and Huesmann, A. S.: Seasonal influence of the quasi-biennial oscillation on stratospheric jets and Rossby wave breaking, J. Atmos. Sci., 66, 935–946, https://doi.org/10.1175/2008JAS2631.1, 2009.
Ho, C.-H., Kim, H.-S., Jeong, J.-H., and Son, S.-W.: Influence of stratospheric quasi-biennial oscillation on tropical cyclone tracks in the western North Pacific, Geophys. Res. Lett., 36, L06702, https://doi.org/10.1029/2009GL037163, 2009.
Holt, L., Lott, F., Garcia, R., Kiladis, G. N., Anstey, J. A., Braesicke, P., Bushell, A. C., Butchart, N., Cagnazzo, C., Chen, C.-C., Chun, H.-Y., Hamilton, K., Kawatani, Y., Kerzenmacher, T., Kim, Y.-H., McLandress, C., Naoe, H., Osprey, S., Richter, J. H., Scinocca, J., Serva, F., Versick, S., Watanabe, S., Yoshida, K., and Yukimoto, S.: An evaluation of tropical waves and wave forcing of the QBO in the QBOi models, Q. J. Roy. Meteorol. Soc., https://doi.org/10.1002/qj.3827, in press, 2020.
Holton, J. R. and Lindzen, R. S.: An updated theory for the quasi-biennial cycle of the tropical stratosphere, J. Atmos. Sci., 29, 1076–1080, https://doi.org/10.1175/1520-0469(1972)029<1076:AUTFTQ>2.0.CO;2, 1972.
Holton, J. R. and Tan, H.: The Influence of the equatorial quasi-biennial oscillation on the global circulation at 50 mb, J. Atmos. Sci., 37, 2200–2208, https://doi.org/10.1175/1520-0469(1980)037<2200:TIOTEQ>2.0.CO;2, 1980.
Huang, B. H., Hu, Z. Z., Kinter, J. L., Wu, Z. H., and Kumar, A.: Connection of stratospheric QBO with global atmospheric general circulation and tropical SST, Part I: Methodology and composite life cycle, Clim. Dynam., 38, 1–23, https://doi.org/10.1007/s00382-011-1250-7, 2012.
Jin, Z., Zhang, Y.-C., Del Genio, A., Schmidt, G., and Kelley, M.: Cloud scattering impact on thermal radiative transfer and global longwave radiation, J. Quant. Spectrosc. Ra., 239, 106669, https://doi.org/10.1016/j.jqsrt.2019.106669, 2019.
Jonsson, A., de Grandpre, J., Fomichev, V., McConnell, J., and Beagley, S.: Doubled CO2-induced cooling in the middle atmosphere: Photochemical analysis of the ozone radiative feedback, J. Geophys. Res.-Atmos., 109, D24103, https://doi.org/10.1029/2004JD005093, 2004.
Kawatani, Y. and Hamilton, K.: Weakened stratospheric Quasi-Biennial Oscillation driven by increased tropical mean upwelling, Nature, 497, 478–481, https://doi.org/10.1038/nature12140, 2013.
Kawatani, Y., Takahashi, M., Sato, K., Alexander, S. P., and Tsuda, T.: Global distribution of atmospheric waves in the equatorial upper troposphere and lower stratosphere: AGCM simulation of sources and propagation, J. Geophys. Res.-Atmos., 114, D01102, https://doi.org/10.1029/2008JD010374, 2009.
Kawatani, Y., Watanabe, S., Sato, K., Dunkerton, T. J., Miyahara, S., and Takahashi, M.: The roles of equatorial trapped waves and internal inertia-gravity waves in driving the Quasi-Biennial oscillation, Part I: Zonal mean wave forcing, J. Atmos. Sci., 67, 963–980, https://doi.org/10.1175/2009JAS3222.1, 2010.
Kawatani, Y., Hamilton, K., and Watanabe, S.: The quasi-biennial oscillation in a double CO2 climate, J. Atmos. Sci., 68, 265–283, https://doi.org/10.1175/2010JAS3623.1, 2011.
Kawatani, Y., Lee, J. N., and Hamilton, K.: Interannual variations of stratospheric water vapor in MLS observations and climate model simulations, J. Atmos. Sci., 71, 4072–4085, https://doi.org/10.1175/JAS-D-14-0164.1, 2014.
Kawatani, Y., Hamilton, K., Sato, K., Dunkerton, T. J., Watanabe, S., and Kikuchi, K.: ENSO Modulation of the QBO: Results from MIROC Models with and without Nonorographic Gravity Wave Parameterization, J. Atmos. Sci., 76, 3893–3917, https://doi.org/10.1175/JAS-D-19-0163.1, 2019.
Keeble, J., Hassler, B., Banerjee, A., Checa-Garcia, R., Chiodo, G., Davis, S., Eyring, V., Griffiths, P. T., Morgenstern, O., Nowack, P., Zeng, G., Zhang, J., Bodeker, G., Burrows, S., Cameron-Smith, P., Cugnet, D., Danek, C., Deushi, M., Horowitz, L. W., Kubin, A., Li, L., Lohmann, G., Michou, M., Mills, M. J., Nabat, P., Olivié, D., Park, S., Seland, Ø., Stoll, J., Wieners, K.-H., and Wu, T.: Evaluating stratospheric ozone and water vapour changes in CMIP6 models from 1850 to 2100, Atmos. Chem. Phys., 21, 5015–5061, https://doi.org/10.5194/acp-21-5015-2021, 2021.
Labitzke, K.: On the interannual variability of the middle stratosphere during the northern winters, J. Meteorol. Soc. Jpn., 80, 963–971, https://doi.org/10.2151/jmsj1965.60.1_124, 1982.
Lait, L. R., Schoeberl, M. R., and Newman, P. A.: Quasi-biennial modulation of the Antarctic ozone depletion, J. Geophys. Res.-Atmos., 94, 11559–11571, https://doi.org/10.1029/JD094iD09p11559, 1989.
Li, F., Austin, J., and Wilson, R. J.: The strength of the Brewer-Dobson circulation in a changing climate: Coupled chemistry-climate model simulations, J. Climate, 21, 40–57, https://doi.org/10.1175/2007JCLI1663.1, 2008.
Liess, S. and Geller, M. A.: On the relationship between QBO and distribution of tropical deep convection, J. Geophys. Res.-Atmos., 117, D03108, https://doi.org/10.1029/2011JD016317, 2012.
Lindzen, R. S.: Equatorial planetary waves in shear: Part I, J. Atmos. Sci., 28, 609–622, https://doi.org/10.1175/1520-0469(1971)028<0609:EPWISP>2.0.CO;2, 1971.
Lindzen, R. S. and Holton, J. R.: A theory of the quasi-biennial oscillation, J. Atmos. Sci., 25, 1095–1107, https://doi.org/10.1175/1520-0469(1968)025<1095:ATOTQB>2.0.CO;2, 1968.
Marshall, A. G. and Scaife, A. A.: Impact of the QBO on surface winter climate, J. Geophys. Res.-Atmos., 114, D18110, https://doi.org/10.1029/2009JD011737, 2009.
Match, A. and Fueglistaler, S.: The buffer zone of the quasi-biennial oscillation, J. Atmos. Sci., 76, 3553–3567, https://doi.org/10.1175/JAS-D-19-0151.1, 2019.
Match, A. and Fueglistaler, S.: Mean-flow damping forms the buffer zone of the quasi-biennial oscillation: 1D theory, J. Atmos. Sci., 77, 1955–1967, https://doi.org/10.1175/JAS-D-19-0293.1, 2020.
Matsuno, T.: Numerical integrations of primitive equations by use of a simulated backward difference method, J. Meteorol. Soc. Jpn., 44, 76–84, https://doi.org/10.2151/jmsj1965.44.1_76, 1966.
Orbe, C., Rind, D., Jonas, J., Nazarenko, L., Faluvegi, G., Murray, L. T., Shindell, D. T., Tsigaridis, K., Zhou, T., Kelley, M., and Schmidt, G.: GISS Model E2.2: A climate model optimized for the middle atmosphere, Part 2: Validation of large-scale transport and evaluation of climate response, J. Geophys. Res.-Atmos., 125, e2020JD033151, https://doi.org/10.1029/2020JD033151, 2020.
Pawson, S., Harwood, R. S., and Haigh, J. D.: A study of the radiative dissipation of planetary waves using satellite data, J. Atmos. Sci., 49, 1304–1317, https://doi.org/10.1175/1520-0469(1992)049<1304:ASOTRD>2.0.CO;2, 1992.
Plumb, R. A.: The interaction of two internal waves with the mean flow: Implications for the theory of the quasi-biennial oscillation, J. Atmos. Sci., 34, 1847–1858, https://doi.org/10.1175/1520-0469(1977)034<1847:TIOTIW>2.0.CO;2, 1977.
Reed, R. J., Campbell, W. J., Rasmussen, L. A., and Rogers, D. G.: Evidence of a downward-propagating, annual wind reversal in the equatorial stratosphere, J. Geophys. Res., 66, 813–818, https://doi.org/10.1029/JZ066i003p00813, 1961.
Richter, J. H., Anstey, J. A., Butchart, N., Kawatani, Y., Meehl, G. A., Osprey, S., and Simpson, I. R.: Progress in simulating the quasi-biennial oscillation in CMIP models, J. Geophys. Res.-Atmos., 125, e2019JD032362, https://doi.org/10.1029/2019JD032362, 2020a.
Richter, J. H., Butchart, N., Kawatani, Y., Bushell, A. C., Holt, L., Serva, F., Anstey, J., Simpson, I. R., Osprey, S., Hamilton, K., Braesicke, P., Cagnazzo, C., Chen, C.-C., Garcia, R. R., Gray, L. J., Kerzenmacher, T., Lott, F., McLandress, C., Naoe, H., Scinocca, J., Stockdale, T. N., Versick, S., Watanabe, S., Yoshida, K., and Yukimoto, S.: Response of the Quasi-Biennial Oscillation to a warming climate in global climate models, Q. J. Roy. Meteorol. Soc., https://doi.org/10.1002/qj.3749, in press, 2020b.
Rind, D., Jonas, J., Balachandran, N., Schmidt, G., and Lean, J.: The QBO in two GISS global climate models: 1. Generation of the QBO, J. Geophys. Res.-Atmos., 119, 8798–8824, https://doi.org/10.1002/2014JD021678, 2014.
Rind, D., Orbe, C., Jonas, J., Nazarenko, L., Zhou, T., Kelley, M., Lacis, A., Shindell, D., Faluvegi, G., Russell, G., Bauer, M., Schmidt, G., Romanou, A., and Tausnev, N.: GISS Model E2.2: A climate model optimized for the middle atmosphere – Model structure, climatology, variability and climate sensitivity, J. Geophys. Res.-Atmos., 125, e2019JD032204, https://doi.org/10.1029/2019JD032204, 2020.
Saravanan, R.: A multiwave model of the quasi-biennial oscillation, J. Atmos. Sci., 47, 2465–2474, https://doi.org/10.1175/1520-0469(1990)047<2465:AMMOTQ>2.0.CO;2, 1990.
Scaife, A. A., Butchart, N., Warner, C. D., Stainforth, D., Norton, W., and Austin, J.: Realistic quasi-biennial oscillations in a simulation of the global climate, Geophys. Res. Lett., 27, 3481–3484, https://doi.org/10.1029/2000GL011625, 2000.
Schirber, S., Manzini, E., Krismer, T., and Giorgetta, M.: The Quasi-Biennial Oscillation in a warmer climate: sensitivity to different gravity wave parameterizations, Clim. Dynam., 45, 825–836, https://doi.org/10.1007/s00382-014-2314-2, 2015.
Shibata, K. and Deushi, M.: Radiative effect of ozone on the quasi- biennial oscillation in the equatorial stratosphere, Geophys. Res. Lett., 32, L24802, https://doi.org/10.1029/2005GL023433, 2005.
Trepte, C. R. and Hitchman, M. H.: Tropical stratospheric circulation deduced from satellite aerosol data, Nature, 355, 626–628, https://doi.org/10.1038/355626a0, 1992.
Watanabe, S. and Kawatani, Y.: Sensitivity of the QBO to mean tropical upwelling under a changing climate simulated with an Earth System Model, J. Meteorol. Soc. Jpn., 90, 351–360, https://doi.org/10.2151/jmsj.2012-A20, 2012.
Yoo, C. and Son, S.-W.: Modulation of the boreal wintertime Madden-Julian oscillation by the stratospheric quasi-biennial oscillation, Geophys. Res. Lett., 43, 1392–1398, https://doi.org/10.1002/2016GL067762, 2016.
Zawodny, J. M. and McCormick, M. P.: Stratospheric Aerosol and Gas Experiment II measurements of the quasi-biennial oscilla- tions in ozone and nitrogen dioxide, J. Geophys. Res.-Atmos., 96, 9371–9377, https://doi.org/10.1029/91JD00517, 1991.
Strictly speaking, it is the HL model modified by Plumb (1977). In this paper, we do not use his eponymous model, i.e., the simplest possible model of the QBO, where Boussinesq fluids with uniform mean density were employed because the HL model and its variant are considerably more realistic.
- Abstract
- Introduction
- Sensitivity of the QBO period to enhanced stratospheric radiative damping in the original HL model
- Sensitivity of the QBO period to enhanced stratospheric radiative damping in the modified HL model without the semiannual forcing
- Discussion
- Conclusions
- Data availability
- Author contributions
- Competing interests
- Acknowledgements
- Financial support
- Review statement
- References