the Creative Commons Attribution 4.0 License.
the Creative Commons Attribution 4.0 License.
 | 12 May 2021
Source apportionment of fine organic carbon at an urban site of Beijing using a chemical mass balance model
Jingsha Xu
Di Liu
Xuefang Wu
Tuan V. Vu
Yanli Zhang
Pingqing Fu
Weiqi Xu
Fine particles were sampled from 9 November to 11 December 2016 and 22 May to 24 June 2017 as part of the Atmospheric Pollution and Human Health in a Chinese Megacity (APHH-China) field campaigns in urban Beijing, China. Inorganic ions, trace elements, organic carbon (OC), elemental carbon (EC), and organic compounds, including biomarkers, hopanes, polycyclic aromatic hydrocarbons (PAHs), n-alkanes, and fatty acids, were determined for source apportionment in this study. Carbonaceous components contributed on average 47.2 % and 35.2 % of total reconstructed PM2.5 during the winter and summer campaigns, respectively. Secondary inorganic ions (sulfate, nitrate, ammonium; SNA) accounted for 35.0 % and 45.2 % of total PM2.5 in winter and summer. Other components including inorganic ions (K+, Na+, Cl−), geological minerals, and trace metals only contributed 13.2 % and 12.4 % of PM2.5 during the winter and summer campaigns. Fine OC was explained by seven primary sources (industrial and residential coal burning, biomass burning, gasoline and diesel vehicles, cooking, and vegetative detritus) based on a chemical mass balance (CMB) receptor model. It explained an average of 75.7 % and 56.1 % of fine OC in winter and summer, respectively. Other (unexplained) OC was compared with the secondary OC (SOC) estimated by the EC-tracer method, with correlation coefficients (R2) of 0.58 and 0.73 and slopes of 1.16 and 0.80 in winter and summer, respectively. This suggests that the unexplained OC by the CMB model was mostly associated with SOC. PM2.5 apportioned by the CMB model showed that the SNA and secondary organic matter were the two highest contributors to PM2.5. After these, coal combustion and biomass burning were also significant sources of PM2.5 in winter. The CMB results were also compared with results from the positive matrix factorization (PMF) analysis of co-located aerosol mass spectrometer (AMS) data. The CMB model was found to resolve more primary organic aerosol (OA) sources than AMS-PMF, but the latter could apportion secondary OA sources. The AMS-PMF results for major components, such as coal combustion OC and oxidized OC, correlated well with the results from the CMB model. However, discrepancies and poor agreements were found for other OC sources, such as biomass burning and cooking, some of which were not identified in AMS-PMF factors.
- Article
(6742 KB) - Full-text XML
-
Supplement
(463 KB) - BibTeX
- EndNote


Beijing is the capital of China and a hotspot of particulate matter pollution. It has been experiencing severe PM2.5 (particulate matter with an aerodynamic diameter of ≤ 2.5 µm) pollution in recent decades as a result of rapid urbanization and industrialization and increasing energy consumption (Wang et al., 2009). High PM2.5 pollution from Beijing could have a significant impact on human health (Song et al., 2006a; Li et al., 2013). A case study in Beijing revealed that a 10 µg m−3 increase in ambient PM2.5 concentration will correspondingly increase 0.78 %, 0.85 %, and 0.75 % of the daily mortality of the circulatory diseases, cardiovascular diseases, and cerebrovascular diseases, respectively (Dong et al., 2013). Furthermore, PM2.5 causes visibility deterioration in Beijing. A better understanding of PM2.5 sources in Beijing is essential as it can provide important scientific evidence to develop measures to control PM2.5 pollution.
Many studies have identified the possible sources of fine particulate matter in Beijing using various methods (Zheng et al., 2005; Song et al., 2006a, b; Li et al., 2015; Zhang et al., 2013; Yu and Wang, 2013). Song et al. (2006a) applied two eigenvector models, principal component analysis and absolute principal component scores (PCA/APCSs) and UNMIX, to study the sources of PM2.5 in Beijing. Some studies used elemental tracers to do source apportionment of PM2.5 by applying positive matrix factorization (PMF) (Song et al., 2006b; Li et al., 2015; Zhang et al., 2013; Yu and Wang, 2013). This approach has some underlying challenges. For example, PMF requires a relatively large sample size, and a “best” solution of achieved factors requires a critical assessment of its mathematical parameters and evaluation of the physical reasonability of the factor profiles (de Miranda et al., 2018; Ikemori et al., 2021; Oduber et al., 2021); secondly, many important PM2.5 emission sources do not have a unique elemental composition. Hence, an elemental tracer-based method cannot distinguish sources such as cooking or vehicle exhaust as they emit mainly carbonaceous compounds (Wang et al., 2009). Generally, organic matter (OM) is composed of primary organic matter (POM) and secondary organic matter (SOM). POM is directly emitted, and SOM is formed through the chemical oxidation of volatile organic compounds (VOCs) (Yang et al., 2016). OM was the largest contributor to PM2.5 mass, which was reported to account for 30 %–50 % of PM2.5 in some Chinese cities such as Beijing, Guangzhou, Xi'an, and Shanghai (Song et al., 2007; He et al., 2001; Huang et al., 2014), and can contribute up to 90 % of submicron PM mass in Beijing (Zhou et al., 2018). Furthermore, many organic tracers are more specific to particular sources, making them more suitable to identify and quantify different source contributions to carbonaceous aerosols and PM2.5.
A chemical mass balance (CMB) model has been used for source apportionment of PM worldwide, including in the US (Antony Chen et al., 2010), UK (Yin et al., 2015) and China (P. Chen et al., 2015). The CMB model assumes that source profiles remain unchanged between the emitter and receptor (Sarnat et al., 2008; Viana et al., 2008). The good performance of the CMB model and its comparability with other receptor modeling techniques were demonstrated in an intercomparison exercise conducted in Beijing (Xu et al., 2021). A few studies also have applied a CMB model for source apportionment of PM in Beijing (Zheng et al., 2005; Liu et al., 2016; Guo et al., 2013; Wang et al., 2009). For example, Zheng et al. (2005) investigated sources of PM2.5 in Beijing, but the source profiles they used were mainly derived in the United States, which were less representative of the local sources. Liu et al. (2016) and Guo et al. (2013) apportioned the sources of PM2.5 in a typical haze episode in winter 2013 in Beijing and during the Olympic Games period in summer 2008, respectively. Wang et al. (2009) apportioned the sources of PM2.5 in both winter and summer. A major challenge of the CMB model is that it cannot quantify the contributions of secondary organic aerosol (SOA) and unknown sources, which are often lumped as “unexplained organic carbon (OC)”.
In this study, PM2.5 samples were collected at an urban site of Beijing in winter 2016 and summer 2017. OC, elemental carbon (EC), polycyclic aromatic hydrocarbons (PAHs), alkanes, hopanes, fatty acids, and monosaccharide anhydrides in the PM2.5 samples were determined and applied in the CMB model for apportioning the organic carbon sources. To ensure that the source profiles used in the CMB model are representative, we mainly selected data which had been determined in China. The objectives of this study are 1) to quantify the contributions of pollution sources to OC by applying a CMB model and compare them with those at a rural site of Beijing and 2) to compare the source apportionment results by CMB with those from aerosol mass spectrometer–PMF analysis (AMS-PMF) to improve our understanding of different sources of OC.
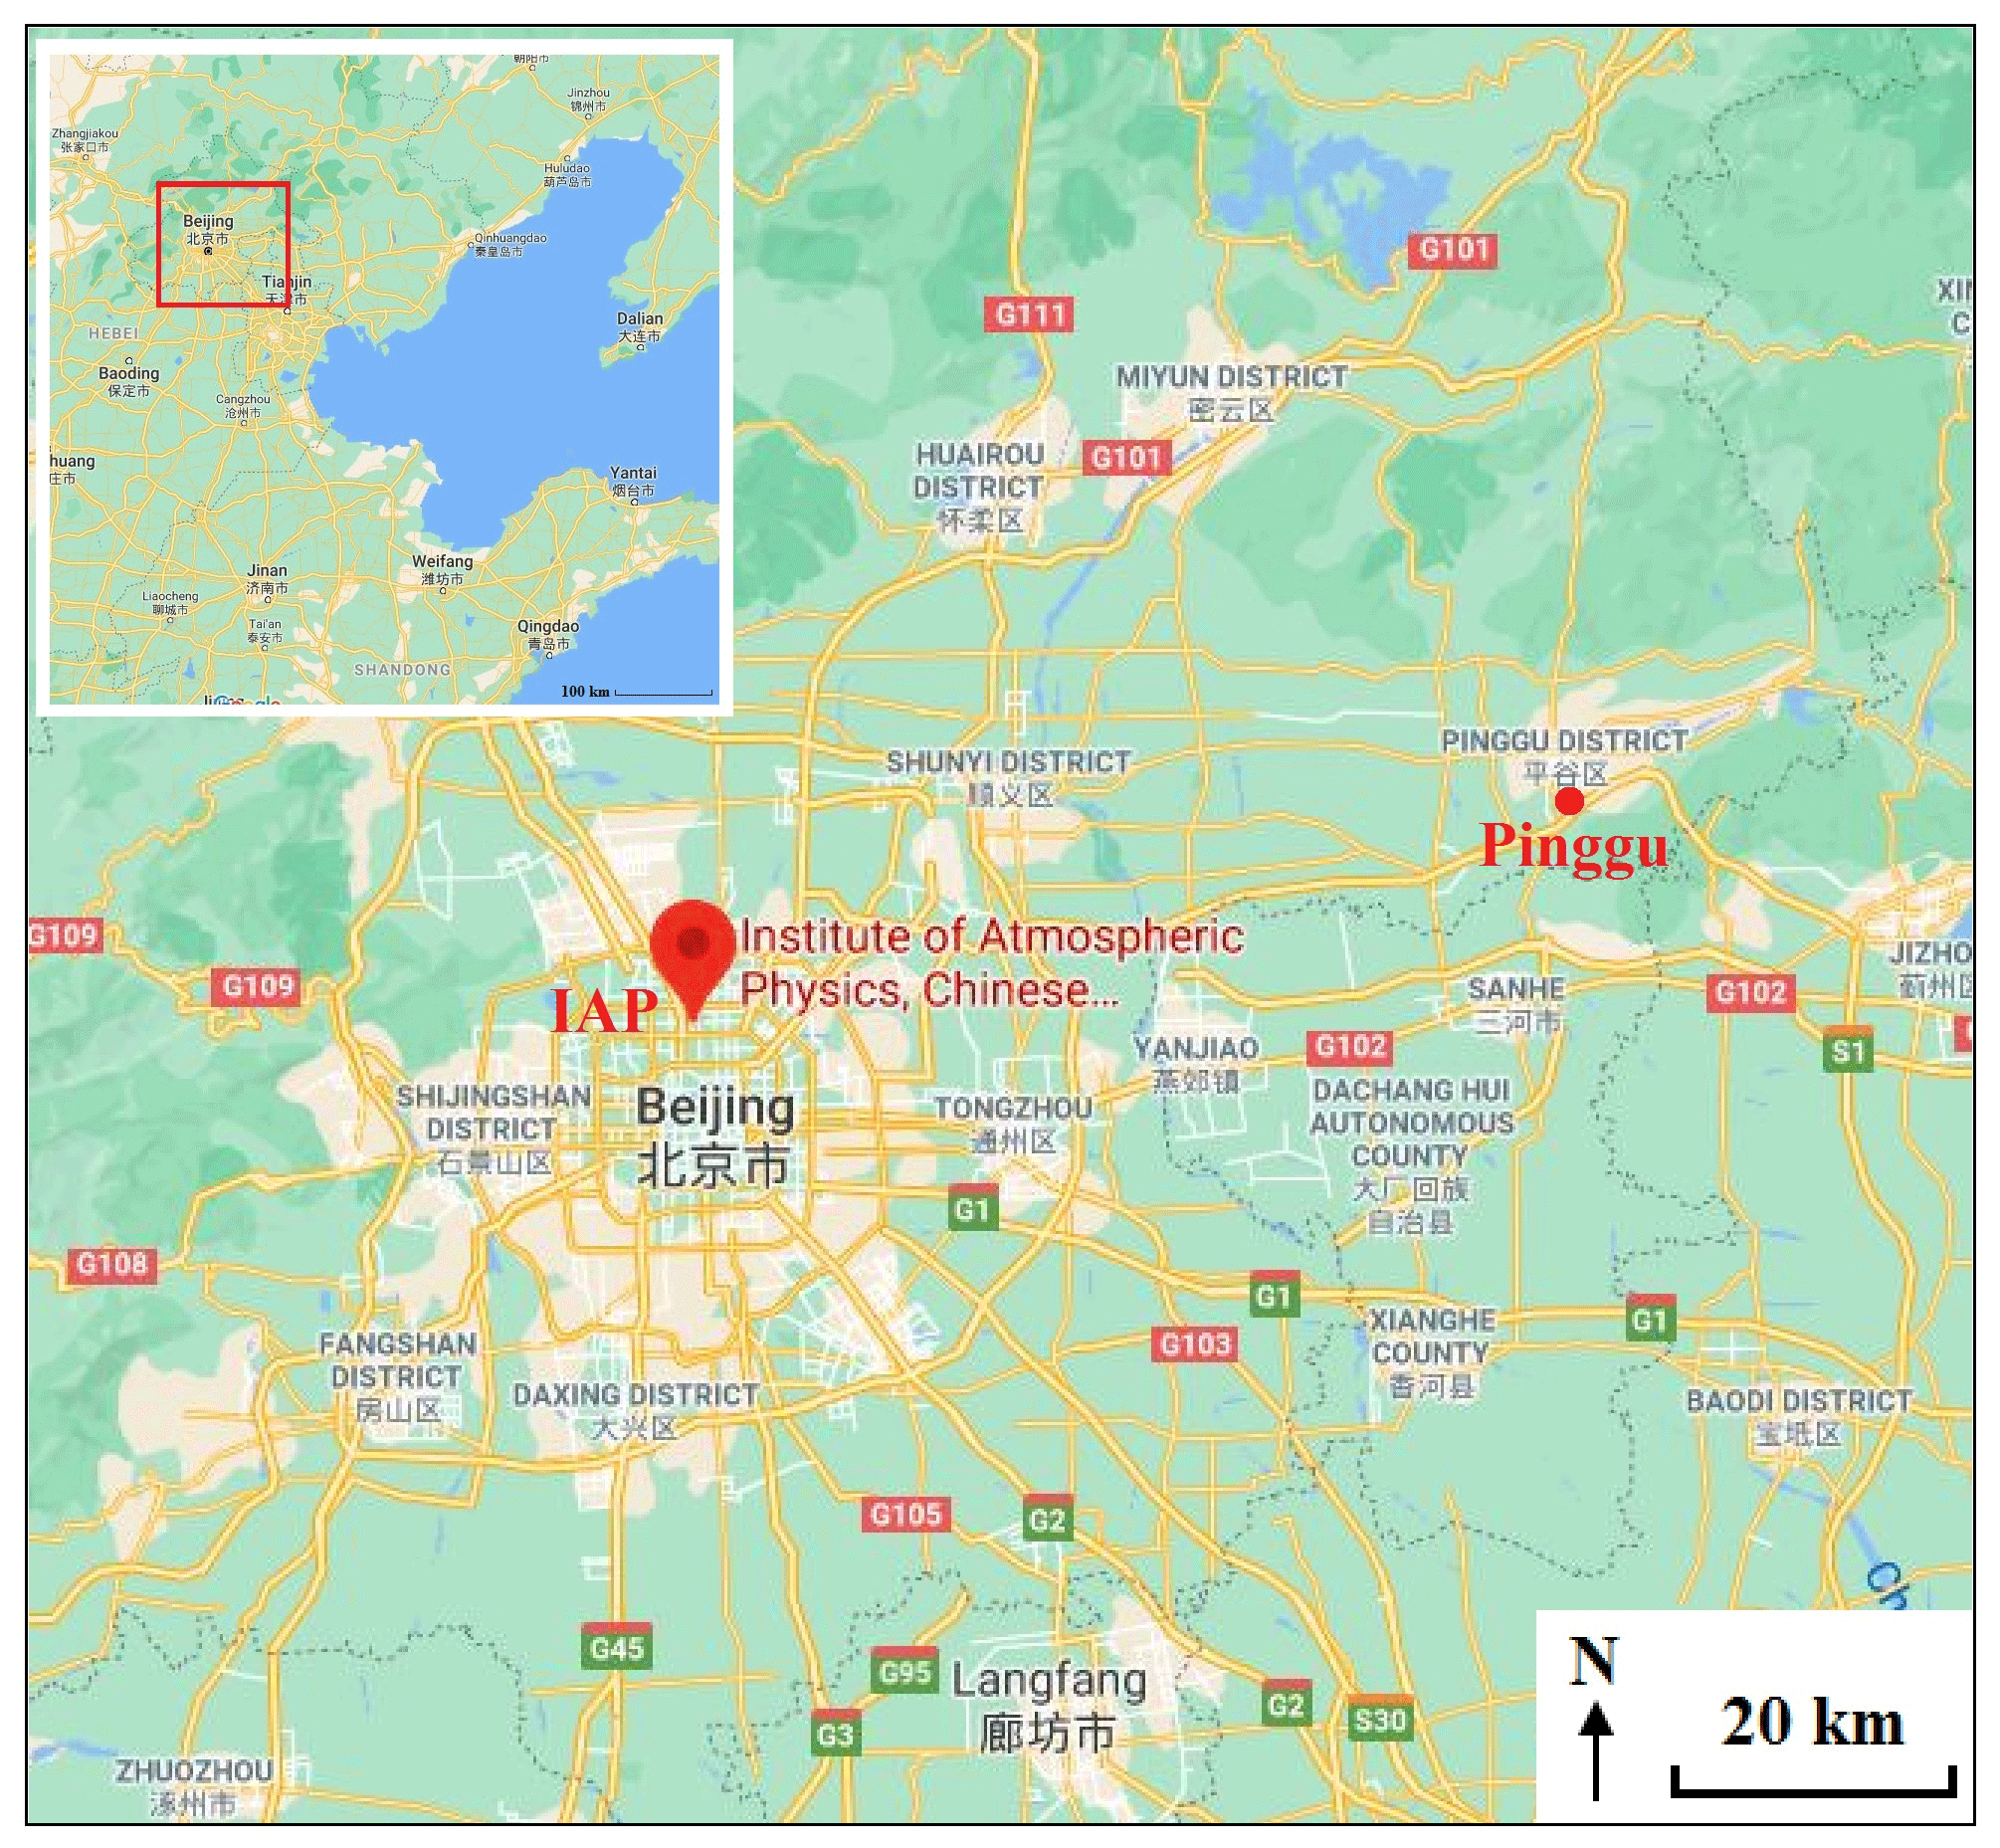
Figure 1Locations of the sampling sites in Beijing (IAP – urban site: Institute of Atmospheric Physics of the Chinese Academy of Sciences; Pinggu – rural site) (source: © Google Maps).
2.1 Aerosol sampling
PM2.5 was collected at an urban sampling site (39.98∘ N, 116.39∘ E), the Institute of Atmospheric Physics (IAP) of the Chinese Academy of Sciences in Beijing, China, from 9 November to 11 December 2016 and 22 May to 24 June 2017 as part of the Atmospheric Pollution and Human Health in a Chinese Megacity (APHH-China) field campaigns (Shi et al., 2019). The sampling site (Fig. 1) is located in the middle between the North 3rd Ring Road and North 4th Ring Road and approximately 200 m from a major highway. Hence, it is subject to many local sources, such as traffic, cooking, etc. The location of a rural site in Beijing–Pinggu during the APHH-China campaigns is also shown in Fig. 1. The rural site in Xibaidian village in Pinggu is about 60 km away from IAP and 4 km northwest of Pinggu town center. It is surrounded by trees and farmland with several similar small villages nearby. A provincial highway is approximately 500 m away on its east side running north–south. This site is far from industrial sources and located in a residential area. Other information regarding the sampling site is described elsewhere (Shi et al., 2019).
PM2.5 samples were collected on pre-baked (450 ∘C for 6 h) large quartz filters (Pallflex, 8 in × 10 in) by high volume air sampler (Tisch, USA) at a flow rate of 1.1 m3 min−1. A medium volume air sampler (Thermo Scientific Partisol 2025i) was also deployed at the same location to collect PM2.5 samples simultaneously on 47 mm PTFE filters at a flow rate of 15.0 L min−1. Field blanks were also collected with the pump turned off during the sampling campaign. Before and after sampling, all filters were put in a balance room and equilibrated at a constant temperature and relative humidity (RH) for 24 h prior to any gravimetric measurements, which were 22 ∘C and 30 % RH for summer samples and 21 ∘C and 33 % RH for winter samples. PM2.5 mass was determined through the weighing of PTFE filters using a microbalance (Sartorius model MC5; precision: 1 µg). After that, filters were wrapped separately with aluminum foil and stored at under −20 ∘C in darkness until analysis. The large quartz filters were analyzed for OC, EC, organic compounds, and ion species, while small PTFE filters were used for the determination of PM2.5 mass and metals. Online PM2.5 concentrations were determined by the TEOM FDMS 1405-DF instrument at IAP with filter equilibrating and weighing conditions comparable with the United States Federal Reference Method (RH: 30 %–40 %; temperature: 20–23 ∘C) (Le et al., 2020; U.S.EPA, 2016).
2.2 Chemical analysis
2.2.1 OC and EC
A 1.5 cm2 punch from each large quartz filter sample was taken for organic carbon (OC) and elemental carbon (EC) measurements by a thermal-optical carbon analyzer (model RT-4, Sunset Laboratory Inc., USA) based on the EUSAAR2 (European Supersites for Atmospheric Aerosol Research) transmittance protocol (Cavalli et al., 2010; L.-W. A. Chen et al., 2015). Replicate analyses of OC and EC were conducted once every 10 samples. The uncertainties from duplicate analyses of filters were < 10 %. All sample results were corrected by the values obtained from field blanks, which were 0.40 and 0.01 µg m−3 for OC and EC, respectively. Details of the measurement method can be found elsewhere (Paraskevopoulou et al., 2014). The instrumental limits of detection of OC and EC in this study were estimated to be 0.03 and 0.05 µg m−3, respectively.
2.2.2 Organic compounds
Organic tracers, including 11 n-alkanes (C24-C34), 2 hopanes (17a(H)-22,29,30-trisnorhopane, 17b(H),21a(H)-norhopane), 17 PAHs (retene, phenanthrene, anthracene, fluoranthene, pyrene, benz(a)anthracene, chrysene, benzo(b)fluoranthene, benzo(k)fluoranthene, benzo(e)pyrene, benzo(a)pyrene, perylene, indeno(1,2,3-cd)pyrene, dibenz(a,h)anthracene, benzo(ghi)perylene, coronene, picene), 3 anhydrosugars (levoglucosan, mannosan, galactosan), 2 fatty acids (palmitic acid, stearic acid), and cholesterol, in the PM2.5 samples were determined in this study. A total of 9 cm2 of the large quartz filters was extracted three times with dichloromethane and methanol (HPLC grade; : 2:1) under ultrasonication for 10 min. The extracts were then filtered and concentrated using a rotary evaporator under vacuum and blown down to dryness with pure nitrogen gas. A total of 50 µL of N,O-bis-(trimethylsilyl)trifluoroacetamide (BSTFA) with 1 % trimethylsilyl (TMS) chloride and 10 µL of pyridine was then added to the extracts, which were left reacting at 70 ∘C for 3 h to derivatize -COOH to TMS esters and -OH to TMS ethers. After cooling to room temperature, the derivatives were diluted with 140 µL of internal standards (C13 n-alkane, 1.43 ng µL−1) in n-hexane prior to GC-MS (gas chromatography mass spectrometry) analysis. The final solutions were analyzed by a gas chromatography mass spectrometry system (GC-MS; Agilent 7890A GC plus 5975C mass-selective detector) fitted with a DB-5MS column (30 m × 0.25 mm × 0.25 µm). The GC temperature program and MS detection details were reported in Li et al. (2018). Individual compounds were identified through the comparison of mass spectra with those of authentic standards or literature data (Fu et al., 2016). Recoveries for these compounds were in a range of 70 %–100 %, which was obtained by spiking standards to pre-baked blank quartz filters followed by the same extraction and derivatization procedures. Field blank filters were analyzed the same way as samples for quality assurance, but no target compounds were detected.
2.2.3 Inorganic components
Half of the PTFE filter was extracted with 10 mL ultrapure water for the analysis of inorganic ions. Major inorganic ions including Na+, K+, , Cl−, , and were determined by using an ion chromatograph (IC; Dionex, Sunnyvale, CA, USA), and the detection limits (DLs) of them were 0.032, 0.010, 0.011, 0.076, 0.138, 0.240, and 0.142 µg m−3, respectively. The analytical uncertainty was less than 5 % for all inorganic ions. An intercomparison study showed that our IC analysis of the abovementioned ions agreed well with those of the other laboratories (Xu et al., 2020).
For winter samples, crustal elements including Al (DLs in µg m−3; 0.221), Si (0.040), Ca (0.034), Ti (0.003), and Fe (0.044) were determined by X-ray fluorescence spectrometry (XRF), and trace metals including V, Cr, Co, Mn, Ni, Cu, Zn, As, Sr, Cd, Sb, Ba, and Pb were analyzed by inductively coupled plasma mass spectrometry (ICP-MS) after the extraction of one-half of the PTFE filter by diluted acid mixture (HNO3 and HCl) with a detection limit of 1.32, 0.25, 0.04, 0.06, 2.05, 1.25, 1.22, 1.74, 0.02, 0.03, 0.11, 0.06, and 0.04 ng m−3, respectively. For summer samples, apart from Al, Si, Ca, Ti, and Fe as mentioned above, V, Cr, Co, Mn, Ni, Cu, Zn, As, Sr, Cd, Sb, Ba, and Pb were also analyzed by XRF with the DLs of 0.004, 0.002, 0.0005, 0.001, 0.005, 0.026, 0.002, 0.0004, 0.001, 0.013, 0.077, 0.0004, and 0.003 µg m−3, respectively. More details are given in Srivastava et al. (2021). Mass concentrations of all inorganic ions and elements in this study were corrected for the field blank values, and the methods were quality assured with standard reference materials.
2.3 Chemical mass closure (CMC) method
A chemical mass closure analysis was carried out, which includes secondary inorganic ions (sulfate, nitrate, ammonium; SNA), sodium, potassium, and chloride salts, geological minerals, trace elements, organic matter (OM), EC, and bound water in reconstructed PM2.5. Geological minerals were calculated by applying Eq. (1) (Chow et al., 2015).
Trace elements were the sum of all analyzed elements excluding Al, Si, Ca, Ti, and Fe. The average ratios of organic aerosols (OAs) from AMS elemental analysis were applied to calculate OM, which were 1.75 ± 0.16 and 2.00 ± 0.19 in winter and summer, respectively. Based on the concentrations of inorganic ions and gas-phase NH3, particle bound water was calculated with the ISORROPIA II model (available at http://isorropia.eas.gatech.edu, last access: July 2020) in forward mode and thermodynamically metastable phase state (Fountoukis and Nenes, 2007). Two sets of calculations were done for online and offline data, differing in the temperature and relative humidity as specified above.
Table 1Summary of measured concentrations at IAP site in winter and summer.
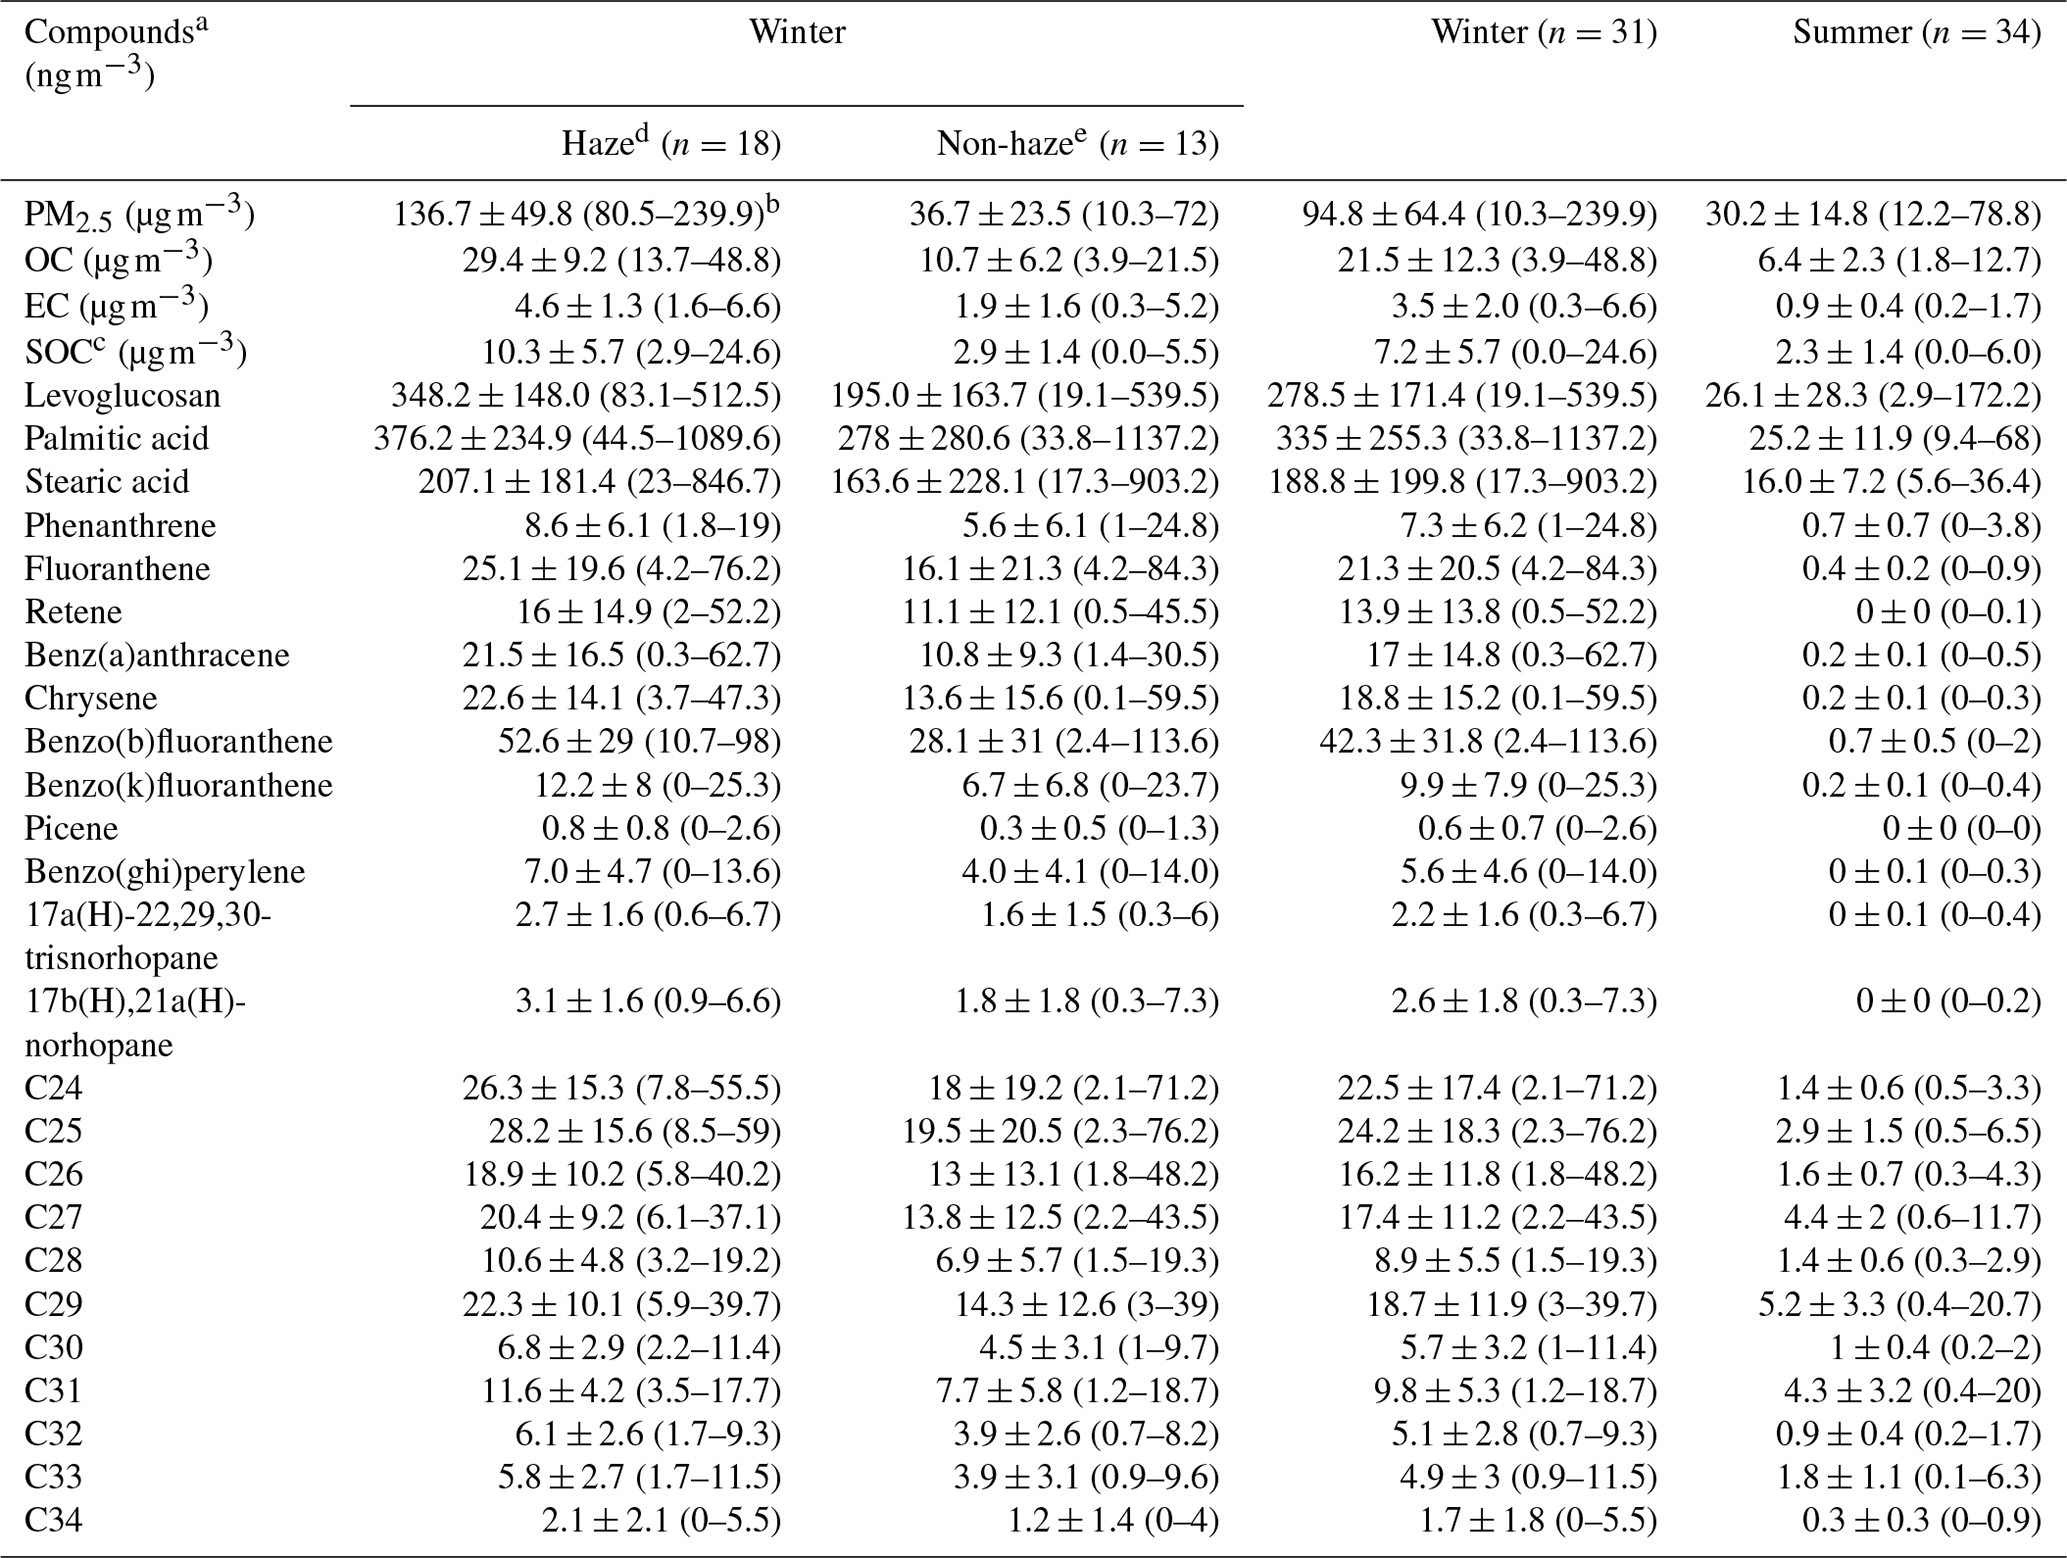
a The unit is nanograms per cubic meter (ng m−3) for all organic compounds and microgram per cubic meter (µg m−3) for PM2.5, OC, EC, and SOC; b mean ± SD (min–max); c SOC concentration was calculated by EC-tracer method; d haze days: PM2.5 ≥ 75 µg m−3; e non-haze days: PM2.5< 75 µg m−3.
2.4 Chemical mass balance (CMB) model
The chemical mass balance model (US EPA CMB8.2) was applied in this study to apportion the sources of OC by utilizing a linear least squares solution. Uncertainties in both source profiles and ambient measurements were taken into consideration in this model. The source profiles applied here were from local studies in China to better represent the source characteristics, including straw burning (wheat, corn, rice straw burning) (Y.-X. Zhang et al., 2007), wood burning (Wang et al., 2009), gasoline and diesel vehicles (including motorcycles, light- and heavy-duty gasoline and diesel vehicles) (Cai et al., 2017), industrial and residential coal combustion (including anthracite, sub-bituminite, bituminite, and brown coal) (Zhang et al., 2008), and cooking (Zhao et al., 2015), except vegetative detritus (Rogge et al., 1993; Wang et al., 2009). The source profiles with EC and organic tracers used in the CMB model were provided in Table S1 of Wu et al. (2020). The selected fitting species were EC, levoglucosan, palmitic acid, stearic acid, fluoranthene, phenanthrene, retene, benz(a)anthracene, chrysene, benzo(b)fluoranthene, benzo(k)fluoranthene, benzo[ghi]perylene, picene, 17a(H)-22,29,30-trisnorhopane, 17b(H),21a(H)-norhopane, and n-alkanes (C24–C33), the concentrations of which are provided in Table 1. The essential criteria in this model were met to ensure reliable fitting results. For instance, in all samples, R2 values were > 0.80 (mostly > 0.9), Chi2 values were < 2, Tstat values were mostly greater than 2 except the source of vegetative detritus, and ratios (ratio of calculated to measured concentration) for all fitting species were in range of 0.8–1.2 in this study.
2.5 Positive matrix factorization analysis of data obtained from aerosol mass spectrometer (AMS-PMF)
An Aerodyne AMS with a PM1 aerodynamic lens was deployed on the roof of the neighboring building, the tower branch of IAP, for real-time measurements of non-refractory (NR) chemical species from 16 November to 11 December 2016 and 22 May to 24 June 2017. The detailed information of the sampling sites is given elsewhere (W. Xu et al., 2019). The submicron particles were dried and sampled into the AMS at a flow of ∼ 0.1 L min−1. NR-PM1 can be quickly vaporized by the 600 ∘C tungsten vaporizer, and then the NR-PM1 species including organics, Cl−, , , and were measured by AMS in mass sensitive V mode (Sun et al., 2020). Details of AMS data analysis, including the analysis of organic aerosol (OA) mass spectra, can be found elsewhere (W. Xu et al., 2019). The source apportionment of organics in NR-PM1 was carried out by applying PMF to the high-resolution mass spectra of OA, while that of fine OC in this study was conducted by applying source profiles along with an offline chemical speciation dataset. The procedures of the pretreatment of spectral data and error matrices can be found elsewhere (Ulbrich et al., 2009). It is noted that the data were missing during the period 9–15 November 2016 due to the malfunction of the AMS.
3.1 Characteristics of PM2.5 and carbonaceous compounds
Mean concentrations of PM2.5, OC, EC, and organic tracers during wintertime (9 November to 11 December 2016) and summertime (22 May to 24 June 2017) at the IAP site are summarized in Table 1 and Fig. S1 in the Supplement. The average PM2.5 concentration was 94.8 ± 64.4 µg m−3 during the whole winter sampling campaign. The winter sampling period was divided into haze (daily PM2.5 > 75 µg m−3) and non-haze days (< 75 µg m−3), based on the National Ambient Air Quality Standard Grade II of the limit for 24 h average PM2.5 concentration. The differentiation between haze and non-haze days enabled us to study the major sources contributing to the haze formation. The average daily PM2.5 was 136.7 ± 49.8 and 36.7 ± 23.5 µg m−3 on haze and non-haze days, respectively. Daily PM2.5 in the summer sampling period was 30.2 ± 14.8 µg m−3, comparable with that on winter non-haze days.
OC concentrations ranged between 3.9–48.8 µg m−3 (mean: 21.5 µg m−3) and 1.8–12.7 µg m−3 (mean: 6.4 µg m−3) during winter and summer, respectively. They are comparable with the OC concentrations in winter (23.7 µg m−3) and summer (3.78 µg m−3) in Tianjin, China, during an almost simultaneous sampling period (Fan et al., 2020) but much lower than the OC concentration (17.1 µg m−3) in summer 2007 in Beijing (Yang et al., 2016). The average OC concentration during haze days (29.4 ± 9.2 µg m−3) was approximately 3 times that of non-haze days (10.7 ± 6.2 µg m−3) during winter. The average EC concentration during winter was 3.5 ± 2.0 µg m−3; its concentration was 4.6 ± 1.3 µg m−3 on haze days, approximately 2.4 times that on winter non-haze days (1.9 ± 1.6 µg m−3), and 5 times that (0.9 ± 0.4 µg m−3) during the summer sampling period. The OC and EC concentrations in this study were comparable with the OC (27.9 ± 23.4 µg m−3) and EC (6.6 ± 5.1 µg m−3) concentrations in winter Beijing in 2016 (Qi et al., 2018) but much lower than those in an urban area of Beijing during winter (OC and EC: 36.7 ± 19.4 and 15.2 ± 11.1 µg m−3) and summer (10.7 ± 3.6 and 5.7 ± 2.9 µg m−3) in 2002 (Dan et al., 2004).
On average, OC and EC concentrations in winter were 3.3 and 3.9 times those in summer. Additionally, OC and EC were well-correlated in this study, with R2 values of 0.85 and 0.63 during winter and summer, respectively, suggesting similar paths of OC and EC dispersion and dilution and/or similar sources of carbonaceous aerosols, especially in winter. Less correlated OC and EC in summer could be a result of SOC formation. SOC in this study was estimated and is discussed in Sect. 3.3.7.
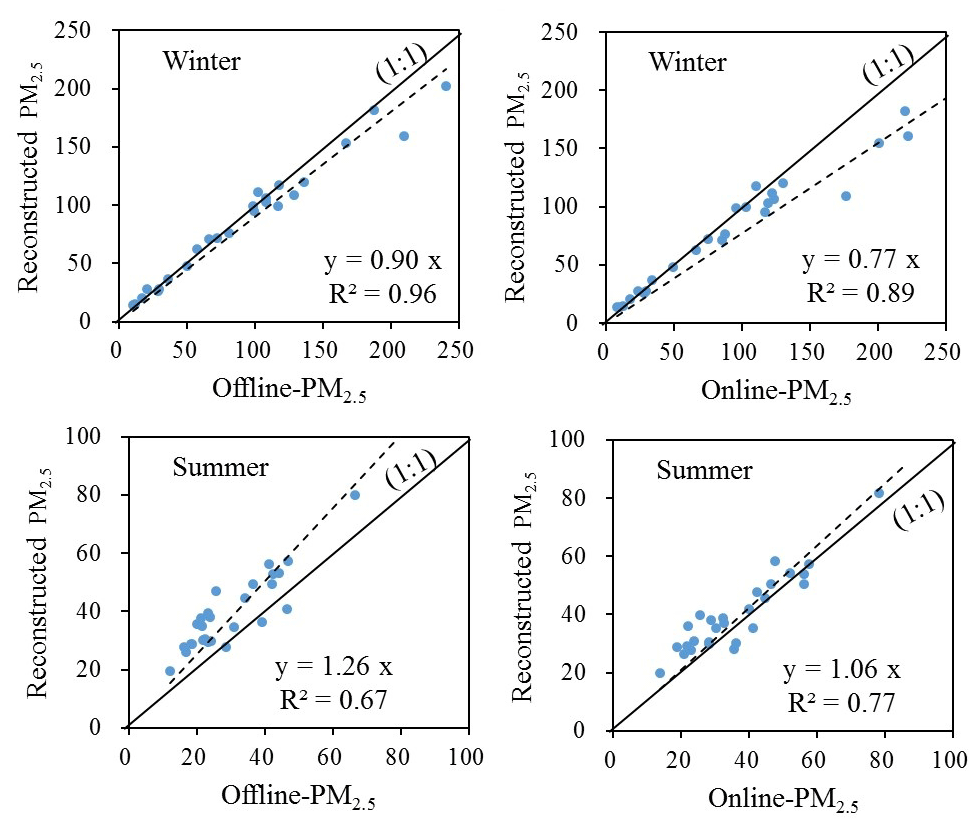
Figure 3Regression results between reconstructed PM2.5 and offline and online PM2.5 by chemical mass closure method.
3.2 Chemical mass closure (CMC)
The composition of PM2.5 applying the chemical mass closure method is plotted in Fig. 2 and summarized in Table S1 in the Supplement. Because the gravimetrically measured mass (offline PM2.5) differs slightly from online PM2.5 (Fig. S2 in the Supplement), the regression analysis results between mass reconstructed using mass closure (reconstructed PM2.5) and both measured PM2.5 concentrations (offline PM2.5 and online PM2.5) were investigated and plotted in Fig. 3.
As shown in Fig. 3, measured offline and online PM2.5 concentrations were moderately well-correlated with the reconstructed PM2.5 with slopes of 0.77 ∼ 1.26 and R2 of 0.67 ∼ 0.96. In winter, the regression results were good between reconstructed PM2.5 and offline PM2.5. For online PM2.5, it was much higher than the reconstructed PM2.5 when the mass was over 170 µg m−3. After excluding the outliers (two outliers of offline PM2.5 > 200 µg m−3 and four outliers of online PM2.5 > 170 µg m−3), the regression results improved with both slopes and R2 approaching unity (Fig. S3 in the Supplement). This could indicate some uncertainties in offline and/or online PM2.5 measurements for heavily polluted samples, or the applied ratio in winter was not suitable for converting OC to OM in heavily polluted samples. During the summer campaign, the slope of the reconstructed PM2.5 and online PM2.5 was close to 1, but that of reconstructed PM2.5 and offline PM2.5 was 1.26. This could be due to the loss of semi-volatile compounds from PTFE filters or the positive artifacts of quartz filters for chemical analyses which can absorb more organics than PTFE filters that are used for PM weighing. To avoid loss of semi-volatiles, all collected samples were stored in cold conditions, including during shipment. The data points were more scattered in summer, which could result from the large difference in OM–OC relationships from day to day. The reconstructed inorganics (reconstructed PM2.5 excluding OM) correlated well with offline PM2.5, but OM did not (Fig. S4 in the Supplement). Hence, the discrepancies between reconstructed PM2.5 and offline and online PM2.5 in summer may be mainly attributable to variable ratios.
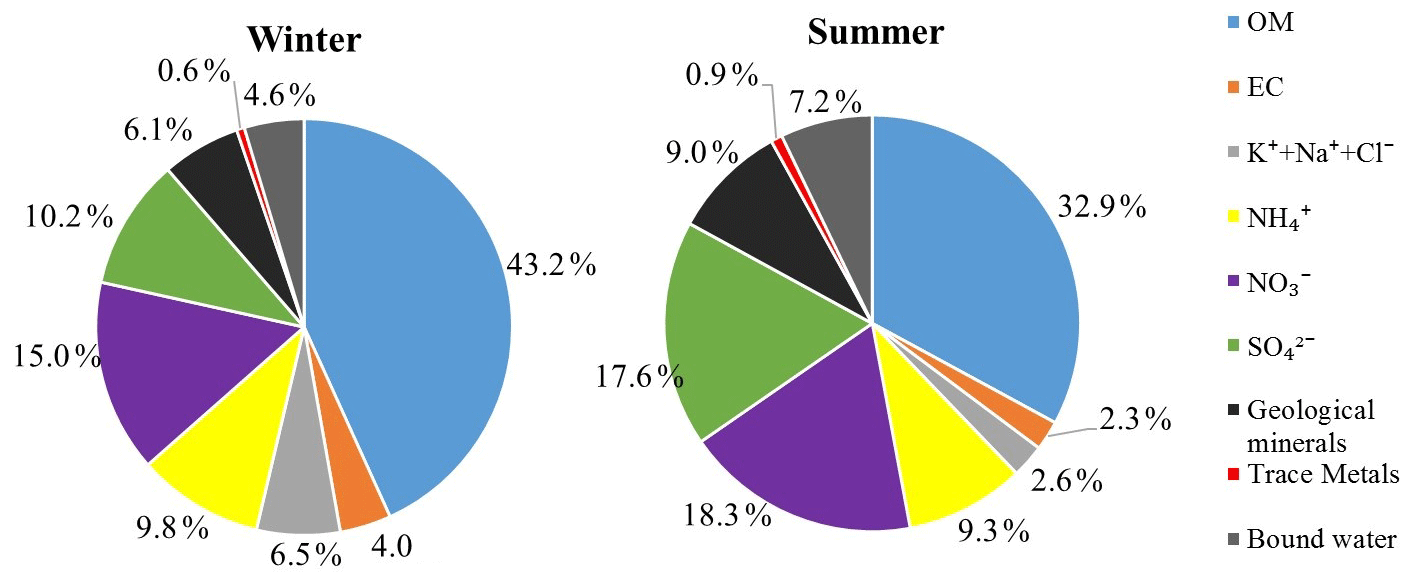
During the winter campaign, the carbonaceous components (OM and EC) accounted for 47.2 % of total reconstructed PM2.5, followed by the secondary inorganic ions (, , ) (35.0 %). In summer, in contrast, secondary inorganic salts represented 45.2 % of PM2.5 mass, followed by carbonaceous components (35.2 %). Bound water contributed 4.6 % and 7.2 % of PM2.5 during the winter and summer, respectively. All other components combined accounted for 13.2 % and 12.4 % of PM2.5 during the winter and summer campaigns, respectively.
Table 2Source contribution estimates (SCEs; µg m−3) for fine OC in urban Beijing during winter and summer from the CMB model.
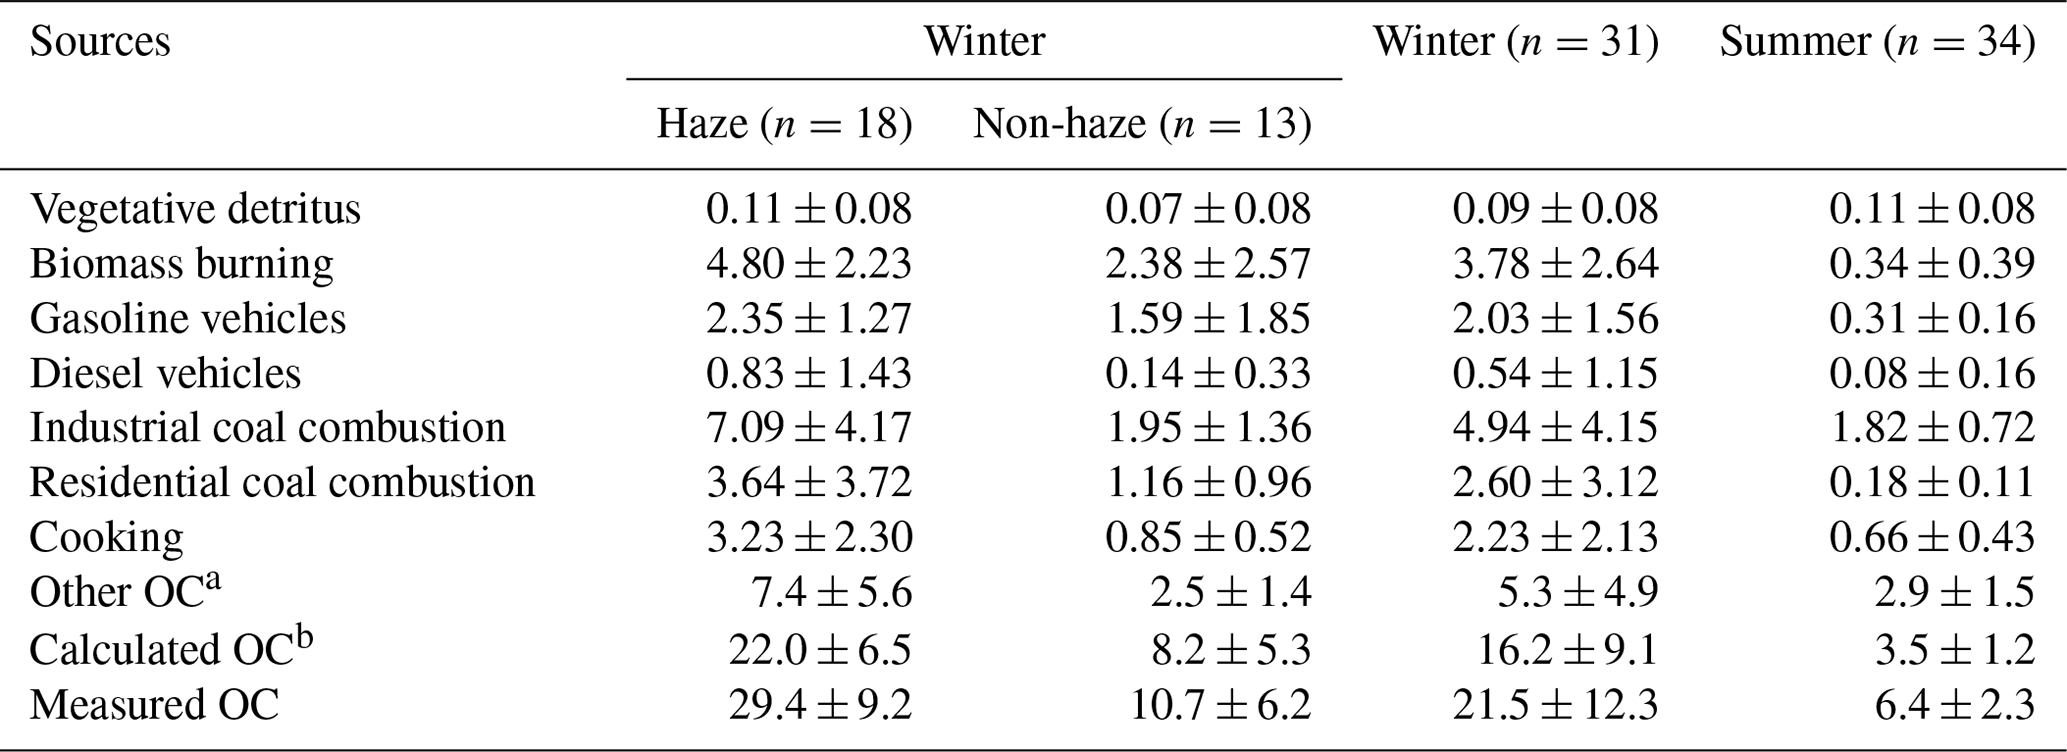
a Other OC is calculated by subtracting calculated OC from measured OC. b Calculated OC is the sum of OC from all seven primary sources: vegetative detritus, biomass burning, gasoline vehicles, diesel vehicles, industrial coal combustion, residential coal combustion, and cooking.
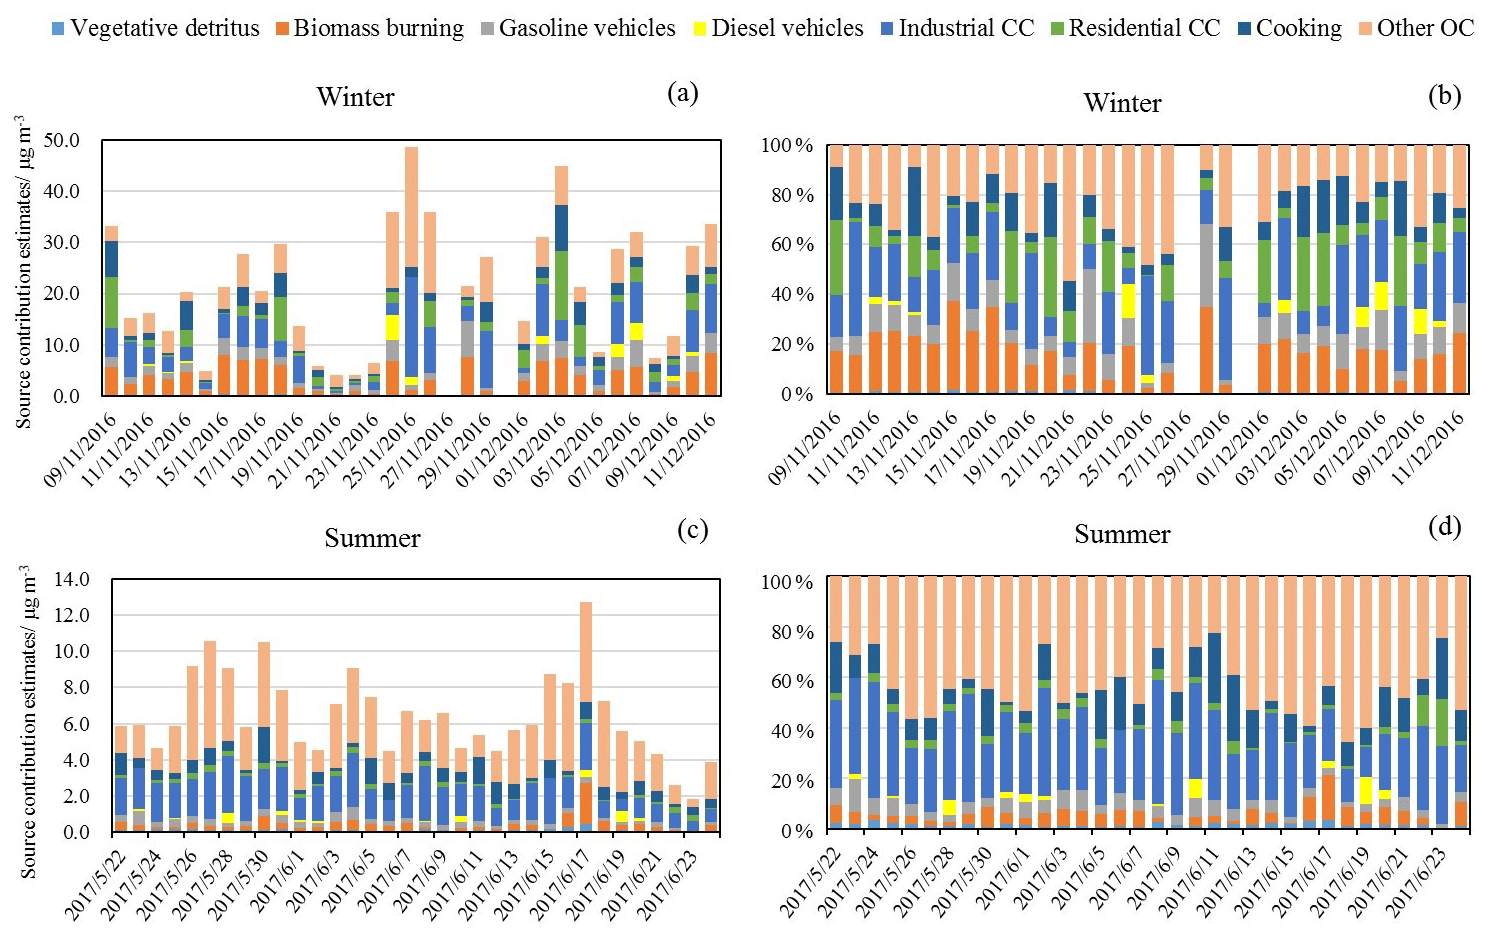
Figure 4Daily source contribution estimates for fine OC in (a) winter and (c) summer and their relative abundance in winter (b) and summer (d).
3.3 Source apportionment of fine OC in urban Beijing applying a CMB model
The CMB model resolved seven primary sources of OC in winter and summer, including vegetative detritus, straw and wood burning (biomass burning, BB), gasoline vehicles, diesel vehicles, industrial coal combustion (industrial CC), residential coal combustion (residential CC), and cooking. It explained an average of 75.7 % (45.3 %–91.3 %) and 56.1 % (34.3 %–76.3 %) of fine OC in winter and summer, respectively. The averaged CMB source apportionment results in winter and summer are presented in Table 2. Daily source contribution estimates to fine OC and the relative abundance of different sources contributions to OC in winter and summer are shown in Fig. 4.
During the winter campaign, coal combustion (industrial and residential CC, 7.5 µg m−3, 35.0 % of OC) was the most significant contributor to OC, followed by other OC (5.3 µg m−3, 24.8 %), biomass (3.8 µg m−3, 17.6 %), traffic (gasoline and diesel vehicles, 2.6 µg m−3, 11.9 %), cooking (2.2 µg m−3, 10.3 %), and vegetative detritus (0.09 µg m−3, 0.4 %). On winter haze days, industrial coal combustion, cooking, and other OC were significantly higher (nearly tripled) compared to non-haze days. During the summer campaign, other OC (2.9 µg m−3, 45.6 %) was the most significant contributor to OC, followed by coal combustion (2.0 µg m−3, 31.1 %), cooking (0.7 µg m−3, 10.3 %), traffic (0.4 µg m−3, 6.1 %), biomass burning (0.3 µg m−3, 5.3 %), and vegetative detritus (0.1 µg m−3, 1.7 %).
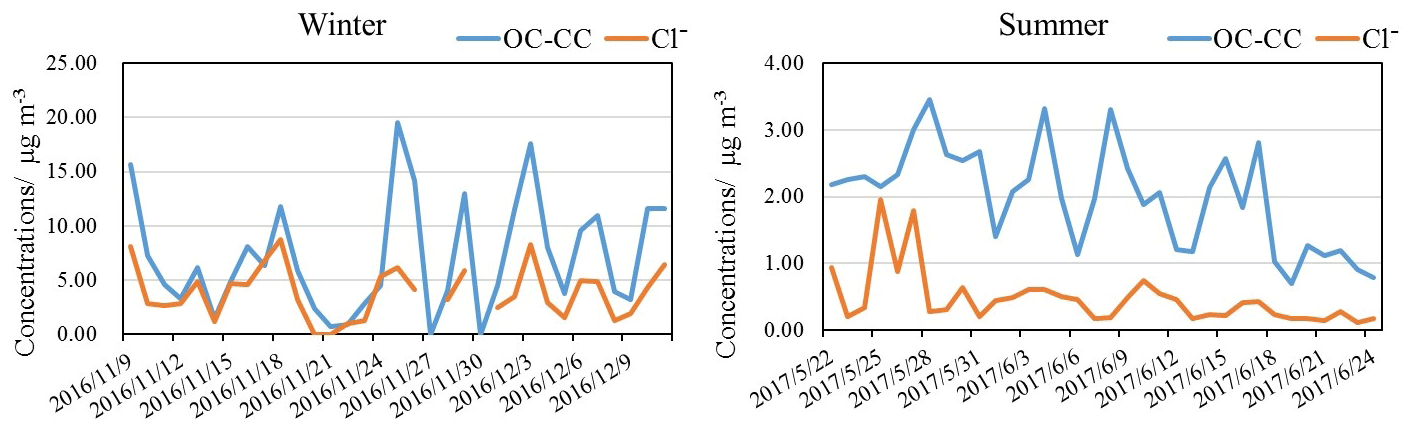
Figure 5Time series of OC from coal combustion (OC-CC) and Cl− in winter and summer in Beijing.
3.3.1 Industrial and residential coal combustion
In China, a large amount of coal is used in thermal power plants, industries, and urban and rural houses in northern China, especially during the heating period (mid-November to mid-March) (Huang et al., 2017; Yu et al., 2019), but urban household coal use experienced a remarkable drop of 58 % during 2005–2015, which is much higher than that of rural household coal use (5 % of decrease) (Zhao et al., 2018). In this study, coal combustion is the single largest source that contributed to primary OC in both winter and summer. In addition, industrial CC was a more significant source of OC than residential CC in urban Beijing. On average, coal-combustion-related OC (CCOC) was 7.5 ± 5.0 µg m−3 (34.5 ± 9.8 % of OC) in winter, which was more than 3 times that in summer – 2.0 ± 0.8 µg m−3 (32.3 ± 10.2 % of OC), but the percentage contribution is similar. A similar seasonal trend was also found in other studies in Beijing (Zheng et al., 2005; Wang et al., 2009), but the relative contribution of coal combustion was much lower than in this study. Industrial-CC-derived OC was 4.94 ± 4.15 and 1.82 ± 0.72 µg m−3 in winter and summer, respectively. Residential-CC-derived OC was 2.60 ± 3.12 and 0.18 ± 0.11 µg m−3 in winter and summer, respectively. Residential CC was much higher in winter compared to that in summer. On haze days, industrial-CC- and residential-CC-derived OC concentrations were 3.6 and 3.1 times that on non-haze days, respectively, indicating an important contribution to haze formation from industrial CC.
Coal combustion is also a major source for particulate chloride (Chen et al., 2014). Because Beijing is an inland city, the contribution of marine aerosols to particulate Cl− is considered minor, which is also supported by the higher mass ratios in winter (10.1 ± 4.8) and summer (2.7 ± 1.8) than seawater (1.81), indicative of significant contributions from anthropogenic sources (Bondy et al., 2017). Yang et al. (2018) also reported that the contribution of sea-salt aerosol to fine particulate chloride was negligible in Chinese inland areas even during summer. Hence, Cl− in this study was mainly from anthropogenic sources. The time series of OC from coal combustion (OC-CC) and Cl− during winter and summer in Beijing are shown in Fig. 5. OC-CC and Cl− exhibited similar trends in both seasons. The correlation coefficient (R2) between OC-CC and Cl− during winter was 0.62, which could be attributed to enhanced coal combustion activities in this season. No significant correlation between the two was found during the summer campaign, indicating that the abundance of Cl− in summer was more influenced by other sources, probably including biomass burning. In addition, due to the semi-volatility of ammonium chloride, it is liable to evaporate in summer (Pio and Harrison, 1987). A similar phenomenon has been observed in Delhi (Pant et al., 2015).
3.3.2 Biomass burning
Biomass burning (BB), including straw and wood burning, is an important source of atmospheric fine OC, which ranked as the second highest primary source of OC after industrial coal combustion during the winter campaign and third highest during the summer campaign after industrial CC and cooking. As shown in Fig. 4, the relative abundance of BB-derived OC during the winter campaign is much higher than the summer campaign. BB-derived OC from the CMB results was 3.78 ± 2.64 and 0.34 ± 0.39 µg m−3 in winter and summer, contributing 17.6 % and 5.3 % of OC in these two seasons, respectively. These results are lower than those in 2005–2007 in Beijing when BB accounted for 26 % and 11 % of OC in winter and summer, respectively (Wang et al., 2009). The BB-derived OC on winter haze days (4.80 ± 2.23 µg m−3) was approximately double that of non-haze days (2.38 ± 2.57 µg m−3), accounting for 16.3 % and 22.2 % of OC on haze and non-haze days, respectively.
Levoglucosan is widely used as a key tracer for biomass burning emissions (Bhattarai et al., 2019; Cheng et al., 2013; J. Xu et al., 2019). Based on a levoglucosan to OC ratio of 8.2 % (X.-Y. Zhang et al., 2007; Fan et al., 2020), the BB-derived OC was 3.40 ± 2.09 µg m−3 and 0.32 ± 0.35 µg m−3 during the winter and summer campaigns, respectively. These results are comparable to BB-derived OC from the CMB model in this study. The estimated BB-derived OC concentrations are also comparable with the BB-derived OC during the same sampling periods in Tianjin (Fan et al., 2020) but higher than those at IAP in 2013/14 (Kang et al., 2018). Both of the studies applied the levoglucosanOC ratio method to estimate the BB-derived OC, although the actual ratio in Beijing air may be very different from 8.2 %. The heavily elevated OC concentration in winter compared to summer could be a result of increased biomass burning activities for house heating and cooking in Beijing in addition to the unfavorable dispersion conditions under stagnant weather conditions in the winter.
In summer, the total OC concentration was highest on 17 June. The sudden rise in OC on this day was attributed to the enhanced biomass burning activities, which led to the highest level of BB-derived OC and highest biomass burning organic carbon (BBOC) to OC abundance. The levoglucosan concentration on this day was also the highest in summer, which reached 172 ng m−3.
3.3.3 Gasoline and diesel vehicles
OC and EC are the key components of traffic emissions (gasoline vehicles and diesel engines) (Chen et al., 2014; Chuang et al., 2016). Traffic-related OC, as represented by the total sum of OC from gasoline and diesel vehicles, was 2.4 ± 2.3 and 0.39 ± 0.22 µg m−3 and contributed 12.1 ± 7.8 % and 6.1 ± 3.3 % of OC in winter and summer, respectively. These results are lower than the contribution of vehicle emissions to OC (13 %–20 %) in Beijing during 2005 and 2006 (Wang et al., 2009), suggesting traffic emissions may be a less significant contributor to fine OC in the atmosphere in Beijing in 2016/17. By multiplying by factors of 2.39 and 1.47 in winter and summer, respectively, as mentioned in Sect. 2.3, traffic-related organic aerosol contributed 8.2 ± 6.5 % and 2.3 ± 1.7 % of PM2.5 in winter and summer, respectively. The summer result was comparable with the vehicular emission contribution to PM2.5 (2.1 %) in summer in Beijing but higher than that in winter (1.5 %) in Beijing estimated by using a PMF model (Yu et al., 2019). Gasoline vehicles dominated the traffic emissions; gasoline-vehicle-derived OC was 2.03 ± 1.56 and 0.31 ± 0.16 µg m−3 in winter and summer, respectively, which are approximately 4 times that in winter (0.54 ± 1.15 µg m−3) and summer (0.08 ± 0.16 µg m−3) attributed to diesel vehicles. On haze days, gasoline- and diesel-derived OC concentrations were 2.35 ± 1.27 and 0.83 ± 1.43 µg m−3, respectively, much higher than gasoline- (1.59 ± 1.85 µg m−3) and diesel-derived (0.14 ± 0.33 µg m−3) OC on non-haze days. Even though diesel vehicles played a less important role in OC emissions, diesel-derived OC on haze days increased by around 6 times above that of non-haze days, and such an increase was much higher than for gasoline, suggesting a potentially important role of diesel emissions in haze formation.
3.3.4 Cooking
Cooking is expected to be an important contributor of fine OC in densely populated Beijing, which has a population of over 21 million. The cooking source profile was selected from a study which was carried out in the urban area of another Chinese megacity, Guangzhou, which includes fatty acids, sterols, monosaccharide anhydrides, alkanes, and PAHs in particles from Chinese residential cooking (Zhao et al., 2015). The resulting cooking-related OC concentrations were 2.23 ± 2.13 µg m−3 and 0.66 ± 0.43 µg m−3 in winter and summer, respectively, and both accounted for about 10 % of total OC. Cooking OC was 3.23 ± 2.30 µg m−3 on winter haze days, around 4 times higher than that on non-haze days (0.85 ± 0.52 µg m−3).
3.3.5 Vegetative detritus
Vegetative detritus made a minor contribution to fine particle mass. Its concentration was 0.09 ± 0.08 µg m−3 (0.4 %) and 0.11 ± 0.08 µg m−3 (1.7 %) of OC during the winter and summer campaigns, respectively. These contributions are comparable with that in winter (0.5 %) but higher than that in summer (0.3 %) in urban Beijing during 2006/07 (Wang et al., 2009). These results are also higher than the plant-debris-derived OC in Tianjin in winter 2016 (0.02 µg m−3) and summer 2017 (0.01 µg m−3), which were calculated based on the relationship of glucose and plant debris and a ratio of 1.93 (Fan et al., 2020).
3.3.6 Other OC
The other OC was calculated by subtracting the calculated OC (the sum of OC from seven main sources) from measured OC concentrations. As shown in Table S2 in the Supplement, there are four major source categories of OC in Beijing based on the Multi-resolution Emission Inventory for China (MEIC), which include power, industry, residential, and transportation (Zheng et al., 2018). In the “industry” category, industrial coal combustion has been resolved by the CMB model. The local emissions of OC from industrial coal in Beijing were zero (shown in Table S2), and hence, the resolved primary organic carbon (POC) from industrial coal combustion in Beijing should be regionally transported. The MEIC data also show a small industrial oil combustion source. Since the tracers for this are likely to be the same as those for gasoline-derived road traffic emissions in the CMB model, this may result in a small overestimation of the latter source. For the industrial-process-related OC which has not been resolved by the CMB model, the annual average OC emissions in Beijing were 1161 and 1083 t in 2016 and 2017, respectively, which accounted for 7.7 % and 9.0 % of the total OC emissions (POC). Therefore, the contribution from industrial processes to the total OC in the atmosphere (POC + SOC) was considered relatively small. The other OC in this study is likely to be a mixture of predominantly SOC and a small portion of POC from sources such as industrial processes.
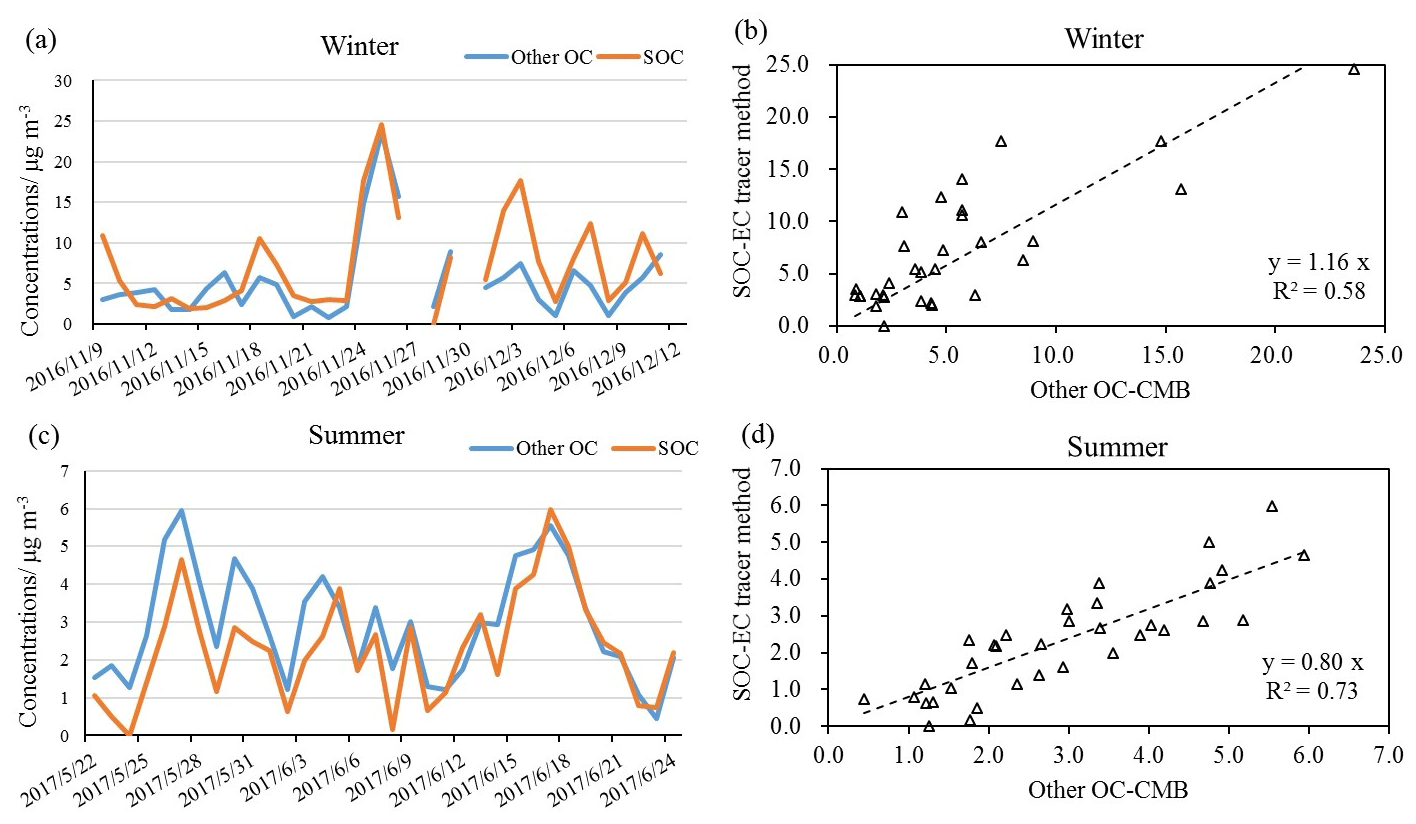
Figure 6Time series of mean values for other OC estimated by the CMB model and SOC estimated by the EC-tracer method in winter (a) and summer (c); correlation relationship between other OC estimated by the CMB model and SOC estimated by the EC-tracer method in winter (b) and summer (d).
The other OC was 5.3 ± 4.9 and 2.9 ± 1.5 µg m−3 in winter and summer, respectively, contributing 24.8 % and 43.9 % of total measured OC. This is in good agreement with the other OC estimated by the CMB model in another study in urban Beijing, for which other OC contributed 22 % and 44 % of OC in winter and summer, respectively (Wang et al., 2009). The ratio in summer was more than 10 % higher than that in summer 2008 in Beijing estimated using a tracer yield method, with the SOC derived from specific VOC precursors (toluene, isoprene, α-pinene, and β-caryophyllene) accounting for 32.5 % of OC (Guo et al., 2012).
Even though the other OC concentration was lower in summer, its relative abundance was higher than that in winter, suggesting relatively higher efficiency of SOA formation in summer due to more active photochemical processes under higher temperatures and strong radiation. The other OC on winter haze days was 7.4 ± 5.6 µg m−3, approximately 3 times that on non-haze days (2.5 ± 1.4 µg m−3). Other OC is also compared with the SOC estimated by the EC-tracer method below.
3.3.7 SOC calculated based on the EC-tracer method
EC is a primary pollutant, while OC can originate from both primary sources and form in the atmosphere from gaseous precursors, namely primary organic carbon (POC) and SOC, respectively (Xu et al., 2018). The ratios can be used to estimate the primary and secondary carbonaceous aerosol contributions. Usually, ratios > 2.0 or 2.2 have been applied to identify and estimate SOA (Liu et al., 2017). In this study, all samples were observed with higher ratios (> 2.2). SOC in this study was estimated using the equation below, assuming EC comes 100 % from primary sources and the ratio in primary sources is relatively constant (Turpin and Huntzicker, 1995; Castro et al., 1999):
where SOCi, OCi, and ECi are the ambient concentrations of secondary organic carbon (SOC), organic carbon, and elemental carbon of sample i, respectively. is the ratio in primary aerosols. It is difficult to accurately determining the ratio of for a given area. varies with the contributions of different sources and can also be influenced by meteorological conditions (Dan et al., 2004). In this work, was determined based on the lowest 5 % of measured ratios for the winter and summer campaigns, respectively (Pio et al., 2011). The average SOC concentrations during summer and winter were calculated and are shown in Table 1. Daily concentrations of other OC estimated by the CMB model and SOC estimated by the EC-tracer method in winter and summer are plotted in Fig. 6, as well as their correlation relationship.

Figure 7Comparison of the source contribution estimates (SCE in µg m−3; % OC) at IAP with those at a rural site in Beijing–Pinggu.
The average SOC concentrations in winter and summer are presented in Table 1. The average SOC concentration during winter was 7.2 ± 5.7 µg m−3, accounting for 36.6 ± 15.9 % of total OC. The average SOC concentration during summer was one-third of that in winter, which was 2.3 ± 1.4 µg m−3, accounting for 36.2 ± 16.0 % of total OC. The mean SOC concentrations during winter haze and non-haze periods were 10.3 ± 5.7 and 2.9 ± 1.4 µg m−3, contributing to 34.0 ± 12.0 % and 40.5 ± 20.4 % of OC during haze and non-haze episodes, respectively. As shown in Fig. 6, the SOC estimated by the EC tracer method followed a similar trend to the other OC calculated by the CMB model. They were well-correlated in both seasons with R2 of 0.58 and 0.73 in winter and summer samples, respectively, and gradients of 1.16 and 0.80. This suggests that the estimates of other OC calculated from the CMB outputs were reasonable and mainly represented the secondary organic aerosol.
3.4 Comparison with the source apportionment results in rural Beijing
The OC source apportionment results in this study are also compared with those in another study conducted at a rural site of Beijing–Pinggu during APHH-Beijing campaigns (Wu et al., 2020). The CMB model was run based on the results from high-time-resolution PM2.5 samples that were collected in Pinggu during the same sampling period but not on identical days. It is valuable to study both rural and urban sites as both exceed health-based guidelines and require evidence-based mitigation policies which may differ depending on the source apportionment at each. Furthermore, urban air pollution may affect the pollution levels in rural areas (Y. Chen et al., 2020), and domestic heating and cooking led to high emissions of particles and precursor gases, which may contribute to air pollution in the cities (Liu et al., 2021). The comparison of results is presented in Fig. 7 and Table S3 in the Supplement.
As shown in Fig. 7 and Table S3, slightly more OC was explained by the CMB model at the urban site (75.7 %) than the rural site (69.1 %) during winter, but less OC was explained at the urban site (56.1 %) than the rural site (63.4 %) during summer. As at the urban site, biomass burning and coal combustion are important primary sources in rural Beijing. Diesel contributed more to OC at the rural site, while cooking contributed more at the urban site. The rural site also had a larger contribution from vegetative detritus to OC than the urban site. The source contribution estimates from biomass burning at the rural site were approximately 2 and 4 times that at the urban site during winter and summer. In winter, biomass burning contributed a similar percentage of OC at both sites. A higher percentage of OC from biomass burning was found at the rural site than the urban site in summer possibly because of the use of biomass for cooking. For traffic emitted OC, gasoline exceeded diesel at the urban site, while the rural site by contrast has a larger diesel contribution. Industrial-CC-emitted OC is higher at the urban site during winter but lower in summer compared to the rural site. The source contribution estimates of residential CC at the urban site is only half that of the rural site in both seasons, and its relative contribution to OC was also lower at the urban site. Coal is widely used for cooking and heating at the villages around the rural site at the time of observations. Cooking accounted for over 10 % of OC at the urban site but less than 5 % at the rural site, which is plausible as the urban site is more densely populated.
3.5 Comparison with source apportionment results from AMS-PMF
Results from AMS-PMF were compared with the CMB source apportionment results to investigate the consistency and potential uncertainties of both methods and also to provide supplemental source apportionment results (Ulbrich et al., 2009; Elser et al., 2016). Similar comparisons have yielded valuable insights in earlier studies (Aiken et al., 2009; Yin et al., 2015). It is noteworthy that the CMB model was applied to PM2.5 samples, while AMS-PMF was applied to NR-PM1 species. This may consequently cause differences in the chemical composition and source attribution between the two methods as larger particles were not captured by AMS. However, as mentioned in the study of Aiken et al. (2009), the mass concentration between PM1 and PM2.5 was small with a reduced fraction of OA and increased fraction of dust. In addition, OC fractions in fine particles were found mostly concentrated in particles < 1 µm (C. Chen et al., 2020; Zhang et al., 2018; Tian et al., 2021). Hence, the bias was expected to be relatively small. Six factors in non-refractory (NR)-PM1 from the AMS were identified based on the mass spectra measured in winter at IAP by applying a PMF model, including coal combustion OA (CCOA-AMS), cooking OA (COA-AMS), biomass burning OA (BBOA-AMS), and three secondary factors of oxidized primary OA (OPOA-AMS), less-oxidized OA (LOOOA-AMS), and more-oxidized OA (MOOOA-AMS). In summer, the PMF analysis resulted in five factors including two primary factors of hydrocarbon-like OA (HOA-AMS), cooking OA (COA-AMS), and three secondary factors of oxygenated OA (OOA-AMS): OOA1, OOA2, and OOA3. These OOA factors were identified by PMF based on diurnal cycles, mass spectra, and the correlations between OA factors and other measured species. Three OOA factors showed significantly elevated ratios (0.67–1.48) and correlated well with secondary inorganic aerosols (SIAs) (R = 0.52–0.69). Hence, OOA1, OOA2, and OOA3 represent three types of SOAs. Compared to OOA2 and OOA3, OOA1 showed relatively higher f43 (fraction of m/z of 43 in OA). In addition, the concentrations of OOA1 and OOA3 were higher in daytime, implying the effect of photochemical processing. The variations in OOA2 tracked well with (R = 0.89), an aqueous-processing-related fragment ion (Sun et al., 2016), indicating that OOA2 was an OA factor associated with aqueous-phase processing. Previous studies suggested that aqueous-phase processing plays an important role in the formation of nitrogen-containing compounds (Xu et al., 2017). The fact that OOA2 with relatively high ratios (0.046) was correlated with several N-containing ions (e.g. CH4N+, C2H6N+, R = 0.71–0.77) further supports the above argument. The factor profiles of AMS-PMF in winter and summer are provided in Figs. S5 and S6 in the Supplement, respectively.
Table 3Source contributions of OA and OC (µg m−3) from AMS-PMF results in urban Beijing during winter and summer.
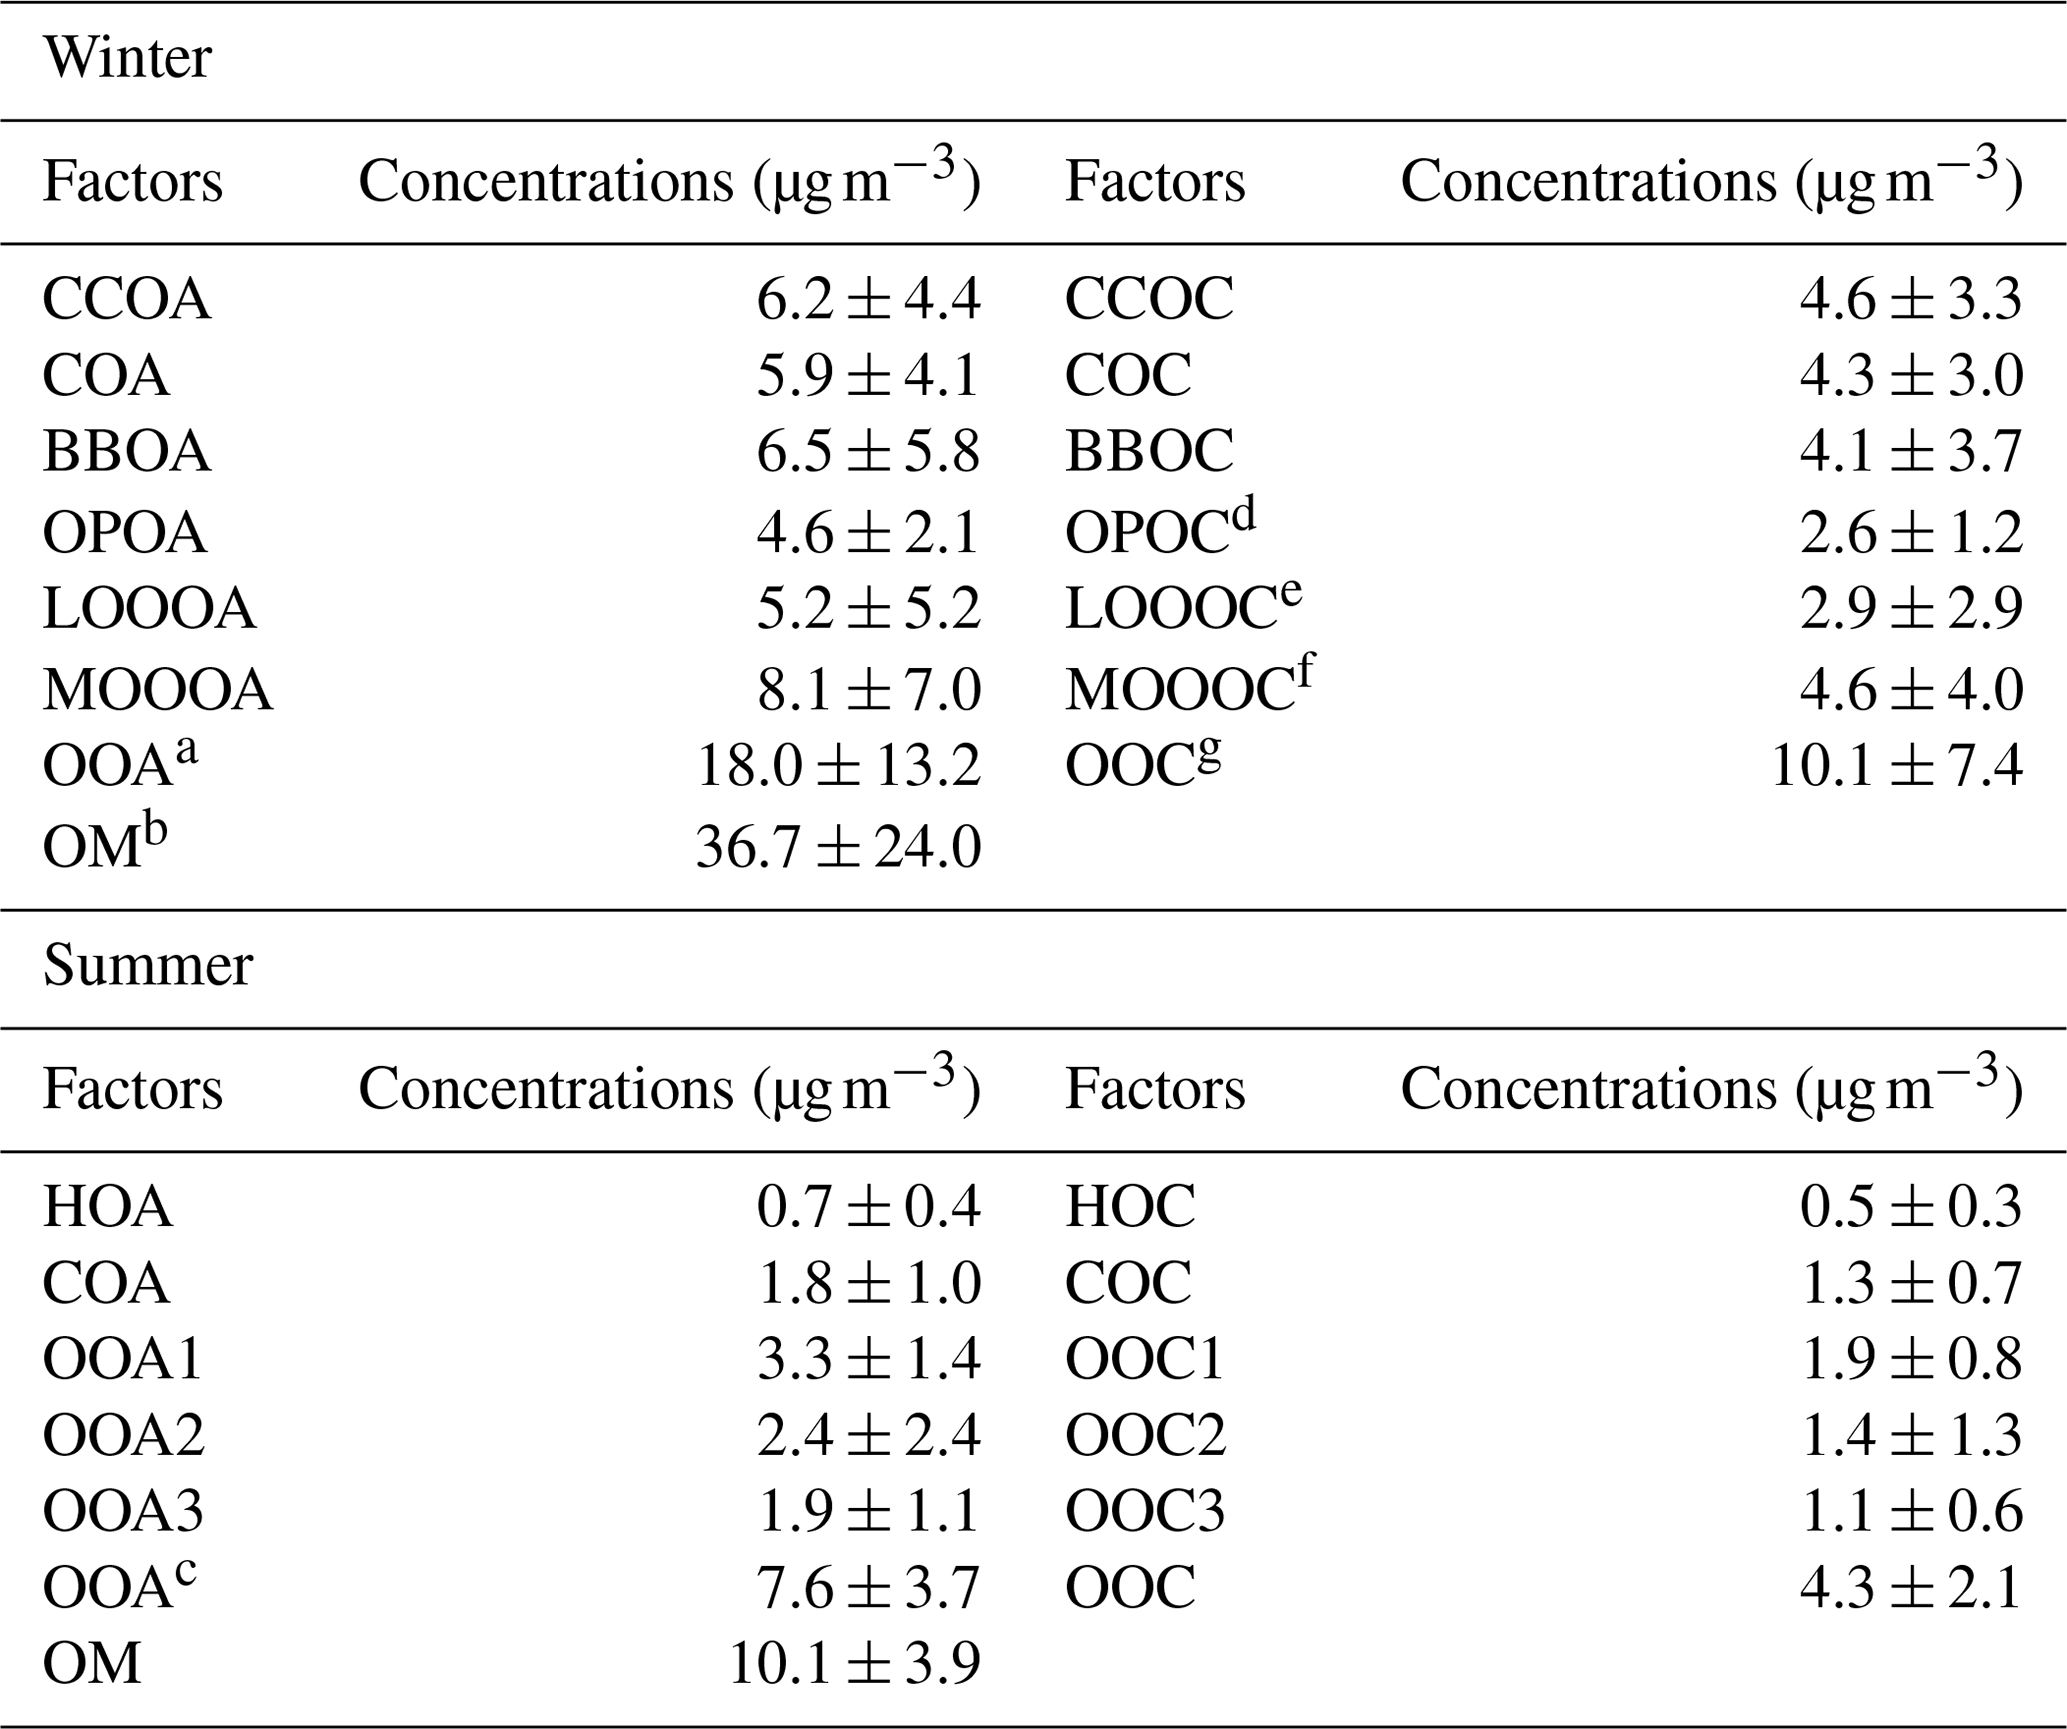
a OOA = OPOA + LOOOA + MOOOA; b OM is organics measured by AMS; c OOA = OOA1 + OOA2 + OOA3; d OPOC: oxidized primary OC; e LOOOC: low oxidized organic carbon; f MOOOC: more oxidized organic carbon; g OOC = OOC1 + OOC2 + OOC3.
In order to be compared with the source apportionment results of OC in this study from the CMB model, the OA concentrations from the AMS-PMF were converted to OC based on various OAOC ratios measured in Beijing: 1.35 for CCOACCOC (coal combustion organic carbon), 1.31 for HOA/HOC (hydrocarbon-like organic carbon) (Sun et al., 2016), 1.38 for COA/COC (cooking organic carbon), 1.58 for BBOABBOC (biomass burning organic carbon) (W. Xu et al., 2019), and 1.78 for OOAOOC (oxidized organic carbon; Huang et al., 2010). The concentrations of OA and corresponding OC from AMS-PMF analysis are presented in Table 3. As the AMS data were missing during the period 9–15 November 2016, the comparison of the AMS-PMF and CMB results for this period has been excluded.
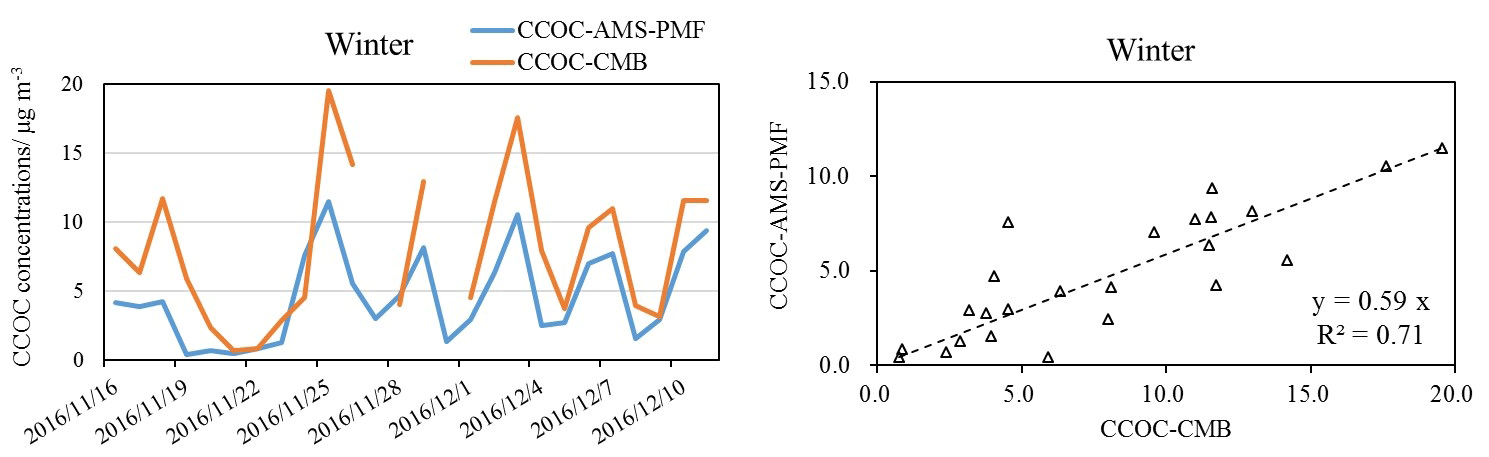
Figure 8Time series and correlation of coal-combustion-related OC (CCOC) estimated by the CMB model and CCOC from AMS-PMF analysis.
The CCOA-AMS factor was mainly characterized by m/z of 44, 73, and 115 (Sun et al., 2016). In winter, CCOA-AMS was 6.2 ± 4.4 µg m−3, contributing 16.9 % of OM. CCOC-AMS was 4.6 ± 3.3 µg m−3, which was much lower than the estimated coal combustion OC (7.9 ± 5.2 µg m−3, industrial and residential coal combustion OC) by the CMB model (CCOC-CMB). The time series of CCOC-CMB and CCOC-AMS in Fig. 8 shows a similar trend with a relatively good correlation of R2 = 0.71, but coal combustion estimated by the CMB model was consistently higher than by AMS-PMF probably because AMS-PMF only resolved the sources of NR-PM1, and some coal combustion particles are larger (Xu et al., 2011). The correlation coefficients (R2) of CCOC-AMS with Cl− and NR-Cl− were 0.49 and 0.65, respectively, in the winter data.
BBOA-AMS in winter was 6.5 ± 5.8 µg m−3, contributing 17.7 % of OM. This BBOA-AMS factor included a high proportion of m/z of 60 and 73, which are typical fragments of anhydrous sugars like levoglucosan (Srivastava et al., 2019). BBOC-AMS was 4.1 ± 3.7 µg m−3, which was very close to the estimated BBOC-CMB (3.72 ± 2.79 µg m−3, 16.4 % of OC) during the same period.
COA-AMS is as a common factor identified in both winter and summer results. It is characterized by high m/z of 55 and 57 in the mass spectrum (Sun et al., 2016). COA-AMS was 5.9 ± 4.1 and 1.8 ± 1.0 µg m−3 in winter and summer, respectively, contributing 16.1 % and 17.8 % of OM. COC-AMS was 4.3 ± 3.0 and 1.3 ± 0.7 µg m−3 in winter and summer, respectively, which were almost 2 times that of the COC-CMB results for winter (2.20 ± 1.97 µg m−3) and summer (0.66 ± 0.43 µg m−3). Yin et al. (2015) also reported that COC-AMS was about 2 times that of COC-CMB. The overestimation of cooking OC by AMS-PMF could be due to a low relative ionization efficiency (RIE) for cooking OAs (1.4) in AMS, while the actual RIE could be higher, such as 1.56–3.06 (Reyes-Villegas et al., 2018), and/or the use of a relatively low OA/OC ratio for cooking (Xu et al., 2021).
HOA-AMS was 0.7 ± 0.4 µg m−3 in summer, accounting for 6.9 % of OM. HOA-AMS is usually identified based on the high contribution of aliphatic hydrocarbons in this factor, particularly m/z of 27, 41, 55, 57, 69, and 71 (Aiken et al., 2009). This result is lower than that (17 % of OM) in rural Beijing during summer 2015 (Hua et al., 2018). HOC-AMS was 0.5 ± 0.3 µg m−3 in summer, which is higher than the traffic (gasoline + diesel) emitted OC (0.4 ± 0.2 µg m−3) from the CMB model. No obvious correlation was observed between HOC with nitrate and traffic emitted OC from the CMB model during summer.
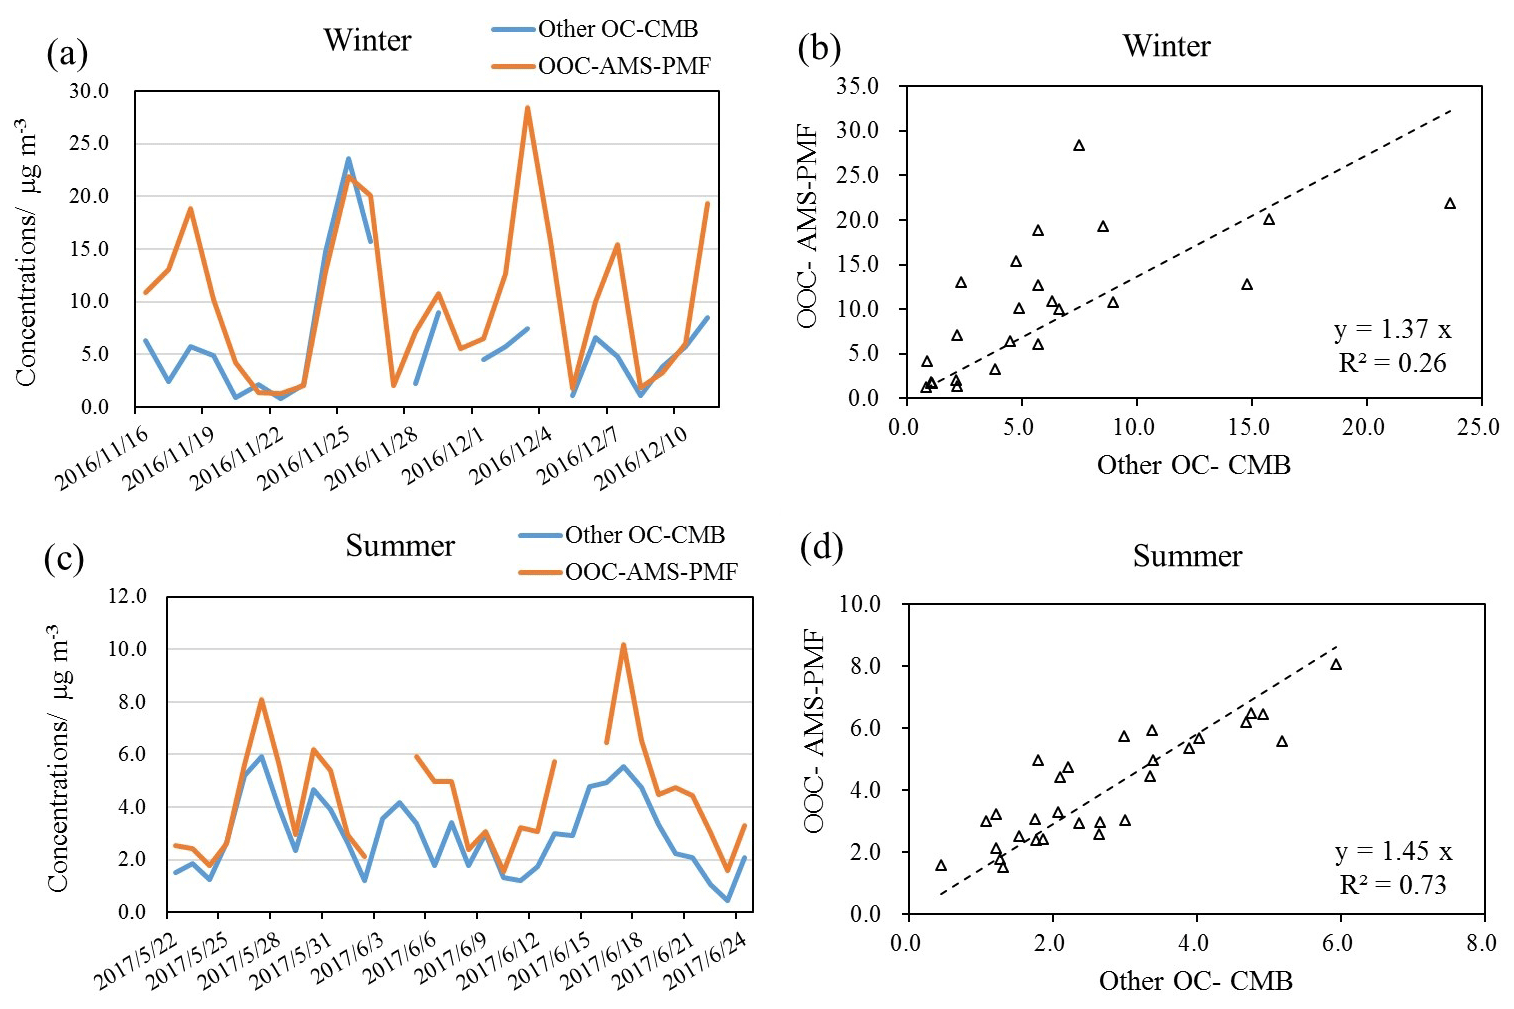
Figure 9Time series of mean values for other OC estimated by the CMB model and OOC estimated by AMS-PMF in winter (a) and summer (c); correlation relationship between other OC estimated by the CMB model and OOC estimated by AMS-PMF in winter (b) and summer (d).
OOA-AMS concentrations (the sum of all oxidized OA) were 18.0 ± 13.2 and 7.6 ± 3.7 µg m−3 in winter and summer, respectively, accounting for 49.0 % and 75.2 % of OM. The derived OOC-AMS concentrations in winter and summer were 10.1 ± 7.4 and 4.3 ± 2.1 µg m−3 in winter and summer, respectively, higher than the other OC estimated by the CMB model (other OC-CMB) in winter (6.1 ± 5.5 µg m−3) and summer (2.9 ± 1.5 µg m−3) in this study. This could be because AMS-PMF did not resolve HOC in winter and CCOC in summer, which may be mixed with the OOA factors and lead to the overestimation of OOC concentrations. The time series and correlation of other OC-CMB and OOC-AMS are plotted in Fig. 9. A similar temporal trend was found between them, especially in summer, which was also observed with a better correlation (R2 = 0.73).
In summary, the CMB model is able to resolve almost all major known primary OA sources, but AMS-PMF can resolve more secondary OA sources. The AMS-PMF results for major components, such as CCOC-AMS and OOC-AMS agreed well with the results from the CMB model in the winter. However, discrepancies or poor agreement was found for other sources, such as BBOA-AMS and COA-AMS, although the temporal features were very similar. Furthermore, AMS-PMF did not identify certain sources probably due to their relatively small contribution to particle mass. Overall, the CMB model and AMS-PMF offered complementary data to resolve both primary and secondary sources.
3.6 Source contributions to PM2.5 from the CMB model
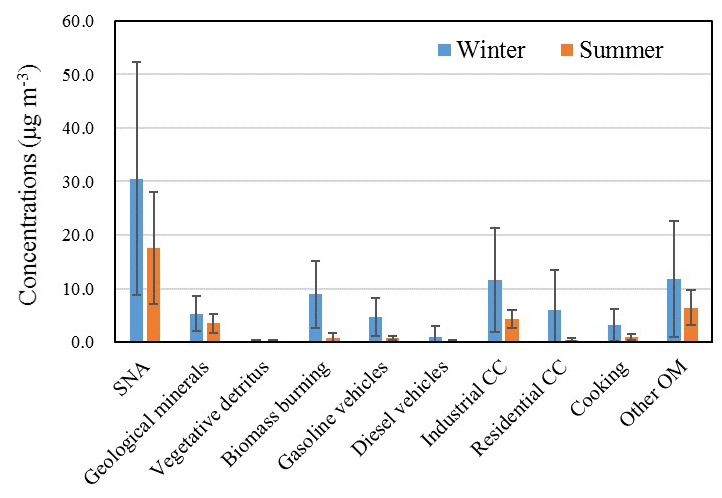
The source contributions to PM2.5 were calculated by the multiplication of the fine OC source estimates from the CMB model by the ratios of fine OC to PM2.5 mass (Table S4 in the Supplement), which were obtained from the same source profiles used for the OC apportionment by the CMB model (Y.-X. Zhang et al., 2007; Wang et al., 2009; Cai et al., 2017; Zhang et al., 2008). For cooking, vegetative detritus, and secondary organic aerosols, ratios were applied considering the low contribution of inorganic species to PM2.5 mass from these sources (Zhao et al., 2007; Bae et al., 2006b). The ratios for oxygenated OA were in the range of 1.85–2.3 (Zhang et al., 2005; Aiken et al., 2008), and the ratio was 2.17 in secondary organic aerosols of PM2.5 (Bae et al., 2006a). Therefore, an ratio of 2.2 is applied in this study to convert the other OC to OM. Due to the variability of the ratio in the source profiles, the application using the average ratio of each source to convert the OC to PM2.5 in all samples may be subject to uncertainties as both organic species and PM2.5 mass measurements are subject to analytical imprecision. Unfortunately, insufficient data are available for a formal analysis of uncertainty, but errors of around ± 10 % seem very probable. In addition, instead of ratio, applying an ratio to cooking and vegetative detritus sources for the calculation may result in an underestimation of PM2.5 source contributions from these sources because they can also emit inorganic pollutants. However, cooking emissions are mostly organic, and the contribution from vegetative detritus to PM2.5 is very small, so their effects on source contribution estimation here are considered negligible. The daily PM2.5 contribution estimates and seasonal average source contributions are provided in Figs. S7 in the Supplement and Fig. 10, respectively. Detailed data and their relative abundance in the reconstructed PM2.5 are summarized in Table S5 in the Supplement.
As shown in Table S5, PM2.5 mass was explained well by those sources which accounted for 91.9 ± 24.1 % and 99.0 ± 19.1 % of online PM2.5 in winter and summer, respectively. In the summer, the offline PM2.5 is lower than online observations. Thus, the CMB-based source contributions are more than offline PM2.5 mass (121.7 ± 26.6 %). On average, the source contributions in winter ranked as SNA > coal combustion > other OM > biomass burning > gasoline and diesel > geological minerals > cooking > vegetative detritus; in summer these ranked as SNA > other OM > coal combustion > geological minerals > cooking > gasoline and diesel > biomass burning > vegetative detritus.
Zheng et al. (2005) investigated the seasonal trends of PM2.5 source contributions in Beijing during 2000 applying a CMB model. In winter (January), the contributions from coal combustion, biomass burning, diesel and gasoline, and vegetative detritus to PM2.5 were 9.55 µg m−3 (16 % of PM2.5 and hereafter), 5.8 µg m−3 (9 %), 3.85 µg m−3, and 0.33 µg m−3, respectively. Contributions from gasoline, diesel, coal combustion, and biomass burning were enhanced in Beijing during winter in 2016 compared to 2000, while the contribution from vegetative detritus basically remained similar. In summer (July) 2000, coal combustion contributed 2 % of PM2.5 (2.39 µg m−3), much less than that in summer 2016 of this study. The contribution from diesel and gasoline (7.78 µg m−3; Zheng et al., 2005) was approximately 10 times that in 2016 (0.8 µg m−3). Similarly, contributions from vegetative detritus and biomass burning were small and insignificant.
Zhou et al. (2017) estimated that coal combustion contributions in winter and summer in the Beijing–Tianjin–Hebei area in 2013 were 15.9 µg m−3 and 2.1 µg m−3, respectively, which are comparable with those in this study. These results are also comparable with the PMF-resolved coal and oil combustion in Beijing during winter (17.4 µg m−3) and summer (2.2 µg m−3) in 2010 (Yu et al., 2013). SNA contributed 52.7 and 26.4 µg m−3 of PM2.5 during winter (January) and summer (July), respectively (Yu et al., 2013), which are much higher than those in this study. It is noteworthy that a severe haze pollution event occurred during January 2013 which was characterized by high concentrations of sulfate and nitrate in several studies (Zhou et al., 2017; Han et al., 2016). The contribution from biomass burning in winter is consistent (8.5 µg m−3) with this study (8.9 µg m−3) but higher in summer (2.6 µg m−3) (0.8 µg m−3). The cooking source contributed 4.8 and 1.3 µg m−3 in PM2.5 during winter and summer 2013, respectively, which is also comparable with this study.
Carbonaceous aerosols contributed approximately 59 % and 41 % of reconstructed PM2.5 in winter and summer at the urban IAP site in Beijing. The OC and EC concentrations were comparable with more recent studies (Fan et al., 2020; Qi et al., 2018) but lower than those before 2013 (Yang et al., 2016; Dan et al., 2004), suggesting the effectiveness of air pollution control measures since 2013 (Vu et al., 2019; Zhang et al., 2019). CMB modeling showed that in winter 2016, the top three primary contributors to PM2.5-OC were coal combustion (35 %), biomass burning (17 %), and traffic (12 %); these were in the same order with those at the rural site during the same study period: coal combustion (29 %), biomass burning (18 %), and traffic (17 %) (Wu et al., 2020). In summer 2017, the top three primary contributors to PM2.5-OC were coal combustion (32 %), cooking (11 %), and traffic (6 %); these were different to those at the rural site during the same study period: coal combustion (38 %), biomass burning (11 %), and traffic (7 %) (Wu et al., 2020). The other OC, which was well-correlated (R2: 0.6 ∼ 0.7; slope: 0.8 ∼ 1.2) with the secondary OC (SOC) estimated based on the EC-tracer method, accounted for 25 % and 44 % of OC at the urban site and 31 % and 37 % of OC at the rural site during winter and summer, respectively. Although the annual average PM2.5 levels in Beijing reduced from 88 µg m−3 in 2013 to 58 µg m−3 in 2017 (Vu et al., 2019), and the de-weathered concentration of PM1 decreased by 38 % in 2017 compared to 2007 (Zhang et al., 2020), our CMB modeling results indicate that the coal combustion and biomass burning still remained the dominant primary OC sources in winter 2016 and summer 2017, with road traffic ranked as the third highest. Cooking was a more significant source of OC than biomass burning at the urban site during summer. Compared to other CMB studies in Beijing, our study revealed an increase in the contributions from coal combustion, biomass burning, and traffic to PM2.5 in winter 2016 compared to winter 2000, while those in this study remained similar compared to winter 2013. Sulfate, nitrate, and ammonium concentrations were significantly lower in this study compared to 2013 (Zheng et al., 2005; Zhou et al., 2017). It is however notable that there is a broad consistency in the findings of the CMB studies, whereas the more numerous studies which have used PMF come to rather diverse conclusions (Srivastava et al., 2021).
The data in this article are available from the corresponding authors upon request.
The supplement related to this article is available online at: https://doi.org/10.5194/acp-21-7321-2021-supplement.
JX did the CMB modeling and drafted the paper with the help of ZS, RMH, DL, XW, TVV, YZ, PF, YS, WX, and BZ. DL and TVV conducted the laboratory analysis of organics and inorganics, respectively. XW and YZ provided the CMB source profiles. WX and YS provided the AMS-PMF data.
The authors declare that they have no conflict of interest.
This article is part of the special issue “In-depth study of air pollution sources and processes within Beijing and its surrounding region (APHH-Beijing) (ACP/AMT inter-journal SI)”. It is not associated with a conference.
We acknowledge the support from Zifa Wang and Jie Li from IAP for hosting the APHH-Beijing campaigns at IAP. We also thank Alastair Lewis, William Dixon, Marvin Shaw, and Stefan Swift from the University of York, Siyao Yue, Liangfang Wei, Hong Ren, Qiaorong Xie, Wanyu Zhao, Linjie Li, Ping Li, Shengjie Hou, and Qingqing Wang from IAP, Kebin He and Xiaoting Chen from Tsinghua University, and James Allan and Hugh Coe from the University of Manchester for providing logistic and scientific support during the field campaigns.
This research was funded by the UK Natural Environment Research Council (NERC; NE/N007190/1 and NE/R005281/1) and the Royal Society Advanced Fellowship (grant no. NAFnR1n191220).
This paper was edited by Tim Butler and reviewed by two anonymous referees.
Aiken, A. C., DeCarlo, P. F., Kroll, J. H., Worsnop, D. R., Huffman, J. A., Docherty, K. S., Ulbrich, I. M., Mohr, C., Kimmel, J. R., Sueper, D., Sun, Y., Zhang, Q., Trimborn, A., Northway, M., Ziemann, P. J., Canagaratna, M. R., Onasch, T. B., Alfarra, M. R., Prevot, A. S. H., Dommen, J., Duplissy, J., Metzger, A., Baltensperger, U., and Jimenez, J. L.: and Ratios of Primary, Secondary, and Ambient Organic Aerosols with High-Resolution Time-of-Flight Aerosol Mass Spectrometry, Environ. Sci. Technol., 42, 4478–4485, https://doi.org/10.1021/es703009q, 2008.
Aiken, A. C., Salcedo, D., Cubison, M. J., Huffman, J. A., DeCarlo, P. F., Ulbrich, I. M., Docherty, K. S., Sueper, D., Kimmel, J. R., Worsnop, D. R., Trimborn, A., Northway, M., Stone, E. A., Schauer, J. J., Volkamer, R. M., Fortner, E., de Foy, B., Wang, J., Laskin, A., Shutthanandan, V., Zheng, J., Zhang, R., Gaffney, J., Marley, N. A., Paredes-Miranda, G., Arnott, W. P., Molina, L. T., Sosa, G., and Jimenez, J. L.: Mexico City aerosol analysis during MILAGRO using high resolution aerosol mass spectrometry at the urban supersite (T0) – Part 1: Fine particle composition and organic source apportionment, Atmos. Chem. Phys., 9, 6633–6653, https://doi.org/10.5194/acp-9-6633-2009, 2009.
Antony Chen, L. W., Watson, J. G., Chow, J. C., DuBois, D. W., and Herschberger, L.: Chemical mass balance source apportionment for combined PM2.5 measurements from U. S. non-urban and urban long-term networks, Atmos. Environ., 44, 4908–4918, https://doi.org/10.1016/j.atmosenv.2010.08.030, 2010.
Bae, M.-S., Demerjian, K. L., and Schwab, J. J.: Seasonal estimation of organic mass to organic carbon in PM2.5 at rural and urban locations in New York state, Atmos. Environ., 40, 7467–7479, https://doi.org/10.1016/j.atmosenv.2006.07.008, 2006a.
Bae, M.-S., Schauer, J. J., and Turner, J. R.: Estimation of the Monthly Average Ratios of Organic Mass to Organic Carbon for Fine Particulate Matter at an Urban Site, Aerosol Sci. Tech., 40, 1123–1139, https://doi.org/10.1080/02786820601004085, 2006b.
Bhattarai, H., Saikawa, E., Wan, X., Zhu, H., Ram, K., Gao, S., Kang, S., Zhang, Q., Zhang, Y., Wu, G., Wang, X., Kawamura, K., Fu, P., and Cong, Z.: Levoglucosan as a tracer of biomass burning: Recent progress and perspectives, Atmos. Res., 220, 20–33, https://doi.org/10.1016/j.atmosres.2019.01.004, 2019.
Bondy, A. L., Wang, B., Laskin, A., Craig, R. L., Nhliziyo, M. V., Bertman, S. B., Pratt, K. A., Shepson, P. B., and Ault, A. P.: Inland Sea Spray Aerosol Transport and Incomplete Chloride Depletion: Varying Degrees of Reactive Processing Observed during SOAS, Environ. Sci. Technol., 51, 9533–9542, https://doi.org/10.1021/acs.est.7b02085, 2017.
Cai, T., Zhang, Y., Fang, D., Shang, J., Zhang, Y., and Zhang, Y.: Chinese vehicle emissions characteristic testing with small sample size: Results and comparison, Atmos. Pollut. Res., 8, 154–163, https://doi.org/10.1016/j.apr.2016.08.007, 2017.
Castro, L. M., Pio, C. A., Harrison, R. M., and Smith, D. J. T.: Carbonaceous aerosol in urban and rural European atmospheres: estimation of secondary organic carbon concentrations, Atmos. Environ., 33, 2771–2781, https://doi.org/10.1016/S1352-2310(98)00331-8, 1999.
Cavalli, F., Viana, M., Yttri, K. E., Genberg, J., and Putaud, J.-P.: Toward a standardised thermal-optical protocol for measuring atmospheric organic and elemental carbon: the EUSAAR protocol, Atmos. Meas. Tech., 3, 79–89, https://doi.org/10.5194/amt-3-79-2010, 2010.
Chen, C., Zhang, H., Li, H., Wu, N., and Zhang, Q.: Chemical characteristics and source apportionment of ambient PM1.0 and PM2.5 in a polluted city in North China plain, Atmos. Environ., 242, 117867, https://doi.org/10.1016/j.atmosenv.2020.117867, 2020.
Chen, L.-W. A., Chow, J. C., Wang, X. L., Robles, J. A., Sumlin, B. J., Lowenthal, D. H., Zimmermann, R., and Watson, J. G.: Multi-wavelength optical measurement to enhance thermal/optical analysis for carbonaceous aerosol, Atmos. Meas. Tech., 8, 451–461, https://doi.org/10.5194/amt-8-451-2015, 2015.
Chen, P., Wang, T., Hu, X., and Xie, M.: Chemical Mass Balance Source Apportionment of Size-Fractionated Particulate Matter in Nanjing, China, Aerosol Air Qual. Res., 15, 1855–1867, https://doi.org/10.4209/aaqr.2015.03.0172, 2015.
Chen, W.-N., Chen, Y.-C., Kuo, C.-Y., Chou, C.-H., Cheng, C.-H., Huang, C.-C., Chang, S.-Y., Roja Raman, M., Shang, W.-L., Chuang, T.-Y., and Liu, S.-C.: The real-time method of assessing the contribution of individual sources on visibility degradation in Taichung, Sci. Total Environ., 497–498, 219–228, https://doi.org/10.1016/j.scitotenv.2014.07.120, 2014.
Chen, Y., Shi, G., Cai, J., Shi, Z., Wang, Z., Yao, X., Tian, M., Peng, C., Han, Y., Zhu, T., Liu, Y., Yang, X., Zheng, M., Yang, F., Zhang, Q., and He, K.: Simultaneous measurements of urban and rural particles in Beijing – Part 2: Case studies of haze events and regional transport, Atmos. Chem. Phys., 20, 9249–9263, https://doi.org/10.5194/acp-20-9249-2020, 2020.
Cheng, Y., Engling, G., He, K.-B., Duan, F.-K., Ma, Y.-L., Du, Z.-Y., Liu, J.-M., Zheng, M., and Weber, R. J.: Biomass burning contribution to Beijing aerosol, Atmos. Chem. Phys., 13, 7765–7781, https://doi.org/10.5194/acp-13-7765-2013, 2013.
Chow, J. C., Lowenthal, D. H., Chen, L. W. A., Wang, X. L., and Watson, J. G.: Mass reconstruction methods for PM2.5: a review, Air Qual. Atmos. Hlth., 8, 243–263, https://doi.org/10.1007/s11869-015-0338-3, 2015.
Chuang, M.-T., Chen, Y.-C., Lee, C.-T., Cheng, C.-H., Tsai, Y.-J., Chang, S.-Y., and Su, Z.-S.: Apportionment of the sources of high fine particulate matter concentration events in a developing aerotropolis in Taoyuan, Taiwan, Environ. Pollut., 214, 273–281, https://doi.org/10.1016/j.envpol.2016.04.045, 2016.
Dan, M., Zhuang, G., Li, X., Tao, H., and Zhuang, Y.: The characteristics of carbonaceous species and their sources in PM2.5 in Beijing, Atmos. Environ., 38, 3443–3452, https://doi.org/10.1016/j.atmosenv.2004.02.052, 2004.
de Miranda, R. M., de Fatima Andrade, M., Dutra Ribeiro, F. N., Mendonça Francisco, K. J., and Pérez-Martínez, P. J.: Source apportionment of fine particulate matter by positive matrix factorization in the metropolitan area of São Paulo, Brazil, J. Clean. Prod., 202, 253–263, https://doi.org/10.1016/j.jclepro.2018.08.100, 2018.
Dong, F.-m., Mo, Y.-Z., Li, G.-X., Xu, M.-M., and Pan, X.-C.: [Association between ambient PM10/PM2.5 levels and population mortality of circulatory diseases: a case-crossover study in Beijing], Beijing Da Xue Xue Bao Yi Xue Ban, 45, 398–404, 2013.
Fan, Y., Liu, C.-Q., Li, L., Ren, L., Ren, H., Zhang, Z., Li, Q., Wang, S., Hu, W., Deng, J., Wu, L., Zhong, S., Zhao, Y., Pavuluri, C. M., Li, X., Pan, X., Sun, Y., Wang, Z., Kawamura, K., Shi, Z., and Fu, P.: Large contributions of biogenic and anthropogenic sources to fine organic aerosols in Tianjin, North China, Atmos. Chem. Phys., 20, 117–137, https://doi.org/10.5194/acp-20-117-2020, 2020.
Fountoukis, C. and Nenes, A.: ISORROPIA II: a computationally efficient thermodynamic equilibrium model for K+–Ca2+–Mg2+––Na+–––Cl−–H2O aerosols, Atmos. Chem. Phys., 7, 4639–4659, https://doi.org/10.5194/acp-7-4639-2007, 2007.
Fu, P., Zhuang, G., Sun, Y., Wang, Q., Chen, J., Ren, L., Yang, F., Wang, Z., Pan, X., Li, X., and Kawamura, K.: Molecular markers of biomass burning, fungal spores and biogenic SOA in the Taklimakan desert aerosols, Atmos. Environ., 130, 64–73, https://doi.org/10.1016/j.atmosenv.2015.10.087, 2016.
Guo, S., Hu, M., Guo, Q., Zhang, X., Zheng, M., Zheng, J., Chang, C. C., Schauer, J. J., and Zhang, R.: Primary Sources and Secondary Formation of Organic Aerosols in Beijing, China, Environ. Sci. Technol., 46, 9846–9853, https://doi.org/10.1021/es2042564, 2012.
Guo, S., Hu, M., Guo, Q., Zhang, X., Schauer, J. J., and Zhang, R.: Quantitative evaluation of emission controls on primary and secondary organic aerosol sources during Beijing 2008 Olympics, Atmos. Chem. Phys., 13, 8303–8314, https://doi.org/10.5194/acp-13-8303-2013, 2013.
Han, B., Zhang, R., Yang, W., Bai, Z., Ma, Z., and Zhang, W.: Heavy haze episodes in Beijing during January 2013: Inorganic ion chemistry and source analysis using highly time-resolved measurements from an urban site, Sci. Total Environ., 544, 319–329, https://doi.org/10.1016/j.scitotenv.2015.10.053, 2016.
He, K., Yang, F., Ma, Y., Zhang, Q., Yao, X., Chan, C. K., Cadle, S., Chan, T., and Mulawa, P.: The characteristics of PM2.5 in Beijing, China, Atmos. Environ., 35, 4959–4970, https://doi.org/10.1016/S1352-2310(01)00301-6, 2001.
Hua, Y., Wang, S., Jiang, J., Zhou, W., Xu, Q., Li, X., Liu, B., Zhang, D., and Zheng, M.: Characteristics and sources of aerosol pollution at a polluted rural site southwest in Beijing, China, Sci. Total Environ., 626, 519–527, https://doi.org/10.1016/j.scitotenv.2018.01.047, 2018.
Huang, R.-J., Zhang, Y., Bozzetti, C., Ho, K.-F., Cao, J.-J., Han, Y., Daellenbach, K. R., Slowik, J. G., Platt, S. M., Canonaco, F., Zotter, P., Wolf, R., Pieber, S. M., Bruns, E. A., Crippa, M., Ciarelli, G., Piazzalunga, A., Schwikowski, M., Abbaszade, G., Schnelle-Kreis, J., Zimmermann, R., An, Z., Szidat, S., Baltensperger, U., Haddad, I. E., and Prévôt, A. S. H.: High secondary aerosol contribution to particulate pollution during haze events in China, Nature, 514, 218–222, https://doi.org/10.1038/nature13774, 2014.
Huang, X., Liu, Z., Liu, J., Hu, B., Wen, T., Tang, G., Zhang, J., Wu, F., Ji, D., Wang, L., and Wang, Y.: Chemical characterization and source identification of PM2.5 at multiple sites in the Beijing–Tianjin–Hebei region, China, Atmos. Chem. Phys., 17, 12941–12962, https://doi.org/10.5194/acp-17-12941-2017, 2017.
Huang, X.-F., He, L.-Y., Hu, M., Canagaratna, M. R., Sun, Y., Zhang, Q., Zhu, T., Xue, L., Zeng, L.-W., Liu, X.-G., Zhang, Y.-H., Jayne, J. T., Ng, N. L., and Worsnop, D. R.: Highly time-resolved chemical characterization of atmospheric submicron particles during 2008 Beijing Olympic Games using an Aerodyne High-Resolution Aerosol Mass Spectrometer, Atmos. Chem. Phys., 10, 8933–8945, https://doi.org/10.5194/acp-10-8933-2010, 2010.
Ikemori, F., Uranishi, K., Asakawa, D., Nakatsubo, R., Makino, M., Kido, M., Mitamura, N., Asano, K., Nonaka, S., Nishimura, R., and Sugata, S.: Source apportionment in PM2.5 in central Japan using positive matrix factorization focusing on small-scale local biomass burning, Atmos. Pollut. Res., 12, 349–359, https://doi.org/10.1016/j.apr.2021.01.006, 2021.
Kang, M., Ren, L., Ren, H., Zhao, Y., Kawamura, K., Zhang, H., Wei, L., Sun, Y., Wang, Z., and Fu, P.: Primary biogenic and anthropogenic sources of organic aerosols in Beijing, China: Insights from saccharides and n-alkanes, Environ. Pollut., 243, 1579–1587, https://doi.org/10.1016/j.envpol.2018.09.118, 2018.
Le, T.-C., Shukla, K. K., Chen, Y.-T., Chang, S.-C., Lin, T.-Y., Li, Z., Pui, D. Y. H., and Tsai, C.-J.: On the concentration differences between PM2.5 FEM monitors and FRM samplers, Atmos. Environ., 222, 117138, https://doi.org/10.1016/j.atmosenv.2019.117138, 2020.
Li, L., Ren, L., Ren, H., Yue, S., Xie, Q., Zhao, W., Kang, M., Li, J., Wang, Z., Sun, Y., and Fu, P.: Molecular Characterization and Seasonal Variation in Primary and Secondary Organic Aerosols in Beijing, China, J. Geophys. Res-Atmos., 123, 12394–12412, 2018.
Li, P., Xin, J., Wang, Y., Wang, S., Li, G., Pan, X., Liu, Z., and Wang, L.: The acute effects of fine particles on respiratory mortality and morbidity in Beijing, 2004–2009, Environ. Sci. Pollut. R., 20, 6433–6444, https://doi.org/10.1007/s11356-013-1688-8, 2013.
Li, X., Nie, T., Qi, J., Zhou, Z., and Sun, X. S.: [Regional Source Apportionment of PM2.5 in Beijing in January 2013], Huan jing ke xue = Huanjing kexue, 36, 1148–1153, 2015.
Liu, B., Wu, J., Zhang, J., Wang, L., Yang, J., Liang, D., Dai, Q., Bi, X., Feng, Y., Zhang, Y., and Zhang, Q.: Characterization and source apportionment of PM2.5 based on error estimation from EPA PMF 5.0 model at a medium city in China, Environ. Pollut., 222, 10–22, https://doi.org/10.1016/j.envpol.2017.01.005, 2017.
Liu, L., Zhang, J., Zhang, Y., Wang, Y., Xu, L., Yuan, Q., Liu, D., Sun, Y., Fu, P., Shi, Z., and Li, W.: Persistent residential burning-related primary organic particles during wintertime hazes in North China: insights into their aging and optical changes, Atmos. Chem. Phys., 21, 2251–2265, https://doi.org/10.5194/acp-21-2251-2021, 2021.
Liu, Q., Baumgartner, J., Zhang, Y., and Schauer, J. J.: Source apportionment of Beijing air pollution during a severe winter haze event and associated pro-inflammatory responses in lung epithelial cells, Atmos. Environ., 126, 28–35, https://doi.org/10.1016/j.atmosenv.2015.11.031, 2016.
Oduber, F., Calvo, A. I., Castro, A., Blanco-Alegre, C., Alves, C., Calzolai, G., Nava, S., Lucarelli, F., Nunes, T., Barata, J., and Fraile, R.: Characterization of aerosol sources in León (Spain) using Positive Matrix Factorization and weather types, Sci. Total Environ., 754, 142045, https://doi.org/10.1016/j.scitotenv.2020.142045, 2021.
Pant, P., Shukla, A., Kohl, S. D., Chow, J. C., Watson, J. G., and Harrison, R. M.: Characterization of ambient PM2.5 at a pollution hotspot in New Delhi, India and inference of sources, Atmos. Environ., 109, 178–189, https://doi.org/10.1016/j.atmosenv.2015.02.074, 2015.
Paraskevopoulou, D., Liakakou, E., Gerasopoulos, E., Theodosi, C., and Mihalopoulos, N.: Long-term characterization of organic and elemental carbon in the PM2.5 fraction: the case of Athens, Greece, Atmos. Chem. Phys., 14, 13313–13325, https://doi.org/10.5194/acp-14-13313-2014, 2014.
Pio, C. and Harrison, R.: Vapour pressure of ammonium chloride aerosol: Effect of temperature and humidity, Atmos. Environ. (1967), 21, 2711–2715, https://doi.org/10.1016/0004-6981(87)90203-4, 1987.
Pio, C., Cerqueira, M., Harrison, R. M., Nunes, T., Mirante, F., Alves, C., Oliveira, C., Sanchez de la Campa, A., Artíñano, B., and Matos, M.: ratio observations in Europe: Re-thinking the approach for apportionment between primary and secondary organic carbon, Atmos. Environ., 45, 6121–6132, https://doi.org/10.1016/j.atmosenv.2011.08.045, 2011.
Qi, M., Jiang, L., Liu, Y., Xiong, Q., Sun, C., Li, X., Zhao, W., and Yang, X.: Analysis of the Characteristics and Sources of Carbonaceous Aerosols in PM2.5 in the Beijing, Tianjin, and Langfang Region, China, Int. J. Env. Res Pub. He., 15, 1483, https://doi.org/10.3390/ijerph15071483, 2018.
Reyes-Villegas, E., Bannan, T., Le Breton, M., Mehra, A., Priestley, M., Percival, C., Coe, H., and Allan, J. D.: Online Chemical Characterization of Food-Cooking Organic Aerosols: Implications for Source Apportionment, Environ. Sci. Technol., 52, 5308–5318, https://doi.org/10.1021/acs.est.7b06278, 2018.
Rogge, W. F., Hildemann, L. M., Mazurek, M. A., Cass, G. R., and Simoneit, B. R. T.: Sources of fine organic aerosol. 4. Particulate abrasion products from leaf surfaces of urban plants, Environ. Sci. Technol., 27, 2700–2711, https://doi.org/10.1021/es00049a008, 1993.
Sarnat, J. A., Marmur, A., Klein, M., Kim, E., Russell, A. G., Sarnat, S. E., Mulholland, J. A., Hopke, P. K., and Tolbert, P. E.: Fine Particle Sources and Cardiorespiratory Morbidity: An Application of Chemical Mass Balance and Factor Analytical Source-Apportionment Methods, Environ. Health Persp., 116, 459–466, https://doi.org/10.1289/ehp.10873, 2008.
Shi, Z., Vu, T., Kotthaus, S., Harrison, R. M., Grimmond, S., Yue, S., Zhu, T., Lee, J., Han, Y., Demuzere, M., Dunmore, R. E., Ren, L., Liu, D., Wang, Y., Wild, O., Allan, J., Acton, W. J., Barlow, J., Barratt, B., Beddows, D., Bloss, W. J., Calzolai, G., Carruthers, D., Carslaw, D. C., Chan, Q., Chatzidiakou, L., Chen, Y., Crilley, L., Coe, H., Dai, T., Doherty, R., Duan, F., Fu, P., Ge, B., Ge, M., Guan, D., Hamilton, J. F., He, K., Heal, M., Heard, D., Hewitt, C. N., Hollaway, M., Hu, M., Ji, D., Jiang, X., Jones, R., Kalberer, M., Kelly, F. J., Kramer, L., Langford, B., Lin, C., Lewis, A. C., Li, J., Li, W., Liu, H., Liu, J., Loh, M., Lu, K., Lucarelli, F., Mann, G., McFiggans, G., Miller, M. R., Mills, G., Monk, P., Nemitz, E., O'Connor, F., Ouyang, B., Palmer, P. I., Percival, C., Popoola, O., Reeves, C., Rickard, A. R., Shao, L., Shi, G., Spracklen, D., Stevenson, D., Sun, Y., Sun, Z., Tao, S., Tong, S., Wang, Q., Wang, W., Wang, X., Wang, X., Wang, Z., Wei, L., Whalley, L., Wu, X., Wu, Z., Xie, P., Yang, F., Zhang, Q., Zhang, Y., Zhang, Y., and Zheng, M.: Introduction to the special issue “In-depth study of air pollution sources and processes within Beijing and its surrounding region (APHH-Beijing)”, Atmos. Chem. Phys., 19, 7519–7546, https://doi.org/10.5194/acp-19-7519-2019, 2019.
Song, Y., Xie, S., Zhang, Y., Zeng, L., Salmon, L. G., and Zheng, M.: Source apportionment of PM2.5 in Beijing using principal component analysis/absolute principal component scores and UNMIX, Sci. Total Environ., 372, 278–286, https://doi.org/10.1016/j.scitotenv.2006.08.041, 2006a.
Song, Y., Zhang, Y., Xie, S., Zeng, L., Zheng, M., Salmon, L. G., Shao, M., and Slanina, S.: Source apportionment of PM2.5 in Beijing by positive matrix factorization, Atmos. Environ., 40, 1526–1537, https://doi.org/10.1016/j.atmosenv.2005.10.039, 2006b.
Song, Y., Tang, X., Xie, S., Zhang, Y., Wei, Y., Zhang, M., Zeng, L., and Lu, S.: Source apportionment of PM2.5 in Beijing in 2004, J. Hazard. Mater., 146, 124–130, https://doi.org/10.1016/j.jhazmat.2006.11.058, 2007.
Srivastava, D., Favez, O., Petit, J. E., Zhang, Y., Sofowote, U. M., Hopke, P. K., Bonnaire, N., Perraudin, E., Gros, V., Villenave, E., and Albinet, A.: Speciation of organic fractions does matter for aerosol source apportionment. Part 3: Combining off-line and on-line measurements, Sci. Total Environ., 690, 944–955, https://doi.org/10.1016/j.scitotenv.2019.06.378, 2019.
Srivastava, D., Xu, J., Vu, T. V., Liu, D., Li, L., Fu, P., Hou, S., Shi, Z., and Harrison, R. M.: Insight into PM2.5 Sources by Applying Positive Matrix Factorization (PMF) at an Urban and Rural Site of Beijing, Atmos. Chem. Phys. Discuss. [preprint], https://doi.org/10.5194/acp-2020-1017, in review, 2021.
Sun, Y., Du, W., Fu, P., Wang, Q., Li, J., Ge, X., Zhang, Q., Zhu, C., Ren, L., Xu, W., Zhao, J., Han, T., Worsnop, D. R., and Wang, Z.: Primary and secondary aerosols in Beijing in winter: sources, variations and processes, Atmos. Chem. Phys., 16, 8309–8329, https://doi.org/10.5194/acp-16-8309-2016, 2016.
Sun, Y., He, Y., Kuang, Y., Xu, W., Song, S., Ma, N., Tao, J., Cheng, P., Wu, C., Su, H., Cheng, Y., Xie, C., Chen, C., Lei, L., Qiu, Y., Fu, P., Croteau, P., and Worsnop, D. R.: Chemical Differences between PM1 and PM2.5 in Highly Polluted Environment and Implications in Air Pollution Studies, Geophys. Res. Lett., 47, e2019GL086288, https://doi.org/10.1029/2019gl086288, 2020.
Tian, Y., Harrison, R. M., Feng, Y., Shi, Z., Liang, Y., Li, Y., Xue, Q., and Xu, J.: Size-resolved source apportionment of particulate matter from a megacity in northern China based on one-year measurement of inorganic and organic components, Environ. Pollut., under review, 2021.
Turpin, B. J. and Huntzicker, J. J.: Identification of secondary organic aerosol episodes and quantitation of primary and secondary organic aerosol concentrations during SCAQS, Atmos. Environ., 29, 3527–3544, https://doi.org/10.1016/1352-2310(94)00276-Q, 1995.
U.S. EPA: Monitoring PM2.5 in ambient air using designated reference or class I equivalent methods, in: Quality Assurance Handbook for Air Pollution Measurement Systems, 2–12, 2016.
Ulbrich, I. M., Canagaratna, M. R., Zhang, Q., Worsnop, D. R., and Jimenez, J. L.: Interpretation of organic components from Positive Matrix Factorization of aerosol mass spectrometric data, Atmos. Chem. Phys., 9, 2891–2918, https://doi.org/10.5194/acp-9-2891-2009, 2009.
Viana, M., Kuhlbusch, T. A. J., Querol, X., Alastuey, A., Harrison, R. M., Hopke, P. K., Winiwarter, W., Vallius, M., Szidat, S., Prévôt, A. S. H., Hueglin, C., Bloemen, H., Wåhlin, P., Vecchi, R., Miranda, A. I., Kasper-Giebl, A., Maenhaut, W., and Hitzenberger, R.: Source apportionment of particulate matter in Europe: A review of methods and results, J. Aerosol Sci., 39, 827–849, https://doi.org/10.1016/j.jaerosci.2008.05.007, 2008.
Vu, T. V., Shi, Z., Cheng, J., Zhang, Q., He, K., Wang, S., and Harrison, R. M.: Assessing the impact of clean air action on air quality trends in Beijing using a machine learning technique, Atmos. Chem. Phys., 19, 11303–11314, https://doi.org/10.5194/acp-19-11303-2019, 2019.
Wang, Q., Shao, M., Zhang, Y., Wei, Y., Hu, M., and Guo, S.: Source apportionment of fine organic aerosols in Beijing, Atmos. Chem. Phys., 9, 8573–8585, https://doi.org/10.5194/acp-9-8573-2009, 2009.
Wu, X., Chen, C., Vu, T. V., Liu, D., Baldo, C., Shen, X., Zhang, Q., Cen, K., Zheng, M., He, K., Shi, Z., and Harrison, R. M.: Source apportionment of fine organic carbon (OC) using receptor modelling at a rural site of Beijing: Insight into seasonal and diurnal variation of source contributions, Environ. Pollut., 266, 115078, https://doi.org/10.1016/j.envpol.2020.115078, 2020.
Xu, J., Jia, C., He, J., Xu, H., Tang, Y.-T., Ji, D., Yu, H., Xiao, H., and Wang, C.: Biomass burning and fungal spores as sources of fine aerosols in Yangtze River Delta, China – Using multiple organic tracers to understand variability, correlations and origins, Environ. Pollut., 251, 155–165, https://doi.org/10.1016/j.envpol.2019.04.090, 2019.
Xu, J., Song, S., Harrison, R. M., Song, C., Wei, L., Zhang, Q., Sun, Y., Lei, L., Zhang, C., Yao, X., Chen, D., Li, W., Wu, M., Tian, H., Luo, L., Tong, S., Li, W., Wang, J., Shi, G., Huangfu, Y., Tian, Y., Ge, B., Su, S., Peng, C., Chen, Y., Yang, F., Mihajlidi-Zelić, A., Đorđević, D., Swift, S. J., Andrews, I., Hamilton, J. F., Sun, Y., Kramawijaya, A., Han, J., Saksakulkrai, S., Baldo, C., Hou, S., Zheng, F., Daellenbach, K. R., Yan, C., Liu, Y., Kulmala, M., Fu, P., and Shi, Z.: An interlaboratory comparison of aerosol inorganic ion measurements by ion chromatography: implications for aerosol pH estimate, Atmos. Meas. Tech., 13, 6325–6341, https://doi.org/10.5194/amt-13-6325-2020, 2020.
Xu, J., Srivastava, D., Wu, X., Hou, S., Vu, Tuan V., Liu, D., Sun, Y., Vlachou, A., Moschos, V., Salazar, G., Szidat, S., Prévôt, A. S. H., Fu, P., Harrison, R. M., and Shi, Z.: An evaluation of source apportionment of fine OC and PM2.5 by multiple methods: APHH-Beijing campaigns as a case study, Faraday Discuss., 226, 290–313, https://doi.org/10.1039/D0FD00095G, 2021.
Xu, M., Yu, D., Yao, H., Liu, X., and Qiao, Y.: Coal combustion-generated aerosols: Formation and properties, P. Combust. Inst., 33, 1681–1697, https://doi.org/10.1016/j.proci.2010.09.014, 2011.
Xu, W., Sun, Y., Wang, Q., Du, W., Zhao, J., Ge, X., Han, T., Zhang, Y., Zhou, W., Li, J., Fu, P., Wang, Z., and Worsnop, D. R.: Seasonal Characterization of Organic Nitrogen in Atmospheric Aerosols Using High Resolution Aerosol Mass Spectrometry in Beijing, China, ACS Earth and Space Chemistry, 1, 673–682, https://doi.org/10.1021/acsearthspacechem.7b00106, 2017.
Xu, W., Sun, Y., Wang, Q., Zhao, J., Wang, J., Ge, X., Xie, C., Zhou, W., Du, W., Li, J., Fu, P., Wang, Z., Worsnop, D. R., and Coe, H.: Changes in Aerosol Chemistry From 2014 to 2016 in Winter in Beijing: Insights From High-Resolution Aerosol Mass Spectrometry, J. Geophys. Res.-Atmos., 124, 1132–1147, https://doi.org/10.1029/2018jd029245, 2019.
Xu, X., Zhang, H., Chen, J., Li, Q., Wang, X., Wang, W., Zhang, Q., Xue, L., Ding, A., and Mellouki, A.: Six sources mainly contributing to the haze episodes and health risk assessment of PM2.5 at Beijing suburb in winter 2016, Ecotox. Environ. Safe., 166, 146–156, https://doi.org/10.1016/j.ecoenv.2018.09.069, 2018.
Yang, F., Kawamura, K., Chen, J., Ho, K., Lee, S., Gao, Y., Cui, L., Wang, T., and Fu, P.: Anthropogenic and biogenic organic compounds in summertime fine aerosols (PM2.5) in Beijing, China, Atmos. Environ., 124, 166–175, https://doi.org/10.1016/j.atmosenv.2015.08.095, 2016.
Yang, X., Wang, T., Xia, M., Gao, X., Li, Q., Zhang, N., Gao, Y., Lee, S., Wang, X., Xue, L., Yang, L., and Wang, W.: Abundance and origin of fine particulate chloride in continental China, Sci. Total Environ., 624, 1041–1051, https://doi.org/10.1016/j.scitotenv.2017.12.205, 2018.
Yin, J., Cumberland, S. A., Harrison, R. M., Allan, J., Young, D. E., Williams, P. I., and Coe, H.: Receptor modelling of fine particles in southern England using CMB including comparison with AMS-PMF factors, Atmos. Chem. Phys., 15, 2139–2158, https://doi.org/10.5194/acp-15-2139-2015, 2015.
Yu, L. and Wang, G.: Characterization and Source Apportionment of PM2.5 in an Urban Environment in Beijing, Aerosol Air Qual. Res., 13, 574–583, https://doi.org/10.4209/aaqr.2012.07.0192, 2013.
Yu, L. D., Wang, G. F., Zhang, R. J., Zhang, L. M., Song, Y., Wu, B. B., Li, X. F., An, K., and Chu, J. H.: Characterization and Source Apportionment of PM2.5 in an Urban Environment in Beijing, Aerosol Air Qual. Res., 13, 574–583, https://doi.org/10.4209/aaqr.2012.07.0192, 2013.
Yu, S., Liu, W., Xu, Y., Yi, K., Zhou, M., Tao, S., and Liu, W.: Characteristics and oxidative potential of atmospheric PM2.5 in Beijing: Source apportionment and seasonal variation, Sci. Total Environ., 650, 277–287, https://doi.org/10.1016/j.scitotenv.2018.09.021, 2019.
Zhang, Q., Worsnop, D. R., Canagaratna, M. R., and Jimenez, J. L.: Hydrocarbon-like and oxygenated organic aerosols in Pittsburgh: insights into sources and processes of organic aerosols, Atmos. Chem. Phys., 5, 3289–3311, https://doi.org/10.5194/acp-5-3289-2005, 2005.
Zhang, Q., Zheng, Y., Tong, D., Shao, M., Wang, S., Zhang, Y., Xu, X., Wang, J., He, H., Liu, W., Ding, Y., Lei, Y., Li, J., Wang, Z., Zhang, X., Wang, Y., Cheng, J., Liu, Y., Shi, Q., Yan, L., Geng, G., Hong, C., Li, M., Liu, F., Zheng, B., Cao, J., Ding, A., Gao, J., Fu, Q., Huo, J., Liu, B., Liu, Z., Yang, F., He, K., and Hao, J.: Drivers of improved PM2.5 air quality in China from 2013 to 2017, P. Natl. Acad. Sci. USA, 116, 24463–24469, https://doi.org/10.1073/pnas.1907956116, 2019.
Zhang, R., Jing, J., Tao, J., Hsu, S.-C., Wang, G., Cao, J., Lee, C. S. L., Zhu, L., Chen, Z., Zhao, Y., and Shen, Z.: Chemical characterization and source apportionment of PM2.5 in Beijing: seasonal perspective, Atmos. Chem. Phys., 13, 7053–7074, https://doi.org/10.5194/acp-13-7053-2013, 2013.
Zhang, X. Y., Zhuang, G. S., Guo, J. H., Yin, K. D., and Zhang, P.: Characterization of aerosol over the Northern South China Sea during two cruises in 2003, Atmos. Environ., 41, 7821–7836, https://doi.org/10.1016/j.atmosenv.2007.06.031, 2007.
Zhang, Y., Schauer, J. J., Zhang, Y., Zeng, L., Wei, Y., Liu, Y., and Shao, M.: Characteristics of Particulate Carbon Emissions from Real-World Chinese Coal Combustion, Environ. Sci. Technol., 42, 5068–5073, https://doi.org/10.1021/es7022576, 2008.
Zhang, Y., Lang, J., Cheng, S., Li, S., Zhou, Y., Chen, D., Zhang, H., and Wang, H.: Chemical composition and sources of PM1 and PM2.5 in Beijing in autumn, Sci. Total Environ., 630, 72–82, https://doi.org/10.1016/j.scitotenv.2018.02.151, 2018.
Zhang, Y., Vu, T. V., Sun, J., He, J., Shen, X., Lin, W., Zhang, X., Zhong, J., Gao, W., Wang, Y., Fu, T. M., Ma, Y., Li, W., and Shi, Z.: Significant Changes in Chemistry of Fine Particles in Wintertime Beijing from 2007 to 2017: Impact of Clean Air Actions, Environ. Sci. Technol., 54, 1344–1352, https://doi.org/10.1021/acs.est.9b04678, 2020.
Zhang, Y.-X., Shao, M., Zhang, Y.-H., Zeng, L.-M., He, L.-Y., Zhu, B., Wei, Y.-J., and Zhu, X.-L.: Source profiles of particulate organic matters emitted from cereal straw burnings, J. Environ. Sci., 19, 167–175, https://doi.org/10.1016/S1001-0742(07)60027-8, 2007.
Zhao, B., Zheng, H., Wang, S., Smith, K. R., Lu, X., Aunan, K., Gu, Y., Wang, Y., Ding, D., Xing, J., Fu, X., Yang, X., Liou, K.-N., and Hao, J.: Change in household fuels dominates the decrease in PM2.5 exposure and premature mortality in China in 2005–2015, P. Natl. Acad. Sci. USA, 115, 12401–12406, https://doi.org/10.1073/pnas.1812955115, 2018.
Zhao, X., Hu, Q., Wang, X., Ding, X., He, Q., Zhang, Z., Shen, R., Lü, S., Liu, T., Fu, X., and Chen, L.: Composition profiles of organic aerosols from Chinese residential cooking: case study in urban Guangzhou, south China, J. Atmos. Chem., 72, 1–18, https://doi.org/10.1007/s10874-015-9298-0, 2015.
Zhao, Y., Hu, M., Slanina, S., and Zhang, Y.: Chemical Compositions of Fine Particulate Organic Matter Emitted from Chinese Cooking, Environ. Sci. Technol., 41, 99–105, https://doi.org/10.1021/es0614518, 2007.
Zheng, B., Tong, D., Li, M., Liu, F., Hong, C., Geng, G., Li, H., Li, X., Peng, L., Qi, J., Yan, L., Zhang, Y., Zhao, H., Zheng, Y., He, K., and Zhang, Q.: Trends in China's anthropogenic emissions since 2010 as the consequence of clean air actions, Atmos. Chem. Phys., 18, 14095–14111, https://doi.org/10.5194/acp-18-14095-2018, 2018.
Zheng, M., Salmon, L. G., Schauer, J. J., Zeng, L., Kiang, C. S., Zhang, Y., and Cass, G. R.: Seasonal trends in PM2.5 source contributions in Beijing, China, Atmos. Environ., 39, 3967–3976, https://doi.org/10.1016/j.atmosenv.2005.03.036, 2005.
Zhou, J., Xiong, Y., Xing, Z., Deng, J., and Du, K.: Characterizing and sourcing ambient PM2.5 over key emission regions in China II: Organic molecular markers and CMB modeling, Atmos. Environ., 163, 57–64, https://doi.org/10.1016/j.atmosenv.2017.05.033, 2017.
Zhou, W., Wang, Q., Zhao, X., Xu, W., Chen, C., Du, W., Zhao, J., Canonaco, F., Prévôt, A. S. H., Fu, P., Wang, Z., Worsnop, D. R., and Sun, Y.: Characterization and source apportionment of organic aerosol at 260 m on a meteorological tower in Beijing, China, Atmos. Chem. Phys., 18, 3951–3968, https://doi.org/10.5194/acp-18-3951-2018, 2018.