the Creative Commons Attribution 4.0 License.
the Creative Commons Attribution 4.0 License.
 | 07 May 2021
Water uptake of subpollen aerosol particles: hygroscopic growth, cloud condensation nuclei activation, and liquid–liquid phase separation
Eugene F. Mikhailov
Mira L. Pöhlker
Kathrin Reinmuth-Selzle
Sergey S. Vlasenko
Ovid O. Krüger
Janine Fröhlich-Nowoisky
Christopher Pöhlker
Olga A. Ivanova
Alexey A. Kiselev
Leslie A. Kremper
Ulrich Pöschl
Pollen grains emitted from vegetation can release subpollen particles (SPPs) that contribute to the fine fraction of atmospheric aerosols and may act as cloud condensation nuclei (CCN), ice nuclei (IN), or aeroallergens. Here, we investigate and characterize the hygroscopic growth and CCN activation of birch, pine, and rapeseed SPPs. A high-humidity tandem differential mobility analyzer (HHTDMA) was used to measure particle restructuring and water uptake over a wide range of relative humidity (RH) from 2 % to 99.5 %, and a continuous flow CCN counter was used for size-resolved measurements of CCN activation at supersaturations (S) in the range of 0.2 % to 1.2 %. For both subsaturated and supersaturated conditions, effective hygroscopicity parameters, κ, were obtained by Köhler model calculations. Gravimetric and chemical analyses, electron microscopy, and dynamic light scattering measurements were performed to characterize further properties of SPPs from aqueous pollen extracts such as chemical composition (starch, proteins, DNA, and inorganic ions) and the hydrodynamic size distribution of water-insoluble material. All investigated SPP samples exhibited a sharp increase of water uptake and κ above ∼95 % RH, suggesting a liquid–liquid phase separation (LLPS). The HHTDMA measurements at RH >95 % enable closure between the CCN activation at water vapor supersaturation and hygroscopic growth at subsaturated conditions, which is often not achieved when hygroscopicity tandem differential mobility analyzer (HTDMA) measurements are performed at lower RH where the water uptake and effective hygroscopicity may be limited by the effects of LLPS. Such effects may be important not only for closure between hygroscopic growth and CCN activation but also for the chemical reactivity, allergenic potential, and related health effects of SPPs.
- Article
(5050 KB) - Full-text XML
-
Supplement
(1133 KB) - BibTeX
- EndNote


The hygroscopic properties of atmospheric aerosols and their ability to act as cloud condensation nuclei (CCN)-forming cloud droplets are crucial for the radiative budget of the Earth's atmosphere (Hänel, 1976; Rader and McMurry, 1986; Pöschl, 2005; McFiggans et al., 2006; Andreae and Rosenfeld, 2008; Swietlicki et al., 2008; Cheng et al., 2008; Zieger et al., 2013; Rastak et al., 2014, and references therein). The primary parameters that determine the optical properties, CCN activity, reactivity, and deposition of aerosol particles are their size and composition. Depending on their sources and atmospheric processing (interaction with radiation, gases, and clouds), atmospheric particles consist of a complex mixture of organic and inorganic chemical components.
Primary biological aerosols (PBAs) are a subset of atmospheric particles, which are directly released from the biosphere into the atmosphere. They comprise viable or dead cells, reproductive units, and fragments of organisms (bacteria, fungal spores, viruses, pollen, plant debris, etc.) (Després et al., 2012; Fröhlich-Nowoisky et al., 2016). PBA particles span the entire range of atmospheric aerosol particle diameters from nanometers to ∼100 µm, whereby the lower limit is given by the size of molecular clusters or macromolecules, and the upper limit is related to rapid sedimentation. The number and mass concentrations of PBA particles over vegetated regions are typically on the order of 104 m−3 and 1 µg m−3, respectively, and account for around 30 % in urban and rural air (Després et al., 2012; Fröhlich-Nowoisky et al., 2016). Laboratory experiments have shown that primary bioparticles are efficient CCN and IN and thus are assumed to influence the formation of cloud systems and precipitation (Möhler et al., 2007; Pöschl et al., 2010; Morris et al., 2014; Hoose and Möhler, 2012). Intense precipitation, in turn, can increase the concentrations of IN-active bioaerosols in certain ecosystems (Huffman et al., 2013; Prenni et al., 2013). The positive feedback between the concentration of biological aerosol and precipitation is called bioprecipitation (Morris et al., 2014). It has been suggested that rainforests such as the Amazon Basin can act as biogeochemical reactors in which the precipitation induced by PBA materials sustain the production of plants, and hence PBA material, within the ecosystem (Pöschl et al., 2010).
Pollen is a category of bioaerosols that may spread in large quantities. It is the male gametophyte of gymnosperms and angiosperms. Pollen size ranges from 15 to 100 µm; its shape, when dry, is generally oval or spherical. The typical ambient number concentration of the pollen is estimated to be 10–103 m−3 (Després et al., 2012). In the Northern Hemisphere forests during strong pollination events pollen concentration may exceed 104 m−3 (Williams and Després, 2017). Anemophilous (wind-driven) pollen grains despite their large size can undergo long-distance dispersal up to ∼103 km (Sofiev et al., 2006; Kuparinen et al., 2009).
Water uptake of whole pollen grains at subsaturated conditions was studied by Pope (2010) and Griffiths et al. (2012) using an electrodynamic balance (EDB), as well as by Tang et al. (2019) and Chen et al. (2019), who utilized a commercial vapor sorption analyzer. It was found that mass hygroscopic growth of pollen grains can be approximated by the κ-Köhler equation (Petters and Kreidenweis, 2007). For six pollen species studied by EDB, the κ values were in the range of 0.05–0.10 (assuming a dry pollen density of 1 g cm−3). These values agree with the κ range of 0.034–0.061 and 0.036–0.048 reported by Tang et al. (2019) and Chen et al. (2019) based on gravimetric measurements of 6 and 11 pollen samples, respectively. The EDB measurements by Pope (2010) and Griffiths et al. (2012) were complemented by environment scanning electron microscopy (ESEM) analysis, which showed that at RH <85 % the pollen grains swell internally by capillary effect through the germ apertures (Diehl et al., 2001). At RH >89 %, the wetting of the pollen surface was observed. The surface absorption of water was first detected at the pollen pore sites and proceeded to engulf the pollen grain as a whole. Pollen has been identified as a potential natural source of giant CCN (Griffiths et al., 2012). Many studies have reported a high IN activity of various pollen species and highlight their potential importance for mixed-phase clouds in biologically influenced environments (Diehl et al., 2001, 2002; von Blohn et al., 2005; Chen et al., 2008; Pummer et al., 2012). Although pollen grains are assumed to account only for a small fraction of IN activity on a global scale, their local and regional impact on cloud microphysics could be substantial (Hoose et al., 2010).
In addition to the direct emission of intact pollen grains, the rupture of pollen and subsequent release of fine particles may contribute more substantially to ambient aerosol particle concentration. Fresh pollen grains can rupture at high humidity (Taylor et al., 2002, 2004) and during precipitation events (Grote et al., 2001, 2003; Hughes et al., 2020). They may also mechanically rupture under turbulent conditions by impact forces (Visez et al., 2015). When pollen grains rupture, they release cytoplasmic material known as subpollen particles (SPPs), ranging from several nanometers to about 1 µm (Grote et al., 2003; Taylor et al., 2004). Rupture can occur on open anthers (i.e., at the surface), and SPPs can be subsequently dispersed to the atmosphere by disturbances like wind in dry conditions (Taylor et al., 2004). Regional transport and weather patterns may facilitate the transport of these smaller particles and lead to longer atmospheric residence time (Wozniak et al., 2018; Hughes et al., 2020).
Augustin et al. (2013) and O'Sullivan et al. (2015) have shown that the nanoscale range SPPs washed off pollen grains are IN active even with a molecular mass below 1000 kDa. Laboratory experiments with six fresh pollen samples revealed that SPPs ranging 50–200 nm are CCN active in the supersaturation range of 0.81 %–0.12 % (Steiner et al., 2015). Mikhailov et al. (2019) found an almost constant CCN-derived κ value of 0.12 to 0.13 for SPPs produced by birch, pine, and rapeseed pollen grains. As shown below, these values are underestimated since they do not account for the irregular shape of the initial dry SPPs. Wozniak et al. (2018) developed the first model of atmospheric pollen grain rupture and implemented the mechanism in regional climate model simulations over the spring pollen season in the United States with a CCN-dependent moisture scheme. They showed that in contrast to positive “bioprecipitation” feedback caused by IN-active bioparticles (Morris et al., 2014), the CCN-active SPPs suppress precipitation. Model calculations indicate that when the number of SPPs is equal to 106, the suppression effect in clean conditions is 32 %, while their lower value (103) produces a negligible effect on precipitation.
Almost all angiosperm pollen grains are covered by a viscous material called pollenkitt, comprising saturated and unsaturated lipids, carotenoids, flavonoids, proteins, and carbohydrates (Piffanelli et al., 1998; Pacini and Hesse, 2005; Chichiriccò et al., 2019). The CCN properties of the submicron pollenkitt particles obtained from six different plant species were studied by Prisle et al. (2019). It was shown that some pollenkitt species are surface active and therefore decrease surface tension. The CCN-derived κ values were generally between 0.1 and 0.2. For all species studied, the maximum κ was observed at activation diameters ranging between 50–70 nm and steeply decreased above ∼70 nm. Prisle et al. (2019) suggested that this behavior reflects the impact of pollenkitt surface activity on CCN activation, which decreases with particle growth factor increasing.
To our knowledge, no hygroscopic properties of SPPs in subsaturated conditions have been presented in literature. Similar to other atmospheric aerosol particles, the hygroscopicity of SPPs influences their life cycle in the atmosphere as well as the related direct and indirect effects on radiation budget. In addition, SPP hygroscopicity is a key factor enhancing the allergenic potential of chemically modified pollen allergens, like proteins (Pöschl and Shiraiwa, 2015; Reinmuth-Selzle et al., 2017). It was documented that chemical modification of proteins by atmospheric nitrogen dioxide (NO2) and ozone (O3) proceeds efficiently at high RH within the particle bulk. The rate of the protein nitration and dimerization in the liquid phase occurred almost 1 order of magnitude faster in comparison to amorphous and semisolid SPP states (Reinmuth-Selzle et al., 2014; Liu et al., 2017).
In this study, we investigated the hygroscopic properties and CCN activity of birch, pine, and rapeseed SPPs for water saturation ratios between 0.02 and 1.012. These investigations were complemented with different chemical analyses of the subpollen components. A separate HHTDMA experiment was performed to evaluate the size-dependent restructuring of aerosol particles to correct their hygroscopic growth and CCN activity. We also conducted gravimetrical measurements coupled with dynamic light scattering, which allowed for estimating the effect of the colloid nanoparticles on the SPP hygroscopicity. Together with the experimental analysis, the κ-Köhler model was applied to reconcile the hygroscopicity and cloud condensation activity of subpollen particles.
2.1 Sample preparation
Pollen samples were collected from common genera belonging to deciduous, coniferous, and herbaceous plants. These species are birch pollen (Betula pendula), pine pollen (Pinus sylvestris), and rapeseed (Brassica napus), respectively. The aqueous pollen extracts were prepared by placing ∼200 mg of pollen grains in 100 mL Milli-Q water (2 mg mL−1). The solutions were then extracted for 40 min in an ultrasonic bath (frequency, 35 kHz; Bandelin, Sonorex Super 10P, Germany) in 1 min on/off intervals. The aqueous extracts were filtered through a 0.45 µm syringe filter device (25 mm GD/X, sterile, 6901–2504, GE Healthcare Life Science, Whatman). The resulting filtered solution was atomized and dried to generate particles for HHTDMA and CCN measurements. The same extraction protocol was used for chemical and gravimetric analysis. It is expected that the aqueous extracts contain both surface substances (Supplement Sect. S1) and cytoplasmic material released either due to osmotic shock and/or pollen rupture (Pummer et al., 2012; Steiner et al., 2015). As shown by Laurence (2011) the pollen degradation occurs more efficiently under sonification; therefore, we used an ultrasonic bath.
2.2 Gravimetric analysis
Hereinafter we consider that the total solid (TS) in the filtered solution is the sum of both the total dissolved species and total suspended solids (TSS) (hydrosols). The TS mass of subpollen species in the filtered solution was determined gravimetrically as follows. Aqueous pollen extracts were prepared as described in Sect. 2.1 with the exception that 100 mg of pollen grains were suspended in 50 mL Milli-Q water (2 mg mL−1). After filtration, the loaded syringe filter (25 mm, 0.45 µm) was first kept in a desiccator to gently remove liquid water, and then it was dried in vacuum for 24 h (residual pressure 1 hPa). The weighing for the gravimetric PM determination was done with a microbalance (0.01 mg sensitivity) at 25 ∘C and ∼30 % RH, and the filters and impaction substrates were equilibrated at these conditions for 24 h prior to weighing. The TS was then determined as the difference between the initial pollen mass and the mass captured by the syringe filter (Supplement Sect. S2, Table S1). The mass ratio (MR) of the penetrated material through the filter to initial mass was further used to calculate the mass fraction (wi) of chemical species: , where Ci is the mass concentration of species (i) in the filtered solution, and C0 is the initial mass concentration of pollen grains in water. To determine Ci of the water-soluble species, chemical analyses were performed as described below. The total mass concentration of suspended material was determined as .
2.3 Scanning electron microscopy (SEM)
The samples were investigated with a high-resolution scanning electron microscope (ZEISS Merlin). Operation conditions were 0.4 kV accelerating voltage, in-lens detector of secondary electrons (SE mode), and 3.6 mm working distance. Particle samples were collected directly onto 3 mm TEM copper 300-mesh grids and coated with a 30–60 nm thick Formvar film.
2.4 Chemical analysis
2.4.1 Materials
The following chemicals and materials were used in this study: ultra pure water from a GenPur™ UV-TOC/UFxCAD Plus water purification system (Thermo Scientific, Braunschweig, Germany), D−(+)-glucose (>99.5 %, catalog no. G8270, Sigma-Aldrich, USA), phenol (>99 %, catalog 33517, Sigma-Aldrich, USA), sulfuric acid (98 %, catalog no. 1120801000, Merck, Darmstadt, Germany), Qubit® assay tubes (clear 0.5 mL PCR tubes, Q32856, Thermo Scientific, Braunschweig, Germany), Qubit™ protein assay kit (Q33211, 0.25–5 µg, Invitrogen, Thermo Fisher Scientific, Braunschweig, Germany), Qubit™ dsDNA HS assay kit (Q32854, 0.2–100 ng, Invitrogen, Thermo Fisher Scientific, Braunschweig, Germany), protein LoBind tubes (100 safe-lock tubes, PCR clean, 0030108132, Eppendorf, Hamburg, Germany), and starch assay kit (SA20, Sigma-Aldrich, USA).
2.4.2 Carbohydrate analysis
According to the protocol by Masuko et al. (2005) D−(+)-glucose standard solutions were prepared in pure water at different concentrations (50, 250, 500, 1000, 2000, 3000 µM). The 2.5 % () phenol solution was prepared (0.25 g phenol in 5 mL pure water. A volume of 50 µL of the standard solution and of each sample was added to the 96-well plate in triplicate. Immediately, 30 µL of the phenol solution was added, and the well plate was incubated for 5 min at 90 ∘C in a drying oven (Binder, Tuttlingen, Germany). After cooling down to room temperature, the samples were measured at a wavelength of 490 nm using a microplate reader (Multiscan GO, Thermo Scientific, Braunschweig, Germany).
2.4.3 Starch analysis
Water-extractable starch
The assay was done according to the manufacture's protocol (starch assay kit, Sigma-Aldrich). Briefly, 1 mL of each of the TS was added to 1 mL of the starch assay reagent containing 50 units mL−1 of amyloglucosidase, which is an enzyme catalyzing the hydrolysis of starch to glucose. In the second step, the mixture is added to the glucose assay reagent containing 1.5 mM nicotinamide adenine dinucleotide (NAD), 1.0 mM adenosine triphosphate (ATP), 1.0 units mL−1 of hexokinase, and 1.0 units mL−1 of glucose-6-phosphate dehydrogenase (G6PDH). The reaction of the assay involves the following steps:
The increase in NADH (reduced form of NAD) and thus in the absorbance at 340 nm is directly proportional to the final glucose concentration.
Total starch (resistant starch, extraction with DMSO)
The solid pollen samples were prepared as follows: 50 µg samples of rapeseed, birch, and pine pollen grains were dissolved in 10 mL dimethyl sulfoxide (DMSO) (1742589, Fisher Scientific) and 2.5 mL 8 M hydrochloric acid and were incubated for 30 min at 60 ∘C in an oven. After cooling down to room temperature, 25 mL of pure water was added, and the pH was adjusted to approximately 5 with 5 N sodium hydroxide solution. The samples were then treated as the water-extracted samples described above, and the starch content was determined by the starch assay kit.
2.4.4 Protein analysis
The protein concentration of the birch, pine, and rapeseed pollen extracts was determined using a Qubit® protein assay kit according to the manufacturer's instruction (Thermo Fisher Scientific, Braunschweig, Germany). Briefly, 10 µL aliquots of standard and samples were diluted in Qubit® buffer to a final assay volume of 200 µL. After vortexing the tubes for 2–3 s and incubation for 15 min at room temperature, the tubes were inserted into the Qubit® 3.0 fluorometer (Invitrogen, Thermo Fisher Scientific, Braunschweig Germany), and the samples and standards were measured in triplicate.
2.4.5 DNA analysis
The DNA concentration of aqueous pollen extracts was determined according to the manufacturer's instruction of the Qubit® dsDNA HS assay kit (Q32854, 0.2–100 ng, Invitrogen, Thermo Fisher Scientific, Braunschweig, Germany).
2.4.6 Ion analysis
The capillary electrophoresis system “CAPEL-105/105M” (Lumex) is equipped with a variable UV spectrophotometric detector, with a wavelength range of 190–400 nm. The specialized software “Elforan” (Lumex, Russia) was used for instrument control and data acquisition. Fused-silica capillaries were used, with an external polyimide coating (Polymicro Technologies, Phoenix, AZ, USA), 50 µm i.d., 360 µm o.d., effective length of 50 cm, and total length of 60 cm. Hydrodynamic sample injection was performed: 30 mbar × 50 s.
2.5 Size-resolved cloud condensation nuclei (CCN) measurements
A detailed description of the operation of the CCN counter (CCNC) and the subsequent data analysis can be found in Pöhlker et al. (2016), which is the basis for the CCN part of this study. Briefly, size-resolved CCN measurements were conducted using a continuous-flow streamwise thermal-gradient CCN counter (model CCN-200, DMT, USA) coupled to a differential mobility analyzer (DMA) (model 3081, TSI, DMA) and a condensation particle counter (CPC) (model 3772, TSI, USA). The CCNC was operated at a total flow rate of 0.5 L min−1 with a sheath-to-aerosol flow ratio of 10. The water vapor supersaturation (S) was regulated by the temperature difference of the CCNC flow column (ΔT) and calibrated using ammonium sulfate aerosol and activity parameterization Köhler model (AP3) as described in Rose et al. (2008). Based on the calibration procedure, the overall uncertainty of S is estimated to be ∼7 %. For each CCN measurement cycle, S is set to 10 different values ranging from 0.18 % to 1.24 %. At each diameter selected by the DMA (Db), the number concentration of total aerosol particles (condensation nuclei, CN), NCN, was measured with the CPC, and the number concentration of CCN, NCCN, was measured with the CCNC. The measured CCN activated fractions () were corrected for multiply charged particles and fitted with a cumulative Gaussian distribution function as described in Pöhlker et al. (2016):
where “erf” is the error function, a is half the maximum value of , Db,a is the dry particle diameter at , and σa is the standard deviation of the cumulative distribution function (CDF). The CCN activation curves were also corrected for differences in counting efficiencies of the CCNC and the CPC (Rose et al., 2010). The following best-fit parameters were determined for each supersaturation: the maximum activated fraction, MAFF=2a; the midpoint activation diameter, Db,a; and the CDF standard deviation, σa. The MAFF typically equals unity, except for an external mixture of CCN-active with CCN-inactive particles, whereby the difference in CCN activity is due to chemical composition and hygroscopicity. And σa serves as an indicator for the extent of heterogeneity of a particle's composition. Calibration aerosols composed of high-purity ammonium sulfate exhibit small non-zero σa values that correspond to ∼3 % of Db,a and can be attributed to heterogeneities of the water vapor supersaturation profile in the CCNC or other non-idealities such as DMA transfer function and particle shape effects (Rose et al., 2008). Thus, normalized CDF standard deviations or “heterogeneity parameter” values of of ∼3 % indicate internally mixed CCN, whereas higher values indicate external mixtures of particles with varying chemical composition and hygroscopicity (Rose et al., 2008, 2010).
2.6 HHTDMA setup and modes of operation
The hygroscopic properties of the subpollen particles were measured in the 2 %–99.5 % RH range with a high-humidity tandem differential mobility analyzer (HHTDMA) described elsewhere (Mikhailov and Vlasenko, 2020). Briefly, two separate atomizers (model 3076, TSI, USA) were used for aerosol particle generation: the first of them to study aerosol hygroscopic properties and second for RH determination using ammonium sulfate particle growth factors (Supplement Sect. S3, Fig. S2). The generated aerosol solution droplets were dried to a relative humidity of ∼3 % in a Nafion MD-700 dryer (L=60 cm; residence time RT =27 s) and then in a silica gel diffusion dryer (SDD, RT =63 s) to the residual relative humidity of ∼2 % RH. The dry aerosol was passed through a bipolar charger (85Kr) and a differential mobility analyzer (DMA1) (model 3081, TSI, USA) to select monodisperse particles. This near monodisperse aerosol was then humidified, and the resulting particle size after humidification was measured with the scanning mobility particle sizer (DMA2) (SMPS, model 3080, CPC 3772, AIM version 9.0.0.0, 11 November 2010, all TSI, USA). The measured particle size distributions were fitted with a lognormal distribution function (Origin 9 software), and the median diameter (Db) of the fit function was used for further data analysis. Throughout the whole relative humidity range, the absolute RH uncertainty is less than 0.5 %, and the relative growth factor uncertainty due to RH and instrumental errors does not exceed 1 % (Fig. S3). Three operation modes are available using this HHTDMA instrument: hydration and dehydration (H&D) also called restructuring mode, hydration, and dehydration. These modes correspond to different sequences of humidification and drying (“RH histories”) of aerosol particles, as outlined in Table S2 (Supplement Sect. S3). The H&D mode was used to specify the optimal RH range in which initial irregular particles transform into compact globules. Upon hygroscopic growth, the H&D mode was in situ coupled with a conventional hydration or dehydration mode. The mobility-equivalent particle growth factor, gb, was calculated as the ratio of the mobility-equivalent diameter, Db, measured after conditioning (hydration, dehydration) to the minimum mobility diameter, , observed in the H&D mode:
Further details on the HHTDMA operation are provided in Supplement Sect. S3.
2.7 Hydrodynamic size distribution of colloidal bioparticles
Aqueous extracts of pollen grains used for aerosol particle generation contain both water-soluble and water-insoluble material. Insoluble material mainly presents in the form of colloidal particles. The presence of colloids in the size-selected particles can affect their hygroscopic properties. To evaluate this effect, we measured the hydrodynamic size distribution of colloidal bioparticles using a dynamic light scattering (DLS) system (model SZ-100, Horiba, Ltd.). Measurement parameters were as follows: a laser wavelength of 532 nm (10 mW), a scattering angle of 90∘, a measurement temperature of 25 ∘C, a medium viscosity of 0.896 mPa s, a medium refractive index of 1.333, and material refractive index of 1.400. The size distribution of nano-bioparticles was determined in a filtered solution (1 mL) with the same concentration of pollen species as used for dry particle generation (Sect. 2.1). The samples were loaded into quartz microcuvettes, and 7–10 measurements were performed, for which average and standard deviation values were calculated. The obtained DLS-based size distributions were converted into number particle size distributions as described in Supplement Sect. S4.
2.8 Aerosol particle shapes
Inorganic and organic aerosol particles as well as their mixtures restructure upon humidification below its deliquescence. Irregular envelope shape and porous structure can cause a discrepancy between the mobility-equivalent and mass-equivalent particle diameters that usually limit precision of mobility-diameter-based hygroscopicity tandem differential mobility analyzer (HTDMA) and CCNC experiments (Mikhailov et al., 2004, 2009, 2020; Biskos et al., 2006; Gysel et al., 2004; Rose et al., 2008). To account for restructuring, we used the minimum mobility particle diameter, , obtained in H&D HHTDMA mode as an approximation of mass-equivalent diameter of the dry solute particle, Ds (i.e., ). Based on H&D measurements, the dynamic shape factor, χ, of the dry initial particles can be estimated as follows (DeCarlo et al., 2004):
where Db,i is the initial mobility-equivalent diameter selected by DMA1 and measured by DMA2, and ) and C(Db,i) are the Cunningham slip correction factors for the respective diameters and Db,i. Shape factor χ can be split into a component β which describes the shape of the particle envelope and a component δ which is related to the particle porosity and allows for the calculation of the void fraction inside the particle envelope f (Brockmann and Rader, 1990):
2.9 κ-Köhler model and effective hygroscopicity parameters
Both HTDMA and CCN data were fitted by the Köhler model introduced by Petters and Kreidenweis (2007) (denoted P&K hereafter) to obtain an effective hygroscopicity parameter, κ, which is a measure of the amount of water bound per unit volume of dry solute. The saturation ratio, s, over an aqueous solution droplet is expressed in both sub- and supersaturated regimes by the κ-Köhler model:
where aw is the water activity; Ke is the Kelvin term; Ds is the mass-equivalent diameter of the dry solute particle; Dwet is the diameter of the solution droplet; σw is the solution surface tension for pure water (72 mN m−1), which is used here to produce a self-consistent data set as suggested in P&K; Mw is the molecular weight of water; ρw is the density of water; R is the universal gas constant, and T is the temperature. The hygroscopicity, κb,a, from the CCN data set was obtained by inserting the CCN-derived dry activation diameter Db,a for Ds and varying both κ and Dwet until the saturation ratio, s= RH 100 %, was equivalent at the same time to the prescribed supersaturation, %, and to the maximum of a Köhler model curve of CCN activation. The same procedure was used to calculate the corrected hygroscopicity κa due to the irregular shape of the initial dry particles (Sect. 3.3; Eq. 11). In this case, the restructured diameter, Da, was inserted for Ds. Combining water activity, aw, from Eqs. (6) and (2) gives
where κb refers to the HHTDMA-measured hygroscopicity κ. The uncertainty for κa and κb was calculated as propagated error (Supplement Sect. S5). To convert the measured RH-based growth curves (gb vs. RH) into activity-based curves (gb vs. aw), we divided the RH values through the Kelvin term of Eq. (6) by assuming that σ is equal to the surface tension of pure water (72 mN m−1).
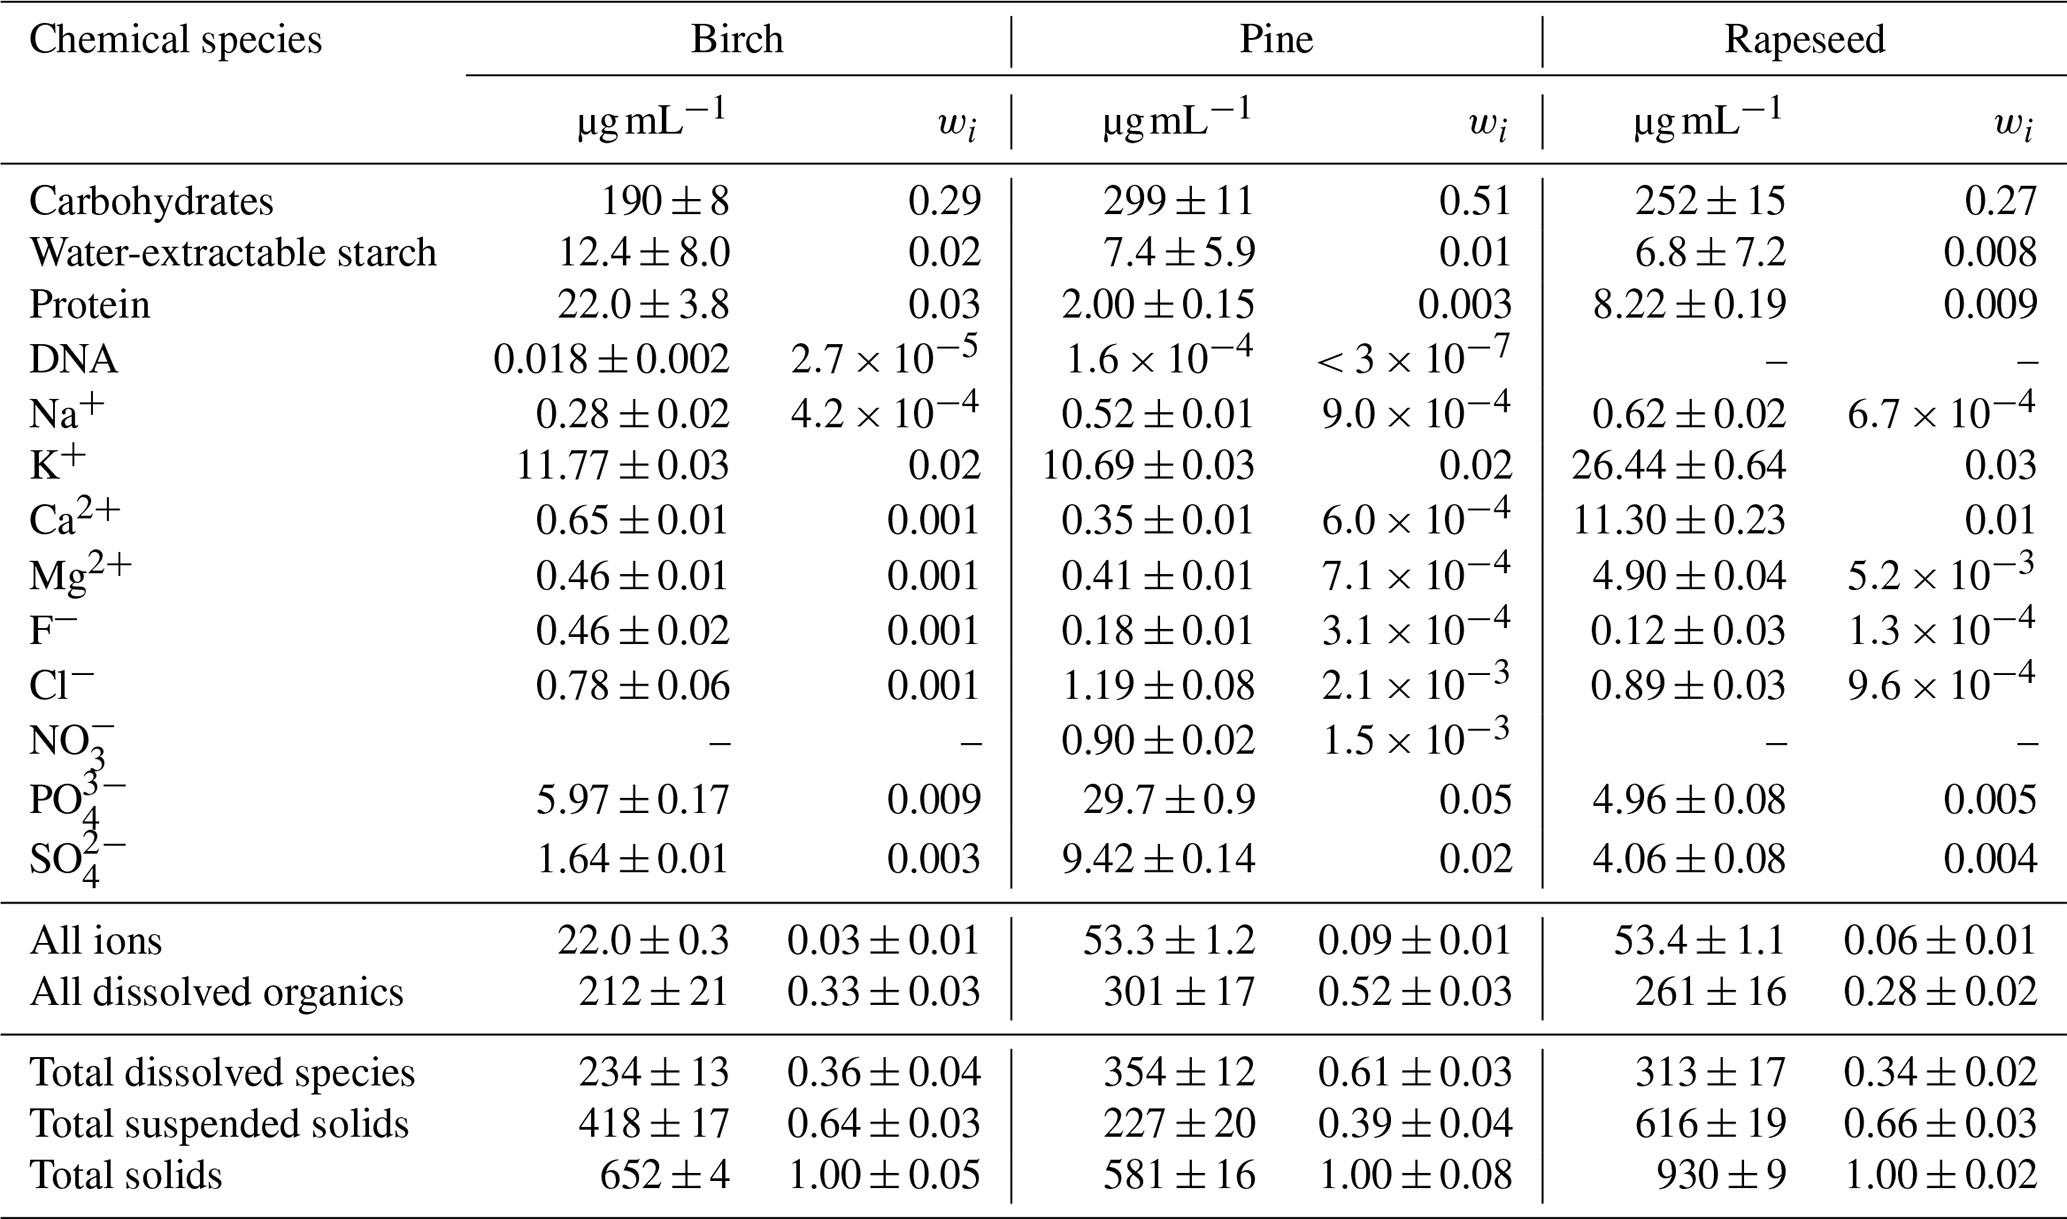
Table 1Concentration (µg mL−1) and mass fraction (wi) of chemical species (i) in the filtered solution of pollen grains. Total solids is the sum of the total dissolved species and total suspended solids. wi is the ratio of the amount of selected species to the mass of total solids containing 1 mL of water.
As proposed by Kreidenweis et al. (2005), hygroscopic growth curves can be approximately described with a polynomial three-parameter fit function of the following form:
where adjustable parameters k1, k2, and k3 capture non-ideality, caused by mixing between water and solutes. From Eqs. (7) and (8) the dependence of κb on aw can be described by

Figure 1Mass fraction of dissolved and suspended species in the filtered solution of pollen grains.
3.1 Chemical composition of pollen species
Bulk chemical analysis results of water-extractable compounds are summarized in Table 1 and illustrated in Fig. 1. Their mass fraction, wi was determined as described in Sect. 2.2. According to the chemical and gravimetrical analyses, the fraction of the total dissolved species varies from ∼35 wt % (pine and rapeseed samples) to ∼61 wt % (birch sample). Among them the major components are carbohydrates (i.e., ∼28 wt % for birch and rapeseed and 51 wt % for pine pollen solution) followed by inorganic ions (<10 wt %). The most common soluble carbohydrates in pollen grains are monosaccharides (glucose, fructose) and disaccharides (sucrose, maltose). Other soluble carbohydrates such as raffinose, stachyose, rhamnose, and arabinose can persist in a lesser amount (Stanley and Linskens, 1974). Water-extractable starch in the filtered solution is 2 wt %, 1 wt %, and 0.8 wt % for birch, pine, and rapeseed solutions, respectively (Table 1). However, extractable starch contains only a minor part of resistant starch measured in pollen grains as described in Sect. 2.4.3. The mass ratios of water-extractable to resistant starch are ∼9 % (birch), ∼3 % (pine), and ∼7 % (rapeseed) by weight (not shown in Table 1). Protein is the second most abundant organic component after carbohydrates. Its content in the filtered extracts varies from ∼0.3 wt % (pine pollen) to ∼3 wt % (birch pollen). DNA in negligible quantities was detected in birch and pine aqueous extracts. Phosphorus ions in the form of PO and K+ are the dominant inorganic ions and account for ∼3 wt % of the extractable material. All filtered pollen extracts contain a small amount of SO ion varying from 0.3 wt % (birch pollen extract) to 2 wt % (pine pollen extract). Calcium and magnesium are also present in the filtered pollen solutions. Their highest total value of ∼1 wt % was found in the rapeseed sample (Table 1). Other ions such as Na+, F−, Cl−, and NO were found in small amounts. Their total mass ratio does not exceed 0.3 wt %. The biological role of the above chemical species during pollen grain development and maturation is considered elsewhere (Baker and Baker, 1979; Pacini et al., 1999; Roulston et al., 2000; Stanley and Linskens, 1974). Based on the chemical analysis results, it is reasonable to assume that water-soluble sugars, proteins, and inorganic ions are the main components causing water uptake by subpollen particles. Table 1 shows that the mass ratio of water-insoluble compounds in the filtered solutions is significant with amounts up to 39 wt %, 64 wt %, and 66 wt % for pine, birch, and rapeseed extracts, respectively. These suspended particles (hydrosols or colloids) can comprise cross-linked sporopollenin, callose, carotenoids, cellulose, starch, and sterols in various proportions (Pacini and Hesse, 2005; Stanley and Linskens, 1974). We consider this fraction of pollen species as an inert material that suppresses hygroscopic growth and CCN activity of subpollen particles, as discussed below.
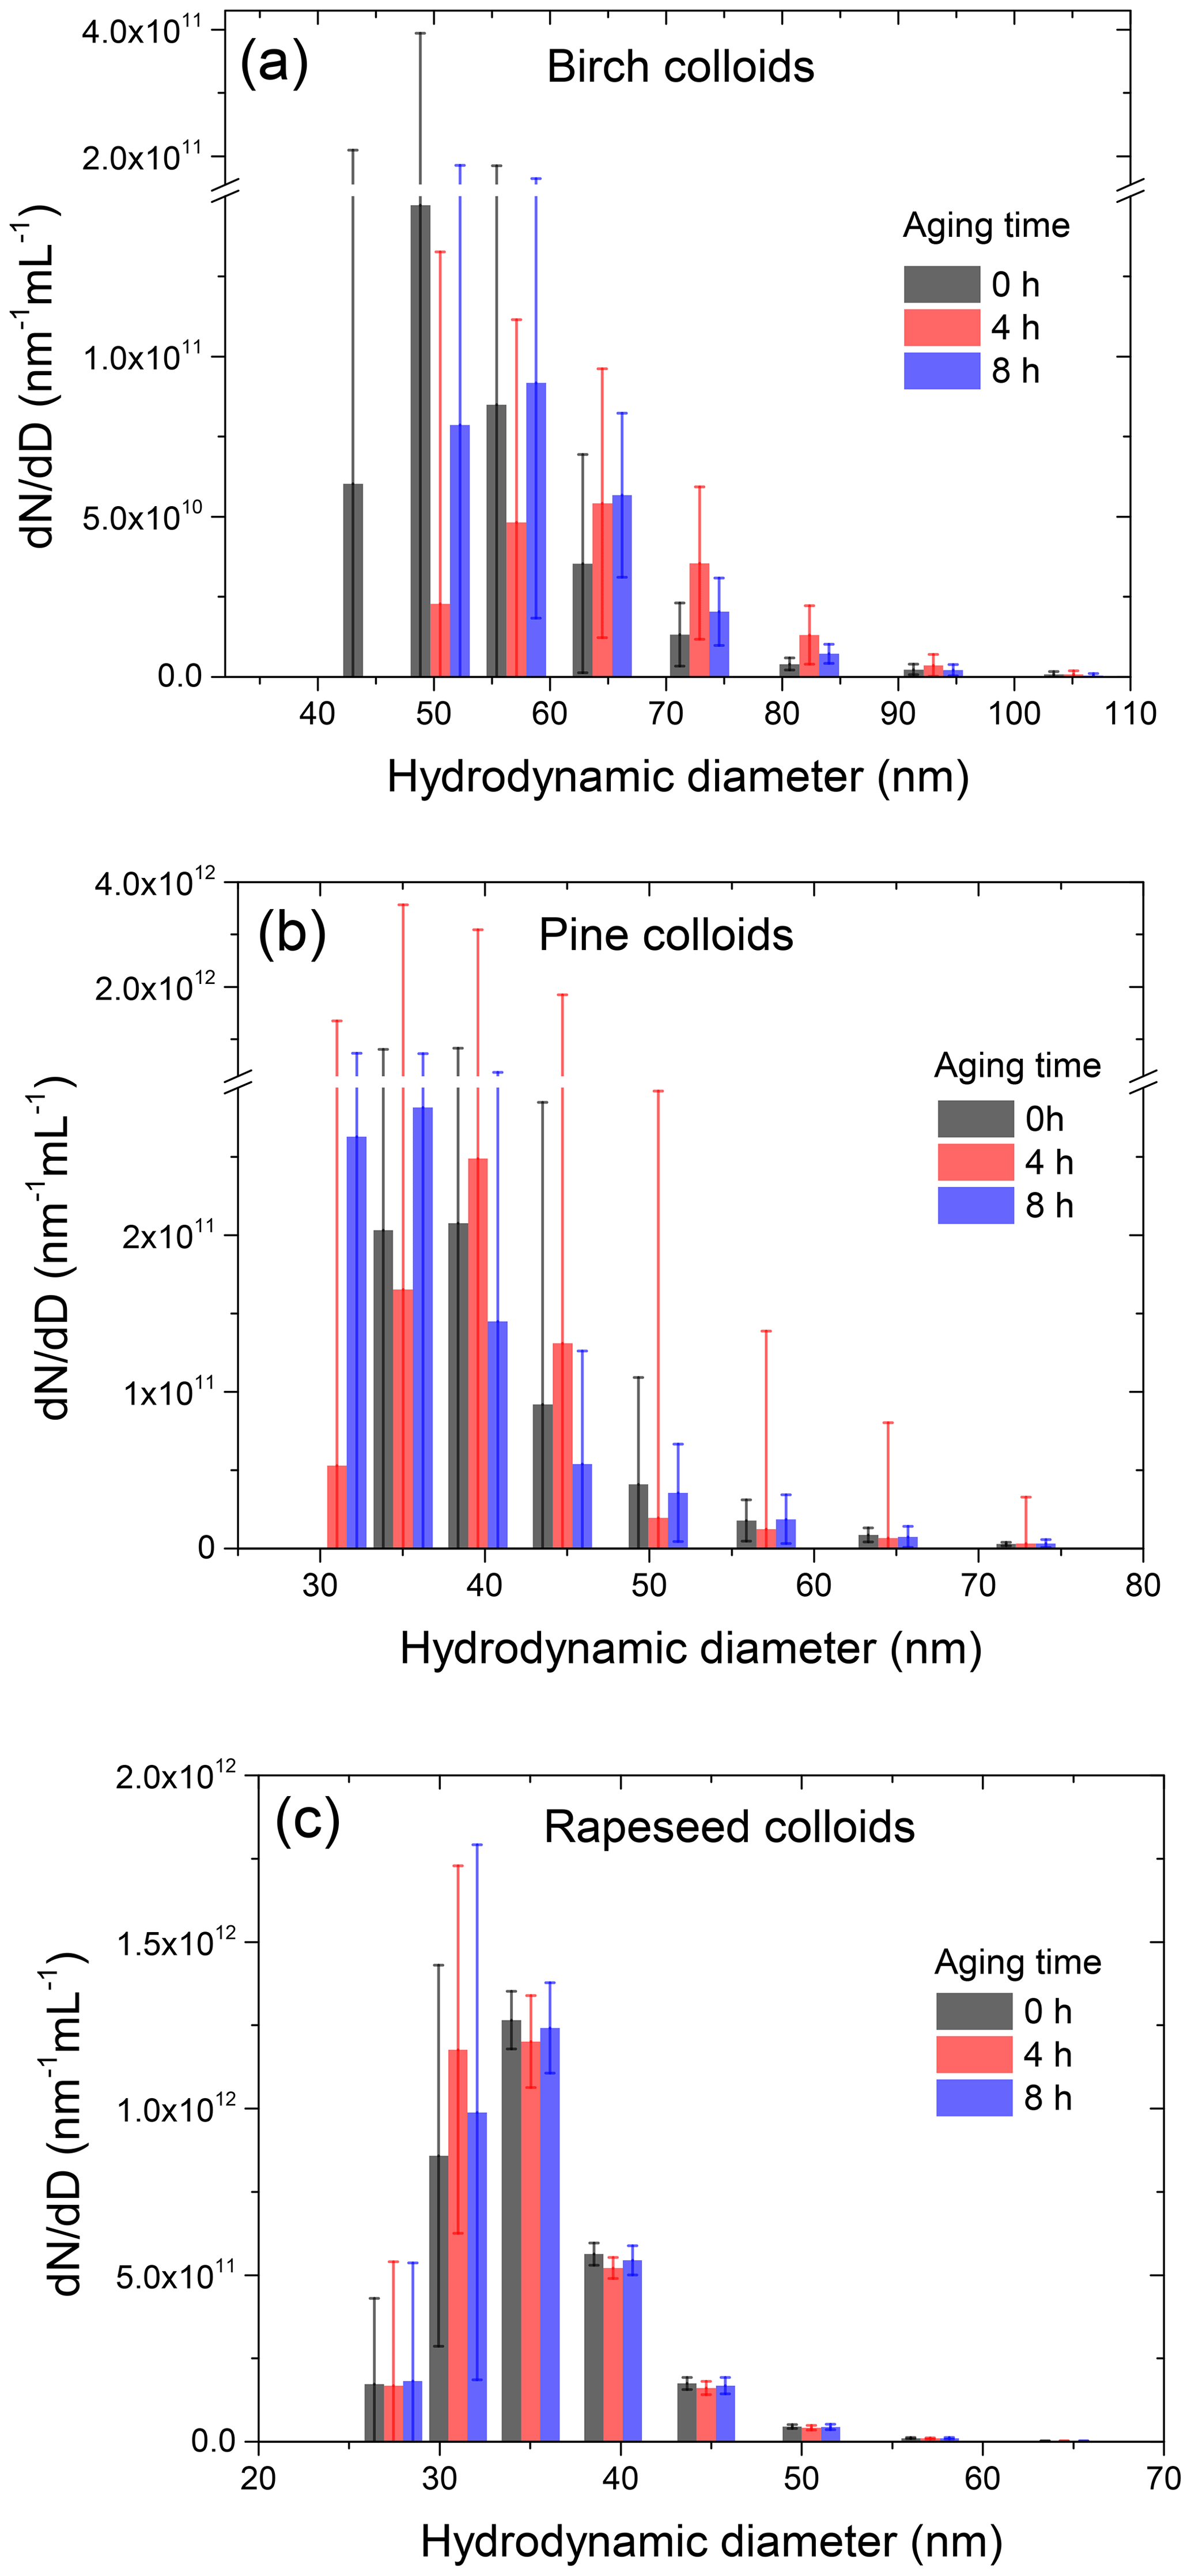
Figure 2Colloidal particle number size distributions of aqueous extracts of birch (a), pine (b), and rapeseed (d) pollen grains: initial (0 h) and after 4 and 8 h aging.
3.2 Hydrodynamic size distribution of hydrosols
As shown in Sect. 3.1 the mass fraction of suspended particles in the nebulized solution is significant (39 wt %–66 wt %). Together with concentration, the effect of such hydrosols on the hygroscopicity of the DMA-selected particles is highly dependent on their size range. Figure 2 shows the hydrodynamic size distribution of colloidal bioparticles determined by a DLS system using the conversion algorithm described in Supplement Sect. S4. The obtained results clearly show that the size of colloidal particles spans the range of 40–110 nm, which is within the SPP size range of dry particles (20–190 nm) used for CCN and HHTDMA measurements. It follows that the studied subpollen particles are an internal mixture of water-soluble and water-insoluble (suspended) compounds in different proportions. Besides, colloidal particles tend to coagulate, forming aggregates. This aging process can lead to a different composition of the size-selected dry particles during the HHTDMA or CCN experiments.
A simple time-dependent turbidity test with an aqueous birch pollen extract demonstrates that this effect becomes noticeable only after 10 h of aging (Supplement Sect. S6, Fig. S5). The experiment with dynamic light scattering provides a similar result. Figure 2 shows that, for a typical timescale of CCN (∼4 h) and HHTDMA (∼8 h) measurements, the size distributions of birch, pine, and rapeseed colloids remain constant within the uncertainty range, indicating that coagulation of suspended particle is small and therefore does not lead to a noticeable change in the size-selected dry particle's composition in the specified time periods.
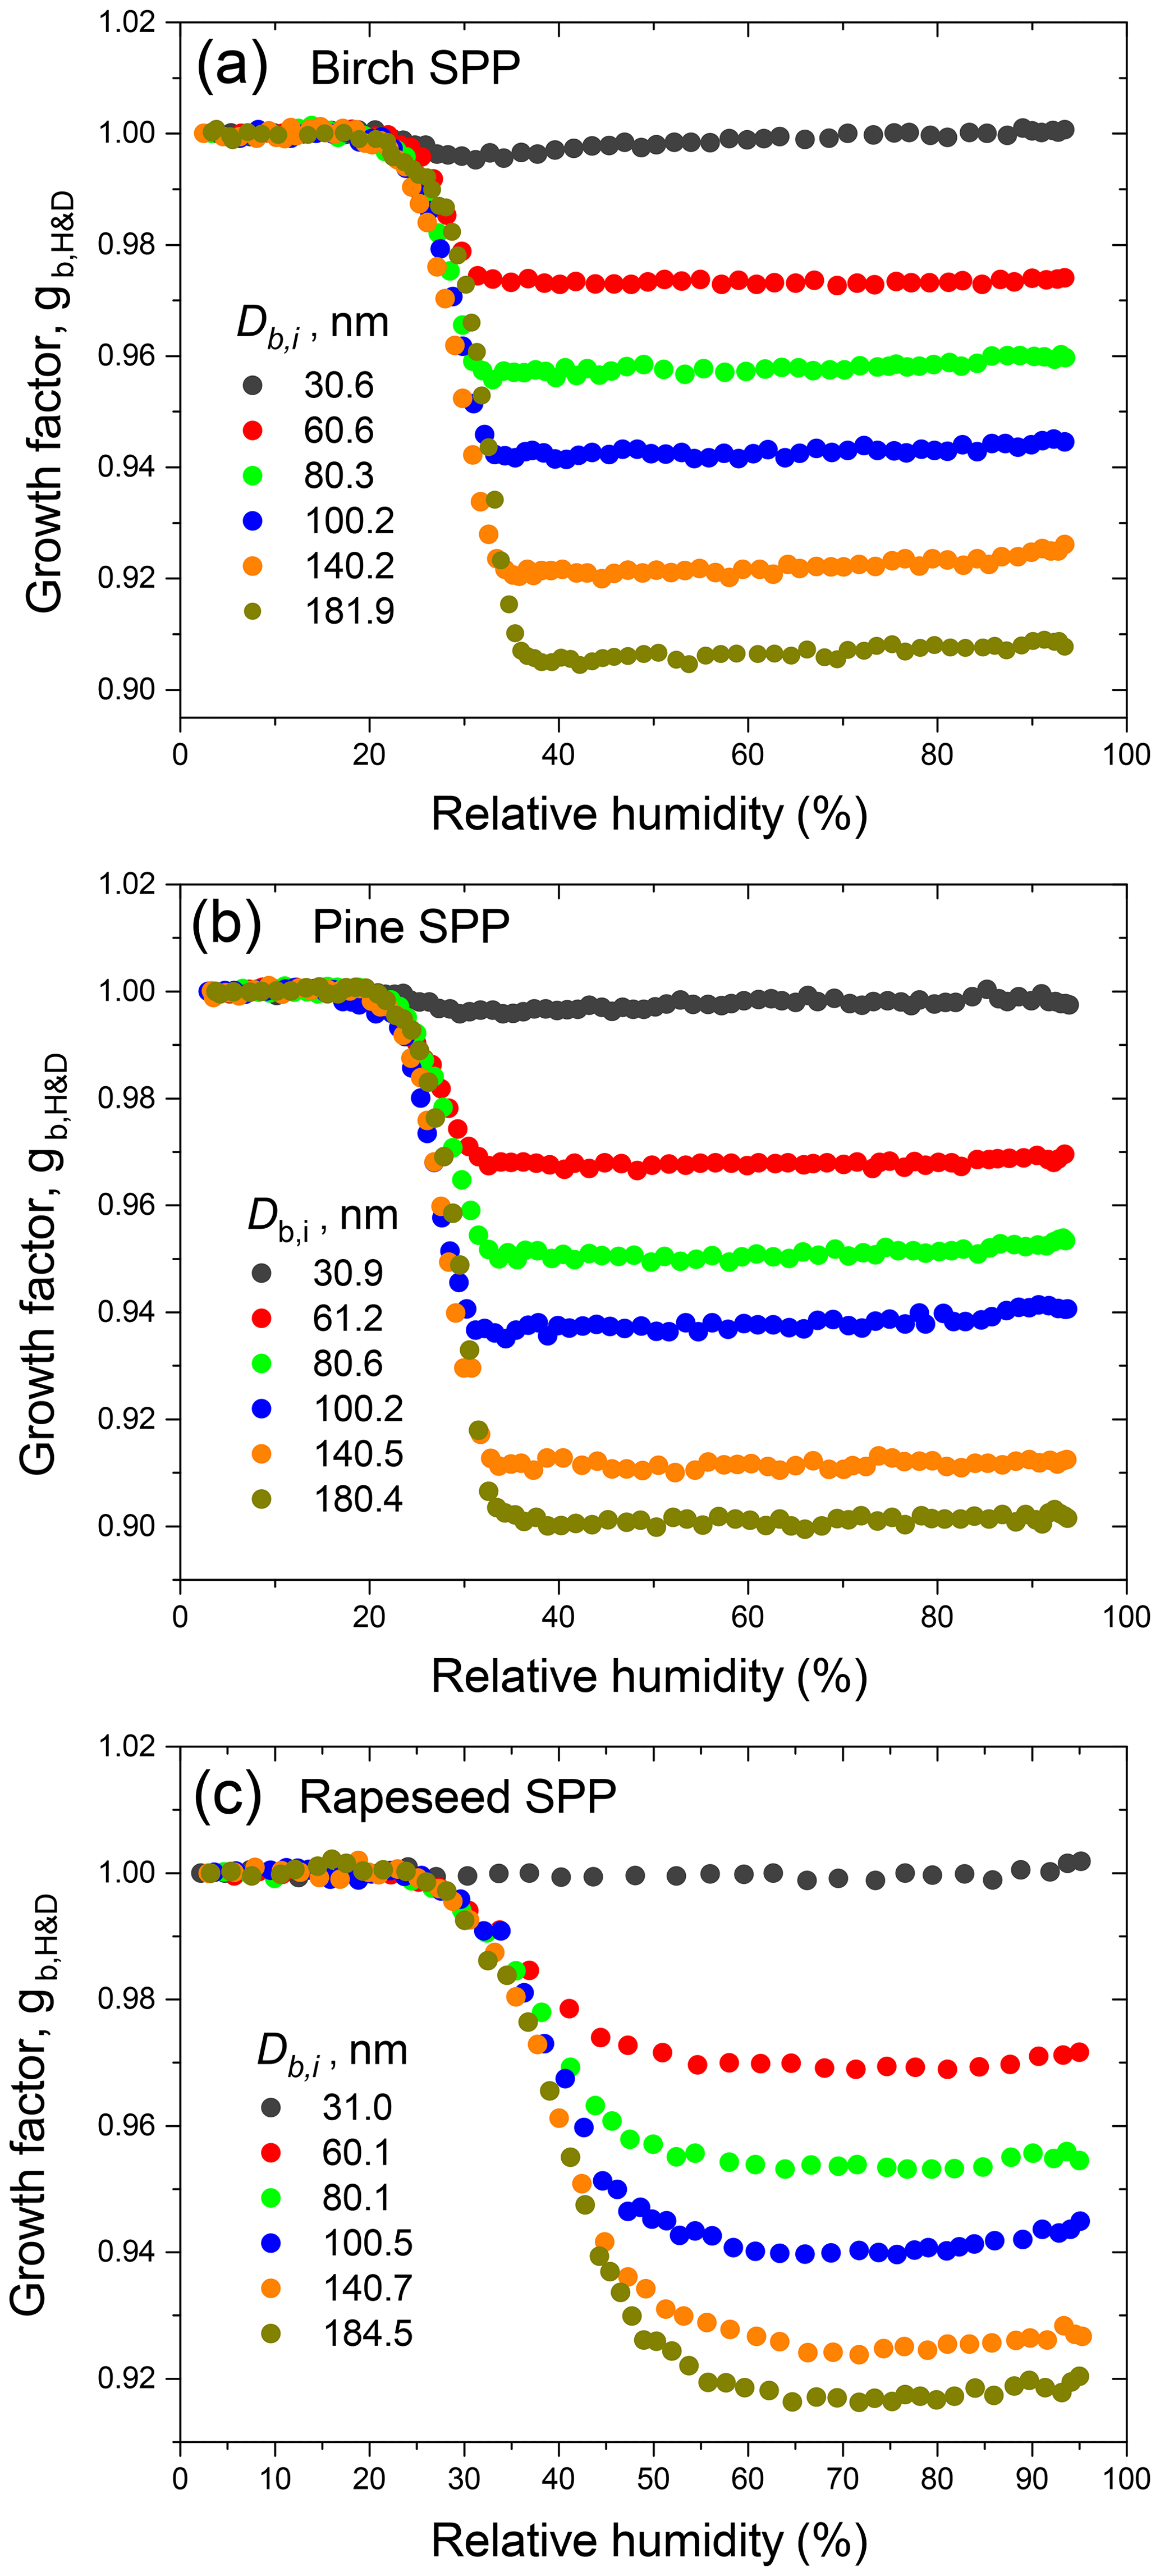
Figure 3Growth factors (gb,H&D) of birch (a), pine (b), and rapeseed (c) SPPs as a function of relative humidity observed for different initial mobility diameters (Db,i) in hydration and dehydration (H&D) HHTDMA experiments.
3.3 Particle restructuring
The H&D HHTDMA operation mode was first used to study the size-dependent aerosol particle restructuring (–180 nm). The dried aerosol particles selected by DMA1 entered the preconditioning section (Fig. S2, dashed rectangle) and underwent microstructural transformation, acquiring a more compact and nearly spherical microstructure during a cycle of humidification (H1, RT = 0.5 s) and drying (Nafion MD-700, RT = 27 s; SDD, RT = 16 s) (Mikhailov et al., 2004, 2009). The particle growth factor obtained during the H&D experiment was calculated as follows: , where Db,RH is the mobility particle diameter measured at RH = RH2 (Table S2).
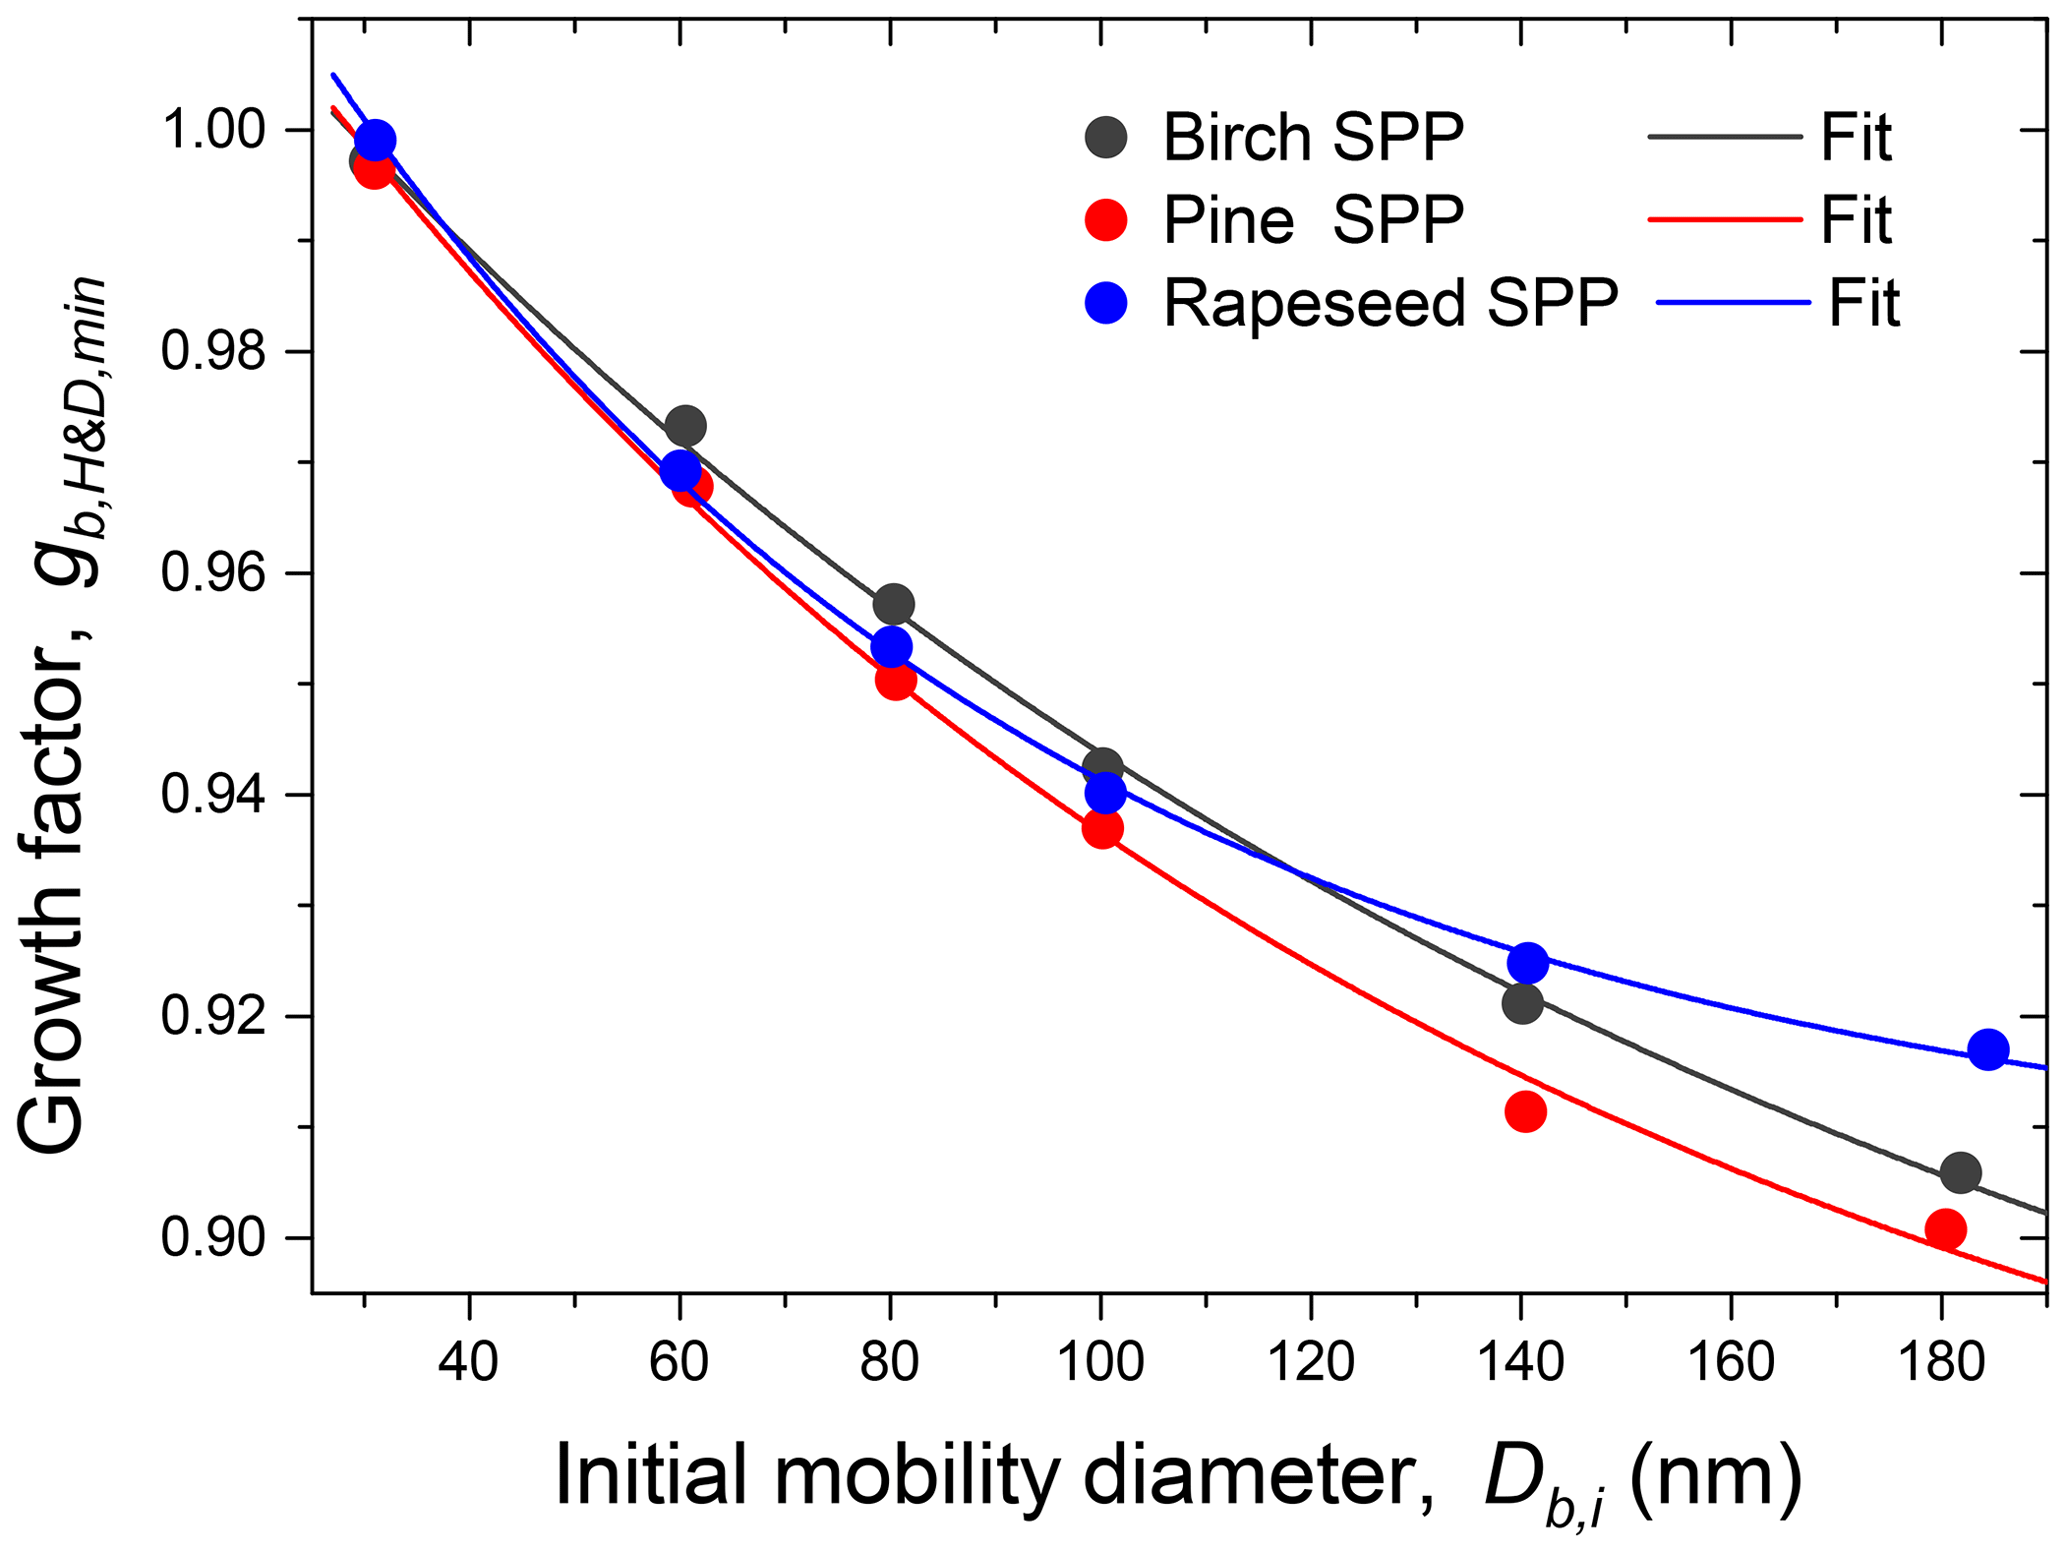
Figure 4Minimum mobility growth factors () of birch, pine, and rapeseed subpollen particles as a function of initial mobility diameter (Db,i). The lines are the exponential fit functions with the best-fitting parameters listed in Table S3.
Figure 3 illustrates the measurement of the subpollen particle growth factors in H&D mode. All species exhibit restructuring; i.e., the growth factors decrease with increasing RH, wherein this effect is strongest for largest diameters. It is also seen that for birch and pine SPPs the gH&D,min is already reached at ∼35 % RH, while for rapeseed SPPs the gH&D,min values are observed at higher humidity starting from ∼65 % RH (excluding particles with nm). The size-dependent RHH&D,min intervals used for gH&D,min averaging are shown in Table 2. The RHH&D,min range for ∼100 nm particles was further employed in HHTDMA hydration and dehydration experiments to convert in situ irregular initial particles into compact globules. Figure 4 shows the growth factors, gH&D,min, obtained over the Db,i range of 30–180 nm together with an exponential fitting curve,
where η, ϕ, and τ are the best-fit parameters listed in Table S3. The fit values of gH&D,min are further used for particle shape correction of initial dry activation diameters, Db,a, determined in size-resolved CCN experiments:
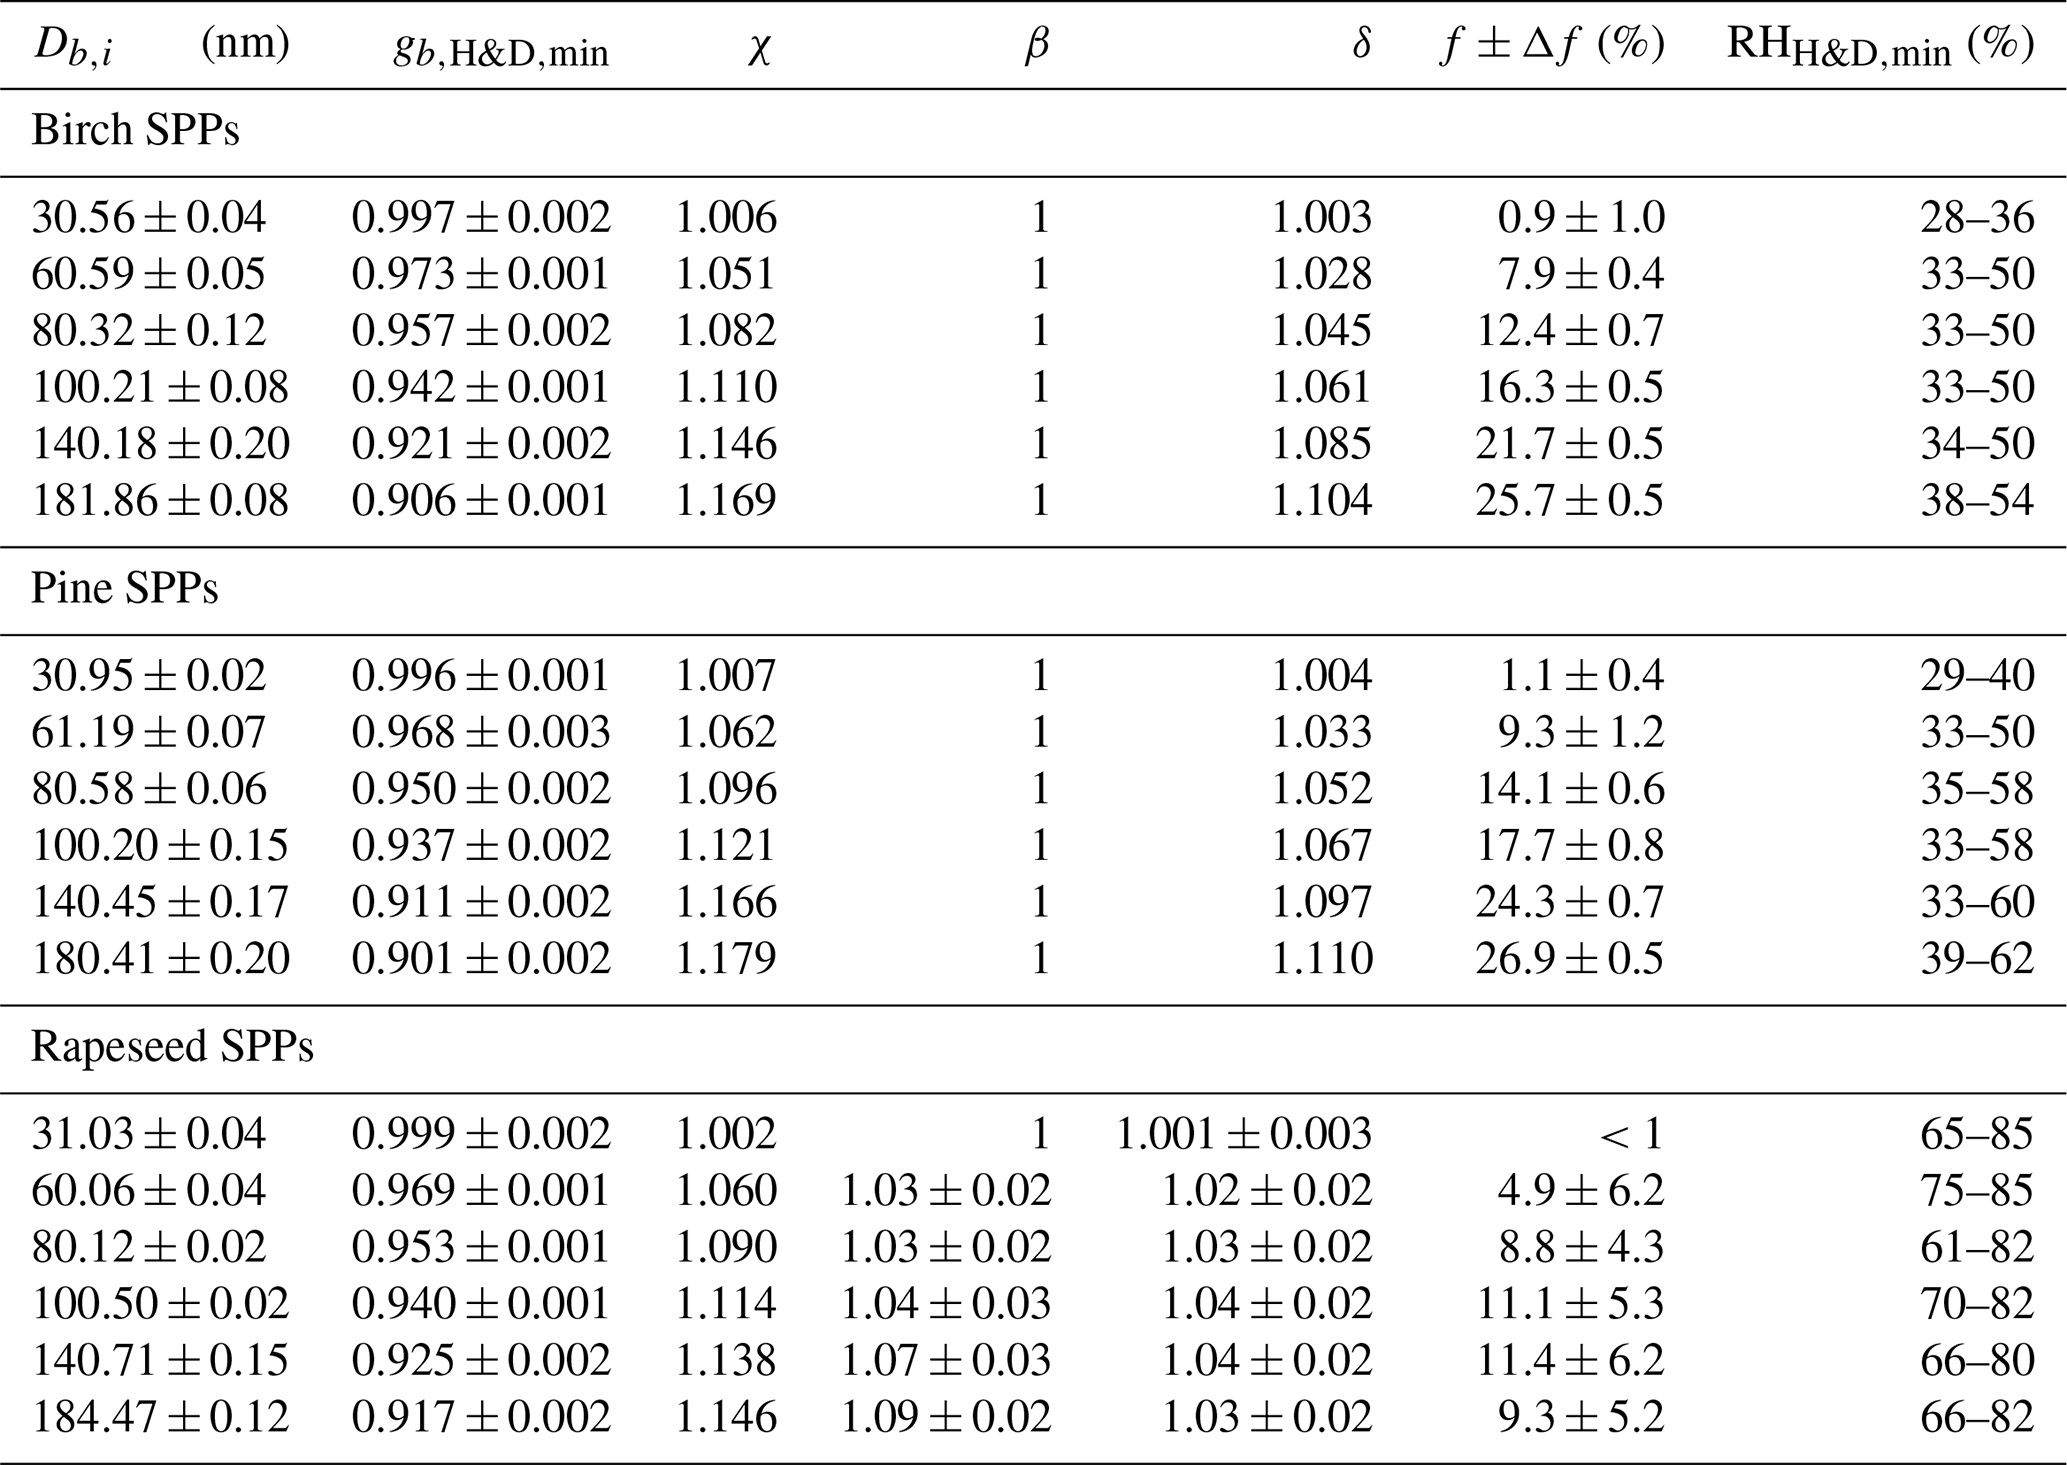
Table 2The size-dependent microstructural rearrangement parameters of subpollen particles (SPPs) obtained in the H&D experiment. Db,i and are mean (±2 SD) initial mobility diameter and minimum mobility growth factor, respectively. The dynamic shape factor (χ), porosity (δ), and void fraction (f) together with propagated error (Δf) are calculated from Eqs. (3), (4), and (5), respectively. For birch, pine, and ∼30 nm rapeseed SPPs, the particle shape envelope (β) is set to 1; for rapeseed SPPs at nm, the β values were obtained as described in Supplement Sect. S8. is the relative humidity at which the minimum mobility growth factors were observed.
3.4 Dry particle morphology
Using Eq. (3) and assuming that obtained in H&D mode is equal to Ds, we calculated the size-dependent dynamic shape factor of the SPPs, χ (Table 2). Scanning electron microscopy (SEM) images of the initial birch and pine SPPs show a spherical shape (Fig. 5a and b); therefore, one can accept that β=1. Using Eqs. (4) and (5) we estimated the porosity (δ) and void fraction (f) of birch and pine SPPs depending on their size (Table 2).
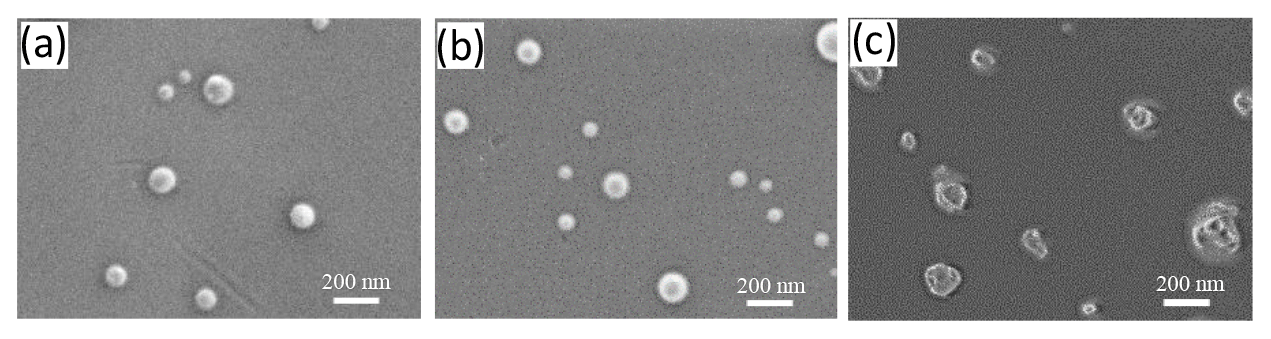
The obtained results indicate that despite the spherical shape the initial dry particles have a porous structure, wherein the void fraction gradually increases with their size, reaching ∼26 % for particles of ∼180 nm. Figure 5c shows that in contrast to birch and pine SPPs the external morphology of rapeseed particles is not spherical. To estimate the envelope component β of rapeseed SPPs, we used Eq. (S8), approximating their shape by a prolate ellipsoid as described in Supplement Sect. S8. The resulting microstructural parameters of rapeseed SPPs are listed in Table 2. Note that δ and f values obtained in this way are their upper estimate, since it is assumed that all particles are oriented in both DMA instruments to its flow by maximal axis. In addition, due to technical limitation of SEM for 30 nm particles, β was set to 1. Even with these assumptions, the void fraction in rapeseed particles is on average 2-fold less than that for birch and pine particles (Table 2). According to chemical analyses (Table 1), rapeseed extracts contain the highest amount of calcium (∼11 µg mL−1) and undissolved species (∼620 µg mL−1). Since calcium is mainly present in the walls of the pollen grains, it is reasonable to assume that the irregular morphology of rapeseed SPPs (Fig. 5c) is due to the predominant aggregation of exine and intine species such as cross-linked sporopollenin and cellulose (Stanley and Linskens, 1974).
3.5 CCN properties
The average parameters derived from CCN activation curves as a result of three repeated measurements for each sample are summarized in Table 3. Figure 6 shows the maximum activation fraction (MAFF) (panel a) and normalized standard deviations () (panel b) against the corresponding midpoint activation diameters (Db,a) and supersaturation (S %) obtained in a series of three CCN measurements for each type of SPP.
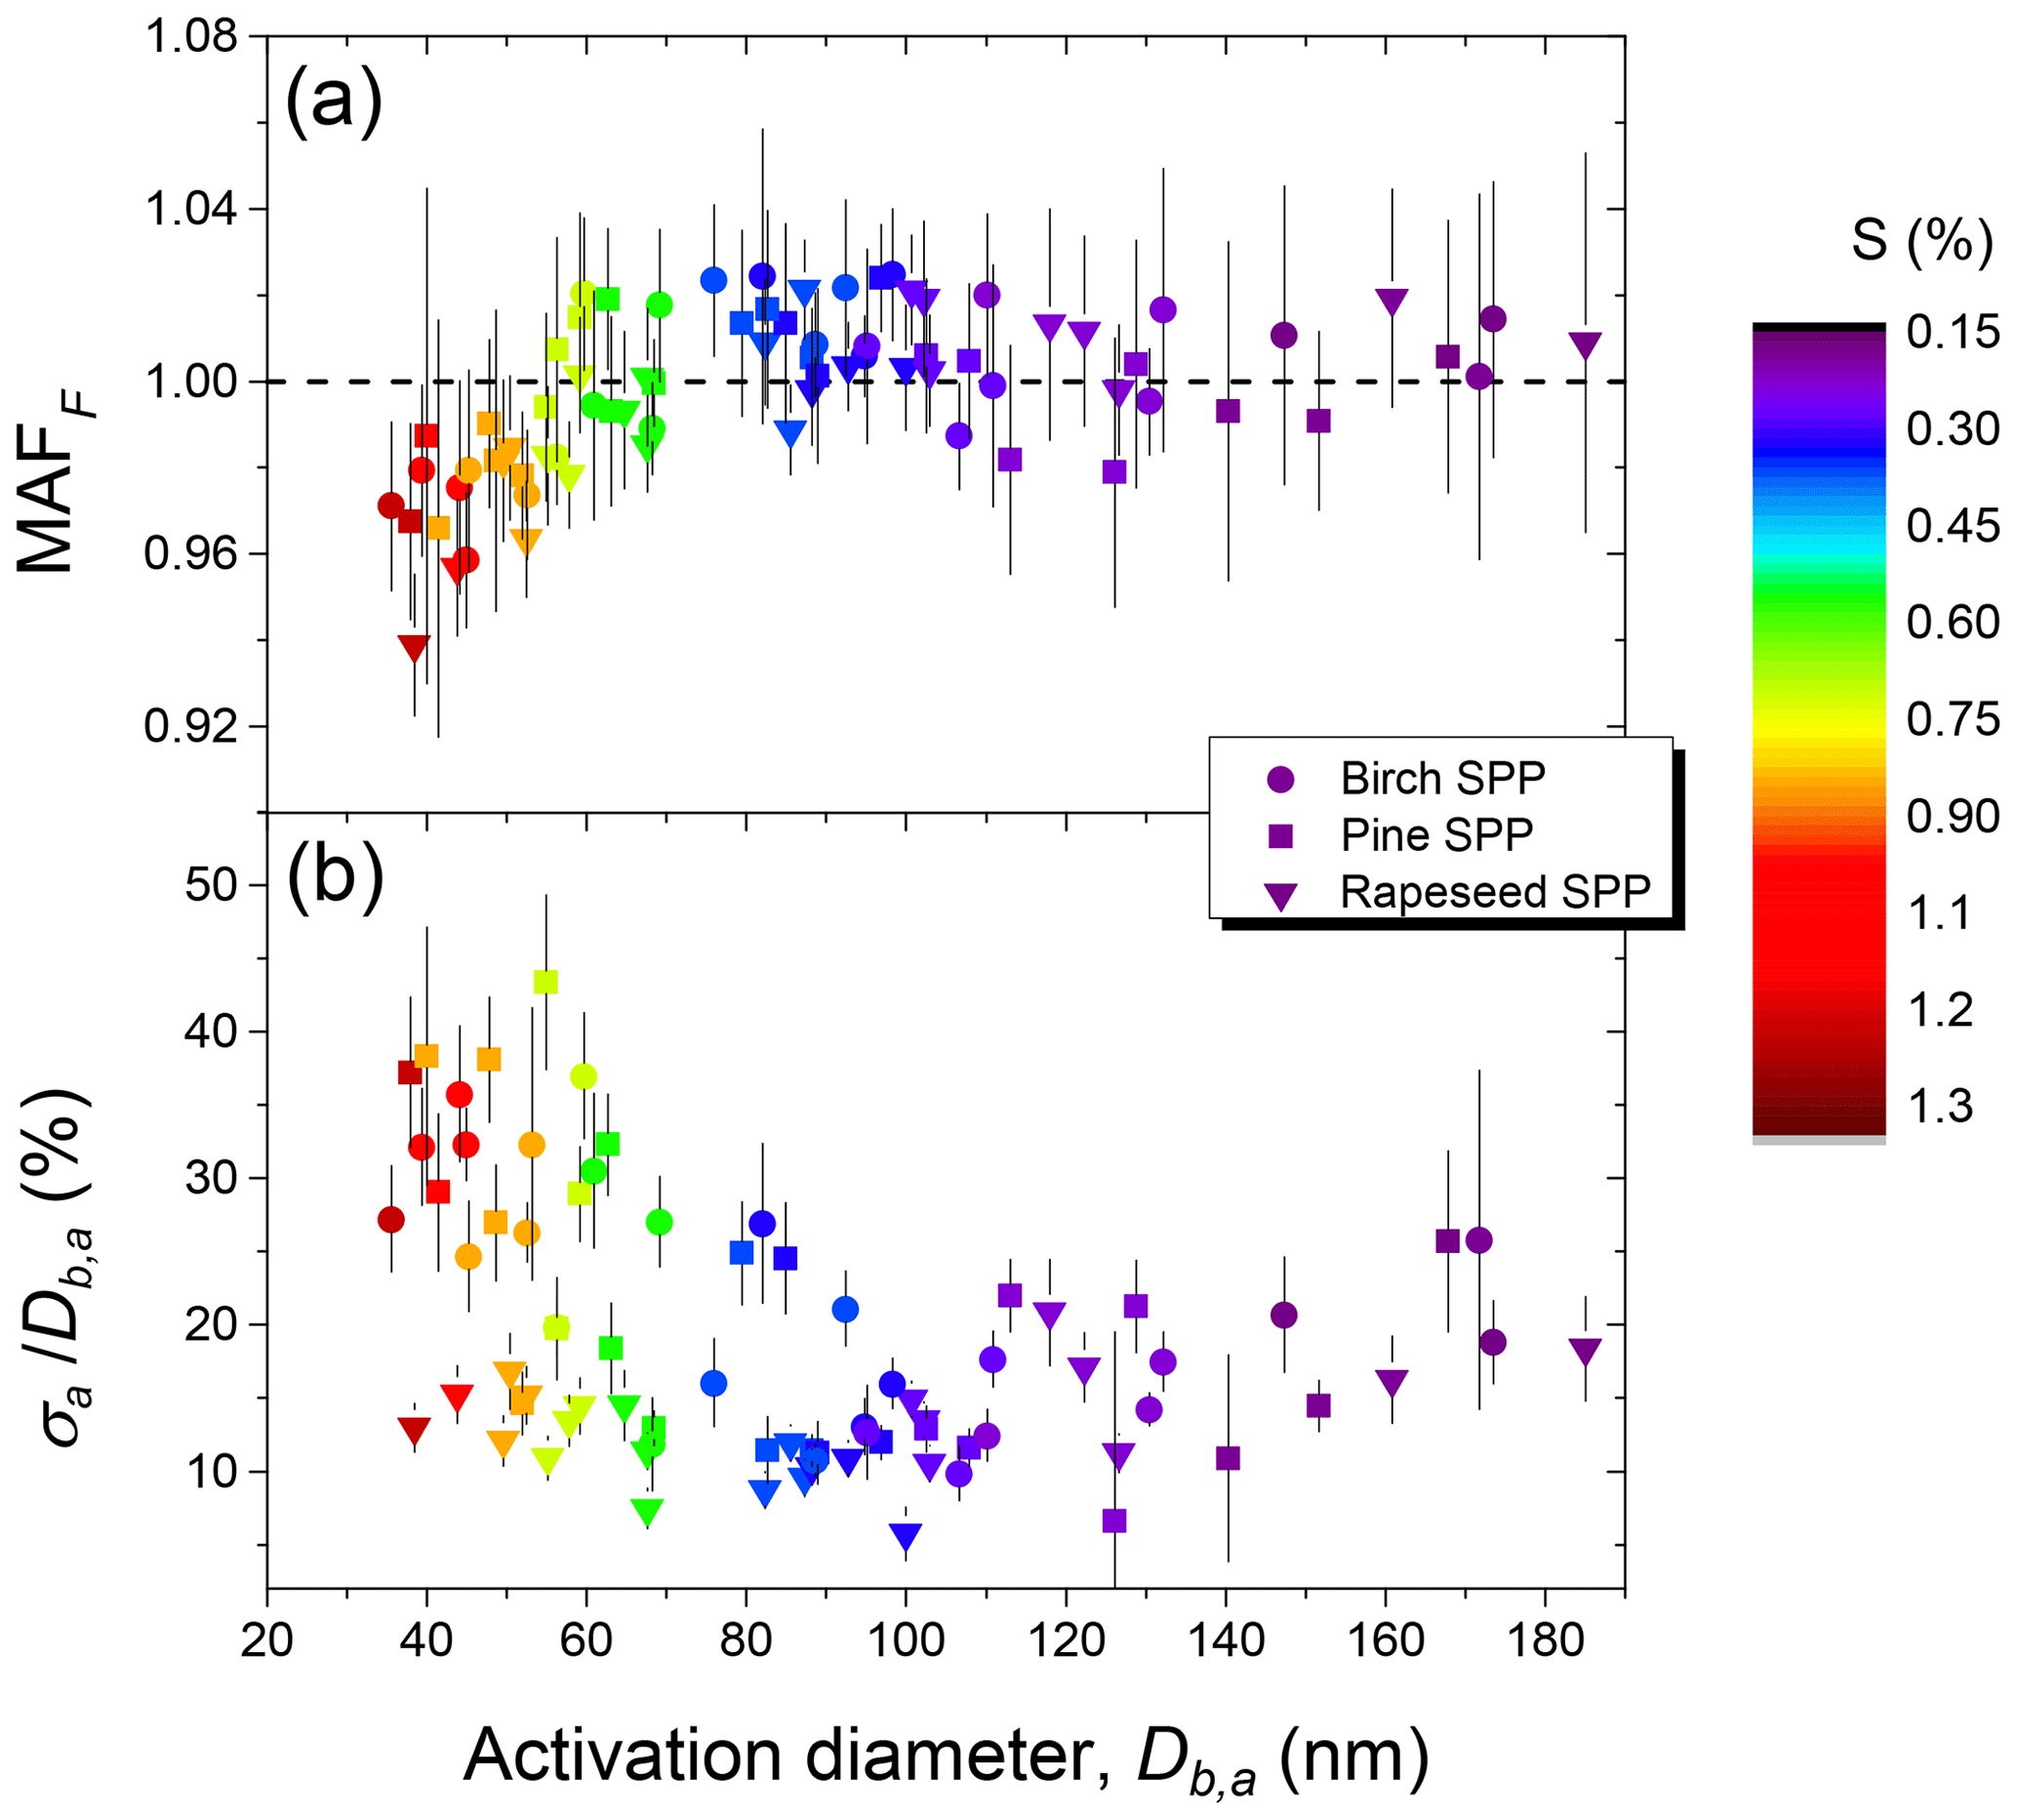
Figure 6Characteristic parameters of birch, pine, and rapeseed subpollen particles derived from CCN activation curves: maximum activated fraction (MAFF) (a) and heterogeneity parameter () (b).
For particles with nm, the MAFF is close to one (Fig. 6a) and (Fig. 6b) ranges from 10 % to 25 %, which implies that nearly all aerosol particles larger ∼80 nm were CCN active at S smaller 0.5 %. As detailed in Sect. 2.5, characterizes the heterogeneity of CCN-active particles in the size range around Db,a. The observed 10 %–25 % heterogeneity range is clearly higher than the ∼3 % observed for aerosols of homogeneous chemical composition, indicating that the particles in this size range were not internally mixed with respect to their solute content (Rose et al., 2010; Pöhlker et al., 2018). For particles with Db,a smaller ∼70 nm (S>0.6 %), the MAFF is below one (Fig. 6a), dropping to ∼0.93, and is high reaching up to 30 %–40 % for birch and pine subpollen particles (Fig. 6b). Both results indicate the presence of a noticeable fraction of CCN-inactive particles with much lower hygroscopicity. As shown in Sect. 3.2 the nebulized aqueous extracts contain a substantial proportion of colloidal particles in the size range of 20–80 nm (Fig. 2). It is therefore possible that a certain fraction of these particles did not have a sufficient amount of dissolved compounds on the surface, which prevented their activation even at S>1 % (Fig. 6a).
Due to porosity and nonsphericity of the initial dry particles, the shape-corrected activation diameters, Da (Eq. 11), are lower than those initial CCN-measured diameters, Db,a (Table 3).
Table 3Characteristic average CCN parameters (mean values ± SD) for subpollen particles (SPPs) at different S (%) values obtained in a series of three measurements for each sample. Quantities are a maximum activated fraction, MAFF; heterogeneity parameter, ; and initial (Db,a and κb,a) and shape-corrected (Da and κa) dry diameter and hygroscopicity parameter, respectively. δκ is the relative change in hygroscopicity due to particle restructuring, and Dwet,a is the wet activation diameter.
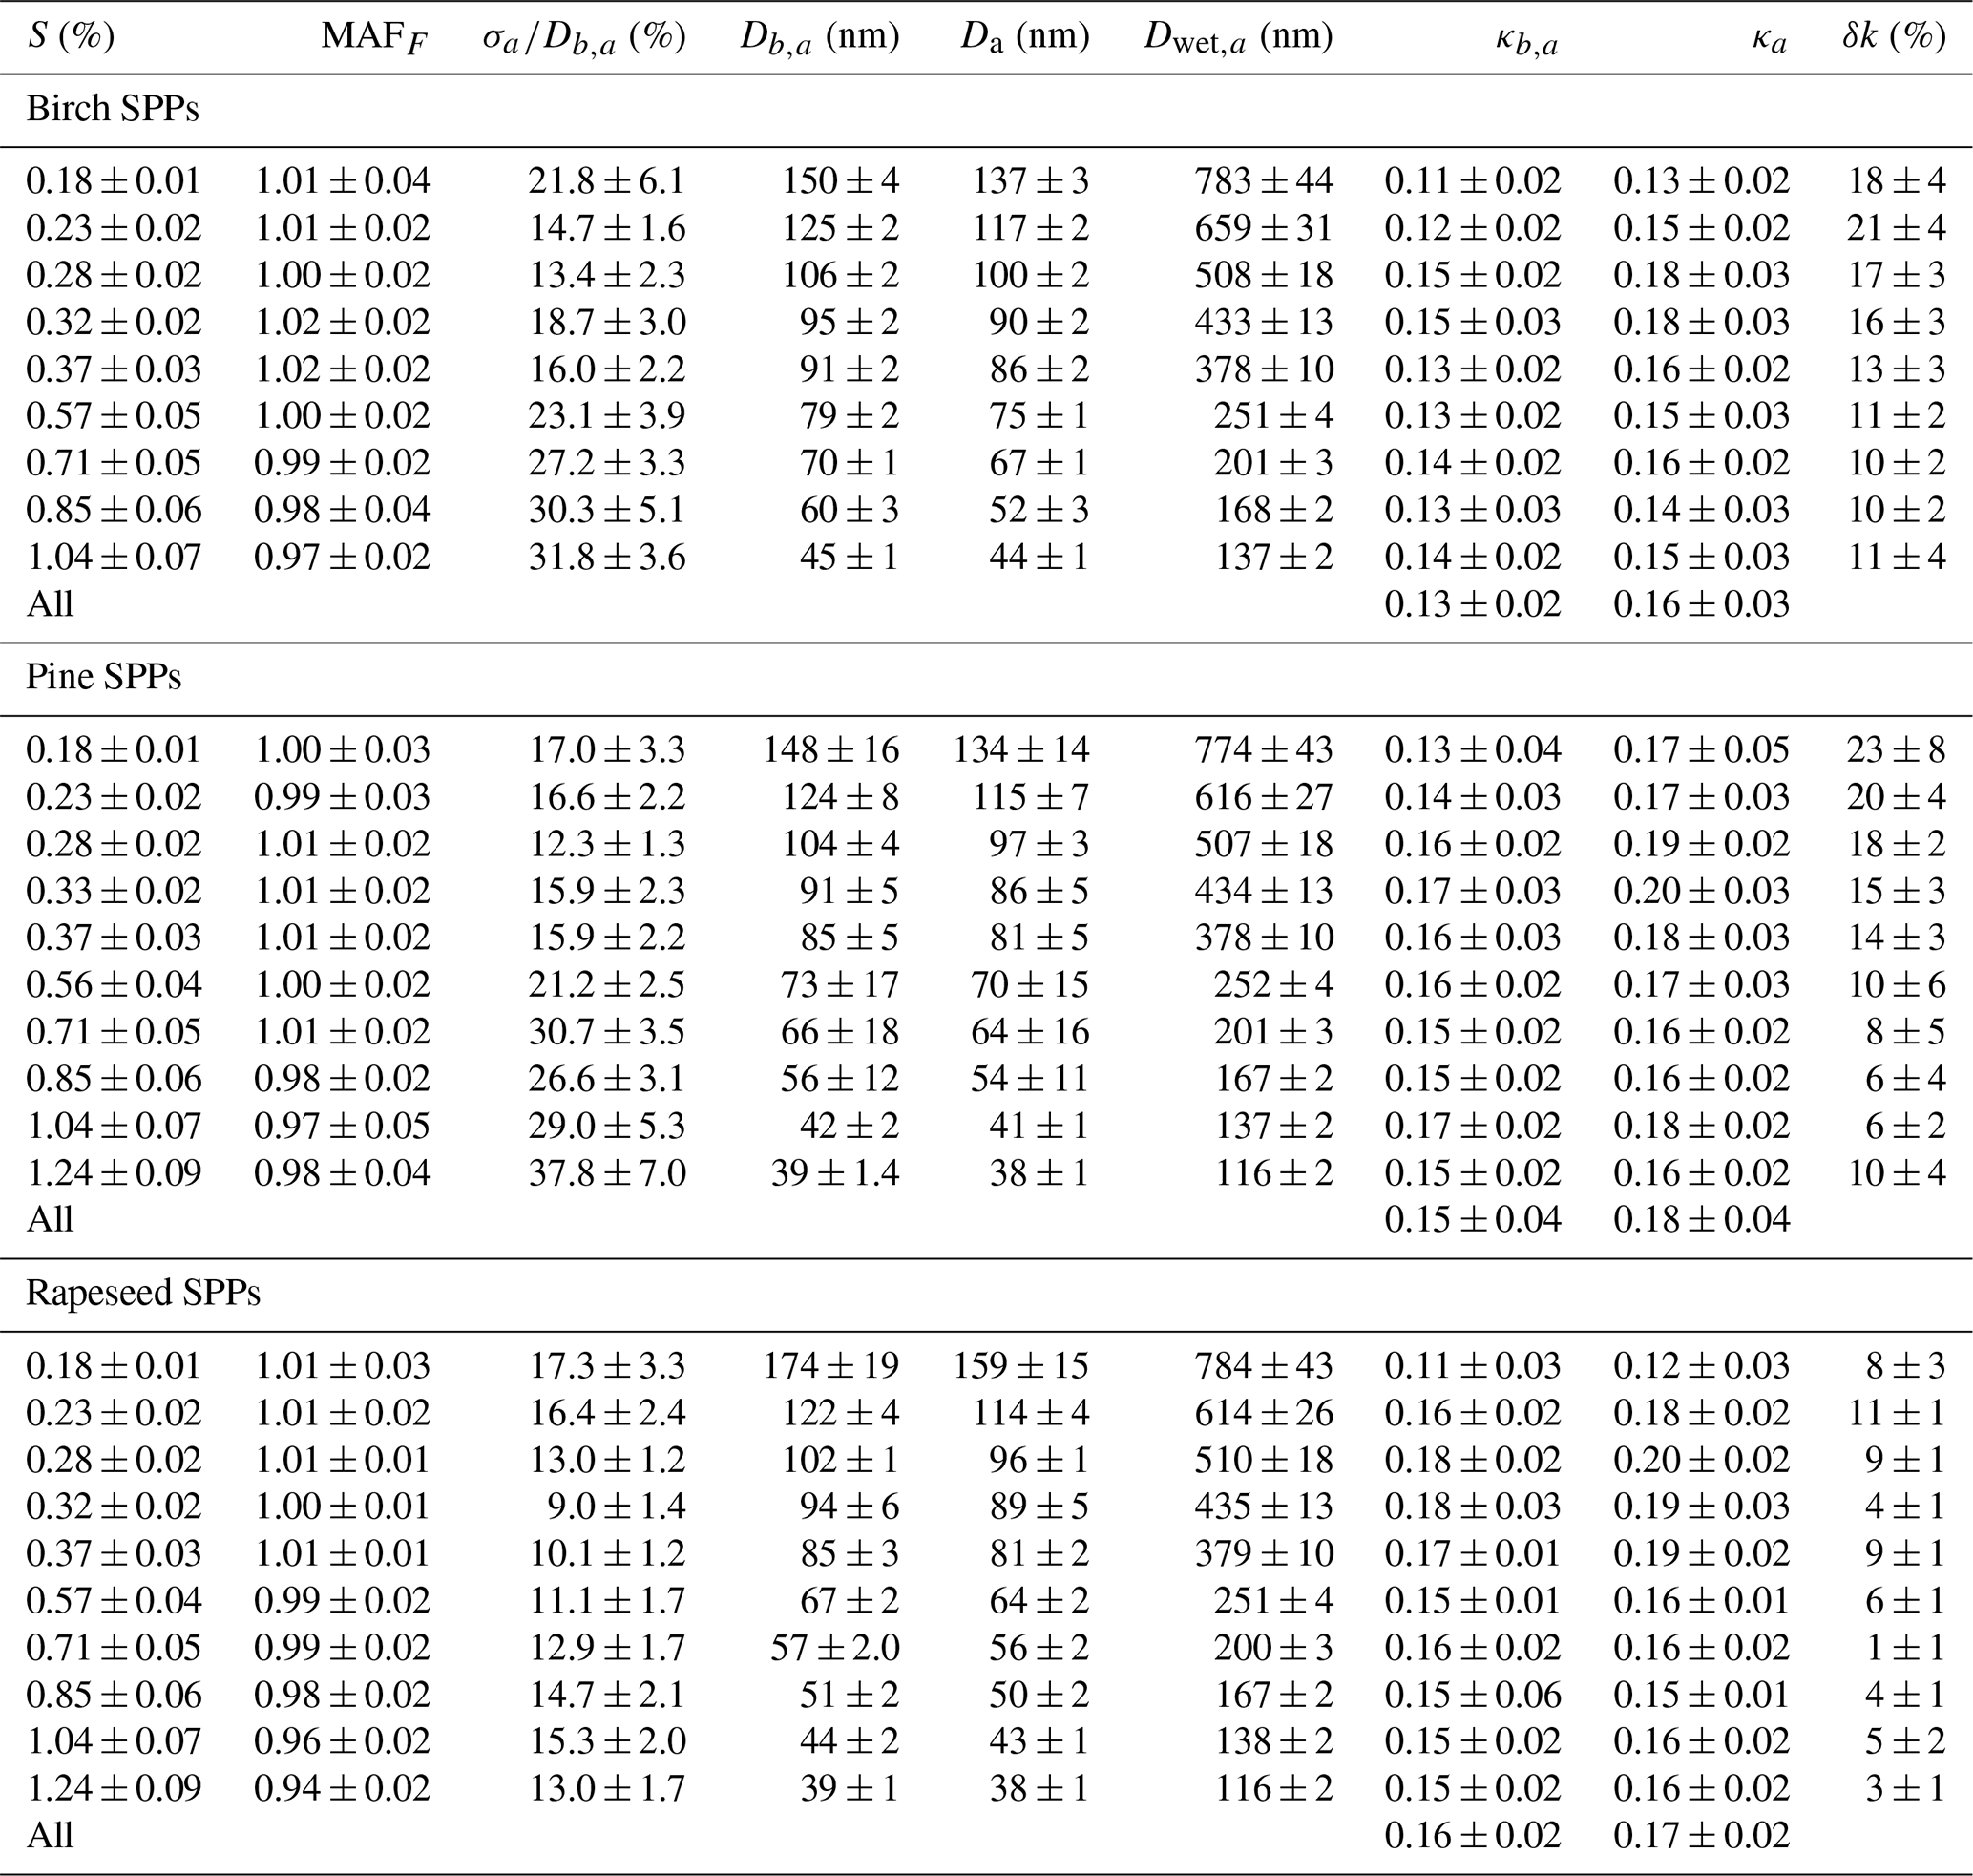
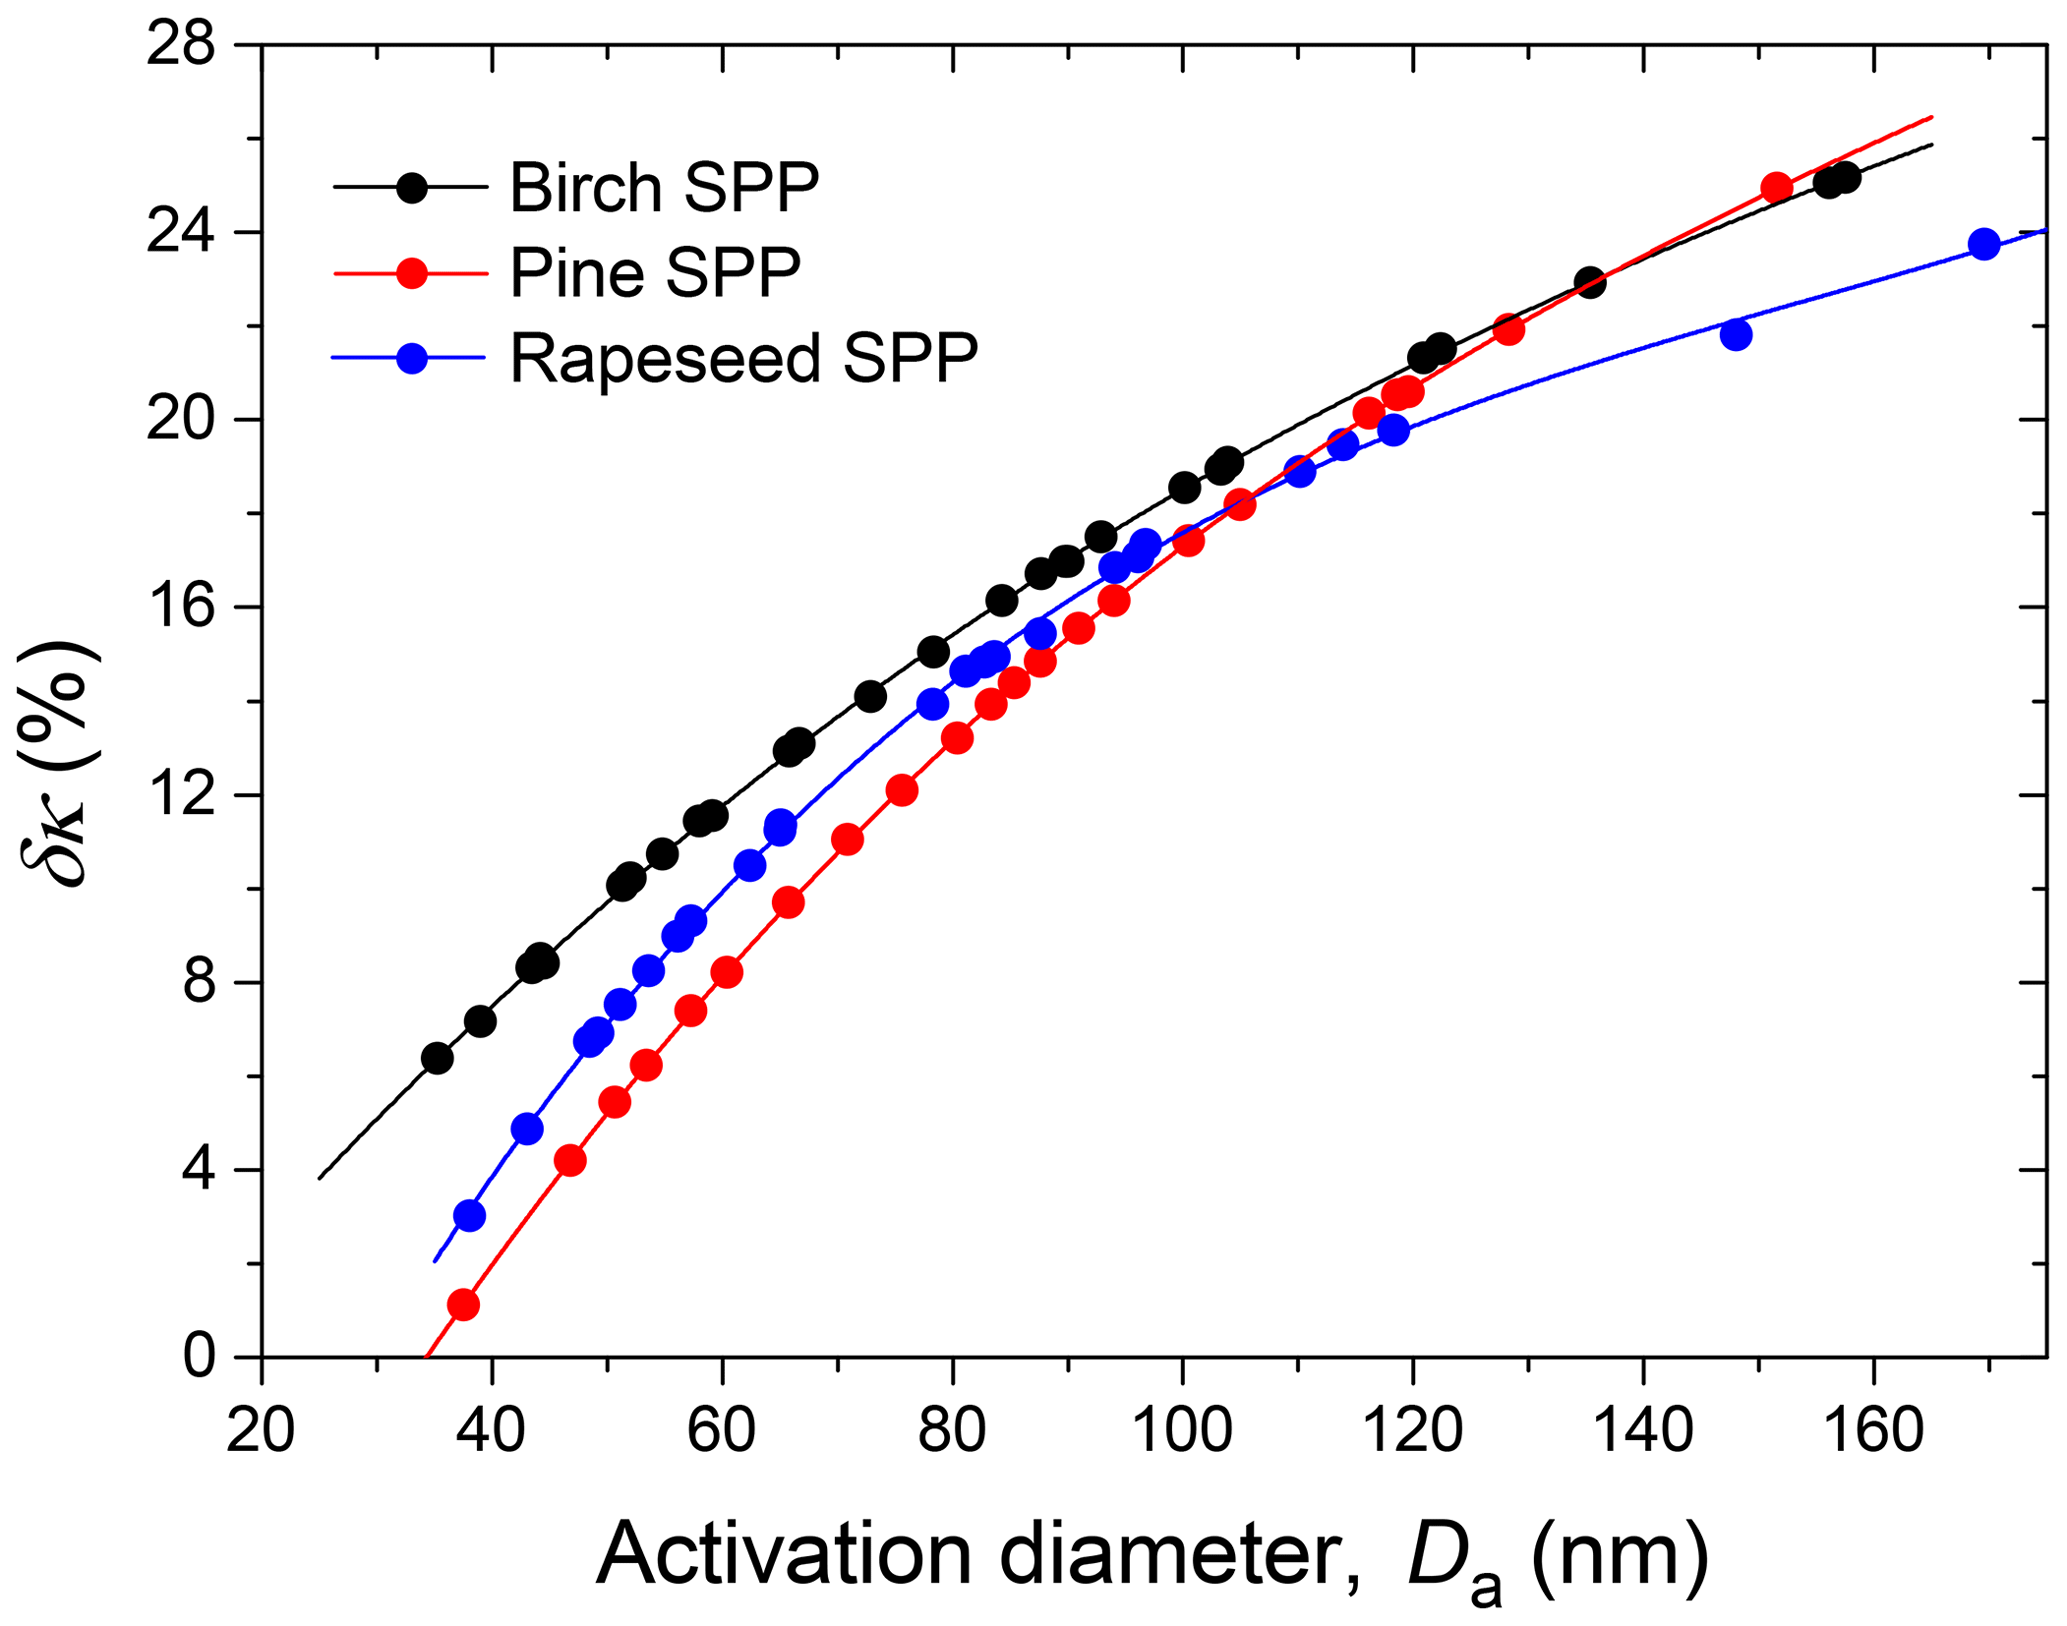
Figure 7The relative change of the hygroscopicity parameter uncertainty, δκ, due to particle irregular structure as a function of activation diameters, Da. Lines are third-order polynomial fits to guide the eye.
This difference leads to a significant underestimation of the κ values, especially for large particles (Table 3). Figure 7 illustrates the monotonic growth of with Da increasing, reaching ∼25 % at Da ∼160 nm for birch and pine SPPs.
The shape-corrected hygroscopicity values, κa, are shown in Fig. 8. For pine, rapeseed, and birch SPPs, average κa (± SD) values are 0.18±0.03, 0.17±0.030, and 0.16±0.02, respectively (Table 3), indicating that the difference in mean κa values is not statistically significant. However, noticeable size-dependent variations in SPP hygroscopicity are traced. Aerosol particles in the size range of 80–120 nm are more hygroscopic (κa∼0.20) than those in the range from 35 to 70 nm (κa∼0.14) and above 130 nm (κa∼0.13). The observed variations in κa are due to the size-dependent ratio of water-soluble and water-insoluble material in the generated dry particles. As discussed above, internally mixed particles with Da<70 nm are enriched in primary non-hygroscopic colloids (Fig. 2), while particles with Da>130 nm may contain their aggregates.
In general, the CCN measurement results show that the subparticles of pollen grains at sizes exceeding 45 nm are CCN active at supersaturations below 1 % (Fig. 6a); therefore, they can participate in the formation and modification of cloud systems.

Figure 8Shape-corrected hygroscopicity, κa, as a function of aerosol particles activation diameter, Da, and supersaturation, S (color code), of birch (a), pine (b), and rapeseed (c) subpollen particles. The red line and gray shaded area correspond to average κa±SD.
3.6 Hygroscopic properties
To avoid the uncertainties associated with the aerosol particle morphology, we coupled H&D mode with one of the hygroscopic growth modes, as shown in Fig. S2 and previously described in Mikhailov et al. (2020). During the hygroscopic growth experiment, the RH2 values in the preconditioning section were maintained in the RHH&D,min range (Table 2). This range corresponds to values which are used to approximate the actual mass-equivalent diameter of dry particles. Using Eq. (2), the measured RH-dependent mobility particle diameters Db were converted into hygroscopic growth factors. The experimental growth factors obtained upon hydration and dehydration of preconditioned SPPs are illustrated in Fig. 9 (panels a, c, e). All samples exhibit gradual and fully reversible water uptake similar to the behavior of amorphous organic substances (Mikhailov et al., 2009, 2013). The fact that the hydration and dehydration curves practically coincide also indicates that there are no kinetic limitations in the water uptake and release on the timescale of the HHTDMA experiment (∼7 s). Even at low RH, the growth factor of ∼100 nm particles preconditioned at RH ∼96 % (dehydration mode) is equal to that obtained in the hydration mode. The observed gradual water uptake and release is determined by the specific chemical composition of SPPs comprising a broad spectrum of hydrophilic and hydrophobic organic species as well as inorganic ions (Table 1). Such systems tend to adopt amorphous phase states (Mikhailov et al., 2009; Koop et al., 2011; Shiraiwa et al., 2011).
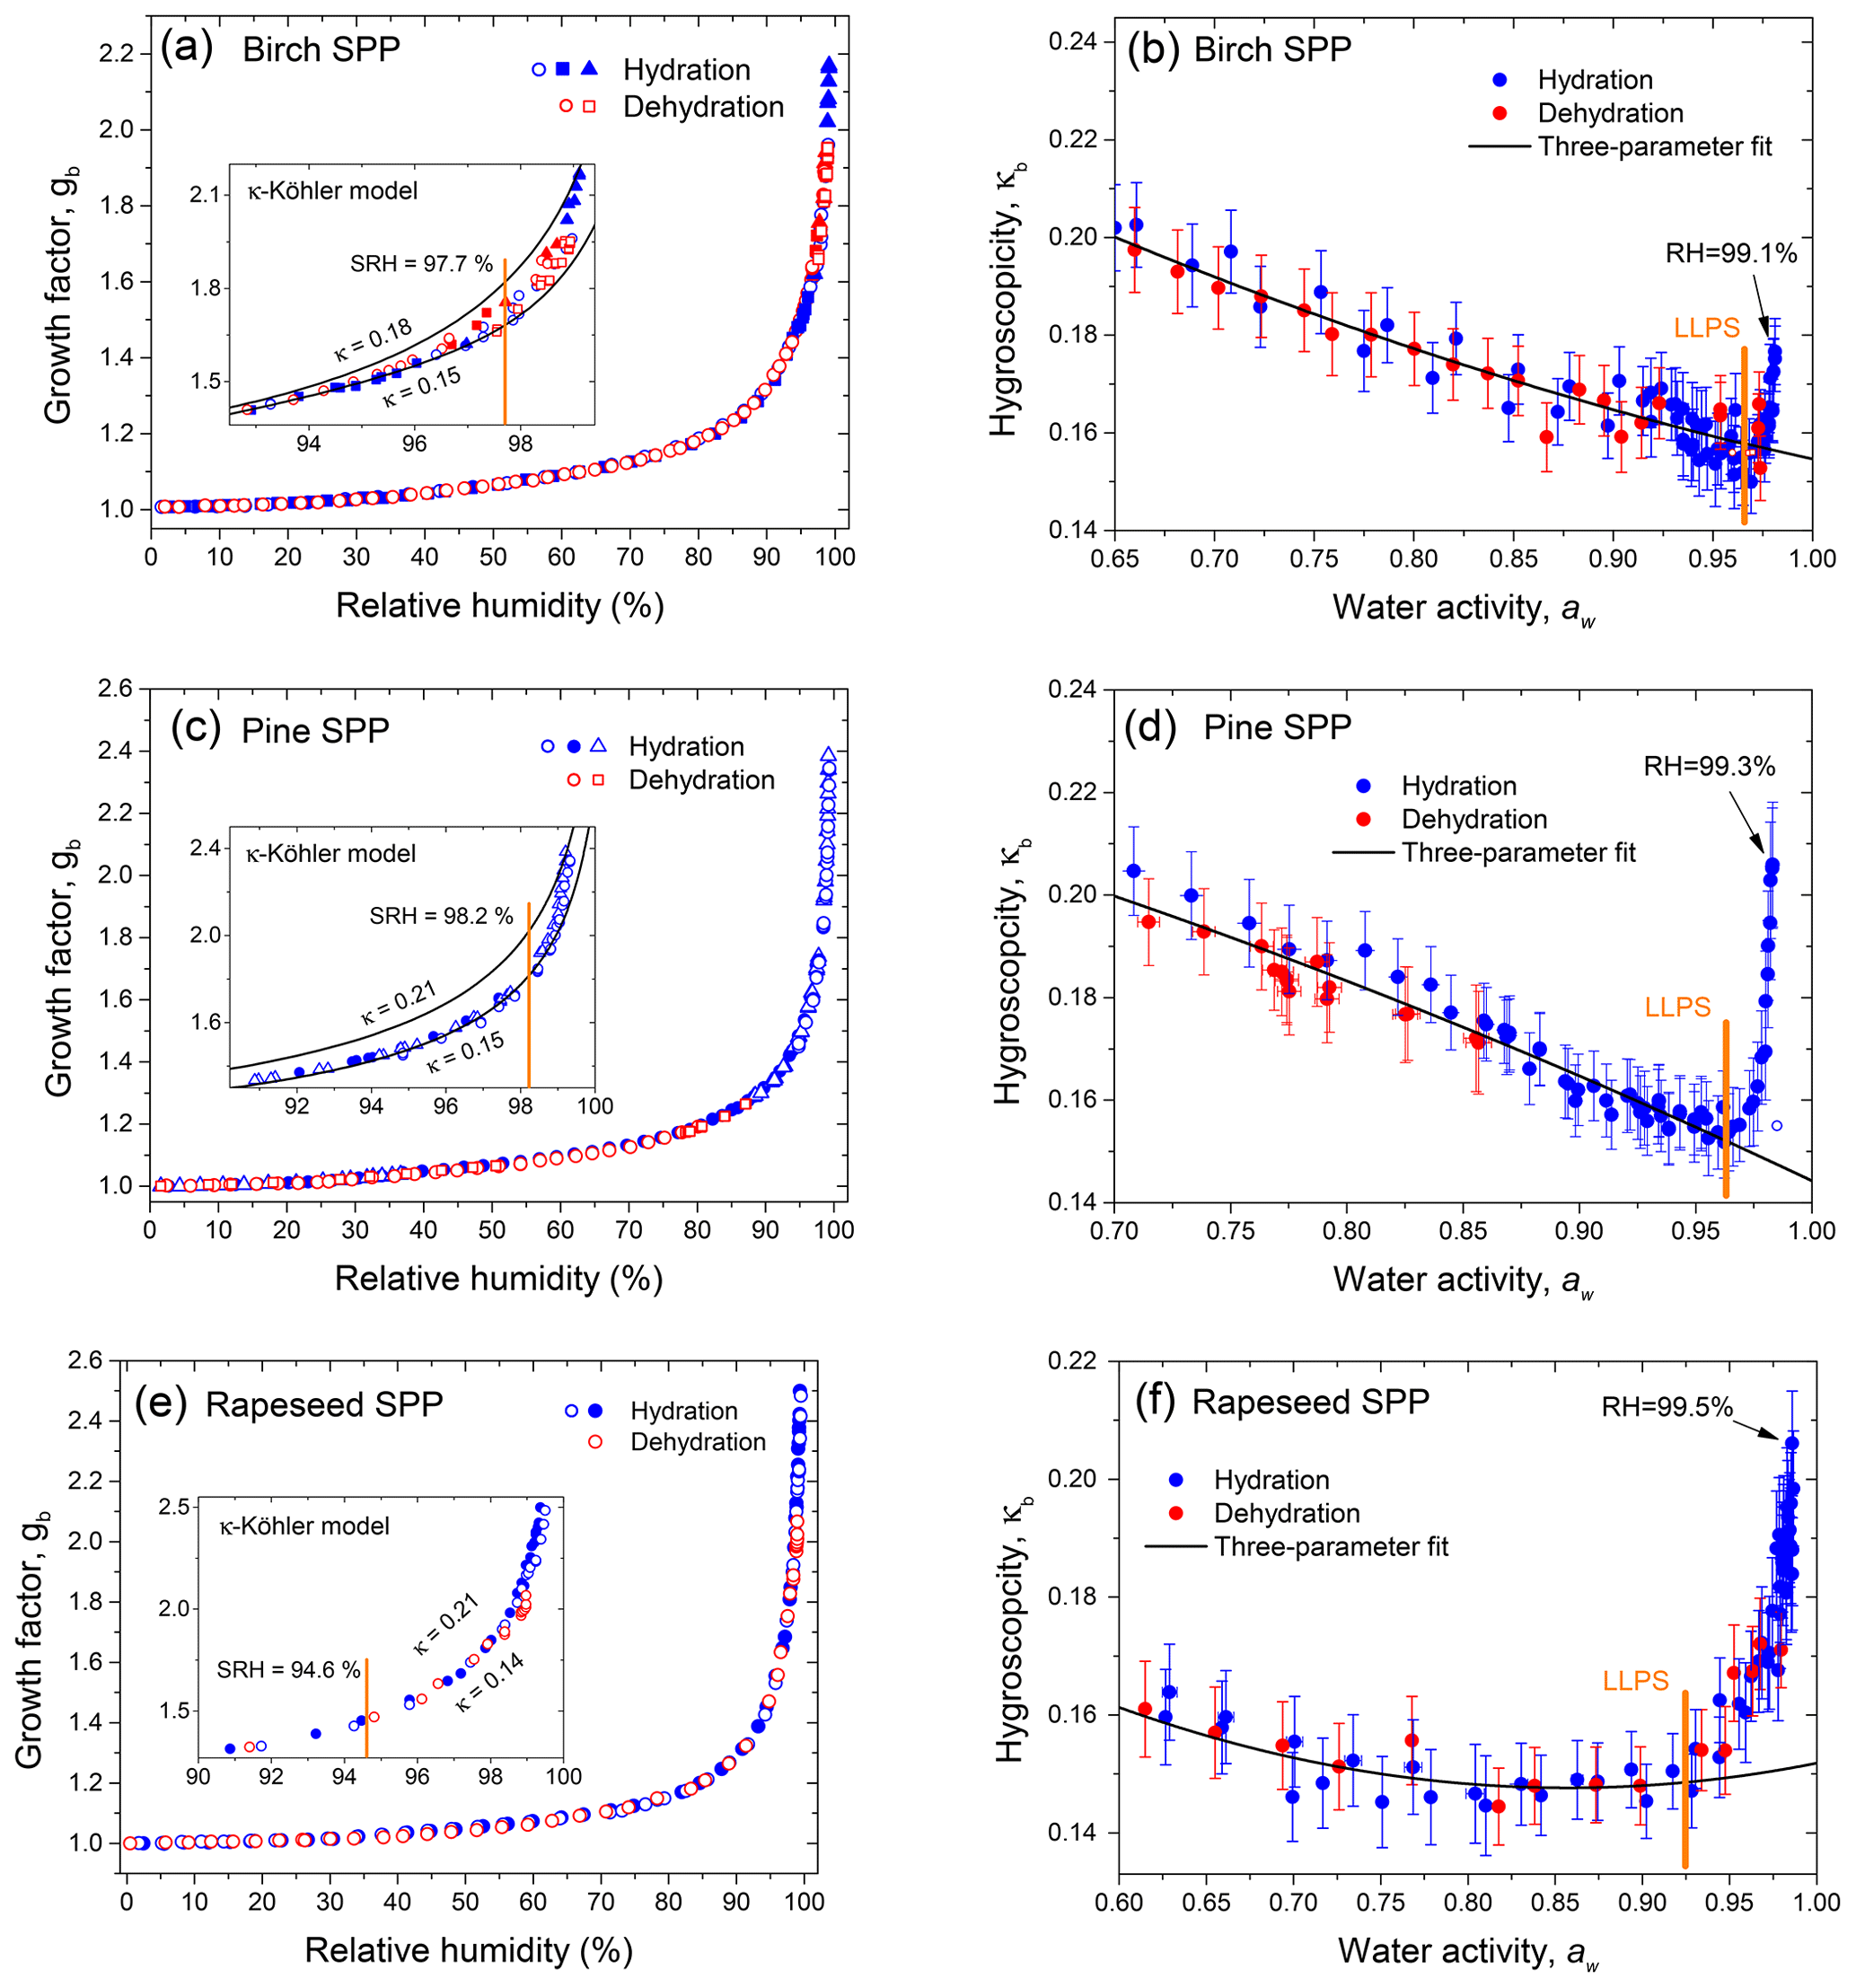
Figure 9Growth factors observed in hydration and dehydration experiments (a, c, e) and gb-based hygroscopicity parameter, κb (Eq. 7) (b, d, f) of birch, pine, and rapeseed subpollen aerosol particles with nm, respectively. Different symbols are different experimental runs. Inserts in panels (a), (c) and (e) show the κ-Köhler curves with lowest and highest κ taken from the right panels. The vertical orange lines in panels (b), (d), and (f) mark the expected onset of LLPS, and the arrows show the experimental point with the maximum RH value obtained in each measurement.
Panels (a), (c), and (e) of Fig. 9 show that noticeable water uptake by SPPs begins at ∼30 % RH. Most likely, above this RH value, the particles undergo a moisture-induced phase transition from glass to semisolid state that can absorb water and swell (Mikhailov et al., 2009; Koop et al., 2011). Continued absorption observed at RH >30 % converts the semisolid particles into heterogeneous solution droplets. At RH >95 %, the particles take up a significant amount of water; with further RH increasing, particles uptake more and more water, leading to an abrupt increase in the growth factors. Thus, in the case of pine SPPs (Fig. 9c), a ∼1 % change in RH from 98 % to 99.2 % results in a 3-fold increase in the particle volume.
Panels (b), (d), and (f) of Fig. 9 show the HHTDMA-derived hygroscopicity parameter, κb, as a function of water activity for birch, pine, and rapeseed SPPs, respectively, calculated from Eq. (7). In the aw range from ∼0.6 to ∼0.95 a pronounced decreasing trend of κb is observed for all samples. Further growth in water activity (aw>0.95) leads to a sharp increase in the hygroscopicity parameter. The obtained gb(RH) and κb(aw) dependencies are typical for non-ideal multicomponent systems undergoing liquid–liquid phase separation (LLPS) at high RH.
Modeling results by Renbaum-Wolff et al. (2016) and Rastak et al. (2017) using AIOMFAC (Aerosol Inorganic–Organic Mixtures Functional groups Activity Coefficients), as well as those by Liu et al. (2018) based on the Flory–Huggins model, show the similar humidity-dependent hygroscopicity for the multicomponent organic material. At aw<0.95, the thermodynamic models predict high κ values due to strong interaction among different kinds of molecules that gradually decrease with particle dilution and a sharp increase of κ at aw>0.95 caused by spinodal decomposition resulting in two phases. Above this aw, the formation of an additional phase becomes thermodynamically favorable in comparison to a single phase. We suggest that consideration of liquid–liquid phase separation, leading to the formation of organic-rich and water-rich phases, can explain the evolution of hygroscopic properties of SPPs. Before the liquid–liquid phase separation relative humidity (SRH), the water uptake represents hygroscopicity of the organic-rich phase, while above SRH the water uptake is determined by the water-rich phase. Most likely, after LLPS the organic-rich phase includes high-molecular-weight pollen species, mainly membrane proteins, starch, and lipids (Stanley and Linskens, 1974). In contrast, in the water-rich phase, the potential components are hydrophilic carbohydrates (glucose, fructose, sucrose, and maltose), water-soluble proteins, and ions (Table 1). Since the analysis of the chemical composition of SPP samples is incomplete and includes only certain classes of compounds, we used Eq. (9) to approximate non-ideal behavior of κb before phase separation. The obtained fit curves were extrapolated to aw=1 and are shown in panels (b), (d), and (f) of Fig. 9. The best-fit parameters are listed in Table 4.
Table 4Parameters characterizing the hygroscopic properties of subpollen particles with nm: best-fit values (±SD) for the three-parameter fit (k1, k2, k3; Eq. 9) and SRH of LLPS; n and R2 are the number of data points and the coefficient of determination of the fit, respectively.
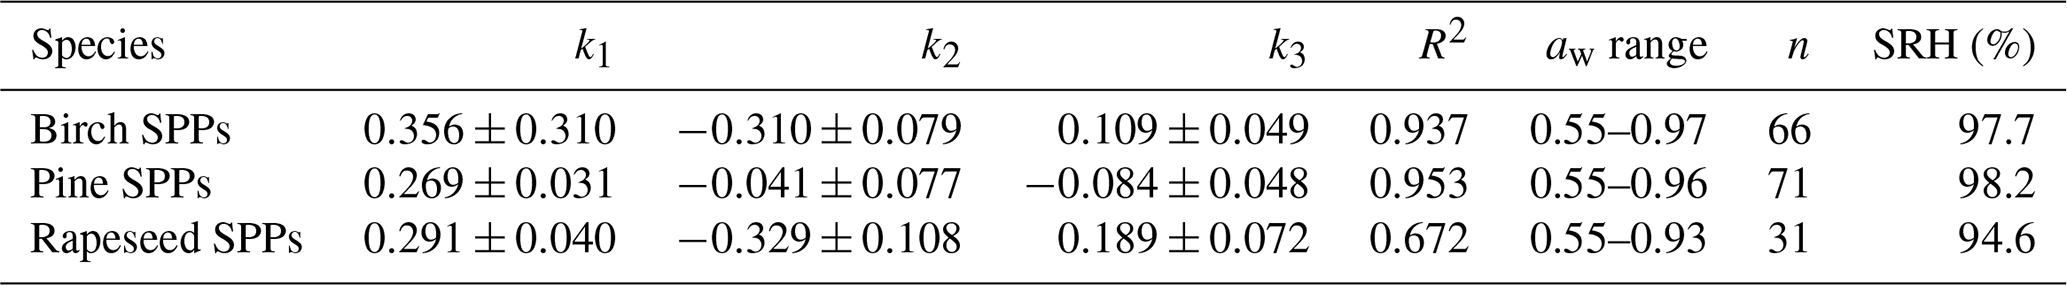
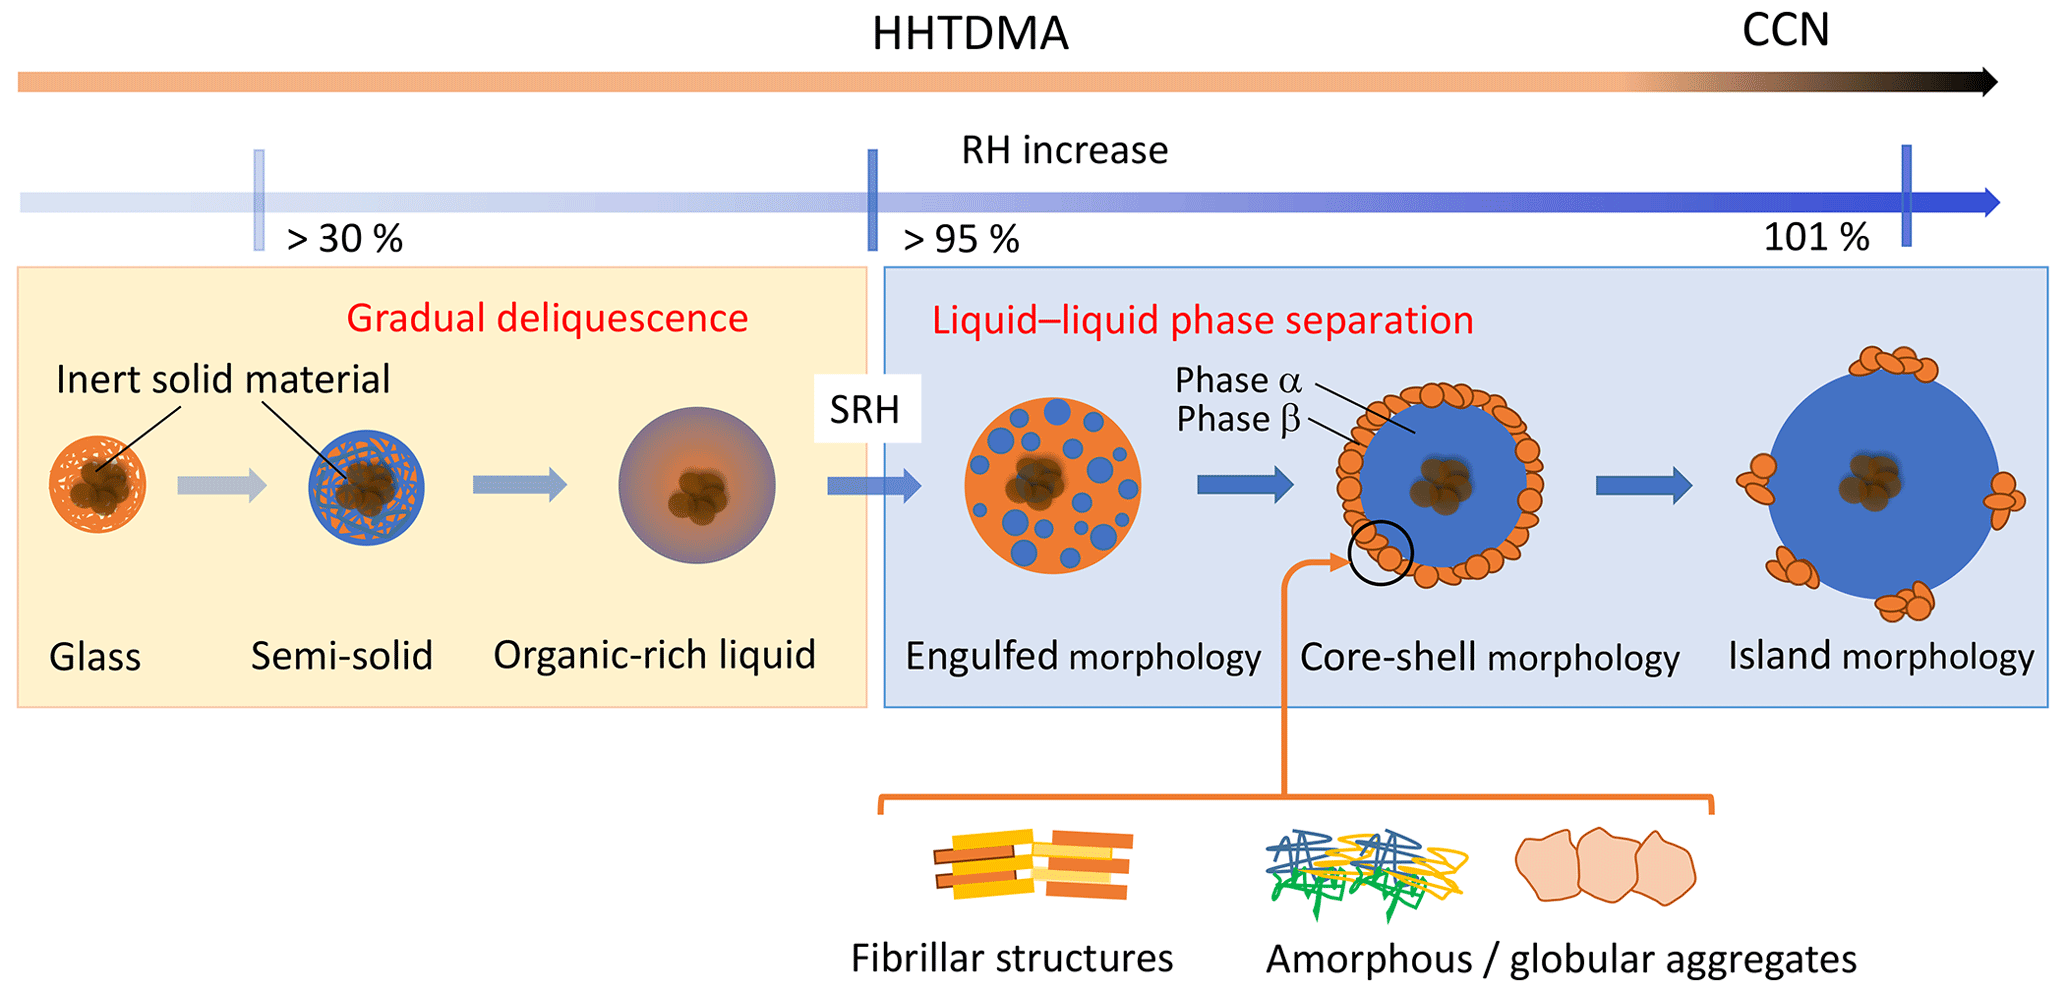
Figure 10Water uptake by amorphous subpollen particles: possible morphology and processes. SRH is the RH onset of liquid–liquid phase separation.
The difference between extrapolated and measured κb demonstrates the effect of LLPS on the water uptake. The onset aw of LLPS was determined as a minimum in the κb(aw) dependency (), and corresponding SRH values converted from obtained aw of LLPS are given in Table 4. The onset SRH of the birch SPPs (97.7 %) and pine SPPs (98.2 %) are comparable, while the SRH of rapeseed SPPs is remarkably lower (94.6 %). The SRH value depends on the dipole moment of organic material, and this parameter is a function of the elemental oxygen to carbon () ratio. Multiple experiments with organic material showed that LLPS has been observed for and never observed for , and this rule applies to both simple and complex mixtures (You et al., 2014). Parameterizations reported by Bertram et al. (2011) and Song et al. (2012) indicate that the SRH tends to decrease with an increasing ratio. It is possible, therefore, that the lower SRH obtained for rapeseed subparticles is caused by a higher content of more oxidized organic compounds relative to birch and pine samples.
The main water-active organic components of SPPs are carbohydrates and proteins (Table 1). For carbohydrates, the ratio is close to one; therefore, it is unlikely that they can initiate LLPS. The average ratio in protein-forming amino acids is 0.4; thus, proteins are suitable candidates for triggering spinodal decomposition. The SRH at that ratio is in the range of 95 %–100 % with a weak effect of organic–inorganic ratio on SRH (You et al., 2014; Bertram et al., 2011). The experimental SRH values for SPPs are within 95 %–98 %, indicating that proteins as well other organic compounds with an ratio near 0.4 may be responsible for LLPS.
Dissolution of sparingly soluble organic compounds may also contribute to the hygroscopicity. Modified κ-Köhler models that assume limited water solubility predict a monotonic increase of κ values for an aw increasing (Petters et al., 2009; Pajunoja et al., 2015). However, the decreasing trend of κb observed in the aw range of 0.6–0.95 cannot be explained by these models (panels b, d, and f of Fig. 9). In addition, the solubility-based prediction is inconsistent with the size-resolved CCN measurements. As can be seen from Table 3, the growth factor () at the activation point increases with an increasing Da (decreasing S) that should result in more organic solute dissolved in the aqueous phase, thus increasing the κ value. The CCN-derived κa values rather demonstrate the opposite effect (Fig. 8); that is, an increase in Da on average leads to a decrease in κa. Most likely, this dependence results from the unequal composition of the dry particles, as discussed above. Taking into account the above arguments, we tend to assume that sparingly soluble compounds have little effect on the water uptake of the SPPs studied.
Figure 10 shows the possible evolution of SPP morphology upon interaction with water vapor. This diagram unites early studies with amorphous particles (Mikhailov et al., 2009; Koop et al., 2011) and those relatively new results associated with LLPS of multicomponent systems (Renbaum-Wolff et al., 2016; Ruehl et al., 2016; Song et al., 2017a; Ovadnevaite et al., 2017; Rastak et al., 2017). At low RH, particles are in an amorphous glassy state. Due to the small diffusion coefficient of water () in the glassy matrix (typically below 10−10 cm2 c−1 at 300 K), the water uptake occurs only at the particle surface. Upon further increase in RH, the outermost layers will absorb more water, which softens the matrix and acts as plasticizer, thus reducing viscosity and increasing . At RH range above ∼30 %, particles undergo a humidity-induced phase transition from glass to a semisolid state. This induces a self-accelerating process such that significant water uptake occurs in a gradual deliquescence process, and the semisolid turns into organic-rich liquid. At high RH (>95 %), particles containing hydrophobic and hydrophilic organics undergo LLPS forming water-rich (α) and organic-rich (β) phases (Fig. 10). The specific value of SRH is a function of ratio and ions content (salting in/out effects) (You et al., 2014, and references therein). On the initial stage of LLPS, the partially engulfed morphology is preferable; with a further RH growth, the water-enriched inclusions increase in size and coagulate into one phase forming particles with core-shell morphology where the aqueous phase being mostly responsible for particle growth at high RH. Under continuing growth conditions, the organic shell will reach a relatively small volume compared to the growing volume of the aqueous core phase, such that it becomes impossible to form a complete organic shell. Under such conditions, the organic material may spread out as molecular “islands” at the surface of the core (Fig. 10) (Ovadnevite et al., 2017). The transition from a coherent phase (organic film) to a spread out “gaseous” state on a two-dimensional (2D) droplet surface can be modeled as a 2D phase transition, as described by Ruehl et al. (2016). The presented particle morphology after LLPS (Fig. 10) is based on microscopy images of supermicron samples (Renbaum-Wolff et al., 2016; Song et al., 2017a) and can differ from ∼100 nm particles studied here. Our results, however, are in agreement with these images. Panels (b), (d), and (f) of Fig. 9 clearly show that at LLPS, water uptake does not occur instantaneously but rather within a certain Δaw, suggesting that a phase separation includes a sequential morphological transformation from an organic-rich phase to a water-rich phase. A similar agreement between microscopic images and the phase transition processes govern the water interactions by the 100 nm particles was observed by Rastak et al. (2017) in the case of monoterpene-derived secondary organic aerosol (SOA).
The inserts in panels (a), (c), and (e) of Fig. 9 show the κ-Köhler modeling results (Eq. 6) with minimum and maximum κb values observed on the κb(aw) dependences (panels b, d, and f of Fig. 9). The difference in the Köhler curves reflects potential uncertainty arising from spinodal decomposition.
The lower Köhler curve fits the particle growth factors before onset SRH (orange line), while the upper Kohler curve corresponds to maximum κb observed after LLPS. Intermediate data points indicate gradual phase separation accompanied by the particle engulfed morphology (Fig. 10).
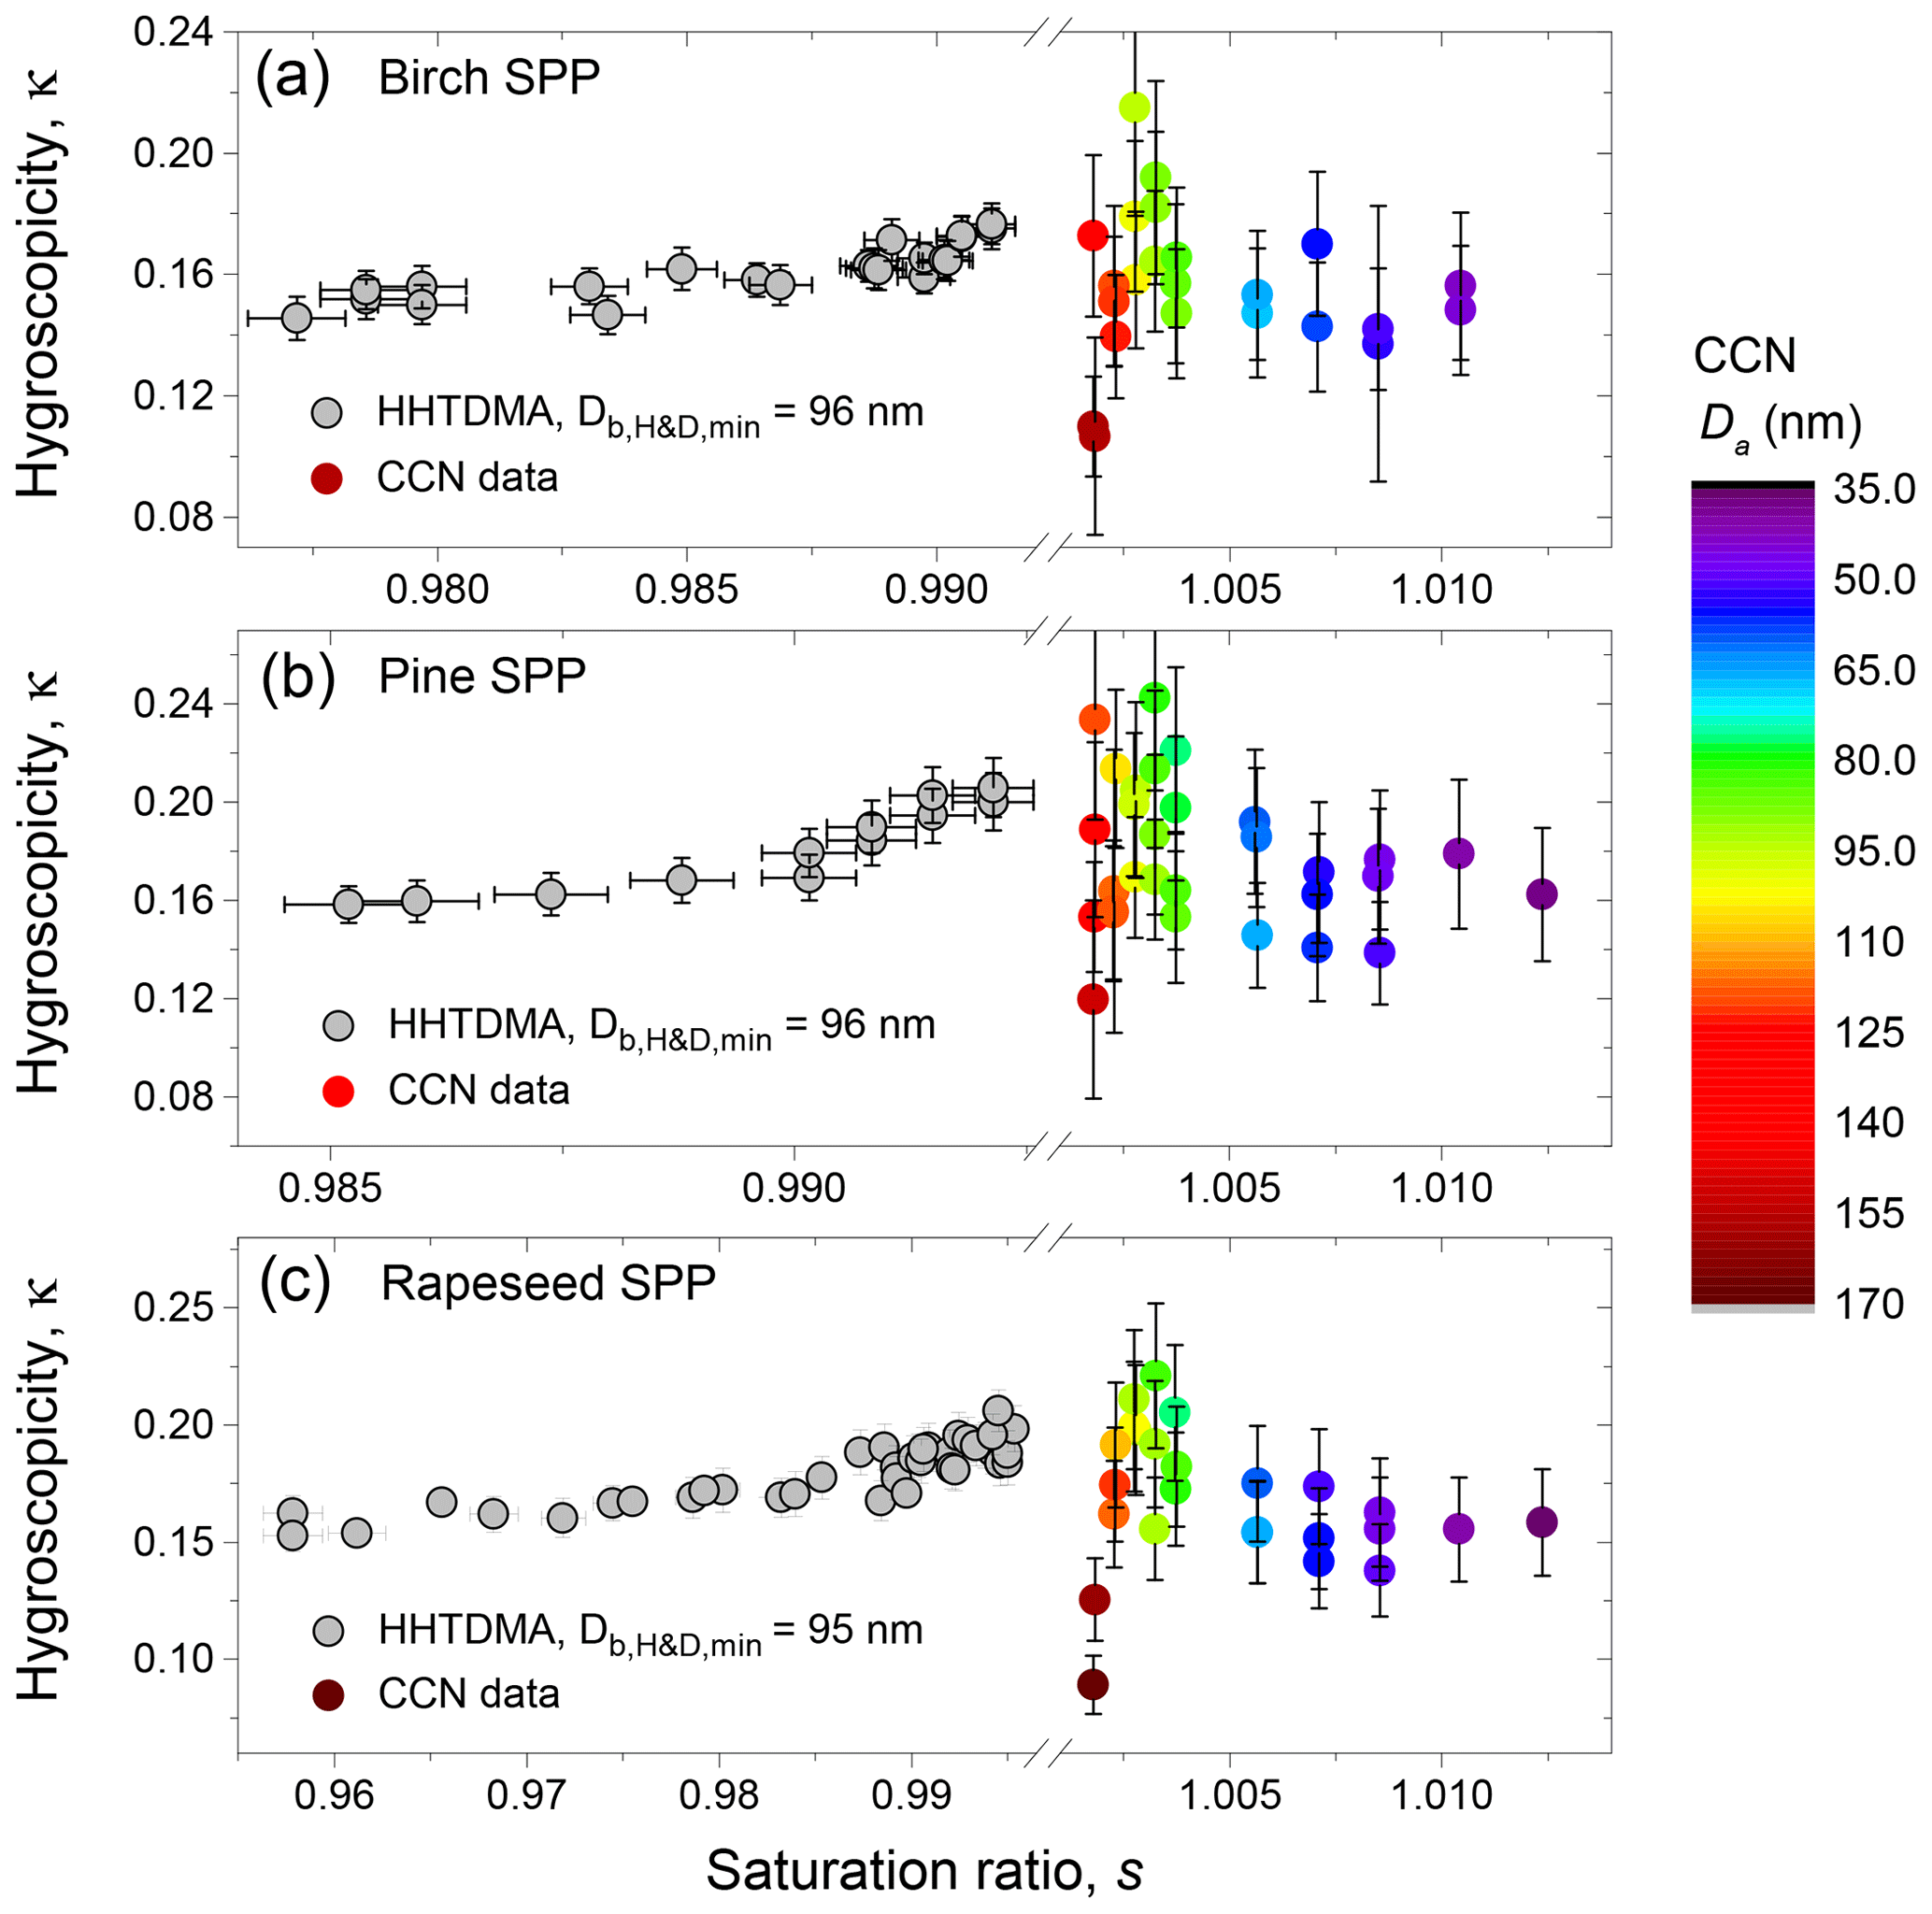
Figure 11HHTDMA-based and CCN-based hygroscopicity parameter, κ, for birch (a), pine (b), and rapeseed (c) SPPs as a function of RH. The color code shows the CCN-derived κa with respect to the shape-corrected activation diameters, Da.
Figure 11 shows the hygroscopicity parameter, κ, measured by HHTDMA and CCNC in SPPs. The HHTDMA-derived κb values are taken after aw of LLPS (orange line in panels b, d, and f of Fig. 9). One can see that within the measurement uncertainty of the CCN setup, the maximum values of the HHTDMA-derived κb with nm coincide with the CCN-derived κa with Da ∼100 nm (yellow data points), having a similar chemical composition, i.e., 0.17±0.01 vs. 0.18±0.03; 0.20±0.01 vs. 0.21±0.03; and 0.19±0.01 vs. 0.20±0.03 for birch, pine, and rapeseed SPPs, respectively. Note the agreement in κ is achieved by assuming that the surface tension equals σw, suggesting that the effect of the organic coating is negligible. One possible explanation is that the organic material establishes a partial shell covering of the water-rich phase (island morphology, Fig. 10). Following Ovadnevaite et al. (2017), the surface coverage parameter cβ is
where Vβ is the volume of phase β, and Vδ is the volume of a spherical shell of minimum thickness δβ,min, corresponding to a molecular single layer. In this study the volume of phase β was calculated as
assuming that the hydrophobic organic volume fraction in the dry particles is ∼7 %. This assumption is based on the chemical analysis of aqueous pollen extracts (Table 1), containing high-molecular-weight species such as protein ∼3 %, extractable starch ∼2 %, and other uncounted macromolecules ∼2 % (lipids, phenolic compounds, etc.). Here we assume that mass and volume fractions of pollen species are equal. Inert (surface inactive) solid material, such as cross-linking callose, sporopollenin, and cellulose, is not considered (Sect. 3.1). The volume of the spherical shell was derived from
where δβ,min is used as a free parameter varying from 0.4 to 5 nm. In the previous studies (Ruehl et al., 2016; Renbaum-Wolff et al., 2016; Liu et al., 2018), the δβ,min value of 0.16 and 0.3 nm was used for LLPS modeling of multicomponent organic mixtures with molar mass (M) ranging 150–360 Da (Zuend and Seinfeld, 2012). The molar masses of biomolecules as well as their size is significantly larger. In particular, the M of plant proteins is mainly 0.5–500 kDa (Mohanta et al., 2019), and their volume-equivalent diameter is 2.2–10.4 nm (Erickson, 2009); therefore, we expanded the possible range of δβ,min up to 5 nm. The effective surface tension of the droplet, σ, is calculated as the weighted mean of the composition-dependent surface tensions from α and β phases (Fig. 10):
where σα and σβ are the surface tension of the water-rich and organic-rich phases, respectively. Figure 12 shows the calculation results for Ds=100 nm based on Eqs. (12)–(14), which are presented as dependences, obtained for different values of the monolayer thickness. One can see that at nm both for the HHTDMA- and CCN-derived growth factors obtained after LLPS, the surface coverage does not exceed 0.1. Using cβ=0.1 and assuming that the surface tensions of water-rich and organic-rich phases are 72 and 57±5 mN m−1, respectively (Absolom et al., 1981; Makievski et al., 1990; Alahverdjieva et al., 2008), it follows from Eq. (15) that σ equals 70.5±0.5 mN m−1. That is, for particles with Ds=100 nm at due to partial shell covering (Fig. 10, island morphology), the surface effect of biomolecules becomes negligibly small. A small contribution of organic coating to the surface tension of the diluted droplets was also observed in CCN activation experiments with pollenkitt particles (Prisle et al., 2019).
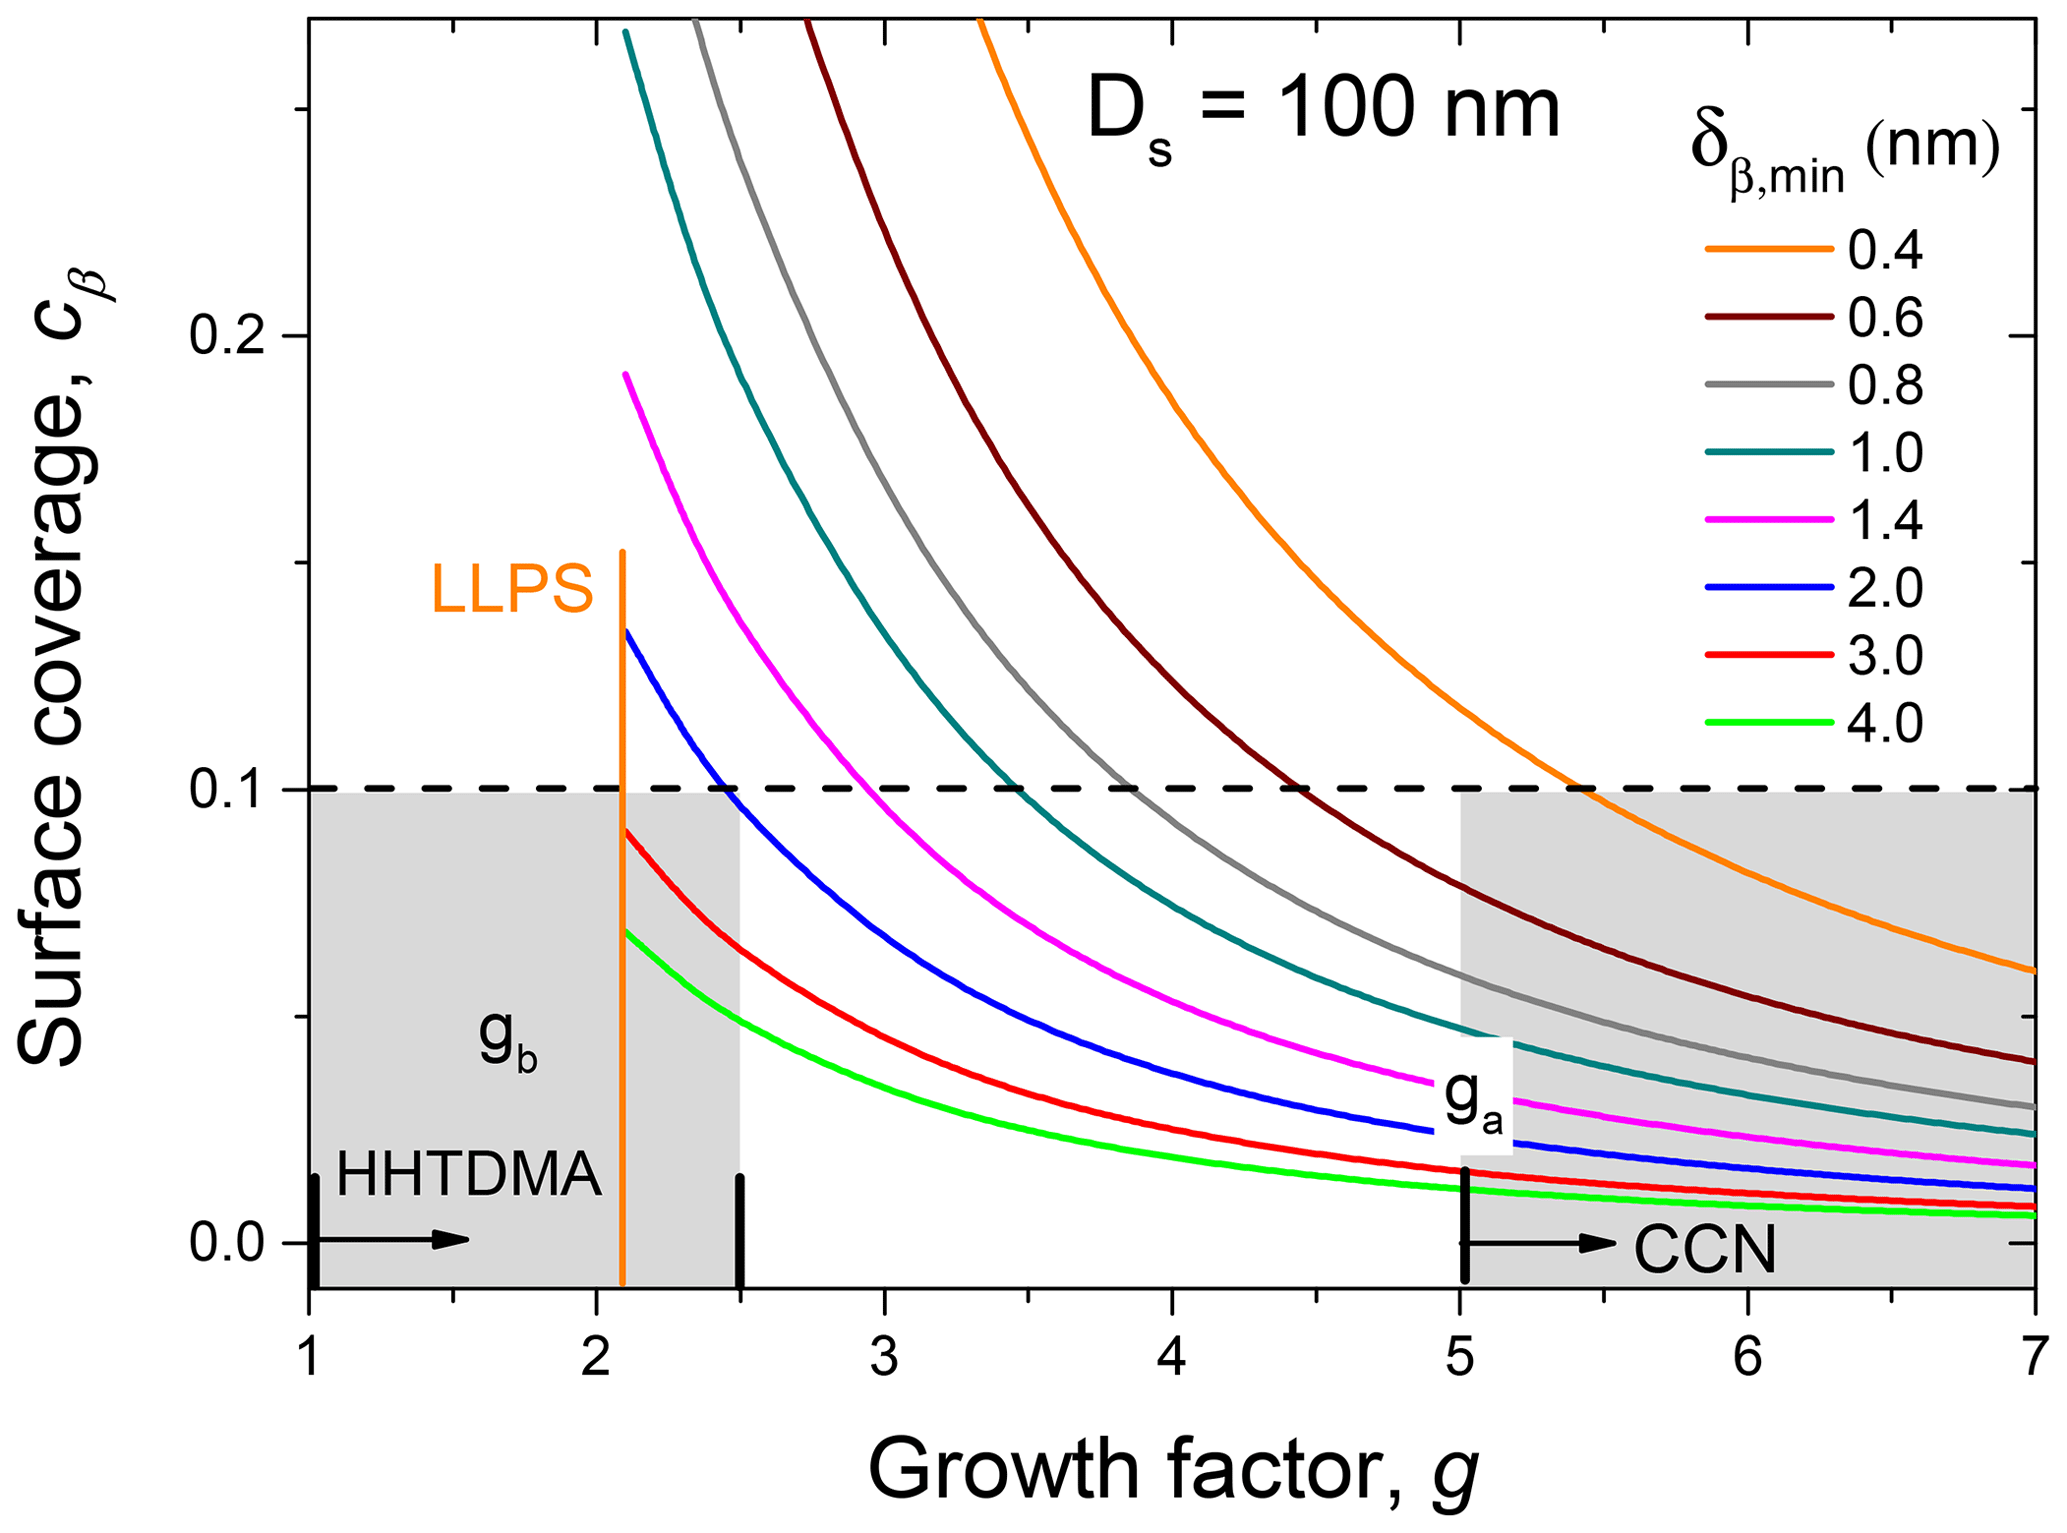
Figure 12The surface coverage, cβ, as a function of particle growth factor, with Ds=100 nm, obtained for different values of the monolayer thickness, δβ,min (colored lines). For HHTDMA and CCN measurements, Ds equals DH&D,min and Da, respectively. is the growth factor at the activation diameter; Da≈100 nm. The gray areas show the growth factor range of HHTDMA and CCN measurements. The dashed line indicates the cβ value below which σ≈σw. Both ga and gb growth factors are average values of the birch, pine, and rapeseed samples.
In our simplified calculations, protein and extractable starch molecules were chosen as the main surface-active components. Depending on polarity, hygroscopicity, concentration, and electrostatic charge, this group of biomolecules can form higher-order fibrillary, globular, and amorphous aggregates, significantly affecting the thermodynamic and kinetic properties of the surface layer (Fig. 10) (Lad et al., 2006; Jarpa-Parra et al., 2015; Zapadka et al., 2017; Trainor et al., 2017; D'Imprima et al., 2019). Moreover, some biopolymers are initially prone to forming two-dimensional aggregates at the air–water interface, making the assumption of mono/multi-layer adsorption redundant (Fainerman and Miller, 1999). In addition, other organic and inorganic species present in the SPPs may have an effect on the thermodynamic properties of the air–water interface, decreasing or increasing surface tension of the droplets (Lin and Timasheff, 1996; Fainerman et al., 1998; Kotsmar et al., 2009). Additional studies are needed to specify the effect of biomolecules on the aerosol particle hygroscopic and CCN properties, including the LLPS stage.
In this study, we have presented measurement results of hygroscopic and cloud condensation nuclei properties of biological aerosols obtained by nebulization and drying of the birch, pine, and rapeseed pollen aqueous extracts. These studies were supplemented with chemical analysis of the pollen species, as well as gravimetric and dynamic light scattering (DLS) measurements to determine the mass fraction of hydrosols and their size distributions, respectively. The analysis results suggest that the initial dry particles in the size range of 20–190 nm are a mixture of different proportions of water-soluble and water-insoluble compounds. The analyzed fraction of water-extractable biomolecules includes proteins and starch. Among the water-soluble compounds, the main ones are inorganic ions and monosaccharides. Aqueous extracts contain also a significant amount of water-insoluble species (∼50 wt %) which are mainly in the size range of 20–80 nm.
The HHTDMA studies in the H&D (restructuring) mode have shown that the DMA1 selected particles ranging 30–180 nm have a porous structure wherein the void fraction gradually increases with size, reaching ∼26 % for 180 nm birch and pine SPPs. The minimum mobility diameters obtained in H&D mode were used as a proxy of the mass-equivalent diameters of the initial dry particles.
CCN measurements revealed that the shape-corrected dry activation diameters measured at S=0.18 %–1.24 % are in the range of 137–44, 134–38, and 159–38 nm for birch, pine, and rapeseed SPPs, respectively. For all samples at high S (>0.6 %), the maximum activated fraction is generally well below one, and the heterogeneity range () is reaching up to 30 %–40 %. Both indicate a substantial fraction of CCN-inactive particles with low hygroscopicity. A weak but noticeable size-dependent variation in κ was observed, ranging from 0.13–0.18, 0.16–0.20, and 0.12–0.20, for birch, pine, and rapeseed SPPs, respectively. For all SPPs studied, the maximum κ values refer to Da=80–120 nm, and low values correspond to particles with activation diameters below and above this size range. Most likely, particles with Da<80 nm are enriched in primary non-hygroscopic colloids, while particles with Da>120 nm may contain their aggregates.
The sensitivity analysis of the CCN results has shown that the uncertainty in hygroscopicity parameter, δκ, caused by irregular particle morphology is strongly dependent on their size, increasing from 4 % to 25 % with particle size increases from 30 to 160 nm, respectively. In general, the CCN measurement results show that the SPPs at sizes exceeding 45 nm are CCN active at supersaturations less than 1 % and, therefore, can participate in the formation and modification of cloud systems.
The hygroscopic properties of SPPs with nm were investigated by the high-humidity tandem differential mobility analyzer (HHTDMA) ranging 2 %–99.5 % RH. Over the entire RH range, the water uptake of SPPs occurred gradually and reversibly, similar to the behavior of amorphous organic substances. A significant amount of absorbed water (gb>1.4) was observed at RH >95 %; with further RH increasing (RH >97 %), particles uptake more water, leading to an abrupt increase in the growth factors: approximately ∼1 % RH results in a 3-fold increase in the particle volume. Due to the solution non-ideality, the HHTDMA-derived hygroscopicity parameter, κ, exhibits a decreasing trend in the 0.6–0.95 aw range and sharp increases at aw>0.95. We suggest that the observed g(RH) and κb(aw) dependences at high RH are the result of liquid–liquid phase separation of the multicomponent SPPs. For birch, pine, and rapeseed subpollen particles, the onset RH of LLPS was estimated to be 97.7 %, 98.2 %, and 94.6 %, respectively.
A good agreement in κ was obtained between HHTDMA at RH >97 % and CCN-derived values. We believe that this closure became possible by the extended upper limit in RH of our HHTDMA system (up to 99.5 %). Discrepancy between the κ measured below and above water saturation in the organic and organic–inorganic mixed particles have been reported in several studies (Song et al., 2017a; Zhao et al., 2016; Hansen et al., 2015; Pajunoja et al., 2015; Whitehead et al., 2014; Alfarra et al., 2013; Dusek et al., 2011; Massoli et al., 2010; Good et al., 2010). Petters et al. (2006), Hodas et al. (2016), Renbaum-Wolff et al. (2016), Rastak et al. (2017), and Liu et al. (2018) suggested that such discrepancies are expected in systems that undergo LLPS at high RH. Usually, the CCN-derived κ values are compared with those obtained by the HTDMA at RH <95 %, which leads to their discrepancy, especially for the organic particles with low ratio (Song et al., 2017a). In this study, the growth factors were also measured at RH above LLPS so that both HHTDMA and CCN measurements provide the κ values of the water-rich phase, which enabled us to close the gap between the particle's hygroscopic growth and their CCN activation. The closure between HHTDMA- and CCN-derived κ was achieved when the value of σ was that of water, suggesting that above LLPS, due to large growth factors, the surface-active biomolecules are not able to fully coat the water-rich phase. Most likely, “islands” composed of 2D or 3D aggregates at the air–water interface are forming.
In conclusion, the obtained and discussed hygroscopic and CCN properties of the SPPs, including spinodal decomposition, may be common for atmospheric particles, such as natural sea-spray (Ovadnevaite et al., 2011; Estillore et al., 2017; Lee et al., 2020) and rainforest aerosols (Simoneit et al., 1990; Graham et al., 2003; Pöschl et al., 2010) as well as anthropogenic aerosols, containing a broad spectrum of biopolymers coupled with water-soluble organic and inorganic material in different proportions (Xu et al., 2020; Song et al., 2017b; Fröhlich-Nowoisky et al., 2016; Pöschl and Shiraiwa, 2015; You et al., 2014; Pöhlker et al., 2012; Schneider et al., 2011; Graber and Rudich, 2006; Zhang and Anastasio, 2003). In addition, the ability of SPPs to undergo LLPS at subsaturated conditions forming a water-rich phase may enhance post-translational modifications of the proteins induced by air pollutants (O3, NO2) and therefore reinforce their allergic potential. This information may be useful for prognostic assessments of allergic diseases such as thunderstorm asthma (Suphioglu, 1998; Pöschl and Shiraiwa, 2015; Reinmuth-Selzle et al., 2017; Beggs, 2017; Kornei, 2018; Yair et al., 2019; Hughes at al., 2020).
The data presented in this article can be accessed through the corresponding author Eugene F. Mikhailov (eugene.mikhailov@spbu.ru).
The supplement related to this article is available online at: https://doi.org/10.5194/acp-21-6999-2021-supplement.
EFM designed the study, performed the concomitant measurements, and wrote this paper. MLP, LAK, and OOK conducted the CCN measurements. KRS and JFN conducted the chemical analyses. AAK, OAI, SSV, CP, and UP contributed to the discussion of the results.
The author Ulrich Pöschl is a member of the editorial board of Atmospheric Chemistry and Physics.
This article is part of the special issue “Pan-Eurasian Experiment (PEEX) – Part II”. It is not associated with a conference.
We thank the Geomodel Research Center, Interdisciplinary Resource Center for Nanotechnology, Chemical Analysis and Materials Research Centre, and Center for Optical and Laser Methods of Matter Research at Saint Petersburg State University. We also thank Mohammed Katzia for technical support in the course of the CCN measurements.
This research has been supported by the Russian Science Foundation (grant no. 18-17-00076).
The article processing charges for this open-access publication were covered by the Max Planck Society.
This paper was edited by Maria Cristina Facchini and reviewed by Mingjin Tang and one anonymous referee.
Absolom, D. R., Van Oss, C. J., Zingg, W., and Neumann, A. W.: II. Surface tension of serum albumin, altered at the protein-air interface, Biochim. Biophys. Acta, 670, 74–78, https://doi.org/10.1016/0005-2795(81)90050-7, 1981.
Alahverdjieva, V. S., Fainerman, V. B., Aksenenko, E. V., Leser, M. E., and Miller, R.: Adsorption of hen egg-white lysozyme at the air–water interface in presence of sodium dodecyl sulphate, Colloids Surf. A Physicochem. Eng. Asp., 317, 610–617, https://doi.org/10.1016/j.colsurfa.2007.11.062, 2008.
Alfarra, M. R., Good, N., Wyche, K. P., Hamilton, J. F., Monks, P. S., Lewis, A. C., and McFiggans, G.: Water uptake is independent of the inferred composition of secondary aerosols derived from multiple biogenic VOCs, Atmos. Chem. Phys., 13, 11769–11789, https://doi.org/10.5194/acp-13-11769-2013, 2013.
Andreae, M. O. and Rosenfeld, D.: Aerosol-cloud-precipitation interactions. Part 1. The nature and sources of cloud-active aerosols, Earth-Sci. Rev., 89, 13–41, https://doi.org/10.1016/j.earscirev.2008.03.001, 2008.
Augustin, S., Wex, H., Niedermeier, D., Pummer, B., Grothe, H., Hartmann, S., Tomsche, L., Clauss, T., Voigtländer, J., Ignatius, K., and Stratmann, F.: Immersion freezing of birch pollen washing water, Atmos. Chem. Phys., 13, 10989–11003, https://doi.org/10.5194/acp-13-10989-2013, 2013.
Baker, H. G. and Baker, I.: Starch in angiosperm pollen grains and its evolutionary significance, Am. J. Bot., 66, 591–600, https://doi.org/10.1002/j.1537-2197.1979.tb06262.x, 1979.
Beggs, P. J.: Allergen aerosol from pollen-nucleated precipitation: A novel thunderstorm asthma trigger, Atmos. Environ., 152, 455–457, https://doi.org/10.1016/j.atmosenv.2016.12.045, 2017.
Bertram, A. K., Martin, S. T., Hanna, S. J., Smith, M. L., Bodsworth, A., Chen, Q., Kuwata, M., Liu, A., You, Y., and Zorn, S. R.: Predicting the relative humidities of liquid-liquid phase separation, efflorescence, and deliquescence of mixed particles of ammonium sulfate, organic material, and water using the organic-to-sulfate mass ratio of the particle and the oxygen-to-carbon elemental ratio of the organic component, Atmos. Chem. Phys., 11, 10995–11006, https://doi.org/10.5194/acp-11-10995-2011, 2011.
Biskos, G., Paulsen, D., Russell, L. M., Buseck, P. R., and Martin, S. T.: Prompt deliquescence and efflorescence of aerosol nanoparticles, Atmos. Chem. Phys., 6, 4633–4642, https://doi.org/10.5194/acp-6-4633-2006, 2006.
Brockmann, J. E. and Rader, D. J.: APS response to nonspherical particles and experimental determination of dynamic shape factor, Aerosol Sci. Technol., 13, 162–172, https://doi.org/10.1080/02786829008959434, 1990.
Chen, J.-P., Hazra, A., and Levin, Z.: Parameterizing ice nucleation rates using contact angle and activation energy derived from laboratory data, Atmos. Chem. Phys., 8, 7431–7449, https://doi.org/10.5194/acp-8-7431-2008, 2008.
Chen, L., Chen, Y., Chen, L., Gu, W., Peng, C., Luo, S., Song, W., Wang, Z., and Tang, M.: Hygroscopic properties of 11 pollen species in China, ACS Earth Space Chem., 3, 2678–2683, https://doi.org/10.1021/acsearthspacechem.9b00268, 2019.
Cheng, Y. F., Wiedensohler, A., Eichler, H., Heintzenberg, J., Tesche, M., Ansmann, A., Wendisch, M., Su, H., Althausen, D., Herrmann, H., Gnauk, T., Bruggemann, E., Hu, M., and Zhang, Y. H.: Relative humidity dependence of aerosol optical properties and direct radiative forcing in the surface boundary layer at Xinken in Pearl River Delta of China: An observation based numerical study, Atmos. Environ., 42, 6373–6397, https://doi.org/10.1016/j.atmosenv.2008.04.009, 2008.
Chichiriccò, G., Pacini, E., and Lanza, B.: Pollenkitt of some monocotyledons: lipid composition and implications for pollen germination, Plant. Biol., 21, 920–926, https://doi.org/10.1111/plb.12998, 2019.
DeCarlo, P. F., Slowik, J. G., Worsnop, D. R., Davidovits, P., and Jimenez, J. L.: Particle morphology and density characterization by combined mobility and aerodynamic diameter measurements. Part 1: Theory, Aerosol Sci. Technol., 38, 1185–1205, https://doi.org/10.1080/027868290903907, 2004.
Després, V. R., Huffman, J. A., Burrows, S. M., Hoose, C., Safatov, A. S., Buryak, G., Fröhlich-Nowoisky, J., Elbert, W., Andreae, M. O., Pöschl, U., and Jaenicke, R.: Primary biological aerosol particles in the atmosphere: a review, Tellus B, 64, 15598, https://doi.org/10.3402/tellusb.v64i0.15598, 2012.
Diehl, K., Quick, C., Matthias-Maser, S., Mitra, S. K., and Jaenicke, R.: The ice nucleating ability of pollen – Part I: Laboratory studies in deposition and condensation freezing modes, Atmos. Res., 58, 75–87, https://doi.org/10.1016/S0169-8095(01)00091-6, 2001.
Diehl, K., Matthias-Maser, S., Jaenicke, R., and Mitra, S. K.: The ice nucleating ability of pollen: Part II. Laboratory studies in immersion and contact freezing modes, Atmos. Res., 61, 125–133, https://doi.org/10.1016/s0169-8095(01)00132-6, 2002.
D'Imprima, E., Floris, D., Joppe, M., Sànchez, R., Grininger, M., and Kühlbrandt, W.: Protein denaturation at the air-water interface and how to prevent it, eLife, 8, e42747, https://doi.org/10.7554/eLife.42747.001, 2019.
Dusek, U., Frank, G. P., Massling, A., Zeromskiene, K., Iinuma, Y., Schmid, O., Helas, G., Hennig, T., Wiedensohler, A., and Andreae, M. O.: Water uptake by biomass burning aerosol at sub- and supersaturated conditions: closure studies and implications for the role of organics, Atmos. Chem. Phys., 11, 9519–9532, https://doi.org/10.5194/acp-11-9519-2011, 2011.
Erickson, H. P.: Size and Shape of Protein Molecules at the Nanometer Level Determined by Sedimentation, Gel Filtration, and Electron Microscopy, Biol. Priced. Online, 11, 32–51, https://doi.org/10.1007/s12575-009-9008-x, 2009.
Estillore, A. D., Morris, H. S., Or, V. W., Lee, H. D., Alves, M. R., Marciano, M. A., Laskina, O., Qin, Z., Tivanski, A. V., and Grassian, V. H.: Linking hygroscopicity and the surface microstructure of model inorganic salts, simple and complex carbohydrates, and authentic sea spray aerosol particles, Phys. Chem. Chem. Phys., 19, 21101–21111, https://doi.org/10.1039/C7CP04051B, 2017.
Fainerman, V. B. and Miller, R.: Equation of State for Concentrated Protein Surface Layers at the Water/Air Interface, Langmuir, 15, 1812–1816, https://doi.org/10.1021/la981180h, 1999.
Fainerman, V. B., Lucassen-Reynders, E. H., and Mller, R.: Adsorption of surfactants and proteins at fluid interfaces, Colloids Surf. B, 143, 141–165, https://doi.org/10.1016/S0927-7757(98)00585-8, 1998.
Fröhlich-Nowoisky, J., Kampf, C. J., Weber, B., Huffman, A., Pöhlker, C., Andreae, M. O., Hoor, P., Thines, E., Hoffman. T., Després, V. R., and Pöschl, U.: Bioaerosols in the Earth system: Climate, health, and ecosystem interactions, Atmos. Res., 182, 346–476, https://doi.org/10.1016/j.atmosres.2016.07.018, 2016.
Good, N., Topping, D. O., Duplissy, J., Gysel, M., Meyer, N. K., Metzger, A., Turner, S. F., Baltensperger, U., Ristovski, Z., Weingartner, E., Coe, H., and McFiggans, G.: Widening the gap between measurement and modelling of secondary organic aerosol properties?, Atmos. Chem. Phys., 10, 2577–2593, https://doi.org/10.5194/acp-10-2577-2010, 2010.
Graber, E. R. and Rudich, Y.: Atmospheric HULIS: How humic-like are they? A comprehensive and critical review, Atmos. Chem. Phys., 6, 729–753, https://doi.org/10.5194/acp-6-729-2006, 2006.
Graham, B., Guyon, P., Taylor, P. E., Artaxo, P., Maenhaut, W., Glovsky, M. M., Flagan, R. C., and Andreae, M. O.: Organic compounds present in the natural Amazonian aerosol: Characterization by gas chromatography–mass spectrometry, J. Geophys. Res., 108, 4766, https://doi.org/10.1029/2003JD003990, 2003.
Griffiths, P. T., Borlace, J. S., Gallimore, P. J., Kalberer, M., Herzog, M., and Pope, F. D.: Hygroscopic growth and cloud activation of pollen: a laboratory and modelling study, Atmos. Sci. Lett., 13, 289–295, https://doi.org/10.1002/asl.397, 2012.
Grote, M., Vrtala, S., Niederberger, V., Wiermann, R., Valenta, R., and Reichelt, R.: Release of allergen-bearing cytoplasm from hydrated pollen: A mechanism common to a variety of grass (Poaceae) species revealed by electron microscopy, J. Allergy Clin. Immunol., 108, 109–115, https://doi.org/10.1067/mai.2001.116431, 2001.
Grote, M., Valenta, R., and Reichelt, R.: Abortive pollen germination: A mechanism of allergen release in birch, alder, and hazel revealed by immunogold electron microscopy, J. Allergy Clin. Immunol., 111, 1017–1023, https://doi.org/10.1067/mai.2003.1452, 2003.
Gysel, M., Weingartner, E., Nyeki, S., Paulsen, D., Baltensperger, U., Galambos, I., and Kiss, G.: Hygroscopic properties of water-soluble matter and humic-like organics in atmospheric fine aerosol, Atmos. Chem. Phys., 4, 35–50, https://doi.org/10.5194/acp-4-35-2004, 2004.
Hänel, G.: The properties of atmospheric aerosol particles as function of relative humidity at the thermodynamic equilibrium with surrounding moist air, Adv. Geophys. 19, 73–188, https://doi.org/10.1016/S0065-2687(08)60142-9, 1976.
Hansen, A. M. K., Hong, J., Raatikainen, T., Kristensen, K., Ylisirniö, A., Virtanen, A., Petäjä, T., Glasius, M., and Prisle, N. L.: Hygroscopic properties and cloud condensation nuclei activation of limonene-derived organosulfates and their mixtures with ammonium sulfate, Atmos. Chem. Phys., 15, 14071–14089, https://doi.org/10.5194/acp-15-14071-2015, 2015.
Hodas, N., Zuend, A., Schilling, K., Berkemeier, T., Shiraiwa, M., Flagan, R. C., and Seinfeld, J. H.: Discontinuities in hygroscopic growth below and above water saturation for laboratory surrogates of oligomers in organic atmospheric aerosols, Atmos. Chem. Phys., 16, 12767–12792, https://doi.org/10.5194/acp-16-12767-2016, 2016.
Hoose, C. and Möhler, O.: Heterogeneous ice nucleation on atmospheric aerosols: a review of results from laboratory experiments, Atmos. Chem. Phys., 12, 9817–9854, https://doi.org/10.5194/acp-12-9817-2012, 2012.
Hoose, C., Kristjansson, J. E., and Burrows, S. M.: How important is biological ice nucleation in clouds on a global scale?, Environ. Res. Lett., 5, 1–7, https://doi.org/10.1088/1748-9326/5/2/024009, 2010.
Huffman, J. A., Prenni, A. J., DeMott, P. J., Pöhlker, C., Mason, R. H., Robinson, N. H., Fröhlich-Nowoisky, J., Tobo, Y., Després, V. R., Garcia, E., Gochis, D. J., Harris, E., Müller-Germann, I., Ruzene, C., Schmer, B., Sinha, B., Day, D. A., Andreae, M. O., Jimenez, J. L., Gallagher, M., Kreidenweis, S. M., Bertram, A. K., and Pöschl, U.: High concentrations of biological aerosol particles and ice nuclei during and after rain, Atmos. Chem. Phys., 13, 6151–6164, https://doi.org/10.5194/acp-13-6151-2013, 2013.
Hughes, D. D., Mampage, B. A., Jones, L. M., Liu, Z., and Stone, E. A.: Characterization of atmospheric pollen fragments during springtime thunderstorms, Environ. Sci. Technol. Lett., 7, 409–414, https://doi.org/10.1021/acs.estlett.0c00213, 2020.
Jarpa-Parra, M., Bamdad, F., Tian, Z., Zeng, H., Temelli, F., and Chen, L.: Impact of pH on molecular structure and surface properties of lentillegumin-like protein and its application as foam stabilizer, Colloids Surf. B, 132, 45–53, https://doi.org/10.1016/j.colsurfb.2015.04.065, 2015.
Koop, T., Bookhold, J., Shiraiwa, M., and Pöschl, U.: Glass transition and phase state of organic compounds: dependency on molecular properties and implications for secondary organic aerosols in the atmosphere, Phys. Chem. Chem. Phys., 13, 19238–19255, https://doi.org/10.1039/C1CP22617G, 2011.
Kornei, K.: Australian state forecasts deadly thunderstorm asthma, Science, 359, 380, https://doi.org/10.1126/science.359.6374.380, 2018.
Kotsmar, Cs., Pradines, V., Alahverdjieva, V. S., Aksenenko E.v., Fainerman, V. B., Kovalchuk, V. I., Krägel, J., Leser, M. E., Noskov, B. A., and Miller, R.: Thermodynamics, adsorption kinetics and rheology of mixed protein–surfactant interfacial layers, Adv. Colloid Interface Sci., 150, 41–54, https://doi.org/10.1016/j.cis.2009.05.002, 2009.
Kreidenweis, S. M., Koehler, K., DeMott, P. J., Prenni, A. J., Carrico, C., and Ervens, B.: Water activity and activation diameters from hygroscopicity data - Part I: Theory and application to inorganic salts, Atmos. Chem. Phys., 5, 1357–1370, https://doi.org/10.5194/acp-5-1357-2005, 2005.
Kuparinen, A., Katul, G., Nathan, R., and Schurr, F. M.: Increases in air temperature can promote wind-driven dispersal and spread of plants, P. Roy. Soc. B-Biol. Sci., 276, 3081–3087, https://doi.org/10.1098/rspb.2009.0693, 2009.
Lad, M. D., Birembout, F., Mattew, J. M., Frazier, R. A., and Green, R. J.: The adsorbed conformation of globular proteins at the air/water interface, Phys. Chem. Chem. Phys., 8, 2179–2186, https://doi.org/10.1039/b515934b, 2006.
Laurence, A. R., Thomas, A. V., Bryant, V. M., and McDonough, C.: Airborne starch granules as a potential contamination source at archaeological sites, J. Ethnobiol., 31, 213–232, https://doi.org/10.2993/0278-0771-31.2.213, 2011.
Lee, H. D., Morris, H.S., Laskina, O., Sultana, C. M., Lee, C., Jayarathne, T., Cox, J. L., Wang, X., Hasenecz, E. S., DeMott, P. J., Bertram, T. H., Cappa, C. D., Stone, E. A., Prather, K. A., Grassian, V. H., and Tivanski, A. V.: Organic enrichment, physical phase state, and surface tension depression of nascent core–shell sea spray aerosols during two phytoplankton blooms, ACS Earth Space Chem., 4, 650–660, https://doi.org/10.1021/acsearthspacechem.0c00032, 2020.
Lin, T.-Y. and Timasheff, S. N.: On the role of surface tension in the stabilization of globular proteins, Protein Sci., 5, 372–381, https://doi.org/10.1002/pro.5560050222, 1996.
Liu, F., Lakey, P. S. J., Berkmeier, T., Tong, H., Kunert, A. N., Meusel., H., Cheng, Y., Su, H., Fröhlich-Nowoisky, J., Lai, S., Weller, M. G., Shiraiwa, M., Pöschl, U., and Kampf, C. J.: Atmospheric protein chemistry influenced by anthropogenic air pollutants: nitration and oligomerization upon exposure to ozone and nitrogen dioxide, Faraday Discuss., 200, 413–427, https://doi.org/10.1039/C7FD00005G, 2017
Liu, P., Song, M., Zhao, T., Gunthe, S. S., Ham, S., He, Y., Qin, Y. M., Gong, Z., Amorim, J. C., Bertram, A. K., and Martin, S. N.: Resolving the mechanisms of hygroscopic growth and cloud condensation nuclei activity for organic particulate matter, Nat. Commun., 9, 4076, https://doi.org/10.1038/s41467-018-06622-2, 2018
Makievski, A. V., Loglio, G., Krägel, J., Miller, R., Fainerman, V. B., and Neumann, A. W.: Adsorption of protein layers at the water/air interface as studied by axisymmetric drop and bubble shape analysis, J. Chem. Phys., 103, 9557–9561, https://doi.org/10.1021/jp990775y, 1999.
Massoli, P., Lamber, A. T., Ahern, A. T., Williams, L. R., Ehn, M., Mikkilä, J., Canagaratna, M. R., Brune, W. H., Onasch, T. B., Jayne, J. T., Petäjä, T., Kulmala, M., Laaksonen, A., Kolb, C. E., Davidovits, P., and Worsnop, D. R.: Relationship between aerosol oxidation level and hygroscopic properties of laboratory generated secondary organic aerosol (SOA) particles, Geophys. Res. Lett., 37, L24801, https://doi.org/10.1029/2010GL045258, 2010.
Masuko, T., Minami, A., Iwasaki, N., Majima, T., Nishimura, S.-I., and Lee, Y. C.: Carbohydrate analysis by a phenol–sulfuric acid method in microplate format, Anal. Biochem., 339, 69–72, https://doi.org/10.1016/j.ab.2004.12.001, 2005.
McFiggans, G., Artaxo, P., Baltensperger, U., Coe, H., Facchini, M. C., Feingold, G., Fuzzi, S., Gysel, M., Laaksonen, A., Lohmann, U., Mentel, T. F., Murphy, D. M., O'Dowd, C. D., Snider, J. R., and Weingartner, E.: The effect of physical and chemical aerosol properties on warm cloud droplet activation, Atmos. Chem. Phys., 6, 2593–2649, https://doi.org/10.5194/acp-6-2593-2006, 2006.
Mikhailov, E. F. and Vlasenko, S. S.: High-humidity tandem differential mobility analyzer for accurate determination of aerosol hygroscopic growth, microstructure, and activity coefficients over a wide range of relative humidity, Atmos. Meas. Tech., 13, 2035–2056, https://doi.org/10.5194/amt-13-2035-2020, 2020.
Mikhailov, E., Vlasenko, S., Niessner, R., and Pöschl, U.: Interaction of aerosol particles composed of protein and saltswith water vapor: hygroscopic growth and microstructural rearrangement, Atmos. Chem. Phys., 4, 323–350, https://doi.org/10.5194/acp-4-323-2004, 2004.
Mikhailov, E., Vlasenko, S., Martin, S. T., Koop, T., and Pöschl, U.: Amorphous and crystalline aerosol particles interacting with water vapor: conceptual framework and experimental evidence for restructuring, phase transitions and kinetic limitations, Atmos. Chem. Phys., 9, 9491–9522, https://doi.org/10.5194/acp-9-9491-2009, 2009.
Mikhailov, E., Vlasenko, S., Rose, D., and Pöschl, U.: Mass-based hygroscopicity parameter interaction model and measurement of atmospheric aerosol water uptake, Atmos. Chem. Phys., 13, 717–740, https://doi.org/10.5194/acp-13-717-2013, 2013.
Mikhailov, E. F., Ivanova, O. A., Nebosko, E. Yu., Vlasenko, S. S., and Ryshkevich, T. I.: Subpollen particles as atmospheric cloud condensation nuclei, Izv. Atmos. Ocean Phys., 55, 357–364, https://doi.org/10.1134/S000143381904008X, 2019.
Mohanta, T. K., Khan, A., Hashem, A., Abd-Allah, E. F., and Al-Harrasi, A.: The molecular mass and isoelectric point of plant proteomes, BMC Genomics, 20, 631, https://doi.org/10.1186/s12864-019-5983-8, 2019.
Möhler, O., DeMott, P. J., Vali, G., and Levin, Z.: Microbiology and atmospheric processes: the role of biological particles in cloud physics, Biogeosciences, 4, 1059–1071, https://doi.org/10.5194/bg-4-1059-2007, 2007.
Morris, C. E., Conen, F., Huffman, J. A., Phillips, V., Pöschl, U., and Sands, D. C.: Bioprecipitation: A feedback cycle linking earth history, ecosystem dynamics and land use through biological ice nucleators in the atmosphere, Global Change Biology, 20, 341–351, https://doi.org/10.1111/gcb.12447, 2014.
O'Sullivan, D., Murray, B., Ross, J., Whale, T. F., Price, H. C., Atkinson, J. D., Umo, N. S., and Webb, M. E.: The relevance of nanoscale biological fragments for ice nucleation in clouds, Sci. Rep.-UK, 5, 8082, https://doi.org/10.1038/srep08082, 2015.
Ovadnevaite, J., Ceburnis, D., Martucci, G., Bialek, J., Monahan, C., Rinaldi, M., Facchini, M. C., Berresheim, H., Worsnop, D. R., and O'Dowd, C.: Primary marine organic aerosol: A dichotomy of low hygroscopicity and high CCN activity, 38, L21806, https://doi.org/10.1029/2011GL048869, 2011.
Ovadnevaite, J., Zuend, A., Laaksonen, A., Sanchez, K. J., Roberts, G., Ceburnis, D., Decesari, S., Rinaldi, M., Hodas, N., Facchini, M. C., Seinfeld, J. H., and O' Dowd, C.: Surface tension prevails over solute effect in organic-influenced cloud droplet activation, Nature, 546, 637–641, https://doi.org/10.1038/nature22806, 2017.
Pacini, E. and Hesse, M.: Pollenkitt – its composition, forms and functions, Flora, 200, 399–415, https://doi.org/10.1016/j.flora.2005.02.006, 2005.
Pacini, T., Franchi, G. G., and Ripaccioli, M.: Ripe pollen structure and histochemistry of some gymnosperms, Pl. Syst. Evol., 217, 81–99, https://doi.org/10.1007/BF00984923, 1999.
Pajunoja, A., Lambe, A. T., Hakala, J., Rastak, N., Cummings, M. J., Brogan, J. F., Hao, L. Q., Paramonov, M., Hong, J., Prisle, N. L., Malila, J., Romakkaniemi, S., Lehtinen, K. E. J., Laaksonen, A., Kulmala, M., Massoli, P., Onasch, T. B., Donahue, N. M., Riipinen, I., Davidovits, P., Worsnop, D. R., Petäjä, T., and Virtanen, A.: Adsorptive uptake of water by semisolid secondary organic aerosols, Geophys. Res. Lett., 42, 3063–3068, https://doi.org/10.1002/2015gl063142, 2015.
Petters, M. D. and Kreidenweis, S. M.: A single parameter representation of hygroscopic growth and cloud condensation nucleus activity, Atmos. Chem. Phys., 7, 1961–1971, https://doi.org/10.5194/acp-7-1961-2007, 2007.
Petters, M. D., Kreidenweis, S. M., Snider, J. R., Koehler, K. A., Wang, Q., Prenni, A. J., and Demott, P. J.: Cloud droplet activation of polymerized organic aerosol, Tellus B, 58, 196–205, https://doi.org/10.1111/j.1600-0889.2006.00181.x, 2006.
Petters, M. D., Wex, H., Carrico, C. M., Hallbauer, E., Massling, A., McMeeking, G. R., Poulain, L., Wu, Z., Kreidenweis, S. M., and Stratmann, F.: Towards closing the gap between hygroscopic growth and activation for secondary organic aerosol – Part 2: Theoretical approaches, Atmos. Chem. Phys., 9, 3999–4009, https://doi.org/10.5194/acp-9-3999-2009, 2009.
Piffanelli, P., Ross, J. H. E., and Murphy, D. J.: Biogenesis and function of the lipidic structures of pollen grains, Sex. Plant Reprod., 11, 65–80, https://doi.org/10.1007/s004970050122, 1998.
Pöhlker, C., Wiedemann, K. T., Sinha, B., Shiraiwa, M., Gunthe, S. S., Smith, M., Su, H., Artaxo, P., Chen, Q., Cheng, Y. F., Elbert, W., Gilles, M. K., Kilcoyne, A. L. D., Moffet, R. C., Weigand, M., Martin, S. T., Pöschl, U., and Andreae, M. O.: Biogenic potassium salt particles as seeds for secondary organic aerosol in the Amazon, Science, 337, 1075–1078, https://doi.org/10.1126/science.1223264, 2012.
Pöhlker, M. L., Pöhlker, C., Ditas, F., Klimach, T., Hrabe de Angelis, I., Araújo, A., Brito, J., Carbone, S., Cheng, Y., Chi, X., Ditz, R., Gunthe, S. S., Kesselmeier, J., Könemann, T., Lavrič, J. V., Martin, S. T., Mikhailov, E., Moran-Zuloaga, D., Rose, D., Saturno, J., Su, H., Thalman, R., Walter, D., Wang, J., Wolff, S., Barbosa, H. M. J., Artaxo, P., Andreae, M. O., and Pöschl, U.: Long-term observations of cloud condensation nuclei in the Amazon rain forest – Part 1: Aerosol size distribution, hygroscopicity, and new model parametrizations for CCN prediction, Atmos. Chem. Phys., 16, 15709–15740, https://doi.org/10.5194/acp-16-15709-2016, 2016.
Pöhlker, M. L., Ditas, F., Saturno, J., Klimach, T., Hrabě de Angelis, I., Araùjo, A. C., Brito, J., Carbone, S., Cheng, Y., Chi, X., Ditz, R., Gunthe, S. S., Holanda, B. A., Kandler, K., Kesselmeier, J., Könemann, T., Krüger, O. O., Lavrič, J. V., Martin, S. T., Mikhailov, E., Moran-Zuloaga, D., Rizzo, L. V., Rose, D., Su, H., Thalman, R., Walter, D., Wang, J., Wolff, S., Barbosa, H. M. J., Artaxo, P., Andreae, M. O., Pöschl, U., and Pöhlker, C.: Long-term observations of cloud condensation nuclei over the Amazon rain forest – Part 2: Variability and characteristics of biomass burning, long-range transport, and pristine rain forest aerosols, Atmos. Chem. Phys., 18, 10289–10331, https://doi.org/10.5194/acp-18-10289-2018, 2018.
Pope, F. D.: Pollen grains are efficient cloud condensation nuclei, Environ. Res. Lett., 5, 044015, https://doi.org/10.1088/1748-9326/5/4/044015, 2010.
Pöschl, U.: Atmospheric aerosols: composition, transformation, climate and health effects, Angew. Chem.-Int. Edit., 44, 7520–7540, https://doi.org/10.1002/anie.200501122, 2005.
Pöschl, U. and Shiraiwa, M.: Multiphase chemistry at the atmosphere–biosphere interface influencing climate and public health in the Anthropocene, Chem. Rev., 115, 4440–4475, https://doi.org/10.1021/cr500487s, 2015.
Pöschl, U., Martin, S. T., Sinha, B., Chen, Q., Gunthe, S. S., Huffman, J. A., Borrmann, S., Farmer, D. K., Garland, R. M., Helas, G., Jimenez, J. L., King, S. M., Manzi, A., Mikhailov, E., Pauliquevis, T., Petters, M. D., Prenni, A. J., Roldin, P., Rose, D., Schneider, J., Su, H., Zorn, S. R., Artaxo, P., and Andreae, M. O.: Rainforest Aerosols as Biogenic Nuclei of Clouds and Precipitation in the Amazon, Science, 329, 1513–1516, https://doi.org/10.1126/science.1191056, 2010.
Prenni, A. J., Tobo, Y., Garcia, E., DeMott, P. J., Huffman, J. A., McCluskey, C. S., Kreidenweis, S.M., Prenni, J. E., Pöhlker, C., and Pöschl, U.: The impact of rain on ice nuclei populations at a forested site in Colorado, Geophys. Res. Lett., 40, 227–231, https://doi.org/10.1029/2012GL053953, 2013.
Prisle, N. L., Lin, J. J., Purdue, S., Lin, H., Meredith, J. C., and Nenes, A.: Cloud condensation nuclei activity of six pollenkitts and the influence of their surface activity, Atmos. Chem. Phys., 19, 4741–4761, https://doi.org/10.5194/acp-19-4741-2019, 2019.
Pummer, B. G., Bauer, H., Bernardi, J., Bleicher, S., and Grothe, H.: Suspendable macromolecules are responsible for ice nucleation activity of birch and conifer pollen, Atmos. Chem. Phys., 12, 2541–2550, https://doi.org/10.5194/acp-12-2541-2012, 2012.
Rader, D. J. and McMurry, P. H.: Application of the Tandem Differential Mobility Analyzer to studies of droplet growth and evaporation, J. Aerosol Sci., 17, 771–788, https://doi.org/10.1016/0021-8502(86)90031-5, 1986.
Rastak, N., Silvergren, S., Zieger, P., Wideqvist, U., Ström, J., Svenningsson, B., Maturilli, M., Tesche, M., Ekman, A. M. L., Tunved, P., and Riipinen, I.: Seasonal variation of aerosol water uptake and its impact on the direct radiative effect at Ny-Ålesund, Svalbard, Atmos. Chem. Phys., 14, 7445–7460, https://doi.org/10.5194/acp-14-7445-2014, 2014.
Rastak, N., Pajunoja, A., Navarro, J. C. A., Ma, J., Song, M., Partridge, D. G., Kirkevag, A., Leong, Y., Hu, W. W., Taylor, N. F., Lambe, A., Cerully, K., Bougiatioti, A., Liu, P., Krejci, R., Petaja, T., Percival, C., Davidovits, P., Worsnop, D. R., Ekman, A. M. L., Nenes, A., Martin, S., Jimenez, J. L., Collins, D. R., Topping, D. O., Bertram, A. K., Zuend, A., Virtanen, A., and Riipinen, I.: Microphysical explanation of the RH-dependent water affinity of biogenic organic aerosol and its importance for climate, Geophys. Res. Lett., 44, 5167–5177, https://doi.org/10.1002/2017gl073056, 2017.
Reinmuth-Selzle, K., Ackaert, C., Kampf, C. J., Samonig, M., Shiraiwa, M., Kofler, S., Yang, H., Gadermaier, G., Brandstetter, H., Huber, C. G., Duschl, A., Oostingh, G. J., and Pöschl, U.: Nitration of the birch pollen allergen Bet v 1.0101: Efficiency and site-selectivity of liquid and gaseous nitrating agents, J. Proteome Res., 13, 1570–1577, https://doi.org/10.1021/pr401078h, 2014.
Reinmuth-Selzle, K., Kampf, C. J., Lucas, K., Lang-Yona, N., Fröhlich-Nowoisky, J., Shiraiwa, M., Lakey, P. S. J., Lai, S., Liu, F., Kunert, A. T., Ziegler, K., Shen, F., Sgarbanti, R., Weber, B., Bellinghausen, I., Saloga, J., Weller, M. G., Duschl, A., Schuppan, D., and Pöschl, U.: Air pollution and climate change effects on allergies in the anthropocene: Abundance, interaction, and modification of allergens and adjuvants, Environ. Sci. Technol., 51, 4119–4141, https://doi.org/10.1021/acs.est.6b04908, 2017.
Renbaum-Wolff, L., Song, M., Marcolli, C., Zhang, Y., Liu, P. F., Grayson, J. W., Geiger, F. M., Martin, S. T., and Bertram, A. K.: Observations and implications of liquid–liquid phase separation at high relative humidities in secondary organic material produced by α-pinene ozonolysis without inorganic salts, Atmos. Chem. Phys., 16, 7969–7979, https://doi.org/10.5194/acp-16-7969-2016, 2016.
Rose, D., Gunthe, S. S., Mikhailov, E., Frank, G. P., Dusek, U., Andreae, M. O., and Pöschl, U.: Calibration and measurement uncertainties of a continuous-flow cloud condensation nuclei counter (DMT-CCNC): CCN activation of ammonium sulfate and sodium chloride aerosol particles in theory and experiment, Atmos. Chem. Phys., 8, 1153–1179, https://doi.org/10.5194/acp-8-1153-2008, 2008.
Rose, D., Nowak, A., Achtert, P., Wiedensohler, A., Hu, M., Shao, M., Zhang, Y., Andreae, M. O., and Pöschl, U.: Cloud condensation nuclei in polluted air and biomass burning smoke near the mega-city Guangzhou, China – Part 1: Size-resolved measurements and implications for the modeling of aerosol particle hygroscopicity and CCN activity, Atmos. Chem. Phys., 10, 3365–3383, https://doi.org/10.5194/acp-10-3365-2010, 2010.
Roulston, T. H., Cane, J. H., and Buchman, S. L.: What governs protein content of pollen: pollinator preferences, pollen–pistil interactions, or phylogeny?, Ecol. Monogr., 70, 617–643, https://doi.org/10.1890/0012-9615(2000)070[0617:WGPCOP]2.0.CO;2, 2000.
Ruehl, C. R., Davies, J. F., and Wilson, K. R.: An interfacial mechanism for cloud droplet formation on organic aerosols, Science, 351, 1447–1450, https://doi.org/10.1126/science.aad4889, 2016.
Schneider, J., Freutel, F., Zorn, S. R., Chen, Q., Farmer, D. K., Jimenez, J. L., Martin, S. T., Artaxo, P., Wiedensohler, A., and Borrmann, S.: Mass-spectrometric identification of primary biological particle markers and application to pristine submicron aerosol measurements in Amazonia, Atmos. Chem. Phys., 11, 11415–11429, https://doi.org/10.5194/acp-11-11415-2011, 2011.
Shiraiwa, M., Ammann, M., Koop., T., and Pöschl, U.: Gas uptake and chemical aging of semisolid organic aerosol particles, P. Natl. Acad. Sci. USA, 108, 11002–11008, 2011.
Simoneit, B. R., Cardoso, J. N., and Robinson, N.: An assessment of the origin and composition of higher molecular weight organic matter in aerosols over Amazonia, Chemosphere, 21, 1285–1301, https://doi.org/10.1016/0045-6535(90)90145-J, 1990.
Sofiev, M., Siljamo, P., Ranta, H., and Rantio-Lehtimaki, A.: Towards numerical forecasting of long-range air transport of birch pollen: theoretical considerations and a feasibility study, Int. J. Biometeorol., 50, 392–402, https://doi.org/10.1007/s00484-006-0027-x, 2006.
Song, M., Marcolli, C., Krieger, U. K., Zuend, A., and Peter, T.: Liquid-liquid phase separation and morphology of internally mixed dicarboxylic acids/ammonium sulfate/water particles, Atmos. Chem. Phys., 12, 2691–2712, https://doi.org/10.5194/acp-12-2691-2012, 2012.
Song, M., Liu, P., Martin, S. T., and Bertram, A. K.: Liquid–liquid phase separation in particles containing secondary organic material free of inorganic salts, Atmos. Chem. Phys., 17, 11261–11271, https://doi.org/10.5194/acp-17-11261-2017, 2017a.
Song, T., Wang, S., Zhang, Y., Song, J., Liu, F., Fu, P., Shiraiwa, M., Xie, Z., Yue, D., Zhong, L., Zheng, J., and Lai, S.: Proteins and amino acids in fine particulate matter in rural Guangzhou, Southern China: seasonal cycles, sources, and atmospheric processes, Environ. Sci. Technol., 51, 6773–6781, https://doi.org/10.1021/acs.est.7b00987, 2017b.
Stanley, R. G. and Linskens, H. F.: Pollen: Biology, Biochemistry and Management, Springer, Berlin, Heidelberg, 307 pp., 1974.
Steiner, A. L., Brooks, S. D., Deng, C., Thornton, D. C. O., Pendleton, M. W., and Bryant, V.: Pollen as atmospheric cloud condensation nuclei. Geophys. Res. Lett., 42, 3596–3602, https://doi.org/10.1002/2015GL064060, 2015.
Suphioglu, C.: Thunderstorm asthma due to grass pollen, Int. Arch. Allergy Immunol., 116, 253–260, https://doi.org/10.1159/000023953, 1998.
Swietlicki, E., Hansson, H.-C., Hämeri, K., Svenningsson, B., Massling, A., McFiggans, G., McMurry, P. H., Petäjä, T., Tunved, P., Gysel, M., Topping, D., Weingartner, E., Baltensperger, U., Rissler, J., Wiedensohler, A., and Kulmala, M.: Hygroscopic properties of submicrometer atmospheric aerosol particles measured with H-TDMA instruments in various environments – a review, Tellus, 60B, 432–469, https://doi.org/10.1111/j.1600-0889.2008.00350.x, 2008.
Tang, M., Gu, W., Ma, Q., Li, Y. J., Zhong, C., Li, S., Yin, X., Huang, R.-J., He, H., and Wang, X.: Water adsorption and hygroscopic growth of six anemophilous pollen species: the effect of temperature, Atmos. Chem. Phys., 19, 2247–2258, https://doi.org/10.5194/acp-19-2247-2019, 2019.
Taylor, P. E.: Thunderstorm Asthma, Curr. Allergy Asthma Rep., 4, 409–413, https://doi.org/10.1007/s11882-004-0092-3, 2004.
Taylor, P. E., Flagan, R., Valenta, R., and Glovsky, M. M.: Release of allergens in respirable aerosols: A link between grass pollen and asthma, J. Allergy Clin. Immunol., 109, 51–56, https://doi.org/10.1067/mai.2002.120759, 2002.
Trainor K., Broom, A., and Meiering, E. M.: Exploring the relationships between protein sequence, structure and solubility, Curr. Opin. Struct. Biol., 42, 136–146, https://doi.org/10.1016/j.sbi.2017.01.004, 2017.
Visez, N., Chassard, G., Azarkan, N., Naas, O., Sénéchal, H., Sutra, J.-P., Poncet, P., and Choël, M.: Wind-induced mechanical rupture of birch pollen: Potential implications for allergen dispersal, J. Aerosol Sci., 89, 77–84, https://doi.org/10.1016/j.jaerosci.2015.07.005, 2015.
von Blohn, N., Mitra, S. K., Diehl, K., and Borrmann, S.: The ice nucleating ability of pollen: Part III: New laboratory studies in immersion and contact freezing modes including more pollen types, Atmos. Res., 78, 182–189, https://doi.org/10.1016/j.atmosres.2005.03.008, 2005.
Whitehead, J. D., Irwin, M., Allan, J. D., Good, N., and McFiggans, G.: A meta-analysis of particle water uptake reconciliation studies, Atmos. Chem. Phys., 14, 11833–11841, https://doi.org/10.5194/acp-14-11833-2014, 2014.
Williams, C. G. and Després, V.: Northern Hemisphere forests at temperate and boreal latitudes are substantial pollen contributors to atmospheric bioaerosols, For. Ecol. Manag., 401, 197–191, https://doi.org/10.1016/j.foreco.2017.06.040, 2017.
Wozniak, M. C., Solmon, F., and Steiner, A. L.: Pollen rupture and its impact on precipitation in clean continental conditions. Geophys. Res. Lett., 45, 7156–7164, https://doi.org/10.1029/2018GL077692, 2018.
Xu, Y., Xiao, H., Wu, D., and Long, C.: Abiotic and Biological Degradation of Atmospheric Proteinaceous Matter Can Contribute Significantly to Dissolved Amino Acids in Wet Deposition, Environ. Sci. Technol., 54, 6551–6561, https://doi.org/10.1021/acs.est.0c00421, 2020.
Yair, Y., Yair, Y., Rubin, B., Confino-Cohen, R., Rosman, Y., Shachar, E., and Rottem, M.: First reported case of thunderstorm asthma in Israel, Nat. Hazards Earth Syst. Sci., 19, 2715–2725, https://doi.org/10.5194/nhess-19-2715-2019, 2019.
You, Y., Smith, M. L., Song, M., Martin, S. T., and Bertram, A. K.: Liquid–liquid phase separation in atmospherically relevant particles consisting of organic species and inorganic salts, Int. Rev. Phys. Chem., 33, 43–77, https://doi.org/10.1080/0144235X.2014.890786, 2014.
Zapadka, K. L., Becher, F. J., Comes dos Santos, A. L., and Jackson S. E.: Factors affecting the physical stability (aggregation) of peptide therapeutics, Interface Focus, 7, 20170030, https://doi.org/10.1098/rsfs.2017.0030, 2017.
Zhang, Q. and Anastasio, C.: Free and combined amino compounds in atmospheric fine particles (PM2.5) and fog waters from Northern California, 37, 2247–2258, https://doi.org/10.1016/S1352-2310(03)00127-4, 2003.
Zhao, D. F., Buchholz, A., Kortner, B., Schlag, P., Rubach, F., Fuchs, H., Kiendler-Scharr, A., Tillmann, R., Wahner, A., Watne, Å. K., Hallquist, M., Flores, J. M., Rudich, Y., Kristensen, K., Hansen, A. M. K., Glasius, M., Kourtchev, I., Kalberer, M., and Mentel, Th. F.: Cloud condensation nuclei activity, droplet growth kinetics, and hygroscopicity of biogenic and anthropogenic secondary organic aerosol (SOA), Atmos. Chem. Phys., 16, 1105–1121, https://doi.org/10.5194/acp-16-1105-2016, 2016.
Zieger, P., Fierz-Schmidhauser, R., Weingartner, E., and Baltensperger, U.: Effects of relative humidity on aerosol light scattering: results from different European sites, Atmos. Chem. Phys., 13, 10609–10631, https://doi.org/10.5194/acp-13-10609-2013, 2013.
Zuend, A. and Seinfeld, J. H.: Modeling the gas-particle partitioning of secondary organic aerosol: the importance of liquid-liquid phase separation, Atmos. Chem. Phys., 12, 3857–3882, https://doi.org/10.5194/acp-12-3857-2012, 2012.