the Creative Commons Attribution 4.0 License.
the Creative Commons Attribution 4.0 License.
 | 07 May 2021
Robust winter warming over Eurasia under stratospheric sulfate geoengineering – the role of stratospheric dynamics
Antara Banerjee
Amy H. Butler
Lorenzo M. Polvani
Alan Robock
Isla R. Simpson
Lantao Sun
It has been suggested that increased stratospheric sulfate aerosol loadings following large, low latitude volcanic eruptions can lead to wintertime warming over Eurasia through dynamical stratosphere–troposphere coupling. We here investigate the proposed connection in the context of hypothetical future stratospheric sulfate geoengineering in the Geoengineering Large Ensemble simulations. In those geoengineering simulations, we find that stratospheric circulation anomalies that resemble the positive phase of the Northern Annular Mode in winter are a distinguishing climate response which is absent when increasing greenhouse gases alone are prescribed. This stratospheric dynamical response projects onto the positive phase of the North Atlantic Oscillation, leading to associated side effects of this climate intervention strategy, such as continental Eurasian warming and precipitation changes. Seasonality is a key signature of the dynamically driven surface response. We find an opposite response of the North Atlantic Oscillation in summer, when no dynamical role of the stratosphere is expected. The robustness of the wintertime forced response stands in contrast to previously proposed volcanic responses.
- Article
(6565 KB) - Full-text XML
-
Supplement
(4566 KB) - BibTeX
- EndNote


Mitigation of greenhouse gas emissions remains of utmost importance in counteracting anthropogenic climate change. However, given the challenges of meeting temperature targets such as 1.5 or 2 ∘C above preindustrial levels under current commitments to the Paris Agreement (Rogelj et al., 2016), methods of climate intervention – or geoengineering – are increasingly gaining attention as potential means to supplement, albeit not replace, climate mitigation and adaptation strategies (National Research Council, 2015). Albedo modification, also known as solar radiation management, describes one set of approaches which proposes to cool the planet by reflecting sunlight to space. Among these approaches, confidence is highest in stratospheric sulfate injections resulting in a net negative radiative forcing and, consequently, a cooling of the planet (Crutzen, 2006; MacMartin et al., 2018) through the scattering effect of sulfate aerosols. Compelling observational evidence for the global cooling effects of stratospheric sulfate aerosol is offered by large, low latitude volcanic eruptions which, to some extent, provide a natural analog for sulfate geoengineering. For example, the widely observed eruption of Mount Pinatubo in June 1991 injected around 18 Tg SO2 into the stratosphere (Guo et al., 2004) and reduced global and annual average surface temperatures by 0.5 ∘C for 2 years following the eruption (Soden et al., 2002), while other large, explosive eruptions of the past century reduced global average temperatures by 0.1–0.2 ∘C (Robock and Mao, 1994). A key limitation of the analogy to geoengineering is the transient nature of volcanic perturbations compared to the hypothetically continuous deployment of sulfate geoengineering (Duan et al., 2019; Robock et al., 2008, 2013). Differences between the impacts of volcanic eruptions and sulfate geoengineering could also arise from the choice of material injected in the latter (sulfur dioxide, SO2, versus sulfate directly) and the choice of injection locations, both of which could result in different aerosol distributions. In addition, geoengineering would be applied within a background atmosphere that contains higher greenhouse gas concentrations than were present at the time of historic volcanic analogs.
Despite these limitations, volcanic eruptions might provide some insight into the potential side effects of sulfate geoengineering of which we remain poorly informed (Robock et al., 2013). Of interest in this study is the suggestion that low latitude volcanic eruptions cause warming over the Northern Hemisphere (NH) continents, specifically Eurasia, in the first or second winters following the eruption (Fischer et al., 2007; Robock, 2002; Robock and Mao, 1992; Shindell et al., 2004; Zambri and Robock, 2016). The proposed mechanism for the surface warming essentially involves dynamical coupling of the stratosphere and troposphere (Graf et al., 1993, 2007; Kodera, 1994; Robock and Mao, 1992). Injection of volcanic SO2 into the tropical lower stratosphere leads to the formation of sulfate aerosols. These aerosols can be globally dispersed via the stratospheric circulation and are strong scatterers of shortwave radiation, causing global cooling of the troposphere. In addition, the aerosols locally warm the tropical lower stratosphere primarily through the absorption of longwave radiation. A variety of mechanisms for stratosphere–troposphere coupling, following diabatic heating of the tropical lower stratosphere such as that resulting from volcanic aerosols, have been proposed. In thermal wind balance with tropical lower stratospheric warming, the extratropical stratospheric westerly mean flow strengthens, and this is accompanied by altered stratospheric wave driving and residual mean circulation anomalies due to balanced flow constraints (Haynes et al., 1991). The mechanism for linking temperature or wind anomalies in the lowermost stratosphere to the tropospheric jet stream and surface weather is less clear (Kidston et al., 2015) but likely involves tropospheric eddy feedbacks with both planetary- and synoptic-scale waves, as well as potentially a direct influence of altered meridional circulation accompanying anomalies in stratospheric wave driving (Domeisen et al., 2013; Hitchcock and Simpson, 2016; Kushner and Polvani, 2004; Polvani and Kushner, 2002; Simpson et al., 2009; Song and Robinson, 2004; Wittman et al., 2007). A strengthened polar vortex is typically associated with a tropospheric circulation pattern that projects onto the positive phase of the Arctic Oscillation (AO) and the North Atlantic Oscillation (NAO), which is its regional manifestation (e.g., Baldwin and Dunkerton, 2001; Hitchcock and Simpson, 2014).
However, the detectability of a volcanically forced response at the extratropical surface has recently been disputed by Polvani et al. (2019). That study separated the effects of external forcing from internal variability using ensembles of simulations from the Community Earth System Model containing the Whole Atmosphere Community Climate Model (CESM-WACCM), CESM containing the Community Atmosphere Model (CESM-CAM5) and the Canadian Earth System Model (CanESM2). They concluded that the Eurasian winter warming following the 1991 eruption of Mount Pinatubo, which averaged around 1 ∘C, was largely a result of internal variability. Polvani and Camargo (2020) reach the same conclusion for the 1883 Krakatau eruption. These studies do not deny the theoretical existence of the sulfate-aerosol-forced stratosphere–troposphere coupling mechanism, only that a forcing much larger than the one from those (already large) volcanic eruptions would be needed to cause a detectable surface warming over internal variability. Or, alternatively, the impacts of a comparable magnitude forcing would have to be present for longer to allow the influence to be seen over internal variability. This suggestion provides the following motivation for our study: do large, continuous sulfate-forcing geoengineering scenarios force significant warming effects on the wintertime surface temperature over Eurasia through stratosphere–troposphere dynamical coupling?
Here, we investigate this question using the Geoengineering Large Ensemble (GLENS) simulations (Tilmes et al., 2018a). In those simulations, SO2 is injected into the tropical and subtropical lower stratosphere in an attempt to stabilize the following three surface temperature metrics: the global mean temperature, the interhemispheric temperature gradient and the Equator-to-pole temperature gradient over the course of the 21st century. A robust strengthening of the stratospheric polar jets has indeed been found under sulfate geoengineering scenarios (Ferraro et al., 2015; Richter et al., 2018; Tilmes et al., 2018b), and the GLENS simulations do show warmer winters over several high latitude locations by the end of the century (2075–2095 average) relative to a baseline with no artificial SO2 injections (2010–2030 average; Jiang et al., 2019). Our aim here is to link these two aspects of the geoengineering response. The contribution of stratospheric dynamics to a dampened seasonal cycle in temperatures, in addition to seasonal insolation variations, has been suggested by Jiang et al. (2019). We here explore in more depth the existence of a stratosphere–troposphere dynamical coupling pathway and quantify its relevance for near-surface patterns of variability, temperature and hydrology over the North Atlantic and Eurasia. As for the recent assessment of the undetectable forced response to volcanic eruptions (Polvani et al., 2019; Polvani and Camargo, 2020), the GLENS single model ensemble approach allows for a clean determination of the forced response against a backdrop of internal variability.
2.1 Simulations
The simulations used here were performed with the Community Earth System Model version 1 (CESM1), containing atmosphere, ocean, sea ice and land components. We briefly describe the atmospheric component of the model, WACCM (Mills et al., 2017). The WACCM resolution is 0.9∘ (latitude) by 1.25∘ (longitude), with 70 vertical levels up to a model top of 140 km. The model comprehensively represents stratospheric processes. The inclusion of interactive chemistry is one key improvement upon previous generations of models used to study sulfate geoengineering (e.g., Ferraro et al., 2015). Feedbacks from changing ozone concentrations have significant effects on the large-scale stratospheric circulation, especially on the quasi-biennial oscillation, in the geoengineering scenario of this study (Richter et al., 2017), and it has been shown that these feedbacks can considerably reduce the midlatitude jet shift response to increased CO2 (Chiodo and Polvani, 2017, 2019). Interactive chemistry is also important for sulfate aerosol concentrations, which are prognostically determined by oxidation of SO2 by OH to H2SO4 and subsequent microphysics within a modal aerosol scheme, the Modal Aerosol Module (MAM3; Mills et al., 2017). The simulated perturbation to radiative forcing following the eruption of Mount Pinatubo compares well to observed estimates, providing validation for the model's radiative effects of sulfate aerosol (Mills et al., 2017).
We analyze the GLENS simulations, which are fully described by Tilmes et al. (2018a). We consider three scenarios, all of which were performed under the following Representative Concentration Pathway 8.5 (RCP8.5) emissions scenario for greenhouse gases: (i) Base – 20 ensemble members performed between 2010–2030; (ii) RCP8.5 – three members of Base that were extended out to 2097; and (iii) GEO8.5 – 20 ensemble members with added stratospheric geoengineering performed between 2020–2099, which were branched off from the 20 Base members; this experiment is named “Geoengineering” in Tilmes et al. (2018a) and “GLENS” in a few other studies (e.g., Jiang et al., 2019; Simpson et al., 2019).
Geoengineering in the GEO8.5 runs is implemented as SO2 injections at four locations (15∘ N and 15∘ S at 25 km and 30∘ N and 30∘ S at 22.8 km, at 180∘ longitude). A primary aim of the experimental design was to limit the side effects of geoengineering. To this end, the GEO8.5 simulations aimed to maintain three annual mean surface temperature metrics at 2020 levels – the global mean temperature, the interhemispheric temperature gradient and the Equator-to-pole temperature gradient – using a feedback algorithm that annually adjusted SO2 injection amounts (Kravitz et al., 2017). By the end of the GEO8.5 simulations, the total SO2 injection rate is 52 Tg yr−1, which is around five times the one-time injection used for WACCM simulations of the Mount Pinatubo eruption. The ensemble approach is a strength of these geoengineering simulations, which allows us to separate the forced geoengineering response (given by ensemble means) from the noise due to internal variability (determined from the spread across ensemble members; Deser et al., 2012).
To supplement GEO8.5, we analyze an additional set of simulations, namely the GEOHEAT_S runs described in Simpson et al. (2019), which we label GEOHEAT for simplicity. These aim to isolate the impact of stratospheric heating by the additional sulfate aerosols present in the GEO8.5 simulations from other factors, such as the longwave effects of increasing greenhouse gases and the shortwave effects of sulfate aerosols. The GEOHEAT runs were performed under Base conditions (average radiative forcing over 2010–2030) but with additional stratospheric heating rates derived from the last 20 years (2075–2095) of the GEO8.5 simulations. The GEOHEAT ensemble contains four members, each with a 20 year length1. Essentially, the GEOHEAT response relative to Base will be compared to trends within GEO8.5, as described in the next subsection, in order to identify which GEO8.5 trends ultimately arise from stratospheric heating by the additional sulfate aerosols.
2.2 Trends and indices of dynamical variability
We compare trends within the RCP8.5, GEO8.5 and GEOHEAT simulations in order to apply regression methods which elucidate the coupling between stratospheric and tropospheric climate responses. Linear trends are appropriate since the climate responses under sulfate geoengineering analyzed here are approximately linear in time and in SO2 injection rate, as noted in previous studies for temperature (global mean) and precipitation (Simpson et al., 2019; Tilmes et al., 2018a). There are some exceptions such as drying over the Mediterranean in winter, which mostly occurs later in the simulations (Simpson et al., 2019). Fields are seasonally averaged before trends are computed. We primarily analyze the NH wintertime (December–February; DJF) and, for comparison, the NH summertime (June–August; JJA). Trends within RCP8.5 and GEO8.5 are taken for the 75-year period between 2020 and 2095. For GEOHEAT, its difference with the Base climatology gives the 65-year response between average 2020 and 2085 conditions. An equivalent trend is calculated by dividing this response by 65 for comparison with RCP8.5 and GEO8.5 trends. In all cases, trends are shown per 30 years.
We compute the following two indices of NH variability:
-
The Northern Annular Mode (NAM) is used to quantify stratosphere–troposphere coupling. We adopt its common definition as the leading empirical orthogonal function (EOF) of geopotential height anomalies (Baldwin and Thompson, 2009; Gerber et al., 2010). The EOF is computed within Base, with concatenated geopotential height fields (20 years in 20 runs) in order to give the best available representation of model variability. The calculation is then performed independently at each pressure level as follows: the global mean is removed, the monthly mean climatology is removed, the seasonal average is taken over DJF and the EOF pattern is calculated over the region 20–90∘ N using a square root of cos (latitude) weighting. We next perform a projection onto the leading EOF in each GEO8.5 simulation. Again, the global mean is removed, the Base monthly mean climatology is removed and the seasonal average is taken over DJF. The principal component (PC) time series is calculated by projecting these anomalies onto the leading EOF and standardizing with the corresponding Base PC standard deviation. We select the NAM at 50 hPa (NAM50), which is a common lower stratospheric metric for investigating stratosphere–troposphere coupling.
-
The North Atlantic Oscillation (NAO) is used to diagnose atmospheric circulation changes over the North Atlantic. The NAO index is computed over the North Atlantic region of 20–80∘ N, 90∘ W–40∘ E in the following two ways: (a) from the leading EOF of sea level pressure (SLP) anomalies to show its surface behavior and (b) from the leading EOF of zonal mean zonal wind anomalies at each pressure level over the North Atlantic region to diagnose stratosphere–troposphere coupling. Other details of the calculation are the same as for the NAM, with the exception that the global mean is not removed from the raw fields.
3.1 Surface air temperature and precipitation responses
The main goal of this paper is to explain the forced wintertime warming trends over Eurasia, Greenland and the North Atlantic which are simulated under sulfate geoengineering over the period between 2020–2095, as shown in Fig. 1a. This winter warming is found despite stabilization of the annual mean Equator-to-pole surface temperature gradient by the feedback control algorithm and contributes to a dampened seasonal cycle in temperature (Jiang et al., 2019). Continental warming is largely absent in summer (Fig. 1b) – this seasonality by itself suggests a dynamical influence of the stratosphere in winter. Furthermore, we show, in Fig. 1d, a distinct dipole response in Eurasian precipitation under geoengineering. There is statistically significant drying over the Mediterranean and southern Europe and wetting to the north over Scandinavia and above 50∘ N in the North Atlantic (Fig. 1d; see also Simpson et al., 2019). Precipitation trends in summer are reversed over Eurasia relative to winter (Fig. 1e), which is again suggestive of a stratospheric dynamical influence in winter.
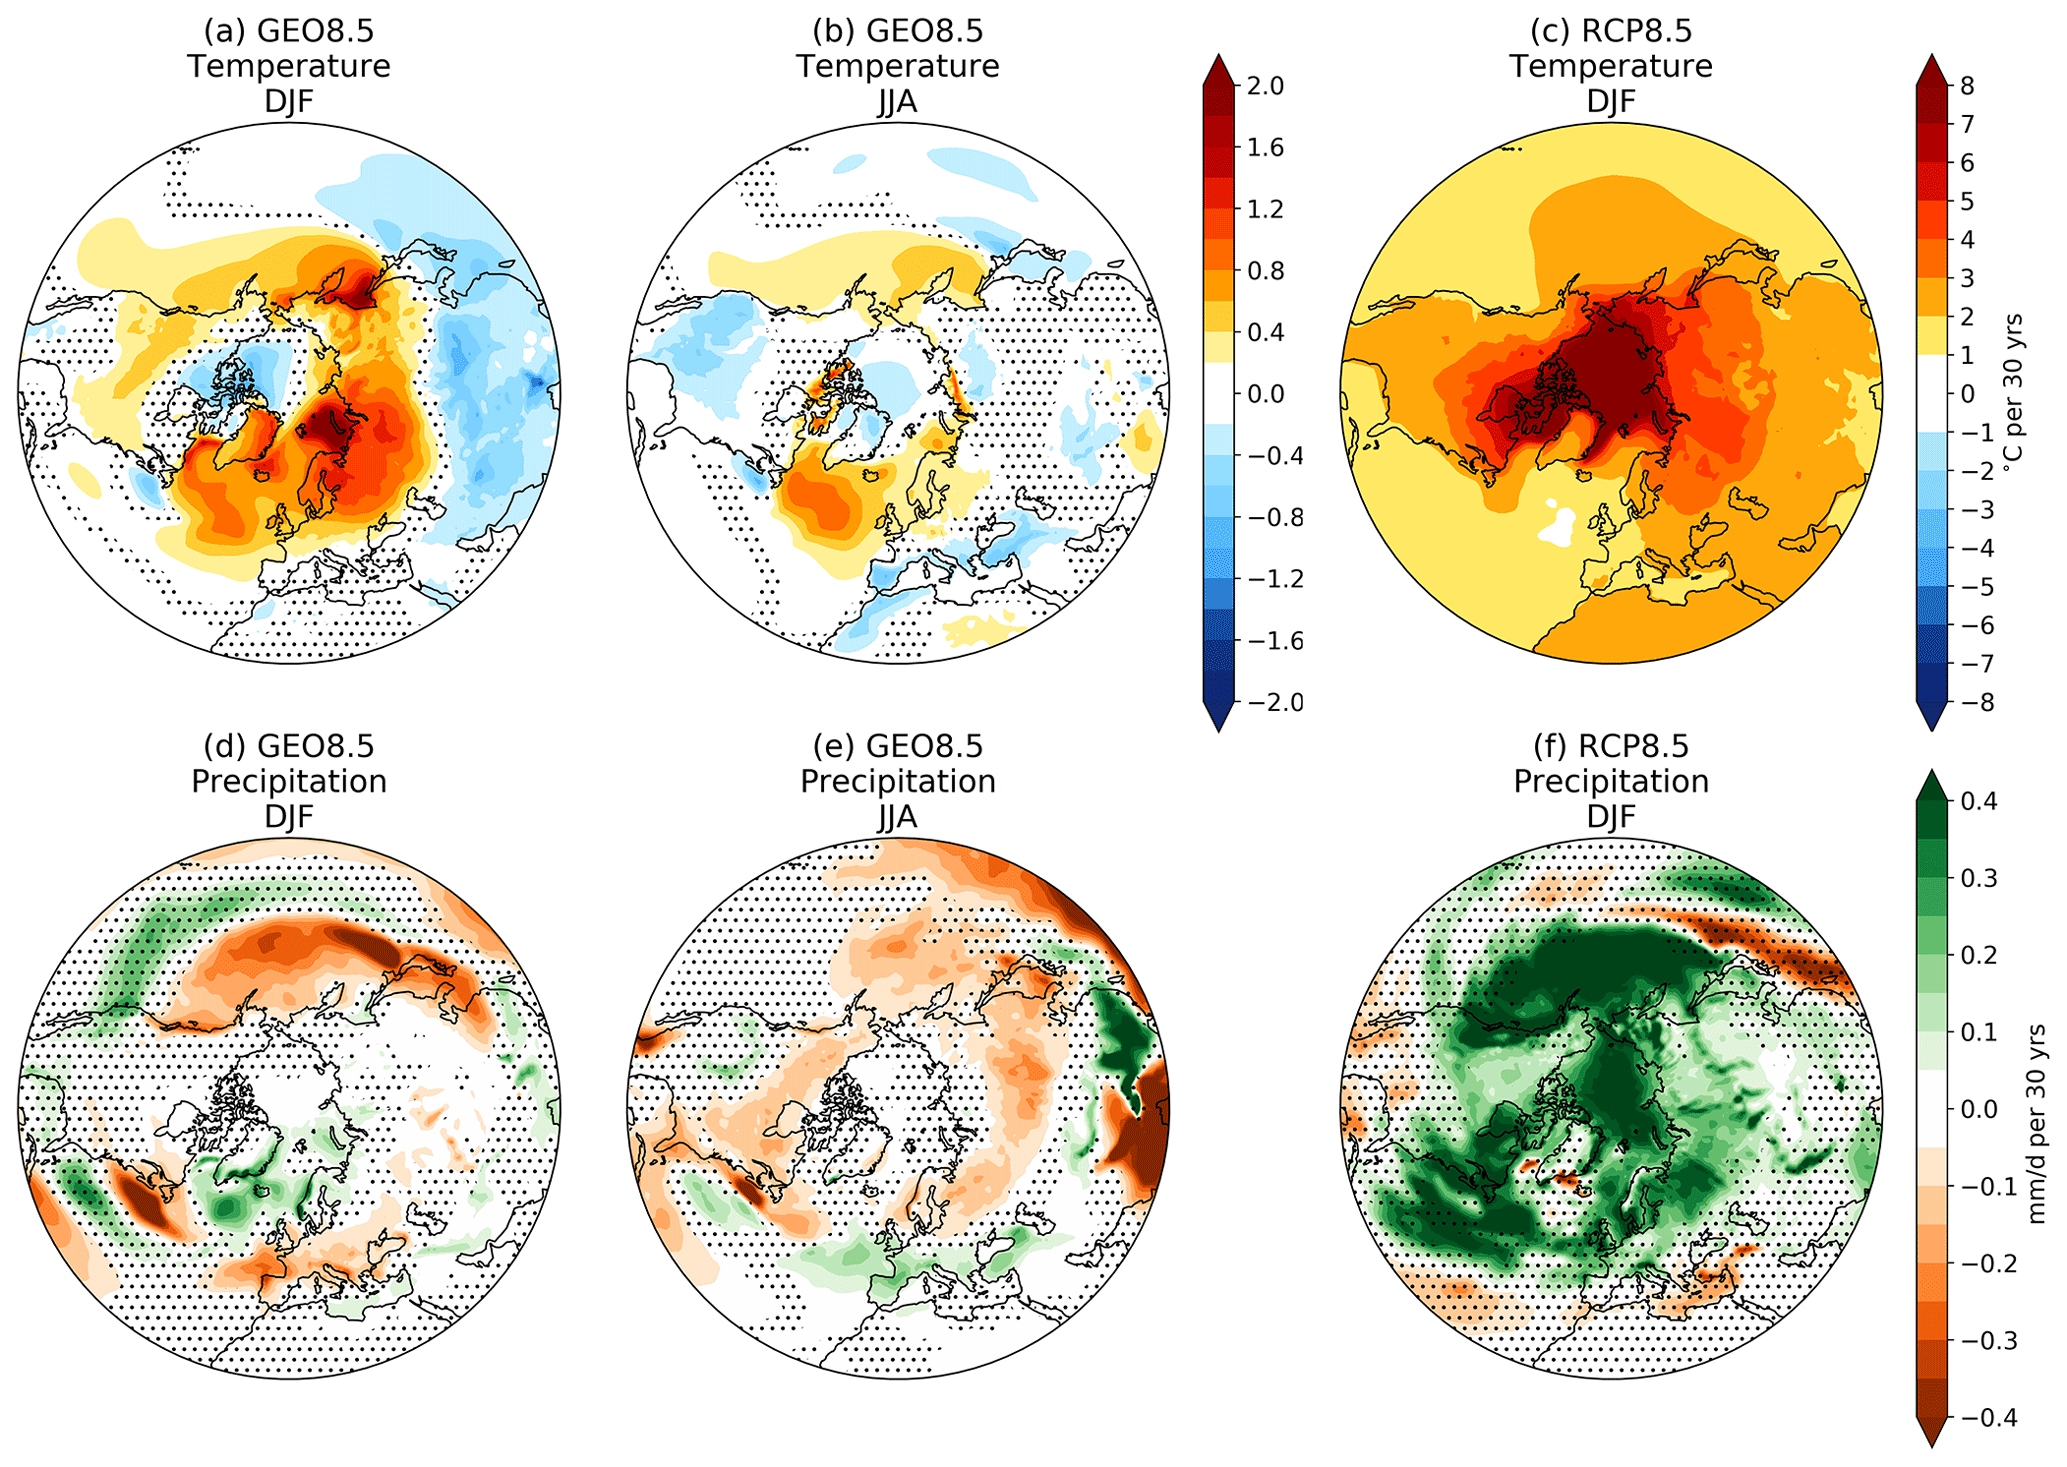
Figure 1Trends in near-surface air temperature and precipitation. Ensemble mean linear trends in (a, b, c) temperature (in degrees Celsius per 30 years) and (d, e, f) precipitation (millimeters per day per 30 years) in different seasons and experiments. (a, d) GEO8.5 for DJF (December, January and February), (b, e) GEO8.5 for JJA (June, July and August) and (c, f) RCP8.5 for DJF. Stippling indicates a lack of statistical significance at the 95 % confidence level under a one sample, two-sided Student's t test using the standard deviation across ensemble members.
To place these geoengineering responses into the broader context of other anthropogenic forcings, we emphasize that the magnitude of the winter warming in the GEO8.5 simulations amounts to approximately one-third of the forced warming under RCP8.5 (Fig. 1c). This makes clear that a feedback control algorithm that only maintains large-scale, zonal mean and annual mean temperatures does not successfully alleviate seasonal and local changes in surface temperature, as shown in previous studies for the GEO8.5 simulations (Jiang et al., 2019; Kravitz et al., 2017; Tilmes et al., 2018a). As for precipitation, trends under geoengineering are largely a cancellation, or slight reversal, of wetting trends in winter over the northern latitudes under rising greenhouse gases in RCP8.5 (Fig. 1f).
It is also of interest to contrast the winter warming under the geoengineering scenario to the potential response of midlatitude surface temperatures to large, low latitude volcanic eruptions. Consider, first, the signal-to-noise ratio by the end of the century in GEO8.5 (shown in Fig. 2a). Here, the signal is defined as the ensemble mean difference between GEO8.5 (2075–2095 average) and Base (2010–2030 average), and the noise is defined as interannual variability (computed as the standard deviation of DJF annual averages in Base across 20 years in 20 members). We find that the signal-to-noise ratio lies just around or below 1 in northern Eurasia, which means the signal is about 1σ of interannual variability (Fig. 2a). While a 1σ anomaly would be small in the context of observing the response in the first or second years after a volcanic eruption, here, the statistical significance of the forced response (ensemble mean relative to standard error in mean) is robust. We demonstrate this in Fig. 2b by showing the year in which ensemble mean trends beginning in 2020 become statistically significant (and remain significant) at the 95 % confidence level, i.e., with , where X is the ensemble mean trend, σ is the spread across ensemble members, and N is the number of ensemble members (20) (following Deser et al., 2012). We find that trends become significant around mid-century over Eurasia (Fig. 2b). The robustness of the forced response in the GEO8.5 simulations is also illustrated by the strong agreement across all 20 ensemble members for 2020–2095 trends, as shown in the Supplement Fig. S1 (the same is true for precipitation; see Fig. S2). Of course, for an individual realization, like we would observe in the real world, it would take much longer than the timescales shown in Fig. 2b to detect a significant trend. The robustness of the forced response to sulfate aerosol injections stands in stark contrast to the lack of a simulated forced response in the winter following the eruptions of Pinatubo and Krakatau (Polvani et al., 2019; Polvani and Camargo, 2020), and is a result of the sustained2 and continuously increasing sulfate forcing in this scenario of geoengineering.

Figure 2Significance of the DJF near-surface air temperature response under geoengineering. (a) The signal-to-noise ratio of the end-of-century ensemble mean response in GEO8.5 (2075–2095) relative to Base (2010–2030). (b) The endpoint year in which the GEO8.5 ensemble mean trends beginning in 2020 become statistically significant from zero, and remain significant, at the 95 % confidence level.
3.2 Stratosphere–troposphere dynamical coupling
We here argue for the existence of a dynamical stratosphere–troposphere coupling pathway under geoengineering in the NH winter. We begin by showing ensemble mean DJF average trends in zonal mean temperature and zonal wind for GEO8.5, GEOHEAT and RCP8.5 in Fig. 3. Zonal wind trends in individual members are shown in Fig. S3.
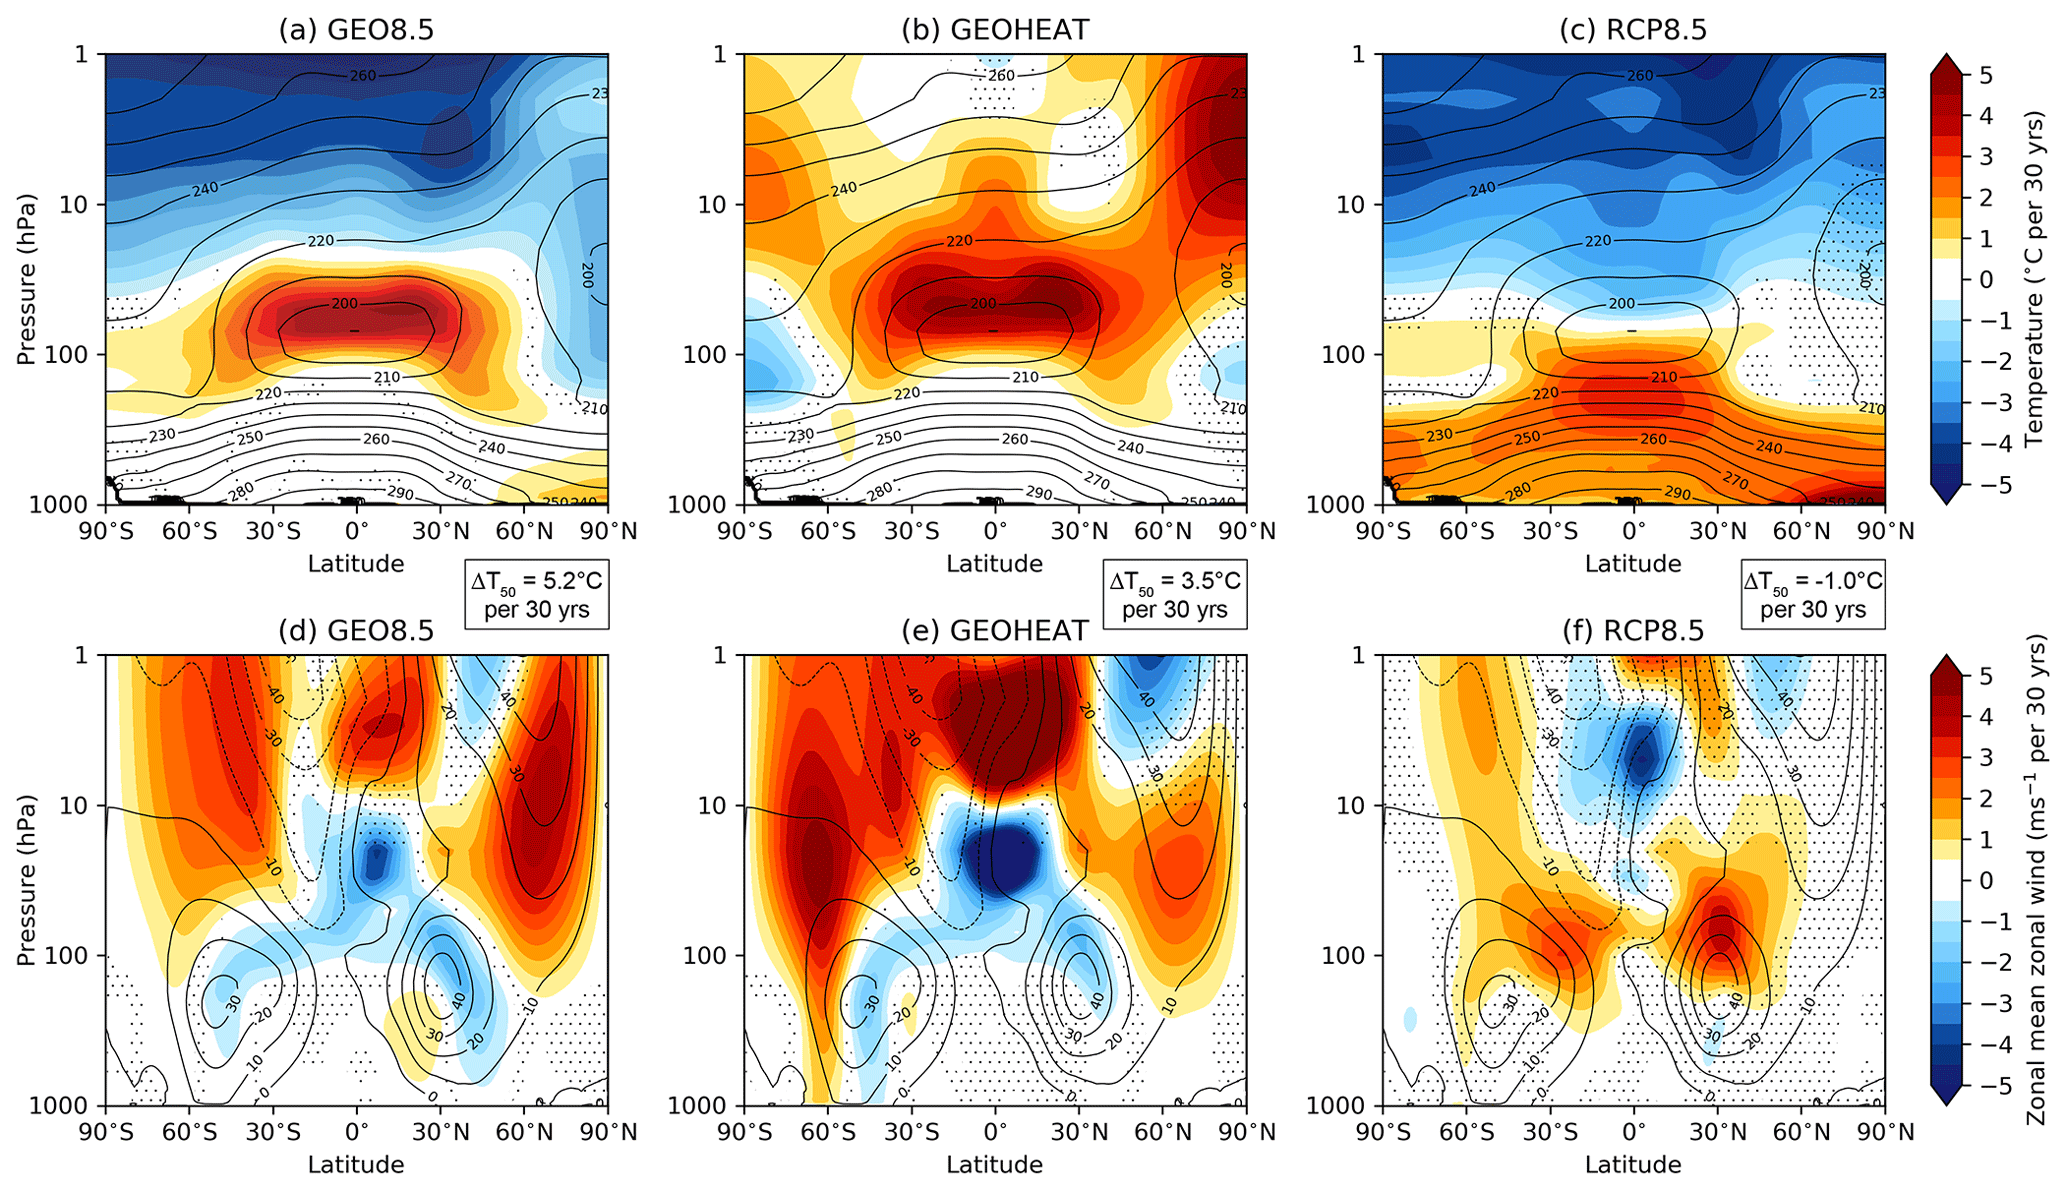
Figure 3Trends in DJF zonal mean temperature and zonal winds. Shown are ensemble mean linear trends in temperature (a–c; shading; degrees Celsius per 30 years) and zonal wind (d–f; shading; meters per second per 30 years). Responses are shown for (a, d) GEO8.5, (b, e) GEOHEAT and (c, f) RCP8.5. Contours show the Base climatology (2010–2030). Stippling indicates trends that are not statistically significant at the 95 % confidence level under a one sample, two-sided Student's t test using the standard deviation across ensemble members. ΔT50 values for each experiment give the ensemble mean and tropical average temperature trend (30∘ S–30∘ N) minus the NH polar cap average trend (60–90∘ N) at 50 hPa.
Figure 3a shows that the heating caused by additional sulfate aerosols in GEO8.5 peaks at just over 4 ∘C per 30 years around 50 hPa, while greenhouse-gas-induced cooling trends occur at the same pressures over the North Pole. The ensemble mean tropical average (30∘ S–30∘ N) temperature trend minus the NH polar cap average (60–90∘ N) trend at 50 hPa is 5.2 ∘C per 30 years in this experiment. Consistent with a thermal wind balance response to this change in temperature gradient, there is a forced strengthening of the NH wintertime polar vortex (up to 5 m s−1 per 30 years around 10 hPa) (Fig. 3d). Richter et al. (2018) found the same result for the first GEO8.5 ensemble member, and we here confirm the robustness of the forced zonal wind response across 20 ensemble members, particularly below 10 hPa (Fig. S3). The GEOHEAT experiment confirms the link between the tropical lower stratospheric warming and strengthening of the polar vortex, as also discussed in Simpson et al. (2019). The tropical lower stratospheric warming is broadly similar to GEO8.5 but with no polar cooling, since greenhouse gas concentrations are kept at Base levels in GEOHEAT (Fig. 3b). The smaller change in the meridional temperature gradient (3.5 ∘C per 30 years) explains the weaker strengthening of the NH polar vortex (Fig. 3e) in GEOHEAT compared to GEO8.5.
In contrast, under climate change alone (RCP8.5), the most notable zonal wind response is a strengthening of the upper flanks of the subtropical jets (Fig. 3f), which is a robustly simulated response to increased greenhouse gas radiative forcing and the resulting enhanced warming of the upper troposphere (Fig. 3c; Lorenz and DeWeaver, 2007; Shepherd and McLandress, 2011; Manzini et al., 2014). We find no statistically significant trend in the NH stratospheric polar vortex (Fig. 3f). The lack of a polar vortex response is consistent with large intermodel spreads found by previous studies, with model responses differing in sign even under large greenhouse gas forcing scenarios such as RCP8.5 and 4xCO2 (Ayarzagüena et al., 2018, 2020; Manzini et al., 2014; Simpson et al., 2018). With the caveat of the single model nature of our study, the stronger NH polar vortex under sulfate geoengineering is therefore a robust and key difference in the forced climate response compared to increasing greenhouse gases alone.
While Fig. 3d and e show a clear strengthening of the NH stratospheric polar vortex under geoengineering, the tropospheric response appears weaker. However, the zonal mean view masks zonal asymmetries in the troposphere. So, we now focus on the region of interest, the North Atlantic. Figure 4 shows ensemble mean trends in the NAO index, computed as the leading principal component of zonal wind as a function of height in the 20–80∘ N, 90∘ W–40∘ E region (see Sect. 2.2). When focusing on the NAO, what becomes apparent is a downward extension of the forced dynamical signal, i.e., positive ensemble mean NAO trends from the stratosphere to the troposphere under geoengineering in GEO8.5 (Fig. 4a). The connection of this response to tropical lower stratospheric heating is supported, once again, by the similar response in GEOHEAT (Fig. 4b). That this stratosphere–troposphere response is forced by sulfate geoengineering is further underscored by the negligible or negative trends found under RCP8.5 (Fig. 4c).
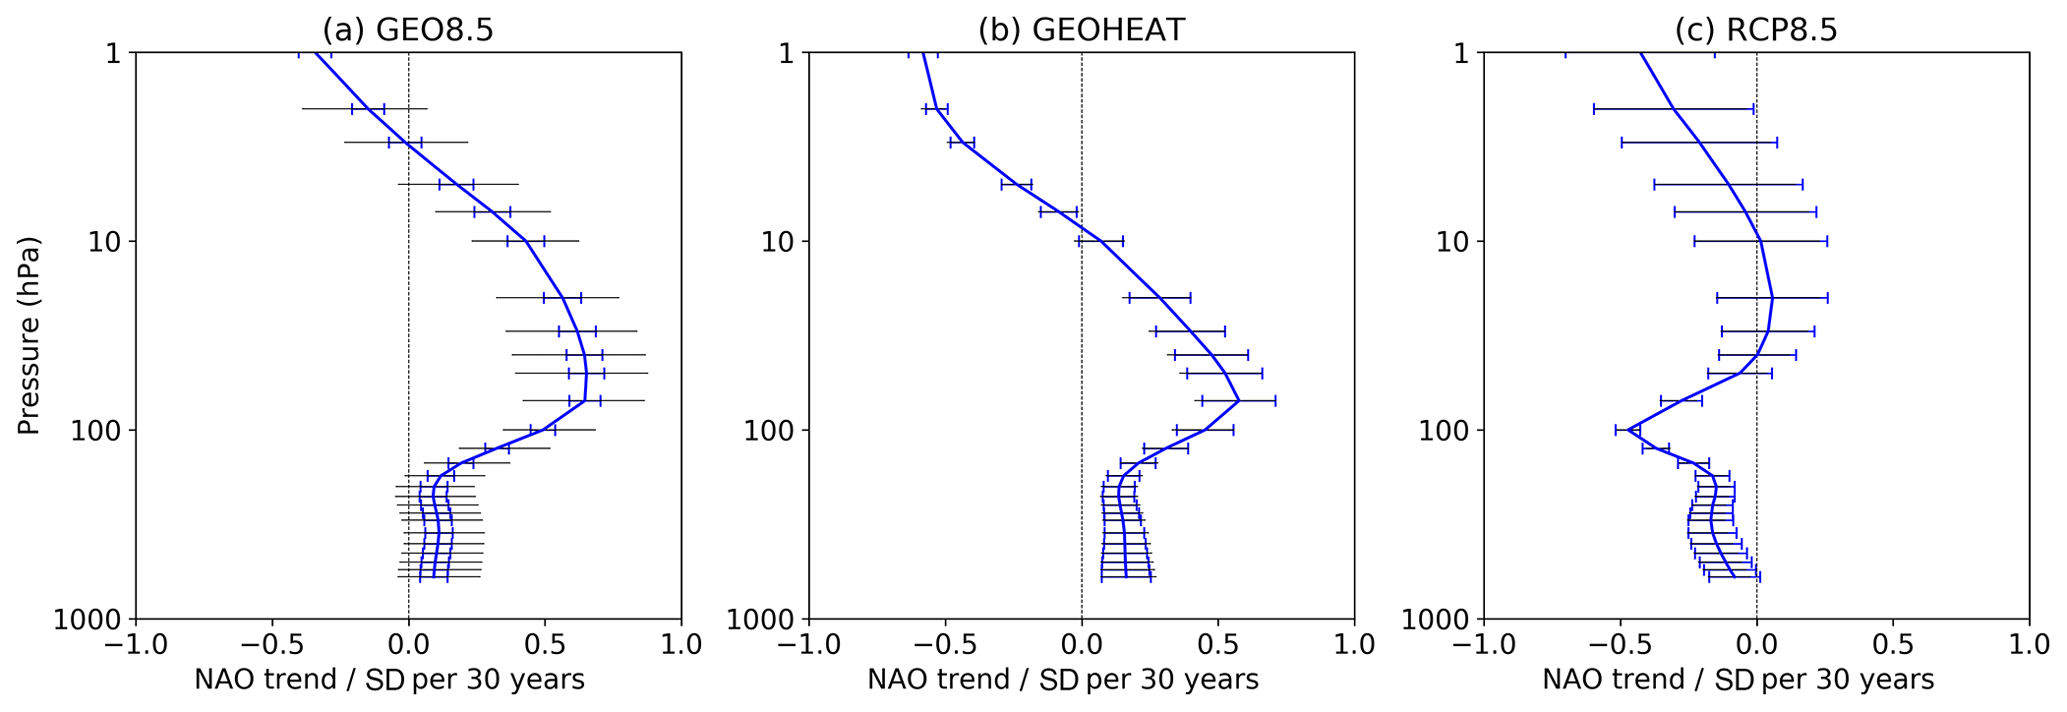
Figure 4Vertical profile of trends in DJF zonal wind characterizing the NAO. Shown are ensemble mean linear trends in (a) GEO8.5, (b) GEOHEAT and (c) RCP8.5, with error bars showing the 95 % confidence interval (, where N is the number of ensemble members). The 5th–95th percentile range is shown by horizontal black lines. In (b) GEOHEAT and (c) RCP8.5, the confidence interval and range are essentially the same.
Since we are ultimately interested in the surface circulation response and the associated impacts, we show, in Fig. 5, ensemble mean trends in SLP and the surface NAO time series (based on SLP; see Sect. 2.2). Winter trends under geoengineering in GEO8.5 show a band of increasing SLP over Eurasia, with a reduction over the North Pole (Fig. 5a); the general pattern is found in almost every ensemble member (Fig. S4). These SLP trends project strongly onto the positive phase of the surface NAO index. We see that the index is generally positive and increases at a rate of 0.17 ± 0.07 per 30 years (Fig. 5d). Consistently, the GEOHEAT ensemble mean response is significantly above zero at 0.55 ± 0.27 (Fig. 5d, magenta bar; see Simpson et al., 2019, for further comparison of the zonal wind responses between GEOHEAT and GEO8.5 in the North Atlantic sector).
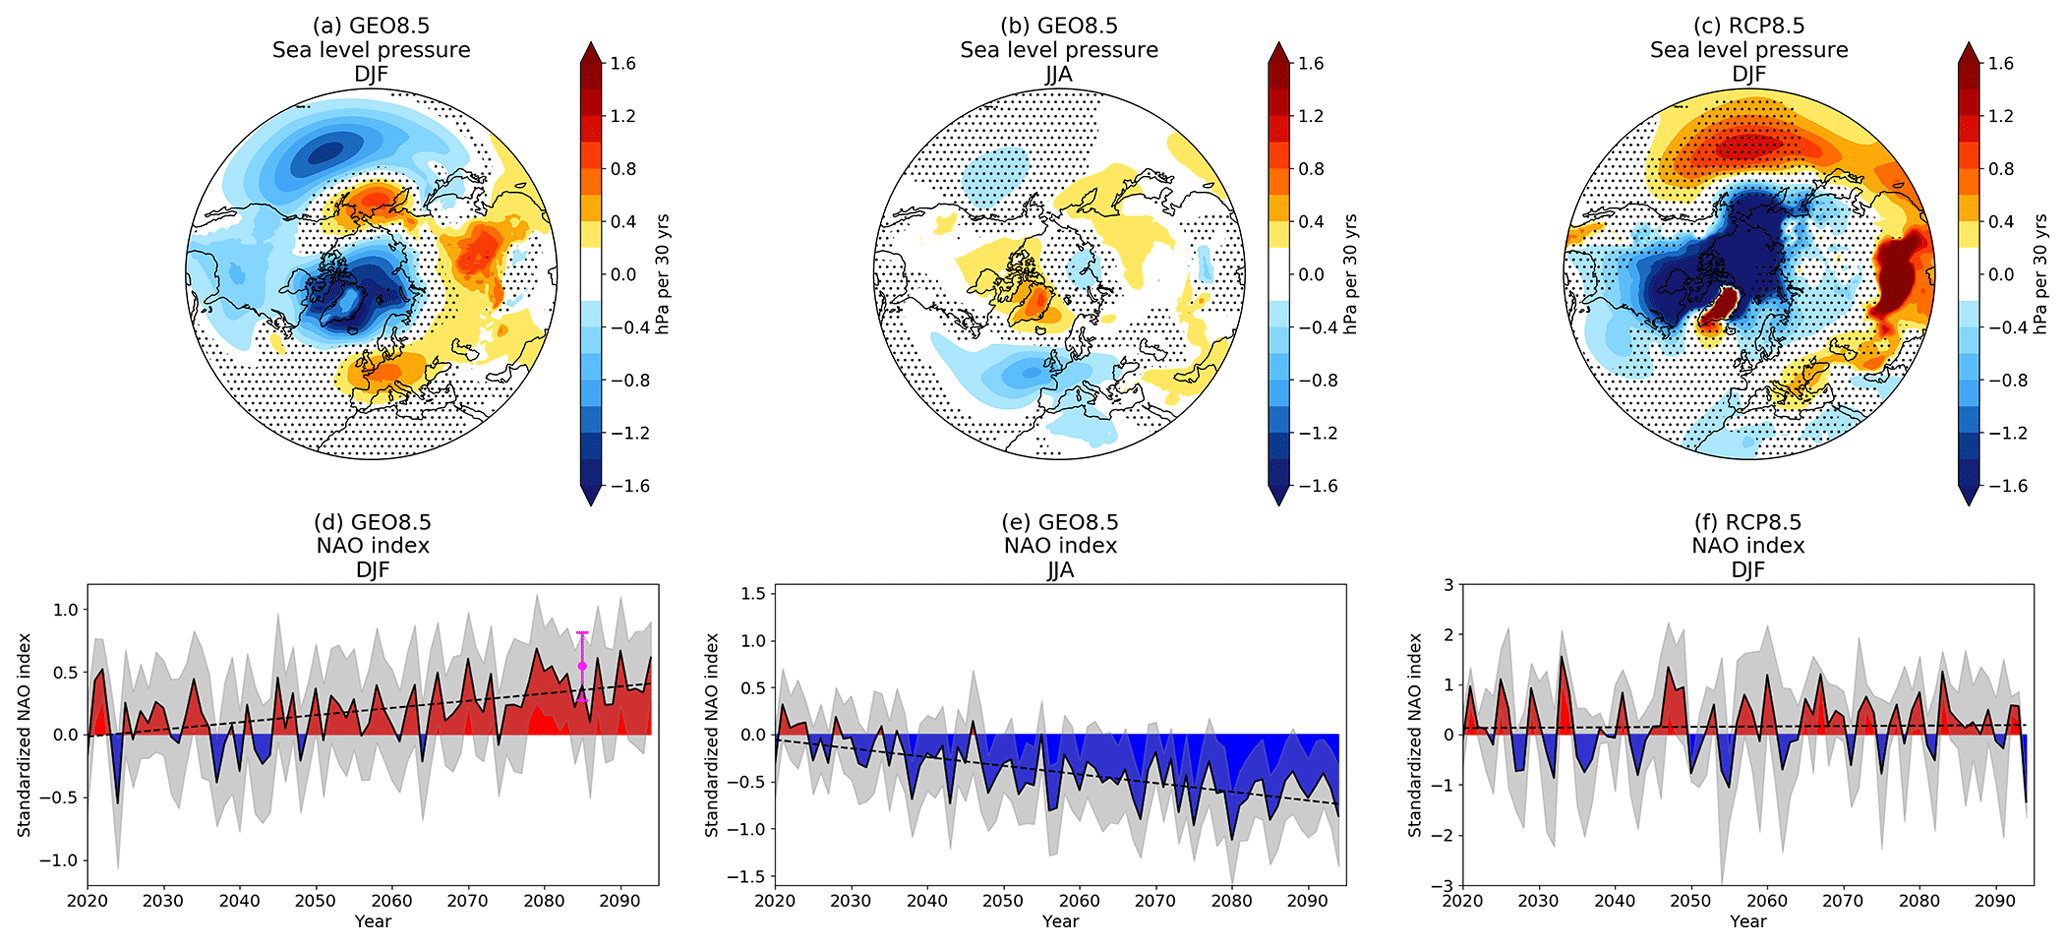
Figure 5Trends in SLP and the surface (SLP-based) NAO time series. (a, b, c) Ensemble mean linear trends in sea level pressure (hectopascals per 30 years). (d, e, f) Ensemble mean time series of the NAO. Responses are shown for (a, d) GEO8.5 (DJF), (b, e) GEO8.5 (JJA) and (c, f) RCP8.5 (DJF). The magenta point in (d) shows the ensemble mean response in GEOHEAT and its 95 % confidence interval. Stippling in (a, b, c) indicates lack of statistical significance at the 95 % confidence interval under a one sample, two-sided Student's t test using the standard deviation across ensemble members. The gray shading in (d, e, f) indicates the 95 % confidence interval (, where N is the number of ensemble members). The vertical scales for the NAO index are different in order to clearly illustrate the respective time series and confidence intervals.
Once more, we highlight the unique feature of the wintertime geoengineering response as compared to the response in RCP8.5, where no simulated trend is seen (0.02 ± 0.20 per 30 years) in the DJF NAO index (Fig. 5c, f). There is again also a distinct seasonality, with an opposite response under geoengineering in the summer, when the NAO index in fact decreases throughout the century with a trend of −0.28 ± 0.07 per 30 years (Fig. 5b, e). In the absence of the stratospheric polar vortex, the JJA response is likely related to ocean circulation changes in this model (Fasullo et al., 2018), although its robustness across other models remains to be determined.
3.3 Quantifying the impact of stratospheric dynamics on surface climate responses
Having shown substantial evidence connecting the stratospheric, tropospheric and surface wintertime circulation responses under geoengineering, we complete our analysis by determining what fraction of the surface temperature and precipitation responses, which we are ultimately interested in, this dynamical coupling can explain. First, within the GEO8.5 simulations, we regress, on a grid-cell-by-grid-cell basis, the DJF time series of each surface field against that of NAM50 (following Thompson et al., 2000). The regression coefficient, multiplied by the trend in NAM50, yields the part of the surface climate trend that is congruent with NAM50. The residual is then the NAM50-congruent trend subtracted from the total trend in the surface field. Second, to confirm which responses are ultimately caused by stratospheric heating from additional sulfate aerosols, we investigate the GEOHEAT responses. Under the proposed mechanism connecting tropical lower stratospheric heating, a strengthening of the NH polar vortex, downward dynamical coupling and circulation-driven climate changes, the GEOHEAT and NAM50-congruent responses should be the same. Indeed, we will show that they are, to a reasonable extent.
Performing this analysis for the surface circulation response, we find, in Fig. 6a, that NAM50-congruent trends in SLP indicate a more positive shift of the NAO than the full trend (compare to Fig. 5a), as seen in the deeper low over the Arctic and the high shifted towards the North Atlantic. Consistently, the NAM50-congruent temperature and precipitation trends both depict dynamically driven responses to a positive NAO phase. There is warming over the Eurasian continent (Fig. 6d), which explains most of the full trend (Fig. 1a; upwards of 60 %). The dipole response of drying over southern Europe and wetting over northern Europe (Fig. 6g) is similar in pattern, but larger in magnitude, than the full trend (Fig. 1d). Furthermore, the SLP pattern, northern Eurasian warming and the dipole response in precipitation over western Europe in GEOHEAT (Fig. 6b, e, h) is very similar to NAM50-congruent trends within GEO8.5 (Fig. 6a, d, g). We therefore conclude that downward dynamical stratosphere–troposphere coupling, which is ultimately driven by tropical lower stratospheric heating from sulfate aerosols, is the major driver of Eurasian winter warming, and associated changes in precipitation, in this particular scenario of sulfate geoengineering.
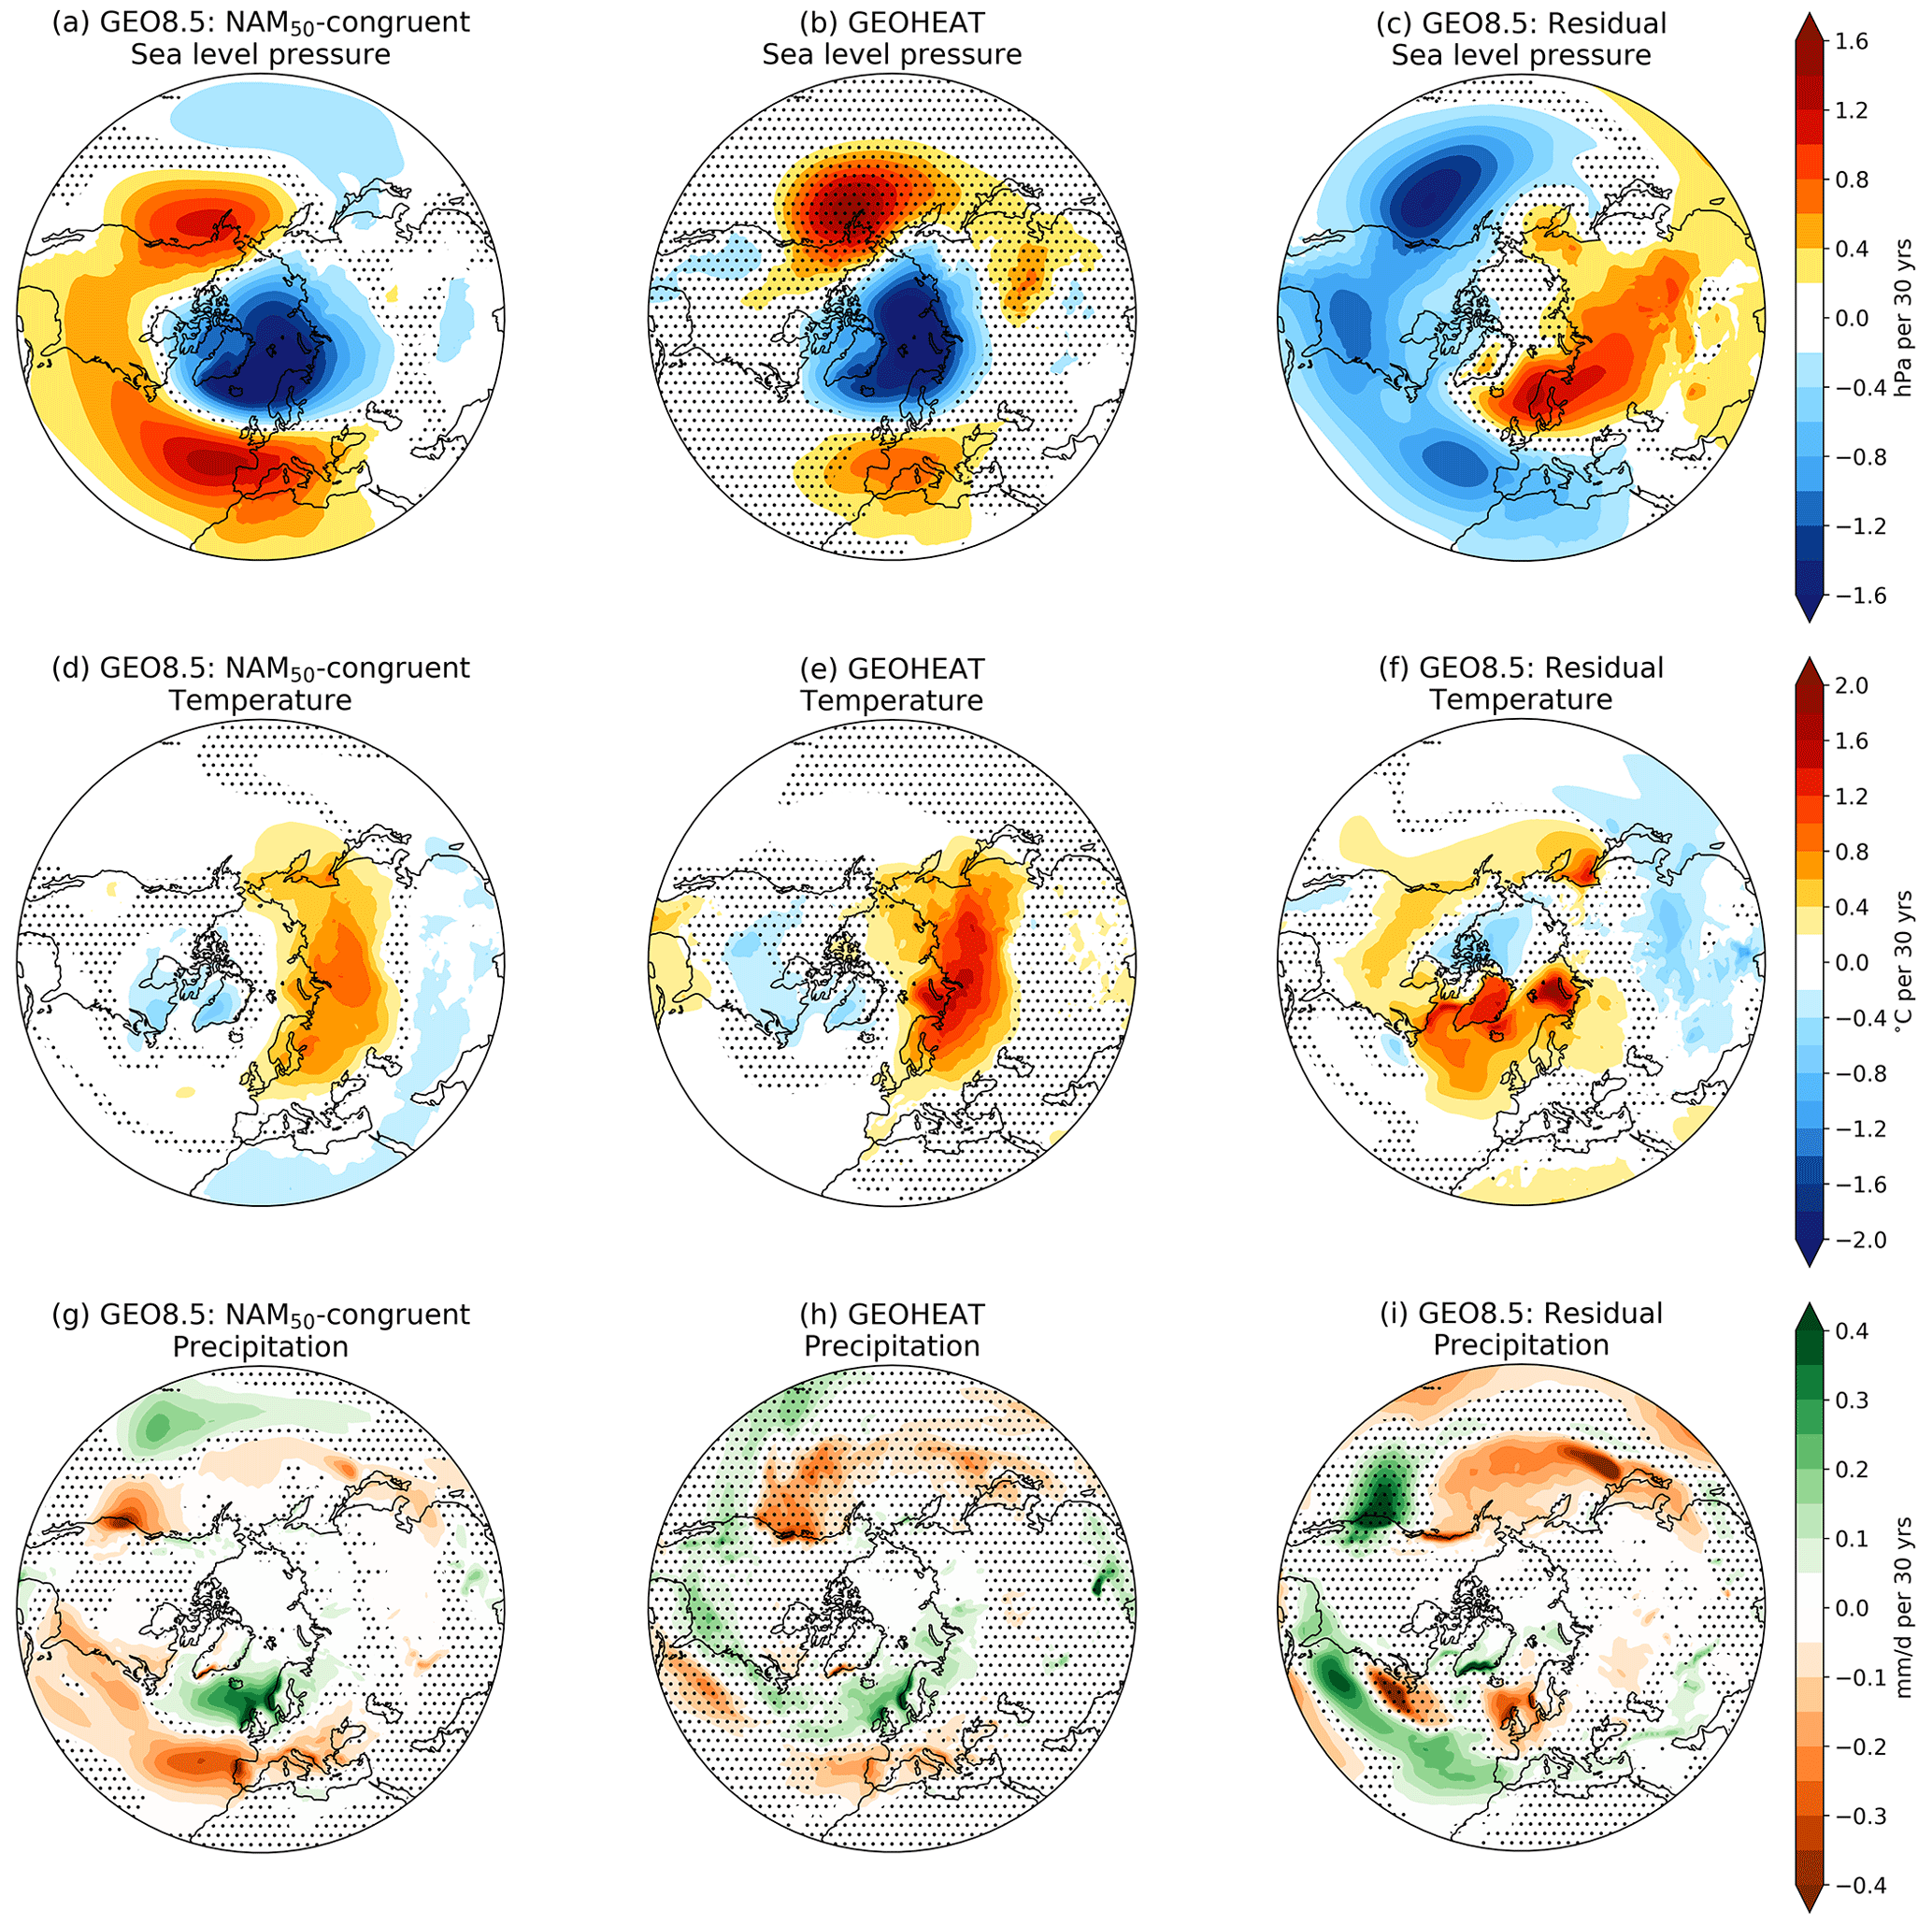
Figure 6Results from regressions of DJF surface climate responses against the stratospheric NAM in GEO8.5 and the responses in GEOHEAT. Ensemble mean linear trends in (a, b, c) sea level pressure (hectopascals per 30 years), (d, e, f) near-surface air temperature (degrees Celsius per 30 years) and (g, h, i) precipitation (millimeters per day per 30 years). Shown are trends in GEO8.5 that are congruent with NAM50 (a, d, g), equivalent trends in GEOHEAT (b, e, h), and the difference between total GEO8.5 trends and NAM50-congruent trends (c, f, i). Stippling indicates lack of statistical significance at the 95 % confidence interval under a one sample, two-sided Student's t test using the standard deviation across ensemble members.
Some large residuals from the NAM50 regressions remain in the surface climate responses, which, therefore, cannot be explained by dynamical stratosphere–troposphere coupling. Residual SLP trends are large and oppositely signed to the NAM50-congruent portion (compare Fig. 6a and c) and, thus, diminish the full response (Fig. 5a). There are residuals of around 1–2 ∘C per 30 years in temperature trends over the Barents–Kara Sea, Greenland and the North Atlantic (Fig. 6f). The literature offer some explanation for these temperature residuals, as follows: annual mean forced warming around Greenland has been linked to changes in the hydrological cycle over the North Atlantic and an acceleration of the Atlantic Meridional Overturning Circulation (AMOC), although this might be a model-dependent feature (Fasullo et al., 2018). The warming over the Barents–Kara Sea is associated with sea ice losses in midwinter and spring (Jiang et al., 2019), but the feedbacks remain to be investigated. For precipitation, the residual is a drying over northwestern Europe and a wetting to the south (Fig. 6i), which also diminishes the full response (Fig. 1d) compared to the NAM50-congruent response alone (Fig. 6g). The circulation residual (Fig. 6c) could be contributing to the precipitation residual, and there is also a possible role of an overall weakening of storm track activity under the combined influence of geoengineering and increasing greenhouse gases (Simpson et al., 2019).
Unlike for the North Atlantic and Eurasia, the stratospheric NAM cannot explain most of the climate responses to geoengineering over the Pacific Ocean and North America. The residual from the NAM50 regression analysis shows reductions in North Pacific SLP (Fig. 6c), which combine with the opposing NAM50-congruent portion (Fig. 6a) to cause a dipole pattern in the full GEO8.5 trend (Fig. 5a). There are also residual warming trends over North America (Fig. 6f) and a dipole response in precipitation over the North Pacific (Fig. 6i) that mostly explain the full trends (Fig. 1a, d). The deepening of the Aleutian low in the residual could signal long-term changes to the El Niño–Southern Oscillation (ENSO). As shown in Simpson et al. (2019), there are some enhancements in tropical East Pacific sea surface temperatures and reductions in the tropical West Pacific in GEO8.5, which are only partially explained by stratospheric heating. Changes in ENSO variability have also been reported in a solar dimming experiment (Malik et al., 2020) and following volcanic eruptions (Khodri et al., 2017). The Pacific climate response in GEO8.5 and under sulfate geoengineering in general merits future study.
We return to the main point that stratospheric dynamics are a key influence on the Eurasian surface climate in this scenario of geoengineering with a prominent seasonal wintertime signature. Without its influence, the residual from the NAM50 regression suggests a negative NAO response under sulfate geoengineering in this particular model (Fig. 6c). Indeed, in the absence of the polar vortex in the NH summer, we have instead revealed a shift towards the opposite NAO phase (Fig. 5b, e).
We have investigated the role of stratospheric dynamics for Northern Hemisphere regional climate changes under continuous and steadily increasing stratospheric sulfate injections to meet multiple annual mean surface temperature targets (of global mean temperature and Equator-to-pole and interhemispheric temperature and gradients) under the RCP8.5 scenario in the Geoengineering Large Ensemble (GLENS) simulations. This geoengineering approach avoids many of the large surface climate impacts of greenhouse gas forcing under RCP8.5, for example in temperature and precipitation, but there are residual impacts on the high latitude, wintertime NH which we have studied here. Sulfate-aerosol-driven warming of the tropical lower stratosphere and the consequent strengthening of the stratospheric polar vortex is a key difference in the climate response under geoengineering compared to a non-geoengineered climate in this model and adds to the robustness of this finding in previous studies. The strengthening NH polar vortex, as reflected in the stratospheric Northern Annular Mode, correlates well in time with surface climate responses; regression analysis suggests that an increasing NAM at 50 hPa leads to a positive trend in the wintertime North Atlantic Oscillation and is consequently the main cause of Eurasian continental winter warming and a dipole response in precipitation. Experiments forced with just stratospheric heating from aerosols further cement the major role of dynamical stratosphere–troposphere coupling over other effects such as seasonal changes in insolation, as suggested by Kravitz et al. (2017), in leading to the NH wintertime surface climate changes (see also Jiang et al., 2019, and Simpson et al., 2019). Trends in North Atlantic sea level pressure congruent with the stratospheric NAM are, however, offset by a negatively signed component that also dominates in the summer season; the causes of this need to be investigated further. Since these are results from a single model and a unique geoengineering strategy, the robustness of the dynamically driven winter warming simulated here needs to be ascertained from other models and other sulfate injection strategies. A recent study also finds winter warming, and argues similarly for stratosphere–troposphere coupling, under the sulfur injection scenario (G6sulfur) of the GeoMIP experiments with the UKESM1 and CESM2-WACCM6 models (Jones et al., 2021).
The role of volcanic forcing in causing the observed wintertime warming following the large Pinatubo and Krakatau eruptions has recently been questioned in the face of large internal variability (Polvani et al., 2019; Polvani and Camargo, 2020). The findings of this paper add further evidence to those studies. The forced warming in the GLENS simulations by the end of the century, when sulfate emissions have reached around 50 Tg (SO2) yr−1, equivalent to several eruptions like Mount Pinatubo each year and sustained for many decades, is found to be within the 1σ spread of unforced extratropical wintertime interannual variability, suggesting that a single large eruption is very unlikely to be detectable. Nonetheless, the forced response in the GLENS simulations is robustly demonstrated with the ensemble approach. The side effects of smaller and perhaps more plausible sulfate injections on the Eurasian continent would be smaller than shown here, with longer timescales needed for detection, underscoring the need for mitigation of greenhouse gas emissions.
The code used to perform this analysis is available at https://doi.org/10.5281/zenodo.4713591 (Banerjee, 2021). The Geoengineering Large Ensemble data are available via the Earth System Grid at http://doi.org/10.5065/D6JH3JXX (Tilmes et al., 2020).
The supplement related to this article is available online at: https://doi.org/10.5194/acp-21-6985-2021-supplement.
AB and LMP conceived the analysis. AB and AHB performed the analysis, with contributions from IRS and LS. AB wrote the paper, with contributions from AHB, LMP, AR, IRS and LS.
The authors declare that they have no conflict of interest.
This article is part of the special issue “Resolving uncertainties in solar geoengineering through multi-model and large-ensemble simulations (ACP/ESD inter-journal SI)”. It is not associated with a conference.
We thank Katie Dagon, James Hurrell and Simone Tilmes, for the useful conversations on this work. The CESM project is supported primarily by the National Science Foundation (NSF). This material is based upon work supported by the National Center for Atmospheric Research, which is a major facility sponsored by the NSF (grant no. 1852977). Computing and data storage resources, including the Cheyenne supercomputer (https://doi.org/10.5065/D6RX99HX, last access: 1 February 2021), were provided by the Computational and Information Systems Laboratory (CISL) at NCAR.
Antara Banerjee has been supported by a University of Colorado Boulder CIRES Visiting Fellow Program funded by NOAA (grant no. NA17OAR4320101). Alan Robock has been supported by the National Science Foundation (grant nos. AGS-1617844 and AGS-2017113). Isla Simpson has been supported by the National Center for Atmospheric Research, which is a major facility sponsored by the National Science Foundation (grant no. 1852977).
This paper was edited by Frank Keutsch and reviewed by two anonymous referees.
Ayarzagüena, B., Polvani, L. M., Langematz, U., Akiyoshi, H., Bekki, S., Butchart, N., Dameris, M., Deushi, M., Hardiman, S. C., Jöckel, P., Klekociuk, A., Marchand, M., Michou, M., Morgenstern, O., O'Connor, F. M., Oman, L. D., Plummer, D. A., Revell, L., Rozanov, E., Saint-Martin, D., Scinocca, J., Stenke, A., Stone, K., Yamashita, Y., Yoshida, K., and Zeng, G.: No robust evidence of future changes in major stratospheric sudden warmings: a multi-model assessment from CCMI, Atmos. Chem. Phys., 18, 11277–11287, https://doi.org/10.5194/acp-18-11277-2018, 2018.
Ayarzagüena, B., Charlton-Perez, A. J., Butler, A. H., Hitchcock, P., Simpson, I. R., Polvani, L. M., Butchart, N., Gerber, E. P., Gray, L., Hassler, B., Lin, P., Lott, F., Manzini, E., Mizuta, R., Orbe, C., Osprey, S., Saint-Martin, D., Sigmond, M., Taguchi, M., Volodin, E. M., and Watanabe, S.: Uncertainty in the Response of Sudden Stratospheric Warmings and Stratosphere-Troposphere Coupling to Quadrupled CO2 Concentrations in CMIP6 Models, J. Geophys. Res.-Atmos., 125, e2019JD032345, https://doi.org/10.1029/2019JD032345, 2020.
Baldwin, M. P. and Dunkerton, T. J.: Stratospheric Harbingers of Anomalous Weather Regimes, Science, 294, 581–584, https://doi.org/10.1126/science.1063315, 2001.
Baldwin, M. P. and Thompson, D. W. J.: A critical comparison of stratosphere-troposphere coupling indices, Q. J. Roy. Meteor. Soc., 135, 1661–1672, https://doi.org/10.1002/qj.479, 2009.
Banerjee, A.: antara-banerjee/GeoengineeringLE_WinterWarming: Publication Code (Version v1.0.0), Zenodo, https://doi.org/10.5281/zenodo.4713591, 2021.
Chiodo, G. and Polvani, L. M.: Reduced Southern Hemispheric circulation response to quadrupled CO2 due to stratospheric ozone feedback, Geophys. Res. Letts., 44, 465–474, https://doi.org/10.1002/2016GL071011, 2017.
Chiodo, G. and Polvani, L. M.: The Response of the Ozone Layer to Quadrupled CO2 Concentrations: Implications for Climate, J. Climate, 32, 7629–7642, https://doi.org/10.1175/JCLI-D-19-0086.1, 2019.
Crutzen, P. J.: Albedo Enhancement by Stratospheric Sulfur Injections: A Contribution to Resolve a Policy Dilemma?, Climatic Change, 77, 211–220, https://doi.org/10.1007/s10584-006-9101-y, 2006.
Deser, C., Phillips, A., Bourdette, V., and Teng, H.: Uncertainty in climate change projections: the role of internal variability, Clim. Dynam., 38, 527–546, https://doi.org/10.1007/s00382-010-0977-x, 2012.
Domeisen, D. I. V., Sun, L., and Chen, G.: The role of synoptic eddies in the tropospheric response to stratospheric variability, Geophys. Res. Lett., 40, 4933–4937, https://doi.org/10.1002/grl.50943, 2013.
Duan, L., Cao, L., Bala, G., and Caldeira, K.: Climate Response to Pulse Versus Sustained Stratospheric Aerosol Forcing, Geophys. Res. Lett., 46, 8976–8984, https://doi.org/10.1029/2019GL083701, 2019.
Fasullo, J. T., Tilmes, S., Richter, J. H., Kravitz, B., MacMartin, D. G., Mills, M. J., and Simpson, I. R.: Persistent polar ocean warming in a strategically geoengineered climate, Nat. Geosci., 11, 910–914, https://doi.org/10.1038/s41561-018-0249-7, 2018.
Ferraro, A. J., Charlton-Perez, A. J., and Highwood, E. J.: Stratospheric dynamics and midlatitude jets under geoengineering with space mirrors and sulfate and titania aerosols, J. Geophys. Res.-Atmos., 120, 414–429, https://doi.org/10.1002/2014JD022734, 2015.
Fischer, E. M., Luterbacher, J., Zorita, E., Tett, S. F. B., Casty, C., and Wanner, H.: European climate response to tropical volcanic eruptions over the last half millennium, Geophys. Res. Lett., 34, L05707, https://doi.org/10.1029/2006GL027992, 2007.
Gerber, E. P., Baldwin, M. P., Akiyoshi, H., Austin, J., Bekki, S., Braesicke, P., Butchart, N., Chipperfield, M., Dameris, M., Dhomse, S., Frith, S. M., Garcia, R. R., Garny, H., Gettelman, A., Hardiman, S. C., Karpechko, A., Marchand, M., Morgenstern, O., Nielsen, J. E., Pawson, S., Peter, T., Plummer, D. A., Pyle, J. A., Rozanov, E., Scinocca, J. F., Shepherd, T. G., and Smale, D.: Stratosphere-troposphere coupling and annular mode variability in chemistry-climate models, J. Geophys. Res., 115, D00M06, https://doi.org/10.1029/2009JD013770, 2010.
Graf, H.-F., Kirchner, I., Robock, A., and Schult, I.: Pinatubo eruption winter climate effects: model versus observations, Clim. Dynam., 9, 81–93, https://doi.org/10.1007/BF00210011, 1993.
Graf, H.-F., Li, Q., and Giorgetta, M. A.: Volcanic effects on climate: revisiting the mechanisms, Atmos. Chem. Phys., 7, 4503–4511, https://doi.org/10.5194/acp-7-4503-2007, 2007.
Guo, S., Bluth, G. J. S., Rose, W. I., Watson, I. M., and Prata, A. J.: Re-evaluation of SO2 release of the 15 June 1991 Pinatubo eruption using ultraviolet and infrared satellite sensors, Geochem. Geophy. Geosy., 5, Q04001, https://doi.org/10.1029/2003GC000654, 2004.
Haynes, P. H., McIntyre, M. E., Shepherd, T. G., Marks, C. J., and Shine, K. P.: On the “Downward Control” of Extratropical Diabatic Circulations by Eddy-Induced Mean Zonal Forces, J. Atmos. Sci., 48, 651–678, https://doi.org/10.1175/1520-0469(1991)048<0651:OTCOED>2.0.CO;2, 1991.
Hitchcock, P. and Simpson, I. R.: The Downward Influence of Stratospheric Sudden Warmings, J. Atmos. Sci., 71, 3856–3876, https://doi.org/10.1175/JAS-D-14-0012.1, 2014.
Hitchcock, P. and Simpson, I. R.: Quantifying Eddy Feedbacks and Forcings in the Tropospheric Response to Stratospheric Sudden Warmings, J. Atmos. Sci., 73, 3641–3657, https://doi.org/10.1175/JAS-D-16-0056.1, 2016.
Jiang, J., Cao, L., MacMartin, D. G., Simpson, I. R., Kravitz, B., Cheng, W., Visioni, D., Tilmes, S., Richter, J. H., and Mills, M. J.: Stratospheric Sulfate Aerosol Geoengineering Could Alter the High-Latitude Seasonal Cycle, Geophys. Res. Lett., 46, 14153–14163, https://doi.org/10.1029/2019GL085758, 2019.
Jones, A., Haywood, J. M., Jones, A. C., Tilmes, S., Kravitz, B., and Robock, A.: North Atlantic Oscillation response in GeoMIP experiments G6solar and G6sulfur: why detailed modelling is needed for understanding regional implications of solar radiation management, Atmos. Chem. Phys., 21, 1287–1304, https://doi.org/10.5194/acp-21-1287-2021, 2021.
Khodri, M., Izumo, T., Vialard, J., Janicot, S., Cassou, C., Lengaigne, M., Mignot, J., Gastineau, G., Guilyardi, E., Lebas, N., Robock, A., and McPhaden, M. J.: Tropical explosive volcanic eruptions can trigger El Niño by cooling tropical Africa, Nat. Commun., 8, 778, https://doi.org/10.1038/s41467-017-00755-6, 2017.
Kidston, J., Scaife, A. A., Hardiman, S. C., Mitchell, D. M., Butchart, N., Baldwin, M. P., and Gray, L. J.: Stratospheric influence on tropospheric jet streams, storm tracks and surface weather, Nat. Geosci., 8, 433–440, https://doi.org/10.1038/ngeo2424, 2015.
Kodera, K.: Influence of volcanic eruptions on the troposphere through stratospheric dynamical processes in the northern hemisphere winter, J. Geophys. Res., 99, 1273–1282, https://doi.org/10.1029/93JD02731, 1994.
Kravitz, B., MacMartin, D. G., Mills, M. J., Richter, J. H., Tilmes, S., Lamarque, J.-F., Tribbia, J. J., and Vitt, F.: First Simulations of Designing Stratospheric Sulfate Aerosol Geoengineering to Meet Multiple Simultaneous Climate Objectives, J. Geophys. Res., 122, 12616–12634, https://doi.org/10.1002/2017JD026874, 2017.
Lorenz, D. J. and DeWeaver, E. T.: Tropopause height and zonal wind response to global warming in the IPCC scenario integrations, J. Geophys. Res., 112, D10119, https://doi.org/10.1029/2006JD008087, 2007.
Kushner, P. K. and Polvani, L. M.: Stratosphere–Troposphere Coupling in a Relatively Simple AGCM: The Role of Eddies, J. Climate, 17, 629–639, https://doi.org/10.1175/1520-0442(2004)017<0629:SCIARS>2.0.CO;2, 2004.
MacMartin, D. G., Ricke, K. L., and Keith, D. W.: Solar geoengineering as part of an overall strategy for meeting the 1.5 ∘C Paris target, Philos. T. R. Soc. A, 376, 20160454, https://doi.org/10.1098/rsta.2016.0454, 2018.
Malik, A., Nowack, P. J., Haigh, J. D., Cao, L., Atique, L., and Plancherel, Y.: Tropical Pacific climate variability under solar geoengineering: impacts on ENSO extremes, Atmos. Chem. Phys., 20, 15461–15485, https://doi.org/10.5194/acp-20-15461-2020, 2020.
Manzini, E., Karpechko, A. Yu., Anstey, J., Baldwin, M. P., Black, R. X., Cagnazzo, C., Calvo, N., Charlton-Perez, A., Christiansen, B., Davini, P., Gerber, E., Giorgetta, M., Gray, L., Hardiman, S. C., Lee, Y.-Y., Marsh, D. R., McDaniel, B. A., Purich, A., Scaife, A. A., Shindell, D., Son, S.-W., Watanabe, S., and Zappa, G.: Northern winter climate change: Assessment of uncertainty in CMIP5 projections related to stratosphere-troposphere coupling, J. Geophys. Res.-Atmos., 119, 7979–7998, https://doi.org/10.1002/2013JD021403, 2014.
Mills, M. J., Richter, J. H., Tilmes, S., Kravitz, B., MacMartin, D. G., Glanville, A. A., Tribbia, J. J., Lamarque, J., Vitt, F., Schmidt, A., Gettelman, A., Hannay, C., Bacmeister, J. T., and Kinnison, D. E.: Radiative and Chemical Response to Interactive Stratospheric Sulfate Aerosols in Fully Coupled CESM1(WACCM), J. Geophys. Res.-Atmos., 122, 13061–13078, https://doi.org/10.1002/2017JD027006, 2017.
National Research Council: Climate Intervention: Reflecting Sunlight to Cool Earth, National Academies Press, Washington, D.C., available at: https://www.nap.edu/catalog/18988/climate-intervention-reflecting-sunlight-to-cool-earth (last access: 1 May 2020), 2015.
Polvani, L. M. and Camargo, S. J.: Scant evidence for a volcanically forced winter warming over Eurasia following the Krakatau eruption of August 1883, Atmos. Chem. Phys., 20, 13687–13700, https://doi.org/10.5194/acp-20-13687-2020, 2020.
Polvani, L. M. and Kushner, P. J.: Tropospheric response to stratospheric perturbations in a relatively simple general circulation model, Geophys. Res. Lett., 29, 1114, https://doi.org/10.1029/2001GL014284, 2002.
Polvani, L. M., Banerjee, A., and Schmidt, A.: Northern Hemisphere continental winter warming following the 1991 Mt. Pinatubo eruption: reconciling models and observations, Atmos. Chem. Phys., 19, 6351–6366, https://doi.org/10.5194/acp-19-6351-2019, 2019.
Richter, J. H., Tilmes, S., Mills, M. J., Tribbia, J. J., Kravitz, B., MacMartin, D. G., Vitt, F., and Lamarque, J.: Stratospheric Dynamical Response and Ozone Feedbacks in the Presence of SO2 Injections, J. Geophys. Res.-Atmos., 122, 12557–12573, https://doi.org/10.1002/2017JD026912, 2017.
Richter, J. H., Tilmes, S., Glanville, A., Kravitz, B., MacMartin, D. G., Mills, M. J., Simpson, I. R., Vitt, F., Tribbia, J. J., and Lamarque, J.-F.: Stratospheric Response in the First Geoengineering Simulation Meeting Multiple Surface Climate Objectives, J. Geophys. Res.-Atmos., 123, 5762–5782, https://doi.org/10.1029/2018JD028285, 2018.
Robock, A.: The Climatic Aftermath, Science, 295, 1242–1244, https://doi.org/10.1126/science.1069903, 2002.
Robock, A. and Mao, J.: Winter warming from large volcanic eruptions, Geophys. Res. Lett., 19, 2405–2408, https://doi.org/10.1029/92GL02627, 1992.
Robock, A. and Mao, J.: The Volcanic Signal in Surface Temperature Observations, J. Climate, 8, 1086–1103, https://doi.org/10.1175/1520-0442(1995)008<1086:TVSIST>2.0.CO;2, 1994.
Robock, A., MacMartin, D. G., Duren, R., and Christensen, M. W.: Studying geoengineering with natural and anthropogenic analogs, Climatic Change, 121, 445–458, https://doi.org/10.1007/s10584-013-0777-5, 2013.
Robock, A., Oman, L., and Stenchikov, G. L.: Regional climate responses to geoengineering with tropical and Arctic SO2 injections, J. Geophys. Res., 113, D16101, https://doi.org/10.1029/2008JD010050, 2008.
Rogelj, J., den Elzen, M., Höhne, N., Fransen, T., Fekete, H., Winkler, H., Schaeffer, R., Sha, F., Riahi, K., and Meinshausen, M.: Paris Agreement climate proposals need a boost to keep warming well below 2 ∘C, Nature, 534, 631–639, https://doi.org/10.1038/nature18307, 2016.
Shepherd, T. G. and McLandress, C.: A Robust Mechanism for Strengthening of the Brewer–Dobson Circulation in Response to Climate Change: Critical-Layer Control of Subtropical Wave Breaking, J. Atmos. Sci., 68, 784–797, https://doi.org/10.1175/2010JAS3608.1, 2011.
Shindell, D. T., Schmidt, G. A., Mann, M. E., and Faluvegi, G.: Dynamic winter climate response to large tropical volcanic eruptions since 1600, J. Geophys. Res., 109, D05104, https://doi.org/10.1029/2003JD004151, 2004.
Simpson, I. R., Blackburn, M., and Haigh, J. D.: The Role of Eddies in Driving the Tropospheric Response to Stratospheric Heating Perturbations, J. Atmos. Sci., 66, 1347–1365, https://doi.org/10.1175/2008JAS2758.1, 2009.
Simpson, I. R., Hitchcock, P., Seager, R., Wu, Y., and Callaghan, P.: The Downward Influence of Uncertainty in the Northern Hemisphere Stratospheric Polar Vortex Response to Climate Change, J. Climate, 31, 6371–6391, https://doi.org/10.1175/JCLI-D-18-0041.1, 2018.
Simpson, I. R., Tilmes, S., Richter, J. H., Kravitz, B., MacMartin, D. G., Mills, M. J., Fasullo, J. T., and Pendergrass, A. G.: The Regional Hydroclimate Response to Stratospheric Sulfate Geoengineering and the Role of Stratospheric Heating, J. Geophys. Res.-Atmos., 124, 12587–12616, https://doi.org/10.1029/2019JD031093, 2019.
Soden, B., Wetherald, R. T., Stenchikov, G. L., and Robock, A.: Global cooling following the eruption of Mt. Pinatubo: A test of climate feedback by water vapor, Science, 296, 727–730, https://doi.org/10.1126/science.296.5568.727, 2002.
Song, Y. and Robinson, W. A.: Dynamical Mechanisms for Stratospheric Influences on the Troposphere, J. Atmos. Sci., 61, 1711–1725, https://doi.org/10.1175/1520-0469(2004)061<1711:DMFSIO>2.0.CO;2, 2004.
Thompson, D. W. J., Wallace, J. M., and Hegerl, G. C.: Annular Modes in the Extratropical Circulation. Part II: Trends, J. Climate, 13, 1018–1036, https://doi.org/10.1175/1520-0442(2000)013<1018:AMITEC>2.0.CO;2, 2000.
Tilmes, S., Richter, J. H., Kravitz, B., MacMartin, D. G., Mills, M. J., Simpson, I. R., Glanville, A. S., Fasullo, J. T., Phillips, A. S., Lamarque, J.-F., Tribbia, J., Edwards, J., Mickelson, S., and Ghosh, S.: CESM1(WACCM) Stratospheric Aerosol Geoengineering Large Ensemble Project, B. Am. Meteorol. Soc., 99, 2361–2371, https://doi.org/10.1175/BAMS-D-17-0267.1, 2018a.
Tilmes, S., Richter, J. H., Mills, M. J., Kravitz, B., MacMartin, D. G., Garcia, R. R., Kinnison, D. E., Lamarque, J.-F., Tribbia, J., and Vitt, F.: Effects of Different Stratospheric SO2 Injection Altitudes on Stratospheric Chemistry and Dynamics, J. Geophys. Res.-Atmos., 123, 4654–4673, https://doi.org/10.1002/2017JD028146, 2018b.
Tilmes, S., Richter, J. H., Mills, M., Kravitz, B., and MacMartin, D. G.: Stratospheric Aerosol Geoengineering Large Ensemble Project – GLENS, NCAR, https://doi.org/10.5065/D6JH3JXX, 2020.
Wittman, M. A. H., Charlton, A. J., and Polvani, L. M.: The Effect of Lower Stratospheric Shear on Baroclinic Instability, J. Atmos. Sci., 64, 479–496, https://doi.org/10.1175/JAS3828.1, 2007.
Zambri, B. and Robock, A.: Winter warming and summer monsoon reduction after volcanic eruptions in Coupled Model Intercomparison Project 5 (CMIP5) simulations, Geophys. Res. Lett., 43, 10920–10928, https://doi.org/10.1002/2016GL070460, 2016.
Each year of this simulation is, in fact, a spin-up run, initialized from 1 January of each year of the first four Base simulations, and these 1-year runs are combined to give a 20-year length for each member. We use these runs in preference to other continuously forced runs in Simpson et al. (2019), since the short lengths of the spin-up runs limit, by design, the surface warming from increasing stratospheric water vapor (Richter et al., 2017; Tilmes et al., 2018b). This would otherwise be a confounding influence on the surface climate responses of interest in this study, which is not present in the corresponding GEO8.5 simulations.
The sulfate injections in the GEO8.5 simulations are equivalent to several eruptions comparable to the 1991 Pinatubo eruption per year and are continuously applied for many decades.