the Creative Commons Attribution 4.0 License.
the Creative Commons Attribution 4.0 License.
 | 06 May 2021
Laboratory study of the collection efficiency of submicron aerosol particles by cloud droplets – Part I: Influence of relative humidity
Alexis Dépée
Thomas Gelain
Marie Monier
Andrea Flossmann
A new In-Cloud Aerosol Scavenging Experiment (In-CASE) has been conceived to measure the collection efficiency (CE) of submicron aerosol particles by cloud droplets. In this setup, droplets fall at their terminal velocity through a 1 m high chamber in a laminar flow containing aerosol particles. At the bottom of the In-CASE chamber, the droplet train is separated from the aerosol particle flow – droplets are collected in an impaction cup, whereas aerosol particles are deposited on a high-efficiency particulate air (HEPA) filter. The collected droplets and the filter are then analysed by fluorescence spectrometry since the aerosol particles are atomised from a sodium fluorescein salt solution (C20H10Na2O5). In-CASE fully controls all the parameters which affect the CE – the droplets and aerosol particles size distributions are monodispersed, the electric charges of droplets and aerosol particles are controlled, and the relative humidity is indirectly set via the chamber's temperature. This novel In-CASE setup is presented here as well as the first measurements obtained to study the impact of relative humidity on CE. For this purpose, droplets and particles are electrically neutralised. A droplet radius of 49.6±1.3 µm has been considered for six particle dry radii between 50 and 250 nm and three relative humidity levels of 71.1±1.3 %, 82.4±1.4 % and 93.5±0.9 %. These new CE measurements have been compared to theoretical models from literature which adequately describe the relative humidity influence on the measured CE.
- Article
(1703 KB) - Full-text XML
- BibTeX
- EndNote


Every year, several billion tonnes of particulate matter are emitted in the atmosphere, originating mainly from oceans, soils, gas-to-particle conversion, evaporating clouds and from human activities (Jaenicke, 1993). During the last decades, the life cycle of these aerosol particles (APs) has been a key topic in atmospheric science for many reasons. First, APs play a key role in weather and climate. They act on cloud formation, and their chemical composition, size distribution and number concentration affect the droplet size distributions and precipitation (Tao et al., 2012). They also have an impact on the cloud cover, which in turn modulates albedo (Twomey et al., 1974) – influencing the Earth's energy budget. Moreover, anthropogenic APs have also been reported to impact human health (Dockery et al., 1992). In fact, the Great Smog of London in 1952, one of the best-known related events, caused up to 12 000 deaths (Bell et al., 2004). Radioactive material released from a nuclear accident is another AP pollution hazard. Indeed, many studies revealed that radioactive material like caesium-137 isotopes can attach to the atmospheric APs and were transported over long distances on a continental scale both after the Chernobyl (Devell et al., 1986; Jost et al., 1986; Pölläen et al., 1997) and the Fukushima (Kaneyasu et al., 2012; Adachi et al., 2013) nuclear accidents in 1986 and 2011, respectively. With a half-life of up to 10 years, caesium-137 can remain for decades in the atmosphere – following resuspension cycles of the atmospheric APs – and jeopardise both ecosystems and human health.
Thus, it is essential to understand the two mechanisms which move atmospheric APs back to the ground. APs can settle through many effects like gravity, wind, surface forces and turbulence. This is referred to as dry AP deposition. There is also the wet AP deposition due to the interactions between APs and clouds or their precipitations. The present paper deals with the wet removal since, far away from the source, it is the main mechanism involved in the AP scavenging (Jaenicke, 1993). Note that Flossmann (1998) numerically showed that the wet deposition is mainly induced by the in-cloud AP collection since 70 % of the AP mass contained in raindrops reaching the soil comes from the cloud. This result is consistent with the environmental measurements of Laguionie et al. (2014), who evaluated the cloud contribution up to 60 % in the wet AP deposition. The in-cloud AP scavenging is subdivided into two mechanisms – AP activation to form cloud hydrometeors and AP collection by clouds hydrometeors. The in-cloud AP collection is therefore a fundamental climate, weather and health issue. In most of current AP wet removal models – like DESCAM (Detailed Scavenging Model, Flossmann, 1985) – the AP collection is described through a microphysical parameter called “collection efficiency” (CE), which quantifies the ability of a droplet to capture the APs present in its surroundings during its fall. It is the ratio between the AP number (or mass) collected by the droplet over the AP number (or mass) within the volume swept by the droplet for a given AP radius. Another equivalent definition is the ratio of the cross-sectional area inside which the AP trajectories are collected by the droplet over the cross-sectional area of the droplet.
Many microphysical effects influence this CE, and their contribution is mainly dependent on the AP size. To be collected an AP has to deviate from the streamline around the falling droplet to make contact with it. The nanometric AP's trajectory is affected by the collisions with air molecules – referred to as the Brownian diffusion. It results in random movement patterns (see Fig. 1a) which tend to increase the CE when the AP radius decreases. For massive APs, there is an increase in CE as they retain an inertia strong enough to deviate significantly from the streamline when it curves and to move straight toward the droplet surface – known as inertial impaction (see Fig. 1b). When considering intermediate AP size, the CE goes through a minimum value called the “Greenfield gap” (Greenfield, 1957) where the AP diffusion and inertia are weaker. In this gap, other microphysical effects can be involved to make the droplet encounter the AP, like the interception for instance. It is the collection of APs following a streamline that approaches the droplet within a distance equivalent to the particle radii (a) – see Fig. 1c. Note that the electrostatic forces can have a significant influence on the CE (Tinsley and Zhou, 2015; Dépée et al., 2019). This effect will be discussed in a companion paper (Dépée et al., 2021) of this work.
There are also thermophoretic and diffusiophoretic effects which can influence the CE. In clouds, they shall favour the CE increase when evaporation occurs and decrease CE during condensation (due to a thermal equilibrium between the droplet and the air). Thermophoresis exists when a thermal gradient prevails between the air and the droplet. When the relative humidity (RH) is below 100 %, the evaporating droplet's surface temperature (Td,s) is colder than the bulk air temperature (Tair). The average kinetic energy of air molecules is then decreasing when approaching the droplet's surface. An AP is thus attracted by a thermophoretic force near the evaporating droplet (see Fig. 1f) caused by the asymmetry in kinetic energy transferred during each collision. Diffusiophoresis occurs in an environment where a gradient of vapour density in the air exists such as in the surrounding of an evaporating droplet. In this case, water molecules diffuse toward the surrounding air while the air molecules diffuse toward the droplet surface. In clouds, since the water molar mass is lower than the air molar mass, there is an asymmetry in the momentum transferred to APs close to the evaporating droplet produced by collisions with the molecules from the continuous phase. This diffusion tends to attract the AP to the droplet. Nonetheless, in order to maintain a constant air pressure at the droplet surface, a hydrodynamical flow directed toward the air is induced – this is the Stefan flow. The hydrodynamical drag induced by the Stefan flow tends to repulse APs from an evaporating droplet. Diffusiophoresis is the sum of the drag force produced by the Stefan flow and the momentum transferred to APs (located in a diffusion boundary layer), due to the dissymmetry of molecular weight. Note that the Stefan flow (repulsive around an evaporating cloud droplet) is on average 5 times larger than the addition to the diffusion flows (attractive around an evaporating cloud droplet) as mentioned by Santachiara et al. (2012). So, diffusiophoresis repulses APs from the evaporating droplet (see Fig. 1d), which in turn decreases the CE. Finally, since the amplitude of the thermophoresis is on average twice as large as the diffusiophoresis (Tinsley et al., 2006), APs are ultimately attracted toward droplets in subsaturated air due to these phoretic effects (see Fig. 1e). Thus, the coupling of the thermophoresis and diffusiophoresis increases the CE when the relative humidity decreases.
The influence of the relative humidity on the CE is described by the well-known Wang et al. (1978) model, which is used in many cloud models like DESCAM (Flossmann, 1985). Since their model predicts an important contribution of thermophoresis and diffusiophoresis on the CE for cloud droplet radii (A<100 µm) and submicron AP radii, it is desirable to validate those theoretical CEs through experiments. A review of available CE measurements can be found in Ardon-Dryer et al. (2015). The only experimental study that tackles the influence of the relative humidity on the CE for cloud droplets is the one of Ardon-Dryer et al. (2015), which tested two levels of relative humidity of 15 % and 88 %. However, in their work they report that the measured electric charge on the droplets were 400±400 elementary charges, and on the APs they were 1 elementary charge. Therefore, the electrostatic forces should have had a significant influence on the measured CE for the droplet radius considered (A≈21.6 µm) as numerically shown by Tinsley and Zhou (2015). Furthermore, there are no similar measurements for other cloud droplet sizes either for high levels of relative humidity as found in cloud.
The purpose of this work is to fill up the deficiency of data in this area. Thus, a novel experiment has been developed in order to study the influence of the relative humidity on the CE to assess the magnitude of the thermophoretic and diffusiophoretic processes. With this experiment, the influence of electric charges can also be investigated, and this is the objective of the companion paper (Dépée et al., 2021).
After the introduction, the experimental setup is detailed, while the experimental method to evaluate the CE and the uncertainties are described in Sect. 3. Section 4 is dedicated to the new CE measurements which are presented and compared to theoretical data from the Wang et al. (1978) Eulerian model. Another comparison is made in the last section to the newer Lagrangian model of Dépée et al. (2019) since it can model every microphysical effect involved in the AP collection by cloud droplets (like Brownian motion, inertial impaction and interception) and especially their coupling. Dépée et al. (2019) focused on the electrostatic forces but did not consider the thermophoresis and the diffusiophoresis. Here, we extend the Dépée et al. (2019) model by adding these phoretic effects. Finally, this study experimentally validates the Dépée et al. (2019) model, which provides consistent theoretical CEs for a convenient incorporation in cloud models, pollution models, climate models and so forth.
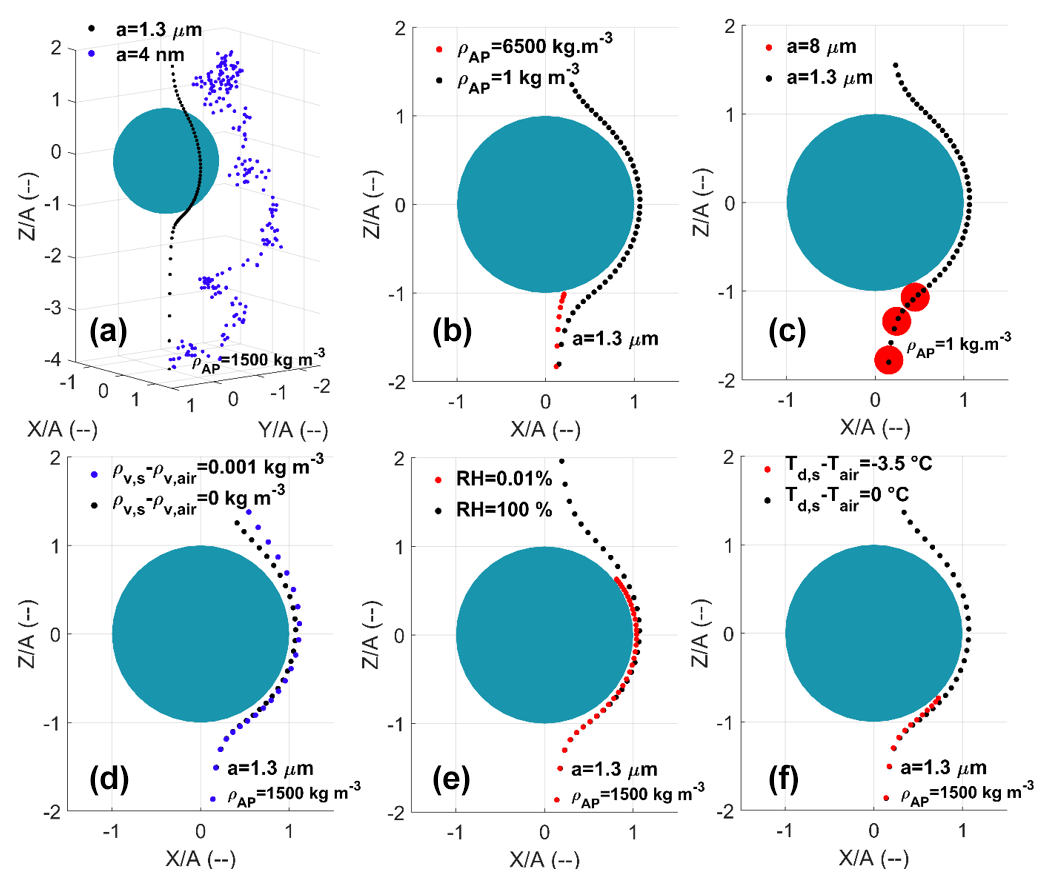
Figure 1AP trajectories computed with the extended Dépée et al. (2019) model for a 50 µm droplet radius (A) and AP with various radii (a) and densities (ρAP). The air temperature (Tair) and the air pressure (Pair) are −17 ∘C and 540 hPa respectively. The panels indicate the effects of Brownian motion (a), inertial impact (b), interception (c), diffusiophoresis (d), combined thermophoresis and diffusiophoresis (e), and thermophoresis (f). Red trajectories result in an AP collection. (d, f) The gradients are equivalent to a relative humidity of 0.01 % (when there is no gradient the equivalent relative humidity is 100 %). ρv,s and ρv,air are the vapour densities at the droplet surface and in the bulk air, respectively.
2.1 Overview
All measurements were conducted inside the In-Cloud Aerosol Scavenging Experiment (In-CASE). Figure 2 shows the airflow diagram with the different parts of the experiment in order to study the relative humidity influence on the CE. The major In-CASE component is the collision chamber (Fig. 2) where a laminar flow containing APs interacts with a train of droplets falling at terminal velocity. In this chamber, the droplet and AP size distributions are monodispersed, and for this particular work the droplet and AP electric charges are neutralised. Droplets are generated through a piezoelectric inductor and neutralised with an electrostatic inductor (detailed in Sect. 2.4), and the radius is measured by optical shadowgraphy with a strobe and a camera (brown, Fig. 2). In Fig. 2, orange shows the AP generation (which is described in Sect. 2.3), black shows an exhaust used to evacuate the AP flow rate surplus at the atomiser's outlet, red shows an Argon flow injected into the In-CASE chamber's bottom part to separate droplets from the AP flow (this is detailed in “AP and droplet separation” in Sect. 2.2.2) and purple indicates the AP flow which leaves the chamber toward a high-efficiency particulate air (HEPA) filter.
The relative humidity in the collision chamber is set through the temperature, with the latter being controlled via a cooling system. In the next sections, the In-CASE chamber as well as the droplets and AP characterisation are described.
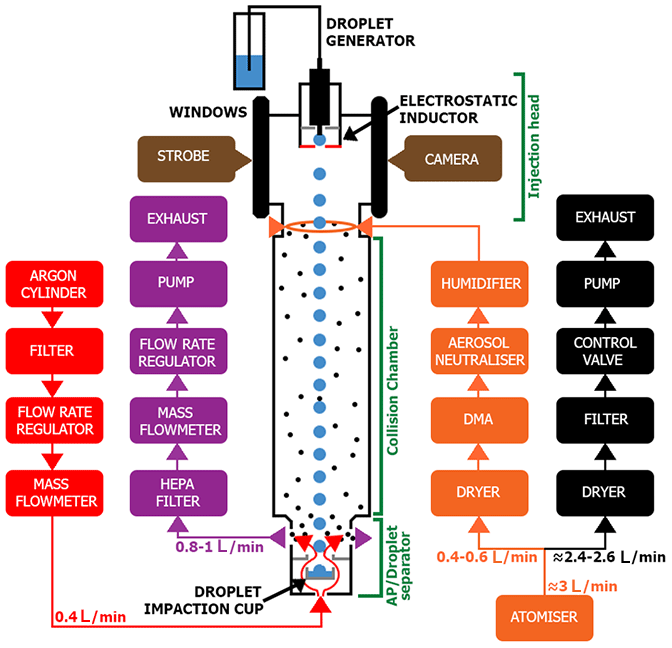
Figure 2In-CASE setup to study the influence of relative humidity. Colours represent different functions. Red represents upward Argon flow against AP pollution in the droplet impaction cup. Purple represents AP (and Argon) evacuation toward the HEPA filter. Orange represents AP, generation, selection and neutralisation. Black represents surplus evacuation and differential mobility analyser (DMA) flow rate control. Brown represents droplet radius measurement. All the key features of the setup are detailed in Table 2.
2.2 In-CASE chamber
The In-CASE chamber (see Fig. 2) is subdivided into three stages – the injection head, the collision chamber and the In-CASE chamber's bottom part. These three parts will be detailed in the next subsections.
2.2.1 Injection head
The injection head is composed of two parts – the droplets and the AP injection. The upper part is used to inject the droplets while the APs are injected in the second part about 10 cm below. This distance is required to measure the droplet size through the two facing windows (see Sect. 2.4.1) but also to let droplets decelerate and reach their terminal velocity.
The droplet train is injected through a housing made with a 3D printer set at the top of the droplet injector (see Fig. 3). This housing has been constructed to precisely place the droplet generator and the electrostatic inductor together. Indeed, the electrostatic inductor has to keep the same position relative to the droplet generator to prevent changes in the electric field Eind, which in turn can disturb the droplet charge and stop the neutralisation (detailed in Sect. 2.4.2).
The APs are injected from the sides of the entire circumference through a flat torus inlet. This injection principle is based on the CLINCH experiment (CoLlision Ice Nucleation CHamber, Ladino et al., 2011), which ensures a laminar flow and a great spatial APs mixture in the collision chamber's inlet.
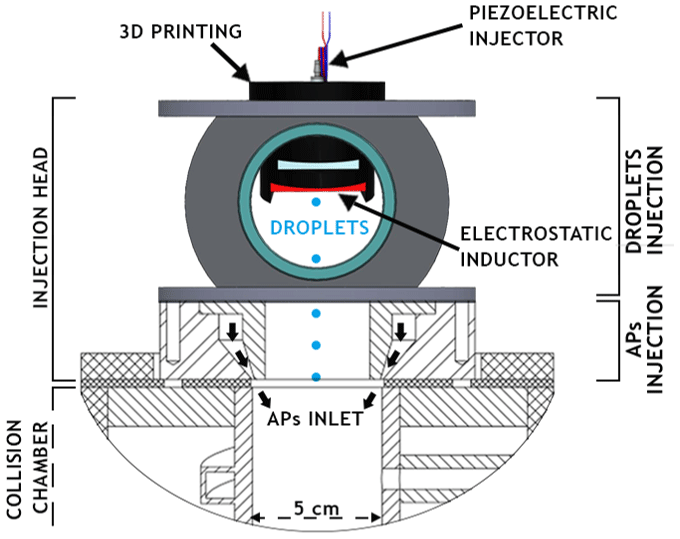
Figure 3View of the In-CASE chamber's top with the injection head where APs and droplets are injected into the collision chamber.
2.2.2 In-CASE bottom stage
The CE is calculated from the AP mass collected by the droplets during an experiment and the average AP mass concentration in the collision chamber. To obtain these quantities, the droplet train must be separated from the interstitial APs (which were not collected).
AP and droplet separation
The system developed to separate the droplet train from the AP flow is presented in Fig. 4. It is composed of a converging portion (from 5 to 3 cm in diameter) where a gutter is inserted to prevent the water condensed on the wall from entering to the In-CASE chamber bottom. The APs are directly vacuumed toward a HEPA filter (see Fig. 2) at the upper part of the separator through four outlets while the droplets – containing collected APs – are impacted into a cup at the separator's lower part.
To prevent AP pollution in the droplet impaction cup, a counterflow is injected below the In-CASE chamber and passes through the droplet impaction cup from nine holes set on its entire circumference. Since the counterflow is injected at the laboratory temperature, and the AP downward flow is colder, Argon – denser than the air – was selected to avoid any Rayleigh–Taylor instability (Sharp, 1983).
Argon is injected at 0.4 L min−1. The diameter of the nine holes is 4 mm, and the top of the droplet impaction cup is 2.5 cm. Thus, the upward Argon flow is injected at 5.9 and 1.4 cm s−1, through the nine holes and the top of the impaction cup, respectively. Because the droplet velocity is about 25 cm s−1 (for the 50 µm droplet radius studied) and the AP terminal velocity is less than 10−3 cm s−1, APs cannot settle into the impaction cup, whereas droplets are impacted without undue disruption.
Validation
The droplet and AP separation were verified with two tests. First, In-CASE was run under standard experimental conditions except no droplets were generated. After 5 h of experiment, a spectrometry analysis was performed in the droplet impaction cup, and no fluorescein was detected. Thus, no AP had settled on the droplet impaction cup during the experiment.
The second test was to ensure that droplets were collected by the impaction cup. Then, In-CASE was again run like a typical experiment except the flow passing through the In-CASE chamber was clean air without any AP. Droplets were tracked by adding sodium fluorescein salt in the water supplying the piezoelectric injector. Since the concentration of sodium fluorescein salt in the water, the droplet generation frequency, the droplet size and the experiment time were known, the goal was to verify if the expected fluorescein mass in the droplets and the actual measured fluorescein mass were equal. After 5 h (=450 000 injected droplets), a discrepancy of 2 % between expected and measured fluorescein mass was obtained. Therefore, all droplets are considered impacted in the impaction cup.
Finally, this indicates that the AP mass detected in the droplet impaction cup after the experiment effectively results from collection by drops in the In-CASE collision chamber and not from contamination from other sources.
2.2.3 Collision chamber
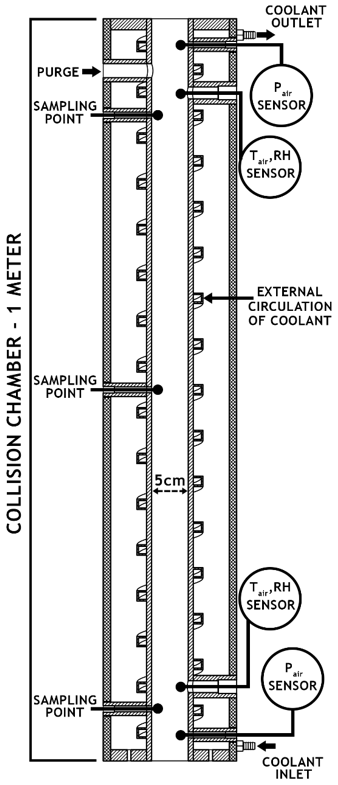
The collision chamber is a 1 m stainless steel cylinder with an inner diameter of 5 cm (see Fig. 5). The collision chamber's temperature is controlled through a coolant which spirally circulates outside the chamber, from the bottom to the top of the collision chamber. The pressure (Pair), temperature (Tair) and relative humidity (RH) are measured at the top and the bottom by sensors. To clean the chamber, water or compressed dried air is injected via a purge. Three sampling points are available but were not used for these experiments.
The temperature and the relative humidity discrepancies between top and bottom were respectively less than 1 ∘C and 4 % in all the CE measurements – the mean values are then considered for both parameters.
Thermodynamic conditions
All the experiments were conducted at atmospheric pressure. To get comparable CE measurements, the temperature has been set to 0.58±0.50 ∘C – as constant as possible between experiments. Three levels of relative humidity (RH) were considered – 71.1 %, 82.4 % and 93.5 %. To increase the relative humidity at a given collision chamber temperature, the temperature of the pure water in the humidifier (Fig. 2) was increased. The relative humidity level of 71.1 % was obtained by completely removing the humidifier to get the driest AP flow possible at the collision chamber's inlet. At lab temperature (about 22 ∘C), the relative humidity of the dry AP flow ranged from 10 % to 20 % at the In-CASE chamber inlet.
Note that the AP flow before the injection head is also thermally set to inject APs with the same temperature as in the collision chamber.
Droplet evaporation
The change in droplet radius due to evaporation in the collision chamber is calculated according to the Sect. 13.2 of Pruppacher and Klett (1997). The corresponding terminal velocity ( cm s−1) is computed from Beard (1976). The residence time of the droplet in the chamber (≈4 s) is computed considering these two changes. Since the droplet radius only decreases around 3 % by evaporation with the lower relative humidity considered in the experiments (71.1 %), the droplet evaporation in the collision chamber is neglected.
AP hygroscopicity
The APs are composed of pure sodium fluorescein salt, which is a high hygroscopic chemical compound. The APs inside the collision chamber then grow to reach their equilibrium size with the relative humidity (RH). In order to evaluate the increase in size by humidification, the AP growth factor (GroF) measured in Quérel et al. (2014) was considered. The growth factor is defined as the ratio of the size of the wet AP over the size of the dry AP. Since their data are limited to relative humidity levels below 90 %, the kappa theory described in Petters and Kreidenweis (2007) is used to extrapolate to the required values. To fit the measurements of Quérel et al. (2014) with the kappa theory, only their data with a relative humidity level less than 85 % were considered. Figure 6 shows the AP growth factor related to the relative humidity for a kappa value of 0.23 and two extreme values of 0.2 and 0.27 – fitting to the sodium fluorescein salt hygroscopicity.
Thus, for relative humidity levels of 71.1 %, 82.4 % and 93.5 % studied here, a dry AP radius of 50 nm selected by the differential mobility analyser (DMA) grows with a growth factor (GroF) of 1.16, 1.27 and 1.57, respectively. Consequently, the CEs measured are applied for size of respectively 58.0, 63.5 and 78.5 nm AP radii.
Note that the AP density is not the one of sodium fluorescein salt (ρfluorescein=1580 kg m−3) since APs contain water. Indeed, the water density (ρwater) should be considered in the AP density (ρAP) calculation. At a given relative humidity (RH), the AP density inside the chamber is then deduced by Eq. (1):
Since the relative humidity after the dryer (see Fig. 2) ranges from 10 % to 20 %, the AP growth factor is less than 1.02 (see Fig. 6) in the DMA. APs are then considered dry when exiting the DMA.
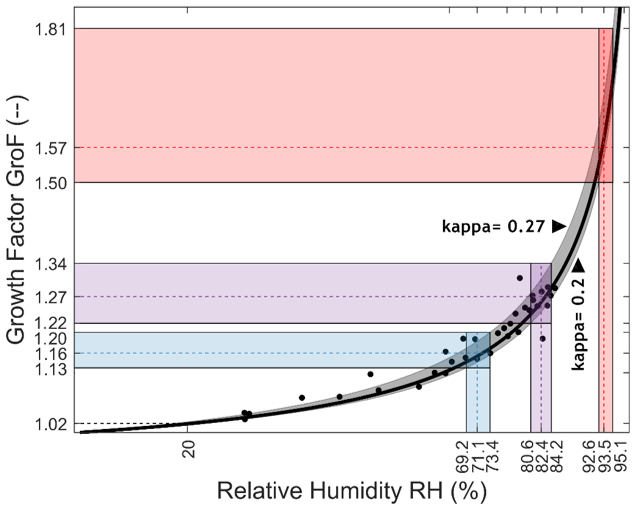
Figure 6Growth factor (GroF) as function of the given relative humidity (RH). Data points (dots) from Quérel et al. (2014) and fits (lines) with the kappa theory (Petters and Kreidenweis, 2007).
2.3 AP generation
APs are generated by the atomisation (atomiser, TSI 3076) of a sodium fluorescein salt solution (C20H10Na2O5). This molecule has been selected for its significant fluorescent properties, detectable at very low concentrations (down to 10−10 g L−1). Once atomised, the fine droplets go through a dry diffuser to produce dry APs. In Fig. 7, two AP size distributions are presented for two different concentrations of the sodium fluorescein salt solution considered – 36 and 100 g L−1 – during the experiments. Those two size distributions have been evaluated using a scanning mobility particle sizer (SMPS). It was observed that the size distribution mode passes from 41 to 67.9 nm in radius when the concentration becomes 3 times larger. Since the geometric standard deviation (σg) is above 1.75, a differential mobility analyser (DMA; TSI 3080) is set between the atomiser and the In-CASE chamber to reduce the dispersion of the AP size distribution. After exiting the DMA, the AP flow goes through a low-energy X-ray neutraliser (< 9.5 keV, TSI 3088) so that the AP charge distribution entering the In-CASE chamber is similar to a Boltzmann distribution. After the neutralisation, the dry AP flow is humidified by a pure water container in order to get high relative humidity in the collision chamber.
Note that the DMA selects APs according to their electrical mobility – Z in Eq. (6) – assuming that only single charged APs can leave the DMA. Actually, depending on the AP size distribution and the AP flow rate in the DMA, larger AP radii carrying multiple charges than the one considered can also be selected. Sometimes those multiple charged APs cannot be neglected as discussed in Sect. 3.2.

Figure 7Two typical AP size distributions obtained with a SMPS at the atomiser's outlet. The concentration of the sodium fluorescein salt solution is 36 g L−1 (a) and 100 g L−1 (b). Dmax and D50 % are respectively the maximum diameter selected by the DMA and the cut-off diameter of the impactor at the DMA's inlet, at a given AP flow rate (0.6 L min−1).
2.4 Droplet characterisation
2.4.1 Droplet generation frequency and size measurement
The droplet generator used for these experiments is a piezoelectric injector provided by Microfab – the MJ-ABL-01 model with an internal diameter of 150 µm. This model has been used for its stability over time, since the experiments can last up to 5 h. This piezoelectric injector generates droplets – at a given frequency – above their terminal velocity. The distance between two following droplets reduces when droplets fall away from the injector's nozzle since the droplet velocity decreases (see Fig. 8, left). It was emphasised during ex situ experiments that droplet generation frequencies greater than 25 Hz induce droplet coalescence since the inter-droplet space becomes too short to prevent droplets from aerodynamically disturbing each other. This agrees with Ardon-Dryer et al. (2015), who observed droplet coalescence for droplet generation frequency larger than 30 Hz operating a similar piezoelectric injector. Thus, droplets were generated at 25 Hz in all experiments presented in this current paper.
The droplet generator is placed at the top of the In-CASE collision chamber, within an injection head (see Fig. 3). A few times during an experiment, droplet pictures are recorded by optical shadowgraphy through two facing windows in the injection head (see Fig. 3). A circle Hough transform is then applied to evaluate the droplet radii in the recorded pictures. An example is given in Fig. 8 (right) for a 49.7 µm droplet radius. Note that the size distributions of the droplets generated by the piezoelectric injector are considered monodispersed since the droplet size dispersion is very low (σ∼1 %).
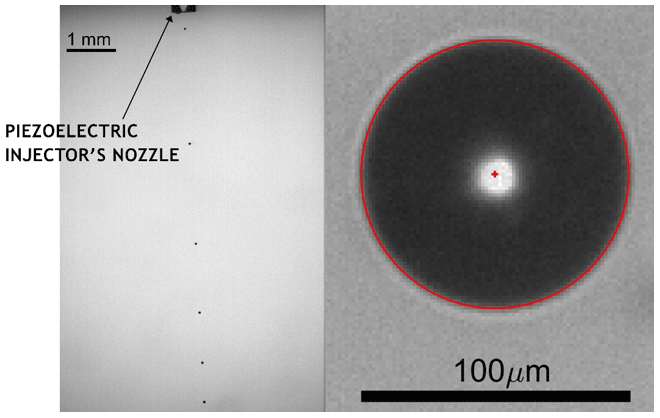
Figure 8(Left) Droplet train at the piezoelectric injector's outlet obtained by optical shadowgraphy – the droplet generating frequency is 200 Hz. (Right) A droplet picture obtained by optical shadowgraphy – the droplet radius and centre are detected through a circle Hough transform (red cross and line).
2.4.2 Droplet charge neutralisation
It is well know that the piezoelectric droplet generator produces highly electrically charged droplets. With a similar device, Ardon-Dryer et al. (2015) measured up to 104 elementary charges on the generated droplets. Since this paper focused only on the relative humidity influence, the droplets, as well as APs, must be neutralised.
To do so, an electrostatic inductor was built following Reischl et al. (1977). Two parallel metal plates are placed at the droplet generator's nozzle – this is the electrostatic inductor shown in Fig. 9 (labelled 1, left). One plate is connected to a potential (Vind) while the other is connected to the neutral potential – as presented in Fig. 9 – in order to induce an electric field (Eind∼102–103 V m−1). Sodium chloride is added to the pure water that feeds the piezoelectric injector. According to the generated electric field polarity, the system can selectively attract negative or positive ions toward the nozzle where the droplet is formed. If Vind is positive, the negative chloride ions (Cl−) migrate toward the nozzle and the positive sodium ions (Na+) are repulsed from the nozzle and inversely if the potential is negative. Following the electric field amplitude – through Vind – the ion quantity can be set. This system can conclusively control the droplet charge. Note that the sodium chloride concentration has no effect on the principle of induction used here since the ion number is large enough for the entire experiment period (Reischl et al., 1977) – 3.3 g L−1 has been considered.
To evaluate the droplet charge and then neutralise the droplets, an ex situ experiment has been conducted where the droplet train passed through a capacitor (labelled 2, Fig. 9, left). One capacitor's plate is connected to the neutral, whereas the other is connected to a high potential (Vcap) – inducing an electric field (Ecap∼105–106 V m−1). A Faraday cage surrounding the capacitor and a plate maintained at a neutral potential are set in order to prevent the electric field at the capacitor (Ecap) from disturbing the electric field at the inductor (Eind), which could change the droplet charge. Finally, the potential Vind which electrically neutralises the droplet is found by selecting for the Vind value which minimises the droplet train deflection.
Actually, this system can also be used to precisely evaluated the electric charges on the droplets (for both polarities); this method is applied and presented in Dépée et al. (2021).
Note that the droplet charge induced by the piezoelectric injector has been calculated to −8400 elementary charges – in line with Ardon-Dryer et al. (2015) using a similar generator. Moreover, after the droplet neutralisation, an uncertainty of 600 elementary charges was estimated.
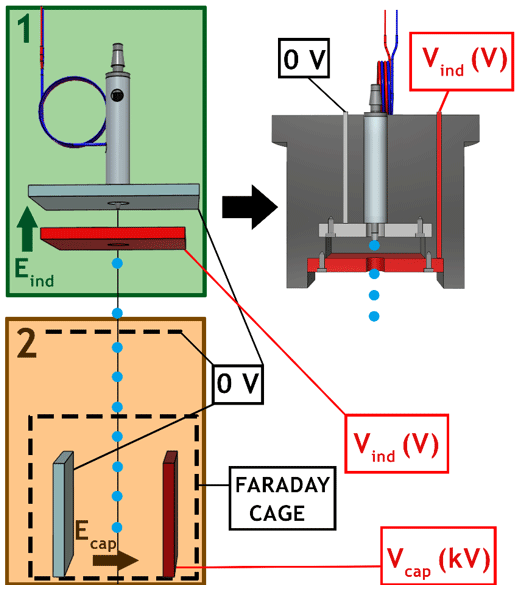
Figure 9(Left) 1 – Electrostatic inductor set at the piezoelectric injector's nozzle to electrically neutralise the droplets. 2 – Capacitor used to analyse the droplet deviation caused by the electric field in the capacitor (Ecap). (Right) Housing made with a 3D printer containing the piezoelectric injector and the electrostatic inductor, set in the injection head (see Fig. 3).
3.1 Definition of the collection efficiency
At the end of an experiment, the collection efficiency (CE) is calculated from Eq. (2):
where the AP mass collected by all droplets (mAP,d) is directly measured by spectrometry analysis in the droplet impaction cup (see Fig. 4), while the mass of available APs in the volume swept by the droplets (mAP,available) is given by Eq. (3):
Fd and Δt are respectively the droplet generation frequency and the experiment duration – the product of those two quantities is the number of droplets injected during an experiment. Cm,AP is the mean AP mass concentration in the In-CASE collision chamber. Note that a is the AP dry radius corrected by the growth factor (GroF) which depends on the relative humidity (see “AP hygroscopicity” in Sect. 2.2.3). Heff is the effective height of interaction between droplets and APs. Since the APs are also falling in the In-CASE collision chamber, this height is not the In-CASE collision chamber's height (HIn-CASE) but is equal to Eq. (4):
However, as the droplet terminal velocity (UA,∞) is about 25 cm s−1 and the maximum AP flow velocity (VQ) considered in the In-CASE collision chamber during the experiment is 5 mm s−1 (for an AP flow rate of 0.6 L min−1), these two heights are thus considered equal (Heff∼HIn-CASE).
In Eq. (3), the mean AP mass concentration in the In-CASE collision chamber is estimated from the fluorescence spectrometry analysis of the HEPA filter though Eq. (5):
QIn-CASE,c is the AP flow rate within the In-CASE collision chamber.
3.2 DMA selection – multiple charged AP's principle
As previously stated, the AP flow travels through a DMA to select the particles according to their electrical mobility (Z), which is defined by Eq. (6):
where n, Cu and ηair are respectively the number of elementary charges (e), the Cunningham correction coefficient and the air dynamic viscosity (expressed here in poise).
Thus, for an AP radius selected by the DMA, all particles with the same ratio are actually selected. For example, when an AP with a radius of 50 nm is selected (single charged), the AP radii of 75.8 nm (double charged) and 98.2 nm (triple charged) will also be selected and progress into the In-CASE collision chamber since they have the same electrical mobility. In this paper, “multiple charged APs” refer to the APs with the same electrical mobility as those with single charge selected by the DMA.
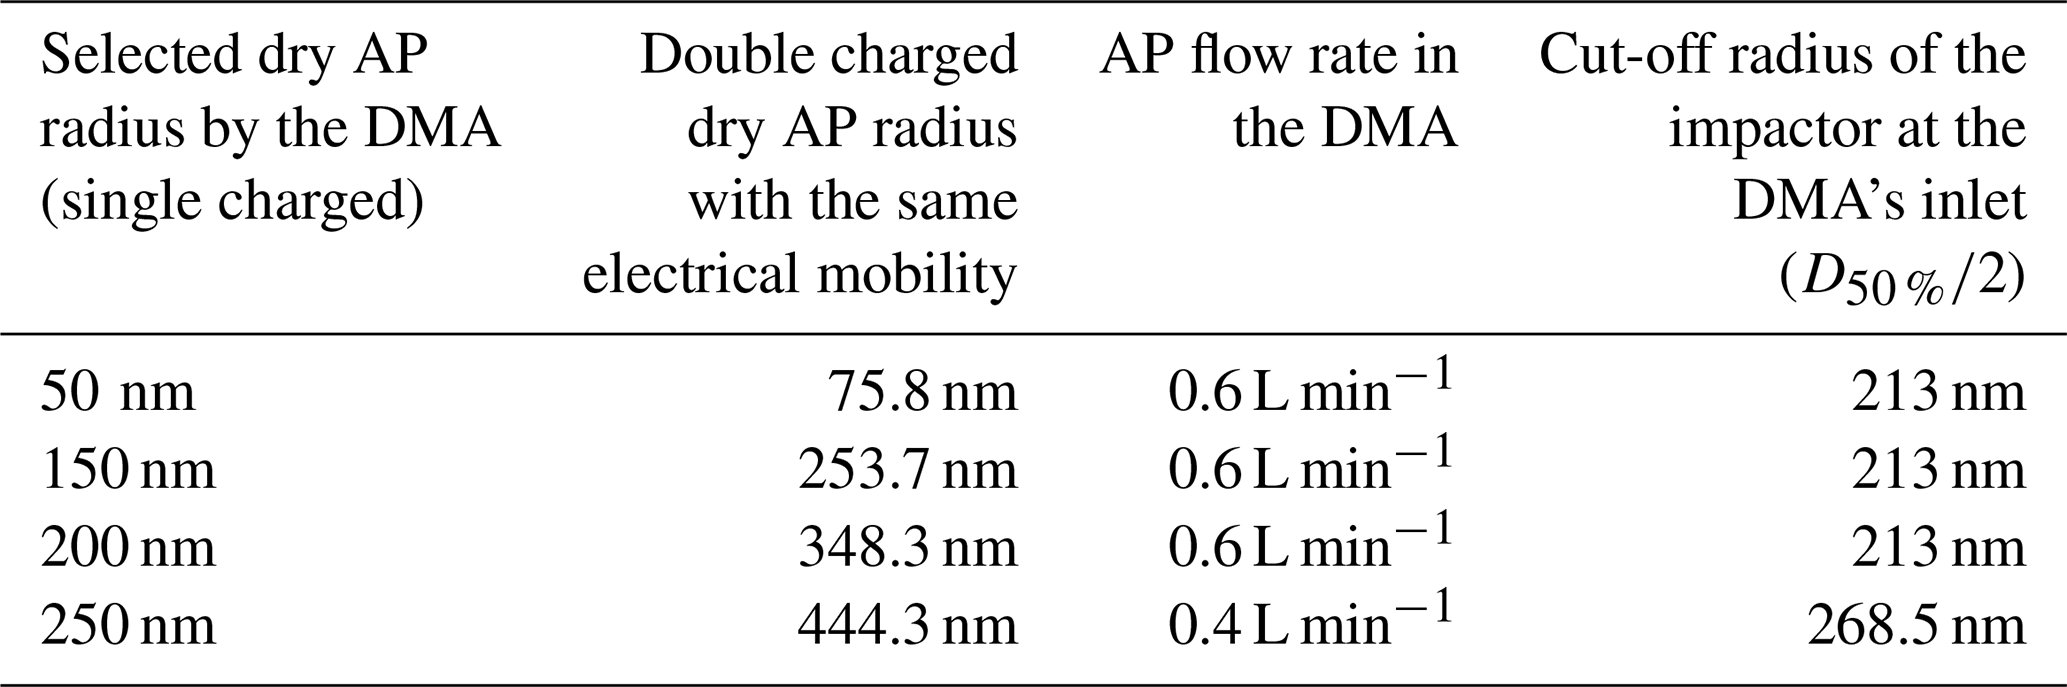
At the DMA's inlet, an aerodynamic impactor is placed to prevent the heaviest APs from entering the DMA. Thus, for a given AP flow rate in the DMA, the multiple charged APs can be impacted at the DMA's inlet and can then be neglected at the DMA's outlet. To evaluate this case, the cut-off radius of the impactor at the DMA's inlet must be considered (referred to as ). This radius is defined as the one where 50 % of the APs are impacted. The Table 1 shows this parameter for every AP flow rate used during the experiment and for a given selected AP radius. The double charged AP radius with the same electrical mobility as the selected AP radius (single charged) is also indicated – when this latter size is large enough compared to the cut-off radius, it is assumed that there is no contribution of the multiple charged APs in the CE measurement. This is the case for a selected AP radius of 200 or 250 nm where the AP size distribution at the DMA's outlet can be considered purely monodispersed.
However, for a selected AP radius of 50 or 150 nm, according to Table 1, the multiple charged AP radii cannot be neglected. Different experiments were run to perform a deconvolution of their respective contributions in the final CE calculation. This method is presented in Appendix A.
3.3 Uncertainty evaluations
3.3.1 AP radius uncertainty
The first AP radius uncertainty is related to the AP selection by the DMA. Nevertheless, this uncertainty has been neglected since the spectral bandwidth of the DMA is quite small compared to the AP radius uncertainty addressed below.
Indeed, the only significant AP radius uncertainty results from the effective AP radius inside the In-CASE collision chamber due to the hygroscopicity of the APs. For the relative humidity levels studied (71.1 %, 82.4 % or 93.5 %), the extreme relative humidity levels measured in all experiments are considered – for 71.1 %, the minimum and maximum values are 69.2 % and 73.4 %, respectively. As a reminder, the kappa value is assumed from the Quérel et al. (2014) data and ranges from 0.2 to 0.27 (see Fig. 6). The low uncertainty for the AP radius is then evaluated by considering the minimum growth factor (GroF) in Fig. 6 for the lower level of relative humidity measured and the lower kappa value determined – respectively 69.2 % and 0.2. Similarly, for the same example (RH = 71.1 %), the high uncertainty for the AP radius is estimated by evaluating the maximum growth factor – for the maximum level of relative humidity observed and the maximum kappa value assumed – respectively 73.4 % and 0.27. In this example, for a dry AP radius of 50 nm selected by the DMA, its wet radius in the In-CASE collision chamber is likely to be 58 nm (GroF = 1.16), ranging from 56.5 nm (GroF = 1.13) to 60 nm (GroF = 1.20) resulting from the respective low and high uncertainties.
3.3.2 Uncertainty of the collection efficiency
Since the method of CE evaluation differs in the presence of multiple charged APs, the uncertainty calculation is also different depending on the situations. The method is described in Appendix B.
When there are no multiple charged APs in the AP flow, the CE is directly estimated through Eq. (3), which can be rewritten as Eq. (7):
where Nd is the number of injected droplets during the experiment. The relative CE uncertainty (uCE) is then evaluated according to Lira (2002) and summarised by Eq. (8),
with the following.
-
The relative uncertainty related to the droplet radius measurement (uA), which is the ratio between the standard deviation and the mean droplet radius on 200 pictures obtained by optical shadowgraphy. This relative uncertainty is about 1 %.
-
The relative uncertainty of the effective height of interaction between droplets and APs (), which is 4 %. Indeed, it has been evaluated that a maximum of 4 cm is required to assure a good AP mixing at the injection in the collision chamber of 1 m height (HIn-CASE).
-
The relative uncertainty of the number of droplets () which can be correlated to the droplet number effectively impacted on the droplet impaction cup. This relative uncertainty was evaluated during the validation of AP and droplet train separation (“Validation” in Sect. 2.2.2) and is about 2 %.
-
The relative uncertainty of the detected AP mass in the droplet impaction cup (), which takes into account the relative uncertainty related to the spectrometry analysis (ufluorimeter) and the one caused by the dilution (udilution), Eq. (9). Indeed, at the end of an experiment the water contained in the droplet impaction cup is dried and the residual AP mass is then dissolved in 2 mL volume of ammonia water.
where udilution is estimated at 1 % while ufluorimeter is the main source of uncertainty. In fact, when the mass of AP collected by the droplet is close to the detection limit of the fluorimeter (about 10−15 kg in the droplet sample volume analysed), ufluorimeter is up to 30 %.
-
The relative uncertainty of the mean AP mass concentration in the In-CASE collision chamber () which can be evaluated, according to Eq. (5), by Eq. (10):
where the relative uncertainty of the detected AP mass on the HEPA filter () depends on the one on the fluorimeter (ufluorimeter) and the one on the dilution (udilution∼1 %). In fact, the spectrometry analysis is performed by diluting the AP mass on the HEPA filter in a 100 mL ammonia water solution at the end of an experiment. The relative uncertainty of the AP flow rate in the In-CASE collision chamber () is given by the data sheet of the constructor – about 1 %. Note that the relative uncertainty on the experiment time (uΔt) is neglected since the error is approximately 1 s on an experiment that can last more than 5 h.
4.1 Extension of the Dépée et al. (2019) model
In all experiments, the droplet charge is 0±600 elementary charges with a radius of about 50 µm. Since the AP charge distribution is similar to a Boltzmann distribution, an AP charge of more than 5 elementary charges is thus highly unlikely in the radius range considered in the experiments. Moreover, Dépée et al. (2019) numerically evaluated the contribution of the electrostatic forces on the CE for a droplet of 50 µm radius with −1000 elementary charges and 5 elementary charges on the AP. For these extreme values, they calculate an increase in the CE due to the electrostatic forces by 42 % and 22 % for an AP radius of 50 and 300 nm, respectively. Close to these two AP radii, a rise of the CE by a factor of 3 and 4, respectively, is observed when the relative humidity goes from 93.5±0.9 % to 71.1±1.3 % (Fig. 10). Consequently, it is assumed that the contribution of the thermophoresis and the diffusiophoresis is of first order in the measurements and the electrostatic forces can be neglected in the observed increase in CE.
To extend the Dépée et al. (2019) model for the thermophoretic (Fth) and diffusiophoretic forces (Fdf), the resulting velocity at the AP location () given by the authors (in Eq. 6) is replaced by Eq. (11):
where Fbuoy is the buoyancy force, Uf@AP is the fluid velocity at the AP location, τAP is the AP relaxation time and mAP is the AP mass. The thermophoresis and the diffusiophoresis which are given by Brock (1962) and Waldmann and Schmitt (1966), respectively, are summarised in Eq. (12):
with ur the unit vector in the radial direction from the droplet centre to the AP centre, r∗ the distance between the AP and droplet centres normalised by the droplet radius A, Dv the diffusivity of vapour, Kn the Knudsen number, Mair and Mwater the respective air and water molar masses, and kair and kAP the respective air and AP thermal conductivities. Note that the thermal conductivity of the sodium fluorescein salt is considered for kAP – equal to 0.43 m kg s−3 K−1 (Al-Azzawi and Owen, 1984).
In Eq. (12), the terms (1) and (2) represent the gradient of vapour density and the thermal gradient in the air, respectively. These two gradients are computed under the assumption that the temperature and vapour density profiles are spherically symmetric around the droplet (Wang et al., 1978). Because the droplet is falling in the air, fv and fh – which are the ventilation coefficients for the vapour and the heat respectively (Beard and Pruppacher, 1971) – correct the gradients since the profiles are actually disturbed by the airflow.
4.2 Collection efficiency measurements and analysis
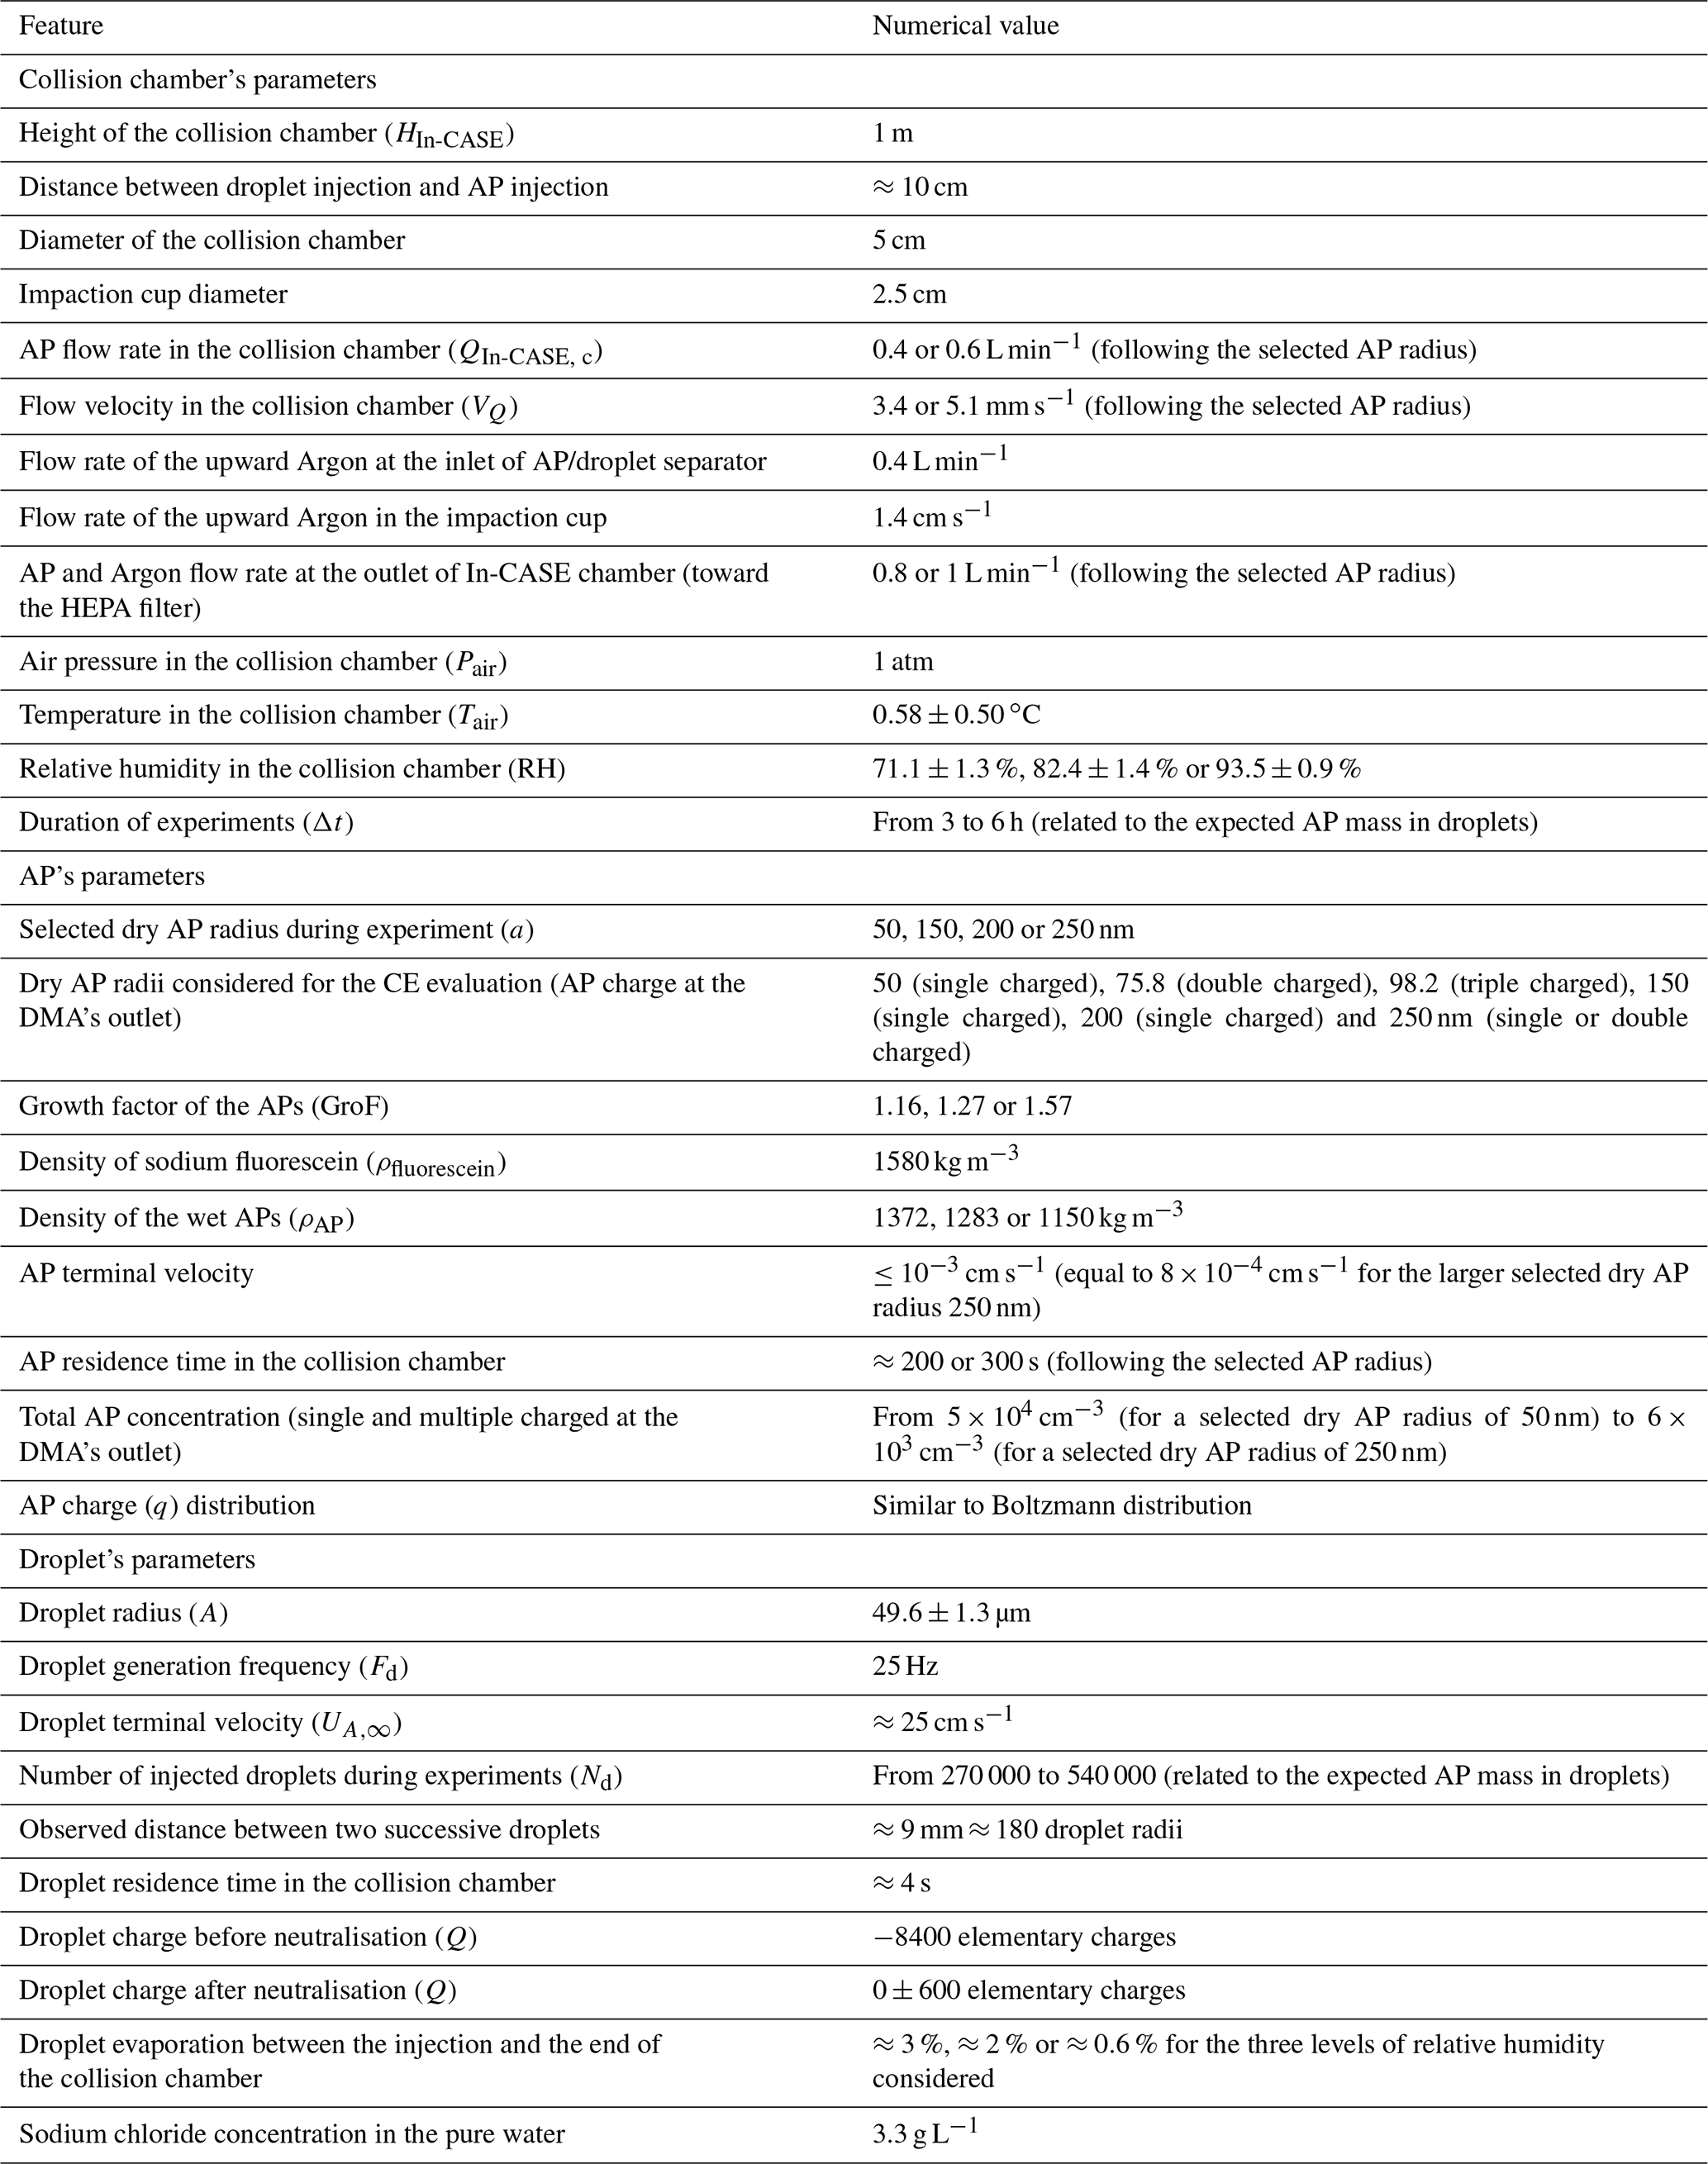
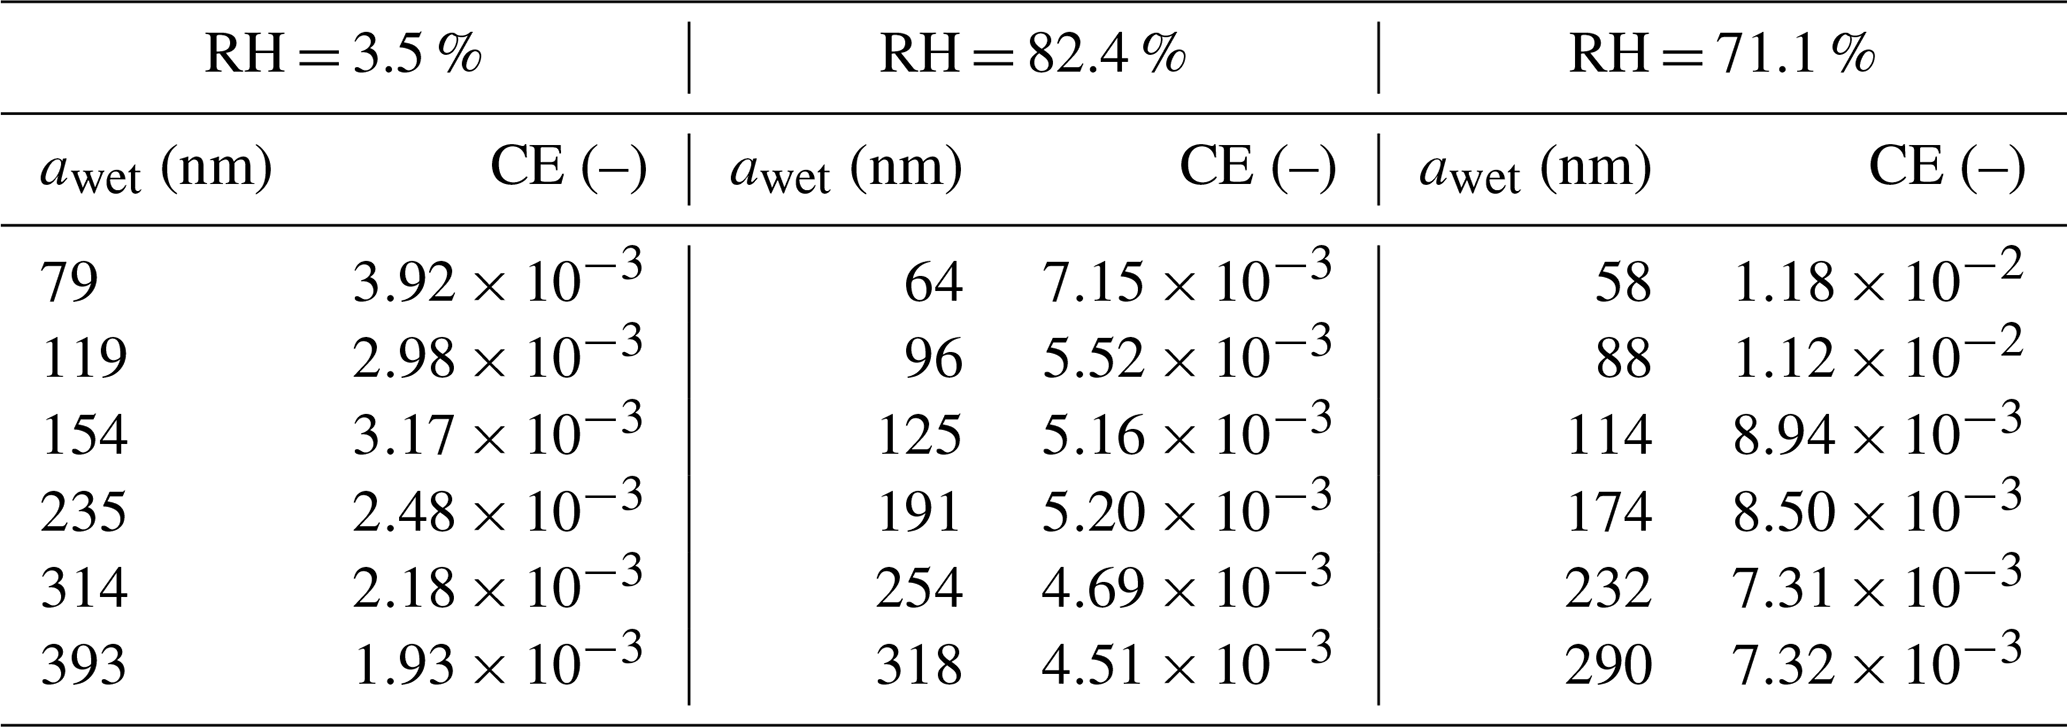
In Fig. 10, the CEs are presented for the three levels of relative humidity studied – 71.1 %, 82.4 % and 93.5 % – and six dry AP radii ranging from 50 to 250 nm. The numerical values are presented in Table 3. As a reminder, all experiments were conducted with an air temperature of 0.58±0.50 ∘C at the atmospheric pressure, the AP charge distribution is similar to a Boltzmann distribution and the droplet charge is 0±600 elementary charges. The droplet radius is 49.6±1.3 µm. The key features of the experiments are summarised in Table 2. The measurements are compared to computed efficiencies using the models described in Wang et al. (1978) (dashed lines) as well as the extended version of Dépée et al. (2019) (solid lines). Note that the experimental conditions vary a little for the CE measurements at a given relative humidity level. For the modelling, air temperature and droplet radius are then the mean values of the three levels of relative humidity – Tair=0.26, 0.27 and 1.2 ∘C – A=49.3, 50.8 and 48.8 µm – from the lowest to the highest, respectively. For RH = 100 %, these parameters are those from Table 2.
Table 3CE measurements for the three levels of relative humidity (RH) and the wet AP radii (awet). The droplet radius is 49.6±1.3 µm.
Regarding the experimental results, it can be noted that the influence of the relative humidity via the thermophoresis and diffusiophoresis contribution on the CE is of first order. For the larger AP radii studied, the CE increases by a factor of 4 when the relative humidity passes from 93.5 % to 71.1 % – filling up the Greenfield gap as the models predict. A slight decline of the contribution of these two phoretic effects is observed when the AP radius decreases – with the previous factor of 4 reducing to a factor of 3 for the smaller AP radii and for the same relative humidity range (from 93.5 % to 71.1 %). Although this decrease is small, it is in line with the theory. Indeed, when the AP radius decreases the contribution of the Brownian motion on the CE increases and starts dominating over the thermophoretic and the diffusiophoretic forces. Consequently, the influence of the relative humidity on the CE is negligible for nanometric AP radii.
Moreover, the impact of the AP size is lower than the influence of the relative humidity for the experimental conditions considered. Indeed, between the larger and the smaller AP radii, the CE is only increased by a factor of 1.61, 1.59 and 2.03 for the respective relative humidity levels of 71.1 %, 82.4 % and 93.5 %. A decrease in the AP size effect on the CE is noticeable when the thermophoresis and the diffusiophoresis contributions intensify – in other words when the relative humidity declines. This observation is in line with the modelling of the CE when a threshold is more and more visible as the relative humidity decreases for the submicron AP radii studied.
Finally, for the AP sizes and the droplet radius studied, both models describe relatively well the observed CE variations when changing relative humidity. For the two lowest levels of relative humidity (71.1 % and 82.4 %), the CE modelling is really close between both models since the thermophoresis and diffusiophoresis dominate the influence on the CE. Nevertheless, some significant discrepancies appear for the highest relative humidity (93.5 %), where the Dépée et al. (2019) extended model gives higher CE values. These differences result from the Wang et al. (1978) model, which does not consider dynamic effects such as AP inertia, AP weight and interception, in contrast to the extended model of Dépée et al. (2019), which offers a complete description of the microphysical effects involved in clouds.
Figure 10CE measurements for three levels of relative humidity – 71.1 %, 82.4 % and 93.5 % – compared to the extended model of Dépée et al. (2019) (solid lines) and the Wang et al. (1978) model (dashed line). Squares are the CE measurements summarised in Table 3. For the modelling, air temperature and droplet radius are then the mean values of the three levels of relative humidity – Tair=0.26, 0.27 and 1.2 ∘C – A=49.3, 50.8 and 48.8 µm – from the lowest to the highest, respectively. For RH = 100 %, the parameters are those from Table 2.
In-CASE (In-Cloud Aerosol Scavenging Experiment) was built to conduct a set of experiments quantifying the contribution of any microphysics effects involved in the AP collection by falling cloud droplets. For this purpose, all parameters influencing the collection efficiency (CE) are controlled – i.e. the AP and droplet sizes, the AP and droplet electric charges, and the relative humidity.
This study focused on the influence of relative humidity since the literature lacks baseline data validating the theoretical models of CE implemented in cloud, climate and pollution models. Indeed, only the work of Ardon-Dryer et al. (2015) is dedicated to investigate the CE variation for two levels of relative humidity and cloud droplet sizes (A≤100 µm). Nevertheless, for the droplet radius considered, the authors conclude that the electrostatic forces could have played a key role on their CE measurements, since the APs and droplets are charged, however slightly.
In the new measured CE dataset that is presented here, the APs and droplets are neutralised. There is no significant remaining electrostatic effect considering the maximum residual AP and droplet charges for the droplet radius examined ( µm), which is twice as larger as the one studied by Ardon-Dryer et al. (2015). Here, three levels of relative humidity were investigated – 71.1 %, 82.4 % and 93.5 % – which are typical in-cloud conditions.
From the measurements obtained, it is clear that the relative humidity – through the thermophoretic and diffusiophoretic forces – significantly impacts the CE. Indeed, an increase by a factor of 4 was observed for the CE when the relative humidity level declines from 93.5 % to 71.1 %. Thus, it is quite important to consider these effects in the cloud model since the levels of relative humidity are comparable to those used in this study. It was also shown that for the AP size considered in the present study, the impact of the AP size on the CE is a second-order dependency. In fact, only a doubling of the CE was highlighted – for a relative humidity of 93.5 % – from the larger to the smaller AP radius considered. This impact of the AP size decreased when the influence of the relative humidity increases.
The CEs computed with the well-established model of Wang et al. (1978) as well as the new Lagrangian model described in Dépée et al. (2019) and extended to phoretic effects were compared to the measurements. The agreement was good. Nevertheless, significant discrepancies between both models were revealed for high relative humidity (in subsaturated air) where the relative humidity influence is weak. This can be attributed to the fact that the model of Wang et al. (1978) disregards some microphysics effects such as AP weight, AP inertia and interception which have a significant contribution near the Greenfield gap (Greenfield, 1957). Thus, the extended Lagrangian model of Dépée et al. (2019) offers a more appropriate estimation of the CE.
In this study, the electrostatic effects were not considered. However, Dépée et al. (2019) have shown an impact of several orders of magnitude on the CE, especially considering the electric charges of cloud droplets and radioactive APs. Then, it is essential to investigate the AP collection by clouds due to the electrostatic forces – referred to as “electroscavenging”. Up to now, the analytical expression of the electrostatic forces – based on the image charge theory developed by Jackson (1999) – has never been experimentally validated or at least emphasised. Consequently, In-CASE was also used to study the influence of the droplet and AP charge on CE which is addressed in a second paper (Dépée et al., 2021).
This Appendix presents the method used to evaluate the CE when the selected AP radius by the DMA is 50 or 150 nm – when the multiple charged APs cannot be neglected (see Sect. 3.2).
A1 Ratio of multiple charged APs
A1.1 Selected AP radius of 50 nm
Before the AP selection, the DMA charges the APs following a known charging law (Wiedensohler, 1988) with an energy X-ray neutraliser (not presented in Fig. 2).
The first step is to estimate the number and mass ratios of multiple charged APs in the mean AP mass concentration measured in the In-CASE collision chamber (Cm,AP). For this purpose, the size distribution of the APs produced by the atomiser is measured just before the DMA selection (Fig. 7). The AP number concentrations at the single (50 nm), double (75.8 nm), triple (98.2 nm), quadruple (119.1 nm) and quintuple (139.1 nm) charged radii are deduced from the size distribution.
Those AP number concentrations are the total concentrations at a given multiple charged AP radius. From those total concentrations, a fraction will be actually carrying the correct charge number to have the exact electrical mobility selected by the DMA (one charge for 50 nm, two charges for 75.8 nm and three charges for 98.2 nm, etc.). This fraction number (FN,n) of an AP radius (a) carrying n elementary charge(s) can be estimated through the AP charging law imposed by the energy X-ray neutraliser – defined by Wiedensohler (1988). This similar Boltzmann distribution is defined in Eq. (A1):
where ε0, kb and Tair≈295.15 K are the vacuum permittivity, the Boltzmann constant and the lab temperature. The ion mobility ratio () is assumed to be equal to 0.875 (Wiedensohler, 1988).
Finally, the effective AP numbers for the respective multiple charged AP radii have been evaluated in the AP flow at the DMA's outlet (corresponding to the AP flow going into the In-CASE collision chamber). Thus, the mass fractions (Fm,n) for the single, double, triple, quadruple and quintuple charged AP radii were estimated. It was found that the quadruple and quintuple charged AP radii can be neglected since their weight is less than 6 % in the mean AP mass concentration in the In-CASE collision chamber (Cm,AP). Moreover, since their number concentrations are really poor (less than 50 cm−3) compared to the single, double and triple charged radius (∼103–104 cm−3), the likelihood of those APs being collected by a droplet in the collision chamber is extremely small.
A2 Selected AP radius of 150 nm
For a selected AP radius of 150 nm, only the double charged APs are considered since the triple charged APs are assumed to be stopped by the impactor at the DMA's inlet (triple charged radius = 353.4 nm and nm, Table 1). The mass fractions (Fm,n) of the single and double charged APs are evaluated in the same way as a 50 nm selected AP radius.
A3 Deduction of the collection efficiency
A4 Selected AP radius of 50 nm
As explained in Sect. 3.2, when the selected AP radius by the DMA is 50 nm, the AP mass collected at the In-CASE chamber bottom (mAP,d) is actually the sum of the masses of the single (50 nm), double (75.8 nm) and triple (98.2 nm) charged AP collected by the droplet train. This can also be defined as the linear combination of the collection efficiencies (CE) and the available AP mass in the volume swept by the droplets (mAP,available(ai)) at a given multiple charged dry AP radius (ai) – Eq. (A2):
where the respective available AP masses in the volume swept by the droplets are defined by Eq. (A3):
All the parameters given in Eqs. (A2) and (A3) are either measured or initially known, except the collection efficiencies (CEi) for the single, double and triple charged AP dry radius. To deduce those three unknown parameters, a set of j linearly independent experiments (j≥3) has been performed by varying the ratio of the multiple charged APs (by changing the AP size distribution mode in Fig. 7). The matrix system is then described through Eq. (A4):
where the one-dimension matrix of the collected mass (Mcollected mass) for the set of j experiment is noted as Eq. (A5):
The two-dimension matrix of the available AP masses in the volume swept by the droplet (Mavailable) for the single (a1), double (a2) and triple (a3) charged is defined as Eq. (A6):
The one-dimension matrix containing all the unknown CEs (MCE) is Eq. (A7):
Finally, this matrix system (16) is numerically solved by the quasi-Newton method. The uniqueness of the solution was verified – the initial value was changed in the solving method, giving the same solution vector.
A4.1 Selected AP radius of 150 nm
Like the same principle as before, the AP mass collected by the whole droplets (mAP,d) is the linear combination of the single (150 nm) and double charged (253.7 nm), defined as Eq. (A8):
Nevertheless, to avoid additional experiments and numerically reverse a similar matrix system to (10), it was assumed that the CE of a dry AP radius of 253.7 nm is equivalent to the one for a dry AP radius of 250 nm. Then, the CE for a 150 nm dry AP radius is deduced by Eq. (A9):
The right term in Eq. (A9) has no unknown since the CE of a 250 nm dry AP radius (CE2(250 nm,A,RH )) has been previously calculated with the method developed in Sect. 3.1.
This appendix presents the method used to evaluate the CE uncertainty when the selected AP radius by the DMA is 50 or 150 nm – when the multiple charged APs cannot be neglected (see Sect. 3.2).
B1 With a selected dry AP radius of 150 nm
Since the CE of a selected dry AP radius of 150 nm (CE (150 nm, A, RH)) is calculated through the CE of a selected dry AP radius of 250 nm (CE (250 nm, A, RH)) – Eq. (A9) – the uncertainty on the CE for the 150 nm () is evaluated by propagating the uncertainty on the CE for 250 nm (). It means the term is added in Eq. (8) to deduce .
B2 With a selected dry AP radius of 50 nm
When the selected dry AP radius is 50 nm, the matrix system (16), solved by a quasi-Newton method, is composed of parameters each with their relative uncertainties. The relative CE uncertainties of the single (50 nm), double (75.8 nm) and triple (98.2 nm) charged dry AP radius are then deduced by randomly perturbing the terms of the matrix Mcollected mass and Mavailable in Eq. (A4) within the limits of their respective experimental relative uncertainties. A total of 10 000 perturbed matrix systems were generated by the Monte Carlo method and solved with the quasi-Newton method. From the 10 000 solution vectors – shaped like Eq. (A5) – the ones with negative CEs were removed since they have no physical meaning. Figure B1 shows the set of the solutions for a relative humidity level of 71.1 % and a single charged dry AP radius (50 nm).
Finally, the relative uncertainty of the CE is given by the standard deviation (σ) of the solution distribution.
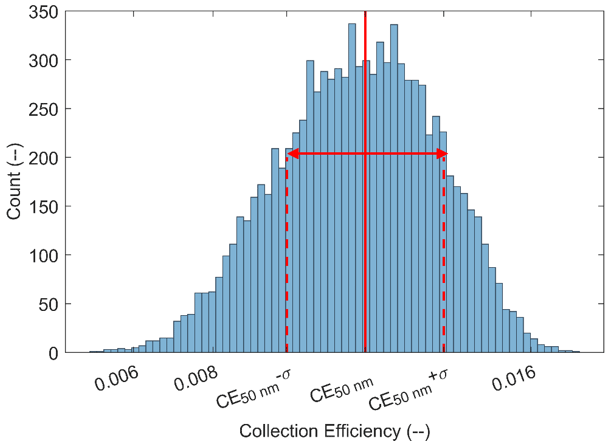
Figure B1Distribution of 10 000 solutions (negative values were removed) for a relative humidity level of 71.1 % and a single charged dry AP radius (50 nm).
No code was developed in the present article. The code used was described in Dépée et al. (2019), published in the Journal of Aerosol Science, https://doi.org/10.1016/j.jaerosci.2019.04.001.
All the underlying research data can be found in the present article.
This work relies on the experimental work of AD, with a methodology and a conceptualization made in collaboration with PL. Formal analysis was also performed by AD and PL. Numerical simulations were performed by AD and TG. The original article was written by AD under the supervision of PL, MM and AF.
The authors declare that they have no conflict of interest.
Authors sincerely thank Luis A. Ladino for all the advice he provided for the design of In-CASE.
This work was funded by the French Institute for Radiological Protection and Nuclear Safety (IRSN).
This paper was edited by Joachim Curtius and reviewed by two anonymous referees.
Adachi, K., Kajino, M., Zaizen, Y., and Igarashi, Y.: Emission of spherical cesium-bearing particles from an early stage of the Fukushima nuclear accident, Sci. Rep.-UK, 3, 1–5, https://doi.org/doi.org/10.1038/srep02554, 2013.
Al-Azzawi, H. K. and Owen, I.: Measuring the thermal conducitivity of uranin, Int. J. Heat Fluid Fl., 5, 57–59, 1984.
Ardon-Dryer, K., Huang, Y.-W., and Cziczo, D. J.: Laboratory studies of collection efficiency of sub-micrometer aerosol particles by cloud droplets on a single-droplet basis, Atmos. Chem. Phys., 15, 9159–9171, https://doi.org/10.5194/acp-15-9159-2015, 2015.
Beard, K. V.: Terminal velocity and shape of cloud and precipitation drops aloft, J. Atmos. Sci., 33, 851–864, 1976.
Beard, K. V. and Pruppacher, H. R.: A wind tunnel investigation of the rate of evaporation of small water drops falling at terminal velocity in air, J. Atmos. Sci., 28, 1455–1464, https://doi.org/10.1175/1520-0469(1971)028<1455:AWTIOT>2.0.CO;2, 1971.
Bell, M. L., Davis, D. L., and Fletcher, T.: A retrospective assessment of mortality from the London smog episode of 1952: the role of influenza and pollution, Environ. Health Persp., 112, 6–8, 2004.
Brock, J. R.: On the theory of thermal forces acting on aerosol particles, J. Coll. Sci. Imp. U. Tok., 17, 768–780, 1962.
Dépée, A., Lemaitre, P., Gelain, T., Mathieu, A., Monier, M., and Flossmann, A.: Theoretical study of aerosol particle electroscavenging by clouds, J. Aerosol Sci., 135, 1–20, 2019.
Dépée, A., Lemaitre, P., Gelain, T., Monier, M., and Flossmann, A.: Laboratory study of the collection efficiency of submicron aerosol particles by cloud droplets – Part II: Influence of electric charges, Atmos. Chem. Phys., 21, 6963–6984, https://doi.org/10.5194/acp-21-6963-2021, 2021.
Devell, L., Tovedal, H., Bergström, U., Appelgren, A., Chyssler, J., and Andersson, L.: Initial observations of fallout from the reactor accident at Chernobyl, Nature, 321, 192–193, 1986.
Dockery, D. W., Schwartz, J., and Spengler, J. D.: Air pollution and daily mortality: associations with particulates and acid aerosols, Environ. Res., 59, 362–373, 1992.
Flossmann, A. I.: Interaction of aerosol particles and clouds, J. Atmos. Sci., 55, 879–887, 1998.
Flossmann, A. I., Hall, W. D., and Pruppacher, H. R.: A theoretical study of the wet removal of atmospheric pollutants, Part I: The redistribution of aerosol particles captured through nucleation and impaction scavenging by growing cloud drops, J. Atmos. Sci., 42, 583–606, 1985.
Greenfield, S. M.: Rain scavenging of radioactive particulate matter from the atmosphere, J. Meteorol., 14, 115–125, 1999.
Jackson, J. D.: Classical electrodynamics, 3rd edition, Wiley & Sons, New York, London, Sydney, 808, 1999.
Jaenicke, R.: Chapter 1: Tropospheric aerosols, Aerosol-cloud-climate interactions, in: International Geophysics, Vol. 54, edited by: Hobbs, P. Academic Press, 1–31, https://doi.org/10.1016/S0074-6142(08)60210-7, 1993.
Jost, D. T., Gäggeler, H. W., Baltensperger, U., Zinder, B., and Haller, P.: Chernobyl fallout in size-fractionated aerosol, Nature, 324, 22–23, 1986.
Kaneyasu, N., Ohashi, H., Suzuki, F., Okuda, T., and Ikemori, F.: Sulfate aerosol as a potential transport medium of radiocesium from the Fukushima nuclear accident, Environ. Sci. Technol., 46, 5720–5726, 2012.
Ladino, L., Stetzer, O., Hattendorf, B., Günther, D., Croft, B., and Lohmann, U.: Experimental study of collection efficiencies between submicron aerosols and cloud droplets, J. Atmos. Sci., 68, 1853–1864, 2011.
Laguionie, P., Roupsard, P., Maro, D., Solier, L., Rozet, M., Hébert, D., and Connan, O.: Simultaneous quantification of the contributions of dry, washout and rainout deposition to the total deposition of particle-bound 7Be and 210Pb on an urban catchment area on a monthly scale, J. Aerosol Sci., 77, 67–84, 2014.
Lira, I.: Evaluating the measurement uncertainty: fundamentals and practical guidance, in: institute of physics, series in measurement science and technology, Institute of Physics Publishing, Bristol and Philadelphia, 251, https://doi.org/10.1119/1.1522703, 2002.
Petters, M. D. and Kreidenweis, S. M.: A single parameter representation of hygroscopic growth and cloud condensation nucleus activity, Atmos. Chem. Phys., 7, 1961–1971, https://doi.org/10.5194/acp-7-1961-2007, 2007.
Pöllänen, R., Valkama, I., and Toivonen, H.: Transport of radioactive particles from the Chernobyl accident, Atmos. Environ., 31, 3575–3590, 1997.
Pruppacher, H. R. and Klett, J. D.: Microphysics of Clouds and Precipitation, in Atmospheric and oceanographic Sciences Library, Kluwer Academic Press, Dordrecht/Boston/London, 954 pp., 1997.
Quérel, A., Lemaitre, P., Monier, M., Porcheron, E., Flossmann, A. I., and Hervo, M.: An experiment to measure raindrop collection efficiencies: influence of rear capture, Atmos. Meas. Tech., 7, 1321–1330, https://doi.org/10.5194/amt-7-1321-2014, 2014.
Reischl, G. P. W. W., John, W., and Devor, W.: Uniform electrical charging of monodisperse aerosols, J. Aerosol Sci., 8, 55–65, 2014.
Santachiara, G., Prodi, F., and Belosi, F.: A review of termo-and diffusio-phoresis in the atmospheric aerosol scavenging process, Part 1: Drop scavenging, 2, 148–158, https://doi.org/10.4236/acs.2012.22016, 2012.
Sharp, D. H.: Overview of Rayleigh-taylor instability, No. LA-UR-83-2130, CONF-8305110-2, Los Alamos National Lab., New Mexico, USA, 1983.
Tao, W. K., Chen, J. P., Li, Z., Wang, C., and Zhang, C.: Impact of aerosols on convective clouds and precipitation, Rev. Geophys., 50, 1–62, https://doi.org/10.1029/2011RG000369, 2012.
Tinsley, B. A. and Zhou, L.: Parameterization of aerosol scavenging due to atmospheric ionization, J. Geophys. Res-Atmos., 120, 8389–8410, 2015.
Tinsley, B. A., Zhou, L., and Plemmons, A.: Changes in scavenging of particles by droplets due to weak electrification in clouds, Atmos. Res., 79, 266–295, 2006.
Twomey, S.: Pollution and the planetary albedo, Atmos. Environ., 8, 1251–1256, 1974.
Waldmann, L. and Schmitt, K. H.: Thermo-phoresis and diffusiophoresis of aerosols, Aerosol Science, Academic Press, London, UK, 137–162, 1966.
Wang, P. K., Grover, S. N., and Pruppacher, H. R.: On the effect of electric charges on the scavenging of aerosol particles by clouds and small raindrops, J. Atmos. Sci., 35, 1735–1743, 1978.
Wiedensohler, A.: An approximation of the bipolar charge distribution for particles in the submicron size range, J. Aerosol Sci., 19, 387–389, 1988.
- Abstract
- Introduction
- Experimental setup
- Data analysis
- Results and discussions
- Conclusions
- Appendix A: Evaluation method of the collection efficiency in the presence of multiple charged APs
- Appendix B: Uncertainty of the collection efficiency in the presence of multiple charged APs
- Code availability
- Data availability
- Author contributions
- Competing interests
- Acknowledgements
- Financial support
- Review statement
- References