the Creative Commons Attribution 4.0 License.
the Creative Commons Attribution 4.0 License.
 | 05 May 2021
Stratospheric carbon isotope fractionation and tropospheric histories of CFC-11, CFC-12, and CFC-113 isotopologues
Max Thomas
Jan Kaiser
Samuel Allin
Patricia Martinerie
Robert Mulvaney
Anna Ridley
Thomas Röckmann
William T. Sturges
Emmanuel Witrant
We present novel measurements of the carbon isotope composition of CFC-11 (CCl3F), CFC-12 (CCl2F2), and CFC-113 (CF2ClCFCl2), three atmospheric trace gases that are important for both stratospheric ozone depletion and global warming. These measurements were carried out on air samples collected in the stratosphere – the main sink region for these gases – and on air extracted from deep polar firn snow. We quantify, for the first time, the apparent isotopic fractionation, ϵapp(13C), for these gases as they are destroyed in the high- and mid-latitude stratosphere: ϵapp(CFC-12, high-latitude) ‰, and ϵapp(CFC-113, high-latitude) ‰, ϵapp(CFC-12, mid-latitude) ‰, and ϵapp(CFC-113, mid-latitude) ‰. Our CFC-11 measurements were not sufficient to calculate ϵapp(CFC-11), so we instead used previously reported photolytic fractionation for CFC-11 and CFC-12 to scale our ϵapp(CFC-12), resulting in ϵapp(CFC-11, high-latitude) ‰ and ϵapp(CFC-11, mid-latitude) ‰. Measurements of firn air were used to construct histories of the tropospheric isotopic composition, δT(13C), for CFC-11 (1950s to 2009), CFC-12 (1950s to 2009), and CFC-113 (1970s to 2009), with δT(13C) increasing for each gas. We used ϵapp(high-latitude), which was derived from more data, and a constant isotopic composition of emissions, δE(13C), to model δT(13C, CFC-11), δT(13C, CFC-12), and δT(13C, CFC-113). For CFC-11 and CFC-12, modelled δT(13C) was consistent with measured δT(13C) for the entire period covered by the measurements, suggesting that no dramatic change in δE(13C, CFC-11) or δE(13C, CFC-12) has occurred since the 1950s. For CFC-113, our modelled δT(13C, CFC-113) did not agree with our measurements earlier than 1980. This discrepancy may be indicative of a change in δE(13C, CFC-113). However, this conclusion is based largely on a single sample and only just significant outside the 95 % confidence interval. Therefore more work is needed to independently verify this temporal trend in the global tropospheric 13C isotopic composition of CFC-113. Our modelling predicts increasing δT(13C, CFC-11), δT(13C, CFC-12), and δT(13C, CFC-113) into the future. We investigated the effect of recently reported new CFC-11 emissions on background δT(13C, CFC-11) by fixing model emissions after 2012 and comparing δT(13C, CFC-11) in this scenario to the model base case. The difference in δT(13C, CFC-11) between these scenarios was 1.4 ‰ in 2050. This difference is smaller than our model uncertainty envelope and would therefore require improved modelling and measurement precision as well as better quantified isotopic source compositions to detect.
- Article
(3107 KB) - Full-text XML
-
Supplement
(19944 KB) - BibTeX
- EndNote


Chlorofluorocarbons (CFCs) have been produced since the 1940s for multiple uses, such as refrigerant gases, aerosol propellants, and in foam blowing. Since their role in ozone depletion was discovered (Molina and Rowland, 1974; Farman et al., 1985), there has been a global effort to phase out the production and use of CFCs, culminating in the essentially complete elimination of their production in 2015 under the Montreal Protocol. Long-term monitoring shows that the atmospheric mole fractions of the three most abundant CFCs (CFC-11, CFC-12, and CFC-113) have been declining as a result (Carpenter et al., 2014). However, recent studies highlight the need for continued, careful monitoring of CFCs. Montzka et al. (2018) found evidence for a recently emerged source of atmospheric CFC-11, with subsequent studies tracing these emissions largely to north-east China (Rigby et al., 2019; Adcock et al., 2020). In addition, Adcock et al. (2018) found increasing mole fractions of CFC-113a. Isotopic measurements could provide additional constraints when identifying sources and sinks of CFCs.
CFCs are released to the troposphere by industrial processes and emission from existing banks (Lickley et al., 2020). Once in the troposphere, CFCs are transported to the stratosphere, where they are subject to UV photolysis and reaction with O(1D). Loss by photolysis is dominant, with loss by O(1D) contributing around 2 %, 6 %, and 6 % for CFC-11, CFC-12, and CFC-113, respectively (Burkholder et al., 2013). The balance of these sources and sinks and the transport processes between them determine the atmospheric lifetime of a CFC and its tropospheric concentration.
These processes also influence the isotopic signature of CFCs. Breakdown in the stratosphere preferentially destroys light isotopologues, causing a fractionation that leaves the un-photolysed stratospheric CFC pool enriched in heavy isotopes – 13C and 37Cl – relative to the troposphere. Such behaviour has been observed for δ(37Cl, CFC-11), δ(37Cl, CFC-12), and δ(37Cl, CFC-113) (Allin et al., 2015; Laube et al., 2010a) and for other gases, such as N2O (Griffith et al., 2000; Rahn and Wahlen, 1997; Röckmann et al., 2001; Kaiser et al., 2006; Toyoda et al., 2018), CH4, and H2 (Röckmann et al., 2003b; Rahn et al., 2003; Rhee et al., 2006; Röckmann et al., 2011). Heavy isotopologues of CFCs are enriched in the troposphere when this stratospheric pool mixes with the troposphere. There is a good conceptual understanding of isotopic budgets of CFCs, but significant uncertainties remain that hinder the use of isotopic methods to study CFC emissions, sources, and sinks.
One such uncertainty is the degree to which CFCs fractionate in the stratosphere. To date, few studies have been carried out to quantify the apparent isotopic fractionation, ϵapp, in CFCs. ϵapp relates the change in isotopic signature of a chemical to the degree of destruction observed in the atmosphere using a Rayleigh fractionation model. It is an empirical value that is affected by intrinsic photochemical fractionation, destruction by O(1D), and transport and mixing (Kaiser et al., 2006). In the dominant stratospheric sink region, photochemical loss dominates loss from reaction with O(1D) for CFC-11 and CFC-12 (Minschwaner et al., 2013). Laube et al. (2010b) measured vertical profiles of δ(37Cl, CFC-12) in stratospheric air from tropical latitudes, calculating ϵapp(37Cl, CFC-12) ‰. Using similar methodology, Allin et al. (2015) calculated ϵapp(37Cl, CFC-12) ‰ at mid- and ‰ at high latitudes. This decrease in the magnitude of ϵapp(37Cl) with increasing latitude is qualitatively consistent with observations of δ(15N, N2O) and δ(18O, N2O) (Kaiser et al., 2006), though the decrease is larger for CFC-12. Allin et al. (2015) observed no latitude dependence for ϵapp(37Cl, CFC-11) (mid: ‰; high: ‰) and ϵapp(37Cl, CFC-113) (mid: ‰; high: ‰), though they speculated that some latitude dependence could be obscured by their uncertainties.
For CFCs, the only study of ϵapp(13C) – from here, ϵapp – under conditions representative of the stratosphere was the laboratory photolysis experiment of Zuiderweg et al. (2012). Laboratory experiments exclude the effects of atmospheric transport and mixing, which tend to dilute observed fractionations such that ϵapp tends to be less-than-intrinsic photolytic fractionations, ϵp (Kaiser et al., 2006). Zuiderweg et al. (2012) reported ϵp under stratospherically relevant conditions for CFC-11 ( ‰ at 203 K to ‰ at 233 K) and CFC-12 ( ‰ at 203 K to ‰ at 233 K). These values imply greater levels of fractionation for δ(13C) than for δ(37Cl) in the stratosphere.
Another uncertainty in our understanding of CFC isotopologues is the isotopic signature of their sources. Allin et al. (2015) used their measured ϵapp for CFC-11, CFC-12, and CFC-113 to model a tropospheric history of δ(37Cl) in these chemicals following the approach of Röckmann et al. (2003a). Allin et al. (2015) constructed a tropospheric history of the isotopic composition of these chemicals from measurements of tropospheric and firn air — deep, compacted snow containing an archive of tropospheric air going back decades (e.g. Buizert et al., 2012). When a constant isotopic source signature was assumed, the model agreed well with measurements of δ(37Cl) representative of tropospheric air from around 1970 onwards. Five pre-1970 air samples had δ(37Cl) values that were inconsistent with the model. However, no clear trend was observable for these five samples, and, in addition, the disagreement was not significant to 2σ. The authors concluded that a constant source signature is likely consistent with measured δ(37Cl) since 1970 and that, with current measurement precisions, it is premature to assign a source change to CFC-11, CFC-12, and CFC-113 in the period before this.
In contrast, Zuiderweg et al. (2013) presented evidence for a past change in δ(13C, CFC-12). Large depletions, around −40 ‰ relative to the present-day troposphere, were measured in one deep firn air sample that corresponded to a mean age of around 1965. A significant change in the source signature of CFC-12 is required to explain this observation, and Zuiderweg et al. (2013) suggest that a change in feedstock during CFC production is the most promising explanation. But the results of Zuiderweg et al. (2013) rely heavily on one firn air sample that was potentially biased due to interference from a nearby chromatographic peak (see below and Appendix C). The tropospheric history of δ(13C, CFC-12) remains uncertain.
We remeasured the firn profile analysed by Zuiderweg et al. (2013) using a method similar to Allin et al. (2015) and Laube et al. (2010a) to better constrain and independently assess the history of δ(13C, CFC-12). Together with δ(13C, CFC-12), we also measured δ(13C, CFC-11) and δ(13C, CFC-113) in firn and stratospheric air samples. For the first time, stratospheric measurements were used to calculate ϵapp(13C) for CFC-11, CFC-12, and CFC-113. We then used these ϵapp values to quantify the isotope effect associated with the stratospheric removal in a two-box model, using a constant isotopic source signature, and calculated the temporal evolution of tropospheric δ(13C) for these chemicals since 1937 (CFC-12), 1946 (CFC-11), and 1962 (CFC-113). Model results were compared to the firn measurements to investigate whether changes in isotopic source composition are required to explain the δ(13C) history of these chemicals.
2.1 Sample collection
We present new data from two stratospheric and two tropospheric data sets (Table 1). One stratospheric data set, which we call “Kiruna”, was collected at high latitudes from high-altitude Geophysica flights out of Kiruna, Sweden, using the BONBON-I, BONBON-II, and CLAIRE cryogenic whole-air samplers (Laube et al., 2010b). The other, which we call “Gap”, was collected at mid-latitudes from balloons launched from Gap, France, using the whole-air sampler of the then Max Planck Institute for Aeronomy (Kaiser et al., 2006). The firn air samples were collected at North Greenland Eemian Ice Drilling (NEEM) in northern Greenland during field campaigns in 2008 and 2009. Shallow ice cores were drilled, stopping every few metres for air sampling, with the borehole sealed off from ambient air using a bladder (Allin et al., 2015; Schwander et al., 1993).
Table 1Samples analysed in this study.
a 62 to 72∘ N, 2∘ W to 24∘ E; 9–19 km; Laube et al. (2010b). b 44.4 to 44.8∘ N, 3.1 to 6.3∘ E; 8–34 km; Kaiser et al. (2006). c 77.45∘ N, 51.06∘ W; Buizert et al. (2012). d 77.45∘ N, 51.06∘ W; Zuiderweg et al. (2013). e Mean ages of the age distributions of the firn air samples.
2.2 Sample preparation and analysis
All of the samples were analysed using an established gas chromatography (GC)–mass spectrometry (MS) method that has produced robust and consistent results for chlorine isotope ratios in natural abundances of CFC-11, CFC-12, and CFC-113 (Laube et al., 2010b; Allin et al., 2015). In short, an Agilent 6890 GC was coupled to a VG/Waters tri-sector mass spectrometer. Air samples were dried by passing them through magnesium perchlorate granules before being concentrated onto a Hayesep D 80/100 mesh held at −78 ∘C in a sample loop using a dry-ice–ethanol mixture. Desorption from the Hayesep D was achieved by heating the sample loop to around 95 ∘C using hot water. A high-purity helium stream transferred the sample to a 0.32 mm internal diameter GS-GasPro (30 m) or KCl-passivated CP-PLOT Al2O3 (50 m) column held at −10 ∘C. The column was heated at 10 ∘C min−1 to 200 ∘C to release the chemicals of interest, separated by their retention strength, and pass them to the MS. Every fourth injection was a standard. While the above method was used for every sample analysed, different volumes were trapped for the stratospheric samples (200 mL at 20 ∘C and 1 bar, method A) and the NEEM 2008/09 firn samples (600 mL at 20 ∘C and 1 bar, method B). Also, method A used similar instrument settings to Allin et al. (2015). Method B uses the same MS and chromatography, but we increased the detector voltage (from 375 to 400 V), reduced the number of mass fragments measured at any given time, and optimised our source and collector slit parameters for maximum signal. Measurements of δ(37Cl, CFC-11), δ(37Cl, CFC-12), and δ(37Cl, CFC-113) in firn and stratospheric air samples using method A were presented previously by Allin et al. (2015). In this study, we use method A (Allin et al., 2015) and method B, which differers from method A by slight changes to the instrument settings and by looking at different ion fragments (Sect. 2.3). We further validate our method in Appendix B, where we show that our method produces δ(13C, CFC-12) that is consistent with a gas chromatography–isotope ratio mass spectrometry (GC–IRMS) system over a wide range of δ(13C, CFC-12).
Our method allows measurements of δ(37Cl) (Allin et al., 2015) and δ(13C) (this study) for CFCs with main isotopologues in the pmol mol−1 range. A key advantage of our method is that we can make these measurements using only a few hundred millilitres of air, which is important when measuring typical stratospheric and firn air samples where sample volumes are restricted.
2.3 Data processing
δ(13C) was calculated using
where and are the ratios of the 13C35Cl2F+ () to 12C35Cl2F+ () ion fragments for the sample and the reference gas, respectively. Rstd was taken to be the weighted mean ratio of two preceding and subsequent reference gases. Measured δ(13C, CFC-11) and δ(13C, CFC-12) reflect the total fractionation of each gas, whereas δ(13C, CFC-113) only reflects the fractionation on the CCl2F fragment, neglecting fractionation on the CClF2 fragment. The reference used for all measurements was 2005 Northern Hemisphere background air, AAL-071170 – from here referred to as “AAL”. For the stratospheric samples (method A), was calculated by regressing separate raw intensities for each ion fragment against each other (Laube et al., 2010a; Allin et al., 2015). For the firn samples (method B, using a larger air volume) the intensity of the 101 fragment saturated the detector, and we instead used the 12C37Cl2F+ () fragment to calculate , again by the regression of the separate raw intensities for each fragment. To recover , we applied a correction to the measured based on the expected using the relation
The expected values correspond to isotopologue ratios (relative mass difference of 4) and were calculated based on the modelling of diffusive and gravitational fractionation in firn (Sect. 2.4), assuming a constant isotopic source composition. In this case, , with c being the correction for a relative mass difference of 1. Substituting Eq. (2) into (1) allows us to recover δ values from measurements of . With this treatment we use 12C37Cl2F2 as a standard, assuming that δT(37,37Cl) for CFC-11, CFC-12, and CFC-113 is determined dominantly by diffusive and gravitational fractionation in the firn. As a check on our correction, we plot depth profiles of 2c and δ(37Cl) measurements of the NEEM 2009 firn profile presented in Allin et al. (2015) (Fig. 1); 2c is similar to δ(37Cl), within the precision of the data, as expected considering Allin et al. (2015) did not observe temporal signals in δ(37Cl). Given the lack of temporal signals in δ(37Cl), we do not expect large temporal changes in tropospheric δ(37,37Cl). The median magnitude of the effect of this correction on our δ(13C) is 0.8 ‰ (CFC-11), 0.7 ‰ (CFC-12), and 0.5 ‰ (CFC-113). The impact of the correction on δ(13C) increases with depth in the firn, reaching maximum magnitudes of 4.2 ‰ (CFC-11), 4.3 ‰ (CFC-12), and 0.9 ‰ (CFC-113).

Figure 1δ(37Cl) as measured by Allin et al. (2015) against depth in NEEM 2009 firn air samples. Also shown is the correction factor, c, used in this work to convert to (Eq. 2), multiplied by 2; c gives the fractionation for a relative mass difference of 1 and, assuming no change in δ(37Cl), which has a relative mass difference of 2, 2c should be consistent with δ(37Cl).
To ascertain the linearity of the response of our analytical system, we performed dilution series for both methods, as described in Appendix A and shown in Fig. A1. For method A, the dilution series showed that below a certain threshold (minimum peak area) there are systematic deviations in our measurement methods. Based on these results, a number of stratospheric samples, for which the peak area fell blow this threshold, were excluded. From a total of 38 measurements of each CFC, we rejected 22 (CFC-11), 9 (CFC-12), and 12 (CFC-113) measurements because they fell outside of the linearity limit of our method. For method B, we did not reject any of the 56 measurements performed based on the dilution series. We did, however, exclude the 69.4 and 71.9 m NEEM 2009 samples (10 measurements) for CFC-113 because, for the corresponding mean ages, there was too little CFC-113 in the atmosphere (Adcock et al., 2018) to reliably determine δ(13C) values. These 10 measurements are shown in Fig. A1 but did not contribute to our analysis.
2.4 Modelling firn air transport
Differing masses and diffusivities cause gases and isotopologues of a given gas to move through firn at different rates. Here, a model of gas transport in firn air (Witrant et al., 2012) was used to predict both the age distribution for CFC-11, CFC-12, and CFC-113 at each firn sampling depth and the gravitational and diffusive fractionation of each of these CFCs using a constant isotopic source composition. The gravitational and diffusive corrections for a relative mass difference of 1 (c in Sect. 2.3 and Fig. 1) range from −1.0 ‰ to 0.2 ‰ (CFC-11), −1.1 ‰ to 0.2 ‰ (CFC-12), and −0.2 ‰ to 0.2 ‰ (CFC-113). In the upper firn, enrichment due to gravitational fractionation gives positive c, while in the deeper firn, c is negative as diffusive fractionation overwhelms the gravitational fractionation. Once measurements of firn air are corrected for this fractionation, any change in δ(13C) is indicative of changes in the tropospheric isotopic composition, δT(13C).
2.5 Modelling the tropospheric isotopic composition
We modelled δT(13C, CFC-11), δT(13C, CFC-12), and δT(13C, CFC-113) from 1937 to 2050 using a two-box model. The model was used by Röckmann et al. (2003a), Bernard et al. (2006), and Prokopiou et al. (2017) for N2O isotopologue budget calculations and was adopted by Allin et al. (2015) to model the evolution of chlorine isotopes in CFC-11, CFC-12, and CFC-113. This model is detailed in Allin et al. (2015), so we only present a brief overview. The model boxes represent the troposphere and stratosphere. CFCs are emitted to the tropospheric box with a constant isotopic composition, δE(13C). Some portion of the tropospheric CFC load is transported to the stratospheric box, where CFCs are destroyed and fractionated according to ϵapp. As these fractionated CFCs are exchanged with the troposphere, they alter the tropospheric isotopic composition – our desired variable. Troposphere–stratosphere exchange is parameterised according to Holton (1990) and Appenzeller et al. (1996). The dominant uncertainties in the model are the uncertainty in ϵapp and the magnitude of the bulk air troposphere–stratosphere exchange flux, both of which are accounted for in the model uncertainty envelope. We offset modelled δT(13C) such that it is 0 ‰ in 2005. This treatment ensures that the modelled δT(13C) is relative to the tropospheric composition in 2005, consistent with our data, which are referenced to a 2005 air standard (AAL). We also shift the uncertainty envelope such that it is 0 ‰ in 2005 and increases backwards and forwards in time, reflecting the fact that in 2005 δT(13C)=0 ‰ by definition. Our only change to the modelling of Allin et al. (2015) is to the value of ϵapp such that it reflects 13C rather than 37Cl fractionation.
3.1 Measurements of δ(13C) in firn air
Measurements of firn air from NEEM 2008/09, plotted against mean age of air, are shown in Fig. 2. In the absence of a calibration of our AAL standard against the international standard Vienna Pee Dee Belemnite (VPDB), we present δ(13C, CFC-11) and δ(13C, CFC-113) relative to our 2005 background air reference gas (AAL). For CFC-12, there were measurements of the same samples on the VPDB scale (Zuiderweg et al., 2013), allowing us to rescale our measurements. Taking the mean of the NEEM 2009 samples from 50.7 to 10.5 m gave δ(13C, sample vs. VPDB) ‰ and δ(13C, sample vs. AAL) ‰, resulting in
which we used to rescale our δ(13C, CFC-12, sample vs. AAL) measurements to VPDB. A smooth δ(13C) trend and uncertainty envelope was calculated using the non-parametric LOESS (locally weighted scatter plot smoothing) technique. Uncertainty in the trend derives from measurement uncertainty and the width of the age distribution at each depth. To account for the age uncertainty, we sub-sampled the relevant probability-weighted age distribution 200 times for each measurement and calculated the LOESS using the resulting measurement pairs. All further details are supplied in the Supplement. The mean standard error in the LOESS was 1.0 ‰ (CFC-11), 1.3 ‰ (CFC-12), and 1.6 ‰ (CFC-113).
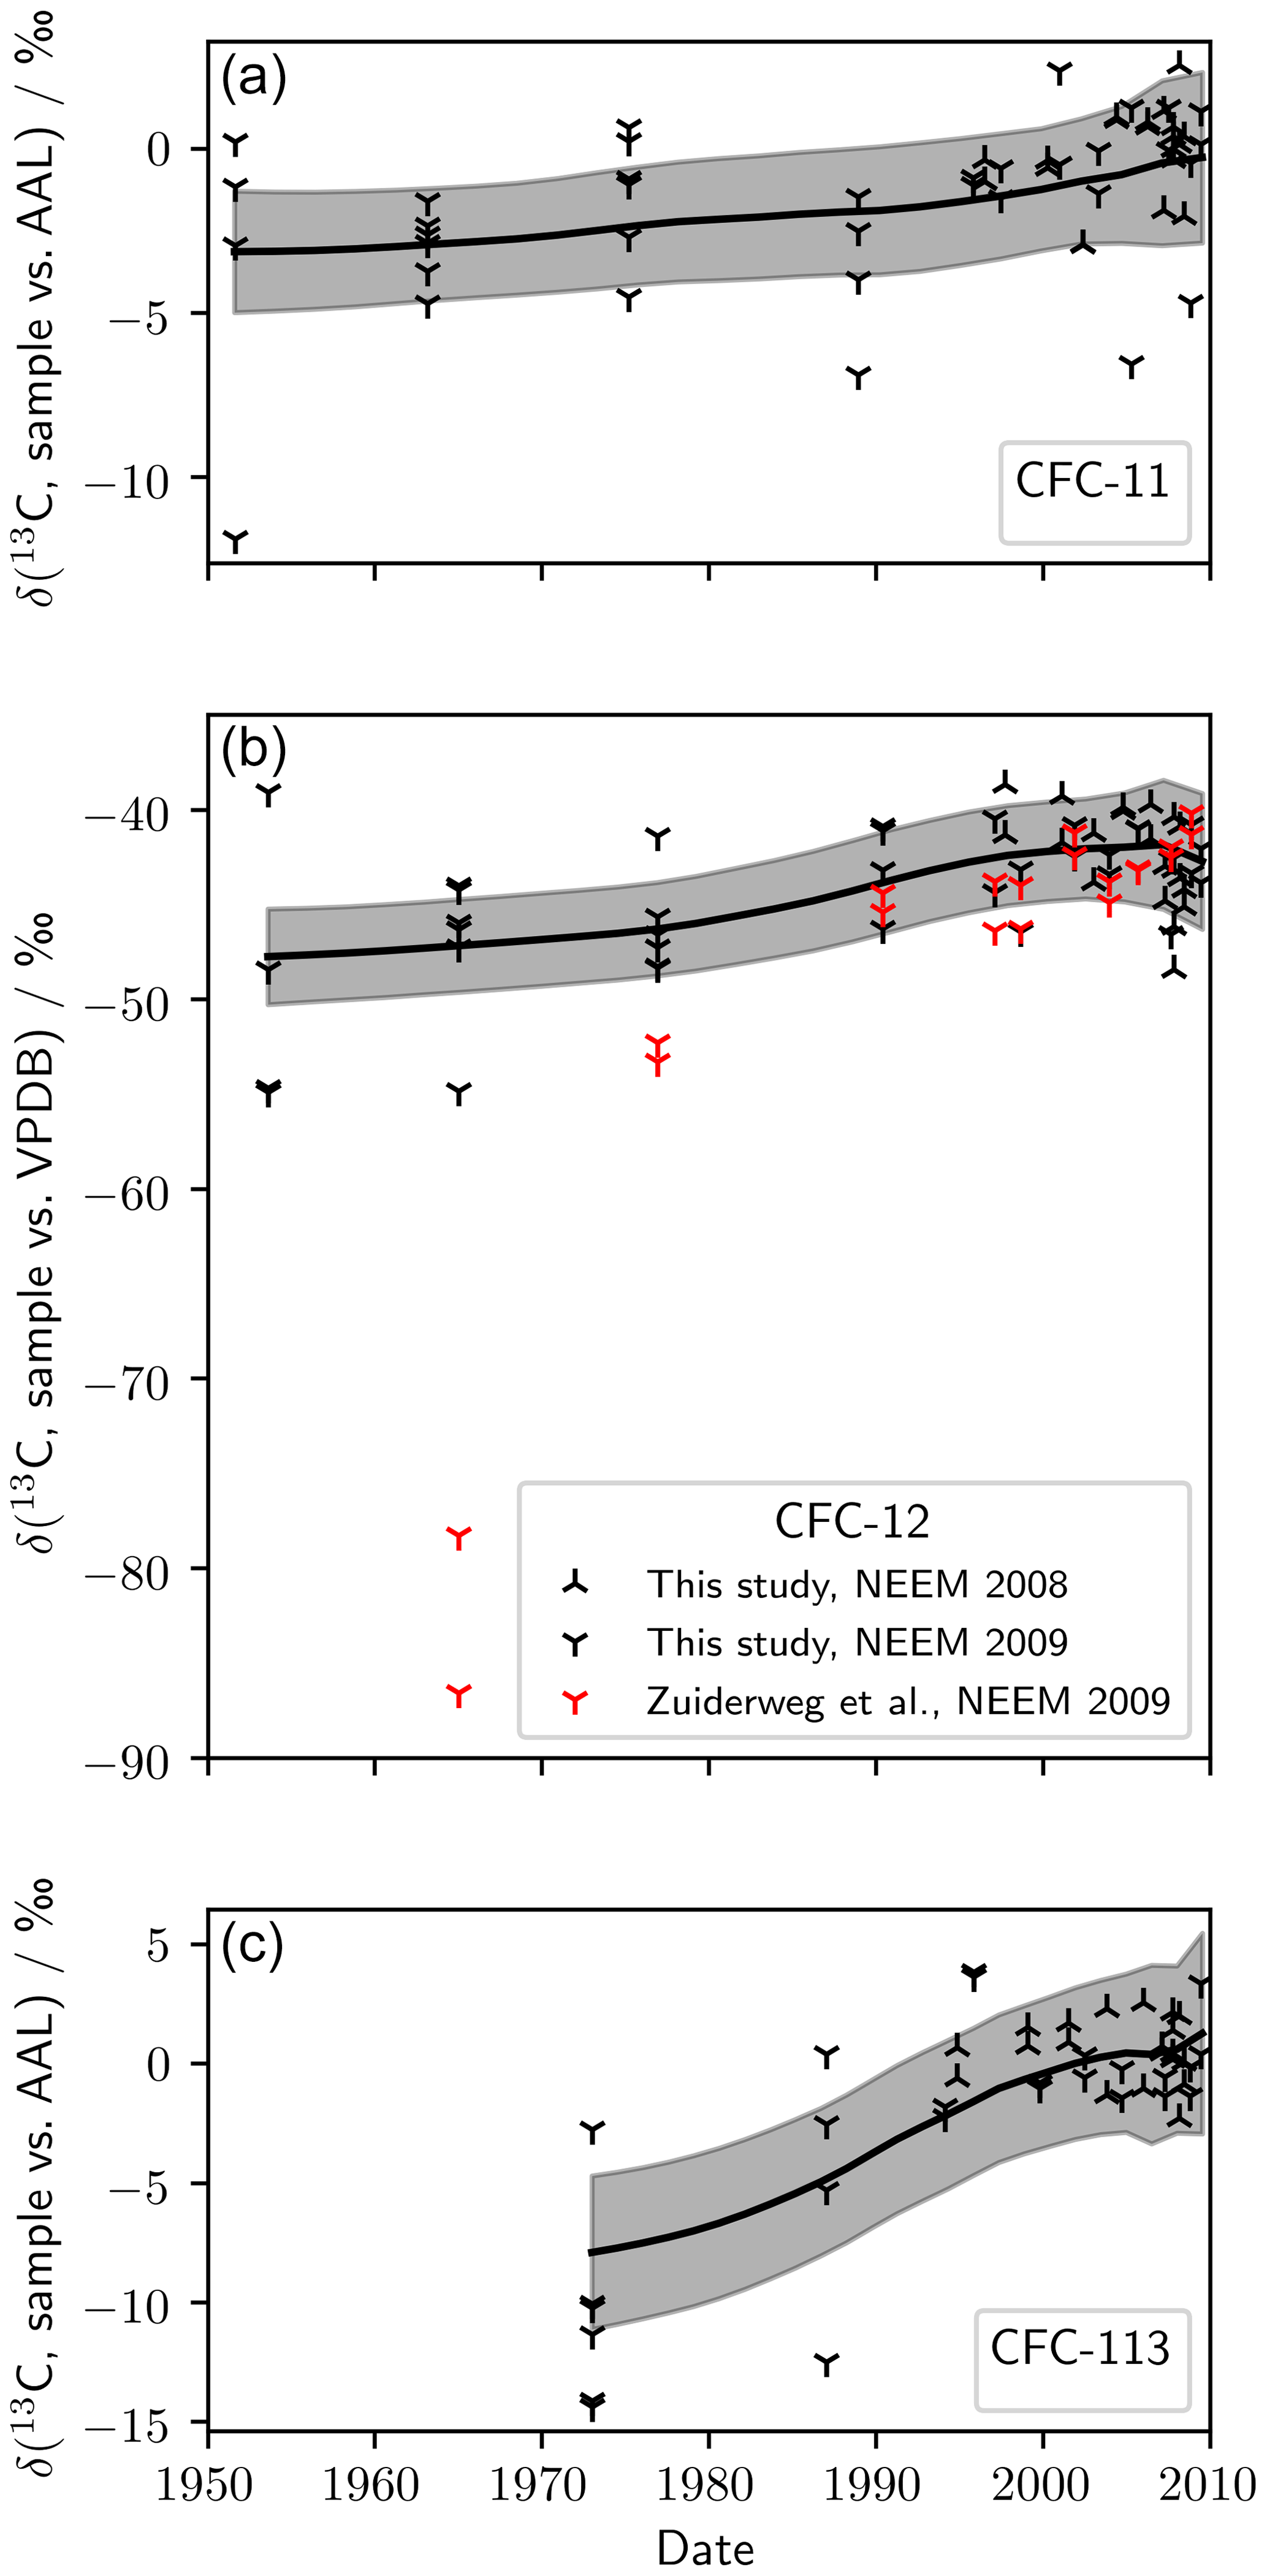
Figure 2(a) Measured δ(13C, CFC-11), (b) δ(13C, CFC-12), and (c) δ(13C, CFC-113) in NEEM 2008 and 2009 firn air. Also shown is δ(13C, CFC-12) as measured by Zuiderweg et al. (2013) in the same NEEM 2009 firn air samples. The smoothed trend (black line) and 95 % confidence bounds (grey shading) were generated using a LOESS regression.
We calculated trends in δ(13C) using the LOESS. For each CFC we saw an increase in δ(13C) from the oldest to the youngest air: δ(13C, CFC-11) increased by (2.9±1.6) ‰ between 1952 and 2009, δ(13C, CFC-12) increased by (5.3±2.2) ‰ between 1954 and 2009, and δ(13C, CFC-113) increased by (9.3±2.7) ‰ between 1973 and 2009 (standard error and mean age). The observed trends had large relative uncertainty and were similar in magnitude to our 105-to- 101 correction.
For CFC-12, there was general agreement between our measured firn profile and the measurements of Zuiderweg et al. (2013) after around 1990. However, in the oldest two samples measured by Zuiderweg et al. (2013) – corresponding to mean ages of 1965 and 1977 – there was a significant difference between our measurements of the NEEM 2009 profile and those presented by Zuiderweg et al. (2013). For the 1965 sample, the measurements of Zuiderweg et al. (2013) were around 40 ‰ outside of our 95 % confidence intervals, an order of magnitude larger than our 105-to- 101 correction.
3.2 Calculating ϵapp from stratospheric measurements
Our stratospheric measurements are presented as Rayleigh plots in Fig. 3, where f is the fractional release factor quantifying the degree of stratospheric destruction (Leedham Elvidge et al., 2018). Destruction of CFC-12 and CFC-113 (corresponding to an increase in fractional release factor and decreasing ln (1−f)) was concurrent with an increase in δ(13C) for the remaining stratospheric pool (Fig. 3). The gradient of the linear regression of ln (1+δ(13C)) with ln (1−f) gives ϵapp, which was negative for CFC-12 and CFC-113 in both latitude regions. CFC-11 is omitted from Fig. 3 because we do not take ϵapp(CFC-11) forward for our modelling or analysis. We present stratospheric CFC-11 data and justify their omission from our analysis in Appendix D.
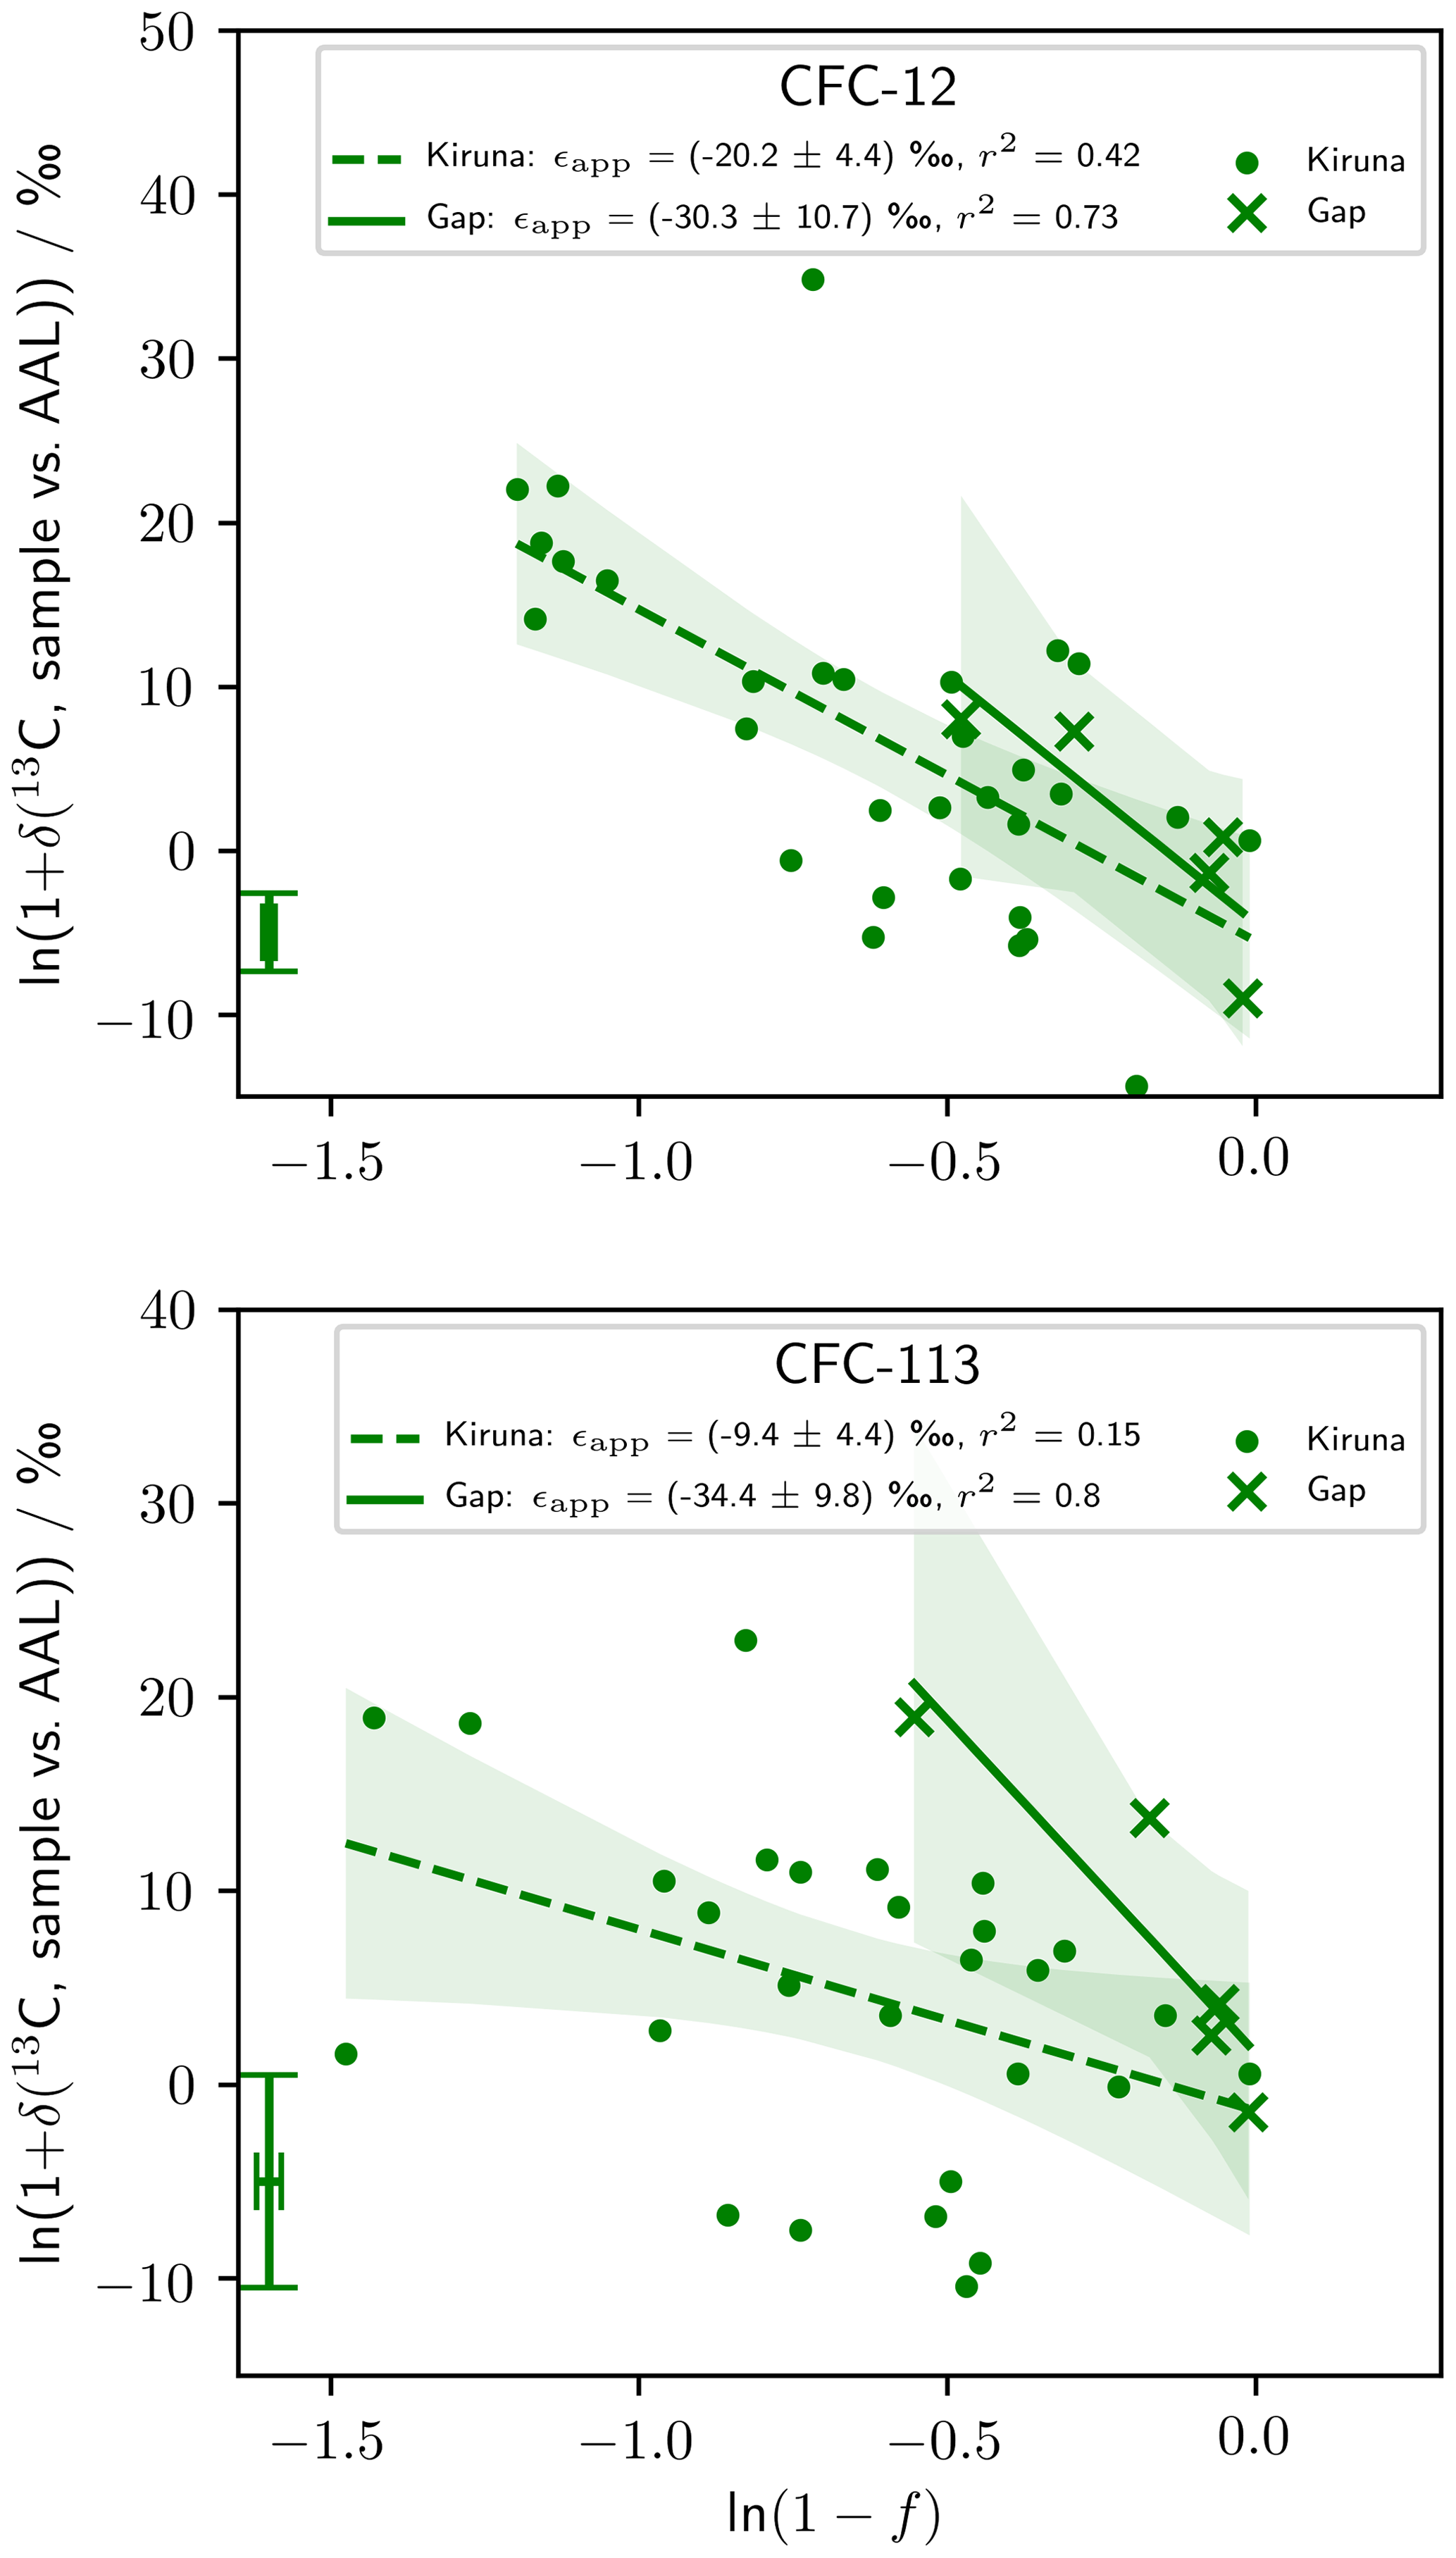
Figure 3Rayleigh plots of our stratospheric measurements. The linear regression (lines) and 95 % confidence bounds on the regression (shading) are shown for the high-latitude (Kiruna) and mid-latitude (Gap) data sets. The gradients of these regressions, corresponding to ϵapp, are given in the legend with 1 standard error. The error bar in the bottom left corner of each graph shows the median repeatability of the reference gas measurements over the measurement days and the median error deriving from the fractional release factor. CFC-11 data are presented in Appendix D.
From our stratospheric measurements, we derived ϵapp(CFC-12, high-latitude) ‰ (p<0.01), ϵapp(CFC-12, mid-latitude) ‰ (p=0.07), ϵapp(CFC-113, high-latitude) ‰ (p=0.04), and ϵapp(CFC-113, mid-latitude) ‰ (p=0.04) (Table 2). Of these, ϵapp(CFC-12, mid-latitude) is significant at 90 % confidence, with the others significant at 95 %.
Table 2The apparent isotopic fractionation, ϵapp, derived from our stratospheric measurements and the photolytic isotopic fractionation, ϵp, measured by Zuiderweg et al. (2012). All uncertainties are 1 standard error.

* Calculated using Eq. (4). Taking the mean of the 203 and 233 K measurements gives .
We derived ϵapp(CFC-11) by scaling our measured ϵapp(CFC-12) based on previous laboratory measurements of photolytic carbon isotope fractionation, ϵp (Zuiderweg et al., 2012). ϵapp is less than ϵp because atmospheric mixing dilutes the isotopic effect of photolytic fractionation (Kaiser et al., 2006). Atmospheric mixing affects CFC-11 and CFC-12 similarly, so we expect
Taking the mean of ϵp measured at stratospherically relevant temperatures (203 and 233 K) gives ϵp(13C, CFC-11) ‰ and ϵp(13C, CFC-12) ‰, such that . Scaling our measured ϵapp(CFC-12) by this factor gives ϵapp(13C, CFC-11, high-latitude) ‰ and ϵapp(13C, CFC-11, mid-latitude) ‰. These are the best estimates of ϵapp(13C, CFC-11) possible using our measurements. For each CFC, ϵapp was more negative at mid-latitudes. High-latitude ϵapp was derived from more data than the mid-latitude ϵapp. Of the three CFCs, ϵapp(CFC-11) was least negative at both latitudes, while ϵapp(CFC-12) was most negative at high latitudes, and ϵapp(CFC-113) was most negative at mid-latitudes. We took ϵapp(high-latitude) forward for our modelling because these were derived from more data, and we have more confidence in them.
3.3 Reconstructed tropospheric isotopic composition
We now turn to our measured and modelled δT(13C) (Fig. 4). Our firn measurements have been corrected for gravitational and diffusive fractionation. The smoothed trend and 95 % confidence interval were, similar to the firn profiles, based on LOESS regression on these corrected data. The standard error in the δT(13C) reconstruction was equal to that of the firn profile to within 0.1 ‰ for each CFC. Modelled δT(13C) is presented with 95 % confidence intervals. The model was forced with our derived ϵapp(high-latitude), prescribed CFC emissions, and a constant isotopic composition of emissions. For CFC-12, we also show the polynomial presented by Zuiderweg et al. (2013) representing the tropospheric trend that best captured their firn measurements.
As with the firn profile, we calculated trends in measured δT(13C) using a LOESS. For each CFC, measured δT(13C) increased through time: δT(13C, CFC-11) increased by (2.1±1.6) ‰ between 1952 and 2009, δT(13C, CFC-12) increased by (4.8±2.2) ‰ between 1956 and 2009, and δT(13C, CFC-113) increased by (9.0±2.7) ‰ between 1975 and 2009 (standard error and mean age). These trends are similar to and slightly smaller than the trends in the firn because of the gravitational and diffusive correction. The polynomial of Zuiderweg et al. (2013) only agreed with our reconstructed δT(13C, CFC-12) after around 1995. Our measurements are compared to previously published δT(13C, CFC-11), δT(13C, CFC-12), and δT(13C, CFC-113) in Table 3. Our δT(13C, CFC-12) measurements were rescaled to Zuiderweg et al. (2013) using 50.7 m and shallower samples representative of mean ages of around 2000 to 2009. In this period, our measured δT(13C, CFC-12) is therefore consistent with Zuiderweg et al. (2013) by definition. These measurements were consistent with Bahlmann et al. (2011) () ‰ and with Redeker et al. (2007) () ‰ to within 1 standard deviation. For each CFC, our δT(13C, sample vs. AAL) for this period was consistent with 0 ‰, as expected given that our AAL reference was collected in 2005. For CFC-11 and CFC-113, a quantitative comparison of our data to previous measurements (Thompson et al., 2002; Redeker et al., 2007; Bahlmann et al., 2011) was not possible due to our data being on a different scale.
Thompson et al. (2002)Redeker et al. (2007)Bahlmann et al. (2011)Zuiderweg et al. (2013)Table 3Comparison of δT(13C) measurements for CFC-11, CFC-12, and CFC-113 from various studies. Only measurements from background, rural, or coastal sites are included as these are most representative of the remote firn measurements presented here. The uncertainties are 1 standard deviation, and the number in brackets gives the number of observations.

a Thompson et al. (2002), sampled July 1999 to March 2001 background Northern (Alert, Canada (82.5∘ N, 62.3∘ W)) and Southern Hemisphere (Baring Head, New Zealand (41.4∘ S, 174.9∘ E)) air. b Redeker et al. (2007), sampled August to November 2004, Crossgar (54.40∘ N, 5.76∘ W), Hillsborough (54.46∘ N, −6.08∘ W), and Mace Head (53.20∘ N, 9.54∘ W). c Bahlmann et al. (2011), marine-influenced air, Wadden Sea Station in List on Sylt (55.02∘ N, 8.44∘ E), August to September 2010. d Zuiderweg et al. (2013), firn air samples representing depths 50.7 m and shallower, representing 2002 to 2009; NEEM 2009 campaign. e This study, firn air samples corrected for gravitational and diffusive fractionation, depths 50.7 m and shallower, representing 2001 to 2009 (CFC-11), 2002 to 2009 (CFC-12), 2000 to 2009 (CFC-113); NEEM 2008/09 campaigns.
We take the mean of the δT(13C) as predicted using the Appenzeller et al. (1996) and Holton (1990) stratosphere–troposphere exchange parameterisations for a given emissions scenario and ϵapp to be one model scenario. Hence, four model scenarios are shown in Fig. 4: one for each CFC using Velders and Daniel (2014) emissions (three scenarios, labelled V&D) plus an additional scenario for CFC-11 that differs from V&D by fixing emissions after 2012 (one scenario, labelled M18). The model uncertainty for a scenario is taken to be the full δT(13C) envelope as predicted using the two stratosphere–troposphere exchange parameterisations. The dominant uncertainty was from ϵapp, as shown by the strong overlap between the uncertainty envelopes of the two stratosphere–troposphere exchange parameterisations. Each model run predicted an increase in δT(13C) through time. This behaviour is qualitatively consistent with our measurements for each CFC. There was quantitative agreement between our measurements and modelling for CFC-11 and CFC-12 for the entire period covered by the measurements. For CFC-113, the model is consistent with the measurements after around 1980 but predicts too little fractionation to capture the observed δT(13C) depletion measured in the sample with a mean age of 1975.

Figure 4Measured and modelled δT(13C, CFC-11), δT(13C, CFC-12), and δT(13C, CFC-113). The smoothed trend and 95 % confidence intervals for measured δT(13C) are shown by the solid black line and grey shading, respectively. The solid blue line shows the mean modelled δT(13C) for the Velders and Daniel (2014) scenario (V&D) and the two stratosphere–troposphere exchange parameterisations (Holton, 1990; Appenzeller et al., 1996). ϵapp(high-latitude) was used for each CFC. Blue shading shows the 95 % uncertainty envelope for the Holton (1990) and Appenzeller et al. (1996) parameterisations. For CFC-11 only, the dotted blue line shows the mean modelled δT(13C) for the M18 scenario, with the uncertainty envelope omitted for clarity. For CFC-12, the red line shows δT(13C) as predicted by Zuiderweg et al. (2013) (amending a typo in the coefficients presented by Zuiderweg et al. (2013), δT(13C, CFC-12) , where , and t gives the date).
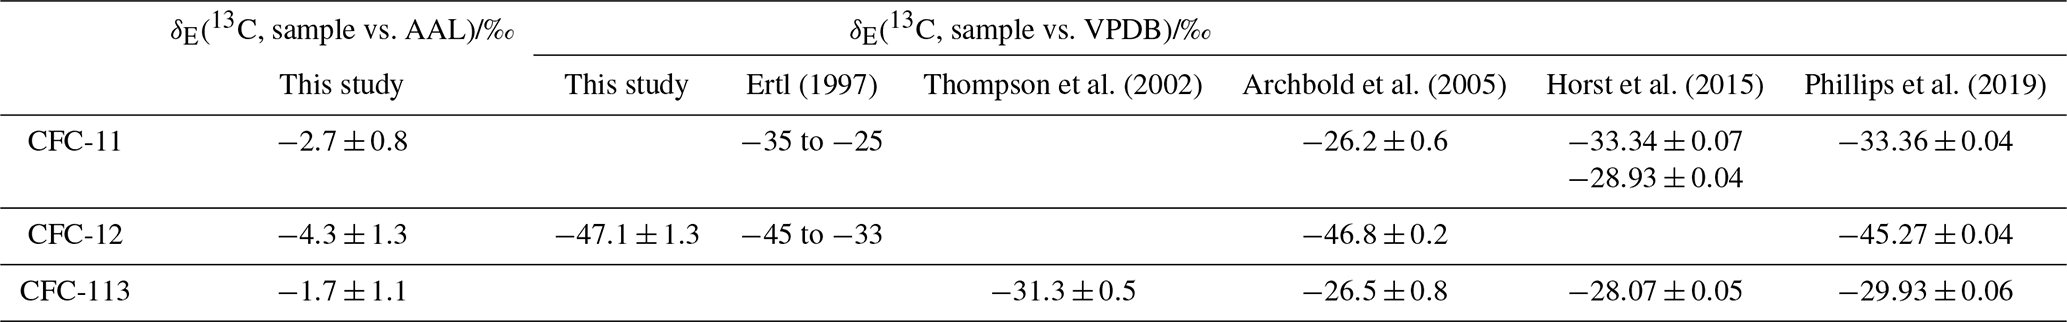
Our model returned a value for the isotopic composition of emissions, δE(13C), such that modelled δT(13C)=0 ‰ in 2005 (Table 4). Hence, more negative ϵapp, which drives greater fractionation up to 2005, produces more negative δE(13C). We take δE(13C) as the mean of the predictions using the Appenzeller et al. (1996) and Holton (1990) stratosphere–troposphere exchange parameterisations. For each CFC, δE(13C) was negative and significantly different from 0 ‰, and it was relatively depleted in 13C compared to 2005 tropospheric air. For CFC-12, we can perform a quantitative comparison with previously reported δ(13C, sample vs. VPDB) values of CFC-12 gas that was purchased from manufacturers, which range from −33 ‰ (Ertl, 1997) to () ‰ (Archbold et al., 2012) (Table 4). We modelled δE(13C, CFC-12) ‰ (2 standard errors), within the range of previously reported δE(13C, CFC-12).
Our measurements provide the first observational constraints on ϵapp(13C) for CFC-12 and CFC-113. Our derived ϵapp(13C, CFC-12) is consistent with previously reported ϵp(13C, CFC-12) (Zuiderweg et al., 2012), being a factor of 2 to 3 lower than ϵp(13C, CFC-12), as expected given the effect of mixing and diffusion in the atmosphere (Kaiser et al., 2006). Kaiser et al. (2006) also discuss in detail the effects of mixing and transport on the apparent isotope fractionations for N2O (which we know with much better precision). While mixing and transport are certainly relevant and reduce the observed apparent stratospheric isotope fraction compared with the intrinsic photochemical isotope effects, the variations in these mixing and transport effects are negligible for the precision that we report for CFCs, as can be inferred from the more precise observations for N2O. The meridional differences observed in ϵapp(CFC-12) are qualitatively consistent with previously reported isotopic fractionation patterns of other elements in long-lived trace gases, such as δ(37Cl, CFC-12) (Allin et al., 2015; Laube et al., 2010b) and N2O isotopologues (Kaiser et al., 2006). For CFC-113, we have only measured the δ(13C) of the CCl2F fragment, and our results do not provide information on the CClF2 fragment or for the molecule as a whole. Our derived ϵapp(CFC-113) is internally consistent with our firn air measurements, with both data sets being measured on the same fragment. Allin et al. (2015) do not observe meridional differences for ϵapp(37Cl, CFC-113) – as we observe for ϵapp(13C, CFC-113) – but speculate that differences could be masked by their uncertainties. Given our best understanding of compact tracer–tracer correlations in the lower stratosphere, we do not expect significant meridional differences in ϵapp for the range of observed fractional releases (Volk et al., 1997). The lack of a latitude dependence for lower-stratospheric Rayleigh fractionation is supported by stratospheric observations of other long-lived trace gases, in particular carbon and hydrogen isotope fractionation in CH4 (Röckmann et al., 2011) and nitrogen and oxygen isotope fractionation in N2O (Kaiser et al., 2006), which are constrained by a much wider range of observations, with lower measurement uncertainties, than currently available for CFCs. CH4 and N2O have global atmospheric mean lifetimes of 10 years and 123 years, respectively, which covers the range of lifetimes of CFC-11 (52 years), CFC-113 (93 years), and CFC-12 (102 years). The three CFCs also have the same chemical sinks as N2O – photolysis and oxidation by O(1D), in similar proportions as N2O. We therefore do not expect these CFCs to behave any differently than CH4 and N2O. The observed meridional differences could be statistical artefacts deriving from our poorly constrained ϵapp(mid-latitude).
Ertl (1997)Thompson et al. (2002)Archbold et al. (2005)Horst et al. (2015)Phillips et al. (2019)Table 4δE(13C) as predicted by our modelling and as reported in previous studies for CFC-11, CFC-12, and CFC-113. With the exception of Ertl (1997), all uncertainties are 2 standard errors.
We derived ϵapp(CFC-11) by scaling our measured ϵapp(CFC-12) to previously reported (Zuiderweg et al., 2012). While our presented ϵapp(CFC-11) values are our best estimates, they are dependent on our ϵapp(CFC-12) estimates, ϵp(CFC-11), and ϵp(CFC-12). Our rescaled ϵapp(CFC-11) also omits the effect of fractionation by O(1D), though given the around 2 % contribution of O(1D) to stratospheric CFC-11 loss (Burkholder et al., 2013), we expect this omission to have little effect. Appendix D gives technical details on why we do not use our CFC-11 measurements in our analysis and modelling. For all three CFCs, our ϵapp(high-latitude) was derived from more data than our ϵapp(mid-latitude), so we have more confidence in our ϵapp(high-latitude). For each CFC, ϵapp(13C) is larger than previously reported ϵapp(37Cl) (Allin et al., 2015), causing more negative fractionation during stratospheric destruction.
Our tropospheric reconstructions and modelling (Fig. 4) allow us to investigate changes in δE(13C). Our model was run using a constant δE(13C), and agreement between our reconstructed and modelled δT(13C) is therefore evidence that no large change in δE(13C) has occurred over the time period spanned by the measurements. For CFC-12, there was agreement between our reconstructed δT(13C) and comparable previous measurements (Table 3). This agreement reflects the calibration of Zuiderweg et al. (2013), to which our measurements were rescaled, but is still a check on the quality of our reconstruction. Our modelled and measured δT(13C, CFC-12) was in agreement for the entire period covered by the measurements (Fig. 4). Our results are therefore consistent with a constant δE(13C, CFC-12). Furthermore, δE(13C, CFC-12) as predicted by our model was within the range of previously reported isotopic source compositions for CFC-12 (Table 4). While some variation in δE(13C, CFC-12) is possible within our uncertainties, these confluent lines of evidence suggest that no dramatic change in δE(13C, CFC-12), as proposed by Zuiderweg et al. (2013), has occurred since around 1956. The cause of this discrepancy was likely an analytical artefact in Zuiderweg et al. (2013), discussed further in Appendix C. Our measurements and modelling of δT(13C, CFC-11) are in agreement for the entire period covered by measurements and are therefore consistent with a constant δE(13C, CFC-11) since at least 1952. For CFC-113, our modelling did not agree with our measurements earlier than around 1980. This discrepancy may be indicative of a change in δE(13C, CFC-113) though, given that our measurements do not provide a complete picture of the fractionation in CFC-113, and given that this discrepancy is caused by one measurement depth, these results do not confirm a change in δE(13C, CFC-113). Multiple industrial processes use CFC-113 as a feedstock or produce CFC-113 as an intermediate (Adcock et al., 2018), so a change in δE(13C, CFC-113) is plausible. The discrepancy between the modelled and reconstructed confidence bounds is at most −1.9 ‰. The range of published δE(CFC-113) is () ‰ to () ‰ (Table 4), around 5 ‰. The discrepancy seen for measured and modelled δT(CFC-113) can be accounted for by the range of published δE(CFC-113).
Our modelling predicts increasing δT(13C) for CFC-11, CFC-12, and CFC-113 as lighter isotopologues are preferentially destroyed in the stratosphere, and the remaining stratospheric CFC pool, enriched in 13C, is mixed with tropospheric air. An acceleration in the rate of increase in δT(13C) was modelled for each CFC, starting in around 1990. This acceleration is caused by reduced emissions, with relatively depleted δE(13C) as emissions mitigate stratospheric 13C enrichment. Therefore, the new CFC-11 emissions identified by Montzka et al. (2018) have the potential to decrease the rate of increase in δT(13C, CFC-11). We estimated the potential effect of these new emissions by comparing the V&D and M18 scenarios. As expected, in M18, δT(13C, CFC-11) was lower than V&D after 2012. Using ϵapp(CFC-11, high-latitude), the difference was 1.4 ‰ in 2050 – well within our uncertainty envelope. Improved modelling precision and more precise knowledge of δE(13C, CFC-11) would be needed if δT(13C, CFC-11) measurements were to be used as a tool for monitoring global CFC-11 emissions, though the isotopic signal from emissions may be more pronounced on regional scales.
We presented a new data set of the δ(13C) of CFC-11, CFC-12, and CFC-113 for stratospheric air samples and derived values for the apparent isotopic fractionation, ϵapp, at high latitudes and mid-latitudes of ϵapp(CFC-11, high-latitude) ‰, ϵapp(CFC-11, mid-latitude) ‰, ϵapp(CFC-12, high-latitude) ‰, ϵapp(CFC-12, mid-latitude) ‰, ϵapp(CFC-113, high-latitude) ‰, and ϵapp(CFC-113, mid-latitude) ‰. While for CFC-12 and CFC-113 these estimates are independent, the ϵapp(CFC-11) estimates are not, having been derived by scaling our ϵapp(CFC-12) measurements. Further measurements of δ(13C, CFC-11) in the stratosphere are required to estimate ϵapp(CFC-11) independent of CFC-12. For CFC-113, these ϵapp values are only applicable to the CCl2F fragment of the molecule. When used to model the tropospheric isotopic composition, δT(13C), our derived ϵapp(high-latitude) drives strong fractionation from the mid 1900s through to 2050. Our stratospheric data complement previous, similar measurements of δ(37Cl) for CFC-11, CFC-12, and CFC-113 (Allin et al., 2015; Laube et al., 2010a).
We also reconstructed δT(13C) from firn air measurements. Comparing these with the model shows that the histories of δT(13C, CFC-11) and δT(13C, CFC-12) are consistent with a constant isotopic source composition, δE(13C), and with stratospheric processing as the sole sink of these chemicals. Our results contradict previous reports of extreme depletion for δT(13C, CFC-12) and δE(13CFC-12). Such extreme depletions could have challenged the history of CFC-12 industrial processes and feedstocks, the current understanding of their atmospheric cycling, and/or raised questions about their inertness in the biogeosphere. The discrepancy between reconstructed and modelled δT(13C, CFC-113) suggests a change in δE(13C, CFC-113). Changes in industrial processes that produce CFC-113 – as an end product or by-product – could explain such a discrepancy, and the range of reported δE(13C, CFC-113) would be sufficient to cause such a discrepancy. We caution, however, that this discrepancy derives from only one sample and takes into account the fractionation of only one CFC-113 fragment. Further work would be needed to definitively assign a change in δE(13C, CFC-113). The modelled increase in δT(13C) from 2009 through 2050 is sensitive to new emissions. We compared future δT(13C, CFC-11) trends in scenarios with and without new CFC-11 emissions. The difference between scenarios was within uncertainty bounds; showing better modelling precision and precise quantification of the isotopic composition of emissions would be needed to detect the isotopic signature of recently reported new CFC-11 emissions in background air.
We measured two dilution series to account for any errors or biases that may be introduced by the low concentrations of CFCs in some samples (Fig. A1). The first dilution series was produced using method A and is therefore applicable to measurements of the Kiruna and Gap samples. The second dilution series was produced using method B and is therefore applicable to measurements of the NEEM 2008/09 firn samples. Each dilution series included repeat measurements of a reference gas (unpolluted tropospheric air collected in 2009; SX-0706077) at five concentrations ranging from (2.9±0.02) to (245.1±3.6) pmol mol−1 (CFC-11), (6.6±0.1) to (540.0±3.4) pmol mol−1 (CFC-12), and (0.9±0.01) to (78.1±0.2) pmol mol−1 (CFC-113). Measurements of this dilution series were previously reported by Allin et al. (2015, SI). The 102 peak area was used as an indicator of the level of dilution in the sample. Noting that the true δ(13C, sample vs. SX-0706077) value of each measurement is 0 ‰, we assessed the performance of our method by plotting peak area against measured δ(13C, sample vs. SX-0706077) for each sample.
For method A, the measured δ(13C) was negative for the samples with the lowest 102 peak area. We have therefore taken the lowest-dilution series 102 peak area where we do not see this behaviour to be the lower 102 peak area limit for method A, above which we have reliable data. This limit was 39 000 (CFC-11), 57 000 (CFC-12), and 44 000 (CFC-113) and is shown in Fig. A1 by the dotted red line. Kiruna and Gap measurements with 102 peak areas below this threshold were excluded from our results but are provided in the Supplement. For method B, the measured δ(13C) showed no bias for lower peak areas, and we therefore retained all data. We have excluded the 69.4 and 71.9 m NEEM 2009 samples for CFC-113 because, for the corresponding mean ages, there was too little CFC-113 in the atmosphere (Adcock et al., 2018) to reliably determine δ(13C).
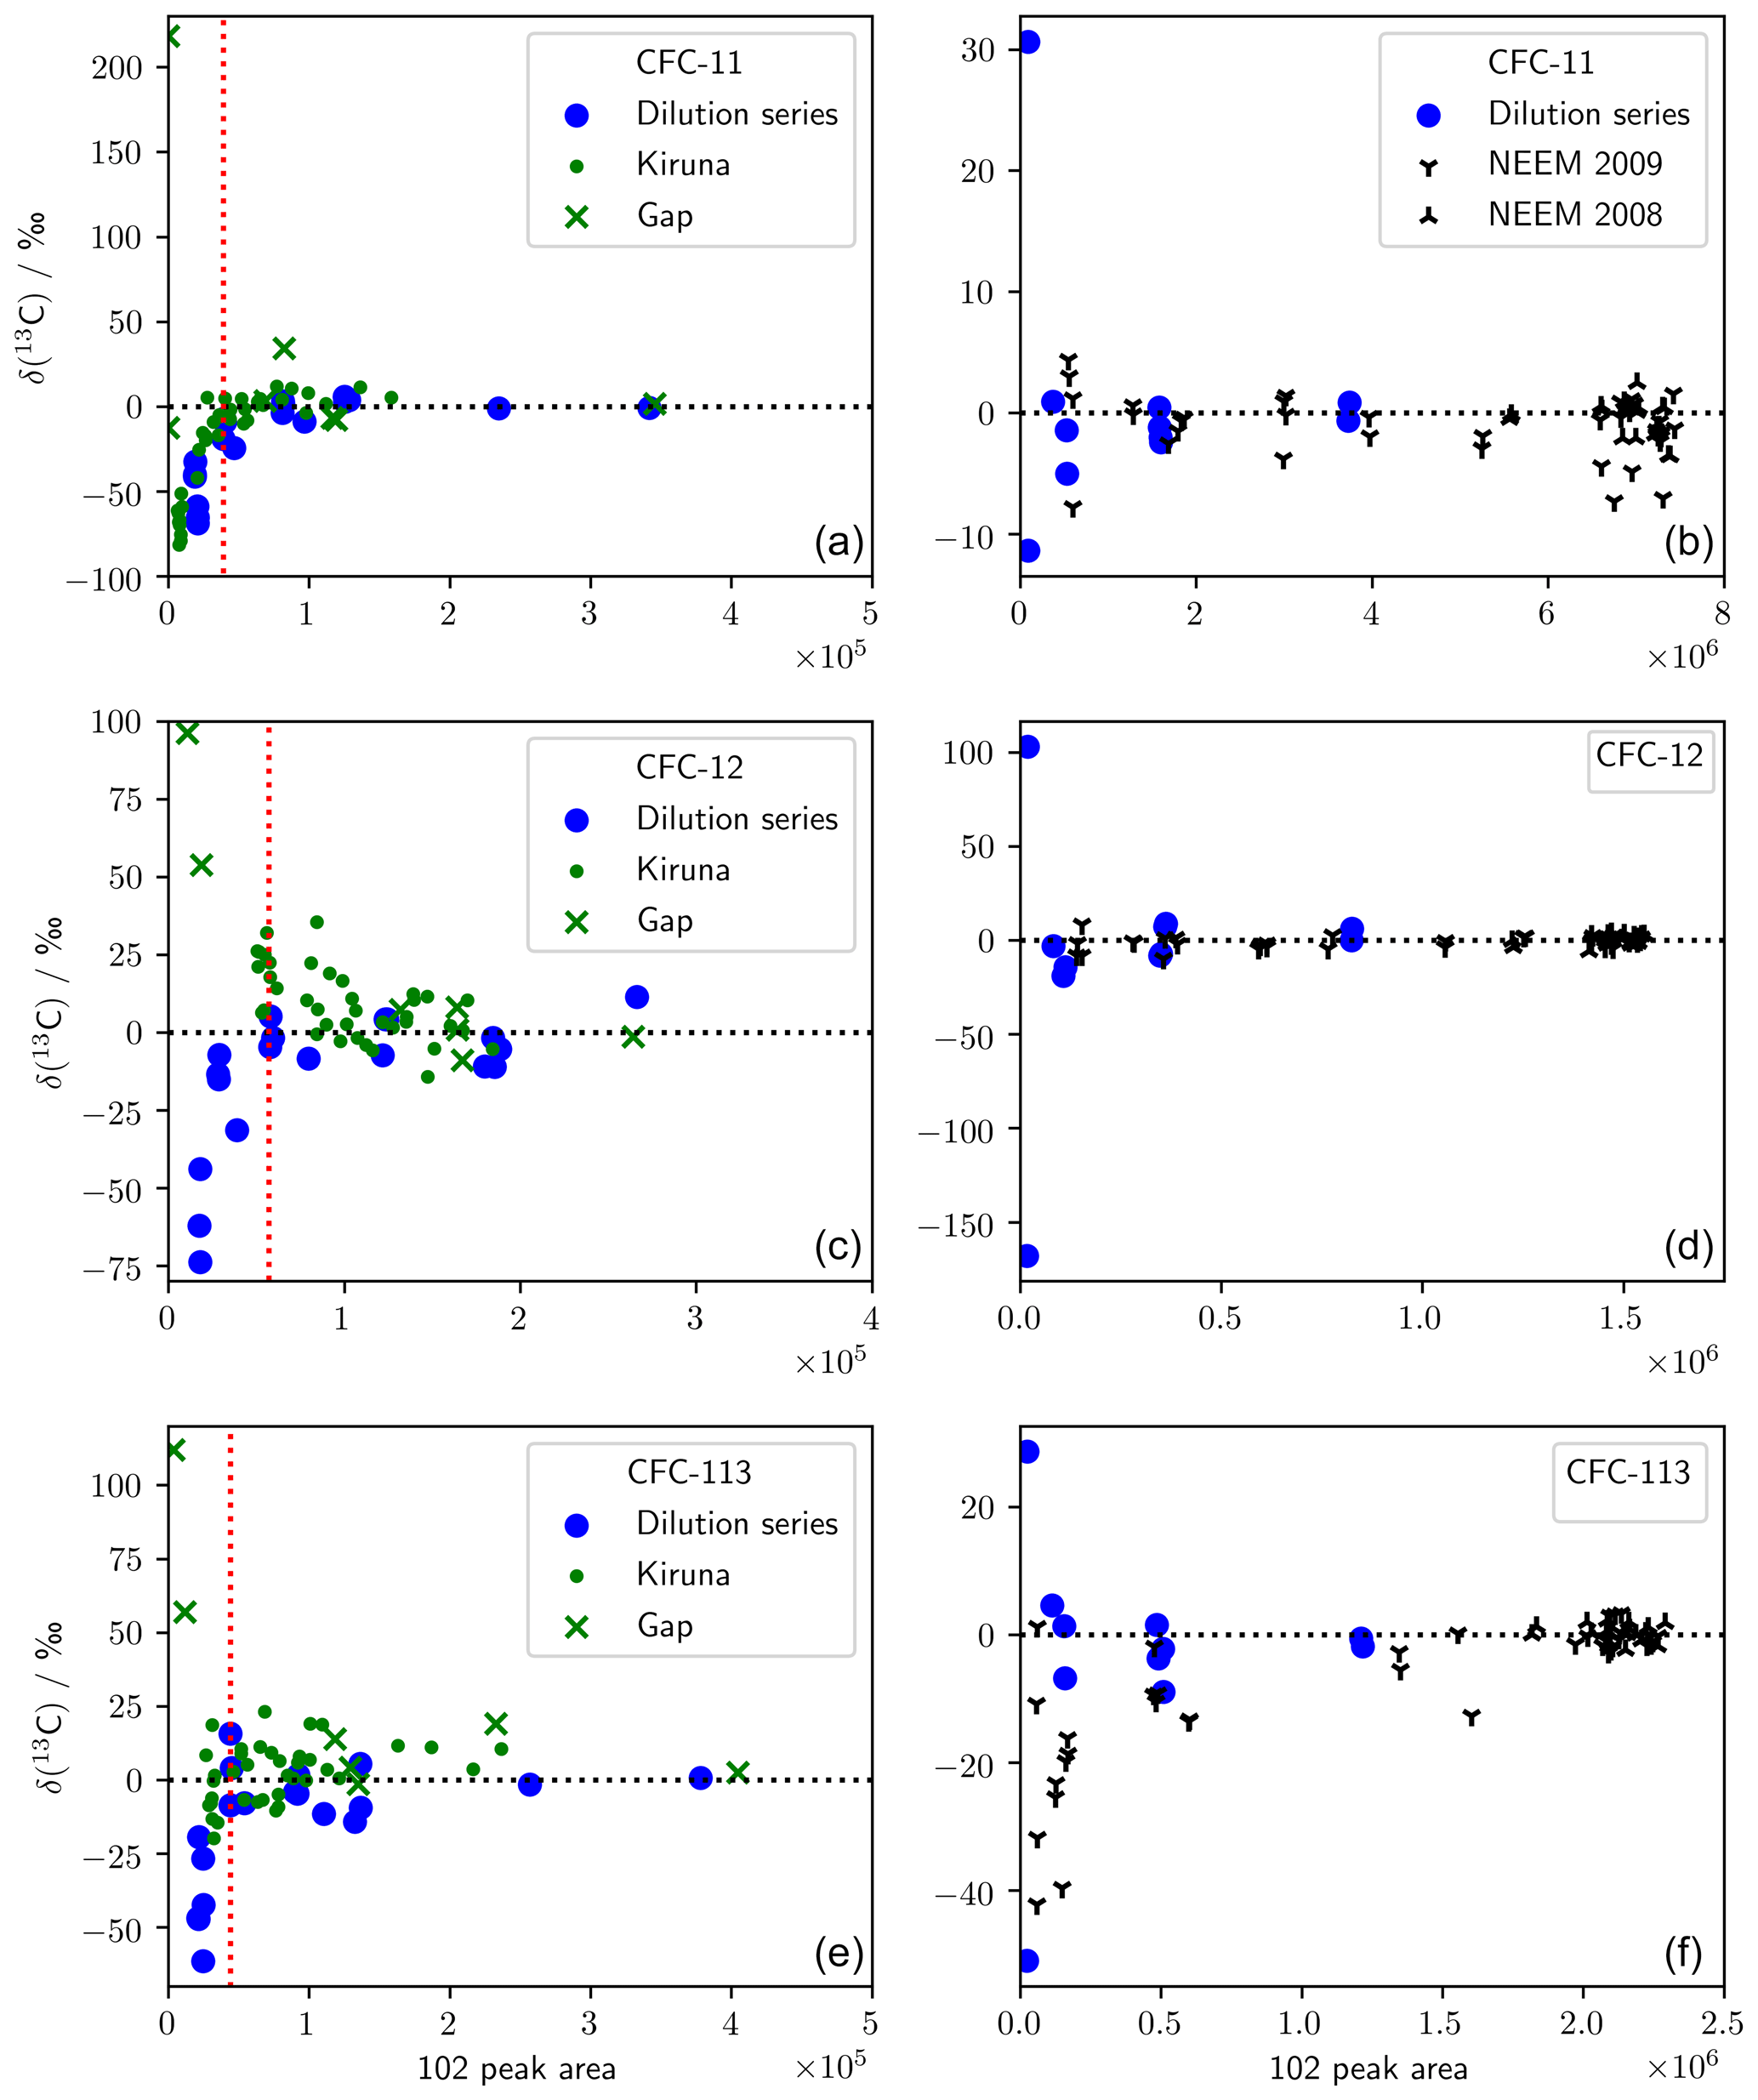
Figure A1Dilution series for the analytical methodologies used in this work. (a, c, e) Method A, which was used to measure stratospheric samples. The dotted red line shows the lower limit of 102 peak areas that were retained. (b, d, f) Method B, which was used to measure firn air. Dilution series measurements are relative to SX-0706077 (2009 air), and stratospheric and firn air measurements are relative to AAL (2005 air).
Single-detector GC–MS has been used previously to measure carbon isotope ratios (Eiler et al., 2017; Hauri et al., 2002; Schutten et al., 1957; Nier, 1940), and our single-detector GC–MS analytical system has been used previously to measure chlorine isotopes in stratospheric and firn air samples (Allin et al., 2015; Laube et al., 2010a). As a check on the quality of our method, we have compared measurements made of a suite of photolysis samples using GC–IRMS (Zuiderweg et al., 2011) as presented in Zuiderweg et al. (2012) to our own measurements – using GC–MS – of those samples (Fig. B1). These samples were not subject to the CH3Cl chromatographic interference seen in Zuiderweg et al. (2013). The samples were diluted by a factor of 1000 before measurement on our system to accommodate the higher sensitivity of our GC–MS method.
The agreement between the methods is good (Fig. B1). Linear regression gives a high regression coefficient (r2=0.92) and a gradient consistent with unity (1.0±0.1). This agreement holds over a range of δ spanning almost 60 ‰. The intercept is (46.3±2.7) ‰. This intercept results in a δ value for CFC-12 in AAL-071170 on the VPDB scale of () ‰ – consistent with the (43.0±2.3) ‰ derived using Eq. (3).
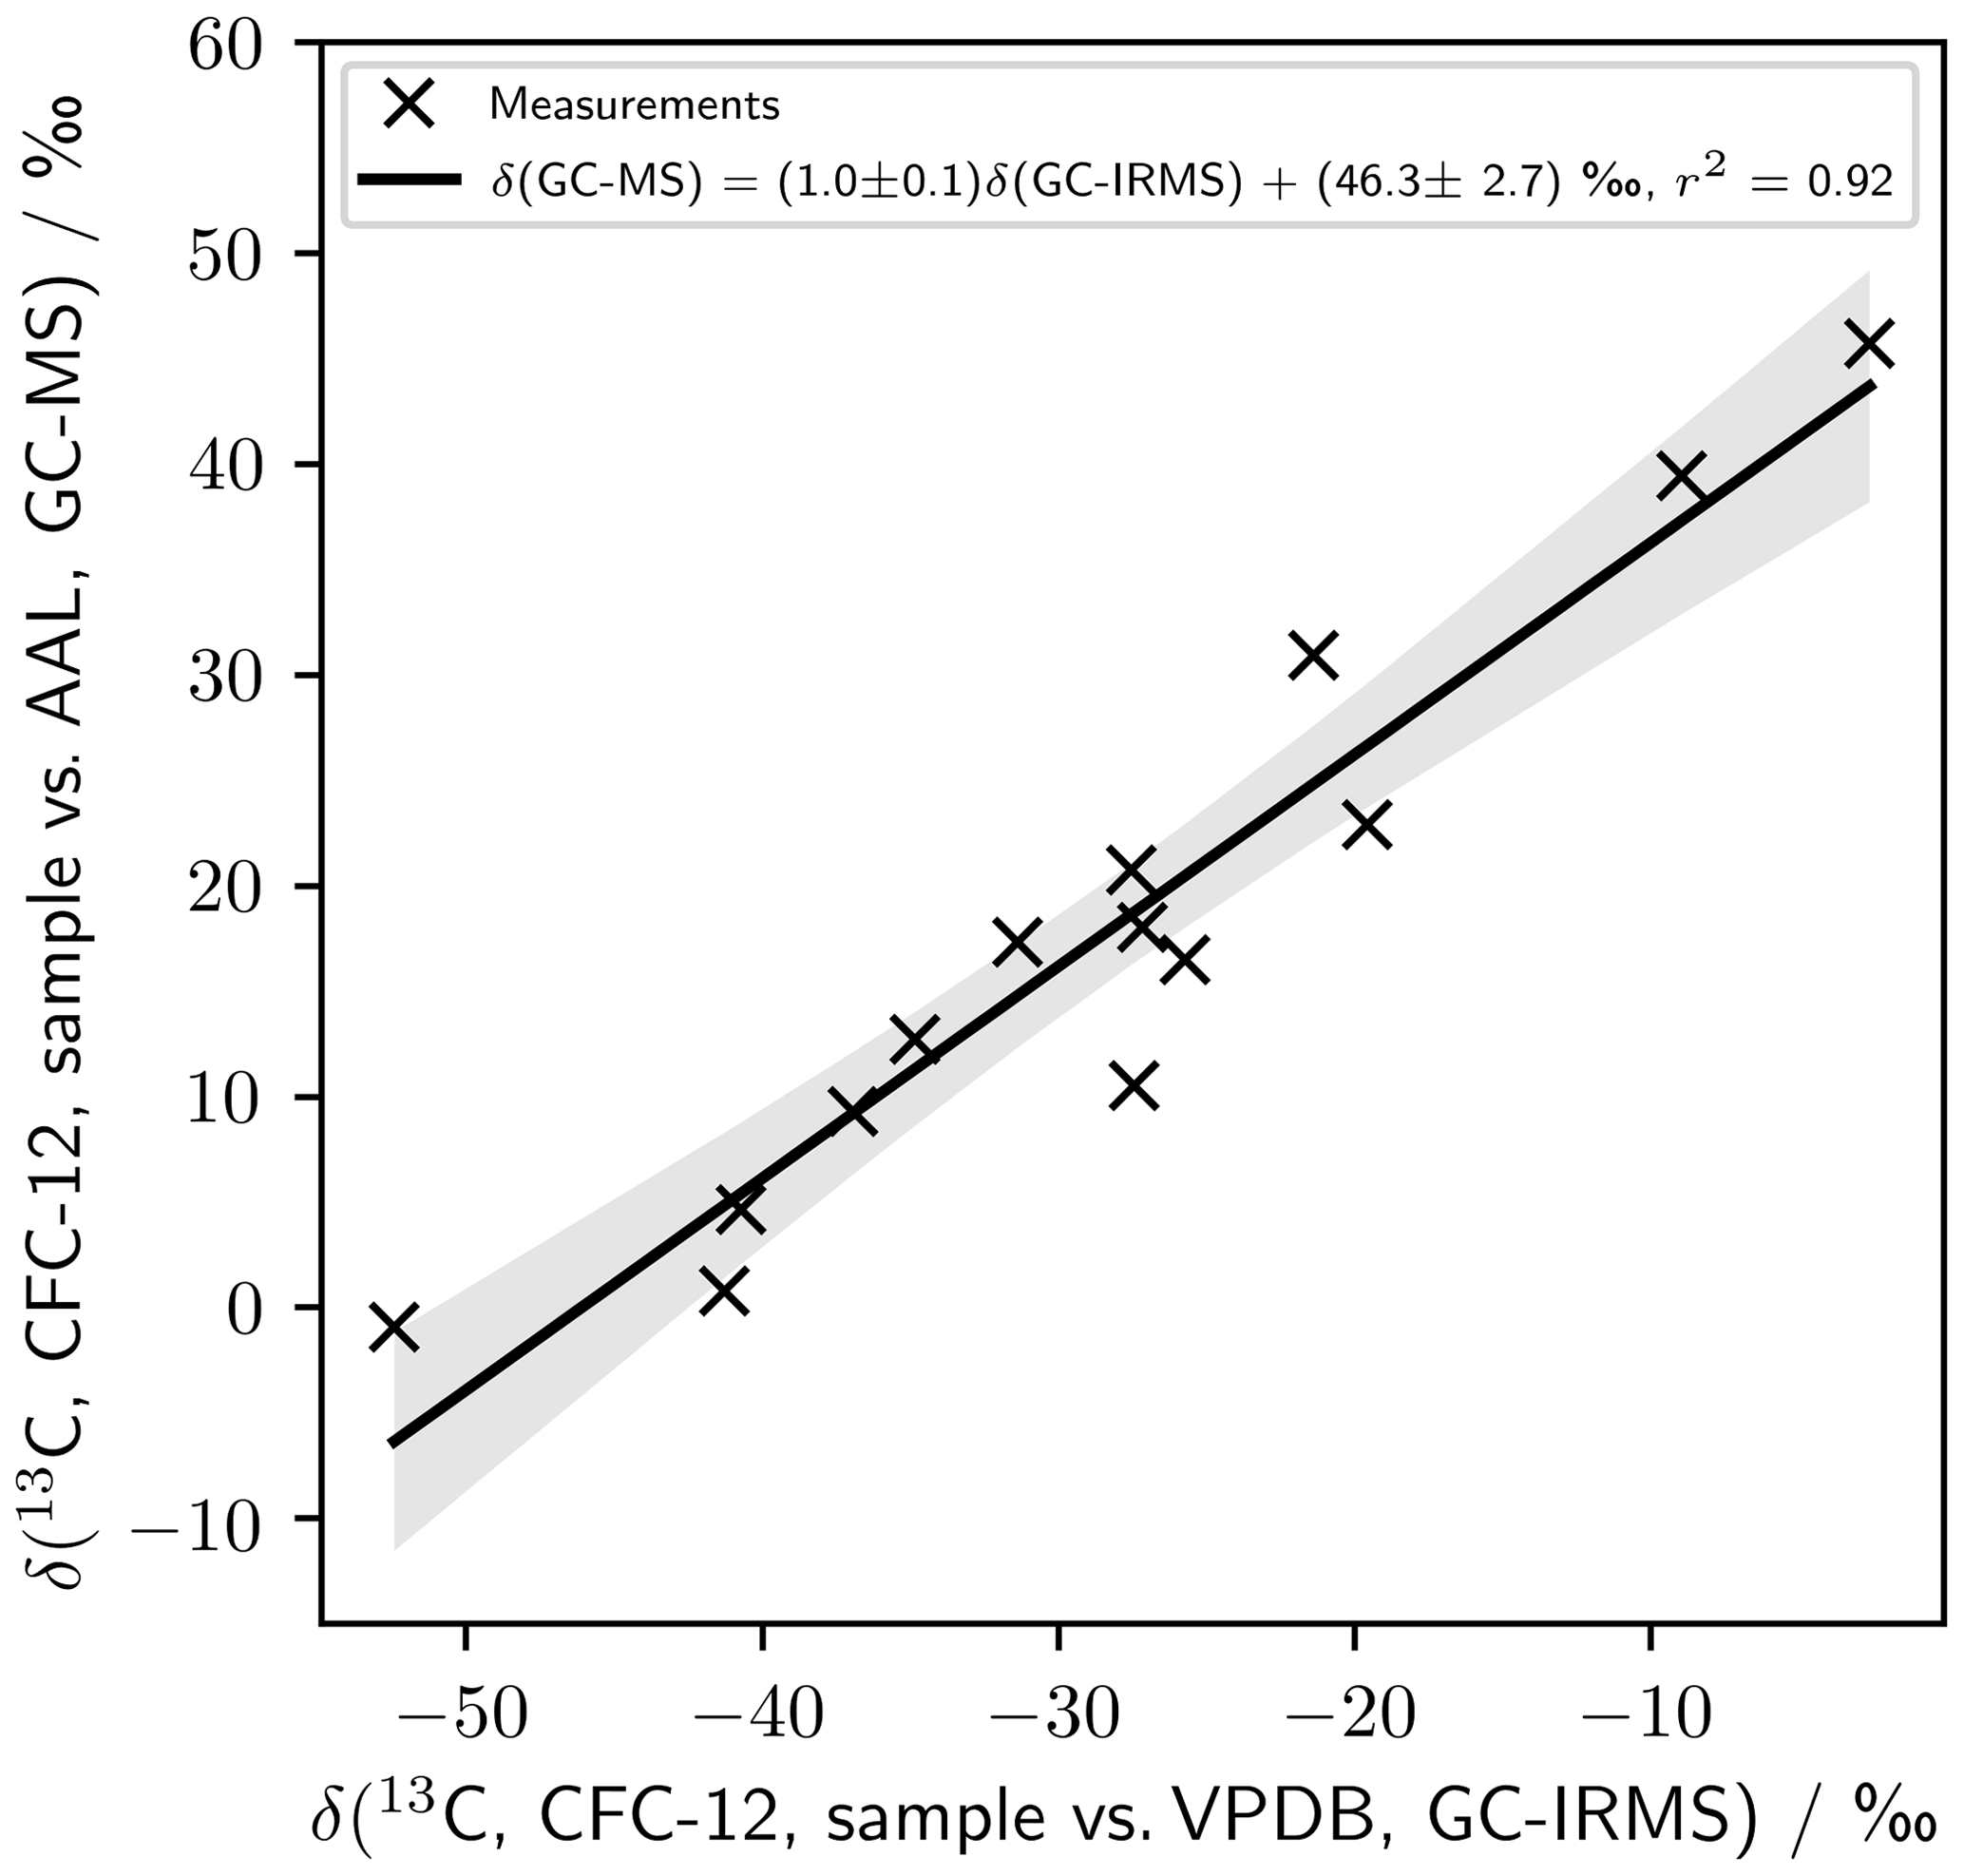
Figure B1Comparison of measurements presented by Zuiderweg et al. (2012) using GC–IRMS (Zuiderweg et al., 2011) to our own measurements of those same samples.
We measured δ(13C, CFC-12) in the same NEEM 2009 flask samples as Zuiderweg et al. (2013) and linked our measurements to the VPDB calibration scale used by Zuiderweg et al. (2013). The measurements in these two studies were consistent, except for the samples at 66.8 and 69.4 m, corresponding to mean ages of 1977 and 1965, respectively (Fig. 2). For the sample corresponding to a mean age of 1965, the discrepancy between data sets is around 40 ‰, an order of magnitude larger than our 95 % confidence intervals and any corrections made to our measurements. The discrepancy is larger when δT(13C, CFC-12) is considered, with the tropospheric scenario presented by Zuiderweg et al. (2013) predicting δT(13C) ‰ in 1965, whereas our measured δT(13C, CFC-12) ‰ (2 standard errors). Assuming sample integrity was preserved between studies, at most one data set can be accurate.
The cause of this discrepancy was likely a measurement artefact in Zuiderweg et al. (2013). In the method of Zuiderweg et al. (2013), methyl chloride elutes before CFC-12. Zuiderweg et al. (2013) model the methyl chloride tail using an exponentially decaying function and subtract this signal from their CFC-12 peak before integration. Zuiderweg et al. (2013) performed a dilution series to evaluate their method, including their treatment of the methyl chloride peak. However, in their dilution series the proportion of methyl chloride to CFC-12 was constant because methyl chloride and CFC-12 were diluted concurrently. In the NEEM 2009 firn air samples, the proportion of methyl chloride to CFC-12 increased in the deeper samples (see Fig. 2 in Zuiderweg et al., 2013). This increase reflects the changing ratio of the CFC-12 mole fraction, γ(CFC-12), to the CH3Cl mole fraction, γ(CH3Cl), since the early 1900s (Fig. C1). The methyl chloride baseline correction was therefore performed, on the sample at 69.4 m and, to a lesser extent, on the sample at 66.8 m, on a methyl chloride peak that was larger than that evaluated in the dilution series for a given CFC-12 peak area. Indeed, the trend in δ(13C) depletion in the NEEM 2009 profile was qualitatively similar to the trend in tropospheric over that time period, with lower for the depleted δ(13C) measurements and relatively constant in the period of little change in δ(13C). The dilution series performed by Zuiderweg et al. (2013) therefore did not adequately assess variations in .
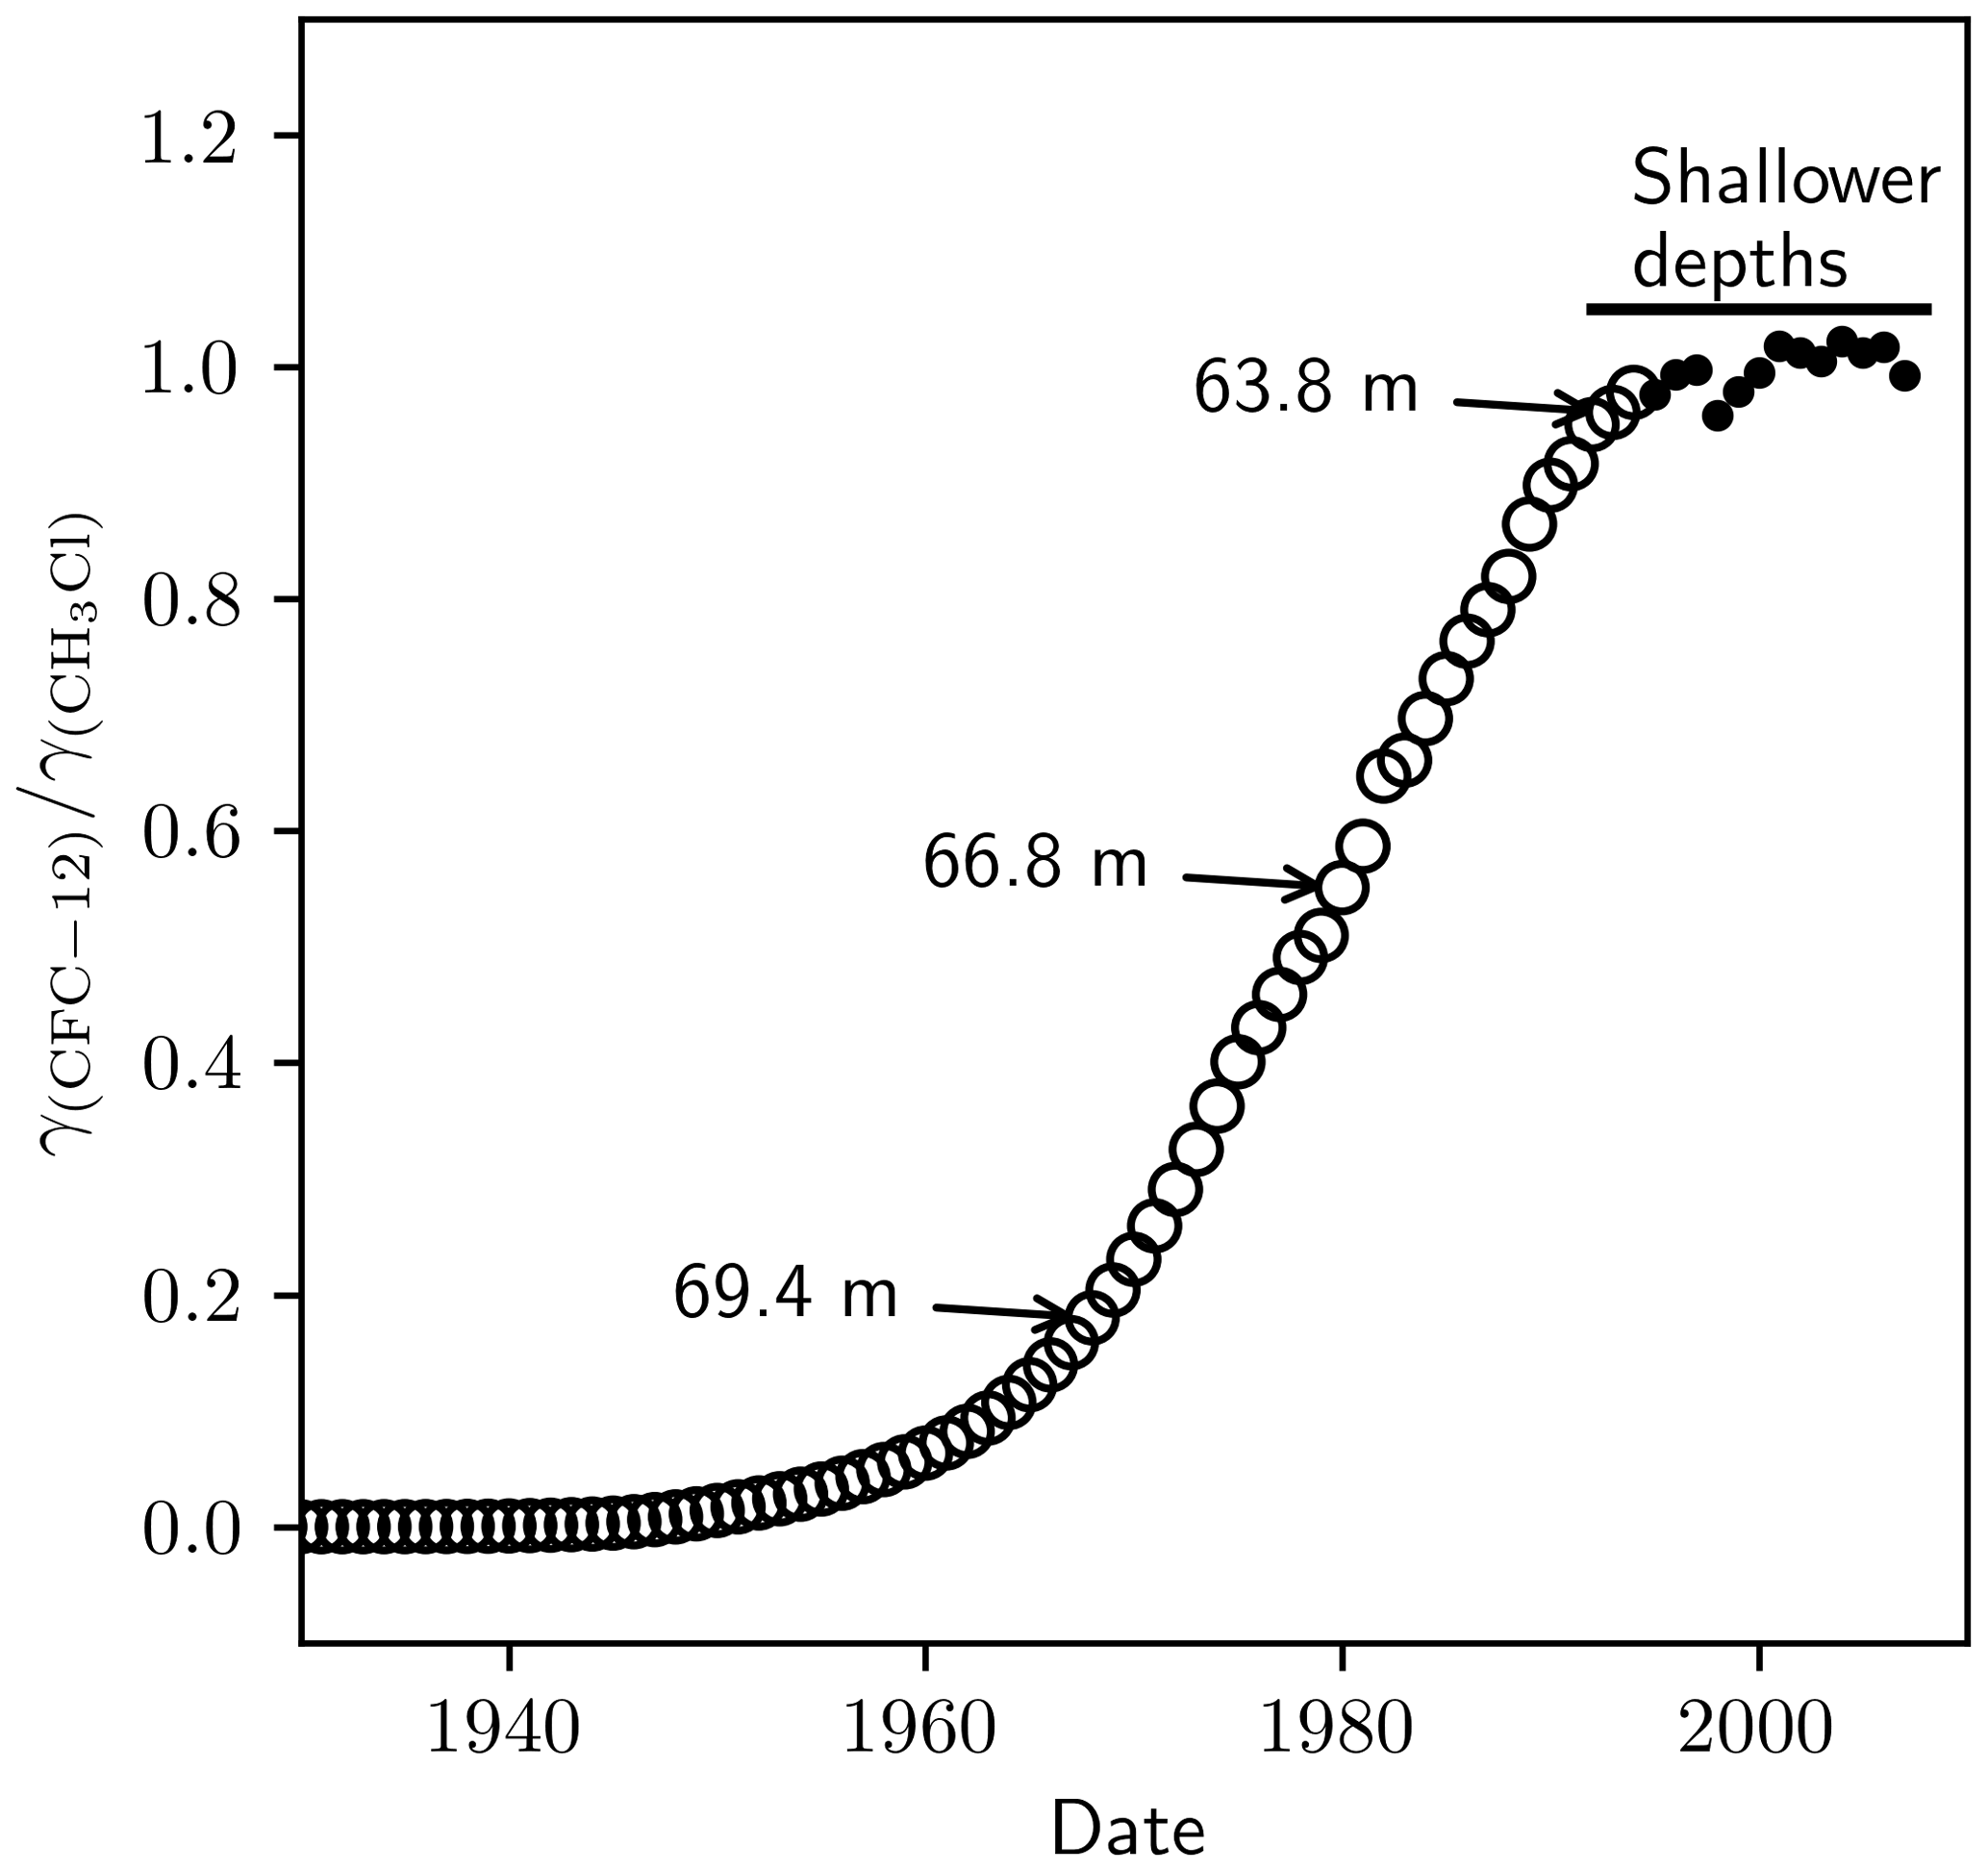
Figure C1The ratio of the tropospheric mole fraction of CFC-12 to CH3Cl. Circles were taken from Butler et al. (1999). The dots were calculated using data from the National Oceanic and Atmospheric Administration – Halocarbons & other Atmospheric Trace Species (NOAA-HATS). The annotations indicate the points on the curve that correspond to different depth samples in the NEEM 2009 firn profile.
We presented ϵapp(CFC-11) based on scaling of our measured ϵapp(CFC-12) (Table 2, Eq. 4). These best-estimate values were used in our analysis and modelling. We took this approach because the ϵapp(CFC-11) derived from our stratospheric measurements was inadequate. Figure 3 shows stratospheric Rayleigh plots for our CFC-11 data, from which we derived ϵapp(CFC-11, high-latitude) ‰ and ϵapp(CFC-11, mid-latitude) ‰ (1 standard error). ϵapp(CFC-11, high-latitude) is not significantly different from 0 ‰ and therefore, when used to force our model, gives confidence intervals that, while consistent with our observations, span 0 ‰. ϵapp(CFC-11, high-latitude) derived from our stratospheric CFC-11 measurements is consistent with our presented best estimate, ϵapp(CFC-11, high-latitude) ‰. We do not reject our ϵapp(CFC-11, high-latitude) derived directly from our CFC-11 observations as it is reasonable and derived from relatively many data. We used a different estimate in our analysis simply to achieve the best possible model precision. In contrast, we do not believe our derived ϵapp(CFC-11, mid-latitude) ‰ is correct based on consideration of previously reported ϵp (Zuiderweg et al., 2012, Table 2). Our ϵapp(CFC-11, mid-latitude) derived from our stratospheric CFC-11 measurements is greater than previously reported ϵp(CFC-11), which is inconsistent with our best understanding of atmospheric mixing (Kaiser et al., 2006). Also, our derived , inconsistent with . Our mid-latitude stratospheric CFC-11 regressions were derived from few data (n=5) and are heavily influenced by one data point with . We believe, with additional measurements, ϵapp(CFC-11) would likely decrease in magnitude.
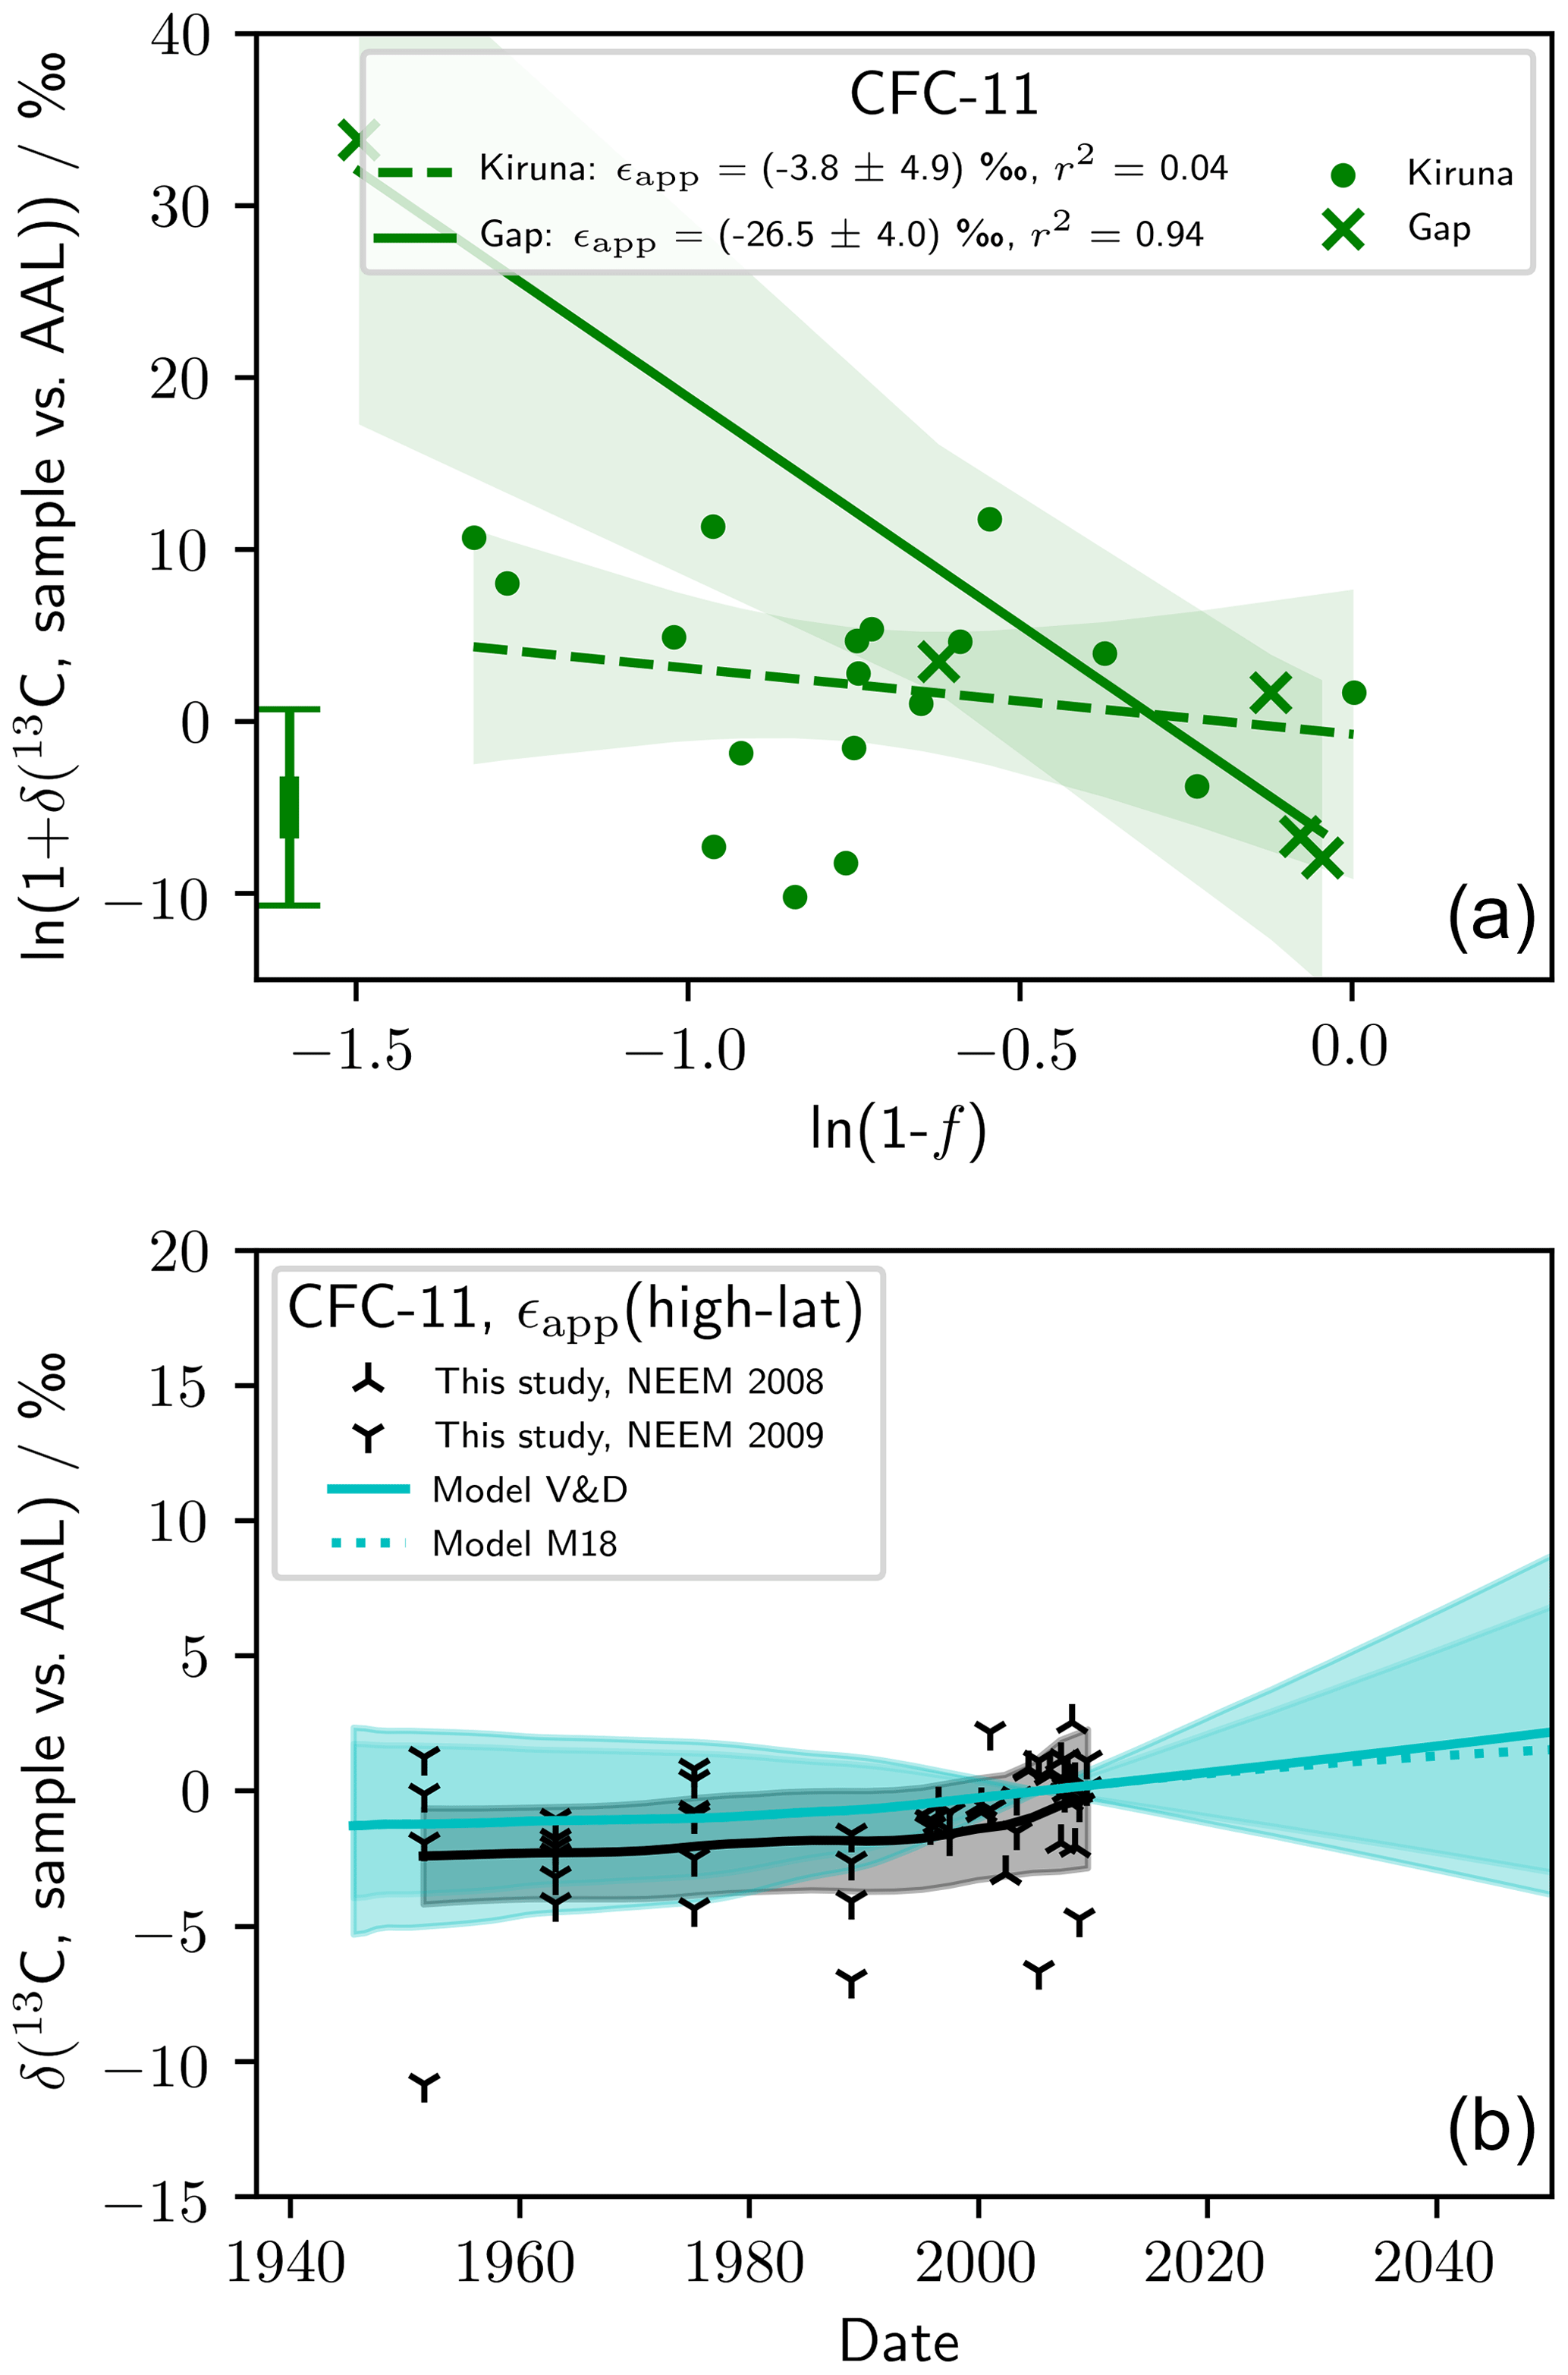
Figure D1(a) Rayleigh plot showing observations of δ13(C, CFC-11) and derived ϵapp(CFC-11, high-latitude) and ϵapp(CFC-11, mid-latitude). (b) Also shown is measured and modelled δT(CFC-11) (see Fig. 4 and Sect. 2.5 for a description of the model). The model was forced with ϵapp(CFC-11, high-latitude). The error bar in the bottom left corner of (a) shows the median repeatability of the reference gas measurements over the measurement days and the median error deriving from the fractional release factor.
All data and plot scripts used in this study are given in the Supplement.
The supplement related to this article is available online at: https://doi.org/10.5194/acp-21-6857-2021-supplement.
MT prepared the manuscript with JCL, JK, and TR, with contributions from all authors. SA measured the firn air samples, and AR measured the stratospheric samples under the supervision of JCL, JK, and WTS. PM and EW provided the firn air modelling, and JK provided the tropospheric modelling. TR was responsible for the Geophysica aircraft sampling, while RM, TR, JK, and WTS led the firn sampling activities.
The authors declare that they have no conflict of interest.
This work received funding from the European Research Council (EXC3ITE “EXploring Chemistry, Composition and Circulation in the stratosphere with Innovative TEchnologies”; grant agreement no. 678904), the Horizon 2020 research and innovation programme through the EUROCHAMP-2020 Infrastructure Activity under grant agreement no. 730997, and the UK Natural Environment Research Council (research fellowship NE/I021918/1). NEEM is directed and organised by the Centre for Ice and Climate at the Niels Bohr Institute and US NSF, Office of Polar Programs. It is supported by funding agencies and institutions in Belgium (FNRS-CFB and FWO), Canada (GSC), China (CAS), Denmark (FIST), France (IPEV, CNRS/INSU, CEA, and ANR), Germany (AWI), Iceland (RannIs), Japan (NIPR), Korea (KOPRI), the Netherlands (NWO/ALW), Sweden (VR), Switzerland (SNF), United Kingdom (NERC), and the USA (US NSF, Office of Polar Programs). We thank Kelly Redeker for supplying raw data from Redeker et al. (2007). We also thank Stephen A. Montzka, James W. Elkins, and others involved in the NOAA-HATS programme and the NOAA/ESRL Global Monitoring Division for CFC-12 and CH3Cl mole fraction data (ftp://aftp.cmdl.noaa.gov/data/hats/cfcs/cfc12/combined/, last access: 31 August 2018 and ftp://aftp.cmdl.noaa.gov/data/hats/methylhalides/ch3cl/flasks/, last access: 31 August 2018).
This research has been supported by the European Research Council (EXC3ITE (grant no. 678904)), Horizon 2020 (EUROCHAMP-2020 (grant no. 730997)), and the Natural Environment Research Council (grant no. NE/I021918/1).
This paper was edited by Farahnaz Khosrawi and reviewed by two anonymous referees.
Adcock, K. E., Reeves, C. E., Gooch, L. J., Leedham Elvidge, E. C., Ashfold, M. J., Brenninkmeijer, C. A. M., Chou, C., Fraser, P. J., Langenfelds, R. L., Mohd Hanif, N., O'Doherty, S., Oram, D. E., Ou-Yang, C.-F., Phang, S. M., Samah, A. A., Röckmann, T., Sturges, W. T., and Laube, J. C.: Continued increase of CFC-113a (CCl3CF3) mixing ratios in the global atmosphere: emissions, occurrence and potential sources, Atmos. Chem. Phys., 18, 4737–4751, https://doi.org/10.5194/acp-18-4737-2018, 2018. a, b, c, d
Adcock, K. E., Ashfold, M. J., Chou, C. C.-K., Gooch, L. J., Mohd Hanif, N., Laube, J. C., Oram, D. E., Ou-Yang, C.-F., Panagi, M., Sturges, W. T., and Reeves, C. E.: Investigation of East Asian emissions of CFC-11 using atmospheric observations in Taiwan, Environ. Sci. Technol., 54, 3814–3822, 2020. a
Allin, S. J., Laube, J. C., Witrant, E., Kaiser, J., McKenna, E., Dennis, P., Mulvaney, R., Capron, E., Martinerie, P., Röckmann, T., Blunier, T., Schwander, J., Fraser, P. J., Langenfelds, R. L., and Sturges, W. T.: Chlorine isotope composition in chlorofluorocarbons CFC-11, CFC-12 and CFC-113 in firn, stratospheric and tropospheric air, Atmos. Chem. Phys., 15, 6867–6877, https://doi.org/10.5194/acp-15-6867-2015, 2015. a, b, c, d, e, f, g, h, i, j, k, l, m, n, o, p, q, r, s, t, u, v, w, x, y
Appenzeller, C., Holton, J. R., and Rosenlof, K. H.: Seasonal variation of mass transport across the tropopause, J. Geophys. Res.-Atmos., 101, 15071–15078, 1996. a, b, c, d, e
Archbold, M. E., Redeker, K. R., Davis, S., Elliot, T., and Kalin, R. M.: A method for carbon stable isotope analysis of methyl halides and chlorofluorocarbons at pptv concentrations, Rapid Commun. Mass Sp., 19, 337–342, 2005. a
Archbold, M. E., Elliot, T., and Kalin, R. M.: Carbon isotopic fractionation of CFCs during abiotic and biotic degradation, Environ. Sci. Technol., 46, 1764–1773, 2012. a
Bahlmann, E., Weinberg, I., Seifert, R., Tubbesing, C., and Michaelis, W.: A high volume sampling system for isotope determination of volatile halocarbons and hydrocarbons, Atmos. Meas. Tech., 4, 2073–2086, https://doi.org/10.5194/amt-4-2073-2011, 2011. a, b, c, d
Bernard, S., Röckmann, T., Kaiser, J., Barnola, J.-M., Fischer, H., Blunier, T., and Chappellaz, J.: Constraints on N2O budget changes since pre-industrial time from new firn air and ice core isotope measurements, Atmos. Chem. Phys., 6, 493–503, https://doi.org/10.5194/acp-6-493-2006, 2006. a
Buizert, C., Martinerie, P., Petrenko, V. V., Severinghaus, J. P., Trudinger, C. M., Witrant, E., Rosen, J. L., Orsi, A. J., Rubino, M., Etheridge, D. M., Steele, L. P., Hogan, C., Laube, J. C., Sturges, W. T., Levchenko, V. A., Smith, A. M., Levin, I., Conway, T. J., Dlugokencky, E. J., Lang, P. M., Kawamura, K., Jenk, T. M., White, J. W. C., Sowers, T., Schwander, J., and Blunier, T.: Gas transport in firn: multiple-tracer characterisation and model intercomparison for NEEM, Northern Greenland, Atmos. Chem. Phys., 12, 4259–4277, https://doi.org/10.5194/acp-12-4259-2012, 2012. a, b
Burkholder, J. B., Mellouki, W., Fleming, E. L., George, C., Heard, D. E., Jackman, C. H., Kurylo, M. J., Orkin, V. L., Swartz, W. H., and Wallington, T. J.: Chapter 3: Evaluation of Atmospheric Loss Processes, SPARC Report on the Lifetimes of Stratospheric Ozone-Depleting Substances, Their Replacements, and Related Species, SPARC Report No. 6, 2013. a, b
Butler, J. H., Battle, M., Bender, M. L., Montzka, S. A., Clarke, A. D., Saltzman, E. S., Sucher, C. M., Severinghaus, J. P., and Elkins, J. W.: A record of atmospheric halocarbons during the twentieth century from polar firn air, Nature, 399, 749–755, 1999. a
Carpenter, L. J., Reimann, S., Burkholder, J. B., C., C., Hall, B. D., Hossaini, R., Laube, J. C., and Yvon-Lewis, S. A.: Chapter 1: Ozone-Depleting Substances (ODSs) and Other Gases of Interest to the Montreal Protocol, Scientific Assesment of Ozone Depletion: 2014, Global Ozone Research and Monitoring Project-Report No. 55, World Meteorological Organization, Geneva, Switzerland, 2014. a
Eiler, J., Cesar, J., Chimiak, L., Dallas, B., Grice, K., Griep-Raming, J., Juchelka, D., Kitchen, N., Lloyd, M., Makarov, A., Robins, R., and Schwieters, J.: Analysis of molecular isotopic structures at high precision and accuracy by Orbitrap mass spectrometry, Int. J. Mass Spectrom., 422, 126–142, https://doi.org/10.1016/j.ijms.2017.10.002, 2017. a
Ertl, S. J.: Herkunftsbestimmung organischer Schadstoffe durch Untersuchung des natürlichen Isotopengehalts (in German), PhD thesis, Technischen Universitaẗ München, München, 1997. a, b, c
Farman, J. C., Gardiner, B. G., and Shanklin, J. D.: Large losses of total ozone in Antarctica reveal seasonal ClOx/NOx interaction, Nature, 315, 207–210, 1985. a
Griffith, D. W. T., Toon, G. C., Sen, B., Blavier, J.-F., and Toth, R. A.: Vertical profiles of nitrous oxide isotopomer fractionation measured in the stratosphere, Geophys. Res. Lett., 27, 2485–2488, 2000. a
Hauri, E. H., Wang, J., Pearson, D., and Bulanova, G.: Microanalysis of δ13C, δ15N, and N abundances in diamonds by secondary ion mass spectrometry, Chem. Geol., 185, 149–163, https://doi.org/10.1016/S0009-2541(01)00400-4, 2002. a
Holton, J.: On the global exchange of mass between the stratosphere and troposphere, J. Atmos. Sci., 47, 392–395, 1990. a, b, c, d, e
Horst, A., Lacrampe-Couloume, G., and Sherwood Lollar, B.: Compound-specific stable carbon isotope analysis of chlorofluorocarbons in groundwater, Anal. Chem., 87, 10498–10504, 2015. a
Kaiser, J., Engel, A., Borchers, R., and Röckmann, T.: Probing stratospheric transport and chemistry with new balloon and aircraft observations of the meridional and vertical N2O isotope distribution, Atmos. Chem. Phys., 6, 3535–3556, , 2006. a, b, c, d, e, f, g, h, i, j, k, l
Laube, J. C., Engel, A., Bönisch, H., Möbius, T., Sturges, W. T., Braß, M., and Röckmann, T.: Fractional release factors of long-lived halogenated organic compounds in the tropical stratosphere, Atmos. Chem. Phys., 10, 1093–1103, https://doi.org/10.5194/acp-10-1093-2010, 2010a. a, b, c, d, e
Laube, J., Kaiser, J., Sturges, W., Bönisch, H., and Engel, A.: Chlorine isotope fractionation in the stratosphere, Science, 329, 1167–1167, 2010b. a, b, c, d, e
Leedham Elvidge, E., Bönisch, H., Brenninkmeijer, C. A. M., Engel, A., Fraser, P. J., Gallacher, E., Langenfelds, R., Mühle, J., Oram, D. E., Ray, E. A., Ridley, A. R., Röckmann, T., Sturges, W. T., Weiss, R. F., and Laube, J. C.: Evaluation of stratospheric age of air from CF4, C2F6, C3F8, CHF3, HFC-125, HFC-227ea and SF6; implications for the calculations of halocarbon lifetimes, fractional release factors and ozone depletion potentials, Atmos. Chem. Phys., 18, 3369–3385, https://doi.org/10.5194/acp-18-3369-2018, 2018. a
Lickley, M., Solomon, S., Fletcher, S., Velders, G. J., Daniel, J., Rigby, M., Montzka, S. A., Kuijpers, L. J., and Stone, K.: Quantifying contributions of chlorofluorocarbon banks to emissions and impacts on the ozone layer and climate, Nat. Commun., 11, 1–11, 2020. a
Minschwaner, K., Hoffmann, L., Brown, A., Riese, M., Müller, R., and Bernath, P. F.: Stratospheric loss and atmospheric lifetimes of CFC-11 and CFC-12 derived from satellite observations, Atmos. Chem. Phys., 13, 4253–4263, https://doi.org/10.5194/acp-13-4253-2013, 2013. a
Molina, M. J. and Rowland, F. S.: Stratospheric sink for chlorofluoromethanes: chlorine atom-catalysed destruction of ozone, Nature, 249, 810–812, 1974. a
Montzka, S. A., Dutton, G. S., Yu, P., Ray, E., Portmann, R. W., Daniel, J. S., Kuijpers, L., Hall, B. D., Mondeel, D., Siso, C., Nance, J. D., Rigby, M., Manning, A. J., Hu, L., Moore, F., Miller, B. R., and Elkins, J. W.: An unexpected and persistent increase in global emissions of ozone-depleting CFC-11, Nature, 557, 413–417, 2018. a, b
Nier, A. O.: A mass spectrometer for routine isotope abundance measurements, Rev. Sci. Instrum., 11, 212–216, https://doi.org/10.1063/1.1751688, 1940. a
Phillips, E., Gilevska, T., Horst, A., Manna, J., Seger, E., Lutz, E. J., Norcross, S., Morgan, S. A., West, K. A., Mack, E. E., Dworatzek, S., Webb, J., and Sherwood Lollar, B.: Transformation of Chlorofluorocarbons Investigated via Stable Carbon Compound-Specific Isotope Analysis, Environ. Sci. Technol., 54, 870–878, 2019. a
Prokopiou, M., Martinerie, P., Sapart, C. J., Witrant, E., Monteil, G., Ishijima, K., Bernard, S., Kaiser, J., Levin, I., Blunier, T., Etheridge, D., Dlugokencky, E., van de Wal, R. S. W., and Röckmann, T.: Constraining N2O emissions since 1940 using firn air isotope measurements in both hemispheres, Atmos. Chem. Phys., 17, 4539–4564, https://doi.org/10.5194/acp-17-4539-2017, 2017. a
Rahn, T. and Wahlen, M.: Stable isotope enrichment in stratospheric nitrous oxide, Science, 278, 1776–1778, 1997. a
Rahn, T., Eiler, J. M., Boering, K. A., Wennberg, P. O., McCarthy, M. C., Tyler, S., Schauffler, S., Donnelly, S., and Atlas, E.: Extreme deuterium enrichment in stratospheric hydrogen and the global atmospheric budget of H2, Nature, 424, 918–921, 2003. a
Redeker, K., Davis, S., and Kalin, R.: Isotope values of atmospheric halocarbons and hydrocarbons from Irish urban, rural, and marine locations, J. Geophys. Res., 112, D16307, https://doi.org/10.1029/2006JD007784, 2007. a, b, c, d, e
Rhee, T. S., Brenninkmeijer, C. A., Braß, M., and Brühl, C.: Isotopic composition of H2 from CH4 oxidation in the stratosphere and the troposphere, J. Geophys. Res., 111, D23303, https://doi.org/10.1029/2005JD006760, 2006. a
Rigby, M., Park, S., Saito, T., Western, L., Redington, A., Fang, X., Henne, S., Manning, A., Prinn, R., Dutton, G., Fraser, P. J., Ganesan, A. L., Hall, B. D., Harth, C. M., Kim, J., Kim, K.-R., Krummel, P. B., Lee, T., Li, S., Liang, Q., Lunt, M. F., Montzka, S. A., Mühle, J., O’Doherty, S., Park, M.-K., Reimann, S., Salameh, P. K., Simmonds, P., Tunnicliffe, R. L., Weiss, R. F., Yokouchi, Y., and Young, D.: Increase in CFC-11 emissions from eastern China based on atmospheric observations, Nature, 569, 546–550, 2019. a
Röckmann, T., Kaiser, J., Brenninkmeijer, C. A., Crowley, J. N., Borchers, R., Brand, W. A., and Crutzen, P. J.: Isotopic enrichment of nitrous oxide (15N14NO, 14N15NO, 14N14N18O) in the stratosphere and in the laboratory, J. Geophys. Res., 106, 10403–10410, 2001. a
Röckmann, T., Kaiser, J., and Brenninkmeijer, C. A. M.: The isotopic fingerprint of the pre-industrial and the anthropogenic N2O source, Atmos. Chem. Phys., 3, 315–323, https://doi.org/10.5194/acp-3-315-2003, 2003a. a, b
Röckmann, T., Rhee, T. S., and Engel, A.: Heavy hydrogen in the stratosphere, Atmos. Chem. Phys., 3, 2015–2023, https://doi.org/10.5194/acp-3-2015-2003, 2003b. a
Röckmann, T., Brass, M., Borchers, R., and Engel, A.: The isotopic composition of methane in the stratosphere: high-altitude balloon sample measurements, Atmos. Chem. Phys., 11, 13287–13304, https://doi.org/10.5194/acp-11-13287-2011, 2011. a, b
Schutten, J., Boerboom, A., v. d. Hauw, T., and Monterie, F.: Precise measurement of isotope ratios with a single collector mass spectrometer, Appl. Sci. Res., 6, 388–392, https://doi.org/10.1007/BF02920395, 1957. a
Schwander, J., Barnola, J.-M., Andrié, C., Leuenberger, M., Ludin, A., Raynaud, D., and Stauffer, B.: The age of the air in the firn and the ice at Summit, Greenland, J. Geophys. Res., 98, 2831–2838, https://doi.org/10.1029/92JD02383, 1993. a
Thompson, A. E., Anderson, R. S., Rudolph, J., and Huang, L.: Stable carbon isotope signatures of background tropospheric chloromethane and CFC113, Biogeochemistry, 60, 191–211, 2002. a, b, c, d
Toyoda, S., Yoshida, N., Morimoto, S., Aoki, S., Nakazawa, T., Sugawara, S., Ishidoya, S., Uematsu, M., Inai, Y., Hasebe, F., Ikeda, C., Honda, H., and Ishijima, K.: Vertical distributions of N2O isotopocules in the equatorial stratosphere, Atmos. Chem. Phys., 18, 833–844, https://doi.org/10.5194/acp-18-833-2018, 2018. a
Velders, G. J. M. and Daniel, J. S.: Uncertainty analysis of projections of ozone-depleting substances: mixing ratios, EESC, ODPs, and GWPs, Atmos. Chem. Phys., 14, 2757–2776, https://doi.org/10.5194/acp-14-2757-2014, 2014. a, b
Volk, C., Elkins, J., Fahey, D., Dutton, G., Gilligan, J., Loewenstein, M., Podolske, J., Chan, K., and Gunson, M.: Evaluation of source gas lifetimes from stratospheric observations, J. Geophys. Res., 102, 25543–25564, 1997. a
Witrant, E., Martinerie, P., Hogan, C., Laube, J. C., Kawamura, K., Capron, E., Montzka, S. A., Dlugokencky, E. J., Etheridge, D., Blunier, T., and Sturges, W. T.: A new multi-gas constrained model of trace gas non-homogeneous transport in firn: evaluation and behaviour at eleven polar sites, Atmos. Chem. Phys., 12, 11465–11483, https://doi.org/10.5194/acp-12-11465-2012, 2012. a
Zuiderweg, A., Holzinger, R., and Röckmann, T.: Analytical system for stable carbon isotope measurements of low molecular weight (C2-C6) hydrocarbons, Atmos. Meas. Tech., 4, 1161–1175, https://doi.org/10.5194/amt-4-1161-2011, 2011. a, b
Zuiderweg, A., Kaiser, J., Laube, J. C., Röckmann, T., and Holzinger, R.: Stable carbon isotope fractionation in the UV photolysis of CFC-11 and CFC-12, Atmos. Chem. Phys., 12, 4379–4385, https://doi.org/10.5194/acp-12-4379-2012, 2012. a, b, c, d, e, f, g, h, i
Zuiderweg, A., Holzinger, R., Martinerie, P., Schneider, R., Kaiser, J., Witrant, E., Etheridge, D., Petrenko, V., Blunier, T., and Röckmann, T.: Extreme 13C depletion of CCl2F2 in firn air samples from NEEM, Greenland, Atmos. Chem. Phys., 13, 599–609, https://doi.org/10.5194/acp-13-599-2013, 2013. a, b, c, d, e, f, g, h, i, j, k, l, m, n, o, p, q, r, s, t, u, v, w, x, y, z, aa, ab, ac, ad, ae, af
- Abstract
- Introduction
- Methodology
- Results
- Discussion
- Conclusions
- Appendix A: Dilution series and quality control
- Appendix B: Comparison of GC–MS with GC–IRMS measurements
- Appendix C: Reason for NEEM 2009 discrepancy
- Appendix D: Stratospheric CFC-11
- Code and data availability
- Author contributions
- Competing interests
- Acknowledgements
- Financial support
- Review statement
- References
- Supplement